ipca laboratories limited buy q1 fy14 cmp...
TRANSCRIPT
Recommend BUY
CMP 625.00
Target Price 706.00
ISIN: INE571A01020 AUGUST 21st
, 2013
IPCA LABORATORIES LIMITED Q1 FY14
STOCK DETAILS
Sector Pharmaceutical
BSE Code 524494
Face Value 2.00
52wk. High / Low (Rs.) 708.00/389.00
Volume (2wk. Avg ) 8729
Market Cap ( Rs in mn ) 78875.00
Annual Estimated Results (A*: Actual / E*: Estimated)
Years FY13A FY14E FY15E
Net Sales 27784.20 32785.36 36719.60
EBITDA 5766.70 6528.30 7341.70
Net Profit 3313.90 3684.49 4135.82
EPS 26.26 29.20 32.77
P/E 23.80 21.41 19.07
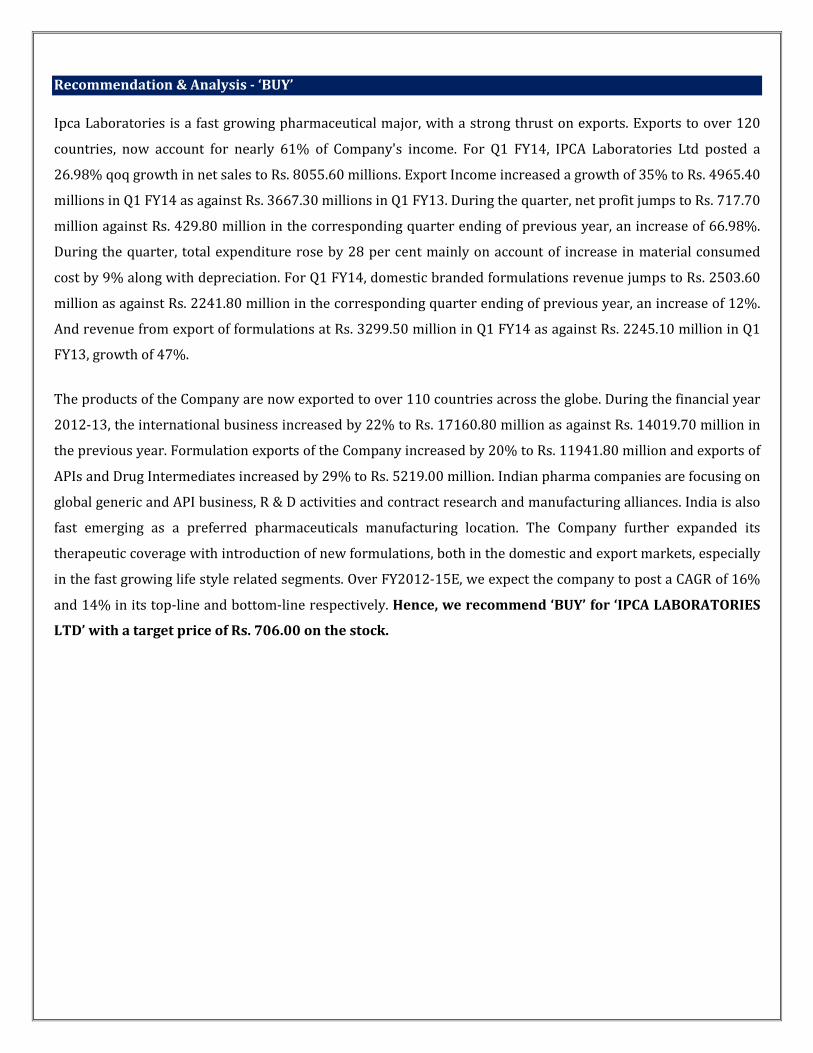
Shareholding Pattern (%)
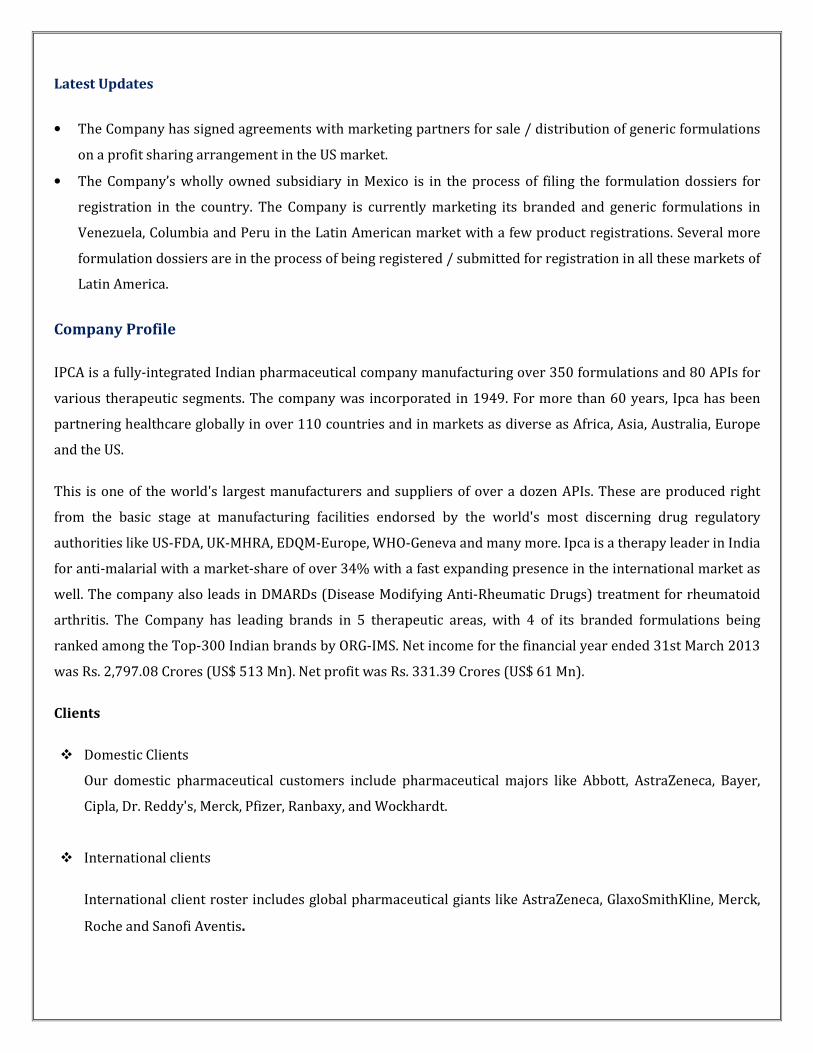
1 Year Comparative Graph
BSE SENSEX IPCA LABS LTD
SYNOPSIS
IPCA Laboratories Ltd. is a fully-integrated Indian
pharma company manufacturing over 350
formulations and 80 APIs for various therapeutic
segments.
The Company has posted a net profit of Rs. 717.70
million for the quarter ended June 30, 2013 where
as the same was at Rs. 429.80 million for the quarter
ended June 30, 2012.
Revenue for the quarter rose 26.98% to Rs. 8055.60
million from Rs.6344.00 million, when compared
with the prior year period.
Export Income at Rs. 4965.40 millions in Q1 FY14 as
against Rs. 3667.30 millions in Q1 FY13, registered a
growth of 35%.
EBITDA is Rs.1275.10 millions as against Rs.859.10
millions in the corresponding period of the previous
year.
Total Revenue of formulations business increased to
Rs. 5803.10 million in Q1 FY14 from Rs. 4486.90
million in Q1 FY13, growth of 29%.
Active Pharmaceutical Ingredients revenue rose by
17% to Rs. 2122.20 million in Q1 FY14 as against Rs.
1815.60 million in Q1 FY13.
Net Sales and PAT of the company are expected to
grow at a CAGR of 16% and 14% over 2012 to
2015E respectively.
The Company has signed agreements with
marketing partners for sale/distribution of generic
formulations on a profit sharing arrangement in the
US market.
PEER GROUPS CMP MARKET CAP EPS P/E (X) P/BV(X) DIVIDEND
COMPANY NAME (Rs.) Rs. in Mn. (Rs.) Ratio Ratio (%)
IPCA Laboratories Ltd 625.00 78875.00 26.26 23.80 5.02 200.00
Sun Pharma Ltd 481.40 994262.20 2.65 181.15 5.76 425.00
Dr Reddys Labs Ltd 2042.25 347271.40 67.78 30.13 4.46 275.00
Lupin Ltd 767.15 343060.40 29.34 26.11 7.08 200.00
Recommendation & Analysis - ‘BUY’
Ipca Laboratories is a fast growing pharmaceutical major, with a strong thrust on exports. Exports to over 120
countries, now account for nearly 61% of Company's income. For Q1 FY14, IPCA Laboratories Ltd posted a
26.98% qoq growth in net sales to Rs. 8055.60 millions. Export Income increased a growth of 35% to Rs. 4965.40
millions in Q1 FY14 as against Rs. 3667.30 millions in Q1 FY13. During the quarter, net profit jumps to Rs. 717.70
million against Rs. 429.80 million in the corresponding quarter ending of previous year, an increase of 66.98%.
During the quarter, total expenditure rose by 28 per cent mainly on account of increase in material consumed
cost by 9% along with depreciation. For Q1 FY14, domestic branded formulations revenue jumps to Rs. 2503.60
million as against Rs. 2241.80 million in the corresponding quarter ending of previous year, an increase of 12%.
And revenue from export of formulations at Rs. 3299.50 million in Q1 FY14 as against Rs. 2245.10 million in Q1
FY13, growth of 47%.
The products of the Company are now exported to over 110 countries across the globe. During the financial year
2012-13, the international business increased by 22% to Rs. 17160.80 million as against Rs. 14019.70 million in
the previous year. Formulation exports of the Company increased by 20% to Rs. 11941.80 million and exports of
APIs and Drug Intermediates increased by 29% to Rs. 5219.00 million. Indian pharma companies are focusing on
global generic and API business, R & D activities and contract research and manufacturing alliances. India is also
fast emerging as a preferred pharmaceuticals manufacturing location. The Company further expanded its
therapeutic coverage with introduction of new formulations, both in the domestic and export markets, especially
in the fast growing life style related segments. Over FY2012-15E, we expect the company to post a CAGR of 16%
and 14% in its top-line and bottom-line respectively. Hence, we recommend ‘BUY’ for ‘IPCA LABORATORIES
LTD’ with a target price of Rs. 706.00 on the stock.

FINANCIAL HIGHLIGHTS
Results updates- Q1 FY14,
IPCA Labs Ltd is a fully integrated pharmaceutical
company with presence in intermediates, APIs and
formulations (generics and branded), reported its
financial results for the quarter ended 30th June,
2013.
Months Jun-13 Jun-12 % Change
Net Sales 8055.60 6344.00 26.98
PAT 717.70 429.80 66.98
EPS 5.69 3.41 66.92
EBITDA 1275.10 859.10 48.42
The company net profit jumps to Rs.717.70 million against Rs.429.80 million in the corresponding quarter
ending of previous year, an increase of 66.98%. Revenue for the quarter rose 26.98% to Rs. 8055.60 million from
Rs.6344.00 million, when compared with the prior year period. Reported earnings per share of the company
stood at Rs.5.69 a share during the quarter, registering 66.92% increase over previous year period. Profit before
interest, depreciation and tax is Rs.1275.10 millions as against Rs.859.10 millions in the corresponding period of
the previous year.
Expenditure :
During the quarter Total Expenditure rose by 28 per
cent mainly on account of increase in material
consumed cost along with consideration of
Depreciation in the rupee impact. Total expenditure
in Q1 FY14 was at Rs. 6586.50 million as against Rs.
5157.50 million in Q1 FY13. Material consumed cost
Rs. 2762.00 millions against Rs. 2537.50 millions in
the corresponding period of the previous year. Staff
cost was at Rs. 1143.50 million and other expenses
are Rs. 1963.60 million in Q1 FY14 are the primarily
attributable to growth of expenditure.
Latest Updates
• The Company has signed agreements with marketing partners for sale / distribution of generic formulations
on a profit sharing arrangement in the US market.
• The Company’s wholly owned subsidiary in Mexico is in the process of filing the formulation dossiers for
registration in the country. The Company is currently marketing its branded and generic formulations in
Venezuela, Columbia and Peru in the Latin American market with a few product registrations. Several more
formulation dossiers are in the process of being registered / submitted for registration in all these markets of
Latin America.
Company Profile
IPCA is a fully-integrated Indian pharmaceutical company manufacturing over 350 formulations and 80 APIs for
various therapeutic segments. The company was incorporated in 1949. For more than 60 years, Ipca has been
partnering healthcare globally in over 110 countries and in markets as diverse as Africa, Asia, Australia, Europe
and the US.
This is one of the world's largest manufacturers and suppliers of over a dozen APIs. These are produced right
from the basic stage at manufacturing facilities endorsed by the world's most discerning drug regulatory
authorities like US-FDA, UK-MHRA, EDQM-Europe, WHO-Geneva and many more. Ipca is a therapy leader in India
for anti-malarial with a market-share of over 34% with a fast expanding presence in the international market as
well. The company also leads in DMARDs (Disease Modifying Anti-Rheumatic Drugs) treatment for rheumatoid
arthritis. The Company has leading brands in 5 therapeutic areas, with 4 of its branded formulations being
ranked among the Top-300 Indian brands by ORG-IMS. Net income for the financial year ended 31st March 2013
was Rs. 2,797.08 Crores (US$ 513 Mn). Net profit was Rs. 331.39 Crores (US$ 61 Mn).
Clients
� Domestic Clients
Our domestic pharmaceutical customers include pharmaceutical majors like Abbott, AstraZeneca, Bayer,
Cipla, Dr. Reddy's, Merck, Pfizer, Ranbaxy, and Wockhardt.
� International clients
International client roster includes global pharmaceutical giants like AstraZeneca, GlaxoSmithKline, Merck,
Roche and Sanofi Aventis.

Product Area
� APIs (Active Pharmaceutical Ingredients)
Ipca has emerged as one of India's top exporters of APIs with nearly 25% of the turnover coming from APIs.
Regulated markets like the USA, Canada, Europe and Australia account for 75% of its API exports.
IPCA is one of the world's largest manufacturers of APIs - Atenolol (anti-hypertensive), Chloroquine
Phosphate (anti-malarial), Furosemide (diuretic), Hydroxychloroquine Sulphate (NSAID), Metoprolol
Succinate (anti-hypertensive), Metoprolol Tartrate (anti-hypertensive) and Pyrantel Salts (anthelmintic) -
besides being one of the largest suppliers of these APIs worldwide.
� Formulations
The company has leading brands in 5 therapeutic areas, with 4 of its branded formulations being ranked
among the Top-300 Indian brands by ORG-IMS.
Top 10 brands are Zerodol (Aceclofenac + combinations), Lariago (Chloroquine), HCQS
(Hydroxychloroquine), Perinorm (Metoclopramide), Rapither (Artemotil), Tenoric (Atenolol +
Chlorthalidone), Lumerax (Artemether + Lumefantrine), Etova (Etodolac), Malirid (Primaquine) and Folitrax
(Methotrexate).
Marketing: As part of Ipca's marketing segmentation strategy for India, specialty-focused marketing divisions
were conceived a couple of years ago. Today, these 12 divisions are paying rich dividends. Brands
like Glycinorm, HCQS, Lariago, Malirid, Movon, Pari, Perinorm, Ramcor, Solvin, Sultax, Tenolol,
Tenoric, and Zerodolhave become brand leaders in their respective therapeutic segments, and 4 of these are
also rated among the Top-300 Indian Brands (all categories) by ORG-IMS.
� Generic
Ipca's formulations basket includes generics for the developed markets and branded formulations for
emerging markets. Formulations account for 67% of export turnover, making Ipca is one of India's largest
formulation exporters. Ipca has over 1500 products registered in 70 countries, and another 600 are in the
process of registration in 50 countries. More than half of its formulations business is backed by their own
APIs. Ipca manufactures over 350 formulations in virtually every dosage form: oral solids and liquids, dry
powders for suspension, and injectables (liquid and dry).

Financial Highlight STANDALONE (A*- Actual, E* -Estimations & Rs. In Millions)
Balance sheet as at March31st, 2012-2015E
(A*- Actual, E* -Estimations & Rs. In Millions)
FY12A FY13A FY14E FY15E
SOURCES OF FUNDS (Rs.in.mn)
Shareholder's Funds
Share Capital 252.30 252.40 252.40 252.40
Reserves and Surplus 12370.40 15446.10 19130.59 23266.41
1. Sub Total - Net worth 12622.70 15698.50 19382.99 23518.81
Non Current Liabilities
Long Term Borrowing 3301.80 3662.10 3881.83 4037.10
Deferred Tax Liabilities 930.90 1303.90 1108.32 975.32
Other Long term Liabilities 5.90 4.00 4.20 4.33
Long Term Provisions 87.20 122.10 144.08 161.37
2. Sub Total - Non Current Liabilities 4325.80 5092.10 5138.42 5178.11
Current Liabilities
Short Term Borrowings 2013.60 1571.40 1319.98 1135.18
Trade Payables 2307.10 2654.60 2866.97 2981.65
Other Current Liabilities 1745.60 1651.80 1585.73 1538.16
Short Term Provisions 285.70 419.10 481.97 520.52
3. Sub Total - Current Liabilities 6352.00 6296.90 6254.64 6175.50
Total Liabilities (1+2+3) 23300.50 27087.50 30776.04 34872.43
APPLICATION OF FUNDS (Rs.in.mn)
Non-Current Assets
Fixed Assets
Tangible assets 9085.20 10526.70 11895.17 13322.59
Intangible assets 43.00 226.60 283.25 339.90
Capital Work in Progress 884.50 1209.90 1548.67 1889.38
Intangible assets under development 60.60 81.80 94.07 105.36
a) Sub Total - Fixed Assets 10073.30 12045.00 13727.09 15551.87
b) Non-current investments 426.50 217.90 230.97 242.52
c) Long Term loans and advances 763.60 881.60 987.39 1086.13
d) Other non-current assets 71.30 95.00 115.90 134.44
1. Sub Total – Non Current Assets 11334.70 13239.50 15061.36 17014.97
Current Assets
Current Investments 1.50 1.50 1.58 1.64
Inventories 6639.8 7333.40 7990.27 8651.57
Trade receivables 3409.10 4159.30 4866.38 5664.47
Cash and Bank Balances 92.50 546.60 819.90 1167.54
Short-terms loans & advances 336.60 496.40 660.21 858.28
Other current assets 1486.30 1310.80 1376.34 1513.97
2. Sub Total - Current Assets 11965.80 13848.00 15714.68 17857.46
Total Assets (1+2) 23300.50 27087.50 30776.04 34872.43

Annual Profit & Loss Statement for the period of 2012 to 2015E
Value(Rs.in.mn) FY12A FY13A FY14E FY15E
Description 12m 12m 12m 12m
Net Sales 23293.70 27784.20 32785.36 36719.60
Other Income 129.20 186.60 167.94 181.38
Total Income 23422.90 27970.80 32953.30 36900.97
Expenditure -18686.80 -22204.10 -26425.00 -29559.28
Operating Profit 4736.10 5766.70 6528.30 7341.70
Interest -393.60 -313.00 -328.65 -341.80
Gross profit 4342.50 5453.70 6199.65 6999.90
Depreciation -653.10 -840.00 -966.00 -1091.58
Profit Before Tax 3689.40 4613.70 5233.65 5908.32
Tax -887.70 -1299.80 -1549.16 -1772.50
Net Profit 2801.70 3313.90 3684.49 4135.82
Equity capital 252.30 252.40 252.40 252.40
Reserves 12370.40 15446.10 19130.59 23266.41
Face value 2.00 2.00 2.00 2.00
EPS 22.21 26.26 29.20 32.77
Quarterly Profit & Loss Statement for the period of 31st
Dec, 2012 to 30th Sep, 2013E
Value(Rs.in.mn) 31-Dec-12 31-Mar-13 30-Jun-13 30-Sep-13E
Description 3m 3m 3m 3m
Net sales 7010.20 6717.10 8055.60 9263.94
Other income 39.70 25.50 44.50 46.73
Total Income 7049.90 6742.60 8100.10 9310.67
Expenditure -5612.20 -5216.20 -6825.00 -7503.79
Operating profit 1437.70 1526.40 1275.10 1806.87
Interest -74.00 -55.10 -71.30 -80.57
Gross profit 1363.70 1471.30 1203.80 1726.30
Depreciation -215.80 -216.20 -241.10 -260.39
Profit Before Tax 1147.90 1255.10 962.70 1465.92
Tax -269.00 -500.80 -245.00 -433.91
Net Profit 878.90 754.30 717.70 1032.01
Equity capital 252.30 252.40 252.40 252.40
Face value 2.00 2.00 2.00 2.00
EPS 6.97 5.98 5.69 8.18

Ratio Analysis
Particulars FY12A FY13A FY14E FY15E
EPS (Rs.) 22.21 26.26 29.20 32.77
EBITDA Margin (%) 20.33% 20.76% 19.91% 19.99%
PBT Margin (%) 15.84% 16.61% 15.96% 16.09%
PAT Margin (%) 12.03% 11.93% 11.24% 11.26%
P/E Ratio (x) 28.14 23.80 21.41 19.07
ROE (%) 22.20% 21.11% 19.01% 17.59%
ROCE (%) 30.04% 31.56% 30.12% 28.79%
Debt Equity Ratio 0.42 0.33 0.28 0.25
EV/EBITDA (x) 17.75 14.49 12.80 11.37
Book Value (Rs.) 100.06 124.39 153.59 186.36
P/BV 6.25 5.02 4.07 3.35
Charts

Outlook and Conclusion
� At the current market price of Rs.625.00 the stock P/E ratio is at 21.41 x FY14E and 19.07 x FY15E
respectively.
� Earnings per share (EPS) of the company for the earnings for FY14E and FY15E are seen at Rs.29.20 and
Rs.32.77 respectively.
� Net Sales and PAT of the company are expected to grow at a CAGR of 16% and 14% over 2012 to 2015E
respectively.
� On the basis of EV/EBITDA, the stock trades at 12.80 x for FY14E and 11.37 x for FY15E.
� Price to Book Value of the stock is expected to be at 4.07 x and 3.35 x respectively for FY14E and FY15E.
� We recommend ‘BUY’ in this particular scrip with a target price of Rs.706.00 for Medium to Long term
investment.
Industry Overview
India is now among the top five pharmaceutical emerging markets globally and is a front runner in a wide range
of specialties involving complex drugs' manufacture, development, and technology. The Indian pharmaceutical
industry is a highly knowledge based industry which is growing steadily and plays a major role in the Indian
economy. As a highly organised sector, the numbers of pharmaceutical companies are increasing their operations
in India. The industry is expected to touch US$ 35.9 billion by 2016.
The Department of Pharmaceuticals has prepared a 'Pharma Vision 2020' document for making India one of the
leading destinations for end-to-end drug discovery and innovation. The department provides requisite support
by way of world class infrastructure, internationally competitive scientific manpower for pharma research and
development (R&D), venture fund for research in the public and private domain and such other measures.
Sector Structure/ Market Size
The domestic pharma market has reported total sales of Rs 6,370 crore (US$ 1.03 billion) in the month of May
2013, registering a growth of 6.8 per cent, as per IMS Health. The major factors responsible are increasing sales
of generic medicines, continued growth in chronic therapies and a greater penetration in rural markets.
The cumulative drugs and pharmaceuticals sector has attracted foreign direct investments (FDI) worth US$
11,304.91 million during April 2000 to April 2013, according to the latest data published by Department of
Industrial Policy and Promotion (DIPP).
Growth
The Indian pharmaceutical industry would continue to experience strong growth as structural growth drivers
continue to remain impervious. The industry is expected to revert a growth of 10-12 percent in 2013-14,
according to a study by ICRA. It is also expected that in-organic investments will gain momentum in the medium-
term as companies plan to create stronger presence in emerging markets and build expertise in select therapy
areas.
Among the top 10 companies, Cipla with total sales of Rs 302 crore (US$ 49.13 million), Sun Rs 297 crore (US$
48.32 miliion), Alkem Rs 222 crore (US$ 36.12 million) and Sanofi Rs 186 crore (US$ 30.26 million) were the
fastest growing corporations for the month of May 2013.
Exports
Pharmaceutical exports from the country during 2012-13 stood at US$14.6 billion, up from US$13.2 billion the
previous year, as per P V Appaji, Director General, Pharmexcil.
The Ministry of Commerce has targeted Indian pharma sector exports at US$ 25 billion by 2016. The Government
has also planned a ‘Pharma India’ brand promotion action plan spanning over a three-year period to give an
impetus to generic exports.
In order to boost the export capability, Export-Import Bank of India (Exim Bank), has decided to expand the
scope of its finance to pharmaceutical companies for extended repayment periods. Eligible export oriented
companies can avail finance from Exim Bank for a maximum repayment period of 10 years with a moratorium of
up to 36 months.

“Of the export markets, Indian pharma will focus on the US market which presents significant opportunities for
the next two years for generics, due to patent cliffs and recent changes in healthcare policies,” said the India
Ratings report on outlook for Indian pharmaceuticals for 2013.
Generics
Generics will continue to dominate the market while patent-protected products are likely to constitute 10 per
cent of the pie till 2015, according to McKinsey report 'India Pharma 2015- Unlocking the potential of Indian
Pharmaceuticals market'.
Global demand for generic drugs from Indian companies is booming as developed nations battle rising healthcare
costs. As a result, generics companies are increasingly focusing on expanding presence in relatively under-
penetrated markets (i.e. France, Spain & Italy), branded generic markets of East Europe and niche areas like
complex generics, OTCs etc.
Diagnostics Outsourcing/ Clinical Trials
India is fast becoming the preferred destination for high-end pathology and diagnostic services. The highly
fragmented diagnostics and pathology labs market in India is pegged at US$ 3.4 billion, according to a report by
PricewaterhouseCoopers.
An increasing number of hospitals from the UK, US, Middle East and neighbouring countries are tying up with
Indian diagnostic centres to conduct laboratory tests. The Indian diagnostic services market is expected to grow
at a compound annual growth rate (CAGR) of around 26 per cent during 2012-2015 on back of huge investments,
fast expansion into tier II & III cities, and strong government support strengthening the healthcare infrastructure
in the country.
According to RNCOs research report “Booming Clinical Trials Market in India”, the number of clinical studies by
domestic and global players has sharply risen. India, over the last decade, has developed significant capabilities
in clinical trials, along with certain capabilities in project management and data management.According to
RNCOs research report “Booming Clinical Trials Market in India”, the number of clinical studies by domestic and
global players has sharply risen. India, over the last decade, has developed significant capabilities in clinical
trials, along with certain capabilities in project management and data management.

Investments
Some of the investments in the sector are:
• Piramal’s healthcare vertical plans to invest US$ 2.5 million to upgrade their antibody drug conjugate
(ADC) manufacturing suites. The upgrade will give Piramal two commercial grade ADC suites at the
Grangemouth facility, while retaining clinical phase manufacturing capacity in other suites on-site
• Dr Reddy's Laboratories (DRL) has launched Donepezil Hydrochloride tablets in the US market following
the approval by the United States Food and Drug Administration (USFDA)
• US-based drug maker MSD has tied up with Mumbai-based Lupin to market MSD's 23-valent
Pneumococcal Polysaccharide Vaccine in India. Lupin would have a non-exclusive licence to market,
promote and distribute the vaccine under a different brand name
• Aurobindo Pharma, Natco Pharma and Glenmark have received approvals from the US Food and Drug
Administration (USFDA) to launch their migraine drugs in the US market
• Elder Pharmaceuticals has acquired UK-based Max Healthcare. The acquisition is through Elder's fully-
owned UK subsidiary, NutraHealth, and will mark the re-entry of Elder Pharma into the over-the-counter
(OTC) pharmaceutical category
• Zydus Group has launched LipaglynTM (Saroglitazar), a novel drug targeted for treating diabetic
dyslipidemia or hypertriglyceridemia in Type II diabetes. The drug has been approved for launch in India
by the Drug Controller General of India (DCGI)
Government Initiatives
The Foreign Investment Promotion Board (FIPB) has cleared seven FDI proposals for investment in the Indian
pharmaceutical companies. Currently, 100 per cent FDI in pharma sector is permitted through automatic
approval route in the new projects but the foreign investment in the existing pharma companies requires FIPB
approval.
In the Union Budget 2013-14, investment allowance of 15 per cent on new plant and machinery has been
allowed. The allowance is expected to increase investments in new projects while simultaneously providing tax
benefit to the industry.
In order to provide relief to the common man in the area of healthcare, a countrywide campaign in the name of
‘Jan Aushadhi Campaign’ has been initiated by the Department of Pharmaceuticals, Government of India, in
collaboration with the State Governments, by way of opening up of Jan Aushadhi Generic Stores in the
Government Hospitals by way of supply of generic medicines through Central Pharma Public Sector
Undertakings, to make available quality generic medicines at affordable prices to all.

Road Ahead
In spite of some recent adverse developments, with the support of Pharmexcil and the Government in the form of
Brand India Pharma project iPHEX, the sector would continue to grow and meet the healthcare requirements of
the developing world.
The country will see the largest number of merger and acquisitions (M&A) in the pharmaceutical and healthcare
sector, according to consulting firm Grant Thornton. A survey conducted across 100 companies has revealed that
one-fourth of the respondents were optimistic about acquisitions in the pharmaceutical sector.
The pharma companies such as Cipla, Ranbaxy, Dr. Reddy's Labs and Lupin might soon be part of the
government's ambitious 'Jan Aushadhi' project. In an attempt to commercialise the project, the Government is
likely to rope in the private sector to bulk-procure generic drugs from them.
Disclaimer:
This document prepared by our research analysts does not constitute an offer or solicitation for the purchase or sale
of any financial instrument or as an official confirmation of any transaction. The information contained herein is
from publicly available data or other sources believed to be reliable but do not represent that it is accurate or
complete and it should not be relied on as such. Firstcall India Equity Advisors Pvt. Ltd. or any of it’s affiliates shall
not be in any way responsible for any loss or damage that may arise to any person from any inadvertent error in the
information contained in this report. This document is provide for assistance only and is not intended to be and must
not alone be taken as the basis for an investment decision.

Firstcall India Equity Research: Email – [email protected]
C.V.S.L.Kameswari Pharma
U. Janaki Rao Capital Goods
B. Anil Kumar Diversified
Ashish.Kushwaha IT, Consumer Durable & Banking
Suhani Adilabadkar Diversified
M. Vinayak Rao Diversified
Firstcall India also provides
Firstcall India Equity Advisors Pvt.Ltd focuses on, IPO’s, QIP’s, F.P.O’s,Takeover
Offers, Offer for Sale and Buy Back Offerings.
Corporate Finance Offerings include Foreign Currency Loan Syndications,
Placement of Equity / Debt with multilateral organizations, Short Term Funds
Management Debt & Equity, Working Capital Limits, Equity & Debt
Syndications and Structured Deals.
Corporate Advisory Offerings include Mergers & Acquisitions(domestic and
cross-border), divestitures, spin-offs, valuation of business, corporate
restructuring-Capital and Debt, Turnkey Corporate Revival – Planning &
Execution, Project Financing, Venture capital, Private Equity and Financial
Joint Ventures
Firstcall India also provides Financial Advisory services with respect to raising
of capital through FCCBs, GDRs, ADRs and listing of the same on International
Stock Exchanges namely AIMs, Luxembourg, Singapore Stock Exchanges and
other international stock exchanges.
For Further Details Contact:
3rd Floor,Sankalp,The Bureau,Dr.R.C.Marg,Chembur,Mumbai 400 071
Tel. : 022-2527 2510/2527 6077/25276089 Telefax : 022-25276089
E-mail: [email protected]
www.firstcallindiaequity.com