divi’s laboratories ltd. - ventura1.com · divi’s laboratories ltd. buy - friday1 of 14 - 22nd...
TRANSCRIPT

Divi’s Laboratories Ltd.
BUY
- 1 of 14 - Friday 22nd
June, 2012
This document is for private circulation, and must be read in conjunction with the disclaimer on the last page.
ST
OC
K P
OIN
TE
R
Target Price ` 1287 CMP ` 952 FY14 PE 15.5x
Index Details We initiate coverage on Divi's Laboratories Ltd as a BUY with a
Price Objective of `1,287 (target 21.0x FY14 P/E). At CMP of ` 952, the stock is trading at 19.6x and 15.5x its estimated earnings for FY13 & FY14 respectively, representing a potential upside of ~35% over a period of 18 months. Being a leading player in the CRAMs space, Divi’s will be a key beneficiary of the increased generic opportunities emanating from the patent expiry cliff on the back of its expertise in complex chemistry, efficient and cost conscious processes and relationships with the top 25 global innovators. We expect Divi's revenues and earnings to post a CAGR of 25.2% and 23.5% to `2915 crore and `814 crore, respectively by FY14. Further, timely approvals for ready to market products can be a game changer for the company and further accelerate the pace of growth.
Continuous growth of the matured API product portfolio and impending sales of the new ready to market API’s to fuel growth
In the generic API segment, Divi’s enjoys a significant market share in its key products and derives 47% of its revenue from the top 5 products, which are in the matured stage. The company also has a strong pipeline of ready to market products, in addition to its developmental pipeline, which provides Divi’s with strong revenue visibility over the long term. Seeing the robust growth potential in the API space, we
expect revenues from this segment to grow at a CAGR of 19.6% to `1306.9 crore by
FY14.
CRAMS on growth path leading to profitability
Backed by the strong relationship with the innovators, presence across the entire CRAMS value chain and its ability to support the innovator in late life-cycle strategies has enabled Divi’s to establish itself as a leading player in the CRAMS space. Further, the increased focus of MNCs on outsourcing led by cost arbitrage and strong R&D capabilities will only benefit Divi’s. We expect this custom synthesis business to grow at a CAGR of 25% to ` 1277 crore by FY14.
Sensex 16,973
Nifty 5,146
BSE 100 5,141
Industry Pharma
Scrip Details
Mkt Cap (` cr) 12,636
BVPS (`) 160.6
O/s Shares (Cr) 13.3
Av Vol (Lacs) 0.1
52 Week H/L 968/690
Div Yield (%) 1.4
FVPS (`) 2.0
Shareholding Pattern
Shareholders %
Promoters 52.2
DIIs 17.3
FIIs 9.6
Public 20.9
Total 100
Divi’s Lab. vs. Sensex
Key Financials (` in Cr)
Y/E Mar Net
Revenue EBITDA PAT EPS
EPS Growth (%)
RONW (%)
ROCE (%)
P/E (x)
EV/EBITDA (x)
2011 1307.1 491.5 429.3 32.3 23.8 23.9 28.2 29.4 25.8
2012 1858.6 685.0 533.3 40.2 24.2 25.0 33.2 23.7 18.5
2013E 2332.0 876.5 646.2 48.7 21.2 25.2 34.5 19.6 14.4
2014E 2915.2 1095.8 813.7 61.3 25.9 25.8 35.4 15.5 11.6

- 2 of 14 - Friday 22nd
June, 2012
This document is for private circulation, and must be read in conjunction with the disclaimer on the last page.
Strong execution and effective control to ensure sustained margin
Compared to peers, Divi's have been able to maintain strong margins on account of its ability to swiftly execute capex and ensure quick capacity ramp up. Divi’s policy of adding capacities, only post clear visibility of orders ensures that there is no spare capacity and strong cash flows from the very 1st week of operations leads to ROCE being much higher than peers.
Valuation At the CMP of ` 952, Divi's is trading at 19.6x and 15.5x its estimated earnings for FY13 and FY14, respectively. Divi’s is trading at a considerable premium to its counterparts in the domestic market i.e. Biocon, Jubilant as well as to the international players. However, considering the high margin business, steady organic growth, strong cash flows and high return ratios, we believe the premium is completely justified. We initiate coverage on Divi's Laboratories Ltd as a BUY with a Price Objective of `1287 (target 21.0x FY14 P/E) representing a potential upside of 35%
over the next 18 months.

- 3 of 14 - Friday 22nd
June, 2012
This document is for private circulation, and must be read in conjunction with the disclaimer on the last page.
Company Background
Divi's Laboratories Ltd (Divi's) has a significant presence in both Generic APIs and CRAMS business, with each of these segments contributing equally to the topline. The company operates predominately in the export market, which accounts for nearly 93% of its overall revenue with ~75% of it coming from developed markets like the US and EU.
Divi’s has grown to emerge as a preferred supplier of generic APIs and key ingredients for MNCs in the pharmaceutical segments, primarily on the back of its understanding of complex chemistries and development of new process, which are globally acceptable and cost efficient. In addition, the company has an unassailable track record of being a leading player in the CRAMS segment and has one of the strongest custom chemical synthesis (CCS) pipelines with presence in the entire life cycle of a pharmaceutical product. This makes it a preferred one stop solution provider for the pharma giants. Recently, Divi’s has entered into the lucrative carotenoid segment, which would help in diversifying its API product mix.
Geographical break-up
North America
44%
India 8%
Far East9%
Europe30%
ROW5%
Asia4%
Source: Divi’s Labs, Ventura Research
- 4 of 14 - Friday 22nd
June, 2012
This document is for private circulation, and must be read in conjunction with the disclaimer on the last page.
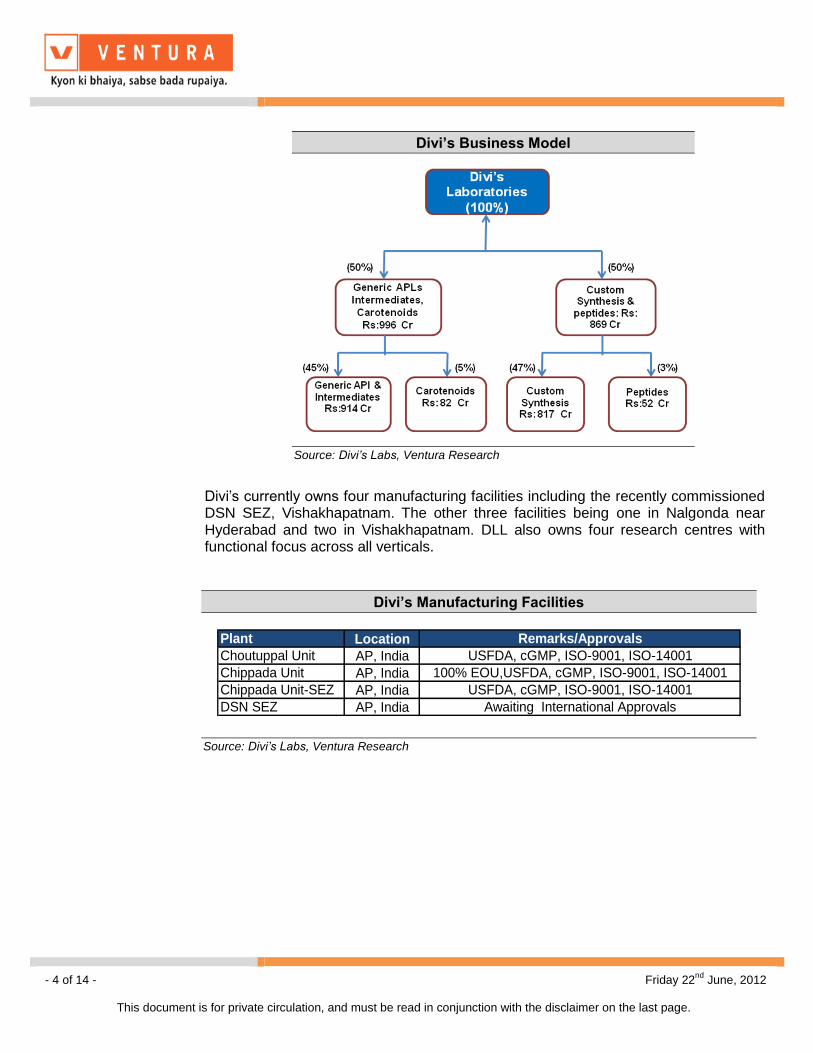
Divi’s currently owns four manufacturing facilities including the recently commissioned DSN SEZ, Vishakhapatnam. The other three facilities being one in Nalgonda near Hyderabad and two in Vishakhapatnam. DLL also owns four research centres with functional focus across all verticals.
Divi’s Business Model
Source: Divi’s Labs, Ventura Research
Divi’s Manufacturing Facilities
Plant Location Remarks/Approvals
Choutuppal Unit AP, India USFDA, cGMP, ISO-9001, ISO-14001
Chippada Unit AP, India 100% EOU,USFDA, cGMP, ISO-9001, ISO-14001
Chippada Unit-SEZ AP, India USFDA, cGMP, ISO-9001, ISO-14001
DSN SEZ AP, India Awaiting International Approvals
Source: Divi’s Labs, Ventura Research
- 5 of 14 - Friday 22nd
June, 2012
This document is for private circulation, and must be read in conjunction with the disclaimer on the last page.
Key Investment Highlights
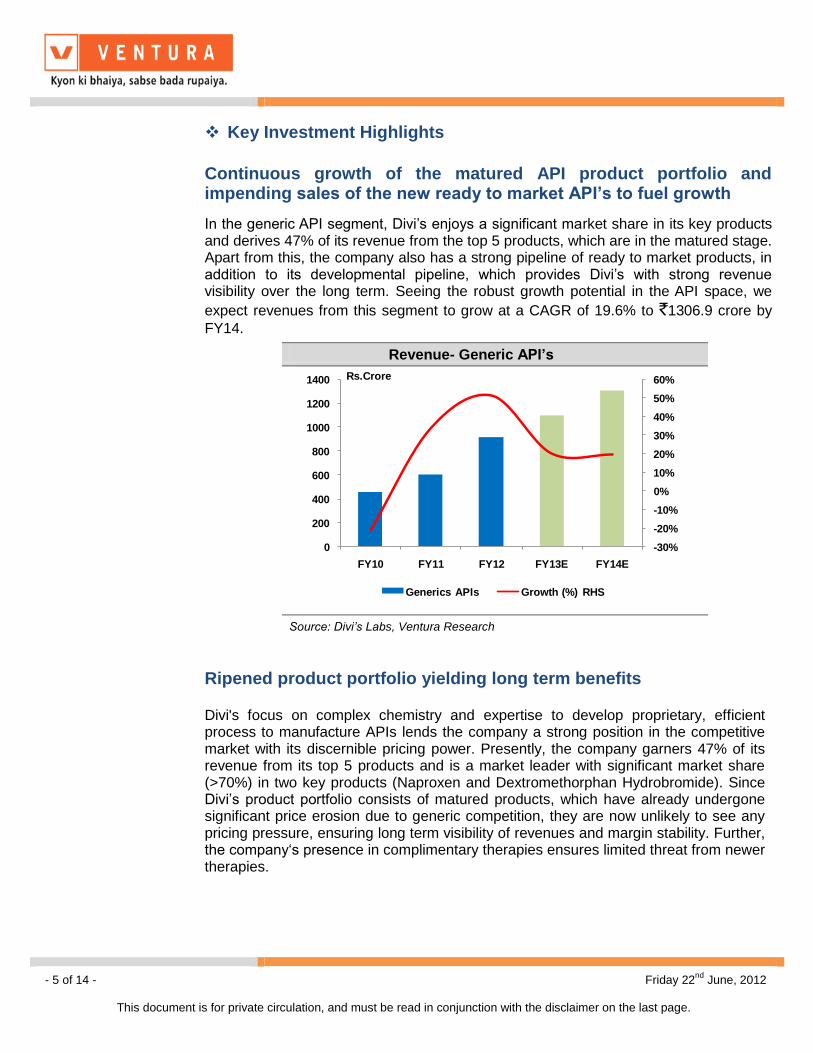
Continuous growth of the matured API product portfolio and impending sales of the new ready to market API’s to fuel growth
In the generic API segment, Divi’s enjoys a significant market share in its key products and derives 47% of its revenue from the top 5 products, which are in the matured stage. Apart from this, the company also has a strong pipeline of ready to market products, in addition to its developmental pipeline, which provides Divi’s with strong revenue visibility over the long term. Seeing the robust growth potential in the API space, we
expect revenues from this segment to grow at a CAGR of 19.6% to `1306.9 crore by
FY14.
Ripened product portfolio yielding long term benefits
Divi's focus on complex chemistry and expertise to develop proprietary, efficient process to manufacture APIs lends the company a strong position in the competitive market with its discernible pricing power. Presently, the company garners 47% of its revenue from its top 5 products and is a market leader with significant market share (>70%) in two key products (Naproxen and Dextromethorphan Hydrobromide). Since Divi’s product portfolio consists of matured products, which have already undergone significant price erosion due to generic competition, they are now unlikely to see any pricing pressure, ensuring long term visibility of revenues and margin stability. Further, the company‘s presence in complimentary therapies ensures limited threat from newer therapies.
Revenue- Generic API’s
-30%
-20%
-10%
0%
10%
20%
30%
40%
50%
60%
0
200
400
600
800
1000
1200
1400
FY10 FY11 FY12 FY13E FY14E
Rs.Crore
Generics APIs Growth (%) RHS
Source: Divi’s Labs, Ventura Research

- 6 of 14 - Friday 22nd
June, 2012
This document is for private circulation, and must be read in conjunction with the disclaimer on the last page.
Anti Inflammatory drugs, Naproxen and Nabumetone used in the treatment of arthritis, spondylitis, and other inflammatory conditions contributes around 25% to Divi's generic API’s topline and are expected to grow at a annual rate of 10-15% over the forecast period.
Dextromethorphan Hydrobromide (70% market share), another key product which contributes to around 15% to topline is widely used as the main ingredient in the formulation of cough syrups and tablets. Prices of Dextromethorphan Hydrobromide have been rising steadily due to global shortage enabling Divi’s to take a price hike of 8% during the previous fiscal.
New products awaiting approval to catapult growth further
In addition to the existing portfolio, Divi's also has a strong developmental portfolio, representing a market potential of USD 14.6 bn. Further, the company has products awaiting USFDA approvals with market potential of $ 8.7 bn. Considering, Divi's strong expertise and swift execution abilities demonstrated in the past, we expect Divi's to effectively monetize the opportunity leading to strong revenue growth over the forecast period. However, we have not factored the same in our valuations.
So far, Divi’s has registered 41 (Drug Master Files) DMFs with the US Food & Drug Administration (USFDA) and 12 DMFs with the European Directorate for the Quality of Medicine & Healthcare (EDQM).
Product Available to be marketed
Product name Therapeutics Used for Global Sales ($, mn)
Candesartan Cilexetil CVS Hyper Tension 1500
Entacapone CNS Parkinsions Disease 100
Losartan potassium CVS Hyper Tension 1580.4
Olmesartan Medoxomil CVS Hyper Tension 2500
Pregabalin CNS Anti Convulsant Drug 3063
Source: Divi’s Labs, Ventura Research
Top Five Products
Product name Therapeutics Used for Global Sales ($,mn)
Naproxen Osteoarthitris Anti Inflammatory Drug 377
Dextromethorphan Cold Medications Cough Supressant 249
Nabumetone Osteoarthitris Anti Inflammatory Drug 66.8
Levodopa CNS Parkinsion's Disease 79
Phenylephrine HCI CNS Decongestant, Dilate Pupils 26
Source: Divi’s Labs, Ventura Research

- 7 of 14 - Friday 22nd
June, 2012
This document is for private circulation, and must be read in conjunction with the disclaimer on the last page.
Foray into the fast growing Carotenoids market to enhance product depth
Considering the huge potential of the carotenoids market, Divi’s has made a strategic entry into the carotenoids business in FY09 through the launch of six key products. This has helped Divi’s diversify into the food and processing industry, a marginal shift from the current focus on pharmaceutical industry.
Product under Development
PRODUCT NAME THERAPEUTICS USED FOR Global Sales ($, mn)
Aliskirin Hemifumarate CVS Lower Blood cholesterol 557
Atazanavir CNS HIV 1400
Atorvastatin CVS Lower Blood cholesterol 12000
Bazedoxifene CNS Post Menopausal Osteoporosis
Chlophedianol HCL CNS Cough Supressant 275
Fesoterodine Fumarate CNS Anti- Diuretic 140
Fondaparinex CVS Anti Coagulant 340
Saxagliptin Anti Diabetic Anti Diabetic 160
Seletracetam CNS Anti Convulsant Drug
Valgaciclovir Anti Infectives Anti Viral 575
Source: Divi’s Labs, Ventura Research
Global Carotenoids Market Divi’s Carotenoid Segment Revenue
0.9
1.0
1.0
1.1
1.1
1.2
1.2
1.3
2012 2015E
$ bn
0
50
100
150
200
250
2012 2013E 2014E
Rs.Crore
Source: Divi’s Labs, Ventura Research Source: Divi’s Labs, Ventura Research

- 8 of 14 - Friday 22nd
June, 2012
This document is for private circulation, and must be read in conjunction with the disclaimer on the last page.
Globally, carotenoid is a $1 bn industry with the adroit players like BASP and DSM leading the market. This business is expected to grow to $1.2 bn by 2015. At present, carotenoids business contributes ` 82 crore (4.4%) to Divi's top-line and the management expects it to grow to ` 150 and ` 250 crore by FY13 and FY14,
respectively. Considering the robust market potential and Divi’s strong execution skills, we are confident about management abilities to achieve the desired levels of growth.
CRAMS business on growth path, leading to profitability
Backed by the strong relationship with the innovators, presence across the entire CRAMS value chain and its ability to support the innovator companies in late life-cycle strategies has enabled Divi’s to establish itself as a leading player in the CRAMS space. Further, the increased focus of MNCs on outsourcing led by cost arbitrage and strong R&D capabilities will only benefit Divi’s. We expect this custom synthesis business to grow at a CAGR of 25% to ` 1277 crore by FY14.
Revenue- Custom Synthesis
-30%
-20%
-10%
0%
10%
20%
30%
40%
50%
0
200
400
600
800
1000
1200
1400
FY10 FY11 FY12 FY13E FY14E
Rs.Crore
Custom Synthesis Growth (%) RHS
Source: Divi’s Labs, Ventura Research
Carotenoids product portfolio
Product name Therapeutics Used forBeta-Carotene Dietary Supplements Geranylgeranyl Pyrophosphate
Lycopene Anti-hyperlipidemic Photosynthetic Organisms
Astaxanthin Anti-hyperlipidemic Terpenes
Apocarotenal Anti-hyperlipidemic Spinach & Citrus
Lutein Eye Preparations Xanthophyll
Canthaxanthin Anti-hyperlipidemic Terpenoids
Source: Divi’s Labs, Ventura Research

- 9 of 14 - Friday 22nd
June, 2012
This document is for private circulation, and must be read in conjunction with the disclaimer on the last page.
Indian CRAMS industry has grown at a CAGR of 47% over the past three years led by enhanced outsourcing budgets of Big Pharma companies. Currently MNCs, outsource only 25-35% of the CRO activities but with enhanced capabilities, the chunk is all likely to increase. Going ahead, the scenario is expected to get more favorable on account of the impending patent cliff. Divi’s presence in the entire life cycle of a pharmaceutical product makes it the most preferred one - stop solution provider for leading pharmaceutical companies. This is re-iterated by the fact that the Top 25 innovators are already customers to Divi’s. The company also provides complete regulatory supports, including DMF filing and large scale component manufacturing, which helps innovators to meet their requirement under one roof.
Strong execution, product portfolio selection, and weakening rupee to ensure sustain margin
Compared to peers, Divi's have been able to maintain strong margins on account of its ability to swiftly execute capex and ensure quick capacity ramp up. Divi’s policy of adding capacities, only post clear visibility of orders ensures that there is no spare capacity and strong cash flows from the very 1st week of operations leads to ROCE being much higher than peers.
Unlike its peers, Divi’s limits its focus to complex chemistry and development of cost efficient processes to manufacture them. This cost competitiveness helps Divi’s to acquire market share and command premium.
Life cycle of pharmaceutical product
Drug
Discovery
Patent
Filing
Drug
Development
Regulatory
Approval
End of Patent
protection
Custom
Synthesis
Generic
APIs
Identifying/disc
overing new molecule
Pre
clinical/Phase I, Phase IIa, Phase
IIb & Phase III
Commercial
launch
Generics
entering
Source: Divi’s Labs, Ventura Research
Source: Divi’s Lab, Ventura Research

- 10 of 14 - Friday 22nd
June, 2012
This document is for private circulation, and must be read in conjunction with the disclaimer on the last page.
Rupee depreciation to further boost margins
The Rupee depreciation is expected to positively impact margins by 100- 150 bps. Factoring for imports (~13.5% of net sales) and fixed currency contracts, 42% of net revenues would be a net beneficiary of the currency movement. However we have not factored this in our model and represents an upside risk to our estimates.
Strong cash flow and healthy balance sheet
Divi's has maintained strong cash flows for FY12 despite higher capex spend. The company has invested nearly ` 200 crore on the 2nd SEZ facility in Vizag and when
fully commissioned expects to garner close to ` 400 crore of revenue annually. Currently, the company has capitalized ` 78 crore towards the two commissioned
blocks of the Vizag facility and expects to capitalize `120 crore for the remaining three blocks by Q2FY13. The company further intends to spend `150 crore each in the next
two years on expansion of existing facilities. Strong capex cycle and capitalization of Vizag facility is positive for the company and would boost its revenues and profitability.
Margin Charts (%) Peer Comparison Charts
10
15
20
25
30
35
40
45
50
55
60
FY06 FY07 FY08 FY09 FY10 FY11 FY12 FY13E FY14E
EBITDA Margin RHS (%) PAT Margin RHS(%)
Affected by inventory destocking by global pharma giant
Divi's Lab Ltd
Biocon Ltd.
Dishman Pharma
Jubilant Life Sciences. Ltd
Piramal Healthcare
0
5
10
15
20
25
30
35
- 10.00 20.00 30.00 40.00
PA
T M
arg
in (
%)
EBITDA Margin (%)
Source: Divi’s Labs, Ventura Research Source: Divi’ Labs, Ventura Research
Strong cash flow despite capex
Particulars (Rs.Crore) FY 11 FY 12 FY 13E FY 14E
Capex -158.3 -263.2 -225.0 -250.0
Working Capital Changes -81.3 -208.8 -176.1 -248.3
Cash Flow Net of Capex 241.8 90.2 324.5 410.0
Debt/Equity Ratio (x) 0.0 0.0 0.0 0.0
Increase In Reserves 276.6 334.0 428.7 596.3
Source: Divi’s Labs, Ventura Research

- 11 of 14 - Friday 22nd
June, 2012
This document is for private circulation, and must be read in conjunction with the disclaimer on the last page.
Key Concerns
Delay in USFDA approval
Divi's recently commissioned DSN SEZ at Vizag is awaiting USFDA approvals and any delay in receiving the same would be a risk to our forecast. The management expects to receive USDFA approval by H1FY13 and we remain confident of achieving the same. However, any regulatory delays would impact revenue and profitability of the company adversely.
Higher tax incidence to impact profitability
Divi’s manufacturing facilities are located in areas offering tax subsidies and hence had a very low tax outgo. However, with Nalgenda facility tax benefit expiring and two units of the Vizag SEZ being eligible only for 50% exemption of export profits for the next 5 years (instead of 100% earlier) tax impact has enhanced to 20-23% from the earlier 7-11%.
Financial performance
Divi’s Laboratories Ltd has witnessed a robust 49.9% yoy growth in its top line to `
718.0 crore in Q4FY12 as against ` 479.1 crore in Q4FY11 led by strong growth
across segments. The EBITDA margins were maintained at 40.0% due to increasing contribution of the low margins generic API business. However, the PAT margins were lower by 640 bps on account of its higher tax expense.
Quarterly Financial Performance Particulars Q4FY12 Q4FY11 FY12 FY11
Net Sales 718.0 479.1 1858.6 1310.3
Growth % 49.9
41.8
Total Expenditure 431.2 286.9 1173.6 816.4
EBIDTA 286.9 192.2 685.0 494.0
EBDITA Margin % 40.0 40.1 36.9 37.7
Depreciation 16.6 13.5 62.1 53.4
EBIT (EX OI) 270.2 178.7 622.9 440.6
Other Income 4.5 10.7 61.5 33.3
EBIT 274.7 189.4 684.4 473.9
Margin % 38.3 39.5 36.8 36.2
Interest 2.73 0.99 3.74 1.52
Exceptional items 0.0 0.0 0.0 0.0
PBT 271.9 188.4 680.6 472.4
Margin % 37.9 39.3 36.6 36.0
Provision for Tax 55.0 13.2 147.4 43.1
PAT 216.9 175.2 533.3 429.3
PAT Margin (%) 30.2 36.6 28.7 32.8
Source: Divi’s Labs, Ventura Research
- 12 of 14 - Friday 22nd
June, 2012
This document is for private circulation, and must be read in conjunction with the disclaimer on the last page.
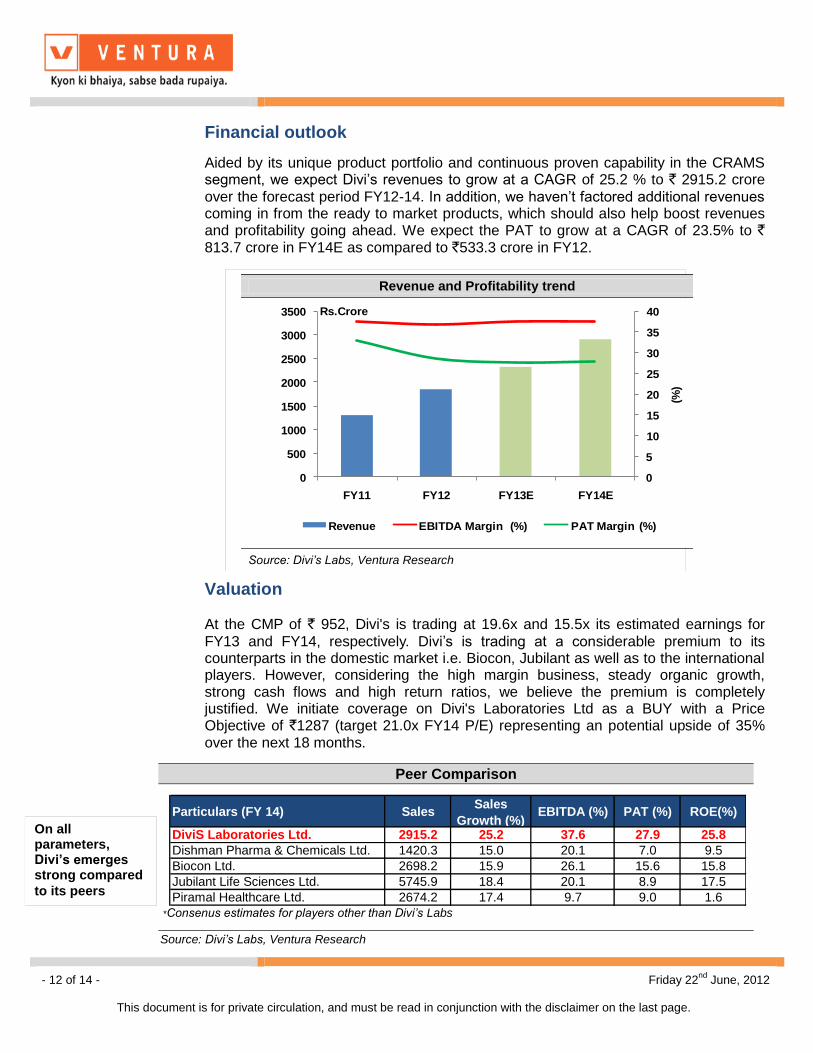
Financial outlook
Aided by its unique product portfolio and continuous proven capability in the CRAMS segment, we expect Divi’s revenues to grow at a CAGR of 25.2 % to ` 2915.2 crore
over the forecast period FY12-14. In addition, we haven’t factored additional revenues coming in from the ready to market products, which should also help boost revenues and profitability going ahead. We expect the PAT to grow at a CAGR of 23.5% to ` 813.7 crore in FY14E as compared to `533.3 crore in FY12.
Valuation At the CMP of ` 952, Divi's is trading at 19.6x and 15.5x its estimated earnings for
FY13 and FY14, respectively. Divi’s is trading at a considerable premium to its counterparts in the domestic market i.e. Biocon, Jubilant as well as to the international players. However, considering the high margin business, steady organic growth, strong cash flows and high return ratios, we believe the premium is completely justified. We initiate coverage on Divi's Laboratories Ltd as a BUY with a Price Objective of `1287 (target 21.0x FY14 P/E) representing an potential upside of 35% over the next 18 months.
Revenue and Profitability trend
0
5
10
15
20
25
30
35
40
0
500
1000
1500
2000
2500
3000
3500
FY11 FY12 FY13E FY14E
(%)
Rs.Crore
Revenue EBITDA Margin (%) PAT Margin (%)
Source: Divi’s Labs, Ventura Research
Peer Comparison
Particulars (FY 14) SalesSales
Growth (%)EBITDA (%) PAT (%) ROE(%)
DiviS Laboratories Ltd. 2915.2 25.2 37.6 27.9 25.8
Dishman Pharma & Chemicals Ltd. 1420.3 15.0 20.1 7.0 9.5
Biocon Ltd. 2698.2 15.9 26.1 15.6 15.8
Jubilant Life Sciences Ltd. 5745.9 18.4 20.1 8.9 17.5
Piramal Healthcare Ltd. 2674.2 17.4 9.7 9.0 1.6 *Consenus estimates for players other than Divi’s Labs
Source: Divi’s Labs, Ventura Research
On all parameters, Divi’s emerges strong compared
to its peers
- 13 of 14 - Friday 22nd
June, 2012
This document is for private circulation, and must be read in conjunction with the disclaimer on the last page.
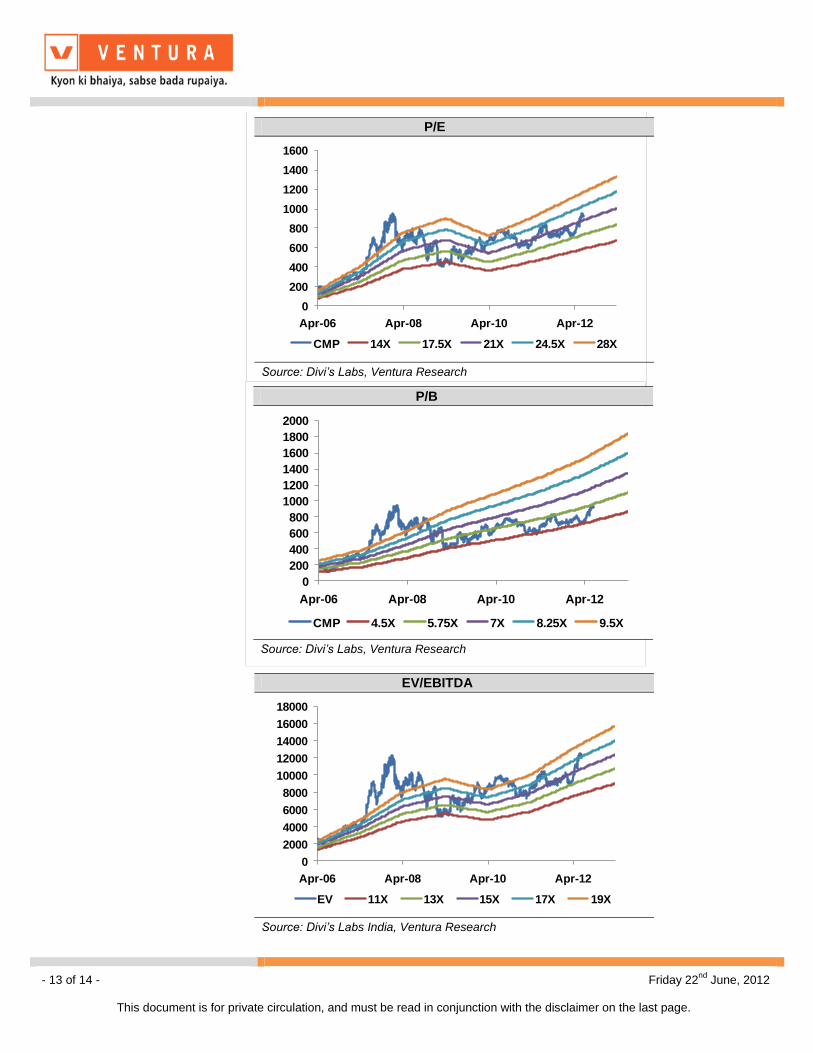
P/E
0
200
400
600
800
1000
1200
1400
1600
Apr-06 Apr-08 Apr-10 Apr-12
CMP 14X 17.5X 21X 24.5X 28X
Source: Divi’s Labs, Ventura Research
P/B
0
200
400
600
800
1000
1200
1400
1600
1800
2000
Apr-06 Apr-08 Apr-10 Apr-12
CMP 4.5X 5.75X 7X 8.25X 9.5X
Source: Divi’s Labs, Ventura Research
EV/EBITDA
0
2000
4000
6000
8000
10000
12000
14000
16000
18000
Apr-06 Apr-08 Apr-10 Apr-12
EV 11X 13X 15X 17X 19X
Source: Divi’s Labs India, Ventura Research

- 14 of 14 - Friday 22nd
June, 2012
This document is for private circulation, and must be read in conjunction with the disclaimer on the last page.
Financials and Projections
Y/E March, Fig in Rs. Cr FY 2011 FY 2012 FY 2013e FY 2014e Y/E March, Fig in Rs. Cr FY 2011 FY 2012 FY 2013e FY 2014e
Profit & Loss Statement Per Share Data (Rs)
Net Sales 1307.1 1858.6 2332.0 2915.2 EPS 32.3 40.2 48.7 61.3
% Chg. 42.2 25.5 25.0 Cash EPS 36.4 44.8 54.7 68.4
Total Expenditure 815.6 1173.6 1455.5 1819.4 DPS 10.0 10.0 10.0 10.0
% Chg. 43.9 24.0 25.0 Book Value 135.4 160.6 192.9 237.8
EBITDA 491.5 685.0 876.5 1095.8 Capital, Liquidity, Returns Ratio
EBITDA Margin % 37.6 36.9 37.6 37.6 Debt / Equity (x) 0.0 0.0 0.0 0.0
Other Income 36.5 61.5 46.8 60.3 Current Ratio (x) 2.5 2.7 2.6 2.6
Exceptional items 0.0 0.0 0.0 0.0 ROE (%) 23.9 25.0 25.2 25.8
PBDIT 528.0 746.5 923.4 1156.1 ROCE (%) 28.2 33.2 34.5 35.4
Depreciation 53.4 62.1 79.4 94.5 Dividend Yield (%) 1.1 1.1 1.1 1.1
Interest 2.2 3.7 4.7 4.7 Valuation Ratio (x)
PBT 472.4 680.6 839.2 1056.8 P/E 29.4 23.7 19.6 15.5
Tax Provisions 43.1 147.4 193.0 243.1 P/BV 7.0 5.9 4.9 4.0
Reported PAT 429.3 533.3 646.2 813.7 EV/Sales 9.7 6.8 5.4 4.3
PAT Margin (%) 32.8 28.7 27.7 27.9 EV/EBIDTA 25.8 18.5 14.4 11.6
Efficiency Ratio (x)
Manpower cost / Sales (%) 39.2 41.0 40.0 40.0 Inventory (days) 159.6 133.3 130.0 130.0
Other Exp / Sales (%) 7.1 14.1 14.0 14.0 Debtors (days) 102.6 97.3 95.0 95.0
Tax Rate (%) 9.1 21.7 23.0 23.0 Creditors (days) 67.7 59.2 60.0 60.0
Balance Sheet Cash Flow statement
Share Capital 26.5 26.6 26.6 26.6 Profit After Tax 429.3 533.3 646.2 813.7
Reserves & Surplus 1771.0 2105.0 2533.7 3130.0 Depreciation 53.4 62.1 79.4 94.5
Minority Interest & Others 0.0 0.0 0.0 0.0 Working Capital Changes -78.6 -198.0 -176.1 -248.3
Total Loans 23.0 52.8 52.8 52.8 Others -3.9 -43.9 0.0 0.0
Deferred Tax Iiability 50.0 60.9 60.9 60.9 Operating Cash Flow 400.1 353.4 549.5 660.0
Total Liabilities 1870.6 2245.2 2673.9 3270.2 Capital Expenditure -52.8 -232.5 -300.0 -270.0
Goodwill 0.0 0.0 0.0 0.0 Change in Investment -189.9 17.9 -20.4 -151.7
Gross Block 885.7 1118.2 1418.2 1688.2 Cash Flow from Investing -242.7 -214.6 -320.4 -421.7
Less: Acc. Depreciation 295.8 357.8 437.3 531.8 Proceeds from equity issue 7.7 0.0 0.0 0.0
Net Block 589.9 760.4 981.0 1156.4 Inc/ Dec in Debt -9.8 29.7 0.0 0.0
Capital Work in Progress 129.3 160.0 85.0 65.0 Dividend and DDT -154.1 -155.3 -217.4 -217.4
Investments 525.6 477.0 572.4 744.2 Cash Flow from Financing -156.2 -125.6 -217.4 -217.4
Net Current Assets 625.7 847.7 1035.5 1304.6 Net Change in Cash 1.2 13.3 11.7 20.8
Deferred Tax Assets 0.0 0.0 0.0 0.0 Opening Cash Balance 16.5 17.7 30.9 42.6
Total Assets 1870.6 2245.2 2673.9 3270.2 Closing Cash Balance 17.7 30.9 42.6 63.4
Ventura Securities Limited Corporate Office: C-112/116, Bldg No. 1, Kailash Industrial Complex, Park Site, Vikhroli (W), Mumbai – 400079 This report is neither an offer nor a solicitation to purchase or sell securities. The information and views expressed herein are believed to be reliable, but no responsibility (or liability) is accepted for errors of fact or opinion. Writers and contributors may be trading in or have positions in the securities mentioned in their articles. Neither Ventura Securities Limited nor any of the contributors accepts any liability arising out of the above information/articles. Reproduction in whole or in part without written permission is prohibited. This report is for private circulation.