investor's toolkit 5
DESCRIPTION
New Tools for Stock Analysis & Portfolio Management by Douglas Gerlach President, ICLUBcentral Inc. Investor's Toolkit 5. What's New in Investor's Toolkit 5?. Intelligent home page New OPS-integrated toolbar Insightful portfolio management tools Option to graph of SSG values to scale - PowerPoint PPT PresentationTRANSCRIPT

1
New Tools forNew Tools forStock AnalysisStock Analysis
&&Portfolio Portfolio
ManagementManagement
by Douglas GerlachPresident,
ICLUBcentral Inc.
Investor's Toolkit 5

2
What's New in Investor's Toolkit 5?
● Intelligent home page● New OPS-integrated toolbar● Insightful portfolio management
tools● Option to graph of SSG values to
scale● Full 5-year projections (not just to 5th
fiscal year)● And much more!

3
The Home Page
● Appears when you start up
● Items in red require attention
● Portfolio Report Card gives you status of holdings

4
Update Prices
Remove button removes single stock from update process

5
Update Company Data
● Import new data from OPS for all holdings
● To update one stock, select it and click Update Selected Company
● Click Update All to update all stocks

6
Portfolio Report Card
● Portfolios highlighted in red require attention
● Double-click to begin working with a portfolio

7
Portfolio Overview

8
Portfolio Alerts

9
Defense
● “Rule of 5” -- 1 out of 5 stocks will underperform your expectations
● Occasionally due to unpredictable circumstances
● More often due to fundamental problems
● Defense is protecting portfolio from damage from that 1 in 5 stock with fundamental problems

10
Offense
● Offense is proactively improving performance of your portfolio by replacing fine but overpriced companies
● Relates strictly to stock's price● Overvalued stocks can no longer
produce desirable return in future

11
Defensive Alerts

12
Defensive Actions
1) Compare– % change for Sales, PTP, and EPS– More analysis if growth doesn't meet
expectations
2) Analyze– Examine history to refine list of sale
candidates– Determine if marked trends exist
3) Decide– Use web to determine reasons for failure– Sell stocks ASAP with low prospects for
strong, steady growth

13
Using PERT
● PERT-A allows you to see subtle downtrends not always visible on quarter to-quarter basis
● Over time, however, these might aggregate into substantial decay in performance
● Gives you insight into past behavior of company

14
PERT-A Worksheet

15
PERT-A Graphs

16
Offensive Alerts

17
Offensive Action
1) Check Risk and Reward– Select companies whose RV, U/D Ratio, and
TR indicate they are overpriced
2) Reevaluate– Review SSG for each, making sure that EPS
growth and forecast high PEs are reasonable
3) Challenge– Replace companies with unsatisfactory return
& risk with companies of equal/better quality & better potential returns

18
Challenge Overpriced Stocks
Set Challenge Parameters

19
Select Challenger

20
Challenge Results

21
Working with SSGs & Data
● New Toolbar gives you instant access to online SSG data– Enter Ticker or Company name to
download SSG data from OPS– Automatically downloads nearly all
information necessary for SSG and PERT
22
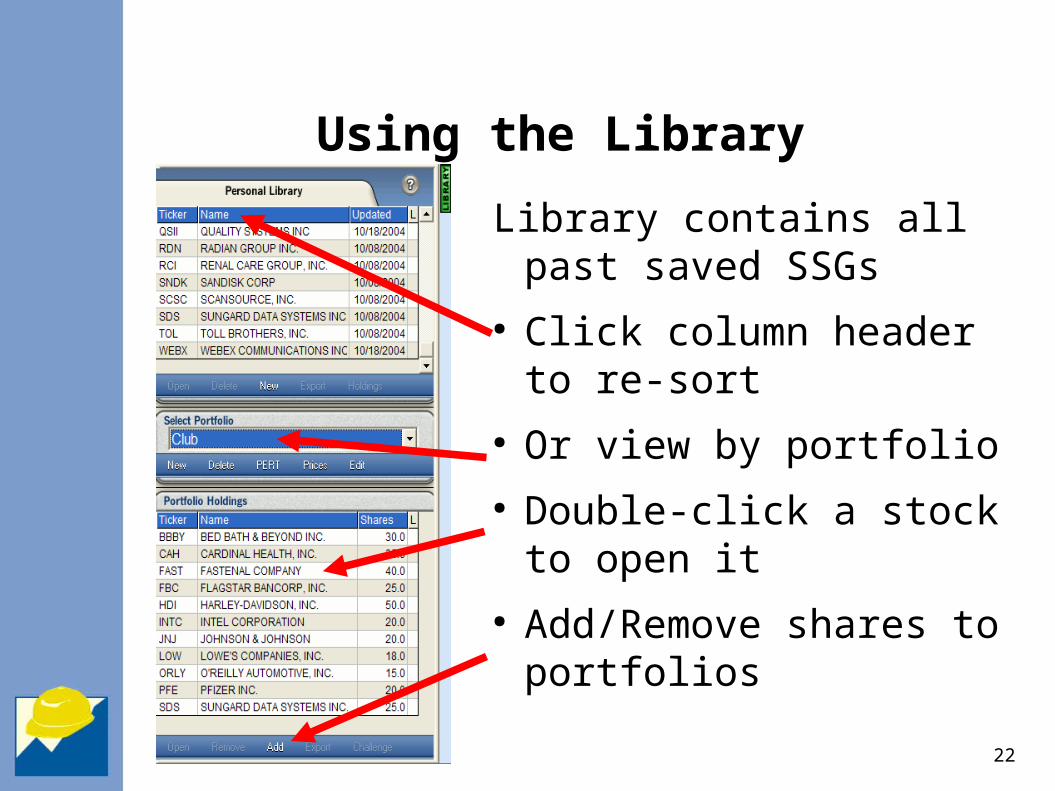
Using the Library
Library contains all past saved SSGs
● Click column header to re-sort
● Or view by portfolio● Double-click a stock
to open it● Add/Remove shares
to portfolios

23

24
Visual Analysis
Options for scaling graph, starting projection line & entering growth rates
25
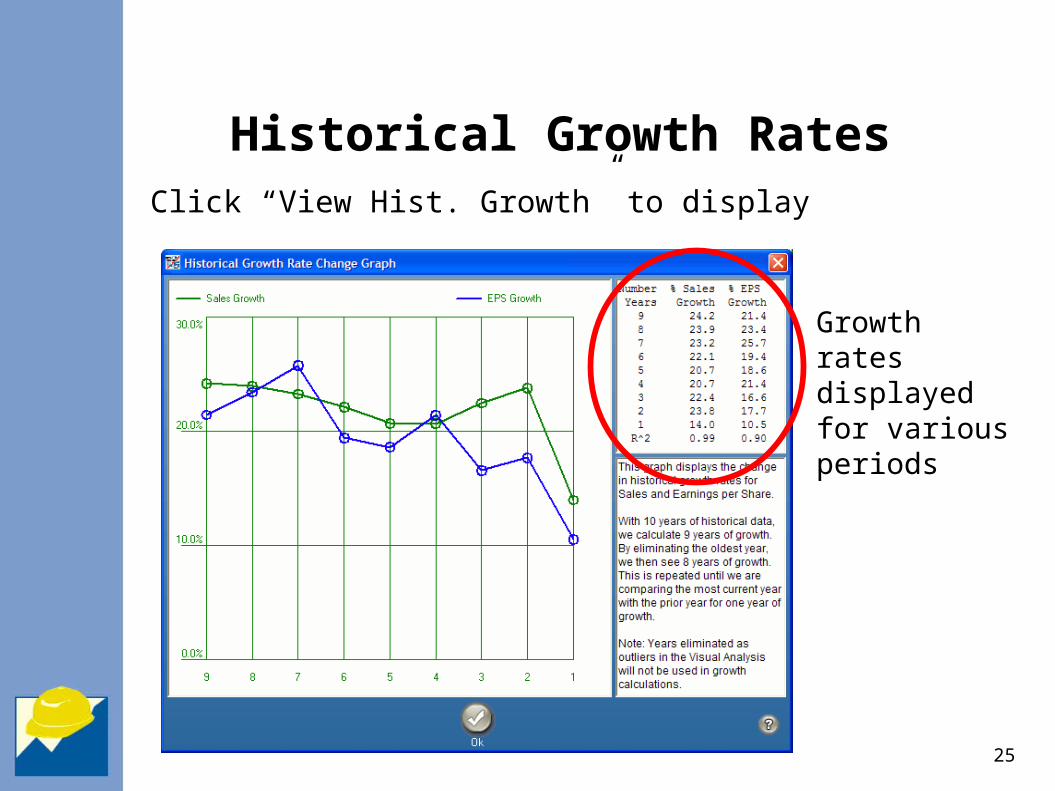
Historical Growth RatesClick “View Hist. Growth” to display
Growth rates displayed for various periods

26
Company Toolbar
● Quickly change to new form● Zoom in or out, print, save, refresh
data & price and more

27
SSG Page 2
Yellow, pink & green highlighting shows you items to review

28
Pre-Tax Profit Margin Graph
Allows you to visually identify trends in PTP.

29
High and Low P/E Ratio Graph
Review past P/E Ratios to identify trends that may continue in the future

30
Average Hi/Lo P/E Judgment
Review past high and low P/E Ratios
Eliminate outliers if necessary
3 options to choose from...
Or enter your own future estimates

31
Select Low Price
Select a potential low stock price or enter your own

32
Price Zones and U/D Ratio
Buy, sell or hold?
Forecasted high price
Current price
Selected low price

33
Many More Features
● Toolkit 5 also includes:– Stock Comparison Guide– Portfolio/PERT Reports, including:
● PERT● Portfolio Trend Report● Portfolio Summary● Portfolio Defense Report● Portfolio Offense Report

34
Recommended by USAToday.com
Try Investor's Toolkit 5 for yourself, and find out why USAToday.com called the program:“a great tool to help investors stop themselves from potentially paying
too much for a stock.”

35
Any Questions?

36
Investor's Toolkit 5
● For more information & free demo:http://www.iclub.com/tk5/
● To purchase:http://www.iclub.com/tk5/buy/
● For support:http://www.iclub.com/support/