investor presentation -...
TRANSCRIPT

Confidential
September 2017
Investor Presentation
Grupo Traxion, S.A.B. de C.V.

2
Content
(Top Alignment)
2.30
Subtitles
(bottom alignment) 2.62
Page Titles
3.09
Page Content
Left Alignment
4.60
Page Content
Right Alignment
4.60
Content
(Bottom Alignment)
3.00
Footnotes
(Top Alignment)
3.15
#0
#74
#130
#207
#223
#0
#119
#147
#60
#194
#199
#205
#75
#172
#198
#247
#150
#70
#101
#100
#106
Disclaimer
The material that follows presents general background information about Grupo Traxion, S.A.B. de C.V. (the “Company”) as of the date of the presentation. This information
consists of information concerning the Company. It is information in summary form and does not purport to be complete. It is not intended to be relied upon as advice to
potential investors and does not form the basis for an informed investment decision. This presentation is strictly confidential and may not be disclosed to any other person.
The information in this presentation is preliminary in nature and subject to change. No representation or warranty, express or implied, is made concerning, and no reliance
should be placed on, the accuracy, fairness or completeness of the information presented herein. All information in this presentation is subject to verification, correction,
completion and change without notice. In giving this presentation, none of the Company, any of its affiliates, directors, officers, agents or employees, nor any placement
agents, managers or initial purchasers undertake any obligation to provide the recipient with access to any additional information or to update this presentation or any
information or to correct any inaccuracies in any such information.
This presentation may contain statements that are forward-looking. Such forward-looking statements are only predictions and are not guarantees of future performance.
Investors are cautioned that any such forward-looking statements are and will be, as the case may be, subject to many risks, uncertainties and factors relating to the
operations and business environments of the Company and its subsidiaries that may cause the actual results of the Company to be materially different from any future results
expressed or implied in such forward-looking statements. None of the Company, any of its affiliates, directors, officers, agents or employees, nor any placement agents,
managers or initial purchasers, shall be liable to any third party (including investors) for any investment or business decision made or action taken in reliance on the information
and statements contained in this presentation or for any consequential, special or similar damages.
Securities may not be offered or sold in the United States unless they are registered or exempt from registration under the U.S. Securities Act of 1933, as amended (the
“Securities Act”). This presentation is being made only to investors that, by means of their attendance at this presentation, represent that they are “qualified institutional
buyers” as that term is defined in Rule 144A under the Securities Act. Any offering of securities to be made outside of Mexico will be made by means of an offering
memorandum that will be sent to you at the address that you provided today. Such offering memorandum will contain, or incorporate by reference, detailed
information about the Company and its business and financial results, as well as its financial statements. Investment decisions should be solely made on the
basis of the offering memorandum and not on the basis of this presentation.
This presentation does not constitute an offer, or an invitation or solicitation for an offer, to subscribe for or purchase any securities, nor shall any part of it nor the fact of its
dissemination form part of or be relied on in connection with any contract or investment decision relating thereto. Neither this presentation nor anything contained herein shall
form the basis of any contract or commitment. If the Company should at any time commence an offering of securities, any decision to invest in such offer to subscribe for or
acquire securities of the Company must be based wholly on the information contained in the offering memorandum to be issued by the Company in connection with any such
offer and not on the contents hereof.
By attending this presentation, you agree to be bound by terms and conditions set out above.

3
Content
(Top Alignment)
2.30
Subtitles
(bottom alignment) 2.62
Page Titles
3.09
Page Content
Left Alignment
4.60
Page Content
Right Alignment
4.60
Content
(Bottom Alignment)
3.00
Footnotes
(Top Alignment)
3.15
#0
#74
#130
#207
#223
#0
#119
#147
#60
#194
#199
#205
#75
#172
#198
#247
#150
#70
#101
#100
#106
16x Fleet growth
over the last 6 years
Traxion – The Mexican Ground Transportation Platform
Notes:
1. According to T21 Magazine (December 2016) and public filings of companies in the ground transportation industry
2. Average pro-forma units for 2016 (includes Egoba, MyM, Grupo SID, LIPU and AFN); 4,621 owned and 342 leased power units
3. Pro-forma figures as of 2016 include revenues or Adjusted EBITDA, respectively, of Grupo SID and LIPU for the full year and exclude 2016 Revenues or Adjusted EBITDA, respectively, of AFN prior to its acquisition; converted using 2016 average exchange rate of Ps$18.66 per US$ according to Banxico
4. Calculated as per audited financials
We believe we are the first and only
ground transportation and logistics
consolidator in Mexico
We operate through two
complementary business segments
Broad portfolio of services providing
a one-stop solution
Unique success story evolving into the largest company
in the Mexican ground transportation and logistics
industry(1) with an owned fleet of 4,963(2) power units
− Cargo Transportation and Logistics
(“Cargo & Logistics”)
− Contracted Personnel and Student
Transportation (“Contracted
Passenger Services”)
+345 MM kms driven per year
(214 million miles)
Nationwide Presence
+9,500 Employees
~US$329MM(3)
in Revenues
131.8% Revenue growth(4) over
the last 2 years
4 companies acquired
over the last 6 years
+900 Customers
Adjusted EBITDA of
~US$64MM(3)

4
Content
(Top Alignment)
2.30
Subtitles
(bottom alignment) 2.62
Page Titles
3.09
Page Content
Left Alignment
4.60
Page Content
Right Alignment
4.60
Content
(Bottom Alignment)
3.00
Footnotes
(Top Alignment)
3.15
#0
#74
#130
#207
#223
#0
#119
#147
#60
#194
#199
#205
#75
#172
#198
#247
#150
#70
#101
#100
#106
Snapshot of Segment Overview
Cargo & Logistics Contracted Passenger Services
One of the largest Cargo & Logistics service providers in Mexico
with the broadest array of service offerings
Cargo transportation services are offered on a spot or dedicated
basis
Notes:
1. Year average (2016)
2. Pro-forma, includes Egoba, MyM, Grupo SID and AFN; owned fleet
3. 3,057 power units are owned and 342 are leased
Largest contracted personnel and student
transportation platform in the country with
unmatched scale and regional reach
Dedicated service
Power units(1)(2)
5.4 Avg. fleet age
vs. 16.6 in the
industry
290k sqm of
warehousing
facilities
Power units(1)(3)
6.0 Avg. fleet age
Dry vans
Distribution and moving
International cargo
Logistics and distribution
International cargo and intermodal
Contracted Personnel and Student Transportation
1,564 3,046 3,399
Source: Company information, SCT

5
Content
(Top Alignment)
2.30
Subtitles
(bottom alignment) 2.62
Page Titles
3.09
Page Content
Left Alignment
4.60
Page Content
Right Alignment
4.60
Content
(Bottom Alignment)
3.00
Footnotes
(Top Alignment)
3.15
#0
#74
#130
#207
#223
#0
#119
#147
#60
#194
#199
#205
#75
#172
#198
#247
#150
#70
#101
#100
#106
History of Growth and Excellence for +65 Years
1952
Proven strategy to deliver profitable growth through organic expansion and M&A
Average fleet size (# of power units)
Lijtszain Family
(Founders)
Founded Muebles y
Mudanzas ("MyM") in 1952
2011 2012 2013 2015 2016 2014
776
4,963
760
752
316 300
Capital raise and
partnership to create
Acquisition of Egoba,
adding 300 units
Acquisition of Lipu,
adding 3,399 units
Acquisition of Grupo Mudancero
(MyM), adding 428 units
Acquisition of Grupo
SID, adding 580 units
Acquisition of AFN,
adding 222 units
'11-'16 Fleet CAGR: 75.3%
Capital Raise
Capital Raise
PROCEEDS
IPO

6
Content
(Top Alignment)
2.30
Subtitles
(bottom alignment) 2.62
Page Titles
3.09
Page Content
Left Alignment
4.60
Page Content
Right Alignment
4.60
Content
(Bottom Alignment)
3.00
Footnotes
(Top Alignment)
3.15
#0
#74
#130
#207
#223
#0
#119
#147
#60
#194
#199
#205
#75
#172
#198
#247
#150
#70
#101
#100
#106
Traxion: An Attractive Investment Opportunity
1
2
3
4
5
6
7
Largest ground transportation services and logistics company
in Mexico with strong industry fundamentals
Nationwide presence with focus on the fastest growing regions in
the country
Diversified and resilient business model
Best-in-class platform designed for growth
Track-record of disciplined acquisitions and successful
integration
Proven history of profitable growth
Experienced management team with strong corporate governance
and sophisticated shareholder base
SMART SPEED
7
Content
(Top Alignment)
2.30
Subtitles
(bottom alignment) 2.62
Page Titles
3.09
Page Content
Left Alignment
4.60
Page Content
Right Alignment
4.60
Content
(Bottom Alignment)
3.00
Footnotes
(Top Alignment)
3.15
#0
#74
#130
#207
#223
#0
#119
#147
#60
#194
#199
#205
#75
#172
#198
#247
#150
#70
#101
#100
#106
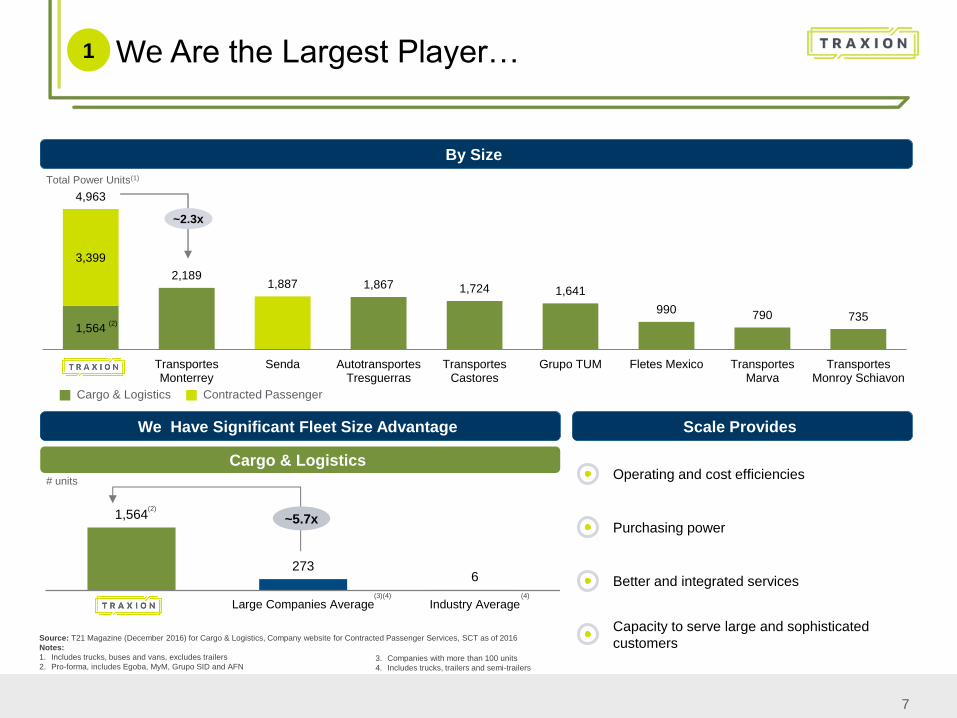
Total Power Units(1)
Source: T21 Magazine (December 2016) for Cargo & Logistics, Company website for Contracted Passenger Services, SCT as of 2016
Notes:
1. Includes trucks, buses and vans, excludes trailers
2. Pro-forma, includes Egoba, MyM, Grupo SID and AFN
By Size
We Are the Largest Player… 1
Cargo & Logistics
We Have Significant Fleet Size Advantage
# units
3. Companies with more than 100 units
4. Includes trucks, trailers and semi-trailers
Scale Provides
Operating and cost efficiencies
Purchasing power
Better and integrated services
Capacity to serve large and sophisticated
customers
1,564
273 6
Large Companies Average Industry Average
~5.7x
(3)(4) (4)
(2)
1,564
3,399
4,963
2,189 1,887 1,867 1,724 1,641
990 790 735
TransportesMonterrey
Senda AutotransportesTresguerras
TransportesCastores
Grupo TUM Fletes Mexico TransportesMarva
TransportesMonroy Schiavon
Cargo & Logistics Contracted Passenger
~2.3x
(2)

8
Content
(Top Alignment)
2.30
Subtitles
(bottom alignment) 2.62
Page Titles
3.09
Page Content
Left Alignment
4.60
Page Content
Right Alignment
4.60
Content
(Bottom Alignment)
3.00
Footnotes
(Top Alignment)
3.15
#0
#74
#130
#207
#223
#0
#119
#147
#60
#194
#199
#205
#75
#172
#198
#247
#150
#70
#101
#100
#106
…With the Broadest Portfolio of Service Offerings…
1
Truckload Intermodal Logistics
Cargo & Logistics
Personnel
Contracted Passenger
Student Tourism
Company
Number of
Units(1)
Domestic
Freight
Int’l Freight
& Transfers Moving LTL Intermodal Logistics Personnel Student Tourism
4,963(2)
Transportes
Monterrey 2,189
Senda 1,887
Autotransportes
Tresguerras 1,867
Transportes
Castores 1,724
Grupo TUM 1,641
Fletes Mexico 990
Transportes
Marva 790
T. Monroy
Schiavon 735
Material level of service offering No service offering
A True One-Stop Solution
Source: T21 Magazine (December 2016), Management estimates, companies websites
Note:
1 Including trucks, buses and vans, excludes trailers
2 Pro-forma, includes Egoba, MyM, Grupo SID, LIPU and AFN

9
Content
(Top Alignment)
2.30
Subtitles
(bottom alignment) 2.62
Page Titles
3.09
Page Content
Left Alignment
4.60
Page Content
Right Alignment
4.60
Content
(Bottom Alignment)
3.00
Footnotes
(Top Alignment)
3.15
#0
#74
#130
#207
#223
#0
#119
#147
#60
#194
#199
#205
#75
#172
#198
#247
#150
#70
#101
#100
#106
…in an Industry that has a Paramount Role in the Mexican Economy…
Source: INEGI, SCT, EMIS Insights
Notes:
1. Includes air, maritime, rail. cargo and passenger road transportation, as of 2015
2. Using 2015 average exchange rate of Ps$15.85 per US dollar according to Banxico
3. Includes transportation, postal and storage services according to INEGI, as of 2016
Road Transportation
86%
14%
Other Transportation Modes
5.9%(3) Contribution to GDP
Ps$1,432 billion (US$90Bn)(2)
Road Transportation
Ps$64 billion (US$4Bn)(2)
Rail Transportation
Road represents
56.2%(4) of Cargo Transportation
Road represents
96.0%(5) of Passenger Transportation
Share of Total Revenues(1)
Total Revenues(1): Ps$1,668 billion (US$105Bn)(2)
Road is the Backbone of the Mexican Transportation Industry
1
Ps$153 billion (US$10Bn)(2)
Air Transportation
Ps$19 billion (US$1Bn)(2)
Maritime Transportation
Ps$300Bn Government investment
between 2012-2016 in
road infrastructure(6)
4. Autotransporte de Carga, Estadistica Basica del Autotransporte Federal SCT, as of 2016
5. Autotransporte Federal de Pasajeros, Estadistica Basica del Autotransporte Federal SCT, as of 2016
6. Presidencia de la Republica, 4o informe de gobierno

10
Content
(Top Alignment)
2.30
Subtitles
(bottom alignment) 2.62
Page Titles
3.09
Page Content
Left Alignment
4.60
Page Content
Right Alignment
4.60
Content
(Bottom Alignment)
3.00
Footnotes
(Top Alignment)
3.15
#0
#74
#130
#207
#223
#0
#119
#147
#60
#194
#199
#205
#75
#172
#198
#247
#150
#70
#101
#100
#106
…that is Highly Fragmented with Room for Consolidation
1
Largest Player in a Highly Fragmented Industry
Cargo & Logistics
Road Cargo Transportation Industry Structure (Participation in the Market Category Per Unit)
Small Companies
(6-30 units)
Medium Companies
(31-100 units)
Large Companies
(+100 units)
Owner Operators
(1-5 units)
Notes:
1. Includes trucks, trailers and semi-trailers
81%
25%
16%
30%
2%
17%
1%
29%
% Companies % Units
140.8k companies
864.8k units(1)
More than 900 sizable
potential targets
with +245K units present
enormous opportunity to
consolidate the industry
Source: SCT, as of 2016

11
Content
(Top Alignment)
2.30
Subtitles
(bottom alignment) 2.62
Page Titles
3.09
Page Content
Left Alignment
4.60
Page Content
Right Alignment
4.60
Content
(Bottom Alignment)
3.00
Footnotes
(Top Alignment)
3.15
#0
#74
#130
#207
#223
#0
#119
#147
#60
#194
#199
#205
#75
#172
#198
#247
#150
#70
#101
#100
#106
We Grow Faster than the Industry
Traxion Footprint: Focus on the Fastest Growing
Regions in the Country
Quintana Roo Baja
California
Aguascalientes
Guanajuato
Queretaro
Jalisco
2010 – 2015 Real GDP CAGR
2.8% National GDP Growth Average
All Subsidiaries Present
No Presence
Main Operations / Economic Regions
2
Source: INEGI, Company information
Sonora
Nuevo
Leon
San Luis
Potosi
Large Companies are Growing Faster Than the Rest
of the Cargo Industry
Cargo Transportation Industry | Number of Units (000’s)(1)
Source: SCT
191 203 194 199 206 215
207 221 226 235 245 260
112 122 123 127 133
143 148
170 186 202
222 246
659 716 729
763 806
865
2011 2012 2013 2014 2015 2016
2011 - 2016
CAGR
10.7%
4.9%
4.7%
2.4%
2011 - 2016PF CAGR(2): 39.1%
Small Companies
(6-30 units)
Medium Companies
(31-100 units)
Large Companies
(+100 units)
Owner Operators
(1-5 units)
Notes:
1. Includes trucks, trailers and semi-trailers
2. CAGR of power units in the Cargo & Logistics segment
6.3%
5.4%
5.4%
5.0% 3.3%
3.9%
3.9%
4.0%
3.8%
12
Content
(Top Alignment)
2.30
Subtitles
(bottom alignment) 2.62
Page Titles
3.09
Page Content
Left Alignment
4.60
Page Content
Right Alignment
4.60
Content
(Bottom Alignment)
3.00
Footnotes
(Top Alignment)
3.15
#0
#74
#130
#207
#223
#0
#119
#147
#60
#194
#199
#205
#75
#172
#198
#247
#150
#70
#101
#100
#106
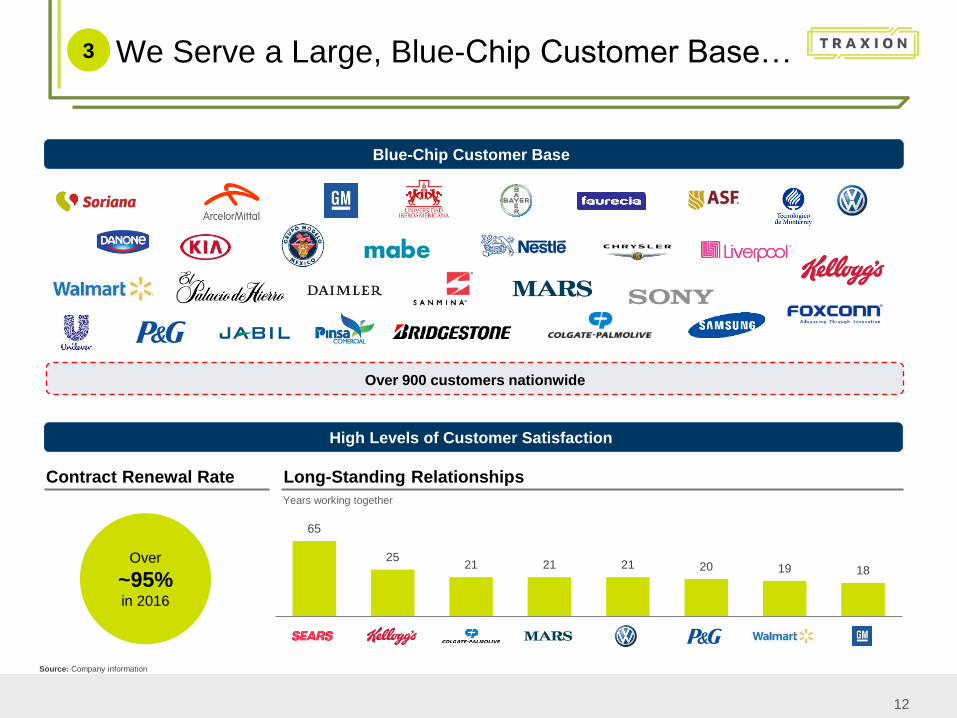
We Serve a Large, Blue-Chip Customer Base…
Blue-Chip Customer Base
Over 900 customers nationwide
High Levels of Customer Satisfaction
Contract Renewal Rate Long-Standing Relationships
65
25 21 21 21 20 19 18
Over
~95% in 2016
Years working together
3
Source: Company information

13
Content
(Top Alignment)
2.30
Subtitles
(bottom alignment) 2.62
Page Titles
3.09
Page Content
Left Alignment
4.60
Page Content
Right Alignment
4.60
Content
(Bottom Alignment)
3.00
Footnotes
(Top Alignment)
3.15
#0
#74
#130
#207
#223
#0
#119
#147
#60
#194
#199
#205
#75
#172
#198
#247
#150
#70
#101
#100
#106
Top 10
Top 20
Top 40
Top 30
Top 50
Other
…Which Supports our Diversified and Resilient Business Model
Revenue Breakdown(1)
Notes:
1. Based on 2016 Pro-forma figures
2. Company estimates according to 2016 Pro-forma financials
By Segment
3
Source: Company financials, Company information
Commercial Agreements
Contracted
Passenger
Services
38% Cargo &
Logistics
62%
Other
1%
Cargo
52%
Logistics
11%
Passenger
36%
Cargo
51%
Logistics
11%
Passenger
38%
No customer represents
more than 5% of the
company’s revenue
Partner of choice for international peers that need a local operating
partner
− 33 commercial agreements with leading international cargo &
logistics companies
Automotive
23%
Industrial
19%
School
6%
Tech
3%
Other
11% Government
3%
Retail
36%
By Industry(2) By Customer Concentration(2)
26%
46%
57%
38%
52%

14
Content
(Top Alignment)
2.30
Subtitles
(bottom alignment) 2.62
Page Titles
3.09
Page Content
Left Alignment
4.60
Page Content
Right Alignment
4.60
Content
(Bottom Alignment)
3.00
Footnotes
(Top Alignment)
3.15
#0
#74
#130
#207
#223
#0
#119
#147
#60
#194
#199
#205
#75
#172
#198
#247
#150
#70
#101
#100
#106
Well-Defined Strategy to Deliver Further Profitable Growth
Operations Financial M&A Commercial
• Continuous monitoring
and improvement to
drive margin
expansion
• Seamless nationwide
reach and international
connection
• One-stop solution
• Reliability and quality
in our services
• Brand differentiation
• Strong customer
relationships
• Increased share of
customers’ wallet
• Cross-selling
• Disciplined use of
leverage
• Cost control and
efficiency
• Allocation of growth
capital to maximize
returns
• Smart capital
allocation & selective
acquisitions
• Opportunistic
acquisitions
• Synergy analysis and
implementation
Proven ability to grow organically and inorganically thanks to a well defined strategy
An integrated approach to support further growth
4

15
Content
(Top Alignment)
2.30
Subtitles
(bottom alignment) 2.62
Page Titles
3.09
Page Content
Left Alignment
4.60
Page Content
Right Alignment
4.60
Content
(Bottom Alignment)
3.00
Footnotes
(Top Alignment)
3.15
#0
#74
#130
#207
#223
#0
#119
#147
#60
#194
#199
#205
#75
#172
#198
#247
#150
#70
#101
#100
#106
Best-In-Class Efficiently Run Operations 4
Robust Technological Platform With Focus on
GPS
Electronic Toll-Collection
System
Safe Driving Training
In-house Maintenance
Speed Control
Renewal of Fleet
Route Evaluation
24/7/365
Tracking &
Tracing
Interface with
any ERP
System
Company to provide
information
Industry Certifications
Best TMS(1) on Warehouse Management Systems
Reliability
Quality Safety
Operating
and cost
efficiencies
5.8 Average
Fleet Age
as of 2016(2)
94.9%
Fleet
Utilization
in 2016(2)
96.1%
sqm utilization
in 2016(2) Source: Company information Notes:
1. Transportation Management System
2. Average fleet age for all power units, fleet utilization for cargo segment and
sqm utilization for logistics operations

16
Content
(Top Alignment)
2.30
Subtitles
(bottom alignment) 2.62
Page Titles
3.09
Page Content
Left Alignment
4.60
Page Content
Right Alignment
4.60
Content
(Bottom Alignment)
3.00
Footnotes
(Top Alignment)
3.15
#0
#74
#130
#207
#223
#0
#119
#147
#60
#194
#199
#205
#75
#172
#198
#247
#150
#70
#101
#100
#106
Differentiated Commercial Strategy Driving Superior Organic Growth
4
Commercial Strategy Description
New Customers
Customer
Relationships
Cross-Selling
Strong specialized team
Corporate strategy
Dedicated and highly specialized customer service team
Focus on maintaining our client base
Capitalize further growth of our clients
Corporate team specialized on identifying opportunities
Broad service offering
One-Stop Solution for Client Needs
Cargo
Logistics
Personnel
Within Existing Customer Base
+900
Customers Product Personnel

17
Content
(Top Alignment)
2.30
Subtitles
(bottom alignment) 2.62
Page Titles
3.09
Page Content
Left Alignment
4.60
Page Content
Right Alignment
4.60
Content
(Bottom Alignment)
3.00
Footnotes
(Top Alignment)
3.15
#0
#74
#130
#207
#223
#0
#119
#147
#60
#194
#199
#205
#75
#172
#198
#247
#150
#70
#101
#100
#106
A Platform Providing Unique Competitive Advantages
4
Increase Synergies Potential
HR Commercial
• Cultural alignment
• Build management and
leadership development
programs
Shared Services Best Practices
Corporate
support
Sharing best practices
Sharing business knowledge
EBITDA
Growth
IT Systems Commercial
Strategy
Human
Resources Financial
Procurement
Management groups
Continuous improvement
Procurement IT
• Assigned IT budget
• Corporate IT Initiatives plan
• Most robust IT systems in
the Industry
• Best processes and policies
in industry
• Savings through scale:
diesel, tires, lubricants and
other
• Cross Selling
• Commercial strategy
Efficient
Management
Cost
Reduction
Quality
Servicing
Incorporation
of New Companies
Constant
Growth
18
Content
(Top Alignment)
2.30
Subtitles
(bottom alignment) 2.62
Page Titles
3.09
Page Content
Left Alignment
4.60
Page Content
Right Alignment
4.60
Content
(Bottom Alignment)
3.00
Footnotes
(Top Alignment)
3.15
#0
#74
#130
#207
#223
#0
#119
#147
#60
#194
#199
#205
#75
#172
#198
#247
#150
#70
#101
#100
#106
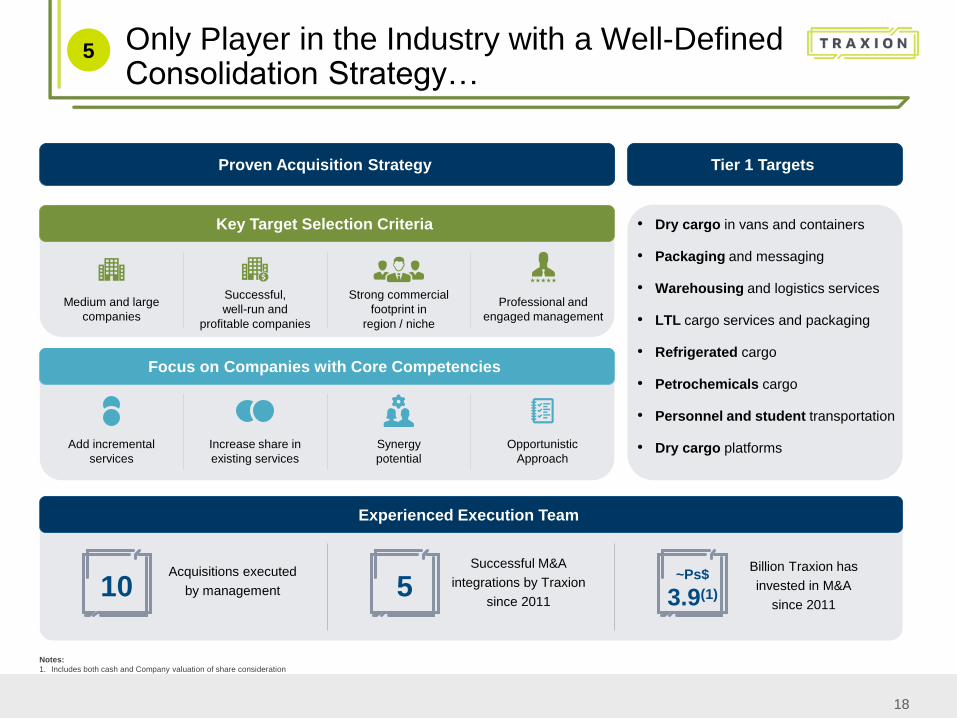
Only Player in the Industry with a Well-Defined Consolidation Strategy…
Acquisitions executed
by management
Successful M&A
integrations by Traxion
since 2011
Billion Traxion has
invested in M&A
since 2011
Experienced Execution Team
Notes:
1. Includes both cash and Company valuation of share consideration
Medium and large
companies
Successful,
well-run and
profitable companies
Strong commercial
footprint in
region / niche
Professional and
engaged management
Key Target Selection Criteria
Focus on Companies with Core Competencies
Add incremental
services
Increase share in
existing services
Synergy
potential
Opportunistic
Approach
Proven Acquisition Strategy
5
5 10 ~Ps$
3.9(1)
Tier 1 Targets
• Dry cargo in vans and containers
• Packaging and messaging
• Warehousing and logistics services
• LTL cargo services and packaging
• Refrigerated cargo
• Petrochemicals cargo
• Personnel and student transportation
• Dry cargo platforms

19
Content
(Top Alignment)
2.30
Subtitles
(bottom alignment) 2.62
Page Titles
3.09
Page Content
Left Alignment
4.60
Page Content
Right Alignment
4.60
Content
(Bottom Alignment)
3.00
Footnotes
(Top Alignment)
3.15
#0
#74
#130
#207
#223
#0
#119
#147
#60
#194
#199
#205
#75
#172
#198
#247
#150
#70
#101
#100
#106
…a Concrete M&A Pipeline Already Identified…
5
Refrigerated Cargo
Services Offered
Near-term opportunities of over 4,000 power units
Dry Cargo
Petrochemicals Cargo
Personnel Transportation
Messaging and Packaging
Identified Targets(1)
• 3 targets
• 4 targets
• 5 targets
• 2 targets
• 1 target
Rationale
New Service Regional
Expansion Strategic Fit Synergies
Notes:
1. No assurance can be given that the acquisitions of these potential targets will be completed. Some targets may not have been approached by the Company and there may not be ongoing discussions with respect to potential transactions. If acquisitions are consummated, there is no assurance that they will be accretive to the Company or that any synergies or additional economies of scale will be achieved
Dry Cargo / LTL • 1 target

20
Content
(Top Alignment)
2.30
Subtitles
(bottom alignment) 2.62
Page Titles
3.09
Page Content
Left Alignment
4.60
Page Content
Right Alignment
4.60
Content
(Bottom Alignment)
3.00
Footnotes
(Top Alignment)
3.15
#0
#74
#130
#207
#223
#0
#119
#147
#60
#194
#199
#205
#75
#172
#198
#247
#150
#70
#101
#100
#106
… and Strong Track-Record of Disciplined Acquisitions and Successful Integrations
We Have Maintained Financial Discipline in Each of our Acquisitions
Acquired: Dec 2011
Fleet: 300
Acquired: May 2016
Fleet: 580
Acquired: June 2016
Fleet: 222
Acquired: October 2016
Fleet: 3,399
Acquired: June 2013
Fleet: 428
• Transfer of best practices • Procurement efficiencies • Commercial intelligence
Proven Acquisition Model
5
• Cargo: fleet utilization
• Logistics: optimize
customer base
• Accelerate fleet growth
• Growth opportunities
with additional equity
• Expand number of
clients
• Extract economies of
scale
• Growth opportunities
with additional equity
Egoba MyM Grupo
SID AFN LIPU
• Commercial strategy
• Management
professionalization
(business plan and
KPIs)
• Increase profitability of
business structure
• Professionalization
(business plan and
KPIs)

21
Content
(Top Alignment)
2.30
Subtitles
(bottom alignment) 2.62
Page Titles
3.09
Page Content
Left Alignment
4.60
Page Content
Right Alignment
4.60
Content
(Bottom Alignment)
3.00
Footnotes
(Top Alignment)
3.15
#0
#74
#130
#207
#223
#0
#119
#147
#60
#194
#199
#205
#75
#172
#198
#247
#150
#70
#101
#100
#106
Traxion continues to deliver a strong track record of growth into 1H17
Revenue
1,592 1,746
3,249 3,789
1,733 2,018
425
2,311
1,058
1,431
1,597 1,748
3,702
6,134
2,801
3,465
2014A 2015A 2016A 2016 PF 1H16 PF 1H17
Ps$MM Average power units
1,564 1,552
3,399 3,690
760 776
4,963
5,242
2014A 2015A 2016 PF 1H17
Cargo & Logistics Contracted Passenger Sevices
Source: Company financials
Notes:
1. Pro-Forma figures include revenues of Grupo SID and LIPU for the full relevant period and include AFN figures from audited financials
2. Pro-Forma figures include average power units of Egoba, MyM, Grupo Sid, LIPU and AFN
Proven History of Growth…
(1) (1)
6
Cargo & Logistics Contracted Passenger Services Other
(2)
Fleet Growth

22
Content
(Top Alignment)
2.30
Subtitles
(bottom alignment) 2.62
Page Titles
3.09
Page Content
Left Alignment
4.60
Page Content
Right Alignment
4.60
Content
(Bottom Alignment)
3.00
Footnotes
(Top Alignment)
3.15
#0
#74
#130
#207
#223
#0
#119
#147
#60
#194
#199
#205
#75
#172
#198
#247
#150
#70
#101
#100
#106
Adjusted EBITDA Adjusted EBITDA Margin
Maintenance of Units(2)
Ps$MM
220 286
768
1,191
470
630
2014A 2015A 2016A 2016 PF 1H16 PF 1H17
%
13.8
16.3
20.7 19.4
16.8 18.2
2014A 2015A 2016A 2016 PF 1H16 PF 1H17
Source: Company financials
Notes:
1. Pro-Forma figures include Grupo SID and LIPU for the full relevant period and include AFN figures from audited financials
2. Maintenance of units included in COGS; already accounted for in Adjusted EBITDA
…Profitability…
(1)
Ps$MM
119 74
612
469 7.4% 4.2%
16.5%
13.5%
2014A 2015A 2016A 1H17
Acquisition of Transportation Equipment and Machinery as % of Revenue
(1) (1)
6
(1)
Acquisition of Transportation Equipment and Machinery
Ps$MM
76 88
183 168
4.8%
5.0%
4.9% 4.8%
2014A 2015A 2016A 1H17
Maintenance of Units as % of Revenue

23
Content
(Top Alignment)
2.30
Subtitles
(bottom alignment) 2.62
Page Titles
3.09
Page Content
Left Alignment
4.60
Page Content
Right Alignment
4.60
Content
(Bottom Alignment)
3.00
Footnotes
(Top Alignment)
3.15
#0
#74
#130
#207
#223
#0
#119
#147
#60
#194
#199
#205
#75
#172
#198
#247
#150
#70
#101
#100
#106
…and Disciplined Financial Strategy
Leverage • Commitment to maintain a strong, bullet-proof balance sheet
• Long-term target Net Debt / EBITDA level of 1.5-2.5x
Liquidity • Maintain adequate liquidity to fund working capital
• Maintain a goal of 60 days of receivables
Capex • Capex allocation based on higher return projects and approved by executive committee
• Target companies must meet financial returns thresholds
Margins • Maintain solid margins
• Improve target’s margins as appropriate through efficiencies
6

24
Content
(Top Alignment)
2.30
Subtitles
(bottom alignment) 2.62
Page Titles
3.09
Page Content
Left Alignment
4.60
Page Content
Right Alignment
4.60
Content
(Bottom Alignment)
3.00
Footnotes
(Top Alignment)
3.15
#0
#74
#130
#207
#223
#0
#119
#147
#60
#194
#199
#205
#75
#172
#198
#247
#150
#70
#101
#100
#106
Experienced Management Team…
Years of relevant experience
Bernardo Lijtszain
Hector Gonzalez
Rodolfo Mercado Victor Bravo Adolfo Salame
Jose Suarez
Rotter
Jose Luis
Estrada
Patricio
Pasquel
Elias Dana
Roffe
Alejandro
Marroquin
45+
30+
20+ 30+ 10+
40+ 40+ 20+ 12+ 15+
Aby Lijtszain
20+
Chairman of the Board
Vice Chairman / CEO
Internal Auditor
COO CFO M&A
Corporate Structure
7
Top Management Background
Bernardo
Lijtszain
Chairman
Aby Lijtszain
Vice Chairman &
Corporate CEO
Rodolfo
Mercado
Corporate COO
Victor Bravo
Corporate CFO
Adolfo Salame
M&A Director
• Co-founder and current Chairman of Traxion with over 45
years of relevant experience
• Board member of Union Nacional de Credito de
Autotransporte, former President of CANACAR(1) and former
President of Confederacion del Autotransporte, among other
relevant positions in the industry
• Co-founder, Vice Chairman and CEO of Traxion, responsible
for strategic planning with over 20 years of experience in the
transportation industry
• Member of the Board of Directors and COO of Traxion with
over 20 years of relevant experience
• He previously served as COO of Lipu and CEO of Settepi
prior to its acquisition by Lipu
• CFO of Traxion with ample experience in positions in
Corporate Finance, Project Finance, Infrastructure
Operations and General Management
• Previously served as OMA’s(2) Airports CFO and later CEO,
as well as ICA’s CFO
• Led OMA’s(2) Airports IPO in 2006
• M&A Director of Traxion with over 10 years of relevant
experience
• Previously served 7 years at Von Wobeser y Sierra advising
leading multinational companies in corporate and regulatory
administrative issues Notes:
1 Camara Nacional del Autotransporte de Carga
2 OMA is a public airports operator with a market cap of ~US$2.5Bn
Over 20+ years of relevant experience on average

25
Content
(Top Alignment)
2.30
Subtitles
(bottom alignment) 2.62
Page Titles
3.09
Page Content
Left Alignment
4.60
Page Content
Right Alignment
4.60
Content
(Bottom Alignment)
3.00
Footnotes
(Top Alignment)
3.15
#0
#74
#130
#207
#223
#0
#119
#147
#60
#194
#199
#205
#75
#172
#198
#247
#150
#70
#101
#100
#106
Independent(1)
67%
Non-independent
33%
Strong Corporate Governance
Current Ownership Structure
Board of Directors Composition Solid Shareholder Base
Our process of institutionalization started 10 years ago
Audit committee
Corporate governance committee
Code of ethics
7 …with Strong Corporate Governance and Sophisticated Investor Base…
Total = 15 Members
Instrumental Pillars of our Success
Well-known, highly reputable investor base with entrenched
relationships in the industry
Develop joint vision of business objectives and execution
strategy:
Larger scale
Execute attractive acquisitions
Improve profitability Notes:
1 According to Ley del Mercado de Valores
Management team with ~23% ownership
Individuals 21.3%
Other 16.3%
17.7%
44.7%

26
Content
(Top Alignment)
2.30
Subtitles
(bottom alignment) 2.62
Page Titles
3.09
Page Content
Left Alignment
4.60
Page Content
Right Alignment
4.60
Content
(Bottom Alignment)
3.00
Footnotes
(Top Alignment)
3.15
#0
#74
#130
#207
#223
#0
#119
#147
#60
#194
#199
#205
#75
#172
#198
#247
#150
#70
#101
#100
#106
A Superior Platform Built for Long-Term Growth
Mexico’s largest ground
transportation and logistics
services platform(1) with
nationwide presence and focus
on the fastest growing regions
in the country
Proven history of high growth
and profitability
We believe we are the first and
only transportation and
logistics consolidator in
Mexico with a solid track-
record of disciplined acquisitions
and successful integration
Note:
1. According to T21 Magazine (December 2016) and public filings of companies in the ground transportation industry
Supplemental Information
Appendix

28
Content
(Top Alignment)
2.30
Subtitles
(bottom alignment) 2.62
Page Titles
3.09
Page Content
Left Alignment
4.60
Page Content
Right Alignment
4.60
Content
(Bottom Alignment)
3.00
Footnotes
(Top Alignment)
3.15
#0
#74
#130
#207
#223
#0
#119
#147
#60
#194
#199
#205
#75
#172
#198
#247
#150
#70
#101
#100
#106
Leverage and Capital Structure
1H17 Debt Profile Debt Amortization Schedule
Capitalization Table
Notes:
1. Includes current installments of long-term debt and long-term debt
12%
88%
Short-term debt
Long-term debt
Debt(1)= Ps$3,183MM
262 271 310 486
656
995
2017 2018 2019 2020 2021 2022 2023
1H17 | Ps$MM 1H17
Current installments of long-term debt 378
Current installments of obligations under capital leases 59
Long-term debt, excluding current installments 2,805
Obligations under capital leases, excluding current installments 185
Total debt 3,427
Total shareholders’ equity 5,039
Total capitalization 8,465
Total debt / equity (%) 68.0%
Ps$MM
29
Content
(Top Alignment)
2.30
Subtitles
(bottom alignment) 2.62
Page Titles
3.09
Page Content
Left Alignment
4.60
Page Content
Right Alignment
4.60
Content
(Bottom Alignment)
3.00
Footnotes
(Top Alignment)
3.15
#0
#74
#130
#207
#223
#0
#119
#147
#60
#194
#199
#205
#75
#172
#198
#247
#150
#70
#101
#100
#106
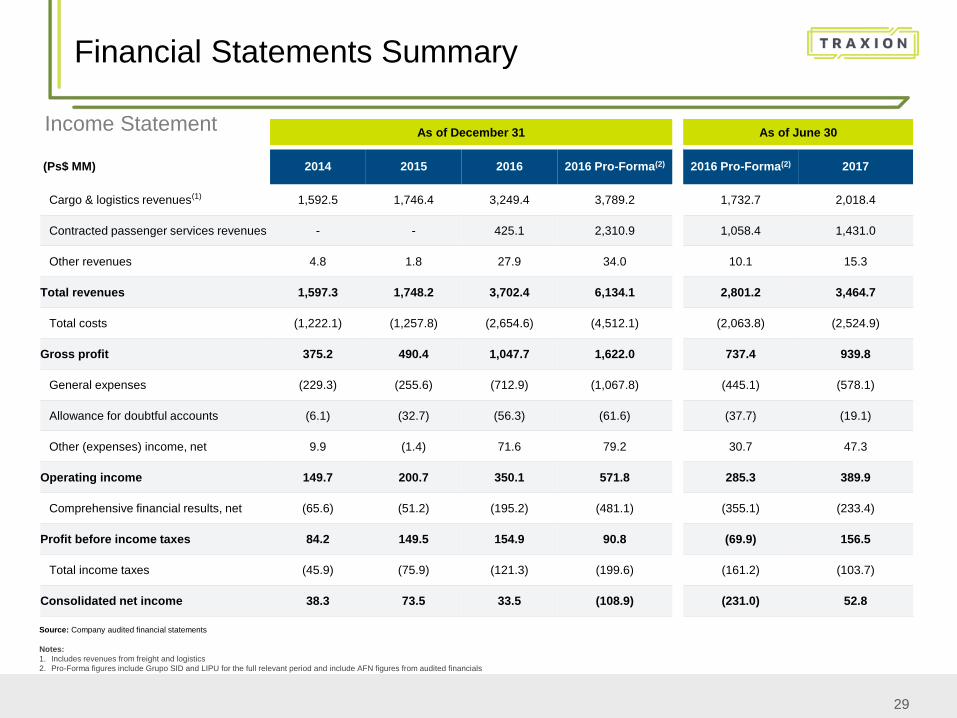
Financial Statements Summary
Income Statement
(Ps$ MM) 2014 2015 2016 2016 Pro-Forma(2)
Cargo & logistics revenues(1) 1,592.5 1,746.4 3,249.4 3,789.2
Contracted passenger services revenues - - 425.1 2,310.9
Other revenues 4.8 1.8 27.9 34.0
Total revenues 1,597.3 1,748.2 3,702.4 6,134.1
Total costs (1,222.1) (1,257.8) (2,654.6) (4,512.1)
Gross profit 375.2 490.4 1,047.7 1,622.0
General expenses (229.3) (255.6) (712.9) (1,067.8)
Allowance for doubtful accounts (6.1) (32.7) (56.3) (61.6)
Other (expenses) income, net 9.9 (1.4) 71.6 79.2
Operating income 149.7 200.7 350.1 571.8
Comprehensive financial results, net (65.6) (51.2) (195.2) (481.1)
Profit before income taxes 84.2 149.5 154.9 90.8
Total income taxes (45.9) (75.9) (121.3) (199.6)
Consolidated net income 38.3 73.5 33.5 (108.9)
Source: Company audited financial statements
As of December 31 As of June 30
2016 Pro-Forma(2) 2017
1,732.7 2,018.4
1,058.4 1,431.0
10.1 15.3
2,801.2 3,464.7
(2,063.8) (2,524.9)
737.4 939.8
(445.1) (578.1)
(37.7) (19.1)
30.7 47.3
285.3 389.9
(355.1) (233.4)
(69.9) 156.5
(161.2) (103.7)
(231.0) 52.8
Notes:
1. Includes revenues from freight and logistics
2. Pro-Forma figures include Grupo SID and LIPU for the full relevant period and include AFN figures from audited financials
30
Content
(Top Alignment)
2.30
Subtitles
(bottom alignment) 2.62
Page Titles
3.09
Page Content
Left Alignment
4.60
Page Content
Right Alignment
4.60
Content
(Bottom Alignment)
3.00
Footnotes
(Top Alignment)
3.15
#0
#74
#130
#207
#223
#0
#119
#147
#60
#194
#199
#205
#75
#172
#198
#247
#150
#70
#101
#100
#106
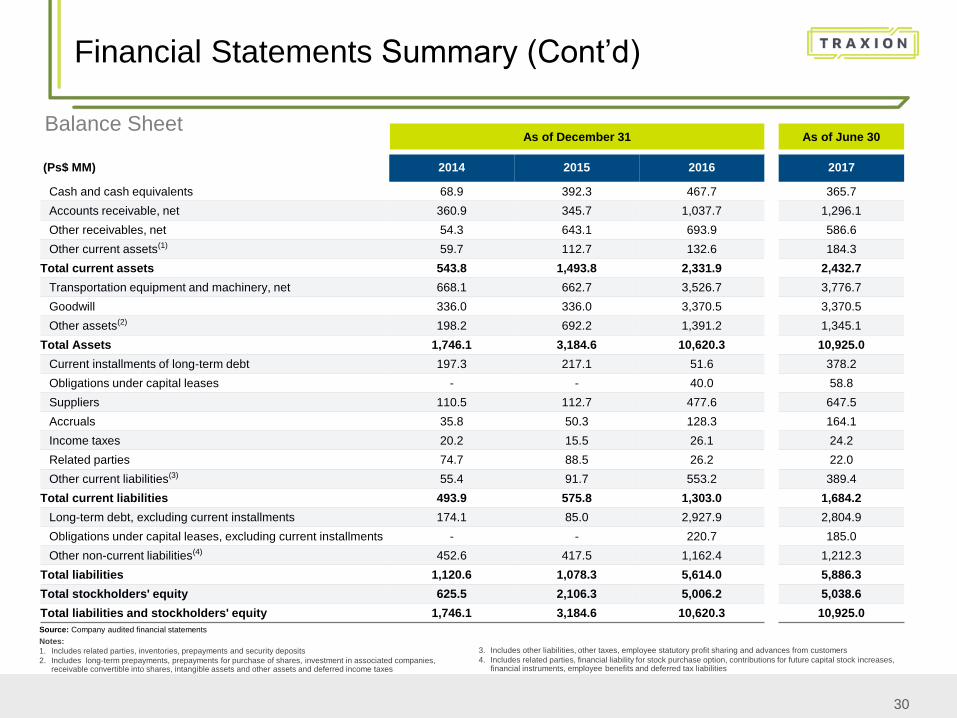
Financial Statements Summary (Cont’d)
Balance Sheet
(Ps$ MM) 2014 2015 2016
Cash and cash equivalents 68.9 392.3 467.7
Accounts receivable, net 360.9 345.7 1,037.7
Other receivables, net 54.3 643.1 693.9
Other current assets(1) 59.7 112.7 132.6
Total current assets 543.8 1,493.8 2,331.9
Transportation equipment and machinery, net 668.1 662.7 3,526.7
Goodwill 336.0 336.0 3,370.5
Other assets(2) 198.2 692.2 1,391.2
Total Assets 1,746.1 3,184.6 10,620.3
Current installments of long-term debt 197.3 217.1 51.6
Obligations under capital leases - - 40.0
Suppliers 110.5 112.7 477.6
Accruals 35.8 50.3 128.3
Income taxes 20.2 15.5 26.1
Related parties 74.7 88.5 26.2
Other current liabilities(3) 55.4 91.7 553.2
Total current liabilities 493.9 575.8 1,303.0
Long-term debt, excluding current installments 174.1 85.0 2,927.9
Obligations under capital leases, excluding current installments - - 220.7
Other non-current liabilities(4) 452.6 417.5 1,162.4
Total liabilities 1,120.6 1,078.3 5,614.0
Total stockholders' equity 625.5 2,106.3 5,006.2
Total liabilities and stockholders' equity 1,746.1 3,184.6 10,620.3
As of December 31
Source: Company audited financial statements
Notes:
1. Includes related parties, inventories, prepayments and security deposits
2. Includes long-term prepayments, prepayments for purchase of shares, investment in associated companies, receivable convertible into shares, intangible assets and other assets and deferred income taxes
3. Includes other liabilities, other taxes, employee statutory profit sharing and advances from customers
4. Includes related parties, financial liability for stock purchase option, contributions for future capital stock increases, financial instruments, employee benefits and deferred tax liabilities
2017
365.7
1,296.1
586.6
184.3
2,432.7
3,776.7
3,370.5
1,345.1
10,925.0
378.2
58.8
647.5
164.1
24.2
22.0
389.4
1,684.2
2,804.9
185.0
1,212.3
5,886.3
5,038.6
10,925.0
As of June 30

31
Content
(Top Alignment)
2.30
Subtitles
(bottom alignment) 2.62
Page Titles
3.09
Page Content
Left Alignment
4.60
Page Content
Right Alignment
4.60
Content
(Bottom Alignment)
3.00
Footnotes
(Top Alignment)
3.15
#0
#74
#130
#207
#223
#0
#119
#147
#60
#194
#199
#205
#75
#172
#198
#247
#150
#70
#101
#100
#106
Financial Statements Summary (Cont’d)
Reconciliation from Net Income to Adjusted EBITDA
Source: Company audited financial statements
As of December 31 As of June 30
Notes:
1. Pro-Forma figures include Grupo SID and LIPU for the full relevant period and include AFN figures from audited financials
2. Includes certain receivables from former related parties written-off, legal and tax advisory professional fees
3. Inventory adjustment due to change in accounting policies
4. Includes professional services fees and commissions
(Ps$ MM) 2014 2015 2016 2016 Pro-Forma(1)
Consolidated net income (loss) 38.3 73.5 33.5 (108.9)
Plus: Total income taxes 45.9 75.9 121.3 199.6
Plus: Comprehensive financial results,
net 65.6 51.2 195.2 481.1
Plus: Depreciation 63.6 72.0 238.5 368.3
Plus: Amortization 7.2 12.6 24.6 47.3
Plus: Restructuring expenses(2) - 0.5 102.4 123.4
Plus: Inventory valuation adjustment(3) - - 19.6 19.6
Plus: Refinancing expenses(4) - - 32.5 60.7
Adjusted EBITDA 220.5 285.8 767.8 1,191.3
2016 Pro-Forma(1) 2017
(231.0) 52.8
161.2 103.7
355.1 233.4
161.8 216.4
22.6 23.5
- -
- -
- -
469.7 629.9