investor presentation/media/files/b/bpost... · may - june 2016 . investor presentation . first...
TRANSCRIPT

May - June 2016
Investor presentation
First quarter 2016

2
Investor presentation first quarter 2016
Disclaimer
This presentation is based on information published by bpost in its First Quarter 2016 Interim Financial Report, made available on May, 2nd 2016 at 5.45pm CET on corporate.bpost.be/investors. This information forms regulated information as defined in the Royal Decree of 14 November 2007. The information in this document may include forward-looking statements1, which are based on current expectations and projections of management about future events. By their nature, forward-looking statements are not guarantees of future performance and involve known and unknown risks, uncertainties, assumptions and other factors because they relate to events and depend on circumstances that will occur in the future whether or not outside the control of the Company. Such factors may cause actual results, performance or developments to differ materially from those expressed or implied by such forward-looking statements. Accordingly, no assurance is given that such forward-looking statements will prove to have been correct. They speak only as at the date of the Presentation and the Company undertakes no obligation to update these forward-looking statements contained herein to reflect actual results, changes in assumptions or changes in factors affecting these statements. This material is not intended as and does not constitute an offer to sell any securities or a solicitation of any offer to purchase any securities.
More on corporate.bpost.be/investors
11.05.2016 Ordinary General Meeting of Shareholders
19.05.2016 Payment date of the dividend
08.08.2016 (17:45 CET) Quarterly results 2Q16
09.11.2016 (17:45 CET) Quarterly results 3Q16
Financial Calendar
1 as defined among others under the U.S. Private Securities Litigation Reform Act of 1995
bpost at a glance Highlights 1Q16 – 4 Outlook 2016 – 5 Overview – 6 Products – 7 Strategy – 8 Domestic Mail – 9 Parcels – 10 Domestic Parcels acquisition – 11 International parcels acquisitions – 12 Additional sources of revenues – 13 Transformation – 14 Productivity – 15 Vision 2020 – 16 Alpha – 17 CSR – 18 Dividend policy – 19 Summary of key financials FY15 – 20 Balance sheet – 21 Relationship with State – 22 Management – 23
More detail on 1Q16 EBITDA bridge – 25 Key financials – 26 Revenues – 27 Domestic Mail – 28 Parcels – 29 Additional sources of revenues – 30 Costs – 31 Cash flow – 32
Contents
Additional Info European mail market – 34 Key contacts – 35

bpost at a glance

4
Highlights of 1Q16
bpost at a glance
Improved underlying Domestic Mail evolution • Driven by advertising mail
Cost savings on track and delivered on all cost items • Underlying average FTE reduction of 7341 for the quarter
Outstanding domestic parcels performance, slow-down of international due to strong USD • Domestic: double-digit volume growth driven by e-commerce and C2C;
price/mix effect of -4.6% fully mix related • International: US flows hampered by strong USD, continued growth to &
from China
-4.0%
+14.6%
+ € 0.5m
- € 15.2m
Revenues down 2.0% • Resilient Domestic Mail performance and Parcels growth offset by
anticipated lower SGEI compensation
€ 604.5m
1 i.e. excluding 379 additional FTEs and interims for higher parcels & solutions volumes, Deltamedia integration, new subsidiaries and absorption of holidays leading to a reported average reduction of FTEs and interims of 355
EBITDA up € 3.2m, reduced SGEI compensation fully absorbed
BGAAP net profit of bpost SA/NV up € 2.6m
Outlook maintained
€ 175.9m
€ 90.0m

5
Outlook for 20161
bpost at a glance
Top line
• Underlying Domestic Mail volume decline between 5 and 6%2
• Compensation for SGEI: € 26.8m lower than in 2015 excluding inflation and volume impact
• Domestic Parcels: double digit volume growth
• International Parcels: continued growth in flows from the US but at a slower pace mainly due to strong US dollar
Costs
• Productivity improvements: low end of 800 to 1,200 FTE/year range excluding impact of Deltamedia integration.
• Strong focus on all cost items and factor cost levers (e.g. abolishment of Saturday compensation, tax shift).
Recurring EBITDA and dividend payment at the same level as 2015
FCF
• Gross capex: c. € 80.0m
• Cash generation from operating activities will be negatively impacted by lower compensation and changed payment terms for SGEI (€ -36.8m), the Alpha pay-outs and a settlement on terminal dues with another postal operator.
1 Outlook 2016 excludes the impact of the acquisition of the Belgian activities of Lagardère Travel Retail 2 2Q16 will count 2 working days more, 3Q16 will count 1 day less (except for stamps which will count the same number of days) and 4Q16 will count 1 day less vs.
same quarter of 2015.

6
Belgium’s leading postal operator
bpost at a glance
2015 figures (normalized)
Leading market position in the resilient Belgian mail market with a balanced regulatory framework Focused mail and parcels business with a proven strategy for profitable growth Scope for continued cost improvements Strong financial performance supporting a high level of cash flow generation and dividends Proven performance track record
Built on strong foundations and with ambitious targets
€ 2.4bn revenues
€ 583.6m 24.2% EBITDA
€ 494.4m 20.5% EBIT
€ 328.1m net profit
9.1m letters handled every day
126,000 parcels handled every day
664 678 post franchised offices post points
5 sorting centres
24,703 average # FTE & interims

7
A modern and diversified mail operator
bpost at a glance
Domestic Mail € 1,464m 61%
Transactional mail
1 Including a.o. SGEI compensation for the retail network, philately, retailer products, “unallocated” operating income
€ 918m 38%
Parcels € 341m 14%
Additional sources of revenues € 589m 25%
€ 2,408m normalized revenues 2015
Advertising mail € 251m 11%
Press € 296m 12%
Domestic € 161m 7%
International € 170m 7%
Special Logistics € 10m 0%
International mail € 176m 7%
Value added services € 96m 4%
Banking and finance € 205m 9%
Other1 € 112m 5%
One integrated domestic distribution network for mail and parcels
International player hubs in London LHR and Brussels
strategically located facilities in US, Canada, China, HK, Singapore, the Netherlands and Australia
Revenues % of total

8
Focused strategy to create value and reward shareholders
bpost at a glance
Continue to focus on core
mail business
Generate continued
productivity gains
Value creation &
rewarding of shareholders
+
Keep stakeholders on board
+
Innovate/ grow
within core competencies

9
Continue to focus on core mail business
bpost at a glance
While being impacted by e-substitution mail remains important…
79% satisfaction level for the paper channel (vs. 54% on average for digital channels)1
Volume 2 specific programs to support mail resilience
Pricing
Price-cap formula for single piece mail & USO2 parcels falling within “small user basket” (inflation + quality bonus + unused credit3)
Volume and operational discounts allowed for other USO products (bulk)
Price increases done in practice on a yearly basis (1 January): +1.5% on average in 2016
Offers solutions to address customers’ preference for paper
Proves effectiveness & relevance in marketing mix of Direct Mail
1 Source: bpost commissioned market research, 2016 (1.015 face to face interviews) 2 Universal Service Obligation 3 Quality bonus = [Average quality – 90%]^2 / 1,000; unused credit = cumulated price increases allowed under cap but not applied for last 3 years. Price
increases need to be approved by the regulator
Telco Cie
Telco Cie à votre service:(voir au dos de votre facture)
Telco CieTelco Cie
Telco Cie à votre service:(voir au dos de votre facture)
Transactional Mail
Advertising

10
Innovate/grow within core competencies (1/4) bpost has an established position in parcels…
bpost at a glance
B2B1: ~€ 750-800m
Double market share by 2017
Unique selling proposition
Offer best last mile and broadest delivery options:
• Home delivery 7 d/week & evening delivery
• 1,250 pick-up and drop-off points
• ~146 parcel lockers
• Click & Collect
B2C/C2X1: ~€ 170-230m
Keep market share and capture e-commerce growth
Rationale
How we do it
Solutions for international e-tailers to ship parcels cross border. Main market is US with several lanes (to Canada, Europe, Australia & Asia).
• Direct access to international commercial and postal networks • Asset-light business model • Dedicated international sorting centre & integrated service range (incl.
customs clearance, fulfillment, payment options, track & trace, etc.) • Strategic presence in North America, Europe & Asia
Domestic parcels
International parcels
1 Source market shares: bpost data, Datamonitor, “European Express Benchmarking 2011”
Others
~50% ~5%
Others

11 bpost at a glance
Retail (220 shops)
Con
ven
ien
ce &
P
roxi
mit
y R
etai
l
• Pre-paid services (Alvadis) • Impulse products (Buronville)
Convenience distribution
Pre
ss
Log
isti
cs
Newspaper Magazines International press
Press distribution to 5,345 POS
Non
-P
ress
Lo
gis
tics
Parcels & Logistic Services (735 pick-up drop-off points)
Lagardère Travel retail in Belgium
Sales 2014: € 440.0m • Retail: 41% (€ 180.0m) • Convenience distribution: 18% (€ 80.0m) • Press distribution: 41% (€ 180.0m)
EBITDA 2014: € 15.6m (3.5% margin)
Rationale for bpost
Diversify into the growing proximity & convenience distribution • Grow at least in line with convenience & proximity
retail market (4-6% annually 2015-20) • Footprint expansion (30 to 45 new stores in the
next 3 to 5 years) and remodeling • Accelerate product diversification in order to
enhance profitability
Further enable domestic parcels growth strategy • Improve delivery options and increase coverage
(network of > 1,900 points across Belgium)
• Fully cash financed (consideration not disclosed) • Fully accretive as of 2017 • Preliminary synergy estimate of €4-5m annually
after full integration • Closing and full consolidation after anti-competition
clearance • Total capex planned < € 10m/year
Transaction details
Innovate/grow within core competencies (2/4) Acquisition agreement for the Belgian activities of Lagardère Travel Retail

12 bpost at a glance
Success Partners Europe (Poland)
Rationale for bpost
Support our international e-commerce cross-border parcels strategy • Offer complete service range to international e-commerce customers (including fulfillment)
• Further build out the US market through a complete service offering
Economize on last mile distribution • In-house last mile distribution vs. use of incumbent postal operators or alternative distributors
Freight Distribution Management (Australia)
Innovate/grow within core competencies (3/4) Bolt-on acquisitions in international parcels
• Logistics, distribution and fulfillment across Europe for US e-tailers
• 100% acquisition in Nov. 2015, full consolidation as of Dec. 2015
• Earn-out on 2015 EBITDA (€ 0.2m financial liability)
Initial consideration Sales 2014
Key figures
€ 3.5m
$ 3.4m
• Third Party Logistics (3PL), warehousing, transport & distribution for US e-tailers
• 100% acquisition in March 2016, full consolidation as of April 2016
Initial consideration Sales 2015
EBITDA 2015
Key figures
€ 14.4m
c. € 24.0m
c. € 2.4m

13
Innovate/grow within core competencies (4/4) bpost has other sources of revenues besides mail and parcels
bpost at a glance
Mail originating from foreign countries and delivered to other countries
International mail What?
Asset-light business model and fully variable costs Dedicated sorting centre and hub in Brussels Active in the US, Europe and Asia
Business model
Customer specific solutions which leverage our key assets: last mile, retail network and financial backbone
Value added services Collect and handling services for mail Services at the front door (gaz, water, electricity) Solutions tailored to specific needs
Associate 50/50 with BNP Paribas Fortis (bpost is sole retail agent) Agent of bpost bank ~50% of revenue (commissions)
Payment services, cash at the counter, public finance solutions Direct offering ~50% of revenue
Banking & finance

14
Continuous improvement is in our DNA. We have a 10-year proven transformation track record…
bpost at a glance
2004 • Building of new
sorting centres • Transformation of
the network
2003 Start of continuous optimization of delivery rounds
2009 Implemen-tation of new distribution structure with reduced number of buildings
2011-2017 New strategic ‘Vision 2020’ program in mail service operations to further increase efficiency
2003 New management
& start of the transformation
period
2006 CVC and Danish Post enter into the capital
for 50%-1 share (split 50/50), government holds 50%+1 share
2008 Danish Post
sells its stake to CVC
2013 IPO in June at €14.5/share CVC sells 30% in IPO and
remaining 20% in December
Tran
sfor
mat
ion
jou
rney
K
ey e
ven
ts
Normalized1 EBIT
1 Normalized figures are neither audited nor have been subject to a limited review
2007 Automated round sorting and mail sequencing

15
… and we have plans for further productivity gains
bpost at a glance
Historic FTE evolution Average FTEs, ‘000
-4.0% p.a.
bpost has a systematic, well-rounded approach to identify and capture cost improvements across the entire organization
2003 2004 2005 2006 2007 2008 2009 2010 2011 2012 2013
24
39
bpost has plans for further productivity gains supported by natural attrition and Vision 2020
2014 to 15: -711
38% of bpost’s employees are above 50
years old
Age pyramid Headcount per age, 31.12.2015
40-49
7,920
0-39
8,024 9,604
50+
Statutories
Non pay-scale contractuals Pay-scale contractuals
2014 2015

16
Vision 2020 will drive substantial productivity improvements by 2017 in the field
bpost at a glance
Improved operational platform
4 industrial mail sorting facilities
Automated sorting of all formats on MSMs (13 installed end 2015)
Central mailbag preparation
Further FTE reduction by eliminating manual mailbag preparation and transport time to/from start of postmen’s round
1 new sorting facility for mail and parcels (Brussels) with increased capacity merging the two existing facilities (Antwerp and Charleroi)
Further reduction of mail centres from current c. 250 to 60
Enabling
Declining mail
volumes
Increasing parcels volumes
Increasingly complex
product mix
1

17
Alpha targets a decrease in support functions at the headquarters
bpost at a glance
End of August 2014, bpost embarked upon the “Alpha program”, a headcount reduction program targeting the support functions at the corporate headquarters.
2
2610 FTE
Scope of Alpha
analysis
-24%
Productivity improvements
identified
177
625
282
118
Still to do Realized 1Q16
Realized FY15
Realized 4Q14
48
Identified reduction
• At 31 March 2016, 448 FTE were saved in the Alpha scope since the start of the analysis. • Savings
• Estimated average unit cost/FTE: € 68k • FY impact as of 2018: € 42.5m annual savings
• Full restructuring provision booked in 3Q15: € 54.5m; total Alpha pay-outs since start of the program: € 26.3m

18
75
88
85
912
We want to keep stakeholders on board…
bpost at a glance
Distribution quality Percentage letters1 in D+1
+6
2003 2015
Customer satisfaction3
Percent
+13
2003 2015
Environment
1st on the IPC
Environmental Ranking in 2015,
2014 & 2013 Carbon disclosure project: 99B
Committed employer
Commitment & well-being
2015 2014
-12%
Recognize experience
# work accidents
205 people graduated
1 D+1 delivery of domestic single piece items up to 2 kg, stamped at “Prior tariff” 2 Quality scores for 2015 subject to approval by the IBPT/BIPT 3 “Satisfied customers” (score of 5 or above on a scale from 1 to 7 on the question: “Overall, how satisfied are you about bpost?”) based on bpost commissioned
survey by Ipsos-Synovate
Note: more information regarding bpost’s Corporate Social Responsibility is available on the website: http://corporate.bpost.be/sustainability
CO2 reduction objective: -45% by 2020 (vs. 2007)

19
Reward shareholders
bpost at a glance
Dividend Policy
Annual dividend of minimum 85% of BGAAP net profit (unconsolidated)
Interim in December of financial year based on 10-month results
Final in May of year following financial year
Constrained by the net results of a given year + distributable reserves
Distributable reserves built gradually as from 2013, primarily to safeguard the dividend level in case of exceptional costs (€ 97m end 2015)
0.93 1.04 1.05
0.200.22
+2% +12%
2015
1.29 0.24*
2014
1.26
2013
1.13
Interim gross DPS (€) Final gross DPS (€)
* Proposed final gross dividend per share to be approved by General Meeting of May 11, 2016

20
Summary of key financials FY15
bpost at a glance
Note: an Excel download of detailed financials per quarter is available on the website: http://corporate.bpost.be/investors/results-reports-and-presentations/quarterly-results/2016
€ million
1 Normalized figures are neither audited nor have been subject to a limited review
FY14 FY15 FY14 FY15 % ΔTotal operating income (revenues) 2,464.7 2,433.7 2,464.7 2,407.6 -2.3%Operating expenses 1,892.6 1,878.5 1,892.6 1,824.0 -3.6%EBITDA 572.0 555.2 572.0 583.6 2.0%Margin (%) 23.2% 22.8% 23.2% 24.2%EBIT 480.2 466.1 480.2 494.4 3.0%Margin (%) 19.5% 19.2% 19.5% 20.5%Profit before tax 454.1 470.6 454.1 499.0 9.9%Income tax expense 158.6 161.4 158.6 170.9 Net profit 295.5 309.3 295.5 328.1 11.0%FCF 373.3 315.9 373.5 315.9 -15.4%bpost S.A./N.V. net profit (BGAAP) 296.9 287.7 296.9 303.6 2.3%Net Debt/ (Net cash), at 31 Dec. (486.2) (549.5) (486.2) (549.5) 13.0%
Reported Normalized1
Alpha social plan provision of
€ 54.5m
Gain from sale of sizeable building
€ 26.1m

21
Supported by a strong balance sheet
bpost at a glance
Assets
1 bpost has no pension deficit: as is customary in Belgium all pensions are paid as part of national social security
Equity and liabilities
PPE & intangible assets
Inventories
Trade & other receivables
Investments in associates
Other assets
Cash & cash equivalents
Mar 31, 2016
2,285.0
643.7
10.6
328.3
390.0
54.2
858.3
Dec 31, 2015
2,112.0
638.1
11.1
413.5
375.0
58.5
615.7
Total equity
Employee benefits
Trade & other payables
Provisions
Interest-bearing loans & borrowings
Mar 31, 2016
2,285.0
806.9
343.7
1,005.2
63.5 65.8
Dec 31, 2015
2,112.0
694.8
346.2
940.9
64.2 65.8
€ million
297.1 49.1
148.1
108.9
77.7
11.6
Long term benefits • Pension savings days • Quota days • Part-time work
Other long term benefits (disability annuities)
Deferred tax asset
• Mostly unfunded (no investment risk)
• Volatility mainly through the discount rate
• No pension liabilities1
Employee benefit liabilities
Termination (early retirement)
Post retirement
(family allowance, transport, bank, …)
22
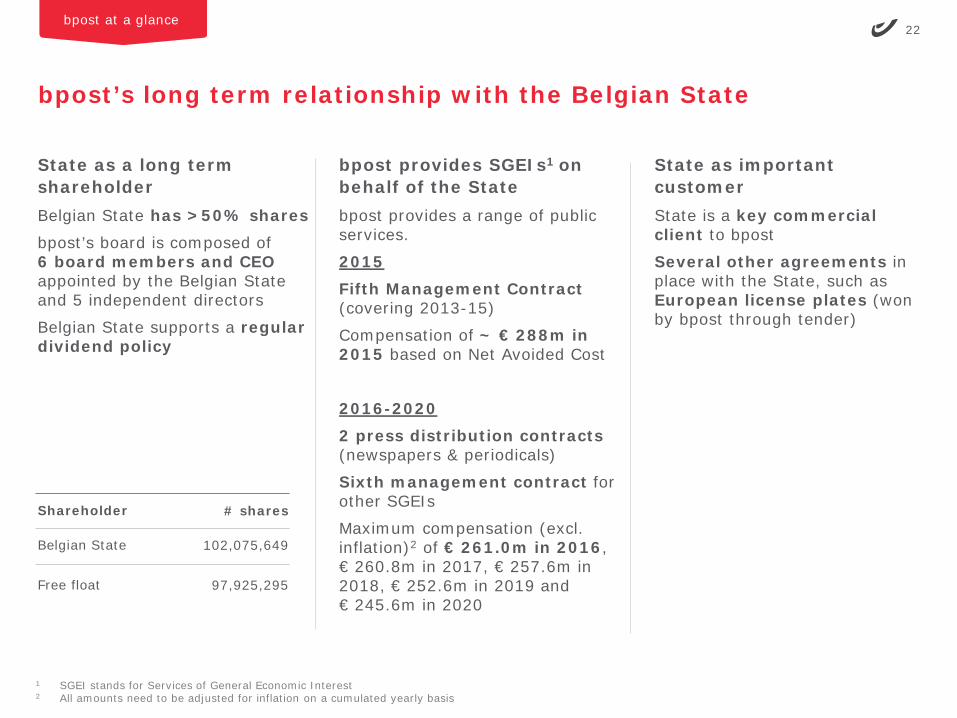
bpost’s long term relationship with the Belgian State
bpost at a glance
State as a long term shareholder Belgian State has >50% shares bpost’s board is composed of 6 board members and CEO appointed by the Belgian State and 5 independent directors
Belgian State supports a regular dividend policy
bpost provides SGEIs1 on behalf of the State bpost provides a range of public services. 2015 Fifth Management Contract (covering 2013-15)
Compensation of ~ € 288m in 2015 based on Net Avoided Cost
2016-2020 2 press distribution contracts (newspapers & periodicals)
Sixth management contract for other SGEIs
Maximum compensation (excl. inflation)2 of € 261.0m in 2016, € 260.8m in 2017, € 257.6m in 2018, € 252.6m in 2019 and € 245.6m in 2020
State as important customer State is a key commercial client to bpost
Several other agreements in place with the State, such as European license plates (won by bpost through tender)
1 SGEI stands for Services of General Economic Interest 2 All amounts need to be adjusted for inflation on a cumulated yearly basis
Shareholder
Belgian State Free float
# shares
102,075,649
97,925,295

23
bpost’s management team and organization
bpost at a glance
Kurt Pierloot Director International & Parcels
Mark Michiels CHRO
Koen Van Gerven CEO
Marc Huybrechts
Director Mail & Retail Solutions
Philippe Dubois Director Mail Services Operations
Koen Beeckmans CFO

Current Trading 1Q16

25
+15.2
+5.9+3.6
EBITDA 1Q16
+175.9
Costs Corporate Additional sources of revenues
-6.3
Parcels Domestic Mail
-8.1
SGEI Compensation
-7.2
EBITDA 1Q15
+172.7
Resilient domestic mail trend and parcels growth combined with further cost reductions led to EBITDA uplift of €+3.2m, thereby fully absorbing the lower SGEI compensation on our bottom-line.
1Q16
Total operating income (revenues)
1 Normalized figures are not audited
€ +10.4m / +6.0%
Normalized1, € million
Sales of building (€ +5.0m) Lower contractual cap

26
Summary of key financials 1Q16
1Q16
€ million
1Q15 1Q16 % ΔTotal operating income (revenues) 616.6 604.5 -2.0%Operating expenses 443.9 428.7 -3.4%EBITDA 172.7 175.9 1.8%Margin (%) 28.0% 29.1%EBIT 151.6 153.9 1.5%Margin (%) 24.6% 25.5%Profit before tax 149.0 149.3 0.2%Income tax expense 52.4 53.4 Net profit 96.6 95.9 -0.7%FCF 298.1 245.9 -17.5%bpost S.A./N.V. net profit (BGAAP) 87.3 90.0 3.0%Net Debt/ (Net cash), at 31 March (785.1) (792.2) 0.9%
Reported

27
Total operating income (revenues)
1Q16
€ million
1 Defined as domestic and Belgian in- and outbound
1Q15 SGEI Organic 1Q16 % Org
Transactional mail 232.6 - -8.8 223.7 -3.8%Advertising mail 64.7 - 0.4 65.1 0.6%Press 74.0 -1.4 0.3 72.9 0.4%
Domestic parcels1 39.5 - 3.6 43.1 9.1%International parcels 41.2 - 0.5 41.7 1.2%Special logistics 2.6 - -0.5 2.1 -19.0%
International mail 45.3 - -5.9 39.3 -13.1%Value added services 24.3 - 1.5 25.8 6.2%Banking and financial 51.7 -3.0 -0.2 48.5 -0.4%Other 29.4 -2.8 -1.7 24.9 -5.7%
Corporate 11.4 - 5.9 17.4 51.9%
616.6 -7.2 -4.9 604.5 -0.8%
Domestic mail
Parcels
Additional sources of revenues
TOTAL

28
Improved domestic mail underlying volume trend of -4.0% driven by advertising mail
1Q16
Total operating income (revenues), € million
1 1Q16 had the same number of business working days as 1Q15 except for stamps which had 1 working day less in 1Q16 vs. 1Q15 2 FY15 corrected for requalification of advertising mail to administrative mail.
• Transactional Mail: continued e-substitution without notable acceleration, shift towards cheaper products (less registered letters).
• Advertising Mail: good direct mail performance in focus sectors, and strong quarter in unaddressed.
• Press: slightly better volume trend versus FY15, mainly driven by periodicals.
FY15 1Q16 FY15 1Q16Transactional mail -5.1% -5.6% -5.3% -5.3%Advertising mail -6.9% 0.1% -4.9% 0.1%Press -2.8% -2.6% -2.8% -2.6%Domestic Mail -5.3% -4.2% -5.0% -4.0%
Reported Underlying 1,2
5.5Price/Mix
Volume
1Q16
-8.1
361.7
-0.6 Working Day impact stamps
-13.1
1Q15 before organic evolution 369.9
SGEI -1.4
1Q15 371.3

29
Excellent growth in domestic parcels but slow-down of international
1Q16
Total operating income (revenues), € million
86.8
+3.6
1Q16
Special Logistics -0.5
International Parcels 0.5
3.6
1Q15 83.2
• Highest volume growth ever of 14.6% driven by excellent e-commerce and continued growth in C2C (online offering).
• Negative price/mix of -4.6% fully mix related (product & client mix).
• From US (€ -1.5m) hampered by strong USD decreasing price competiveness & attractiveness of US goods.
• From China (€ +0.2m) combined with good milk powder volumes to China (€ +1.2m).
1 Defined as domestic and Belgian in- and outbound
Domestic Parcels1
• Mainly due to lower revenues from Sprint activities

30
Additional sources of revenues mainly affected by international mail in part compensated by continued growth in solutions
1Q16
Total operating income (revenues), € million
138.6
-1.7
Banking & Financial -0.2
VAS 1.5
International Mail -5.9
1Q15 before organic evolution 144.9
SGEI -5.8
1Q15 150.6
1Q16
-6.3
Others
• Impact of consequent execution of price strategy (no price discounts granted) to safeguard reasonable profit margins
• Positive contribution of solutions mainly driven by telco contract for decoder swap (€ +0.8m) and City Depot (€ +0.2m).
• Mainly decreasing volumes in philately (€ -0.6m) and lower sales of retailer products (€ -0.9m; mainly utility company front office)
• Mainly impacted by lower volumes of financial transactions managed on behalf of the Belgian State.

31
All cost items contributed to € 15.2m of cost savings
1Q16
428.7
-15.2
1Q16
Other costs -3.2
Other SG&A -3.1
Payroll & Interim -6.7
Transport -2.2
1Q15 443.9
Operating expenses excl. depreciation and amortization, € million
• Average reported FTE reduction of 355 FTE leading to € -5.2m cost savings, underlying FTE reduction is 734 for the quarter.
• Favourable FTE mix of € -4.9m thanks to the recruitment of auxiliary postmen (€ -2.2m) and the reduction of management level FTE (€ -2.6m)
• Negative price effect of € +3.1m explained by phasing elements (a.o. holiday pay related Alpha departures) and merit increase
• Decrease in transport costs linked to the evolution of international activities.
• Higher increase of recoverable VAT for costs and capex incurred in previous years (€ -3.0m).
• Mainly lower 3rd party costs (€ -1.3m), maintenance costs (€ -1.2m) and energy costs (€ -1.3m), partly offset by higher other operating costs
• Higher increase of recoverable VAT (from 14% in 2015 to ~19% in 2016) for 1Q16 expenses (€ -0.8m)

32
Decrease in operating FCF mainly driven by SGEI, Alpha pay-outs and acquisitions.
1Q16
• Proceeds sale of buildings: € +7.3m • Capex: € -1.0m • Final payment for acquisition SPE in Poland: € -0.2m • Acquisition FDM in Australia: € -12.1m • Purchase 24.5% additional shares in LGI: € -20.7m
• Lower compensation and changed payment terms for SGEI: € -36.8m • Lower income tax paid in 1Q16 vs. 1Q15 relating to previous years: € +21.3m • Alpha pay-outs: € -12.0m • Excluding the above:
• Results of operating activities: € +5.7m • Working capital evolution: € -3.8m, mainly due to Social Security payment terms
1 Operating free cash flow = cash flow from operating activities + cash flow from investing activities
€ million 1Q15 1Q16 Delta
Cash flow from operating activities +306.6 +281.1 -25.5Cash flow from investing activities -8.5 -35.1 -26.6Operating free cash flow1 +298.1 +245.9 -52.1Financing activities -0.2 -2.1 -1.9Net cash movement +297.9 +243.9 -54.0
Capex -11.4 -12.4 -1.0
• Payment of a dividend to minority interests: € -2.0m

Additional info

34
A relatively resilient mail market vs. other European operators
European mail market
2008-15 CAGR for addressed mail volumes as reported by major incumbent European postal operators, percent
46
82
142
146
182
193
215
216
223
259
DK
IT
NL
SW
BE
FR
UK
AU
DE
CH
Addressed mail volume per capita 2015 operator level*
1
11
3
8
6
7
10
5
2
4
SOURCE: Company information; Annual reports; Investor presentations; IPC; Eurostat
Note: definition of addressed mail may differ by operator 1 Includes addressed mail 2 Includes addressed mail 3 Includes addressed mail 4 Includes addressed mail 5 Includes mail communication and dialogue marketing 6 Includes addressed mail
7 Includes addressed mail (publishers services excl.) 8 Includes addressed mail excluding press 9 Includes all domestic mail 10 Includes inland addressed mail 11 Includes letter mail and addressed direct mail / media post * Excludes domestic competitors
-2.0
-3.0
-3.0
-3.9
-4.7
-5.0
-9.1
-9.2
-3.4
IT
DK
NL
FR
UK
SW
BE
CH
AU
DE
-11.5
3
9
4
5
6
7
11
10
1
2
(*)
(*)
(*) 2014 data
(*)
(*)
(*) 2008-2014

35
Key contacts
Baudouin de Hepcée
Director External Communication, Investor Relations & Public Affairs
• Email: [email protected] • Direct: +32 (0) 2 276 22 28 • Mobile: +32 (0) 476 49 69 58 • Address: bpost, Centre Monnaie, 1000 Brussels, Belgium
Saskia Dheedene
Manager Investor Relations
• Email: [email protected] • Direct: +32 (0) 2 276 76 43 • Mobile: +32 (0) 477 92 23 43 • Address: bpost, Centre Monnaie, 1000 Brussels, Belgium
