investor presentation · market structure and trends – zooplus operates in a large niche market...
TRANSCRIPT

Investor Presentation Deutsches Eigenkapitalforum, Frankfurt
Dr. Cornelius Patt, CEO
Andreas Grandinger, CFO
November 11-13th, 2013

Deutsches Eigenkapitalforum | page 2
This document includes supplemental financial measures that are or may be non-GAAP financial measures. These supplemental
financial measures should not be viewed in isolation as alternatives to measures of zooplus’ financial condition, results of
operations or cash flows as presented in accordance with IFRS in its Consolidated Financial Statements. Other companies that
report or describe similarly titled financial measures may calculate them differently.
This document contains statements related to our future business and financial performance and future events or developments
involving zooplus that may constitute forward-looking statements. We may also make forward-looking statements in other reports,
in presentations, in material delivered to stockholders and in press releases. In addition, our representatives may from time to time
make oral forward-looking statements. Such statements are based on the current expectations and certain assumptions of zooplus’
management, and are, therefore, subject to certain risks and uncertainties. A variety of factors, many of which are beyond zooplus’
control, affect zooplus’ operations, performance, business strategy and results and could cause the actual results, performance or
achievements of zooplus to be materially different from any future results, performance or achievements that may be expressed or
implied by such forward-looking statements or anticipated on the basis of historical trends. Further information about risks and
uncertainties affecting zooplus is included throughout our most recent annual and interim reports, which are available on the
zooplus website, www.zooplus.de. Should one or more of these risks or uncertainties materialize, or should underlying assumptions
prove incorrect, actual results, performance or achievements of zooplus may vary materially from those described in the relevant
forward-looking statement as being expected, anticipated, intended, planned, believed, sought, estimated or projected. zooplus
neither intends, nor assumes any obligation, to update or revise these forward-looking statements in light of developments which
differ from those anticipated.
Due to rounding, numbers presented throughout this and other documents may not add up precisely to the totals provided and
percentages may not precisely reflect the absolute figures.
Safe Harbor Statement

Deutsches Eigenkapitalforum | page 3
zooplus is the leading European e-commerce company for
pet food and pet supplies
» 1st company to start e-commerce for pet supplies
» 1st company to go international with e-commerce for pet supplies
» Among 1st companies to close the gap in size to the leading offline competitors
1999 – 2004 0 to 20 € m Early start and break-even early on
2005 - 2009 28 to 129 € m zooplus goes international
2010 - 2013 193 to 415 € m Intensifying competition and major changes in logistics
2014 - 2019 500 to 1,000 € m Close the gap in size in setup in relevance
zooplus: prepared to stay ahead of the competition

Deutsches Eigenkapitalforum | page 4
Market structure and trends – zooplus operates in a
large niche market with further growth potential
Germany
3.9
UK
4,6
France
3.4
Italy
2,5
Benelux
1,7
Poland
0,6
Rest of
Europe
4,0
Spain 1,3
Market volume by country
€ bn
» 22 € bn total market
» Specialty retail 1/3 of total market
» Steadily growing market with 2-3 % p.a.
» Main categories cats & dogs food
Grocery
and other
63%
Specialty
retail
33%
Online 4%
Sales channels
Source: Euromonitor
2012, zooplus
estimation
» Fragmented market
» No pan-European player in stationary
business
» zooplus only pan-European e-commerce
retailer
Source: Euromonitor
2012, zooplus
estimation

Deutsches Eigenkapitalforum | page 5
The company has consistently put the user experience first
» Driven by e-commerce aptitude (markets, customers,
infrastructure)
» A niche market (only 1/3 of
households own pets)
» Product typically very bulky
(size and weight)
» Retention is the key business
driver
» Market difficult to enter
Operational
excellence
Reliable Marketing / Advertising
Functionality
Price / Performance
Relevance
Customer loyalty and high
retention
The great user experience

Deutsches Eigenkapitalforum | page 6
Local sales office
Fulfilment center
zooplus headquarter
» Similar patterns in customer behavior
» Integrated international
platform
HU
• Significant overlap in assortment, inter-
nationally sourced
• Outsourced pan-
European logistics
structure (D, NL, PL)
• Second label bitiba
in DE, FR, UK and ES
Having operated as a German outfit for the first
five years we now take a pan-European approach

Deutsches Eigenkapitalforum | page 7
Since 2009 the competitive landscape is populating –
offliners, smaller pure-plays and amazon joining the category
DE, FR, UK, IT

Deutsches Eigenkapitalforum | page 8
As a deliberate act to defend our leading position we
adjusted our pricing – impacting our gross margins
41%
42%
38%
39%
37%
36% 35%
34%
67%
64%
64%
61%
63%
65%
70%
74%
H1/2010 (a) H2/2010 (a) H1/2011 H2/2011 H1/2012 H2/2012 H1/2013 H2/2013e
18 months : H2/2010 – H1/2012
Repositioning in price, unchanged
product mix
-5%p
18 months : H1/2012 – H2/2013
Remaining change in margin driven by
change in product mix – less accessories
-1%p / -2%p Margin
dog/cat food
sales
(of total sales)
(a) (a)
(a) : one-off effects of logistics migration adjusted – impacting
other income and logistics / administration costs

Deutsches Eigenkapitalforum | page 9
H1/2010 (a) H2/2010 (a) H1/2011 H2/2011 H1/2012 H2/2012 H1/2013 H2/2013 (e)
At the same time we achieved substantial efficiency gains
– giving us a critical edge over the competition
2013 (e):
€ 415 m
2010 (a):
€ 187 m
81.6
105.8
118.7
138.4
152.3
183.2
198.8
216.0
92.0 86.6 82.7 74.3 70.2
63.0 60.0 50.2
Other countries D.A.CH
Total cost
(without COGS)
on total sales
Total sales
44,1%
32,1%
(a) (a)
(a) : one-off effects of logistics migration adjusted – impacting
other income and logistics / administration costs
Result: a continuous ramp-up of sales, driven by domestic and international markets
Deutsches Eigenkapitalforum | page 10
IT/Admin (incl.
depreciation &
interest)
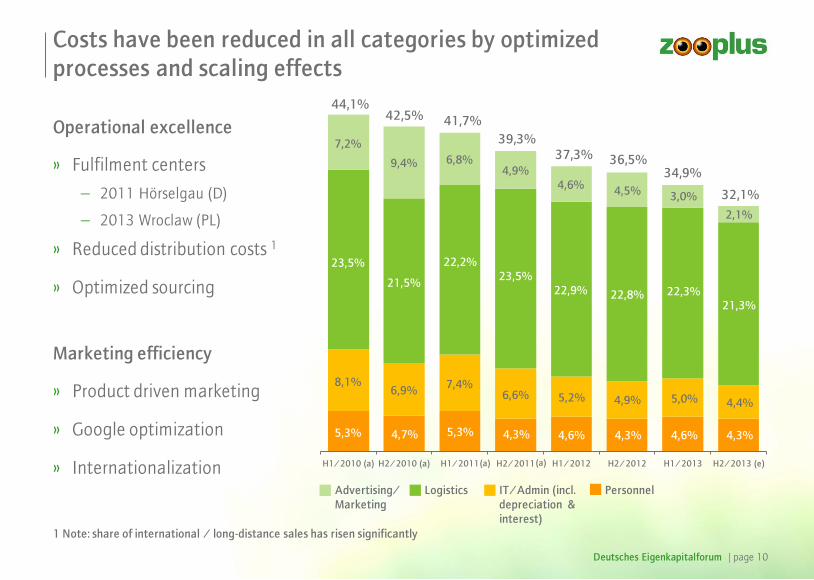
Costs have been reduced in all categories by optimized
processes and scaling effects
Operational excellence
» Product driven marketing
» Google optimization
» Internationalization
» Fulfilment centers
2011 Hörselgau (D)
2013 Wroclaw (PL)
» Reduced distribution costs 1
» Optimized sourcing
Marketing efficiency
H1/2010 (a) H2/2010 (a) H1/2011 H2/2011 H1/2012 H2/2012 H1/2013 H2/2013 (e)
5,3% 4,7% 5,3% 4,3% 4,6% 4,3% 4,6% 4,3%
8,1% 6,9%
7,4% 6,6% 5,2% 4,9% 5,0% 4,4%
23,5%
21,5%
22,2%
23,5%
22,9% 22,8% 22,3% 21,3%
7,2%
9,4% 6,8% 4,9%
4,6% 4,5% 3,0%
2,1%
Advertising/
Marketing
Logistics Personnel
44,1% 42,5% 41,7%
39,3% 37,3% 36,5%
34,9%
32,1%
1 Note: share of international / long-distance sales has risen significantly
(a) (a)

Deutsches Eigenkapitalforum | page 11
Customer loyalty – the winning factor of the business
model – has improved significantly
2009 2010 2011 2012 2013 (e)
143 114
105 99 98
94
64 53 51
114
72 64
145
102
154
92% 80% 94% 99%
84%
63% 90%
70%
<=2009
2010 a
<=2009 <=2009
2010 a+1
2011 a
2012 a
2011 a+1
2010 a+2
<=2009
2013 a
2012 a+1
2011 a+2
2010 a+3
<=2009
Total sales per
annual customer
group (€ m)
143
208
283
369
469
68%
Kohort Analysis – Sales incl. VAT

Deutsches Eigenkapitalforum | page 12
Drivers for the profitability: (a) share of repeat business
and (b) development stage of the supply chain
direct / optimized
supply chain
indirect / intermediate stage
supply chain
new customers
(sales in the year
of acquisition)
repeat customers (consecutive years’ sales)
–
– –
+ +
+

Deutsches Eigenkapitalforum | page 13
While the repeat business has gained a larger share we are
still mid-way in setting up a pan-European supply chain
2010
new customers
2013
repeat customers new customers repeat customers
direct
supply
chain(1)
indirect
supply
chain
(1) D, A, CH, NL, BE
» Sales to repeat customers (sales in the years after the year of acquisition) have risen from 55% to 68%
» The share of sales using indirect supply chains is now 45%, up from 32%
» As zooplus grows towards the € 1 bn most key markets will be served using
direct supply chains / optimized supply chains
indirect
supply
chain
15% 69
40% 168
17%
83
28% 131
43% 88
12% 25
25% 53
20%
42
Sales (€ m) incl. VAT
direct
supply
chain(1)
Deutsches Eigenkapitalforum | page 14
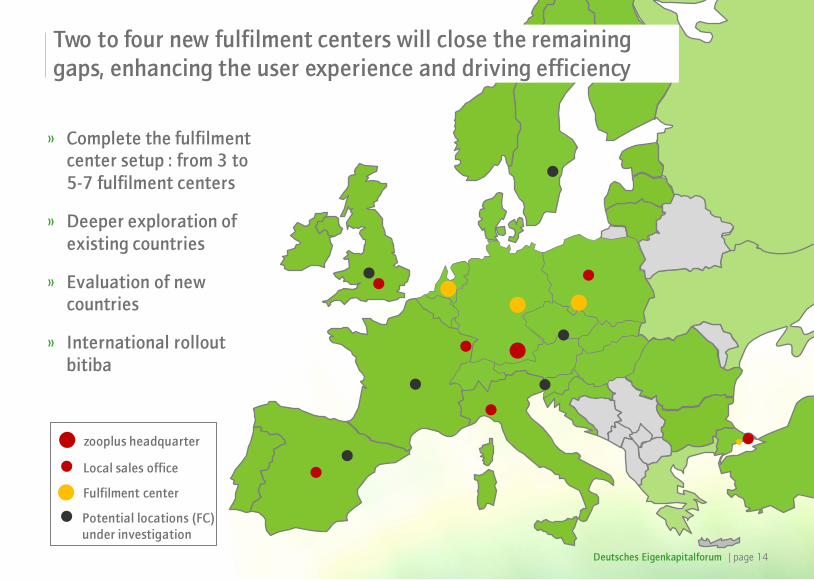
Local sales office
Fulfilment center
zooplus headquarter
» Complete the fulfilment center setup : from 3 to
5-7 fulfilment centers
» Deeper exploration of
existing countries
» Evaluation of new
countries
» International rollout
bitiba
HU
Potential locations (FC)
under investigation
Two to four new fulfilment centers will close the remaining
gaps, enhancing the user experience and driving efficiency

Deutsches Eigenkapitalforum | page 15
Current guidance and mid-term outlook
Total Sales EBT ROS
2014 : € 500 mm + > € 5 mm > 1,0%
Total Sales EBT ROS
2015 : € 600 mm > € 10 mm ~ 2,0%
2016 : € 700 mm ~ € 25 mm ~ 3,5%
Current guidance – for next year
Outlook from today’s perspective – mid-term
EBT: Earnings before taxes ROS: Return on sales = EBT on Total Sales

Deutsches Eigenkapitalforum | page 16
P&L
in mm EUR
9M 2013 9M 2012 D abs D %
Total Sales 306,7 237,8
abs. 68,9 52,7
D in % 29% 28%
COGS 201,4 65,7%
151,4 63,7%
50,0 2,0%
Logistics 67,3
22,0%
54,7 23,0%
12,6 -1,1%
Payment 4,4
1,4%
3,3 1,4%
1,1 0,0%
Customer Acquisition 8,3
2,7%
11,7 4,9%
-3,4 -2,2%
Personnel 13,8 4,5%
10,8 4,5%
3,0 0,0%
G&A 9,5
3,1%
8,0 3,4%
1,4 -0,3%
EBITDA 2,0
0,7%
-2,1 -0,9%
4,1 1,6%
EBT 1,2
0,4%
-2,7 -1,1%
3,9 1,5%
EPS in EUR 0,05 -0,33 0,4 -
Cash Flow
CF from Operations -2,9 -3,7 0,8 -
P&L structure 9M / 2013
» Total sales increase by 29% vs. PY
» COGS increased due to better prices for
customers and change in product mix
» Significant cost reductions in logistics,
customer acquisition and G&A as % of
total sales
» Positive EBT and strong improvement compared to PY

Deutsches Eigenkapitalforum | page 17
P&L
in mm EUR
Q3 2013 Q3 2012 D abs D %
Total Sales 107,8 85,4
abs. 22,4 19,0
D in % 26% 33%
COGS 71,5
66,3%
55,2 64,6%
16,3 1,7%
Logistics 23,0
21,3%
19,8 23,2%
3,2 -1,9%
Payment 1,6
1,4%
1,2 1,4%
0,4 0,1%
Customer Acquisition 2,3
2,1%
4,6 5,4%
-2,3 -3,3%
Personnel 4,6
4,3%
3,7 4,3%
0,9 0,0%
G&A 2,9
2,7%
2,6 3,1%
0,3 -0,4%
EBITDA 2,0
1,8%
-1,6 -1,9%
3,6 3,7%
EBT 1,7
1,6%
-1,8 -2,1%
3,5 3,7%
EPS in EUR 0,15 -0,22 0,4 -
P&L structure Q3 / 2013
» Total sales increase by 26% vs. PY
» COGS increased due to better prices for
customers and change in product mix
» Significant cost reductions in logistics,
customer acquisition and G&A as % of
total sales
» Positive EBT ratio of 1,6%

Deutsches Eigenkapitalforum | page 18
Balance Sheet Sept. 30th, 2013
in mm EUR Sep. 30th, 2013 Dec. 31th, 2012 D abs
A. Non-Current Assets
I. PP&E 0,6 0,7 -0,1
II. Intangible Assets 4,1 2,1 2,0
III. Financial Assets 0,0 0,1 -0,1
IV. Deferred Tax Assets 7,6 8,2 -0,6
Total Non-Current Assets 12,3 11,1
B. Current Assets
I. Inventories 40,2 32,9 7,3
II. Trade Receivables 11,2 9,3 1,9
III. Other Current Assets 5,6 9,1 -3,5
IV. Cash and Cash Equivalents 7,6 3,0 4,6
Total Current Assets 64,6 54,3
76,9 65,4 11,5
Assets Equity and Liabilities
in mm EUR Sep. 30th, 2013 Dec. 31th, 2012 D abs
A. Equity
I. Capital Subscribed 6,1 6,1 0,0
II. Capital Reserves 50,0 49,4 0,6
III. Other Reserves 0,0 -0,1 0,1
IV. Profit and Loss carried forward -21,2 -21,5 0,3
Total Equity 34,9 33,9
B. Current Liabilities
I. Trade payables 12,0 16,8 -4,8
II. Financial Liabilities 13,0 2,0 11,0
III. Derivative Financial Instruments
0,1 0,3 -0,2
IV. Other Current Liabilities 12,8 9,1 3,7
V. Tax Liabilites 0,3 0,1 0,2
VI. Provisions 2,8 2,2 0,6
VII. Deferred Income 1,0 0,9 0,1
Total Current Liabilities 42,0 31,5
76,9 65,4 11,5
Equity (Ratio in %) 45,4% 51,9%
» Attractive balance sheet structure - equity ratio > 40%
» Investments in growth already covered in result
» No impairment risks
» Highly efficient capital utilization
» No further equity raisings envisaged
» Attractive and long-term financing lines in place

Deutsches Eigenkapitalforum | page 19
Shareholder structure and market capitalization
1 Burda Digital Ventures GmbH
2 Others
3 BDV Beteiligungen GmbH & Co. KG
4 Burda GmbH
5 Capital Research
6 The Nomad Investment Partnership LP
7 Ruane, Cunniff & Goldfarb Inc.
8 Wasatch Advisors
9 Burda (others)
22.70 %
5.39 %
7.99 %
2.81 %
7.98 %
8.60 %
24.35 % 5.90 %
14.28 %
1
2
5
9 8 7
6
4
3
Shareholder structure
+82%
Share price development
Jan. 1st, 2013: € 31.95 Nov. 8th, 2013: € 58.21 Market capitalization ~ € 350 m
Free float (according to Deutsche Börse definition): 49,96%