investor & analyst presentation · investor & analyst presentation - annual report 2018 |...
TRANSCRIPT

Investor & Analyst PresentationCapital Markets Day
London, March 20th, 2019
Dr. Cornelius Patt, CEO
Andreas Grandinger, CFO
Investor & Analyst Presentation - Annual Report 2018 | page 2
This document includes supplemental financial measures that are or may be non-GAAP financial measures. These supplemental
financial measures should not be viewed in isolation as alternatives to measures of zooplus’ financial condition, results of
operations or cash flows as presented in accordance with IFRS in its Consolidated Financial Statements. Other companies that
report or describe similarly titled financial measures may calculate them differently.
This document contains statements related to our future business and financial performance and future events or developments
involving zooplus that may constitute forward-looking statements. We may also make forward-looking statements in other
reports, in presentations, in material delivered to stockholders and in press releases. In addition, our representatives may from
time to time make oral forward-looking statements. Such statements are based on the current expectations and certain
assumptions of zooplus’ management, and are, therefore, subject to certain risks and uncertainties. A variety of factors, many of
which are beyond zooplus’ control, affect zooplus’ operations, performance, business strategy and results and could cause the
actual results, performance or achievements of zooplus to be materially different from any future results, performance or
achievements that may be expressed or implied by such forward-looking statements or anticipated on the basis of historical
trends. Further information about risks and uncertainties affecting zooplus is included throughout our most recent annual and
interim reports, which are available on the zooplus website, www.zooplus.de. Should one or more of these risks or uncertainties
materialize, or should underlying assumptions prove incorrect, actual results, performance or achievements of zooplus may vary
materially from those described in the relevant forward-looking statement as being expected, anticipated, intended, planned,
believed, sought, estimated or projected. zooplus neither intends, nor assumes any obligation, to update or revise these forward-
looking statements in light of developments which differ from those anticipated.
Due to rounding, numbers presented throughout this and other documents may not add up precisely to the totals provided and
percentages may not precisely reflect the absolute figures.
Safe Harbor Statement

Investor & Analyst Presentation - Annual Report 2018 | page 3
Your presenters today
Management owns around 5% of the shares of the company
Dr. Cornelius Patt
CEO, Founder
Andreas Grandinger
CFO
» Corporate Management
» Business Development &
Systems Development
» IT
» Human Resources
» Finance
» Controlling
» Legal
» Internal Audit
» Investor Relations

Investor & Analyst Presentation - Annual Report 2018 | page 4
Annual results 2018Capital Markets Day
London, March 20th, 2019
Dr. Cornelius Patt, CEO
Andreas Grandinger, CFO

Investor & Analyst Presentation - Annual Report 2018 | page 5
zooplus continued to improve its market leadership position in 2018
» Sales increased by 21% to EUR 1,342 m
− European market leader position in online retailing sustained
− Double-digit growth rates in all 30 European markets
» Customer loyalty with 95% sales retention
− High loyalty of existing customers shows strength of business model
− Acceleration of new customer growth in H2 2018
» Logistics infrastructure significantly expanded
− New fulfillment centers in UK, Poland and Spain
» Result before tax (EBT) of EUR -2.3 m
− Significantly improved EBT in H2 2018 (EUR 6.9 m)
» Free cash flow of EUR 14.3 m
− Further improvement in working capital from 5.1% to 2.7% of sales

Investor & Analyst Presentation - Annual Report 2018 | page 6
The growth path continued and sales have increased by EUR 231 m in 2018
Sales 2012-2018 (EUR m)
1) in local currencies201720162013 2014
1,342
2012 2015 2018
319
543
711
407
1,111
909
+88
+136
+168
+198
+202
+231
85%91%
94%
92%
94%1
93%
93%1
22%28%31%33%28%30%Sales growth
vs. PY
Repeat
customer sales
New customer
sales (1st year)
21%
94%
95%1

Investor & Analyst Presentation - Annual Report 2018 | page 7
Sales of over EUR 1.3 bn in 2018
1,111
1,342
2017 2018
23%
11%
Food Non-Food
+ 21%
FX adjusted + 21%
Sales (EUR m) Sales growth by category

Investor & Analyst Presentation - Annual Report 2018 | page 8
Quarter on quarter sales development
in EUR m
+ 66
257
208
165 168178
200
2015 2016 2017 2015 2016 2015 2016 2015 20162017 201720172018
221 227
253
Quarter 1 Quarter 2 Quarter 3 Quarter 4
323
260278
316
+ 49+ 39
+ 51
+ 52320
+ 60
2018
331
+ 53
2018
368
+ 63
2018

Investor & Analyst Presentation - Annual Report 2018 | page 9
Private label sales continued to grow significantly faster than branded products in 2018
Private label growth
» Private label food and cat litter
» Strong focus on increasing
share of private label
» Margin advantage of private
label reinvested in growing
private label business
36% 35%
2017 2018

Investor & Analyst Presentation - Annual Report 2018 | page 10
Sales 2018
HU
Source: zooplus sales, unaudited data, growth rates compared to 2017;
market shares based on Euromonitor 2016 market data and zooplus estimation
112m
Total market 2018
23bnSales zooplus
in 2018
DK, SE,
FI, NO
D,A,CHCZ, SK, HU, RO,
SI, HR, BG, TR,
GR, LV. LT, EE
ES, PT
zooplus is the online market leader across Europe
NL, BE, LU
+24%
+17%
+22%
+20%
+20%
+35%
+16%
+20%
86m
149m
387m
84m
224m
82m
108m
1,342m
zooplus market
share in 2018
7.0%
2.7%
6.0%
4.7%
4.4%
5.7%
8.2%
5.4%
5.8%
» EUR 1,342 m,
sales growth rate +21%
» Double-digit sales growth
rates in all countries
UK, IE
IT
FR, MC
Sales growth in
2018
110m16.0%
+37%
PL
Investor & Analyst Presentation - Annual Report 2018 | page 11
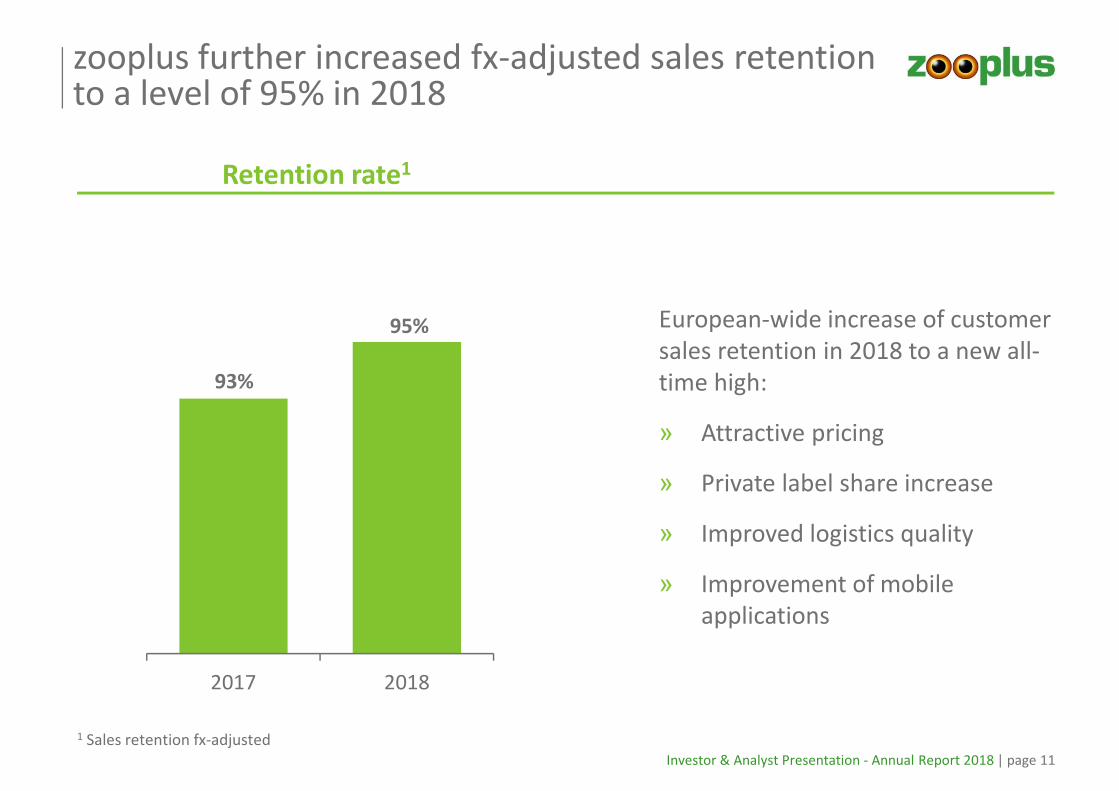
zooplus further increased fx-adjusted sales retention to a level of 95% in 2018
93%
95%
2017 2018
Retention rate1
European-wide increase of customer
sales retention in 2018 to a new all-
time high:
» Attractive pricing
» Private label share increase
» Improved logistics quality
» Improvement of mobile
applications
1 Sales retention fx-adjusted

Investor & Analyst Presentation - Annual Report 2018 | page 12
New customer trend positive since Q3 2018
755
651
694
818
Q1 2018 Q2 2018 Q3 2018 Q4 2018
New customers (in k)
» New customer trend positive
since Q3 2018
» More focused approach of new
customer acquisition
- Stronger focus on registering
- Google bidding adaptations
» Growth of new customer intake
supported by higher marketing
acquisition costst/o registered 644 545 594 722
t/o unregistered 111
106
100
96

Investor & Analyst Presentation - Annual Report 2018 | page 13
Basket value with positive development since Q2 2018
53.6
54.5 54.754.9
Q1 2018 Q2 2018 Q3 2018 Q4 2018
Basket value (EUR)
» Reduction of non-profitable
orders
» Adaptation of free shipping
thresholds
» Reduction of parcel split ratio
» Additional logistics fee charged
for selected orders that need
more than one parcel

Investor & Analyst Presentation - Annual Report 2018 | page 14
Long-term gross margin decline halted
2012 2013 2014 2015 2016 2017 2018
Gross margin1
1 Sales - COGS; years prior to 2018 adjusted from published
external figures to new IFRS 15
in % of sales
37.4%35.8%
32.3%
30.6%
28.7% 28.5% 28.7%
» Less customer and
transactional
discounts
» Reduction of non-
profitable orders
» Higher charges for
shipping
» Margin increase
due to better
sourcing

Investor & Analyst Presentation - Annual Report 2018 | page 15
2017 2018
Gross margin improvement in spite of higher food share
2017 2018
» Supplier contribution
for marketing etc.
since 2018 within
gross margin (IFRS 15)
» Other income:
dunning fees,
exchange rate gains,
others
+ 0.2%p
28.5% 28.7%
in % of sales
1 Share of food and cat litter
on sales
+ 1.4%p
83.5%84.9%
2017 2018
in % of sales
+ 0.1%p
29.2% 29.3%
3 Gross margin + other income on sales2 Sales - CoGS
Total margin3Gross margin2Product mix1

Investor & Analyst Presentation - Annual Report 2018 | page 16
3.2% 3.3%
3.0% 3.3%
19.8% 19.7%
1.7% 2.2%
2017 2018
29.5%
Cost leadership position in 2018 sustained but reflects stronger investment focus
Total margin1
» Marketing up for new
customer acquisition
» IT/Admin impacted by
higher depreciation
» Personnel reflects
stronger IT development
resources
» Increase in depreciationIT/Admin/ (incl. depreciation
& interest)
Advertising/
Marketing
Logistics2
Personnel4
1.0% 1.1% Payment3
28.8%
29.3%29.2%
+ 0.7%p
Total margin & cost structure (in % of sales)
1 gross margin + other income on sales2 logistics costs reclassified to depreciation according to IAS 173 impairment expenses on financial assets reclassified to payment4 including LTI & SOP; own work capitalized reclassified to personnel

Investor & Analyst Presentation - Annual Report 2018 | page 17
Significantly improved cost position in H2 2018
Total margin & Cost structure (in % of sales)
3.3% 3.3%
3.2% 3.5%
20.2% 19.2%
2.0% 2.4%
H1 2018 H2 2018
Total margin1
1.0% 1.0%
29.4%
1.1%IT/Admin/ (incl.
depreciation & interest)
Advertising/
Marketing
Logistics2
Personnel4
Payment3
30.4%
29.6%
28.2%
» Back on positive trend in cost structure since H2 2018
» Significant reduction in logistics costs (efficiency + increased value per parcel)
» IT/Admin solely impacted by higher depreciation
» Increased investment in marketing for new customer acquisition
1 gross margin + other income on sales2 logistics costs reclassified to depreciation according to IAS 173 impairment expenses on financial assets reclassified to payment4 including LTI & SOP; own work capitalized reclassified to personnel

Investor & Analyst Presentation - Annual Report 2018 | page 18
zooplus earnings before tax (EBT) in 2018 reflects investment in marketing, IT and logistics infrastructure
8.88.6
2017 2018
4.1
-2.3
2017 2018
- 0.2 -6.4
in % of sales 0.8 % 0.6 %
in % of sales 0.4 %
-0.2 %
EBITDA (EUR m) EBT (EUR m)
Logistics costs reclassified to depreciation according to IAS 17

Investor & Analyst Presentation - Annual Report 2018 | page 19
Profitability of repeat customers business invested to grow the business with long-term perspective
Repeat customer and new customer contribution (EUR m)
271 24% - 17 - 6.3%840 76% 21 + 2.5%
New customers(sales in the year of acquisition)
Repeat customers(consecutive year’s sales)
2017
Net
Sales
% of
total z+
EBT EBT-
margin
Net
Sales
% of
total z+
EBT EBT-
margin
293 22% - 23 - 7.8%1049 78% 21 + 2.0%2018
+ 0.4% + 3.6%
H1 H2
2018

Investor & Analyst Presentation - Annual Report 2018 | page 20
Cash flow from
operating
activities
Cash flow from
investing activities
Free cash flow
Free cash flow positive with EUR 14 m in 2018
2018
21.7
-7.3
14.3
Operating and free cash flow (EUR m)
» Financing sales growth of EUR 231 m and EBT of EUR - 2.3 m internally
» Main driver: significantly improved working capital

Investor & Analyst Presentation - Annual Report 2018 | page 21
Working Capital has been further improved in 2018
Working capital in % sales
9.5%
8.1%
6.3%
5.1%
2.7%
2014 2015 2016 2017 2018
» Continued focus on
working capital
» Main driver:
Improvement in
supplier payment days
Working Capital = inventory + prepayments + receivables - liabilities
Average of quarters Q1 – Q4

Investor & Analyst Presentation - Annual Report 2018 | page 22
zooplus shows a strong balance sheet at end of 2018
» Positive cash balance of EUR 60 m at 12/31/2018
» Equity ratio of 37%
» No financial debt
» Credit lines of EUR 50 m – until end 2020 without guarantees
Solid foundation for further growth

Investor & Analyst Presentation - Annual Report 2018 | page 23
2018 results
Q & A
Investor & Analyst Presentation - Annual Report 2018 | page 24
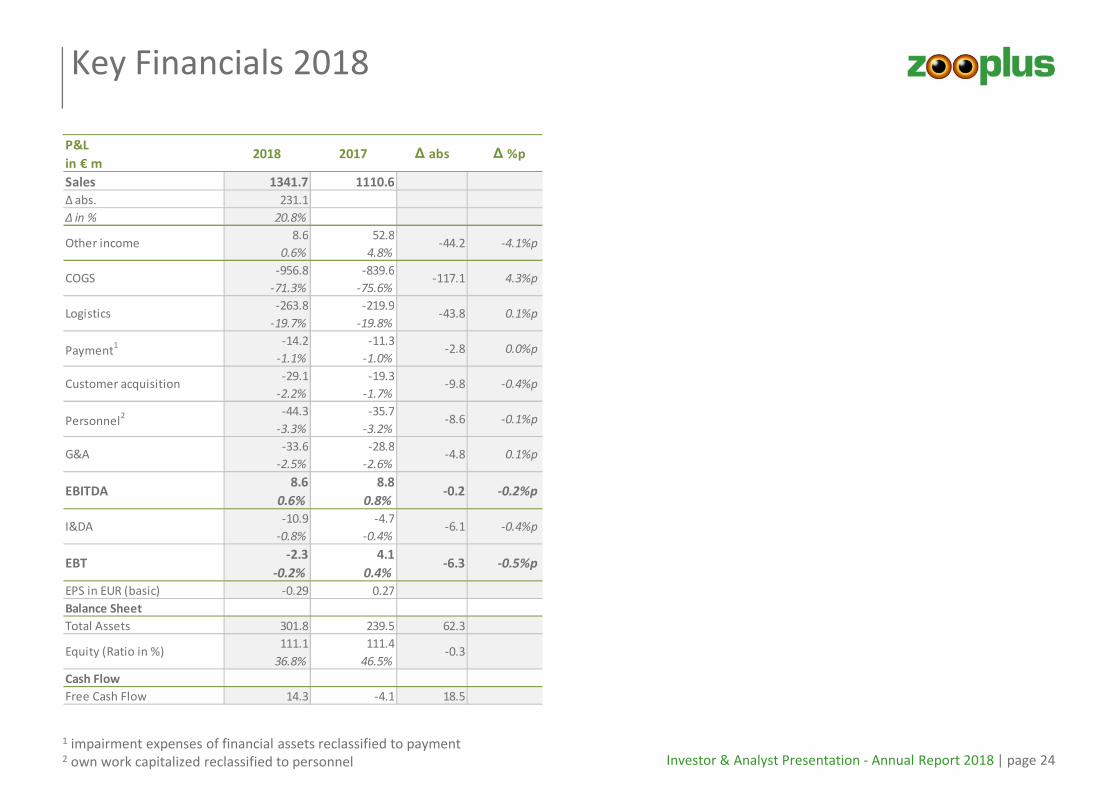
P&L
in € m
Sales 1341.7 1110.6
Δ abs. 231.1
Δ in % 20.8%
8.6 52.8
0.6% 4.8%
-956.8 -839.6
-71.3% -75.6%
-263.8 -219.9
-19.7% -19.8%
-14.2 -11.3
-1.1% -1.0%
-29.1 -19.3
-2.2% -1.7%
-44.3 -35.7
-3.3% -3.2%
-33.6 -28.8
-2.5% -2.6%
8.6 8.8
0.6% 0.8%
-10.9 -4.7
-0.8% -0.4%
-2.3 4.1
-0.2% 0.4%
EPS in EUR (basic) -0.29 0.27
Balance Sheet
Total Assets 301.8 239.5 62.3
111.1 111.4
36.8% 46.5%
Cash Flow
Free Cash Flow 14.3 -4.1 18.5
Other income -44.2 -4.1%p
COGS -117.1 4.3%p
Logistics -43.8 0.1%p
Payment1 -2.8 0.0%p
EBITDA -0.2 -0.2%p
Customer acquisition -9.8 -0.4%p
Personnel2 -8.6 -0.1%p
2018 2017 ∆ abs ∆ %p
Equity (Ratio in %) -0.3
I&DA -6.1 -0.4%p
EBT -6.3 -0.5%p
G&A -4.8 0.1%p
Key Financials 2018
1 impairment expenses of financial assets reclassified to payment2 own work capitalized reclassified to personnel

Investor & Analyst Presentation - Annual Report 2018 | page 25
Profit & Loss 2018
abs % abs %
Sales1341.7 100.0% 1110.6 100.0%
Other income 8.6 0.6% 52.8 4.8%
Own work capitalized 2.8 0.2% 3.5 0.3%
Cost of materials -956.8 -71.3% -839.6 -75.6%
Personnel costs -47.1 -3.5% -39.1 -3.5%
Depreciation -10.1 -0.8% -4.3 -0.4%
Impairment expenses on financial
assets -2.7 -0.2% 0.0 0.0%
Other expenses -337.9 -25.2% -279.3 -25.1%
thereof logistics / fulfillment -263.8 -19.7% -219.9 -19.8%
thereof marketing -29.1 -2.2% -19.3 -1.7%
thereof payment -11.4 -0.9% -11.3 -1.0%
thereof other costs -33.6 -2.5% -28.8 -2.6%
Earnings before interest and taxes
(EBIT) -1.5 -0.1% 4.4 0.4%
Financial income 0.0 0.0% 0.0 0.0%
Financial expenses -0.8 -0.1% -0.4 0.0%
Earnings before taxes (EBT) -2.3 -0.2% 4.1 0.4%
Taxes on income 0.2 0.0% -2.1 -0.2%
Consolidated net result -2.1 -0.2% 1.9 0.2%
Differences from currency translation -0.7 -0.1% -0.5 0.0%
Hedge reserve 0.3 0.0% -2.0 -0.2%
Items that may be relclassified
subsequently to profit or loss -0.4 0.0% -2.5 -0.2%
Comprehensive income -2.5 -0.2% -0.6 -0.1%
Earnings per share in €
basic -0.29 - 0.27 -
diluted -0.29 - 0.27 -
in € m2018 2017

Investor & Analyst Presentation - Annual Report 2018 | page 26
Balance Sheet as of December 31st, 2018
Assets Equity and Liabilities
in € mDec. 31st.
2018
Dec. 31st.
2017∆ abs
A. Non-current assets
I. PP&E 55.9 15.0 40.9
II. Intangible assets 14.2 13.1 1.1
III. Other financial assets 0.0 0.0 0.0
IV. Deferred tax assets 0.0 0.0 0.0
Total non-current assets 70.0 28.1 42.0
B. Current assets
I. Inventories 107.6 104.5 3.0
II. Advance payments 0.4 0.6 -0.2
III. Accounts receivable 28.1 26.4 1.8
IV. Other current assets 16.1 27.5 -11.3
V. Contract assets 19.0 0.0 19.0
VI. Tax receivables 0.9 1.2 -0.3
VII.Derivative financial
instruments0.0 0.0 0.0
VIII. Cash and cash equivalents 59.5 51.2 8.3
Total current assets 231.7 211.4 20.3
301.8 239.5 62.3
in € mDec. 31st.
2018
Dec. 31st.
2017∆ abs
A. Equity
I. Capital subscribed 7.1 7.1 0.0
II. Capital reserves 100.8 98.8 2.0
III. Other reserves -1.8 -1.4 -0.4
IV. Pro fit and Loss carried forward 4.9 6.8 -1.9
Total equity 111.1 111.4 -0.3
B. Non-current liabilities 41.4 11.1 30.3
C. Current liabilities
I. Accounts payable 99.7 78.1 21.6
II Derivative financial instruments 0.1 0.5 -0.5
III. Other current liabilities 19.9 24.6 -4.6
IV. Contract liabilities 17.1 0.0 17.1
V. Tax liabilites 0.1 1.3 -1.2
VI. Finance lease 9.8 2.1 7.7
VII. Provisions 2.6 7.4 -4.9
VIII. Deferred income 0.0 2.9 -2.9
Total current liabilities 149.3 117.0 32.3
301.8 239.5 62.3
Investor & Analyst Presentation - Annual Report 2018 | page 27
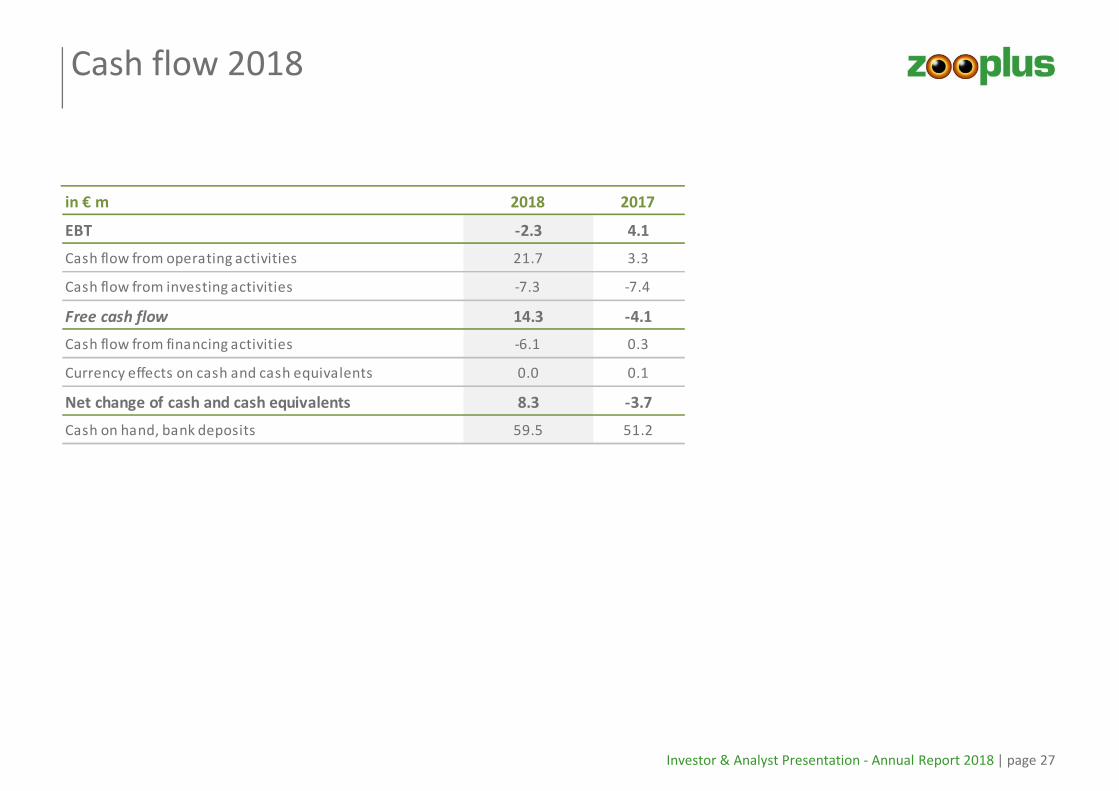
Cash flow 2018
in € m 2018 2017
EBT -2.3 4.1
Cash flow from operating activities 21.7 3.3
Cash flow from investing activities -7.3 -7.4
Free cash flow 14.3 -4.1
Cash flow from financing activities -6.1 0.3
Currency effects on cash and cash equivalents 0.0 0.1
Net change of cash and cash equivalents 8.3 -3.7
Cash on hand, bank deposits 59.5 51.2

Investor & Analyst Presentation - Annual Report 2018 | page 28
Strategy & OutlookCapital Markets Day
London, March 20th, 2019
Dr. Cornelius Patt, CEO
Andreas Grandinger, CFO

Investor & Analyst Presentation - Annual Report 2018 | page 29
Main takeaways from today’s presentation about zooplus’ strategic perspective
» Pet supplies continues to be a very attractive and growing market.
» zooplus is by far market leader online and already No. 2 in the total market. zooplus has a very loyal
and continuously growing customer base of around 7 m customers.
» Competition comes from amazon, brick-and-mortar and small regional onliners. Overall zooplus’
competitive position is today stronger than 12 months ago.
» Amazon is the major competitor but zooplus differentiates today significantly from amazon and
tomorrow even more. There is enough room for growth for a specialist next to the generalist amazon.
» zooplus has the most relevant platform for specialist pet supplies manufacturers and is the only
specialist platform in the category that can efficiently ship a parcel to any place in Europe.
» Sustainable new customer growth but not at any price continues to be priority for zooplus. Sales
growth might be slightly lower going forward but future outlook continues to be very positive.
» zooplus has a clear long-term perspective for future structural profitability of 5-7% EBITDA margin
with a stabilized / improved gross margin and further optimization of cost structure.
» Opportunities arise from brand development and social media marketing, pricing optimization,
private label share increase, more detailed data analyses especially for CRM and suppliers as well as
pet services platform integration to develop the most customer centric pet ecosystem in Europe.
Investor & Analyst Presentation - Annual Report 2018 | page 30
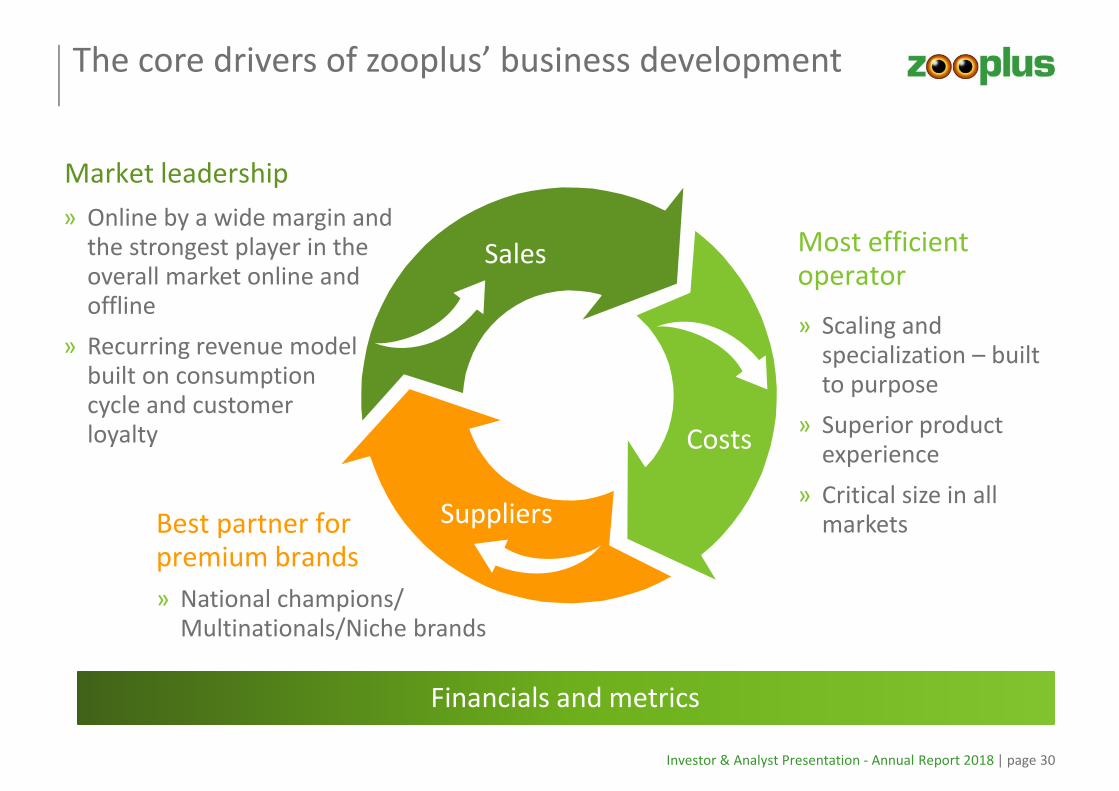
The core drivers of zooplus’ business development
» Online by a wide margin and the strongest player in the overall market online and offline
» Recurring revenue model built on consumption cycle and customer loyalty
» Scaling and specialization – built to purpose
» Superior product experience
» Critical size in all markets
Financials and metrics
Sales
Costs
Suppliers
Market leadership
Most efficient operator
» National champions/ Multinationals/Niche brands
Best partner for premium brands

Investor & Analyst Presentation - Annual Report 2018 | page 31
Different to amazon
Margin focus / private label growth
Market place / intermediary for services
Efficiency and scale
zooplus’ key priorities for 2019 and beyond
Sales growth (retention + new customers)
1
2
3
4
5
Building Europe’s most relevant and customer centric pet platform for consumers and suppliers

Market & Competition

Investor & Analyst Presentation - Annual Report 2018 | page 33
European pet supplies market is a very attractive and growing market
Pet supplies market in Europe 2009-2025e (gross sales EUR bn)
» Ownership of pets is on the rise in Europe
» Humanization of pets drives spending
» Trend towards more premium products
» Market is resilient to economic cycles
» Consumables recurring revenue – subscription like
» No technology and fashion obsolescence risk
» Low product return rates
20 21 2223 23
2425 26 26
27
33
2009 2010 2011 2012 2013 2014 2015 2016 2017 2018 … 2025e
Source: Euromonitor 2016 and zooplus estimation
CAGR +3% p.a.
Investor & Analyst Presentation - Annual Report 2018 | page 34
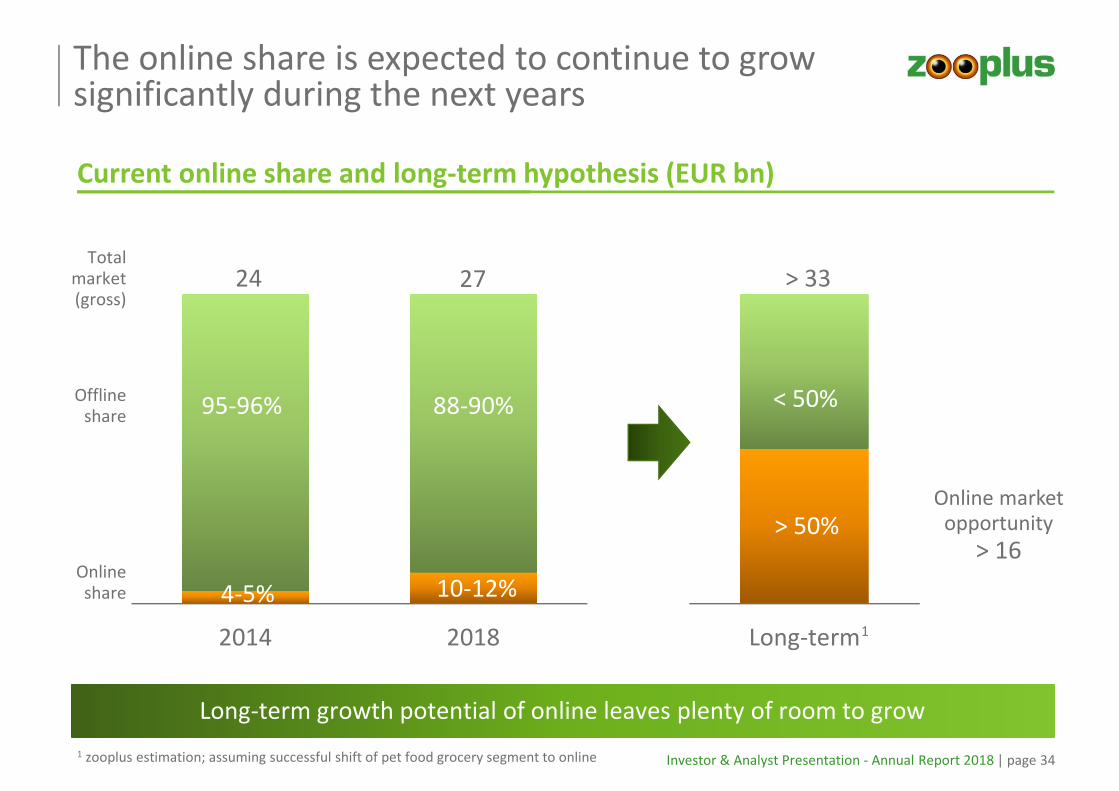
The online share is expected to continue to grow significantly during the next years
Current online share and long-term hypothesis (EUR bn)
2014 2018
24 27
10-12%
88-90%
8-10%
Offline share
Online share
Total market (gross)
< 50%
Long-term
> 50%
> 33
Online market opportunity
> 16
Long-term growth potential of online leaves plenty of room to grow
4-5%
95-96%
1 zooplus estimation; assuming successful shift of pet food grocery segment to online
1
92-90%

Investor & Analyst Presentation - Annual Report 2018 | page 35
zooplus strengthened No. 2 position in Europe in 2018 and is well on its way towards market leadership
Net sales and growth 2018 – European market (EUR bn)
Benefitting from all the advantages of size and market leadership
Source: Company data for 2018 figures; zooplus assumptions
n/a
1.1
1.3
1.9+ 6%
+21%
+7%
Online ~0.08
Online ~0.08
1
2
32)
1) Net sales estimated from gross sales 2) Includes services 3) amazon global online store sales
4 3)+13%
(+ EUR 110 m)
(+ EUR 231 m)
(+ EUR 70 m)
1)

Investor & Analyst Presentation - Annual Report 2018 | page 36
online market position
zooplus is by far the European market leader in online pet supplies
zooplus sales 2018 (EUR m) and market share of total market
growth rate
% of total net sales
84
82
86
108
110
112
149
224
387
Other EE
ES, PT
DK, SE, FI, NO
IT
PL
UK, IE
NL, BE, LU
FR
D, A, CH 29%
17%
11%
8%
8%
8%
6%
6%
6%
16%
20%
20%
17%
37%
20%
22%
24%
35%
7.0%
6.0%
8.2%
2.7%
16.0%
4.4%
5.4%
4.7%
5.7%
Source: market shares zooplus estimation
absolute growth
52 m
37 m
25 m
16 m
30 m
18 m
16 m
16 m
22 m
1
1
1
2
1
1
1
1
1

Investor & Analyst Presentation - Annual Report 2018 | page 37
Competitors fall into three categories
» Generalist, focus on mass & accessories
» Limited premium offer on amazon direct
» Will stay and continue to grow
Brick & mortar
Regional onliners
amazon
» Small independents getting fewer in number
» Chain store online expertise still limited, focus on stores, sales prices offline still much higher
» Challenging times still to come – declining like-for-like unless resized number of outlets
» Mid-term non competitive margin & cost structure
» First signs of consolidation
» Only few very specialized stores will survive
Long-term zooplus and amazon as the two leading concepts in the category

Investor & Analyst Presentation - Annual Report 2018 | page 38
Category
Premium brands
Additional pet content
Pricing
Pet specialist
All relevant premium brands
Pet specific content & services
More competitive or same price
Private label 14% of food sales
There is a good way of living next to amazon as a differentiated category specialist
Supply chain > 99% Direct (control of supply chain)
zooplus with the vision of most relevant platform both for products and services will clearly differentiate versus amazon’s transactional approach
Assortment Food + curated accessories
Generalist
Limited assortment
None
Competitive
< 1% of sales
Direct (20-50%) + Marketplace
Focus on mass & accessories

Investor & Analyst Presentation - Annual Report 2018 | page 39
zooplus has a complete offer and keeps a relevant price advantage versus amazon and the competition
Top 500 articles Top 1000 articles
UK
amazon direct 20% 21%
amazon MP 80% 79%
Pets at Home online 55% 52%
Fetch 54% 50%
amazon direct share reduced over last months, market place significantly more expensive, continued price advantage for zooplus towards the competition
Germany
amazon direct 17% 19%
amazon MP 83% 81%
Fressnapf online 37% 41%
Zooroyal 43% 38%
Source: zooplus research via pricegrabbing March 2019
Assortment overlap Assortment overlap

Investor & Analyst Presentation - Annual Report 2018 | page 40
amazon will not build a monopoly in the pet supplies category
zooplus will continue to develop its business model next to amazon as the leading pet specialist retailer
� There are bigger markets to conquer first
� Pets category one of the most emotional categories in retailing
� Comparatively low margin products with little cash generation today
� Challenges with logistics (bulky & heavy, parcel split)
� Suppliers see challenges for premium brand development on amazon
� Not all consumers are amazon addicts
� Competition authorities will watch the amazon development
� Chewy in the US impressively shows that it is possible to build a customer centric pet retailer next to amazon

Investor & Analyst Presentation - Annual Report 2018 | page 41
Market overall continues to be attractive and growing
Summary market & competition
Brick and mortar will continue to struggle with online
amazon is the only relevant long-term online competitor next to zooplus
Majority of smaller (online) specialists will consolidate or disappear mid-term
Online will take considerably more share in the next years
The market is big enough for both amazon and zooplus in the long run
zooplus strongly differentiates from amazon as the pet specialist
1
2
4
5
6
7
3

Investor & Analyst Presentation - Annual Report 2018 | page 42
Q & A

Brand & Shop portfolio

Investor & Analyst Presentation - Annual Report 2018 | page 44
Key drivers for the attractiveness of the zooplus business model from a shopper perspective
USP and differentiation towards competition
1Price
attractiveness
2Completeness
of offer
3Performance
quality
4Content
“At zooplus or bitibaI always find the best price.”
“Whenever I need to order, the products are available.”
“I can choose the last mile provider and the delivery is very reliable.”
“On zooplus I find very detailed product descriptions and additional information. I can even ask questions to a veterinarian.”

Investor & Analyst Presentation - Annual Report 2018 | page 45
Differentiated brand portfolio to cover all relevant market segments
Discount oriented pet retailer
with focused product portfolio for price sensitive customers
Pet specialist
with broad profile of covered product segments & brands
Vet specialist
with focus on health products and high quality nutrition
Brand opportunity:zooplus and adjacent brands to be developed much stronger in future
Investor & Analyst Presentation - Annual Report 2018 | page 46
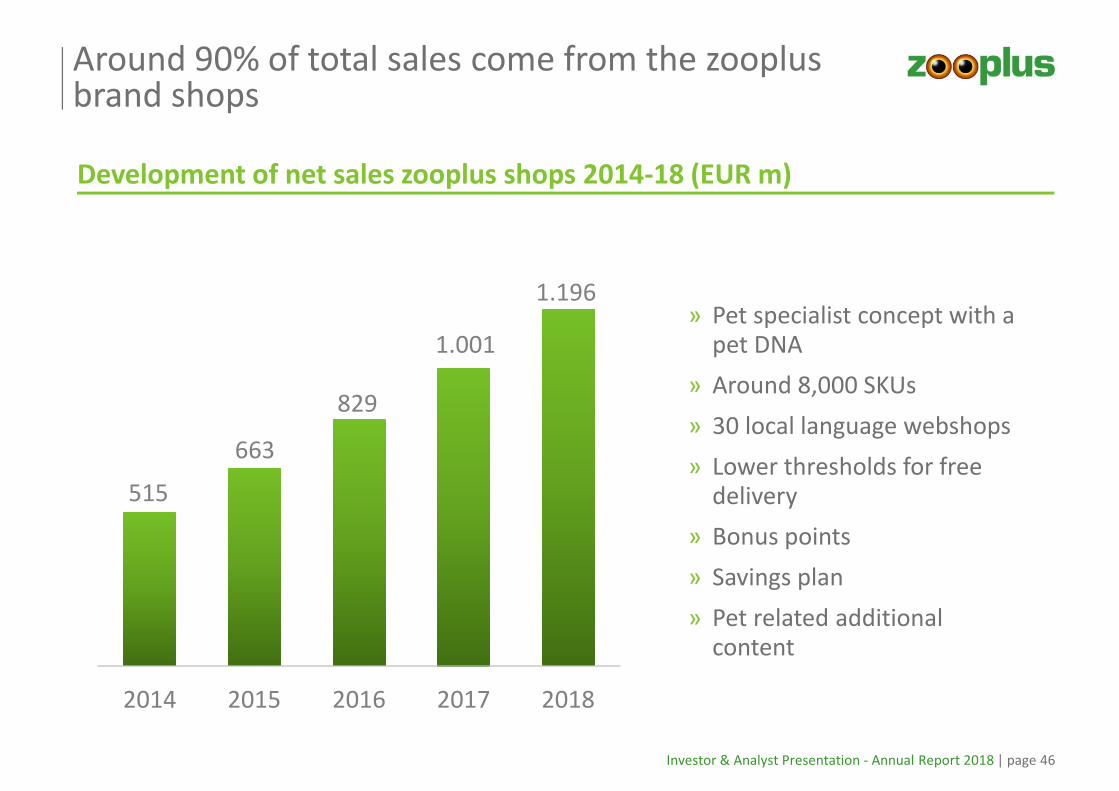
Around 90% of total sales come from the zooplusbrand shops
515
663
829
1.001
1.196
2014 2015 2016 2017 2018
Development of net sales zooplus shops 2014-18 (EUR m)
» Pet specialist concept with a pet DNA
» Around 8,000 SKUs
» 30 local language webshops
» Lower thresholds for free delivery
» Bonus points
» Savings plan
» Pet related additional content

Investor & Analyst Presentation - Annual Report 2018 | page 47
Around 10% of total sales come from the bitibabrand shops
28
48
79
110
146
2014 2015 2016 2017 2018
Development of net sales bitiba shops 2014-18 (EUR m)
» Focused concept for price sensitive customers
» Reduced number of SKUs
» 14 local language webshops
» Higher thresholds for free delivery
» No bonus points and savings plan
» Uses same infrastructure as zooplus
» Slightly lower levels of customer and sales retention
» Contribution margin on similar level as for zooplus customers
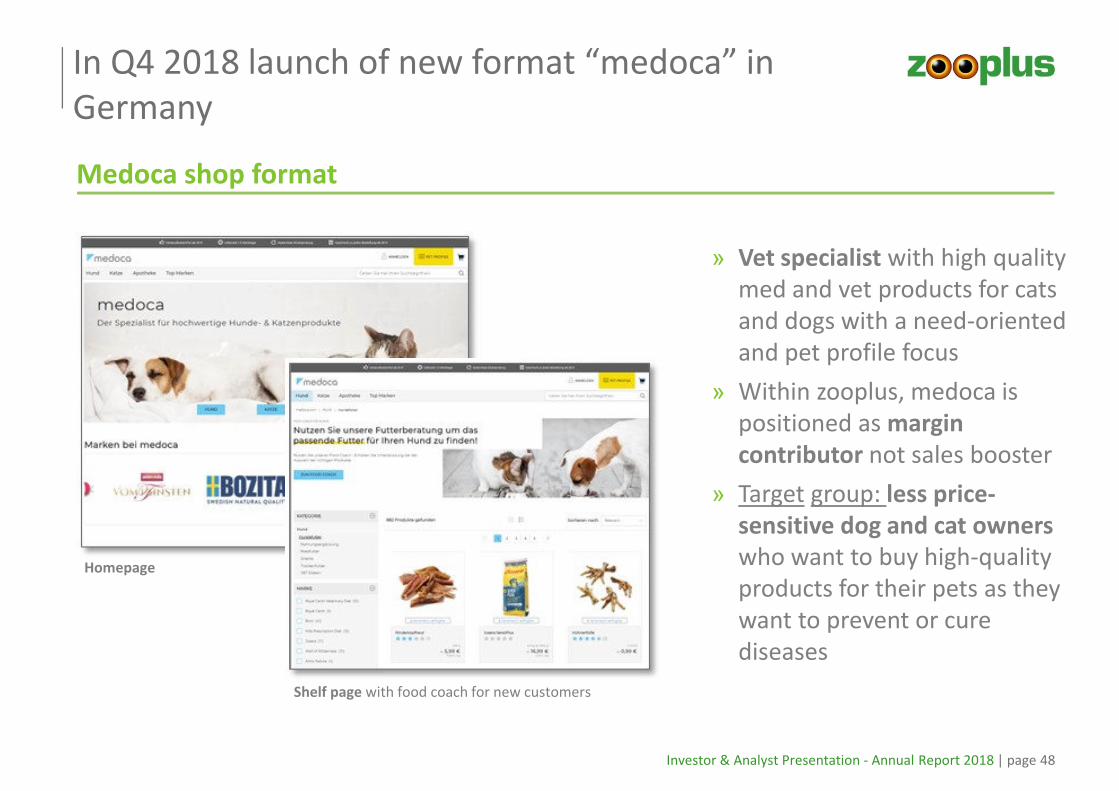
Investor & Analyst Presentation - Annual Report 2018 | page 48
In Q4 2018 launch of new format “medoca” in
Germany
» Vet specialist with high quality
med and vet products for cats
and dogs with a need-oriented
and pet profile focus
» Within zooplus, medoca is
positioned as margin
contributor not sales booster
» Target group: less price-
sensitive dog and cat owners
who want to buy high-quality
products for their pets as they
want to prevent or cure
diseases
Shelf page with food coach for new customers
Homepage
Medoca shop format

Customer loyalty / Retention

Investor & Analyst Presentation - Annual Report 2018 | page 50
Loyal customers are the core base of zooplusgrowth path
Sales retention 2018
95%
» Record high sales retention rate in 2018
» Industry-wide and across industries leading retention rate
» Clear sign that zooplus customers are extremely loyal
Stands for excellent consumer acceptance of product offer and strength of
business model
Fx-adjusted

Investor & Analyst Presentation - Annual Report 2018 | page 51
zooplus business model with high retention is like a subscription business
Retention rates – Cohort analysis – Sales (EUR m)
Reading example: 2012 a = sales of 2012’s new customers in 2012 1) in local currencies
133 131 131 135 138 139 137
62 56 55 56 56 56 56125 87 79 78 77 77 76
105 95 91 88 87
127 119 115
202167 144 136
253217 189
271254
293
2012 2013 2014 2015 2016 2017 2018
135
174 145
101%
90% 99%
70% 91%
78%
<=2010
2011 a+1
2012 a
2013 a
Ø 85%
Ø 91%
Ø 94%
2014 a
2015 a
90%
2016 a
83%
99%
102%
104%
83%
Ø 92%
Ø 94%1)
88%
96%
99%
100%
101%
319
407
543
711
909
2017 a
99%
86%
86%
94%
97%
99%
100%
101%
1,111
94%
87%
94%
96%
98%
99%
100%
99%
2018 a
Ø 94%
Ø 95%1)
Ø 93%
Ø 93%1)
1,342
Investor & Analyst Presentation - Annual Report 2018 | page 52
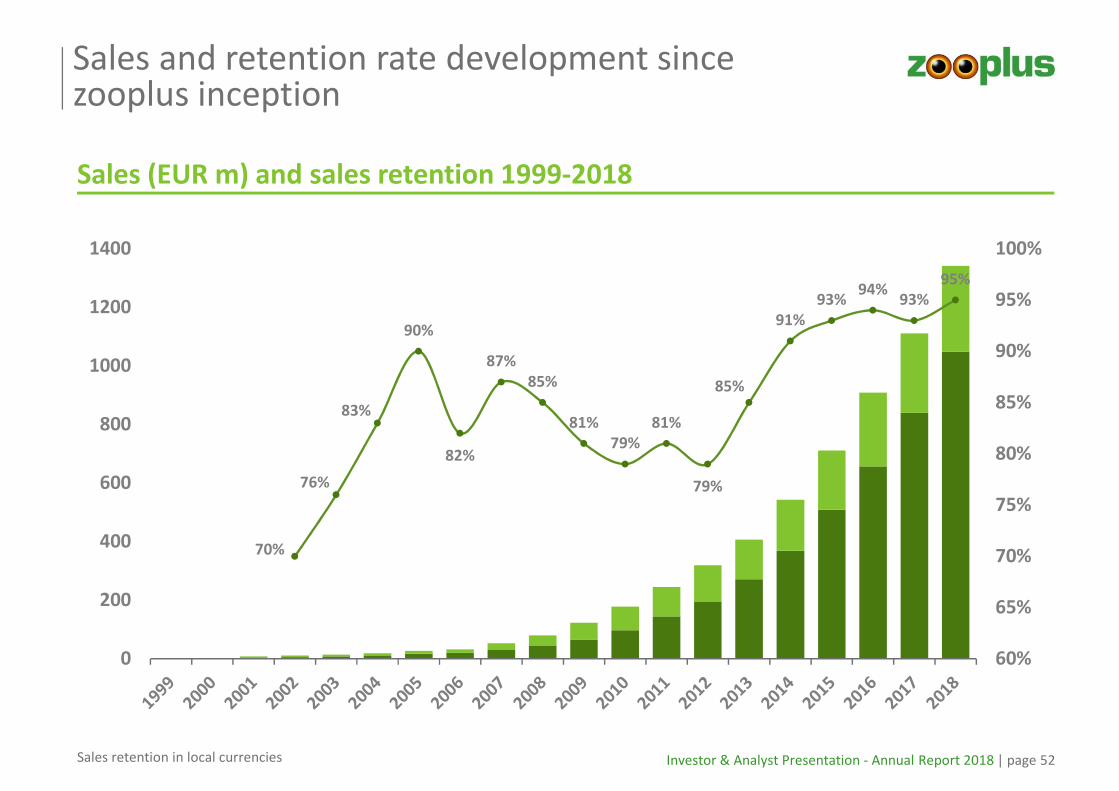
Sales and retention rate development since zooplus inception
Sales (EUR m) and sales retention 1999-2018
70%
76%
83%
90%
82%
87%
85%
81%
79%
81%
79%
85%
91%
93%94%
93%
95%
60%
65%
70%
75%
80%
85%
90%
95%
100%
0
200
400
600
800
1000
1200
1400
Sales retention in local currencies
Investor & Analyst Presentation - Annual Report 2018 | page 53
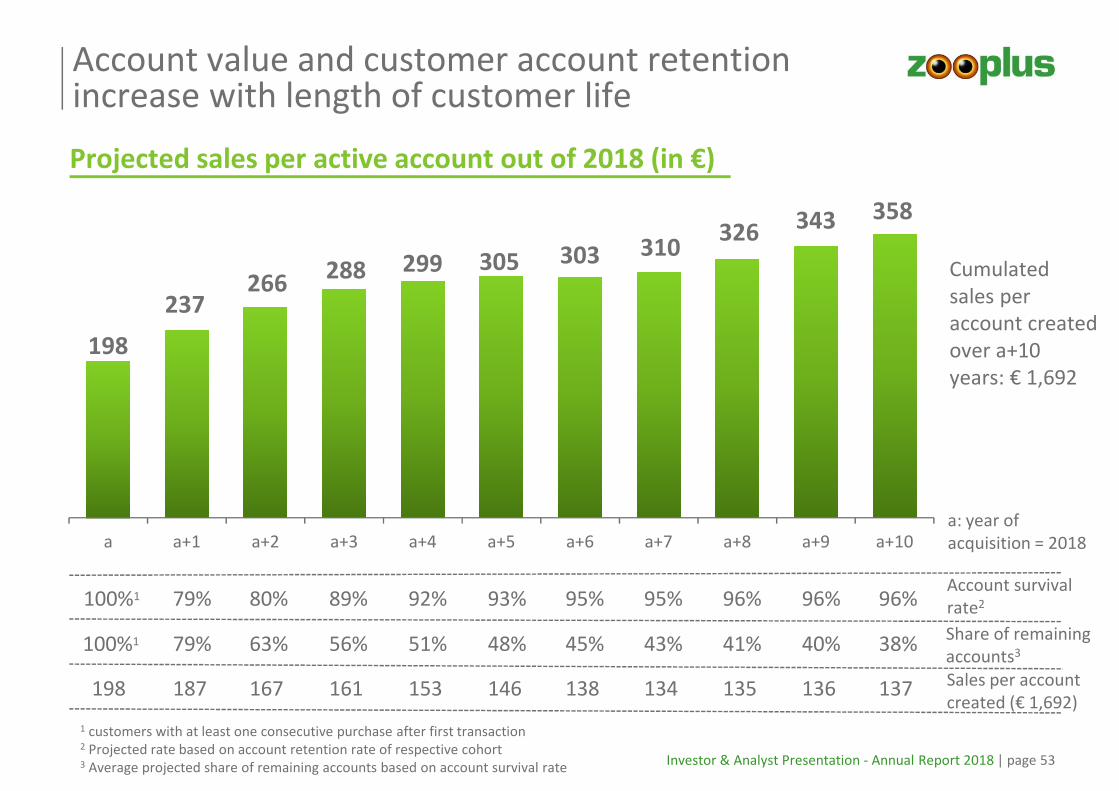
Account value and customer account retention increase with length of customer life
198
237266
288 299 305 303 310326
343 358
a a+1 a+2 a+3 a+4 a+5 a+6 a+7 a+8 a+9 a+10
Projected sales per active account out of 2018 (in €)
Cumulated
sales per
account created
over a+10
years: € 1,692
100%1 79% 63% 56% 51% 48% 38%
Account survival
rate2
a: year of
acquisition = 2018
1 customers with at least one consecutive purchase after first transaction2 Projected rate based on account retention rate of respective cohort3 Average projected share of remaining accounts based on account survival rate
Share of remaining
accounts345% 43% 41% 40%
100%1 79% 80% 89% 92% 93% 95% 95% 96% 96% 96%
198 187 167 161 153 146 137138 134 135 136 Sales per account
created (€ 1,692)
Investor & Analyst Presentation - Annual Report 2018 | page 54
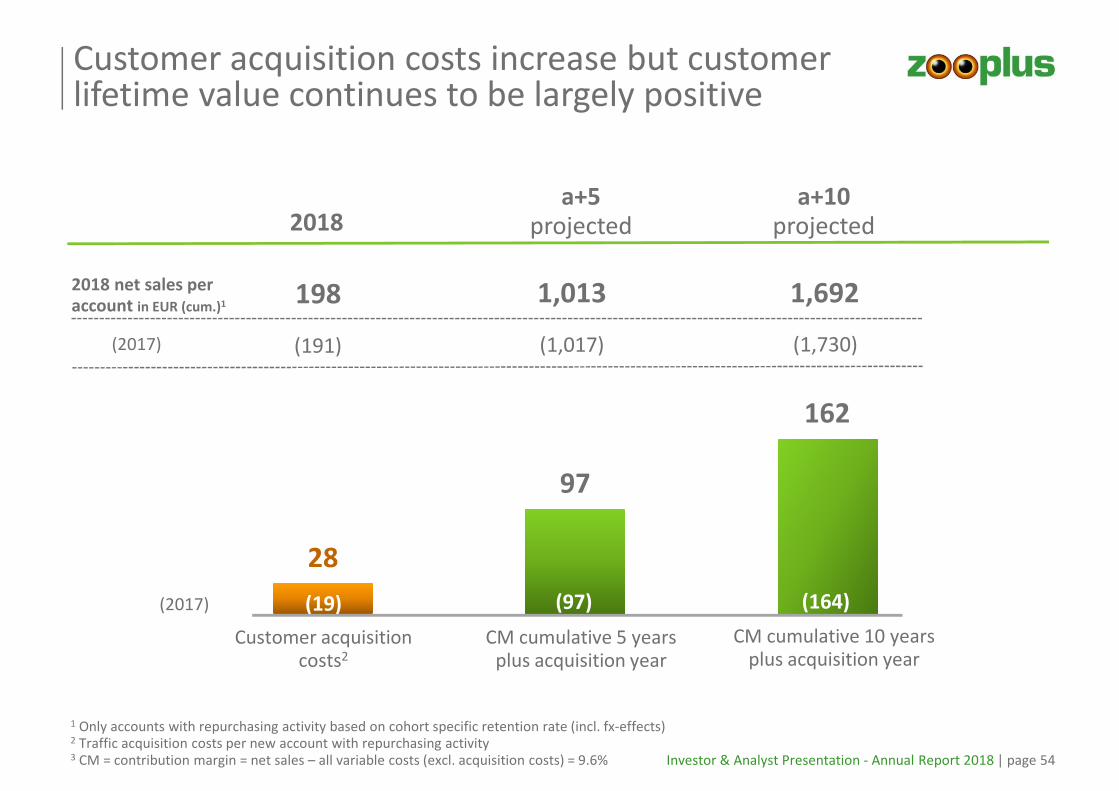
28
97
162
Customer acquisition costs increase but customer lifetime value continues to be largely positive
Customer acquisitioncosts2
CM cumulative 5 yearsplus acquisition year
CM cumulative 10 yearsplus acquisition year
1 Only accounts with repurchasing activity based on cohort specific retention rate (incl. fx-effects)2 Traffic acquisition costs per new account with repurchasing activity3 CM = contribution margin = net sales – all variable costs (excl. acquisition costs) = 9.6%
2018a+5
projecteda+10
projected
1,013 1,6921982018 net sales per account in EUR (cum.)1
(2017) (191) (1,017) (1,730)
(97) (164)(19)(2017)

Investor & Analyst Presentation - Annual Report 2018 | page 55
Strong profitability of repeat customers business invested to grow the business with long-term perspective
Repeat customers and new customers contribution (EUR m)
271 24% - 17 - 6.3%840 76% 21 + 2.5%
New customers(sales in the year of acquisition)
Repeat customers(consecutive year’s sales)
2017
Net
Sales
% of
total z+
EBT EBT-
margin
Net
Sales
% of
total z+
EBT EBT-
margin
293 22% - 23 - 7.8%1,049 78% 21 + 2.0%2018
+ 0.4% + 3.6%
H1 H2
2018

Investor & Analyst Presentation - Annual Report 2018 | page 56
� Competitive pricing
� Brand development
� Personalization & emotionalization
� Data / CRM opportunities:
− Stronger focus on customer-individual analyses in relation to sales frequency
− Intensified analyses of current share of wallet of customers and further potential
− Create additional sales from existing customers
� Logistics - last mile flexibility
Further initiatives planned to support retention
Key priorities

Customer acquisition

Investor & Analyst Presentation - Annual Report 2018 | page 58
135
174
202
253271
293
2013 2014 2015 2016 2017 2018
New customers sales (EUR m) and acquisition costs per new customer1 (EUR)
Growth of new customer business –acquisition costs rising
CAC1
Customer acquisition expected to continue to increase
24 18 18 15 19 28
» Price inflation in Google keywords (SEA)
» Limited growth of Google traffic
» Lower conversion in mobile
» Increasing new customer numbers
1 Per new account with
repurchasing activity
Investor & Analyst Presentation - Annual Report 2018 | page 59
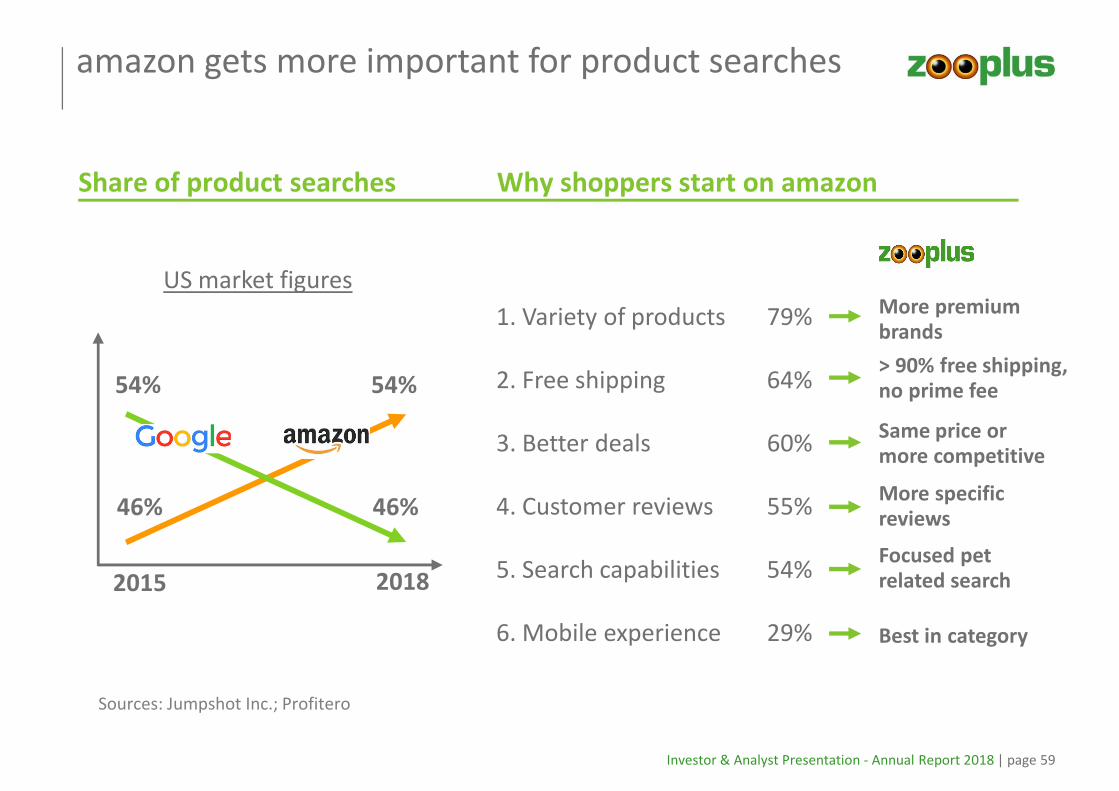
Share of product searches Why shoppers start on amazon
Sources: Jumpshot Inc.; Profitero
amazon gets more important for product searches
54%
46%
54%
46%
2015 2018
1. Variety of products 79%
2. Free shipping 64%
3. Better deals 60%
4. Customer reviews 55%
5. Search capabilities 54%
6. Mobile experience 29%
More premium brands
> 90% free shipping, no prime fee
Same price or more competitive
More specific reviews
Focused pet related search
Best in category
US market figures

Investor & Analyst Presentation - Annual Report 2018 | page 60
Development of Google shopping 2014-2019
Google shopping is today the dominant source for paid online traffic
Source: Merkle Inc.
0%
20%
40%
60%
80%
100%
2014 2014 2015 2015 2016 2016 2017 2017 2018 2018
Non-Brand Overall

Investor & Analyst Presentation - Annual Report 2018 | page 61
Google shopping ad spend UK
zooplus has already achieved the shift towards mobile
9.9% 8.1% 6.8% 5.0%
47.2%
16.1%
52.3%
14.9%
34.8%
50.5%
35.6%
67.6%
8.1%
25.3%
5.3%12.6%
Ad spend zooplus Clicks zooplus
Desktop
SEA
Desktop
shopping
Mobile
shopping
Mobile
SEA
Source: Adthena Search Advertising Report Q1 2018
Investor & Analyst Presentation - Annual Report 2018 | page 62
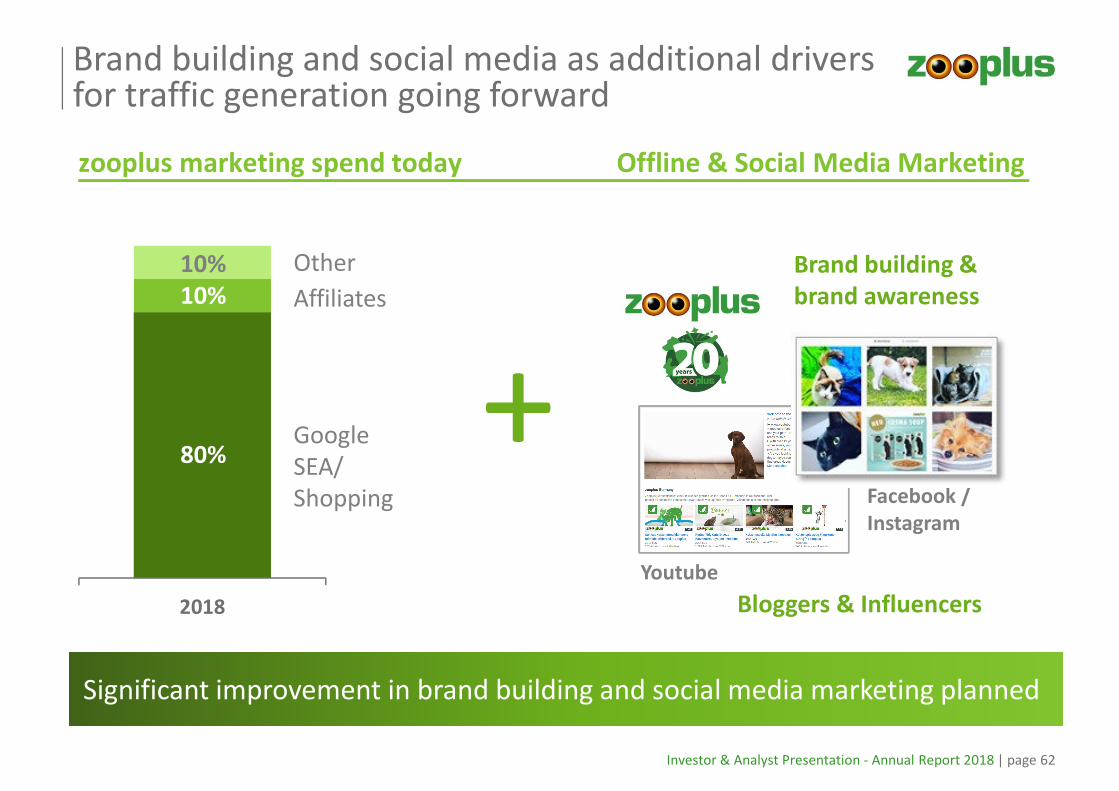
zooplus marketing spend today Offline & Social Media Marketing
Brand building and social media as additional drivers for traffic generation going forward
Bloggers & Influencers2018
SEA/
Shopping
Affiliates
Other
+
Brand building &
brand awareness
Youtube
Facebook /
Significant improvement in brand building and social media marketing planned
10%
10%
80%
Investor & Analyst Presentation - Annual Report 2018 | page 63
Key priorities
� Optimization of traffic conversion trough website improvements
� Ongoing improvement of mobile usage
� Additional ways of customer acquisition:
− Brand building
− Social Media
− Additional content
− Pet related services
New customer acquisition remains major focus for 2019 and beyond

Focus on mobile

Investor & Analyst Presentation - Annual Report 2018 | page 65
zooplus is a digital multi-channel retailer
» Mobile share of orders around 30% and growing
» Mobile will be the dominant channel in the future
» Own zooplus smartphone Apps (iOS and Android)
» Significant investment in mobile channel
» More technical features and optimized UX to come in future
» Online activities adapted to mobile usage

Investor & Analyst Presentation - Annual Report 2018 | page 66
Mobile channel has considerably increased its share and is continuing to grow
Visits
83 m
+28%
Visits
83 m
+28%
Order
share
App
+4%p
Order
share
App
+4%p
Orders
7.0 m
+61%
Orders
7.0 m
+61%
Note: TY 2018 figures, growth: 2018 vs. 2017
Mobile: traffic by mobile phones (incl. app)
Mobile business zooplus 2018 vs. 2017
Clear focus on mobile in all activities

Investor & Analyst Presentation - Annual Report 2018 | page 67
Desktop Tablet Mobile -
Web
Mobile -
App
KPIs – Mobile vs. desktop
Major KPIs (2018)
Desktop Tablet Mobile -
Web
Mobile -
App
38%43%
Desktop Tablet Mobile -
Web
Mobile -
App
22%
58%
21%
7%
Conversion rate
Visits Orders
Desktop Tablet Mobile -
Web
Mobile -
App
Basket value (in EUR)
56
51
8% 10%
16% 54
10% 11%
15%
57

Further business driver mid-term: Pet Services

Investor & Analyst Presentation - Annual Report 2018 | page 69
Pet services marketplace to create additional customer loyalty, differentiation and traffic
zooplus as the most relevant pet platform for products and pet related services
» Pet specialist – fulfilling all pet customer needs
» Differentiating versus amazon and smaller competitors
» Additional traffic generation
» Supported by manufacturer brands
Grooming
zooplus is the only European platform that can activate users on large scale
Breeders / shelters Day-walking
Veterinarians
Insurances
Other

Investor & Analyst Presentation - Annual Report 2018 | page 70
Vet search and vet ratings will be running in six major markets in Q2 2019
» Running in DE and PL, in FR, NL, IT, ES starting Q2 2019
» More than 30,000 vets connected to the platform
» Self-care tool for veterinarians to update and add content to their profiles
» User acceptance in DE for both user groups (pet owners and vets) above expectations
Vet search

Investor & Analyst Presentation - Annual Report 2018 | page 71
Vet search confirms interest for pet service marketplace – further steps planned for 2019
» Flexible multi-offer platform under development
» Better visibility and integration in zoopluswebsite
» Breeders / shelters as next development step
Mock-up: breeders
Example breeders

Gross margin

Investor & Analyst Presentation - Annual Report 2018 | page 73
Long-term gross margin decline halted
in % of sales
1 Sales – CoGS; years prior to 2018 adjusted from published
external figures to new IFRS 15
Gross margin1
2012 2013 2014 2015 2016 2017 2018
37.4%
30.6%32.3%
35.8%
28.7% 28.5% 28.7%
» Selective increase of product prices
» Limitation of discount / coupon usage
» Adjustment of shipping conditions and fees
» Promotion of private label brands
» Optimization of savings plan
Investor & Analyst Presentation - Annual Report 2018 | page 74
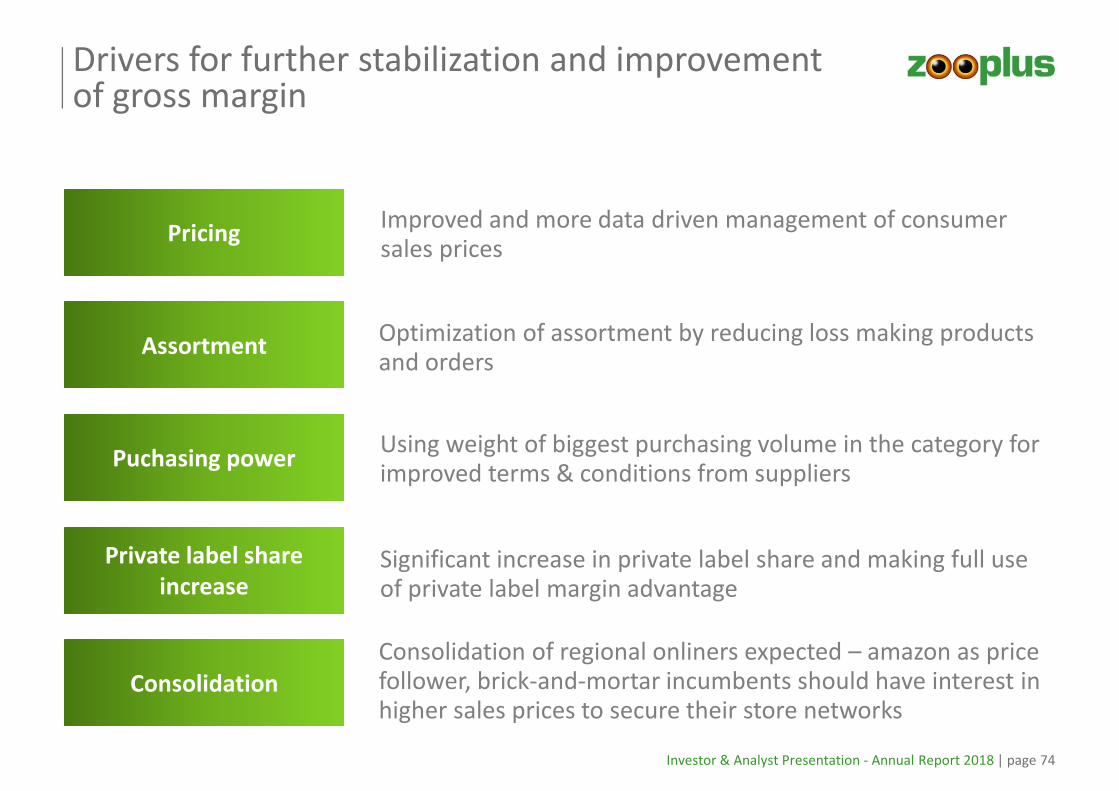
Drivers for further stabilization and improvement of gross margin
1Total
margin
Pricing
Puchasing power
Private label share
increase
Consolidation
Improved and more data driven management of consumer sales prices
Using weight of biggest purchasing volume in the category for improved terms & conditions from suppliers
Significant increase in private label share and making full use of private label margin advantage
Consolidation of regional onliners expected – amazon as price follower, brick-and-mortar incumbents should have interest in higher sales prices to secure their store networks
AssortmentOptimization of assortment by reducing loss making products and orders

Investor & Analyst Presentation - Annual Report 2018 | page 75
Margin stabilization – reducing non-profitable articles and orders
On order /article/ supplier level:
Non profitable orders significantly reduced in 2018
» Delisting of articles with negative contribution if no specific support from suppliers
» Adding surcharges like logistics fee for products with high logistics costs but low sales value
» Cutting off sales of orders that will never make a positive contribution margin

Branded suppliers

Investor & Analyst Presentation - Annual Report 2018 | page 77
zooplus is the most relevant online platform for pet specialist suppliers
zooplus USP
Suppliers need zooplus to distribute their brands across Europe online
» European market leader by far
» Pet specialist platform with more than 7 m customers
» The only retailer with real European-wide reach and
access to 30 country markets
» Pet specific environment, significantly more to come
» Biggest base of pet data
» Long-term the only real counterpart to amazon in the
online pet category

Investor & Analyst Presentation - Annual Report 2018 | page 78
zooplus has the biggest consumer pet database on a pan-European level
Data opportunity still to be explored
» Pet profiles
» Sales data
» Product mix analysis
» Behavioral data
» Brand shift data
» Health data
» Product reviews
Highly relevant for branded suppliers
Accessible only via zooplus
Full and representative coverage – unlike
offline loyalty cards
Potential for much deeper co-operation
with suppliers in future
Movie: 1st zooplus partner conference 2019

Private label

Investor & Analyst Presentation - Annual Report 2018 | page 81
Private label – leading private label operator in the pet specialist online category
Strategic view on private label business
» Strong focus on growing share of private label
» Positioned as products “exclusive to zooplus” – not simple me-too products
» Further portfolio expansion planned
» Margins superior to average of branded products
» Building private label next to expansion of supplier branded products
Sales growth
Improved terms and conditions with manufacturers
Making full use of margin advantage in P&L – today still in investment mode
Further expansion of private label margin:
1
2
3
14%Private label sales share of food and cat litter

Investor & Analyst Presentation - Annual Report 2018 | page 82
13% 14%Share of
total food & cat litter
1.5 1.6Growth index
private label / food
5% 6%Share of
first order sales
Online private label business gains traction and will continue to grow above average
Further significant increase in private label share planned for coming years
Figures for 2017 and 2018

Investor & Analyst Presentation - Annual Report 2018 | page 83
The single private label brands are designed for dedicatedtarget groups and reflect latest nutritional trends
Segment description:Dry food, wet food and snacks
Positioning: Wild and Free! Wolf of Wilderness has beenformulated to mimic the wild wolf´s diet
USP: High fresh meat content, grain-free, species
Target customer: Premium focused dog owners who look fornatural products with holistic concepts (grainless, berries etc.) and strong emotional messages
Price Positioning: Premium
Number of SKUs: 65

Investor & Analyst Presentation - Annual Report 2018 | page 84
New brands will continue to drive private label sales
Segment description:Wet and dry food for dogs and cats
Positioning: Dietetic complete pet food for adult cats and dogs
USP: Appropriate and need-based nutrition for themost frequent diagnosed medical conditions
Target customer: Dog and cat owners whose pets have specialdiseases and need according dietetic completefood
Price Positioning: Premium
Number of SKUs: 28 (wet & dry food)

Pan-European logistics infrastructure
Investor & Analyst Presentation - Annual Report 2018 | page 86
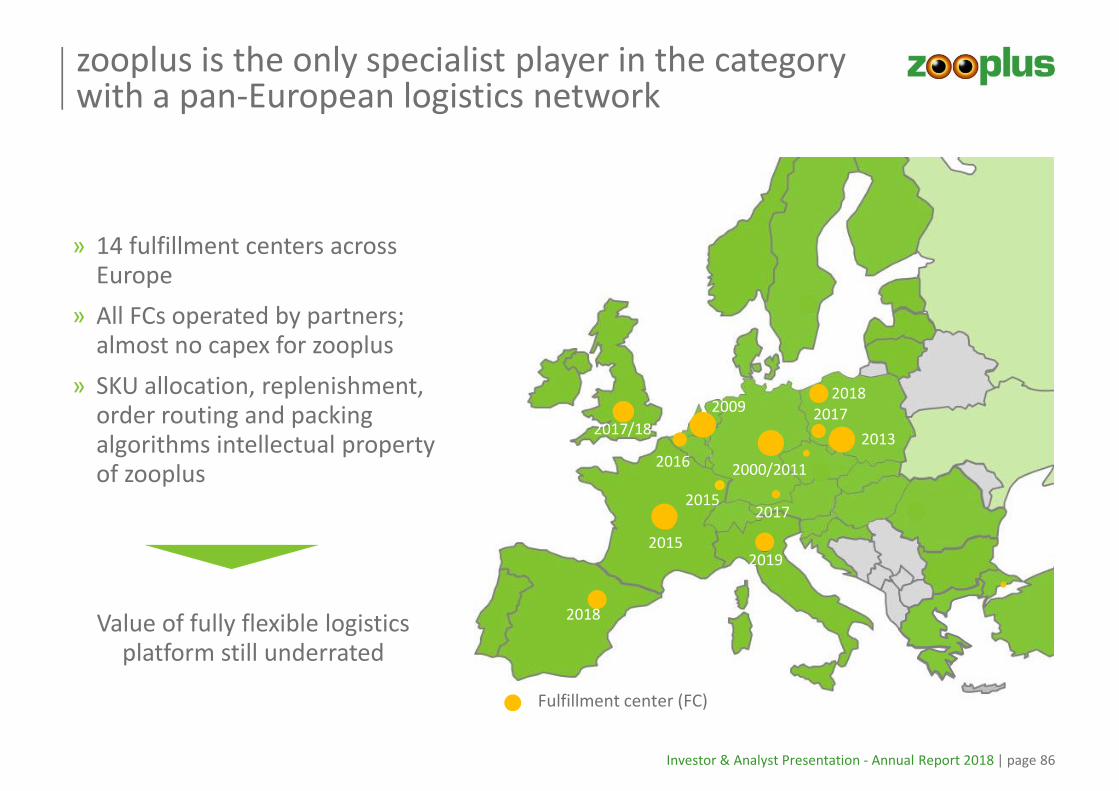
» 14 fulfillment centers across Europe
» All FCs operated by partners; almost no capex for zooplus
» SKU allocation, replenishment, order routing and packing algorithms intellectual property of zooplus
zooplus is the only specialist player in the category with a pan-European logistics network
2013
2015
Fulfillment center (FC)
2009
2015
2016
2017/18
2000/2011
2017
2017
2018
2019
2018Value of fully flexible logistics platform still underrated

Investor & Analyst Presentation - Annual Report 2018 | page 87
zooplus logistics – significant expansion of pan-European network in 2018
» Size of FC UK tripled in Q2 incurring
one-off costs and reduced efficiency
for transition period
» New FC Poland started end of
September 2018 – 40,000 sqm
» New FC Spain started in September
2018 – closing of white spot in
network and strong improvement of
delivery speed to customers
» New FC Spain operated by
4th FC partner – XPO Logistics
Coventry (UK)
Krosno (PL)
Madrid (ES)

Investor & Analyst Presentation - Annual Report 2018 | page 88
zooplus operates fulfillment centers with four logistics experts
Capex per center: € 20 – 35 m1) provided by partners
1) Including facility / building for big zooplus fulfillment centers
» Dirks (PL, UK)
» Rhenus (DE, NL, FR, PL)
» Katoen Natie (BE)
» XPO (ES)
» Experts in their field, exclusive for zooplus in pet category
» Synergies as logistics providers
» More flexibility and grip on costs for zooplus

Investor & Analyst Presentation - Annual Report 2018 | page 89
zooplus’ logistics structure is tailor-made for heavy and bulky products in inbound and outbound logistics
zooplus
logistics
Antwerp, Belgium Antwerp, Belgium
Tilburg, Netherlands Tilburg, Netherlands
Antwerp:
16,000 sqm
Logistics partner:
Katoen Natie
Source: zooplus
Investor & Analyst Presentation - Annual Report 2018 | page 90
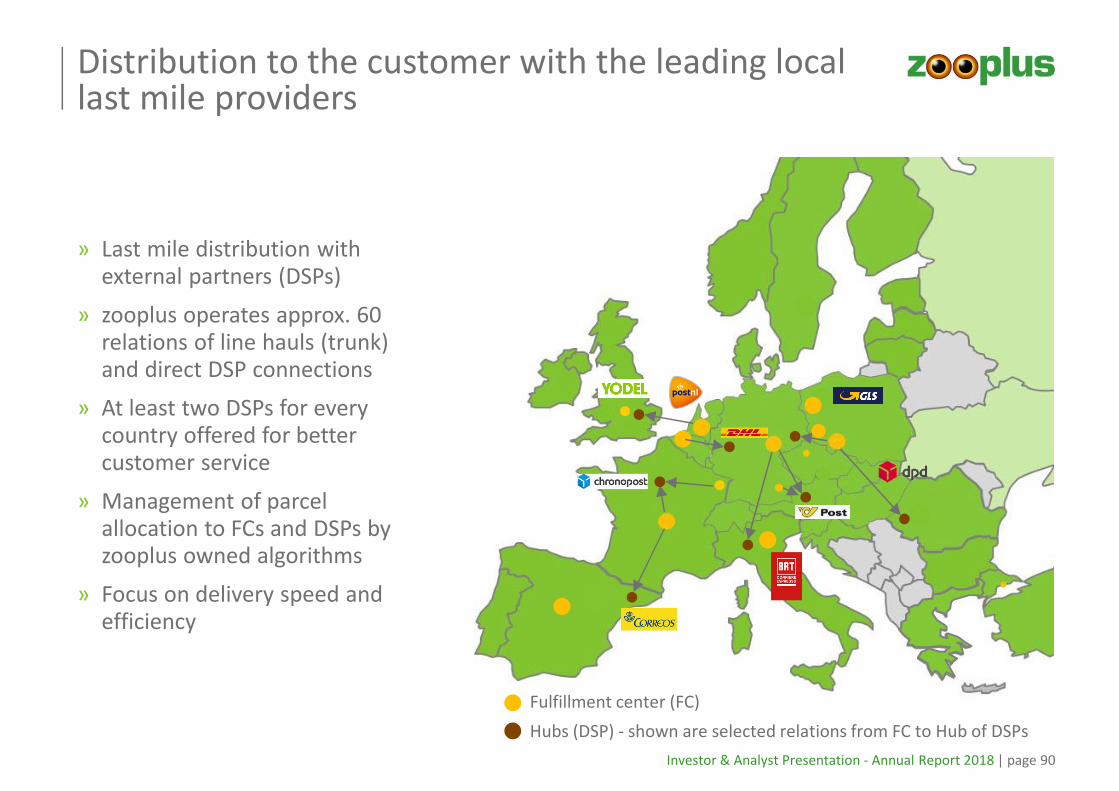
Distribution to the customer with the leading local last mile providers
» Last mile distribution with external partners (DSPs)
» zooplus operates approx. 60 relations of line hauls (trunk) and direct DSP connections
» At least two DSPs for every country offered for better customer service
» Management of parcel allocation to FCs and DSPs by zooplus owned algorithms
» Focus on delivery speed and efficiency
Fulfillment center (FC)
Hubs (DSP) - shown are selected relations from FC to Hub of DSPs
Investor & Analyst Presentation - Annual Report 2018 | page 91
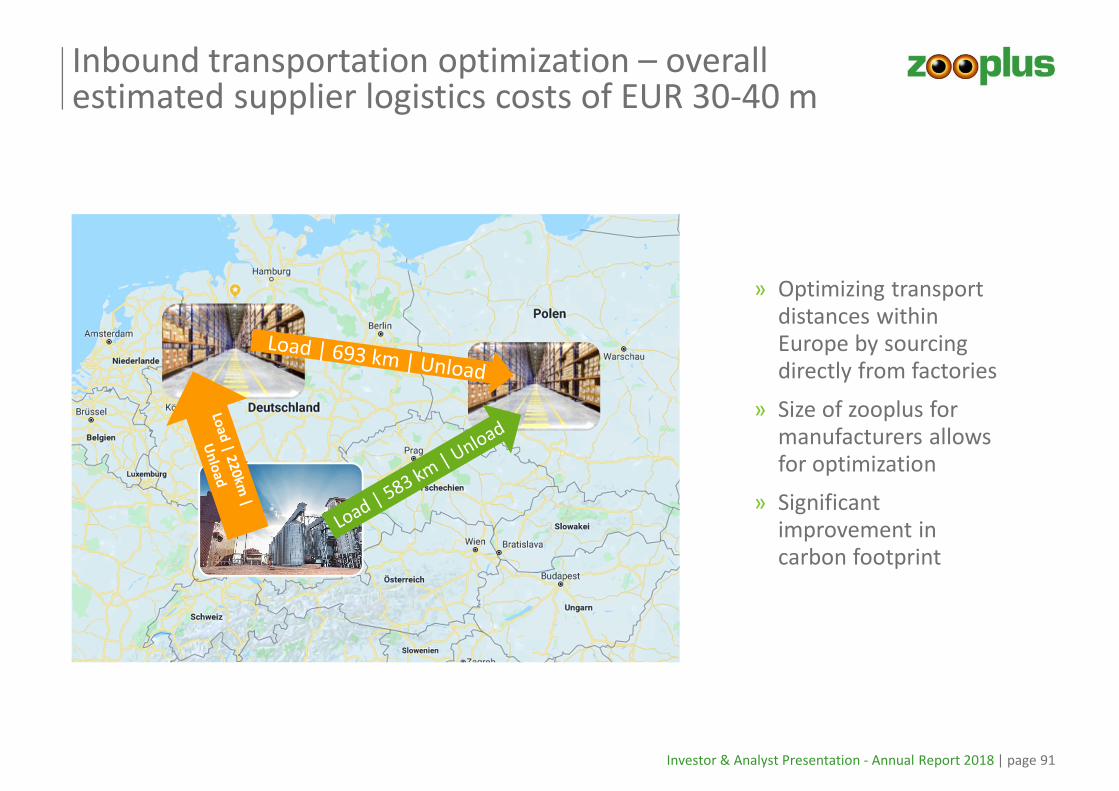
Inbound transportation optimization – overall estimated supplier logistics costs of EUR 30-40 m
» Optimizing transport distances within Europe by sourcing directly from factories
» Size of zooplus for manufacturers allows for optimization
» Significant improvement in carbon footprint

Investor & Analyst Presentation - Annual Report 2018 | page 92
Further development of logistics costs
Overall logistics cost expected to further decrease as percentage of sales
Unit cost for last mile expected to increase in 2019 in major markets due to capacity constraints of parcel service providers and increasing labor cost in this sector
Drivers for improvement in logistics costs:
Scale, efficiency and costs Value per parcel
» Significant additional FC capacity in Poland
» Efficiencies within network
» Optimization of line hauls
» Inbound optimization together with suppliers
» Reduction of parcel split ratio
» Increase of basket size
» Optimize thresholds for free delivery
» Charge additional fees to consumers
Investor & Analyst Presentation - Annual Report 2018 | page 93
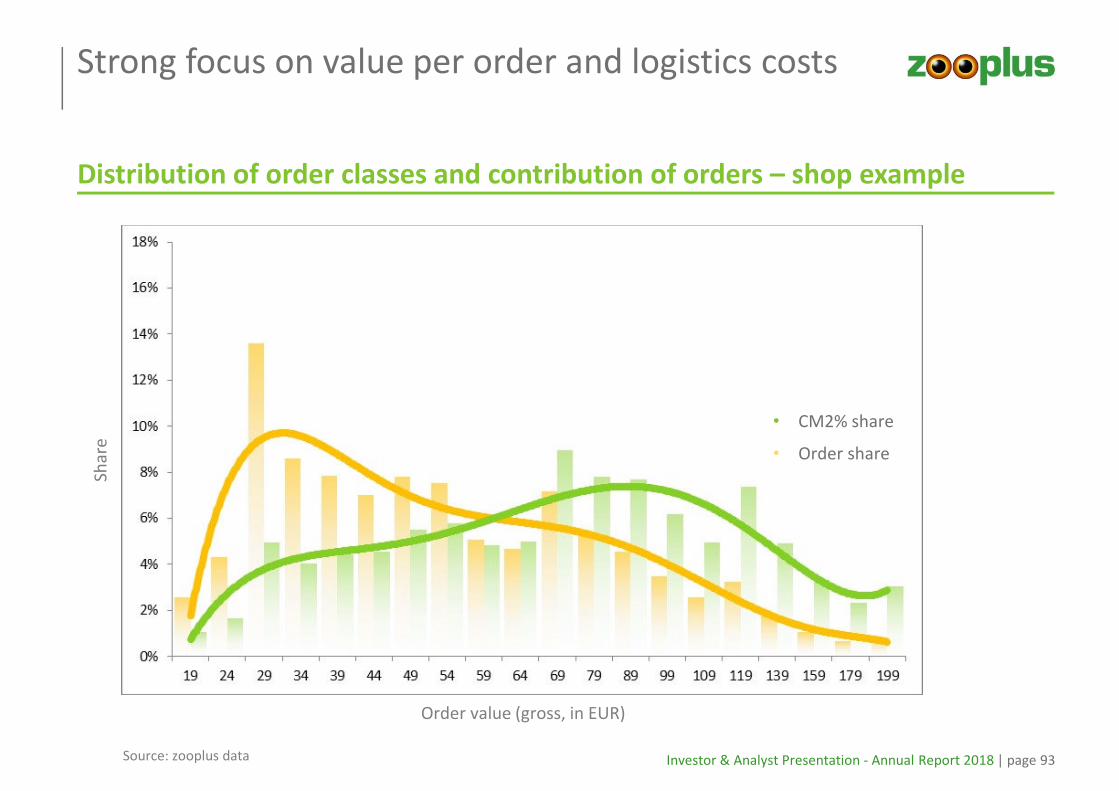
Strong focus on value per order and logistics costs
Distribution of order classes and contribution of orders – shop example
Source: zooplus data
Orders
Contribution
Order value (gross, in EUR)
Sha
re
• CM2% share
• Order share

Investor & Analyst Presentation - Annual Report 2018 | page 94
All order classes with positive contribution, however low order values with very high logistics costs
Development of logistics costs by order value – shop example
Source: zooplus data
Logistics costs in %
Logistics costs
Contribution
Order value (gross)
Log
isti
cs c
ost
s in
%
Logistics costs
Contribution
Logistics costs in %

IT infrastructure and resources

Investor & Analyst Presentation - Annual Report 2018 | page 96
Technology environment specifically designed for zooplus business model
» One central platform
» Mix of inhouse developed systems and standard systems
» SAP Finance for Accounting since 01/2017
» Central data warehouse on SAP Hana
» Inhouse developed algorithms for:
• Google bidding and listing management
• Replenishment and demand forecast
• Pricing
• Order routing
• Parcel building
• Systems monitoring
zooplus specific and scalable - differentiation factor

Investor & Analyst Presentation - Annual Report 2018 | page 97
Strong internal IT development teams as driving force for future developments and differentiation
Strong differentiating factor versus the competition1
Munich, DE Krakow, PL
Bucarest, RO
(External partner)Madrid, ES
» Four internal IT hubs plus one external hub
» More than 200 IT developers
» Additionally external experts as freelancers
» Focus on internal systems, processes & algorithms and product features
Vienna, AT
1 excluding amazon

Cost efficiency / Most efficient operator

Investor & Analyst Presentation - Annual Report 2018 | page 99
Continued focus on retention and sales growth as main drivers for future profitability
Retention
Sales growth
Margin & cost structure
Profitability
Sales growth means
» Keeping the competition including amazon at a distance
» Faster reach of dominant market position
» Better purchasing terms in all areas (COGS & other services)
» More efficiency gains
» More scale in overhead
Investor & Analyst Presentation - Annual Report 2018 | page 100
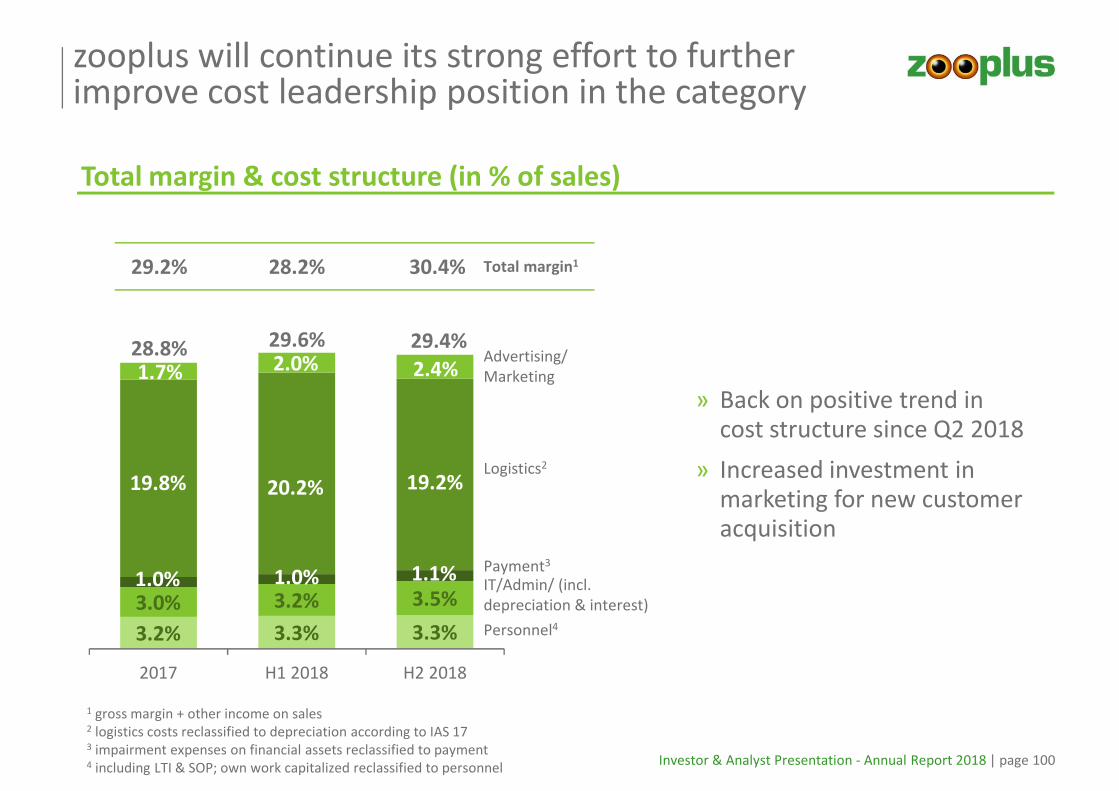
1 gross margin + other income on sales2 logistics costs reclassified to depreciation according to IAS 173 impairment expenses on financial assets reclassified to payment4 including LTI & SOP; own work capitalized reclassified to personnel
zooplus will continue its strong effort to further improve cost leadership position in the category
Total margin & cost structure (in % of sales)
3.2% 3.3% 3.3%
3.0% 3.2% 3.5%
19.8% 20.2% 19.2%
1.7% 2.0% 2.4%
2017 H1 2018 H2 2018
Total margin1
1.0% 1.0% 1.0%
28.8% 29.4%
1.1%IT/Admin/ (incl.
depreciation & interest)
Advertising/
Marketing
Logistics2
Personnel4
Payment3
29.2% 30.4%
29.6%
28.2%
» Back on positive trend in cost structure since Q2 2018
» Increased investment in marketing for new customer acquisition

Investor & Analyst Presentation - Annual Report 2018 | page 101
29%
45% 43%48%
54%
43% 42%
zooplus is clear cost leader in the category – both online and offline
Cost ratio - selected competitors
Source: annual reports 2017 – Fressnapf 2016: all costs except for costs of goods sold, including depreciation and interest; arcaplanet w/o interest
Cost advantage for zooplus of more than 10%-points

Investor & Analyst Presentation - Annual Report 2018 | page 102
Q & A

Guidance 2019

Investor & Analyst Presentation - Annual Report 2018 | page 104
Sales and profit guidance for full year 2019
zooplus well positioned to continue the sales growth pathin 2019
Guidance
1,342 (+21%) 8.6
EBITDA (EUR m)Sales (EUR m)
2019e
2018
+14% to +18%(+188 to +242)
10 - 30

Investor & Analyst Presentation - Annual Report 2018 | page 105
zooplus changes profit guidance 2019 to EBITDA as key indicator
» EBITDA shows more realistic picture of operating performance of the company
» New IFRS 16 standard treats lease / rent of logistics infrastructure similar to owning the infrastructure, therefore IFRS now allows for a better comparison of EBITDA performance between companies who own logistics infrastructure and those like zooplus that work with external service providers
» Up to now logistics costs of zooplus have always been overstated compared to most competitors in ecommerce who own logistics infrastructure
» Therefore with the change of IFRS 16, which requires a deeper analysis of structural changes in P&L and balance sheet, it is now a good moment to change to EBITDA profit guidance
» Impact of full application of IFRS 16 in 2019 for EBITDA is EUR +14 m vs. 2018 (all other things equal)
» EBITDA guidance of 10 to 30 m EUR translates into former EBT figure of EUR -15 to +5 m
Investor & Analyst Presentation - Annual Report 2018 | page 106
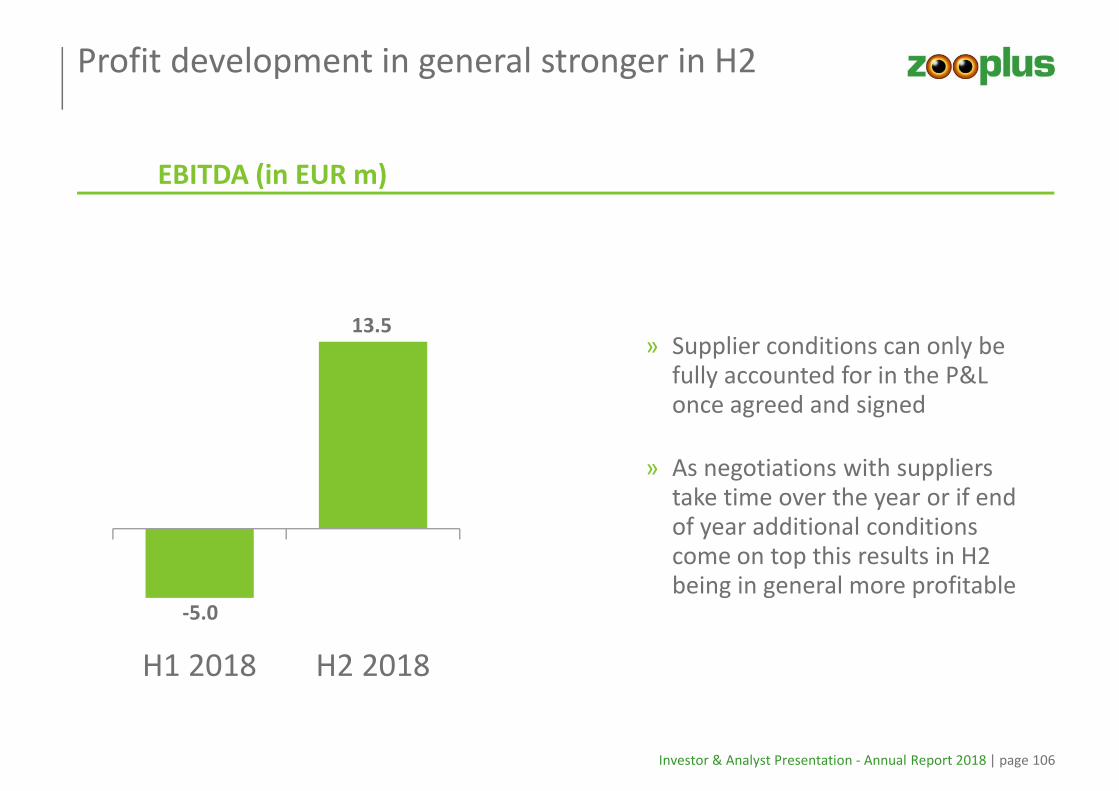
Profit development in general stronger in H2
» Supplier conditions can only be fully accounted for in the P&L once agreed and signed
» As negotiations with suppliers take time over the year or if end of year additional conditions come on top this results in H2 being in general more profitable
H1 2018 H2 2018
EBITDA (in EUR m)
13.5
-5.0

The way forward – 2019 and beyond

Investor & Analyst Presentation - Annual Report 2018 | page 108
The online share is expected to continue to grow significantly during the next years
Current online share and long-term hypothesis (EUR bn)
2014 2018
25 27
10-12%
88-90%
8-10%
Offline share
Online share
Total market (gross)
< 50%
Long-term
> 50%
> 33
Online market opportunity
> 16
Long-term growth potential of online leave enough growth potential for zooplus
4-5%
95-96%
1 zooplus estimation; assuming successful shift of pet food grocery segment to online
1
92-90%

Investor & Analyst Presentation - Annual Report 2018 | page 109
Focus will continue to be on sales growth – but not at any price
» 2 bn target for 2020 set in 2016 too ambitious from today’s perspective but will come only a bit later and growth will continue after 2 bn sales
» Overall competitive position, long-term growth perspective and outlook matter
» Clear market leadership
» Differentiation from amazon
» Customer loyalty
» Cost leadership
» Fully integrated pan-European logistics network
» Strategic relevance for suppliers178 245
319407
543
711
909
1,111
1,342
1,530-
1,584

Investor & Analyst Presentation - Annual Report 2018 | page 110
The moat around zooplus will only get stronger
Growing existing loyal customer base 1
More differentiation through pet related services platform
Cost advantage towards competition in the category both online and offline– further economies of scale
Getting even more relevant for the branded manufacturers (volume and data)
More differentiation versus amazon (assortment, private label, personalization,
emotionalization)
Unique flexible and pan-European logistics platform
2
3
4
5
6

Investor & Analyst Presentation - Annual Report 2018 | page 111
Strong drivers for gross margin stabilization and improvement over the next years
Pricing / Assortment Purchasing power
Private label share
increase Consolidation
1 2
3 4

Investor & Analyst Presentation - Annual Report 2018 | page 112
Over the next years zooplus will continue to drive down costs
» Additional efficiency gains in network
» Inbound logistics optimization
» Value per parcel focus
» Further scale expected
» Further scale expected
» Focus on IT, marketing & brand development and data analytics
Logistics
IT / Admin
Personnel
1
2
3

Investor & Analyst Presentation - Annual Report 2018 | page 113
zooplus will continue to invest in the business to improve market position and growth
» Defending high loyalty of existing customers
» Acquisition of new customers
» Increased investment into brand and non-Google marketing as well as mobile
» Improved product and user experience
» Improved internal processes and efficiency
» Close white spots in the distribution network and increase capacity
» Speed up and make delivery to customers more flexible
Competitive pricing
Marketing costs
IT product development
Private label
1
2
4
5
Logistics
3
» Expansion of private label share
» Development of new brands

Investor & Analyst Presentation - Annual Report 2018 | page 114
There are still big opportunities to explore in detail
Brand & Social Media
Pricing Data / CRM Private label
Opportunities
Pet services platform

Investor & Analyst Presentation - Annual Report 2018 | page 115
Structural profitability in the long run with 5-7% EBITDA margin
2018 EBITDA margin: 0.6% long-term target EBITDA impact
Gross margin: 28.7% 30% +1.3%p
Logistics: 19.7% 17% +2.7%p 1)
Overhead: 5.8% 4.0% +1.8%p
Marketing steady state: 2% +0.0%p
Total target potential: ~ 5- 6%p
Structural EBITDA margin 5 – 7%
1) thereof approx. +1%p from IFRS 16 change
Investor & Analyst Presentation - Annual Report 2018 | page 116
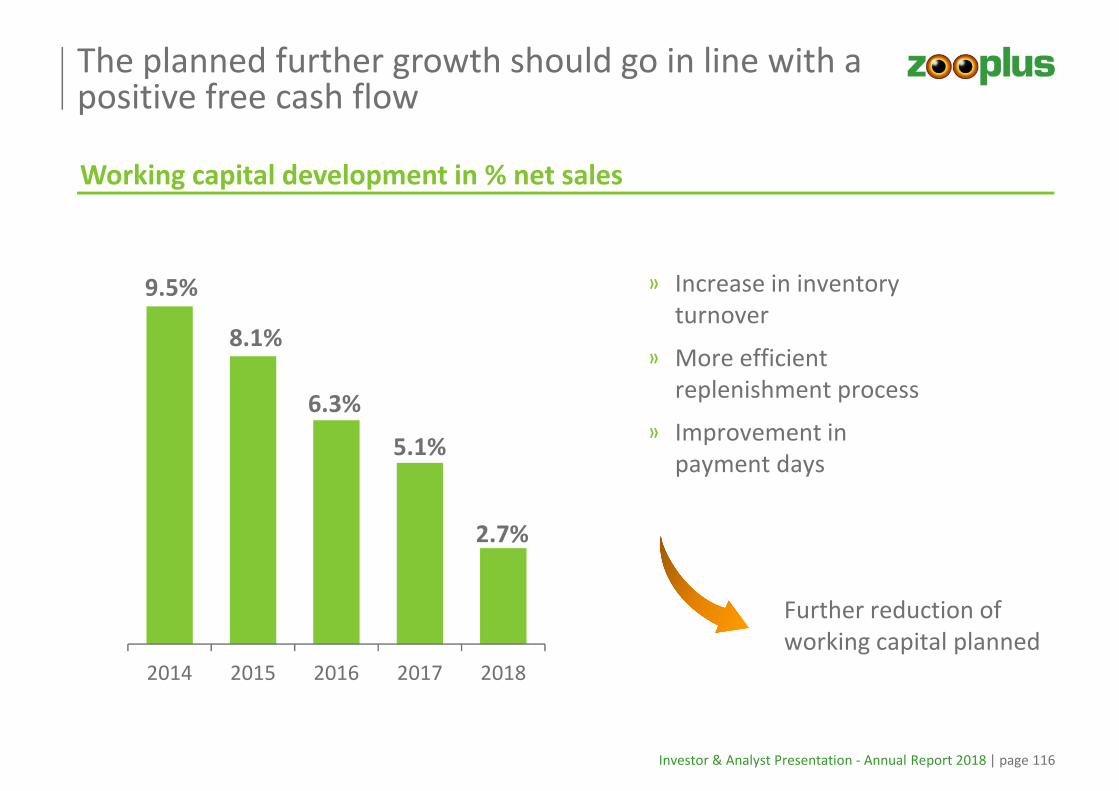
The planned further growth should go in line with a positive free cash flow
Working capital development in % net sales
9.5%
8.1%
6.3%
5.1%
2.7%
2014 2015 2016 2017 2018
» Increase in inventory
turnover
» More efficient
replenishment process
» Improvement in
payment days
Further reduction of
working capital planned

Investor & Analyst Presentation - Annual Report 2018 | page 117
Main takeaways from today’s presentation about zooplus’ strategic perspective
» Pet supplies continues to be a very attractive and growing market.
» zooplus is by far market leader online and already No. 2 in the total market. zooplus has a very loyal
and continuously growing customer base of around 7 m customers.
» Competition comes from amazon, brick-and-mortar and small regional onliners. Overall zooplus
competitive position today stronger than 12 months ago.
» Amazon is the major competitor but zooplus differentiates today significantly from amazon and
tomorrow even more. There is enough room for growth for a specialist next to the generalist amazon.
» zooplus has the most relevant platform for specialist pet supplies manufacturers and is the only
specialist platform in the category that can efficiently ship a parcel to any place in Europe.
» Sustainable new customer growth but not at any price continues to be priority for zooplus. Sales
growth might be slightly lower going forward but future outlook continues to be very positive.
» zooplus has a clear long-term perspective for future structural profitability of 5-7% EBITDA margin
with a stabilized / improved gross margin and further optimization of cost structure.
» Opportunities arise from brand development and social media marketing, pricing optimization,
private label share increase, more detailed data analysis especially for CRM and suppliers as well as
pet services platform integration to develop the most customer centric pet ecosystem in Europe.

Investor & Analyst Presentation - Annual Report 2018 | page 118
Q & A