investor presentation - dubaiaerospace.com · limitations of adjusted ebitda, ... atr72 -600 50 5...
TRANSCRIPT
Investor PresentationResults for the three months ended 31 March, 2018
22 May, 2018
PROPRIETARY & CONFIDENTIAL
© Dubai Aerospace Enterprise
Disclaimer | Forward Looking Statements
2
IMPORTANT NOTICE
This Presentation contains information that is proprietary and/or confidential in nature. Each recipient agrees (i) to treat this Presentation and the information contained herein in a confidential manner, (ii) to use this Presentation and such information only in connection with an evaluation of Dubai Aerospace Enterprise (DAE) Ltd (the "Company" or “DAE") and/or its subsidiaries and affiliates, and (iii) that this Presentation and such information shall not be divulged to any person or entity or reproduced, disseminated or disclosed by the recipient, directly or indirectly, in whole or in part, without the prior written consent of the Company.
Each recipient agrees not to (i) purchase or sell securities in violation of United States securities laws which, among other things, restrict any person who has material, non‐public information about a company from purchasing or selling securities of such company (and options, warrants and rights relating thereto), or (ii) communicate such information to any other person under circumstances in which it is reasonably foreseeable that such person is likely to purchase or sell such securities.
This Presentation is not intended as an offer to sell, or the solicitation of an offer to purchase, any security, the offer and/or sale of which can only be made by definitive offering documentation which will contain material information that is not set forth herein.
Nothing in this Presentation should be construed as a recommendation to invest in any securities that may be issued by DAE and/or any of its subsidiaries or affiliates or as legal, accounting, financial, tax or other advice. DAE is not acting as an advisor or fiduciary in any respect in connection with providing this Presentation.
Neither DAE nor any subsidiary or affiliate of DAE makes any representation or warranty, express or implied, as to the accuracy or completeness of the information contained herein, including as to the accuracy of any estimates or projections. All opinions included in this Presentation constitute DAE's judgment as of the date of this Presentation and are subject to change at any time without notification and at the sole discretion of DAE. Although DAE reserves the right to modify, revise and reissue this Presentation, DAE undertakes no obligation to provide the recipient with access to any additional information or to update any information contained in this Presentation.
Cautionary Statement Concerning Forward-Looking Statements
Certain information contained in this Presentation may constitute "forward-looking statements" which can be identified by the use of forward-looking terminology such as "may", "will", "should", “could”, “continue”, "expect", "anticipate", “predict”, "project", “plan”, "estimate", “budget”, “assume”, “potential”, “future”, "intend" or "believe" or the negatives thereof or other comparable terminology. These statements reflect DAE’s current expectations regarding future events, results or outcomes and are not guarantees of future results or financial condition. Actual results, performance, achievements or conditions may differ materially from those in the forward‐looking statements as a result of a number of factors, many of which are beyond DAE’s control.
Non-IFRS Financial Information
This Presentation may include certain non-IFRS financial information, such as Adjusted EBITDA, not prepared in accordance with IFRS. Because of the limitations of Adjusted EBITDA, it should not be considered as a substitute for financial information prepared or determined in accordance with IFRS, as applicable. Where applicable, DAE compensates for these limitations by relying primarily on its IFRS results and using Adjusted EBITDA only for supplemental purposes.

© Dubai Aerospace Enterprise
DAE At A Glance | March 2018
~$10.3bnDebt Outstanding March 2018
Scale Competitor (1) $15bn+of Assets
World Class Platform 32 Years
Successful Track Record
138 People (4)
Across 6 Locations
1. As of Q1 2018
2. Combined fleet included owned, managed and committed aircraft
3. Weighted by Net Book Value (“NBV”) of the owned fleet only
4. Excludes Joramco
5. Includes consolidated ICD ownership
56Countries of Client Presence
Long-standing
Global Customer
Relationships (2)
112Airline Customers
Balanced Portfolio (3)56%
Narrow
Bodies
37%Wide
Bodies
7%ATR 72-600
4
Strategic, Long-term
Ownership~96%
Owned by Investment Corporation of Dubai (5)
3
382Aircraft (2)
Total Fleet
Based in DIFCRobust Legal Framework
Diversified Funding Sources(1) 75Lenders
140+Investors
18Countries
Europe 19%
Americas 14%
35% MEASA
32% Asia Pacific
© Dubai Aerospace Enterprise
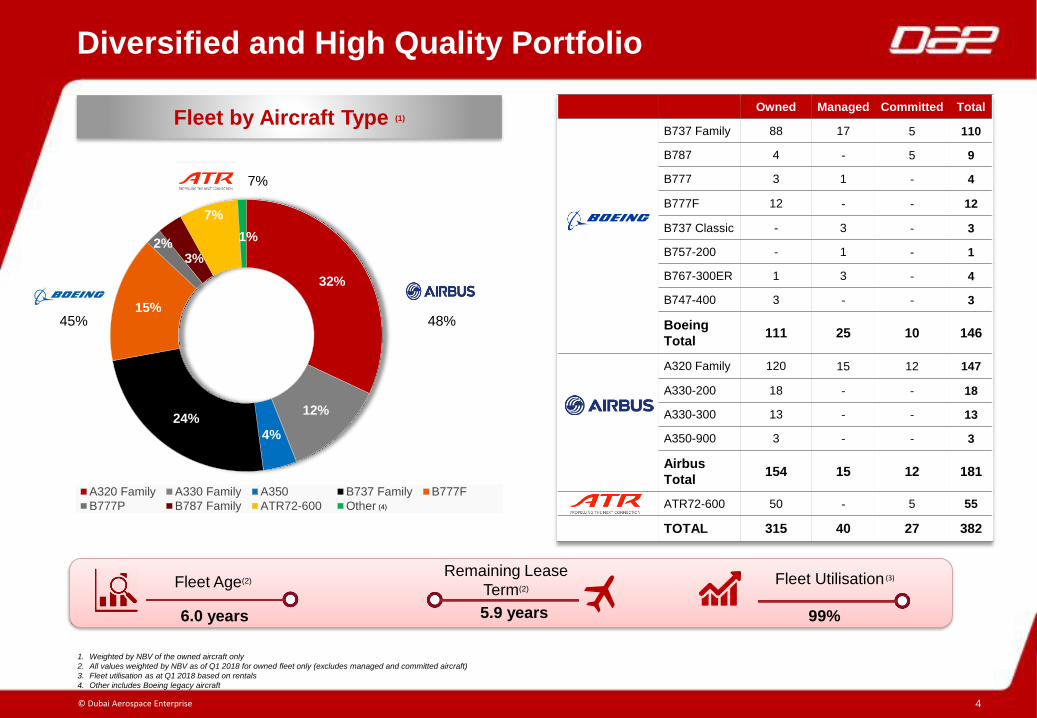
Diversified and High Quality Portfolio
1. Weighted by NBV of the owned aircraft only
2. All values weighted by NBV as of Q1 2018 for owned fleet only (excludes managed and committed aircraft)
3. Fleet utilisation as at Q1 2018 based on rentals
4. Other includes Boeing legacy aircraft
4
Fleet Age(2)Remaining Lease
Term(2)
6.0 years
Fleet Utilisation (3)
Owned Managed Committed Total
B737 Family 88 17 5 110
B787 4 - 5 9
B777 3 1 - 4
B777F 12 - - 12
B737 Classic - 3 - 3
B757-200 - 1 - 1
B767-300ER 1 3 - 4
B747-400 3 - - 3
Boeing
Total111 25 10 146
A320 Family 120 15 12 147
A330-200 18 - - 18
A330-300 13 - - 13
A350-900 3 - - 3
Airbus
Total154 15 12 181
ATR72-600 50 - 5 55
TOTAL 315 40 27 382
5.9 years 99%
32%
12%
4%
24%
15%
2%3%
7%
1%
A320 Family A330 Family A350 B737 Family B777F
B777P B787 Family ATR72-600 Other
Fleet by Aircraft Type (1)
(4)
45% 48%
7%

© Dubai Aerospace Enterprise
Global Customer Relationships
Notes:
1. All values by NBV, as of 31 March, 2018. Includes owned aircraft only
Americas
14%
No customer constitutes more than 15% of total fleet size (1)
Top 10 customers account for approximately 39% of fleet (1)
5
Asia Pacific
32%
Europe
19%
MEASA
35%
Top 10 Countries
1United Arab
Emirates
2 Russia
3 India
4 Vietnam
5 Japan
6 China
7 Indonesia
8 Brazil
9 USA
10 Ethiopia
Top 10 Customers
1 Emirates
2 Vietnam Airlines
3 Aeroflot
4 Ethiopian Airlines
5 Egyptair
6 Azul
7 Philippine Airlines
8 Garuda Indonesia
9 Aegean Airlines
10 Vivaaerobus

© Dubai Aerospace Enterprise 6
Financial Highlights for Q1 2018
Note:
• Q1 2018 results - results for the three months ended 31 March, 2018
• All figures are rounded for presentation purposes
Profit & Loss (USD $m) Q1 2018 Q1 2017 Variance
Total revenue 352.4 113.1 239.3
Total expenses (176.2) (68.6) (107.6)
Profit from operating activities 176.2 44.5 131.7
Net finance costs (66.3) (27.8) (38.5)
Income tax expense (13.9) 12.7 (26.6)
Profit for the period 96.0 29.4 66.6
Unrealised gain on interest rate hedges 2.5 0.3 2.2
Total comprehensive income for the period 98.5 29.7 68.8
Adjusted EBITDA 315.5 85.6 229.9
% Fixed lease revenue
87.2%
Adjusted EBITDA margin
90%
G&A as % of revenue
6.6%
Revenue Analysis (USD $m) Q1 2018 Q1 2017 Variance
Lease revenue 335.2 99.3 235.9
Engineering - Joramco 16.2 13.8 2.4
Other Income 1.0 0.0 1.0
Total Revenue 352.4 113.1 239.3
% Revenue – Top 5 customers
28%
© Dubai Aerospace Enterprise
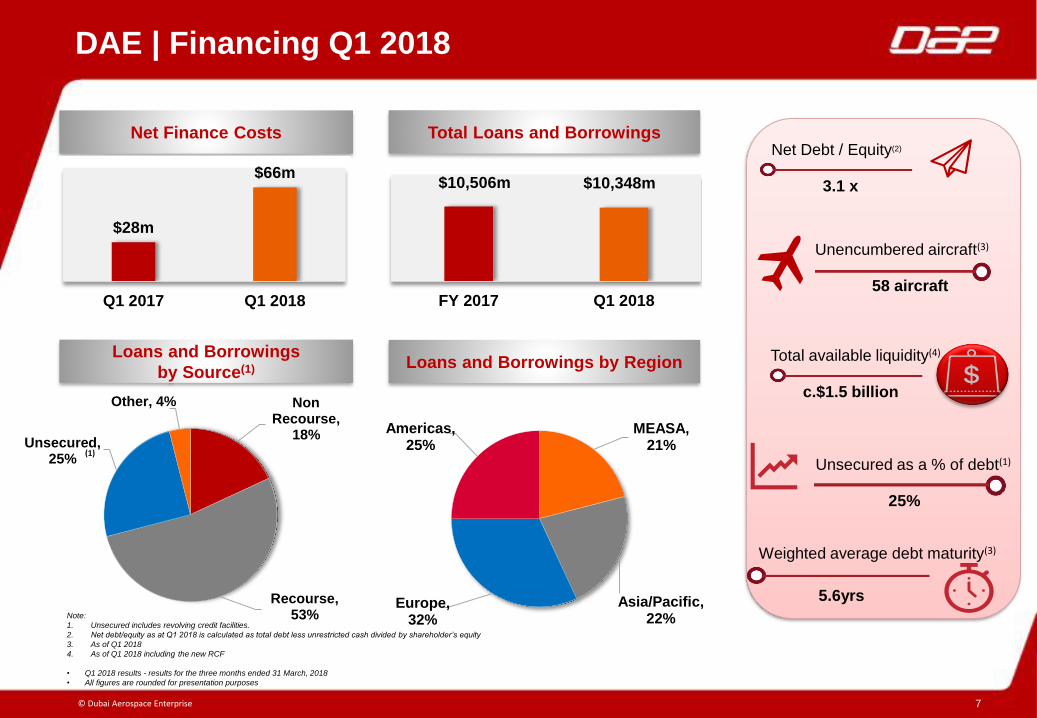
Net Finance Costs Total Loans and Borrowings
7
DAE | Financing Q1 2018
Note:
1. Unsecured includes revolving credit facilities.
2. Net debt/equity as at Q1 2018 is calculated as total debt less unrestricted cash divided by shareholder’s equity
3. As of Q1 2018
4. As of Q1 2018 including the new RCF
• Q1 2018 results - results for the three months ended 31 March, 2018
• All figures are rounded for presentation purposes
Non Recourse,
18%
Recourse, 53%
Unsecured, 25%
Other, 4%
$28m
$66m
Q1 2017 Q1 2018
MEASA, 21%
Asia/Pacific, 22%
Europe, 32%
Americas, 25%
$10,506m $10,348m
FY 2017 Q1 2018
(1)
Loans and Borrowings
by Source(1) Loans and Borrowings by Region Total available liquidity(4)
c.$1.5 billion
Unencumbered aircraft(3)
58 aircraft
Unsecured as a % of debt(1)
25%
Weighted average debt maturity(3)
5.6yrs
Net Debt / Equity(2)
3.1 x
© Dubai Aerospace Enterprise 8
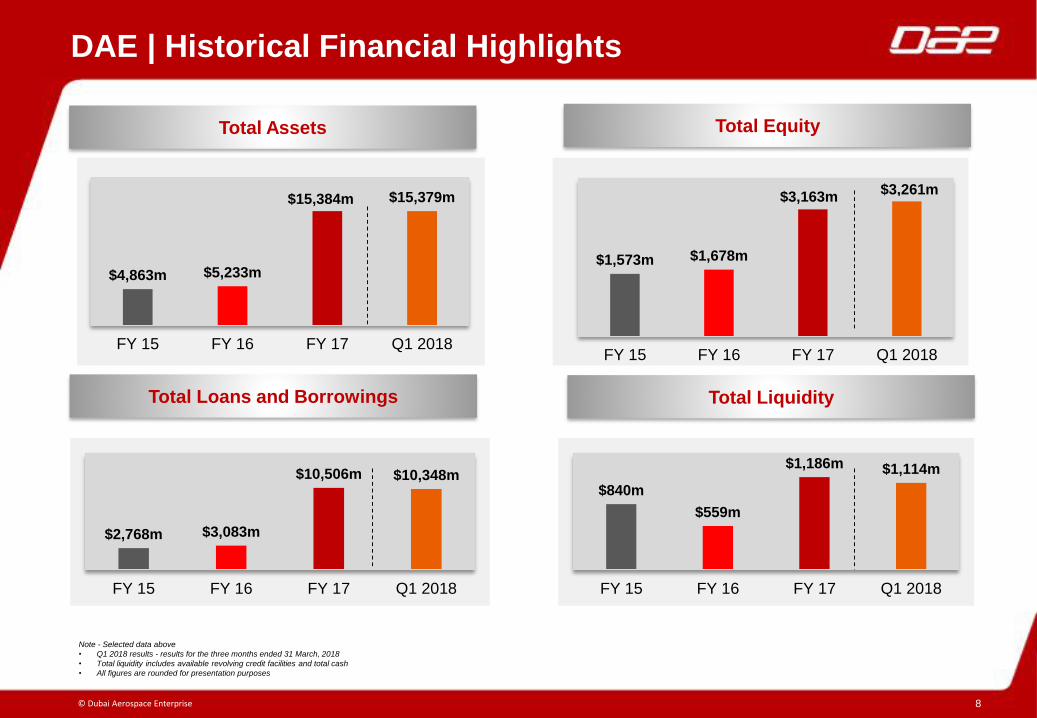
DAE | Historical Financial Highlights
Note - Selected data above
• Q1 2018 results - results for the three months ended 31 March, 2018
• Total liquidity includes available revolving credit facilities and total cash
• All figures are rounded for presentation purposes
$2,768m $3,083m
$10,506m $10,348m
FY 15 FY 16 FY 17 Q1 2018
$4,863m $5,233m
$15,384m $15,379m
FY 15 FY 16 FY 17 Q1 2018
$840m
$559m
$1,186m $1,114m
FY 15 FY 16 FY 17 Q1 2018
$1,573m $1,678m
$3,163m$3,261m
FY 15 FY 16 FY 17 Q1 2018
Total Assets Total Equity
Total Loans and Borrowings Total Liquidity

© Dubai Aerospace Enterprise 9
Integration Completed – Leadership Team

© Dubai Aerospace Enterprise
Summary
Summary
10
1Q2018 – strong quarter. Reflective of earnings power of the franchise
Integration behind us. Organisation running as one company
OEM order – not likely in the near-term
Significant disconnect between current market rentals and OEM price expectations
Financing activity:
Large unsecured revolving credit facility announced May 21
Term loan B
144A and Sukuk – 2H 2018 or 2019 depending on market conditions
Strong Trading quarter – deals expect to firm up in 2H.

© Dubai Aerospace Enterprise
As at
Consolidated balance sheet data (USD $m) (Extract) 31-Mar-18 31-Dec-17 Variance
Total cash and cash resources 605.2 724.0 (118.8)
Aircraft held for lease 12,127.4 12,050.3 77.1
Total assets held-for-sale 0.0 11.2 (11.2)
Total assets 15,378.8 15,383.8 5.0
Total equity 3,261.3 3,162.8 98.5
Total loans and borrowings 10,348.2 10,505.9 (157.7)
Total equity and liabilities 15,378.8 15,383.8 5.0
Comparative period 31 December, 2017
As at
Cashflow data (USD $m) Q1 2018 Q1 2017 Variance
Net cash from operating activities 296.9 99.7 197.2
Net cash (used in)/from investing activities (203.4) 380.9 (584.3)
Net cash used in financing activities (211.5) (92.7) (118.8)
Net (decrease)/increase in cash and cash equivalents (118.0) 388.0 (506.0)
Cash and cash equivalents at the beginning of the period 369.9 94.7 275.2
Cash and cash equivalents 251.9 482.6 (230.7)
11
Appendix - Balance Sheet and Cash Flow Statement | March 2018
Note:
• Q1 2018 results - results for the three months ended 31 March, 2018
• All figures are rounded for presentation purposes

© Dubai Aerospace Enterprise 12