investor presentation going global equita infrastructure day · going global 2017 –2021 strategic...
TRANSCRIPT

Going Global2017 – 2021 Strategic Plan
January 2018
Investor PresentationEquita Infrastructure Day
“
”

This document (the “document”) has been prepared by ASTM Group and SIAS Group (the “companies”) for the sole purpose described herein. Under no condition should it be interpreted as an offer or
invitation to sell or purchase or subscribe to any security issued by the companies or its subsidiaries.
The content of this document is of purely informative and provisional nature and the statements contained herein have not been independently verified. Certain figures included in this document have been
subject to rounding adjustments; accordingly, figures shown for the same category presented in different tables may vary slightly and figures shown as totals in certain tables may not be an arithmetic
aggregation of the figures which precede them.
This document contains forward-looking statements, including (but not limited to) statements identified by the use of terminology such as "anticipates", "believes", "estimates", "expects", "intends", "may",
"plans", "projects", "will", "would" or similar words. These statements are based on the companies’ current expectations and projections about future events and involve substantial uncertainties. All
statements, other than statements of historical fact, contained herein regarding the companies’ strategy, goals, plans, future financial position, projected revenues and costs or prospects are forward-looking
statements. Forward-looking statements are subject to inherent risks and uncertainties, some of which cannot be predicted or quantified. Future events or actual results could differ materially from those set
forth in, contemplated by or underlying forward-looking statements. Therefore, you should not place undue reliance on such forward-looking statements.
The companies do not undertake any obligation to publicly update or revise any forward-looking statements. The companies have not authorized the making or provision of any representation or
information regarding the companies or their subsidiaries other than as contained in this document. Any such representation or information should not be relied upon as having been authorized by the
companies.
Each recipient of this document shall be taken to have made their own investigation and appraisal of the condition (financial or otherwise) of the companies and their subsidiaries.
Neither the companies nor any of their representatives shall accept any liability whatsoever (whether in negligence or otherwise) arising from the use of this document.
This document may not be reproduced or redistributed, in whole or in part, to any other person.
DISCLAIMER
January 2018
2

3
Group Overview
Regulatory Framework
Strategic Plan Update
Final Remarks
1 2 5 6
SUMMARY
January 2018
Ecorodovias Financials
Results
3EPC
Itinera
4
ASTM and SIAS: a growth story in a stable regulatory framework with a
strong free cash flow generation

Group Overview1
4
January 2018

Strategic Plan Update
Final Remarks
Ecorodovias Financials
Results
EPCItinera
5
SIAS GROUP STRUCTURE
Group Overview
Regulatory Framework
January 2018
Gavio Family
Business Unit
Engineering
(SINA)
Business Unit
EPC
(Itinera2)
63.41%(6)7%
63.3% 1
(1) Including pro rata ASTM treasury shares(2) Itinera shareholding structure: 66.2% ASTM, 33.8% SIAS Group (3) As of 31/12/17(4) ASTM and SIAS indirectly own 46.7% of Ecordovias (18.7% trough SIAS and 28% trough ASTM)(5) 20% stake in Road Link(6) Including stake held by SINA
Direct Investments Equity Investments4 5
Business UnitTechnology (Sinelec)
Business Unit Toll Roads
~98% of Group EBITDA
ASTM Market Cap3: € 2,430m
SIAS Market Cap3: € 3,679m

Strategic Plan Update
Final Remarks
Ecorodovias Financials
Results
EPCItinera
6
Growth TrackRecord
Main Historical M&A deals
Group Overview
Regulatory Framework
January 2018
SIAS Group past growth strategy has always been characterized by various value accretive deals (acquisitions, equity subscriptions and tenders) while maintaining a solid, sustainable and conservative financial profile
1) Assets held together with Atlantia and Mediobanca and disposed of in 20122) Assets held together with Atlantia, sold in 20123) Assets sold in 2017
20092006 2012 2013 2014 2015 2016 2018
COSTANERA NORTE & AMB(1)
AcquisitionSecondary Market
43Km
VESPUCIO SUR, NORORIENTE &
LITORAL CENTRAL(2)
AcquisitionSecondary Market
146Km
TE
Equity SubscriptionPrimary Market
32 Km
ATS
AcquisitionSecondary Market
131 Km
SIAS PARKING(3)
AcquisitionSecondary Market
11,5K parking lots
AUTOVIA PADANA
TenderPrimary Market
112 Km
RODOANEL NORTE
TenderPrimary Market
48Km
ECORODOVIAS
AcquisitionSecondary Market
1,792Km
Strategic Plan Update
Final Remarks
Ecorodovias Financials
Results
EPCItinera
7
Financial Results
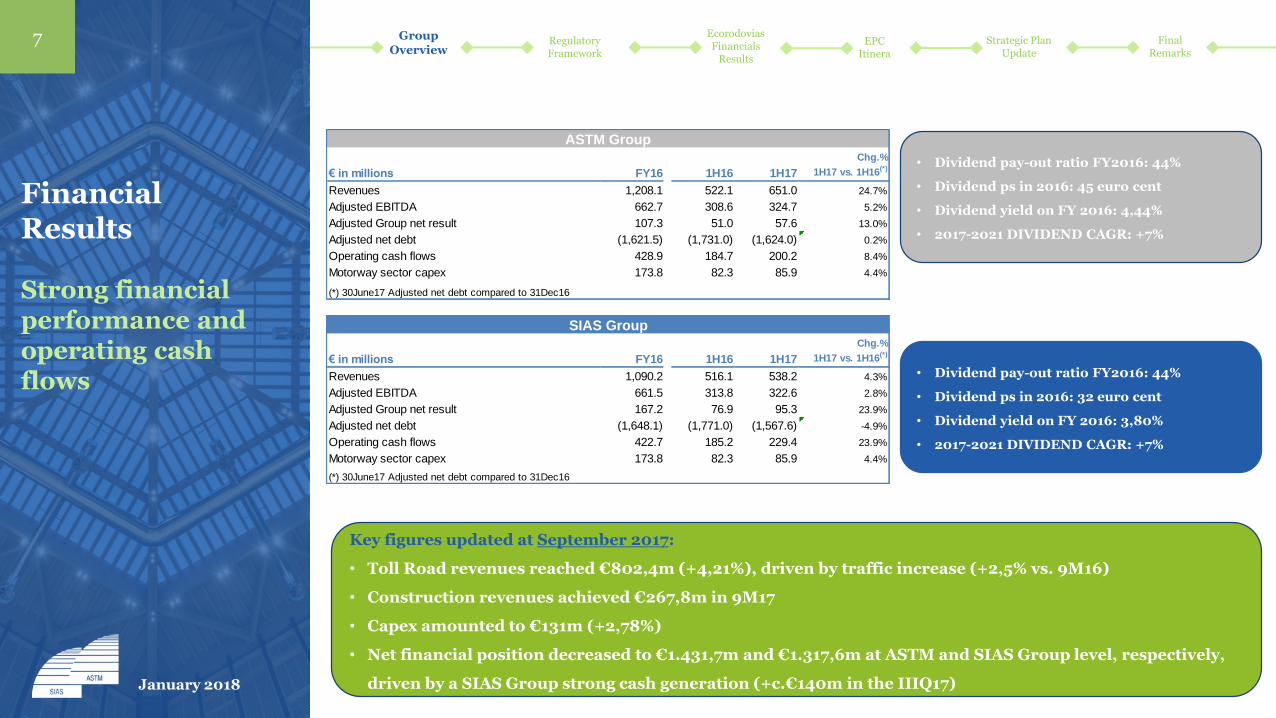
Strong financial performance and operating cash flows
Group Overview
Regulatory Framework
• Dividend pay-out ratio FY2016: 44%
• Dividend ps in 2016: 45 euro cent
• Dividend yield on FY 2016: 4,44%
• 2017-2021 DIVIDEND CAGR: +7%
• Dividend pay-out ratio FY2016: 44%
• Dividend ps in 2016: 32 euro cent
• Dividend yield on FY 2016: 3,80%
• 2017-2021 DIVIDEND CAGR: +7%
Key figures updated at September 2017:
• Toll Road revenues reached €802,4m (+4,21%), driven by traffic increase (+2,5% vs. 9M16)
• Construction revenues achieved €267,8m in 9M17
• Capex amounted to €131m (+2,78%)
• Net financial position decreased to €1.431,7m and €1.317,6m at ASTM and SIAS Group level, respectively,
driven by a SIAS Group strong cash generation (+c.€140m in the IIIQ17)
€ in millions FY16 1H16 1H17
Chg.%
1H17 vs. 1H16(*)
Revenues 1,208.1 522.1 651.0 24.7%
Adjusted EBITDA 662.7 308.6 324.7 5.2%
Adjusted Group net result 107.3 51.0 57.6 13.0%
Adjusted net debt (1,621.5) (1,731.0) (1,624.0) 0.2%
Operating cash flows 428.9 184.7 200.2 8.4%
Motorway sector capex 173.8 82.3 85.9 4.4%
(*) 30June17 Adjusted net debt compared to 31Dec16
ASTM Group
€ in millions FY16 1H16 1H17
Chg.%
1H17 vs. 1H16(*)
Revenues 1,090.2 516.1 538.2 4.3%
Adjusted EBITDA 661.5 313.8 322.6 2.8%
Adjusted Group net result 167.2 76.9 95.3 23.9%
Adjusted net debt (1,648.1) (1,771.0) (1,567.6) -4.9%
Operating cash flows 422.7 185.2 229.4 23.9%
Motorway sector capex 173.8 82.3 85.9 4.4%
(*) 30June17 Adjusted net debt compared to 31Dec16
SIAS Group
January 2018

Strategic Plan Update
Final Remarks
Ecorodovias Financials
Results
EPCItinera
8 Group Overview
Regulatory Framework
477,3
20,5 18,4
516,1500,3
20,7 17,2
538,2
0,0
100,0
200,0
300,0
400,0
500,0
600,0
MotorwaySector
TechnologySector
Other Total
1H16-1H17 Revenues
1H16Actual
1H17Actual
SIAS GROUPASTM GROUP
Financial Results
1H17 positive performance was driven by Motorway Sector (EBITDA: +5,6%)
January 2018
Strategic Plan Update
Final Remarks
Ecorodovias Financials
Results
EPCItinera
9
Italian TollRoad Network
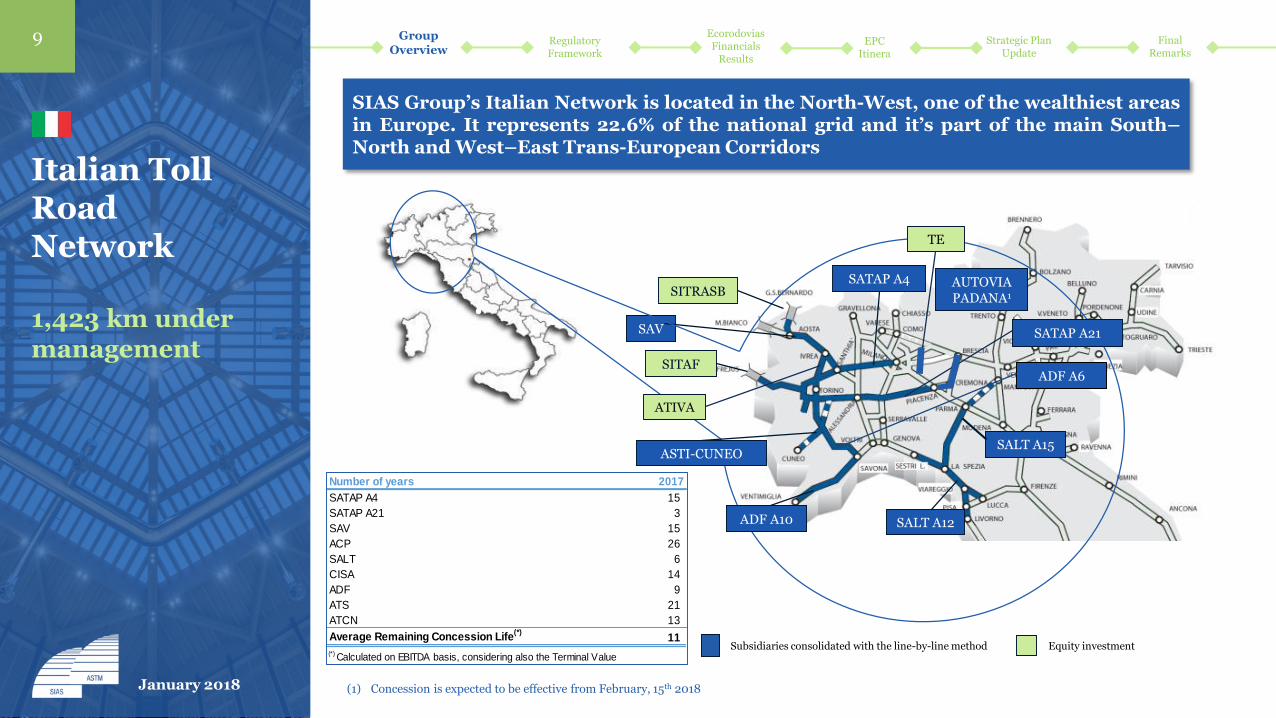
1,423 km under management
Group Overview
Regulatory Framework
Number of years 2017
SATAP A4 15
SATAP A21 3
SAV 15
ACP 26
SALT 6
CISA 14
ADF 9
ATS 21
ATCN 13
Average Remaining Concession Life(*)
11
(*) Calculated on EBITDA basis, considering also the Terminal Value
January 2018
Equity investment
SATAP A4
SATAP A21SAV
ASTI-CUNEO
ADF A10
SALT A15
SALT A12
ATIVA
SITAF
SITRASB
ADF A6
TE
Subsidiaries consolidated with the line-by-line method
AUTOVIA PADANA1
SIAS Group’s Italian Network is located in the North-West, one of the wealthiest areasin Europe. It represents 22.6% of the national grid and it’s part of the main South–North and West–East Trans-European Corridors
(1) Concession is expected to be effective from February, 15th 2018

Strategic Plan Update
Final Remarks
Ecorodovias Financials
Results
EPCItinera
10
Italian TollRoad Network
Italian Concessions directly and indirectly managed
Group Overview
Regulatory Framework
January 2018
Company Concessions % Stake Km MaturityEBITDA €M
(FY16)
% GroupEBITDA (FY16)
TV(10) (€M)
DIR
EC
TIN
VE
ST
ME
NT
S
SATAP A4: Torino – Milano
99.87%130.3 Dec-26+4y(1) 169.8 25.7% TBD(9)
167.7 Jun-17(2) 117.6 17.8% 108A21: Torino – Piacenza
SALT
A12: Sestri Levante-LivornoViareggio-Lucca
Fornola-La Spezia95.18%
154.9 Jul-19 123.9 18.7% 287
A15: La Spezia-Parma 182(3) Dec-31 58.0 8.8% -
SAV A5: Quincinetto-Aosta 65.09% 59.5 Dec-32 47.8 7.2% -
ADFA10: Savona-Ventimiglia
70.91%113.2 Nov-21 93.3 14.1%
99
A6: Torino-Savona 130.9 Dec-38 33.0 5.0% -
ASTI-CUNEO A33: Asti-Cuneo 60.00% 78(4) 23.5 years from completion(5) 2.4 0.4% -
AUTOVIA PADANA(6) A21: Piacenza-Brescia 70.00% 111.6(4) Feb-43 32 n.a. -
Company Concessions % Stake Km MaturityEBITDA (FY16)
TV (€M)
EQ
UIT
Y
INV
ES
TM
EN
TS
JointlyControlledCompanies
ATIVA
A4-A5: Tangenziale di TorinoTorino – Quincinetto
Ivrea-SanthiàTorino-Pinerolo
41.17% 155.8Aug-16(7)
74.2 102
TE A58: Tangenziale esterna di Milano 52.13%(8) 32 Apr-65 24.7 -
AssociatedCompanies
SITRASB T2: Traforo del Gran San Bernardo 36.50% 12.8 Dec-34 4.6 -
SITAFA32-T4: Traforo del Frejus
Torino-Bardonecchia36.5% 94 Dec-50 76 -
1) 4 years extension subject to the approval / clearance of MIT / EU Authorities under the proposed Cross Financing Plan2) Concession expired on June 30, 2017 currently managed under prorogatio regime3) Inclusive of the Parma and Nogarole Rocca stretch (81 km not yet built)4) 23Km under construction 5) Potential re-scheduling of the maturity to 31/12/2030 according to the proposed Cross Financing Plan6) Effectiveness expected from February 15th 2018. Figures make reference to the former concessionaire. The final % stake after the disposal to Ardian will be 51%. The closing is
expected by June 20187) Concession expired on August 31, 2016 currently managed under prorogatio regime 8) Total SIAS Group stakes after the purchase and sale agreement with Banca Intesa, Pizzarotti Group (both still pending) and Itinera (executed in December 2017)9) Satap A4 maybe eligible for a terminal value under the proposed Cross Financing Plan10) Subject to confirmation of Financial Plan assumptions

Strategic Plan Update
Final Remarks
Ecorodovias Financials
Results
EPCItinera
11
Italian TollRoad Network TrafficPerformance
9M 2017 traffic performance
Group Overview
Regulatory Framework
January 2018
9M2017 traffic increased by 2.26%, vs. 9M2016 (+1.88% Light Vehicles and +3.50% HeavyVehicles), confirming and accelerating the recovery started in 2014
Data in millionvehicles km
2017 2016 Changes
Light Heavy Total Light Heavy Total Light Heavy Total
1Q total: 1/1 – 31/3
1,506 558 2,064 1,528 532 2,060 -1.44% 4.92% 0.23%
2Q total: 1/4 - 30/6
1,929 621 2,550 1,817 606 2,423 6.29% 2.29% 5.29%
July 823 216 1,039 819 209 1,028 0.48% 3.31% 1.05%
August 811 175 986 803 168 971 0.99% 4.53% 1.60%
September 657 212 869 655 207 862 0.30% 2.70% 0.88%
3Q total: 1/7 - 30/9
2,291 603 2,894 2,277 584 2,861 0.61% 3.44% 1.19%
1Q-3Q total: 1/1 – 30/9
5,726 1,782 7,508 5,622 1,722 7,344 1.88% 3.50% 2.26%

Strategic Plan Update
Final Remarks
Ecorodovias Financials
Results
EPCItinera
12
Italian TollRoad Network TrafficPerformance
2008 –2017 bgtTraffic Trend
Km vehicles (mln) 2007 2008 2009 2010 2011 2012 2013 2014 2015 2016
2017
budget
Light 6.803 6.760 6.850 6.854 6.757 6.225 6.062 6.111 6.299 6.403 6.485
Heavy 2.363 2.310 2.110 2.197 2.189 2.028 1.974 1.984 2.046 2.101 2.133
Total (*) 9.166 9.071 8.960 9.052 8.946 8.253 8.036 8.095 8.345 8.504 8.617
8000
8500
9000
9500
10000
2007 2008 2009 2010 2011 2012 2013 2014 2015 2016 2017Bgt
Km
ve
hic
les
(mil
ion
s)
Year
-549 VKm/mln (-6%)
9,166 VKm/mln baseline 2007
-12.3%
Traffic 2007 - 2017
-5,4%
November 2017
FinancialResults
& Traffic
Regulatory Framework
(1) Changes to the scope of consolidation in the period 2007-2017 were not considered (therefore, the “traffic volumes” for ATIVA, ATS were not included)(2) ∆ 9M16 vs 9M17 (3) Including ATS traffic (741 Km/Mln Vehicles)
Strong and solid traffic recovery but still potential significant upside
Despite, in the pDespite, in the period 2007 – 2017, the traffic has declined up to a maximum of 12.3% and at the end 2017 we expect to be still down 5.4%, in the same timeframe the Group EBITDA increased 42%
Strategic Plan Update
Final Remarks
Ecorodovias Financials
Results
EPCItinera
13
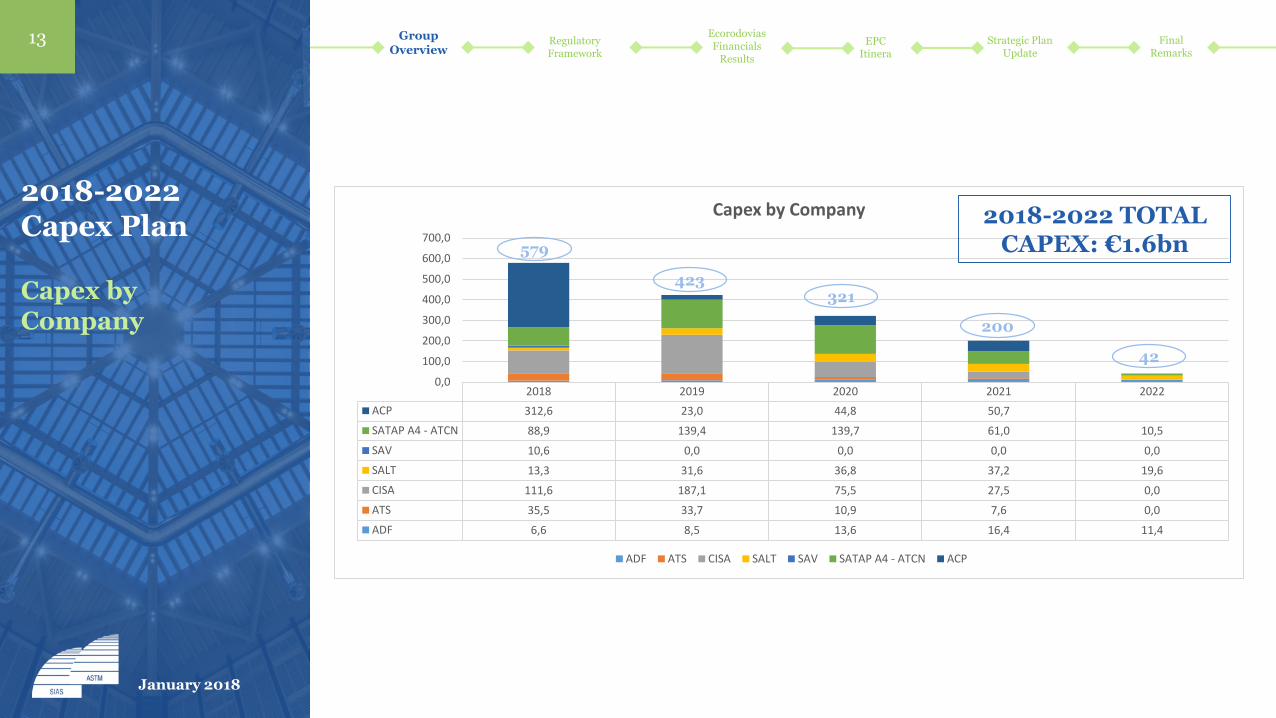
2018-2022 Capex Plan
Capex by Company
Group Overview
Regulatory Framework
January 2018
2018 2019 2020 2021 2022
ACP 312,6 23,0 44,8 50,7
SATAP A4 - ATCN 88,9 139,4 139,7 61,0 10,5
SAV 10,6 0,0 0,0 0,0 0,0
SALT 13,3 31,6 36,8 37,2 19,6
CISA 111,6 187,1 75,5 27,5 0,0
ATS 35,5 33,7 10,9 7,6 0,0
ADF 6,6 8,5 13,6 16,4 11,4
0,0
100,0
200,0
300,0
400,0
500,0
600,0
700,0
Capex by Company
ADF ATS CISA SALT SAV SATAP A4 - ATCN ACP
579
423321
200
42
2018-2022 TOTAL CAPEX: €1.6bn

Strategic Plan Update
Final Remarks
Ecorodovias Financials
Results
EPCItinera
14
Sias Group Financial Structure
Group’s Financial Debt(1) allocation as of 30 September 2017
Group Overview Regulatory
Framework
January 2018
SAV
Bank Debt:€ 10.4M
SIAS
Bank Debt:€ 666M
ASTI-CUNEO
Bank Debt:€ 26M
I/Co Loan:€ 230M
I/Co Loan:€ 613M
I/Co Loan:€ 433M
ADF/ATSSALT/CISASATAP
Secured Bonds€ 1,000M
Loans€ 555M
I/Co Loan:€ 63M
I/Co Loan:€ 216M
Total debt: € 1,555m
Since 2010, SIAS is the main funding entity of the Group. The proceeds arising fromcorporate loans/bonds are allocated – through intercompany loans – to SIAS’s operatingsubsidiaries. A security interest (pledge) over the receivables arising from the intercompanyloans is granted to avoid structural subordination issues
(1) Total Long Term Financial Debt; the figures don’t include the: NPV of non financial debt vs. FCG, the fair value of derivatives and the bank overdrafts
Issuer Debt Ratio (ratio of the aggregate Indebtedness of the Issuer and the Indebtedness of the Group) as of 30September 2017: 69%
Strategic Plan Update
Final Remarks
Ecorodovias Financials
Results
EPCItinera
15
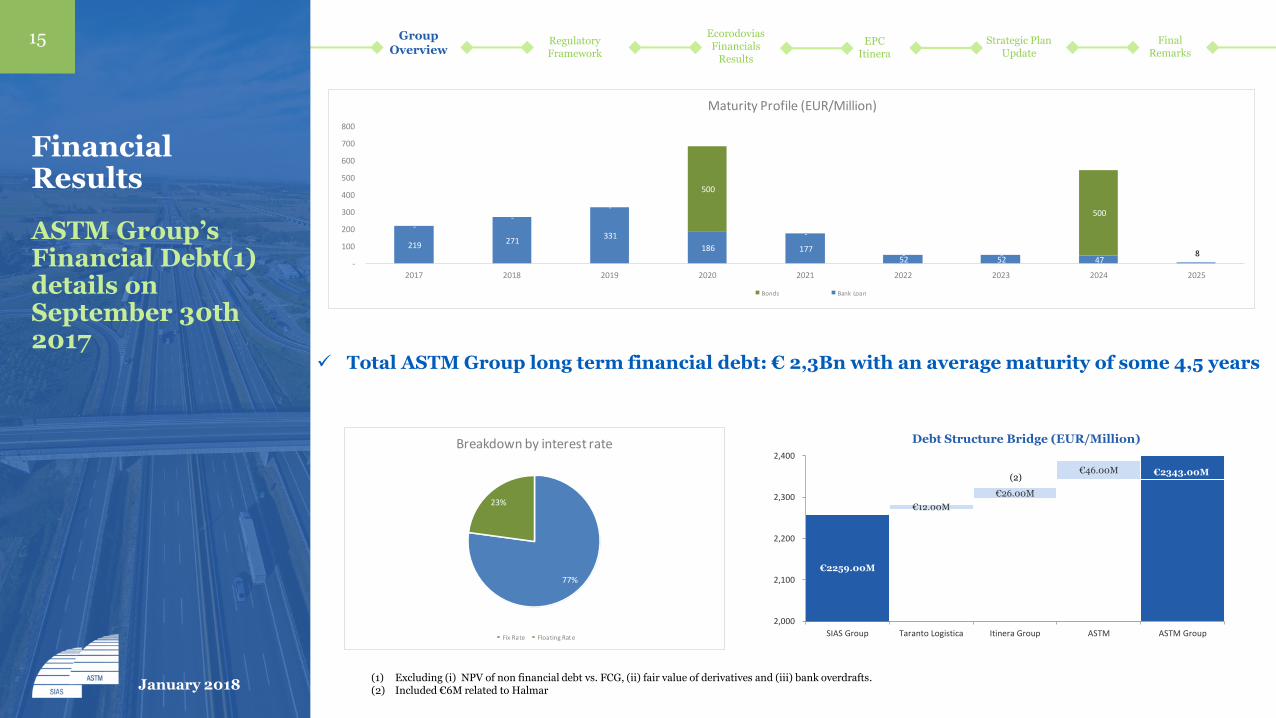
Financial Results
ASTM Group’s Financial Debt(1) details on September 30th 2017
Total ASTM Group long term financial debt: € 2,3Bn with an average maturity of some 4,5 years
(1) Excluding (i) NPV of non financial debt vs. FCG, (ii) fair value of derivatives and (iii) bank overdrafts.(2) Included €6M related to Halmar
€2343.00M
€12.00M
€26.00M
€46.00M
€2259.00M
2,000
2,100
2,200
2,300
2,400
SIAS Group Taranto Logistica Itinera Group ASTM ASTM Group
(2)
Debt Structure Bridge (EUR/Million)
Group Overview
Regulatory Framework
219 271 331
186 177 52 52 47
8
--
-
500
-
- -
500
-
100
200
300
400
500
600
700
800
2017 2018 2019 2020 2021 2022 2023 2024 2025
Maturity Profile (EUR/Million)
Bonds Bank Loan
77%
23%
Breakdown by interest rate
Fix Rate Floating Rate
January 2018

Strategic Plan Update
Final Remarks
Ecorodovias Financials
Results
EPCItinera
16
Financial Results
SIAS Group’s Financial Debt(1) details on September 30th 2017
(1) Excluding (i) NPV of non financial debt vs. FCG, (ii) fair value of derivatives and (iii) bank overdrafts
Total SIAS Group long term financial debt: EUR2.2Bn with an average maturity of some 4,6 yearsand a smooth amortization profile
Solid Credit Rating: Baa2 (stable outlook) byMoody’s (from 2010, confirmed on October 2017).BBB+ (stable outlook) by Fitch (from 2014,confirmed on October 2017)
Group Overview
Regulatory Framework
171 256
310 186 176
52 52 47 8
-
--
500
-
- -
500
- -
100
200
300
400
500
600
700
800
2017 2018 2019 2020 2021 2022 2023 2024 2025
Maturity Profile (EUR/Million)
Bonds Bank Loan
January 2018

Strategic Plan Update
Final Remarks
Ecorodovias Financials
Results
EPCItinera
17
Financial Results
ASTM Group Available sources of funding on September 30th 2017
SIAS Group CASH AND CASH EQUIVALENTS (incl. TV on Satap A21) as atSeptember 30th 17 (EUR/Millions) 1,242
CDP financing 290 SATAP
Pool Loans related to Società di Progetto Autovia Padana270 SIAS
VAT Pool Loan related to Società di Progetto Autovia Padana 66 AUTOVIA PADANA
Committed back up facilities 80 SIAS
Uncommitted bank credit lines 342SIAS and
Consolidated Companies
Committed facilities 30 SIAS
SIAS Group TOTAL UNDRAWN CREDIT LINES 1,078
SIAS Group TOTAL AVAILABLE SOURCES OF FUNDING (EUR/Millions)
2,320
ASTM Group (ex SIAS) CASH AND CASH EQUIVALENT as at September 30th 17 (EUR/Millions)
91
Uncommitted bank credit lines 292
ASTM andConsolidated
Companies
Committed back up facilities 30 ASTM
Committed facilities 18 ITINERA
ASTM Group (ex SIAS) TOTAL UNDRAWN CREDIT LINES 341
GROUP TOTAL AVAILABLE SOURCES OF FUNDING (1)(EUR/Millions)
2,751
Group Overview
Regulatory Framework
(1) Excluding (i) ATIVA TV (€102mln), (ii) NFP @ June 30, 2017 (€65mln)
January 2018

Regulatory Framework
2
18
January 2018

Group Overview
Regulatory Framework
Strategic Plan Update
Final Remarks
Ecorodovias Financials
Results
EPCItinera
19
RegulatoryFramework:
Financial planrenewals & cross financing
Issue Update
Financial Plan Renewals (SALT, CISA, ADF, ATS and SAV)
• Action: on 8Sep17 Additional Deeds to existing agreements have been signed with Ministry of Infrastructure and Transport in order to settle the pending issue
Extension SATAP A4 • Action: the Grantor (MIT) presented to European Authorities a proposal, informally already agreed in advance, which includes the Asti-Cuneo A33 completion and the financial plan re-balance through cross financing with SATAP A4 Milano-Torino.
• Pending: authorization of European Union and signing of specific Additional Deeds to existing agreements.
Completion Asti-Cuneo A33
SATAP A21 (expired on 30Jun17) • Action: agreement with the Grantor (MIT) for the amount of Terminal Value and the management of the concession (expired on 30Jun17)
• Pending: nothing
January 2018

Regulatory Framework
Strategic Plan Update
Final Remarks
Ecorodovias Financials
Results
EPCItinera
20
RegulatoryFramework:
Financial planrenewals & cross financing
Cross financing A4-A33 – main indicative terms:
Asti-Cuneo A33 completion and financial plan re-balance through cross financing with Satap A4 Milano-Torino:
Asti-Cuneo A33 capex to completion: € 350mln (2018-2021)
Satap A4 maturity extension at 31/12/2030 (+4 years)
Satap A4 annual tariff increase: ΔP (annual projected inflation as reported in the
Italian Budget) + 50bps (fixed for the outstanding period of the concession)
Satap A4 Terminal Value method: capitalization of the credits on the cross financing
capex with a cap of 1,6x 2030 Ebitda (A4+A33)
Remuneration based on 3 different WACC:
• Wacc 1: fixed to be applied to Asti-Cuneo A33 initial RAB and completion capex
• Wacc 2: floating as per CIPE regulation, to be applied to Satap A4 initial RAB
• Wacc 3: fixed 2018-2022 to be applied to Satap A4 residual capex
Final settlement of all legal disputes on Asti-Cuneo A33 financial plan
Group Overview
January 2018

Regulatory Framework
Strategic Plan Update
Final Remarks
Ecorodovias Financials
Results
EPCItinera
21
RegulatoryFramework:
Financial planrenewals & cross financing
Financial plan renewals– main indicative terms:
Advanced negotiations on SALT, ADF, CISA, ATS and SAV 2014-2018 financial plans renewals based on:
Capex: stated on the original financial plans
WACC definition method, as per CIPE regulation with:
• ERP increased to 5,5%
• Risk free rate based on the last 12 months avg 10 years BTP
• Kd based on the effective debt cost with a cap of risk free rate plus 200 bps
Terminal value: agreement for SALT, ADF and Satap A21
Recovery of the missing past tariff increases for €40 mln regarding SALT, ADF, CISA,
SAV and Satap A21
Final settlement of all legal disputes on renewals and delays
Potential additional capex for ADF, ATS and Satap A21 in exchange of additional Terminal Value
Safety measures
Group Overview
January 2018

Regulatory Framework
Strategic Plan Update
Final Remarks
Ecorodovias Financials
Results
EPCItinera
22
RegulatoryFramework:
Tariff Increase
Group Overview
January 2018
2014 2015 2016 2017 2018
Weighted Average Tariff Increase for the 2014/2018 period 4.60% 1.50% 1.48% 1.42% 3.02%
Actual tariffs increases
% 2015 2016 2017 2018
SATAP A4 1,50% 6,50% 4,60% 8,34%
SATAP A21 1,50% 0,00% 0,85% 1,67%
SALT A12 1,50% 0,00% 0,00% 2,10%
CISA A15 1,50% 0,00% 0,24% 0,00%
ADF 10 1,50% 0,00% 0,00% 0,98%
ATS A6 1,50% 0,00% 2,46% 2,79%
SAV A5 1,50% 0,00% 0,00% 0,00%

Ecorodovias Financial Results
3
23
January 2018

Strategic Plan Update
Final Remarks
EcorodoviasFinancials
Results
EPCItinera
24
Brazilian TollRoads -Ecorodovias
Regulatory Framework
Group Overview
January 2018
60% 40%
100% 100% 100% 100% 90% 100% 100%
100%
100%
Free Float
64.0% 33.5%
Primav Infraestrutura S.A.
Primav Construções e Comércio S.A.IGLI S.p.A. OS: 50.0%
PS: -
Total: 30.9%
OS: 50.0%
PS: 100.0%
Total: 69.1%
2.5%

Strategic Plan Update
Final Remarks
EcorodoviasFinancials
Results
EPCItinera
25
International Toll Road Network
Equity investments:1,840 km under management
Regulatory Framework
Group Overview
January 2018
Company Concessions% Stake held by
EcorodoviasKm Maturity
EBITDA €M(2)
(FY16)
Jointly controlledCompanies
ECOPONTERio de Janeiro
Noteroi-State of Rio de Janeiro
100% 23 May–45 17.9
ECOVIACuritiba-Porto
Paranagua100% 136.7 Nov-21 51.7
ECOCATARATASParanà-
“Tripolborder” 100% 387.1 Nov-21 59.0
ECO101Macuri/Ba-
Rio de Janeiro border100% 475.9 May-38 21,1
ECOVIASSan Paolo-Porto
Santos100% 176.8 Oct-25 201,4
ECOSULPelotas-Porto Alegre-
Porto Rio Grande90% 457.3 Mar-26 48.9
ECOPISTASSan Paolo-
Vale do Rio Paraiba100% 134.9 Jan-39 48.1
RODOANEL NORTESan Paolo
Northern Ring Road100% 48
30 years sinceinception(1) -
EspiritoSanto
Parana
Sao Paulo Rio De
Janeiro
Rio Grande Do Sul
MinasGerais
Goias
SIAS, together with its controlling company ASTM and Brazilian Group CR Almeida, jointly controls Ecorodovias Infraestrutura e Logistica SA the third Brazilian Toll Road operator listed on the Brazilian stock exchange (€ 2.1bn Market Cap)(1)
9(2) Concessions for 1,840 km in the wealthiest manufacturing Federal States (San Paolo, Rio de Janeiro, Minas Gerais, Paranà, Rio Grande do Sul, Espirito Santo)
(1) EUR equivalent using fx rate as of 31/12/16(2) Including Rodoanel Norte awarded in Jan-18 and not yet in operation

Final Remarks
EcorodoviasFinancials
Results
EPCItinera
26
Brazilian TollRoads -Ecorodovias
May 2016 Acquisition of 64.1% of Primav Infrestrutura (41% of Ecorodovias looking through) May 2017 agreement for the acquisition of a further 5% of Primav Infrestrutura (3.2% of
Ecorodovias looking through)(1)
April / May 2017 Acquisition of further 2,51% of Ecorodovias(2)
46.7%
19.8%
0.4%
33.1%
Igli CR Almeida
Treasury Shares Free Float
Igli69,1%
CR Almeida30,9%
50%
100%
50%
0%
25%
50%
75%
100%
Ordinary Shares Preferred Shares
Primav Infraestrutura Shares Ecorodovias Shares
(1) Purchase Price approx. 188M/BRL paid by (i) converting the IGLI Financial Loan vs CRASA (approx. 133M/BRL) and (ii) cash (approx. 55M/BRL) (2) Purchase price approx. 132M/BRL
Strategic Plan Update
Regulatory Framework
Group Overview
January 2018

Strategic Plan Update
Final Remarks
EcorodoviasFinancials
Results
EPCItinera
27
Ecorodovias Highlights
4,173
303
1,311
1,949
- 1,000 2,000 3,000 4,000
4,117
181
1,130
1,760
- 1,000 2,000 3,000 4,000
Ecorodovias Financial (Comparable Pro-Forma) 9M 2016BRL/Millions
Ecorodovias Financials (Comparable Pro-Forma) 9M 2017BRL/Millions
Revenues (1)
EBITDA (2)
Net Profit (3)
NFP
109 137 143 133101 105
111128
148 152
112 115
220
264291 285
213 220
2013 2014 2015 2016 9M 16 9M 17Heavy Vehicles Light Vehicles
+3,5%
+10,7%
+16%
+67,4%
+1,4%
(1) Excludes construction revenue(2) Excludes construction revenue and Costs, provision for maintenance and Impairment of Ecoporto(3) Excludes non-recurring item: effect of write off assets held for sale (Elog)
Regulatory Framework
Group Overview
37 34
3836
7570
3Q17 3Q16
Traffic volume (equivalent paying vehicles, thousand)
January 2018

4
28
EPC - Itinera
January 2018

Strategic Plan Update
Final Remarks
EcorodoviasFinancials
Results
EPCItinera
EPC
Construction -Itinera
29
Itinera Strategic and Financial Highlights
48
1
3.1%
5
159
-10 90 190 290 390
-0.058
9
8.6%
19
222
-2000200400600800
Itinera 1H2016 Financials (Pro-Forma)(1)
EUR/MillionsItinera 1H2017 Financials
EUR/Millions
Revenues
EBITDA
Net Profit
NFP
EBITDA%
11%
15%
1%
73%
Maintenance Maritime work
Civil Work Infrastructure
55%
45%
0%
25%
50%
75%
100%
Geografical Mix
Italy Abroad
3,6 €/Bn Itinera Backlog as of September 2017
(1) Including ABC incorporation
Regulatory Framework
Group Overview
January 2018

Strategic Plan Update
Final Remarks
EcorodoviasFinancials
Results
EPCItinera
EPC
Construction -Itinera
30
BRAZIL
SWEDENNORWAY
DENMARK
SWITZERLAND
ITALY
POLAND
AUSTRIA
HUNGARY
ROMANIA
BULGARIA
ALGERIA
COTE D’IVOIRE
BOTSWANA
KENYA
KAZAKHSTAN
GEORGIA
ARMENIA
ISRAEL
IRAN
KUWAIT
UAE
OMAN
San Paolo(Brazil)
Washington DC (USA)
Johannesburg(South Africa)
Algeri(Algeria)
Bucarest(Romania)
Erevan(Armenia
)
Riyad(Saudi
Arabia)
QATAR
Dubai (UAE)Abu Dhabi (UAE)
Muscat (Oman)
Itinera Branches
HEADQUARTER
Countries where Itinerasubmitted tenders
Countries where Itineraawarded contracts
TORTONA (Italy)
ItineraInternational Expansion
Regulatory Framework
Group Overview
January 2018

Strategic Plan Update
Final Remarks
EcorodoviasFinancials
Results
EPCItinera
EPC31
Itinera acquired 50% of Halmar’s share capital and got the control through the
governance agreements signed
The deal is worth $ 60mln (of which $ 50mln to buy shares and $ 10mln as additional
equity)
Halmar is one the top five construction companies operating in the metropolitan area of
New York in the transport infrastructure sector (roads, motorways, railways, subways,
airports, bridges and viaducts)
The company aims to achive overall revenue of about $ 450mln with an average EBITDA
of 6%. During 2017, the company took part/planned to take part in tenders having a pro-
quota value of about $ 4bn
Construction -Itinera
Acquisition of majority share-holding in HalmarInternational LLC
July 6th: ITINERA enters the US Infrastructure Market through Halmar acquisition
Itinera’s equity holding in Halmar will enable the company to improve its ability to
respond successfully to EPC Contractor (Engineering, Procurement & Construction)
tenders, expand its bond capacity and, at the same time, focus on new Private Public
Partnership (PPP) projects that many US States are launching
Regulatory Framework
Group Overview
January 2018

Strategic Plan Update
Final Remarks
EcorodoviasFinancials
Results
EPCItinera
EPC
KEY OPERATIONAL DRIVERS
32
Acquisition
In July 2017, Itinera acquired a US construction company, leader in design-build project delivery
The deal is the starting point for USA market development both for the EPC and Concession Business Unit
Halmar and Itinera have an aligned strategy, complementary core capabilities and a common commitment to high cash flow generations and margins
Itinera targeted at 15% 2017-2021 Halmar USA Revenues CAGR and an yearly average new backlog acquisition of more than $300m
4,590
7
37
45
80
114
150
154
157
870
934
2,042
Totals
Hazardous & Solid Waste
Inland Waterways & Marine Ports
Dams
Levees
Public Parks & Recreation
Water / Wastewater Infrastructure
Rail
Airports
Schools
Electricity
Surface Transportation
$ Billion
2016-2025 Cumulative USA Infrastructure Needs
Business Line Construction: Itinera
Regulatory Framework
Group Overview
January 2018

Strategic Plan Update
Final Remarks
EcorodoviasFinancials
Results
EPCItinera
EPC
KEY OPERATIONAL DRIVERS
33
Acquisition
AVIATION MASS TRANSIT RAILROAD HIGHWAYS BRIDGE
5TOP
Heavy Civil Contractor in the NY-Metro area
$20bn
Annual local market
25%
Historical bid capture annual rate
54 YEARS
Of proven performance
1ST RANKED
Locally owned transportation
contractor
Leaders in Design-Build Project Delivery
In-depth knowledge of America’s largest local construction market to deliver growth & profit
Business Line Construction: Itinera
Regulatory Framework
Group Overview
January 2018

5
34
Strategic Plan Update
January 2018

Strategic Plan
Update
Final Remarks
EcorodoviasFinancials
Results
EPCItinera
TOLL ROAD CONCESSIONS
KEY OPERATIONAL DRIVERS
35
GLOBAL MARKET POSITION CONSOLIDATION
SIMPLIFICATION OF GROUP STRUCTURE
EFFICIENCY
STRATEGIC AND FINANCIAL PARTNERSHIPS
ACCESS TO EQUITY AND DEBT CAPITAL MARKETS
• Continue to invest in Italy• Grow in Brazil• Entry into the USA Market• Other geographical areas to be evaluated on a case-by-case basis
• Increase SIAS value through Ecorodovias• Subsidiary mergers and integration• Corporate reorganization by business• Non-core assets disposal
• Strong cost control and lean structure• Overhead centralization• Enhancement of organizational models in compliance with
international best practices
• Implement new partnerships with industrial and financial investors
• Develop and maximize brand new partnership with
• Fund a sustainable, efficient and effective growth• Maintain a solid investment grade credit profile • Increase value for shareholders
Regulatory Framework
Group Overview
January 2018

Final Remarks
EcorodoviasFinancials
Results
EPCItinera
TOLL ROAD CONCESSIONS
36
REGULATORY FRAMEWORK
GROWTH
SIMPLIFICATION & ORGANIZATION
• Financial Plans renewal
• Definition of WACC levels
• Asti-Cuneo: completion with additional capex through cross financing
• SATAP A4 (26% of SIAS Group EBITDA): extension + Terminal Value
• ATIVA and SATAP A21 tender: commitment to re-awarding
• ADF and SALT: exploit extension opportunities through EU requirements on tunnel safety measures
• Tangenziale Esterna: empower the industrial role, after the semplification of shareholders structure
• Incorporation of ATS in ADF and CISA in SALT
• Reorganization of 34% ITINERA stakes, currently at SIAS Group level
• Parking Business disposal
• Saving plan: yearly average cash cost reduction up to €20m at SIAS Group level
ITALIAN MARKET
Italian Market: theGroup‘s Backbone
€533m €538m€580m
€613m€646m
20132012 2014 2015 2016
2012-2016 Italian Toll Road
EBITDA CAGR +5%
Regulatory Framework
Group Overview
Strategic Plan
Update
January 2018

Final Remarks
Ecorodovias Financials
Results
EPCItinera
37
Simplication and organization
Tangenziale Esterna -BreBeMi.
July 28th 2017: agreement with Banca Intesa
Sias signed an agreement with Intesa Sanpaolo to swap their respective partecipations in Tangenziale Esterna di Milano and BreBeMi by 31 December 2018. Sias will concentrate its investments in Tangenziale Esterna di Milano
Regulatory Framework
Group Overview
Strategic Plan
Update
January 2018
October 2017: Sias-Itinera transaction on TE-TEM
Sias signed an agreement for the acquisition of 10,23% of TE and 1,56% of TEM from Itinera, plus the right to buy a further 0,47% of TE from CTE (CorsorzioTangenziali Engineering) and 1% of TE from “Cooperative”
December 2017: Sias-Pizzarotti agreements result in joint control of TE-TEM
Sias signed an agreement to sell the bare ownership of a maximum of 8,11% TEM and, at the same time, to buy, from Impresa Pizzarotti, 3,84% of TE.
Sias stake in TEM @ 50% and in TE @ 28,3%

Final Remarks
Ecorodovias Financials
Results
EPCItinera
38
Simplication and organization
Tangenziale Esterna -BreBeMi.
SIAS
Itinera
AutostradeLombarde
SATAP
99.9%
13.3%
47.7%
31.9%
29.6%
1.6%
TE
7.4%
3.2%
2.7%
TEM
BreBeMi79%
4.7%
6.5%
8.1%
Serravalle
1.0%
13.6%
18.8%
ASTM
17%
63.3%
0.4%
SIAS
SATAP
99.9%
47.7%
TE
0,4 %
TEMSerravalle
ASTM
63.3%
Previous structure: Going forward
Regulatory Framework
Group Overview
Strategic Plan
Update
50%
14.1%
18.8%
13.6%
22.7%
5,6%
Sias Group @ 50% TEM - @ 28,3% TE
January 2018

Final Remarks
Ecorodovias Financials
Results
EPCItinera
39
Strategic & Financial Partnership: Ardian deal on Autovia Padana concession
On May 31th SIAS Group signed the Concession Agreement for A21 Piacenza –Cremona – Brescia motorway with the Ministry of Infrastructure and Transport (MIT)
The effectiveness of agreement, subject to the issue of the relevant Italian Interministerial Decree of approval and the subsequent registration by the Court of Auditors, is expected to take place on Jan 1st
2018
Main Features
Length 88,6 Km
Duration 25 years
Initial Capex €313m, of which €260m (Terminal Value)and €41m (Concession Fees)
Capex from 2019
€217m
2016 Revenues €62,5m
2016 EBITDA €31,9m
Regulatory Framework
Group Overview
Strategic Plan
Update
On November 13th, A4-A35
link road opened to
traffic
January 2018

Final Remarks
Ecorodovias Financials
Results
EPCItinera
40
Strategic & Financial Partnership: Ardian deal on Autovia Padana concession
The structure of the deal:
On June 6th SATAP (70%) and Itinera (30%) entered into an agreement with Ardian that envisages Ardian acquiring 49% of Autovia Padana share capital for c.€80m (total equity commitment Satap+Ardian= eur 164 mln).
As a result of the above:
(i) Autovia Padana will be owned by SATAP (50,9%), Ardian (49,0%) and Itinera (0,1%);
(ii) SIAS Group will consolidated the investment through line-by-line method;
(iii) Itinera will be enable to act as an EPC contractor
(iv) SIAS SpA will remain the funding entity
The rationale of the deal: a strategic partnership for the future and cash in to speed up geographic diversification
The deal is a key point for a strategic partnership with one of the most important private investment company in infrastructure assets.
Itinera strengthened its capital position in order to have room for expansion in foreign markets (i.e. Halmar acquisition)
Regulatory Framework
Group Overview
Strategic Plan
Update
January 2018

6
41
Final remarks
January 2018

2021 AT A GLANCE42
CONCESSIONSSIAS
2.6€bn
Revenues
1.7€bn
EBITDA
2.5x
NFP/EBITDA
9€bn
Capital Employed
>
4,500KM
Under management
>20
Concessions in Italy, LATAM and USA
EPCITINERA
EUROIMPIANTI ELECTRONICS
Revenues
1.1€bn
EBITDA
89€m
Debt / Equity
0.3x
Backlog
4€bn
ENGINEERINGSINA
Revenues
80€m
EBITDA
9€m
TECNOLOGYSINELEC
Revenues
80€m
EBITDA
16€m
NFP
CashPositive
Backlog
200€m
NFP
CashPositive
Backlog
250€m
Strategic Plan Update
FinalRemarks
EcorodoviasFinancials
Results
EPCItinera
Regulatory Framework
Group Overview
January 2018

432021 FINANCIAL TARGETS & GEOGRAPHICAL DIVERSIFICATION
1.5€bn
0.7bn
NFP/EBITDA
2.5x
3.8€bn
1.8€bn
NFP/EBITDA
2.4x
VS
VS53% Italian
47% International
46% Italian54% International
2021
2021
100% Italian
100% Italian
REVENUES
EBITDA
2016
2016
2021
2021
2016
2016
International
ItalianJanuary 2018

44Strategic Plan
Update
FinalRemarks
EcorodoviasFinancials
Results
EPCItinera
Regulatory Framework
Group Overview
Appendix
January 2018
ΔT annual tariff increase
ΔP annual projected inflation rate as reported in the Italian Budget
Xr determined every 5 years to remunerate the regulated invested capital at the end of each regulatory period
K determined every year to remunerate the investments performed during the previous year
CPI actual inflation rate for the previous 12 months as reported by ISTAT
βΔQ quality factor (related to the status of road surface and the accident rate)
Tariff Formulas:
Concessionaire Tariff formula
Companies with "re-alignment" of the financial plan mechanism
SATAP (A4 and A21) ∆T = ∆P ± Xr + K + ß∆Q
AUTOVIA PADANA (A21) ∆T = ∆P ± Xr + K + ß∆Q
SAV (A5) ∆T = 70%*CPI ± Xr + K
SALT (A15) ∆T = 70%*CPI ± Xr + K
ASTI CUNEO (A33) ∆T = ∆P ± Xr + K
Companies with "confirmation" of the financial plan mechanism
SALT (A12) ∆T = 70%*CPI + K
ADF (A10) ∆T = 70%*CPI + K
ADF (A6) ∆T = 70%*CPI + K
~ 57% of FY16 Toll Roads EBITDA
~ 43% of FY16 Toll Roads EBITDA
