aim italia facts - enventcapitalmarkets.co.uk · alfio bardolla training group personal financial...
TRANSCRIPT

© 2017 EnVent Capital Markets – All rights reserved
AIM ITALIA FACTS
September 30th, 2017
Booming performance of AIM Italia Market in 9M 17:
88 companies listed with a total market
capitalization of almost €5bn (+71% vs FY16)
€1bn additional market cap by newcomers and
€771m of funds invested in IPOs (vs €106m in
9M 16)
€93m further funds raised through capital
increase and corporate bond issuance (+173%
vs 9M 16)
Velocity turnover at 51.2% strongly above 9M
16 (14.5%) and the entire 2016 (24.6%)
PIR plans, selective institutional investors and
newcomers with an attractive and compelling equity
story represent turning points in the growth of AIM
Italia Market
D
u
e
t
o
AIM Italia Facts
This snapshot does not represent to be, nor can it be construed as being an offer or solicitation to buy, subscribe or sell financial products or instruments, or to execute any operation whatsoever concerning such products or instruments. Each and every investment/divestiture decision is the sole responsibility of the party receiving the advice and recommendations, who is free to decide whether or not to implement them. Therefore, EnVent and/or the author (s) of the present publication cannot in any way be held liable for any losses, damage or lower earnings that the party using the publication might suffer following execution of transactions on the basis of the information and/or recommendations contained therein. This document may not be distributed in the United States, Canada, Japan or Australia or to U.S. persons
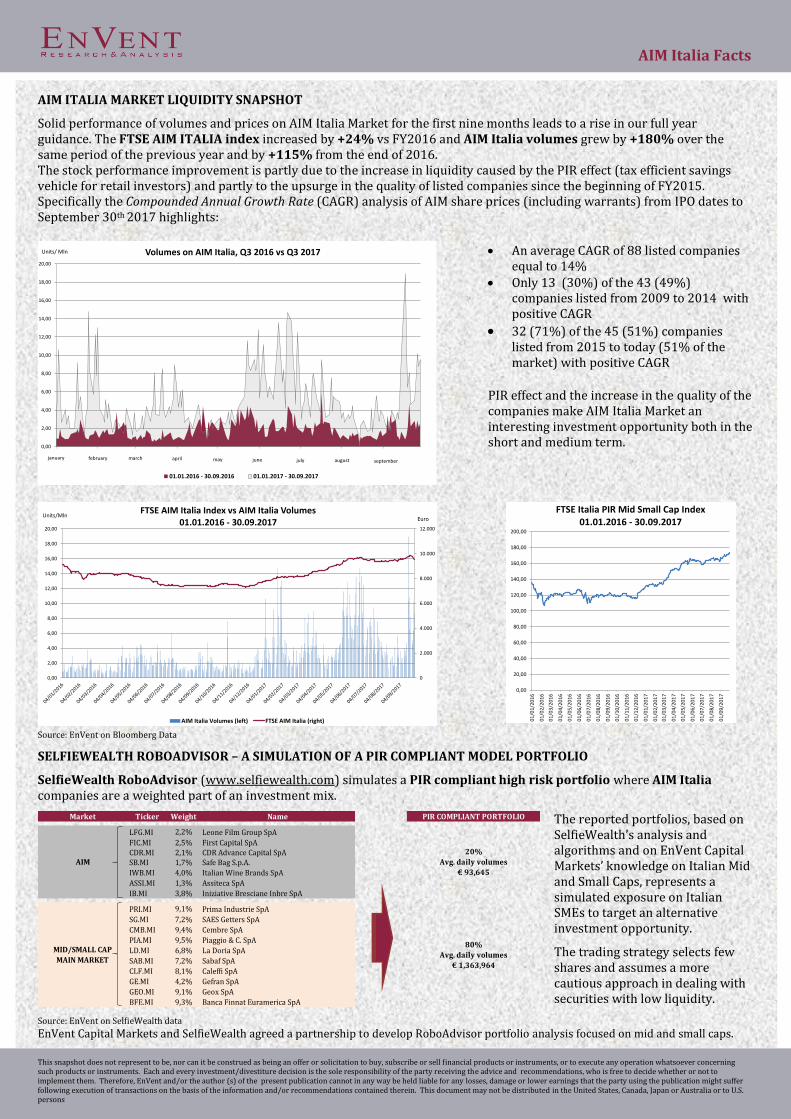
AIM ITALIA MARKET LIQUIDITY SNAPSHOT
Solid performance of volumes and prices on AIM Italia Market for the first nine months leads to a rise in our full year guidance. The FTSE AIM ITALIA index increased by +24% vs FY2016 and AIM Italia volumes grew by +180% over the same period of the previous year and by +115% from the end of 2016. The stock performance improvement is partly due to the increase in liquidity caused by the PIR effect (tax efficient savings vehicle for retail investors) and partly to the upsurge in the quality of listed companies since the beginning of FY2015. Specifically the Compounded Annual Growth Rate (CAGR) analysis of AIM share prices (including warrants) from IPO dates to September 30th 2017 highlights:
0,00
2,00
4,00
6,00
8,00
10,00
12,00
14,00
16,00
18,00
20,00
02/01/2017 02/02/2017 02/03/2017 02/04/2017 02/05/2017 02/06/2017 02/07/2017 02/08/2017 02/09/2017
Volumes on AIM Italia, Q3 2016 vs Q3 2017
01.01.2016 - 30.09.2016 01.01.2017 - 30.09.2017
Units/ Mln
january february march april may june july august september
An average CAGR of 88 listed companies
equal to 14% Only 13 (30%) of the 43 (49%)
companies listed from 2009 to 2014 with positive CAGR
32 (71%) of the 45 (51%) companies listed from 2015 to today (51% of the market) with positive CAGR
PIR effect and the increase in the quality of the companies make AIM Italia Market an interesting investment opportunity both in the short and medium term.
0
2.000
4.000
6.000
8.000
10.000
12.000
0,00
2,00
4,00
6,00
8,00
10,00
12,00
14,00
16,00
18,00
20,00
FTSE AIM Italia Index vs AIM Italia Volumes 01.01.2016 - 30.09.2017
AIM Italia Volumes (left) FTSE AIM Italia (right)
Units/MlnEuro
0,00
20,00
40,00
60,00
80,00
100,00
120,00
140,00
160,00
180,00
200,000
1/0
1/2
01
6
01
/02
/20
16
01
/03
/20
16
01
/04
/20
16
01
/05
/20
16
01
/06
/20
16
01
/07
/20
16
01
/08
/20
16
01
/09
/20
16
01
/10
/20
16
01
/11
/20
16
01
/12
/20
16
01
/01
/20
17
01
/02
/20
17
01
/03
/20
17
01
/04
/20
17
01
/05
/20
17
01
/06
/20
17
01
/07
/20
17
01
/08
/20
17
01
/09
/20
17
FTSE Italia PIR Mid Small Cap Index 01.01.2016 - 30.09.2017
Source: EnVent on Bloomberg Data
SELFIEWEALTH ROBOADVISOR – A SIMULATION OF A PIR COMPLIANT MODEL PORTFOLIO
SelfieWealth RoboAdvisor (www.selfiewealth.com) simulates a PIR compliant high risk portfolio where AIM Italia companies are a weighted part of an investment mix.
Market Ticker Weight Name PIR COMPLIANT PORTFOLIO
LFG.MI 2,2% Leone Film Group SpA
FIC.MI 2,5% First Capital SpA CDR.MI 2,1% CDR Advance Capital SpASB.MI 1,7% Safe Bag S.p.A.
IWB.MI 4,0% Italian Wine Brands SpA
ASSI.MI 1,3% Assiteca SpA
IB.MI 3,8% Iniziative Bresciane Inbre SpA
PRI.MI 9,1% Prima Industrie SpA
SG.MI 7,2% SAES Getters SpA
CMB.MI 9,4% Cembre SpA
PIA.MI 9,5% Piaggio & C. SpA
LD.MI 6,8% La Doria SpA
SAB.MI 7,2% Sabaf SpA
CLF.MI 8,1% Caleffi SpA
GE.MI 4,2% Gefran SpA
GEO.MI 9,1% Geox SpA
BFE.MI 9,3% Banca Finnat Euramerica SpA
20%
Avg. daily volumes
€ 93,645
AIM
MID/SMALL CAP
MAIN MARKET
80%
Avg. daily volumes
€ 1,363,964
The reported portfolios, based on SelfieWealth’s analysis and algorithms and on EnVent Capital Markets’ knowledge on Italian Mid and Small Caps, represents a simulated exposure on Italian SMEs to target an alternative investment opportunity.
The trading strategy selects few shares and assumes a more cautious approach in dealing with securities with low liquidity.
Source: EnVent on SelfieWealth data
EnVent Capital Markets and SelfieWealth agreed a partnership to develop RoboAdvisor portfolio analysis focused on mid and small caps.
AIM Italia Facts
1
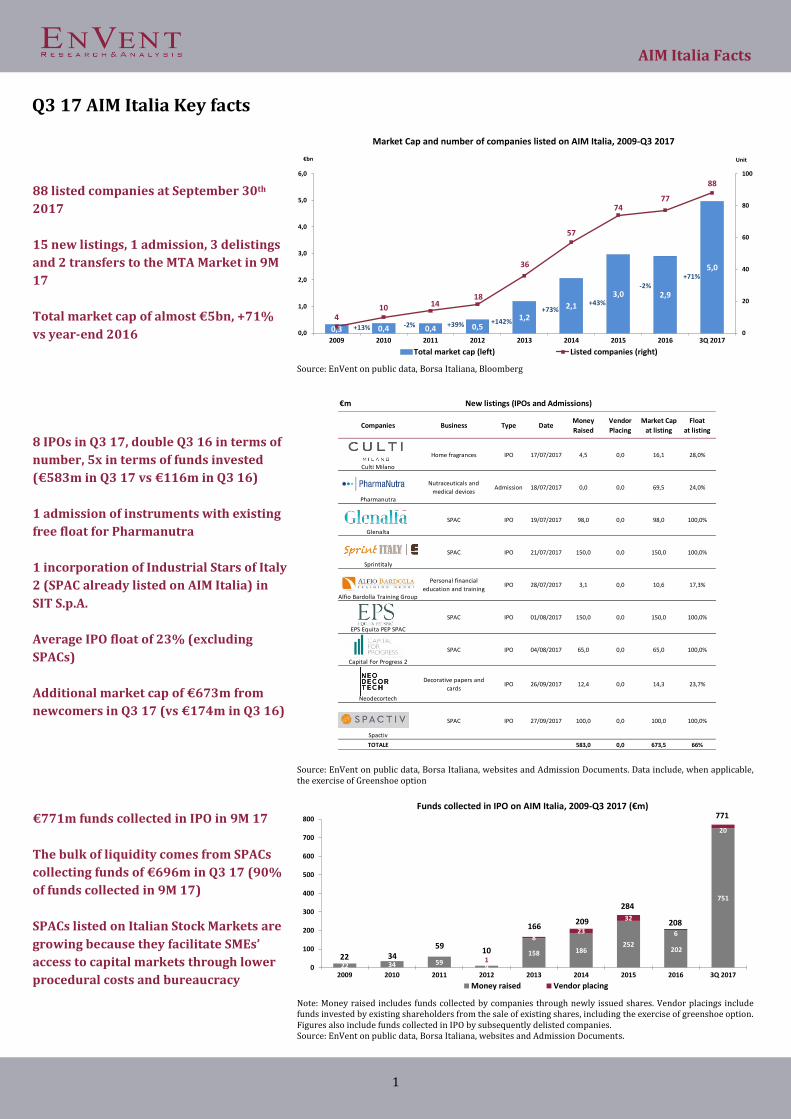
88 listed companies at September 30th
2017
15 new listings, 1 admission, 3 delistings
and 2 transfers to the MTA Market in 9M
17
Total market cap of almost €5bn, +71%
vs year-end 2016
8 IPOs in Q3 17, double Q3 16 in terms of
number, 5x in terms of funds invested
(€583m in Q3 17 vs €116m in Q3 16)
1 admission of instruments with existing
free float for Pharmanutra
1 incorporation of Industrial Stars of Italy
2 (SPAC already listed on AIM Italia) in
SIT S.p.A.
Average IPO float of 23% (excluding
SPACs)
Additional market cap of €673m from
newcomers in Q3 17 (vs €174m in Q3 16)
€771m funds collected in IPO in 9M 17
The bulk of liquidity comes from SPACs
collecting funds of €696m in Q3 17 (90%
of funds collected in 9M 17)
SPACs listed on Italian Stock Markets are
growing because they facilitate SMEs’
access to capital markets through lower
procedural costs and bureaucracy
0,3 0,4 0,4 0,51,2
2,1
3,0 2,9
5,0
410 14
18
36
57
7477
88
0
20
40
60
80
100
0,0
1,0
2,0
3,0
4,0
5,0
6,0
2009 2010 2011 2012 2013 2014 2015 2016 3Q 2017
Market Cap and number of companies listed on AIM Italia, 2009-Q3 2017
Total market cap (left) Listed companies (right)
€bn Unit
+13% -2% +39% +142%
+73%+43%
-2%+71%
Source: EnVent on public data, Borsa Italiana, Bloomberg
€m New listings (IPOs and Admissions)
Companies Business Type DateMoney
Raised
Vendor
Placing
Market Cap
at listing
Float
at listing
Culti Milano
Home fragrances IPO 17/07/2017 4,5 0,0 16,1 28,0%
Pharmanutra
Nutraceuticals and
medical devicesAdmission 18/07/2017 0,0 0,0 69,5 24,0%
Glenalta
SPAC IPO 19/07/2017 98,0 0,0 98,0 100,0%
Sprintitaly
SPAC IPO 21/07/2017 150,0 0,0 150,0 100,0%
Alfio Bardolla Training Group
Personal financial
education and trainingIPO 28/07/2017 3,1 0,0 10,6 17,3%
EPS Equita PEP SPAC
SPAC IPO 01/08/2017 150,0 0,0 150,0 100,0%
Capital For Progress 2
SPAC IPO 04/08/2017 65,0 0,0 65,0 100,0%
Neodecortech
Decorative papers and
cardsIPO 26/09/2017 12,4 0,0 14,3 23,7%
Spactiv
SPAC IPO 27/09/2017 100,0 0,0 100,0 100,0%
TOTALE 583,0 0,0 673,5 66% Source: EnVent on public data, Borsa Italiana, websites and Admission Documents. Data include, when applicable, the exercise of Greenshoe option
22 34 599
158 186252
202
751
1
823
32
6
20
0
100
200
300
400
500
600
700
800
2009 2010 2011 2012 2013 2014 2015 2016 3Q 2017
Funds collected in IPO on AIM Italia, 2009-Q3 2017 (€m)
Money raised Vendor placing
22 3459
166209
10
284
208
771
Note: Money raised includes funds collected by companies through newly issued shares. Vendor placings include funds invested by existing shareholders from the sale of existing shares, including the exercise of greenshoe option. Figures also include funds collected in IPO by subsequently delisted companies. Source: EnVent on public data, Borsa Italiana, websites and Admission Documents.
Q3 17 AIM Italia Key facts

AIM Italia Facts
2
€93m further funds raised in 9M 17 vs
€34m in 9M 16 (+173%) and over the
entire of 2016
Further capital raises represented 70%
of additional funds collected, of which
50% comes from warrant conversion
(around €30m)
Corporate bond issues accounted for
30%, of which 57% non-convertible
Steep increase in number and value of
trades in 9M 17 (respectively, +707% and
+382% vs 9M 16)
AIM Italia Velocity Turnover accelerating
to 51.2% as of end September 2017 (vs
14.5% as of end September 2016) in line
with Mid Cap and the half of Small Cap
and Star Indexes
9M 17 confirmed the higher velocity
turnover of companies with market cap
lower than €10m
Media (72.0%), Energy & Cleantech
(63.0%) and Industrials (58.3%) the
most traded industries
Liquidity analysisVELOCITY
TURNOVER*
Tot. Volumes /
Free Float
INDUSTRY
Financial and Inv. Companies 25,0% 71,7%
Digital 39,5% 337,3%
Media 72,0% 307,5%
Energy & Cleantech 63,0% 291,7%
Food & Beverage 36,6% 61,7%
Industrials 58,3% 268,0%
Consumer goods and services 51,6% 273,5%
Other 122,2% 392,2%
Mean 51,4% 261,4%
MARKET CAP
< €10m 112,3% 642,6%
€10-25m 58,1% 246,0%
€25-50m 49,0% 233,3%
> €50m 27,1% 138,4%
Mean 51,4% 261,4%
*Tot. Volumes / Num. Ordinary Shares , average last twelve months
Source: EnVent on publ ic data, Borsa Ita l iana, Bloomberg, webs ites and
Admiss ion Documents
Trading Period: 01/01/2017 - 30/09/2017
In Q3 17 FTSE AIM Italia Index increased
by +24% compared to year-end 2016,
below FTSE Italia Small Cap (+39%) and
over FTSE AIM UK All-Share (+19%)
2735
14 19
38
66
2757
34
46
27
0
20
40
60
80
100
2012 2013 2014 2015 2016 2017
Further capital raises and Corporate bond issues on AIM Italia, 2009-Q3 2017 (€m)
Further capital raise Corporate bonds issued
27
62
71
53
84
93
3Q 2017
Note: Further capital raises include rights issues, reserved rights issues and warrants exercise. Corporate bond issues include convertible, non-convertible bonds and mini-bonds. Source: EnVent on public data, Borsa Italiana, websites and Admission Documents
0
20.000
40.000
60.000
80.000
100.000
120.000
140.000
160.000
180.000
200.000
0
100
200
300
400
500
600
700
1Q2
00
9
2Q2
00
9
3Q2
00
9
4Q2
00
9
1Q2
01
0
2Q2
01
0
3Q2
01
0
4Q2
01
0
1Q2
01
1
2Q2
01
1
3Q2
01
1
4Q2
01
1
1Q2
01
2
2Q2
01
2
3Q2
01
2
4Q2
01
2
1Q2
01
3
2Q2
01
3
3Q2
013
4Q2
01
3
1Q2
01
4
2Q2
01
4
3Q2
01
4
4Q2
014
1Q2
01
5
2Q2
01
5
3Q2
01
5
4Q2
01
5
1Q2
016
2Q2
01
6
3Q2
01
6
4Q2
01
6
1Q 2
017
2Q 2
017
3Q 2
017
Value and volumes traded on AIM Italia, 2009-Q3 2017
Value (left) Trades number (right)
€m Units
Source: EnVent on Borsa Italiana Monthly Update
51,2%
108,7%
57,8%
93,3%
0%
10%
20%
30%
40%
50%
60%
70%
80%
90%
100%
110%
120%
AIM ITALIA SMALL CAP MID CAP STAR
Velocity turnover of companies listed on AIM Italia vs companies listed on other Italian reference markets: Q3 2017
Source: EnVent on public data, Borsa Italiana, Bloomberg, websites and Admission Documents
60
80
100
120
140
160
180
200
220
AIM Italia index vs Italy and UK reference indexes, 1.07.2013 - 30.09.2017
Italia Small Cap
Italia All-Share
UK All-Share
AIM UK All-Share
AIM Italia
Note: AIM Italia index launched on July the 7th, 2013 Source: EnVent on Bloomberg
AIM Italia Facts
3
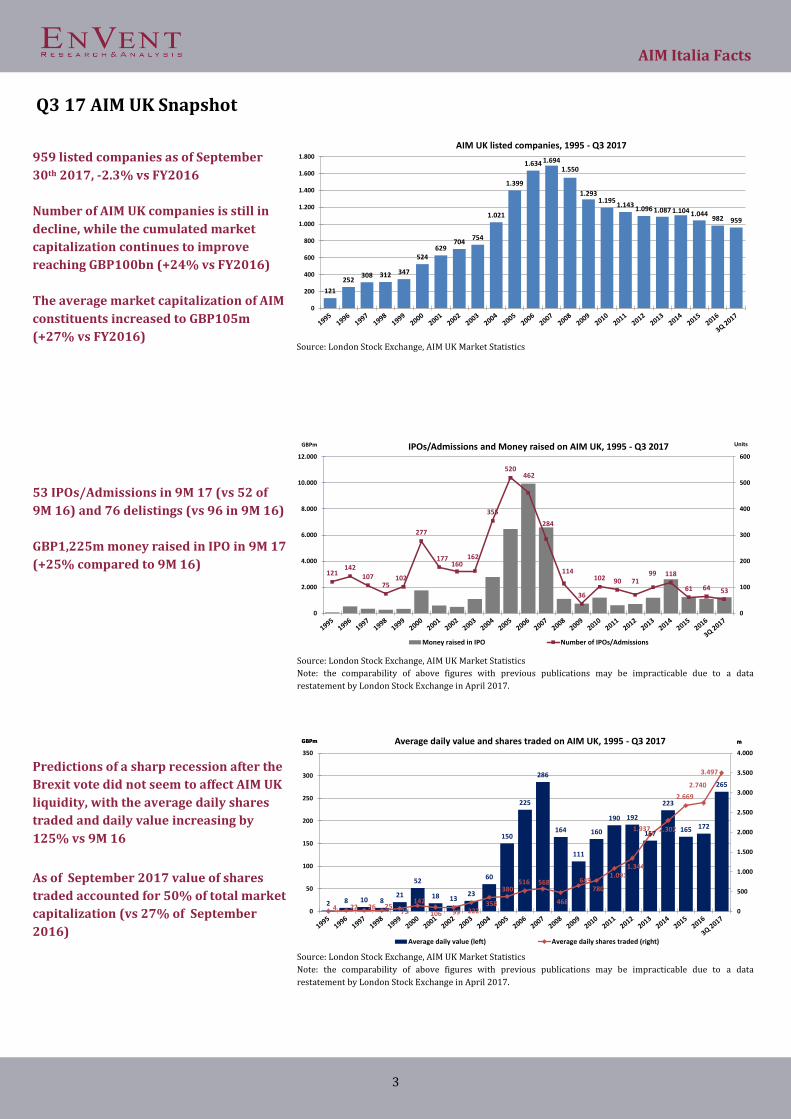
959 listed companies as of September
30th 2017, -2.3% vs FY2016
Number of AIM UK companies is still in
decline, while the cumulated market
capitalization continues to improve
reaching GBP100bn (+24% vs FY2016)
The average market capitalization of AIM
constituents increased to GBP105m
(+27% vs FY2016)
53 IPOs/Admissions in 9M 17 (vs 52 of
9M 16) and 76 delistings (vs 96 in 9M 16)
GBP1,225m money raised in IPO in 9M 17
(+25% compared to 9M 16)
Predictions of a sharp recession after the
Brexit vote did not seem to affect AIM UK
liquidity, with the average daily shares
traded and daily value increasing by
125% vs 9M 16
As of September 2017 value of shares
traded accounted for 50% of total market
capitalization (vs 27% of September
2016)
121
252308 312 347
524629
704754
1.021
1.399
1.634 1.6941.550
1.2931.195
1.1431.096 1.087 1.104 1.044
982 959
0
200
400
600
800
1.000
1.200
1.400
1.600
1.800
AIM UK listed companies, 1995 - Q3 2017
Source: London Stock Exchange, AIM UK Market Statistics
121142
10775
102
277
177160
162
355
520462
284
114
36
102 90 7199 118
61 64 53
0
100
200
300
400
500
600
0
2.000
4.000
6.000
8.000
10.000
12.000
IPOs/Admissions and Money raised on AIM UK, 1995 - Q3 2017
Money raised in IPO Number of IPOs/Admissions
UnitsGBPm
Source: London Stock Exchange, AIM UK Market Statistics
Note: the comparability of above figures with previous publications may be impracticable due to a data
restatement by London Stock Exchange in April 2017.
2 8 10 821
52
18 1323
60
150
225
286
164
111
160
190 192
157
223
165 172
265
4 22 26 2579
142
106 99 222358
380516 568
468
649780
1.0911.344
1.937 2.302
2.669
2.740
3.497
0
500
1.000
1.500
2.000
2.500
3.000
3.500
4.000
0
50
100
150
200
250
300
350
Average daily value and shares traded on AIM UK, 1995 - Q3 2017
Average daily value (left) Average daily shares traded (right)
mGBPm mGBPm
Source: London Stock Exchange, AIM UK Market Statistics
Note: the comparability of above figures with previous publications may be impracticable due to a data
restatement by London Stock Exchange in April 2017.
Q3 17 AIM UK Snapshot
1.
AIM Italia Facts
4
ADMISSION
CAPITAL RAISE/INCREASE
CORPORATE BOND
FLOAT
GREENSHOE OPTION
IPO
MARKET CAPITALIZATION/CAP
MONEY RAISED
SPAC (Special Purpose Acquisition Company)
VELOCITY TURNOVER
VENDOR PLACING
VOLUMES
WARRANT
Transfers and just listings from other markets
Money raised by a company through a right assigned to existing shareholders or reserved
to new shareholders to underwrite additional new issued shares at a determined price
Debt securities issued by a company
Ordinary shares available for trading on the market, owned by non-significant
shareholders (stakes under 5% of share capital on AIM Italia)
Also referred to as over-allotment option, it is granted by the Issuer to the Global
Coordinator, giving the faculty to increase the size of the IPO by the sale of additional
existing shares
Initial Public Offer: sale of ordinary shares of a private company on the equity capital
market within the listing process on a stock exchange
Total market value of 100% Equity of a company listed on a stock exchange
Funds collected in IPO by a private company from the underwriting of new issued shares
New company usually formed for the sole purpose of raising capital to identify and
acquire a suitable business opportunity
Ratio of total traded shares to total ordinary shares in a given period
Funds collected in IPO (or in other placement) by existing shareholders of a company
from the sale of existing shares and from the Greenshoe option exercise
Number of financial instruments traded in a certain period
Derivative financial instrument giving the holder the right to underwrite new issued
shares of a company at a determined price within a certain time frame
Glossary
2.

AIM Italia Facts
5
CONTACTS Franco Gaudenti
Chief Executive Officer
Paolo Verna
Director – Head of Equity Capital Markets
Luigi Tardella
Partner – Co-Head of Research & Analysis
EnVent Capital Markets Limited
42 Berkeley Square – W1J 5AW London
Via Barberini, 95 – 00187 Rome
Via della Spiga, 52 - 20121 Milan
Phone +44 (0) 2035198451
+39 06 896841
www.enventcapitalmarkets.co.uk
DISCLAIMER This publication has been prepared by the Research & Analysis Division of EnVent Capital Markets
Ltd (“EnVent Capital Markets”) with the purpose to convey selected information about the AIM
Italia market, compared to the AIM UK market, to our clients, partners and our network of
professional contacts. EnVent Capital Markets Limited is authorised and regulated in the United
Kingdom by the Financial Conduct Authority (Reference no. 651385).
EnVent Capital Markets does not intend to provide any recommendation about the capital market
predictions and about the future results of analysed companies, but only a static description of AIM
Italia trends observed in the reference period. It is not, under any circumstances, intended for
distribution to the general public. Accordingly, this document is only being communicated to
persons and residents in UK to whom it may lawfully be issued under The Financial Services and
Markets Act 2000 and COBS 4.12 of the FCA’s New Conduct of Business Sourcebook. For residents in
Italy, this document is intended for distribution only to professional clients and qualified
counterparties as defined in Consob Regulation n. 16190 of the 29th October 2007, as subsequently
amended and supplemented.
No part of this document may be reproduced in any manner without the written permission of
EnVent Capital Markets.
This publication has been drawn up on the basis of public information provided by business
information service companies (Bloomberg, S&P Capital IQ, Bureau van Dijk) and by other public
sources (official websites, companies’ Admission Documents, Borsa Italiana website, London Stock
Exchange website and press releases), on which EnVent Capital Markets has not performed an
independent verification. Although EnVent Capital Markets makes every reasonable endeavour to
obtain information from sources that it deems to be reliable, it accepts no responsibility or liability
as to the completeness, accuracy or exactitude of information provided, nor regarding the data,
analysis, comments and elaborations herein included.
This publication does not represent to be, nor can it be construed as being, an offer or solicitation to
buy, subscribe or sell financial products or instruments, or to execute any operation whatsoever
concerning such products or instruments.
This publication shall not in any case be used as basis of an investment decision by persons that, in
case, will have to conduct independent research and analysis before taking any investment decision
at their sole responsibility. The price of the investments and the income derived from them can go
down as well as up, and investors may not get back the amount originally invested.
The access to other information providers or a different analysis of available data may lead to
observations even remarkably different from those contained in this publication.
This document and its contents do not, and are not intended to, constitute, or form any part of, an
offer for sale, invitation to subscribe for or purchase or otherwise acquire transferable securities
within the meaning of sections 85 and 102B of the Financial Services and Markets Act 2000, as
amended (“FSMA”) or according to Italian Legislative Decree no. 58/98 art. 1, clause 1, let. t), as
subsequently amended and supplemented. The information does not represent any expression of
negotiation willingness.