investment management and the fintech revolution
TRANSCRIPT

Investment Management and
the Fintech Revolution
26 March 2015

2 2
Agenda
• An Introduction to State Street Global Exchange
• State Street 2014 Data Analytics Survey
– Global findings
– UK specific findings
• Conclusion
• Industry Feedback
– Shaul David, Fintech Specialist, UKTI Financial Services Organisation
– Lisa Moyle, Head of Financial Services and Payments Programmes, Tech UK

3 3
The Market is Changing Rapidly, Driven by Unprecedented Data Volumes and Complexity, Regulatory Mandates and Technology Advancements
Globalization and
Expanding
Investment Options
Data
Proliferation
Regulatory
Challenges
Increased Importance
of Risk in Search
for Alpha
● Mounting volume of investment data across multiple systems
● Significant Growth of more complex, unstructured data and results
● Clients demand faster, more flexible access to data
● Domicile-specific regulatory regimes are driving new requirements
● Regulators are demanding increased transparency
● Increasing focus on investment policy compliance and monitoring
● Financial crisis drawdowns are leading to spotlight on risk management
● Risk / performance trade-offs are receiving fresh consideration; continued
convergence of performance and risk
● Low interest rates create dependence on riskier asset classes to generate
returns / alpha
● Technology advancement is driving more sophisticated analytics and better
transparency, new analytic approaches and new insights
● Daily and near real time performance views, security and strategy level
● Continued expansion into new asset classes and geographic regions
● Increasing asset class breadth is driving move from individual asset class to multi-asset
class tools
Technology
Advancement Enabling
New Analytic
Approaches
CORP-1304
4 4
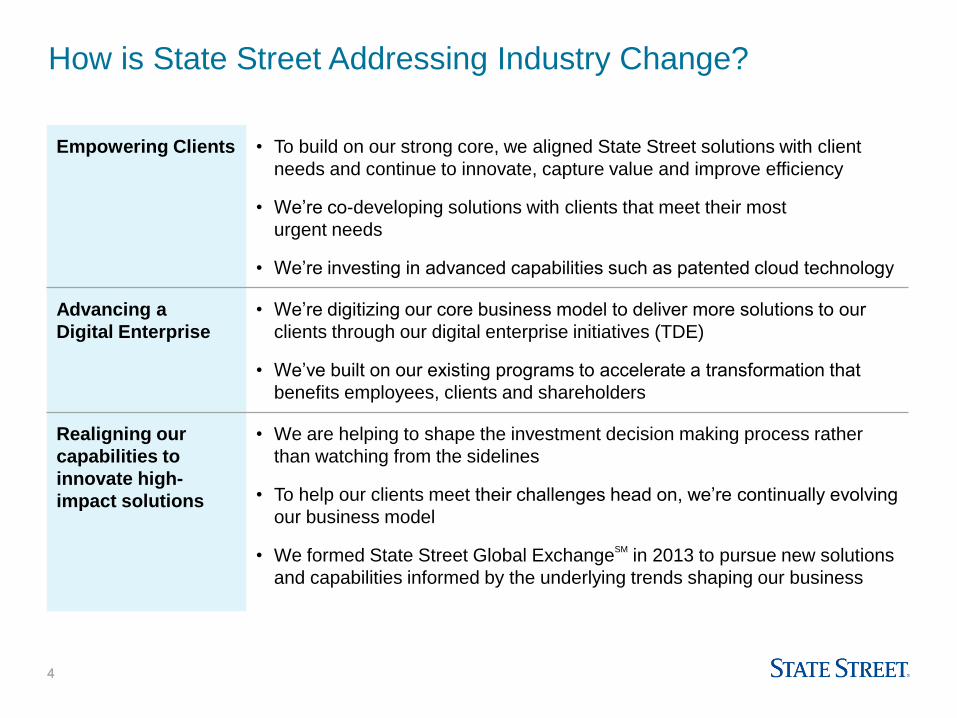
How is State Street Addressing Industry Change?
Empowering Clients • To build on our strong core, we aligned State Street solutions with client
needs and continue to innovate, capture value and improve efficiency
• We’re co-developing solutions with clients that meet their most
urgent needs
• We’re investing in advanced capabilities such as patented cloud technology
Advancing a
Digital Enterprise
• We’re digitizing our core business model to deliver more solutions to our
clients through our digital enterprise initiatives (TDE)
• We’ve built on our existing programs to accelerate a transformation that
benefits employees, clients and shareholders
Realigning our
capabilities to
innovate high-
impact solutions
• We are helping to shape the investment decision making process rather
than watching from the sidelines
• To help our clients meet their challenges head on, we’re continually evolving
our business model
• We formed State Street Global ExchangeSM
in 2013 to pursue new solutions
and capabilities informed by the underlying trends shaping our business
5 5
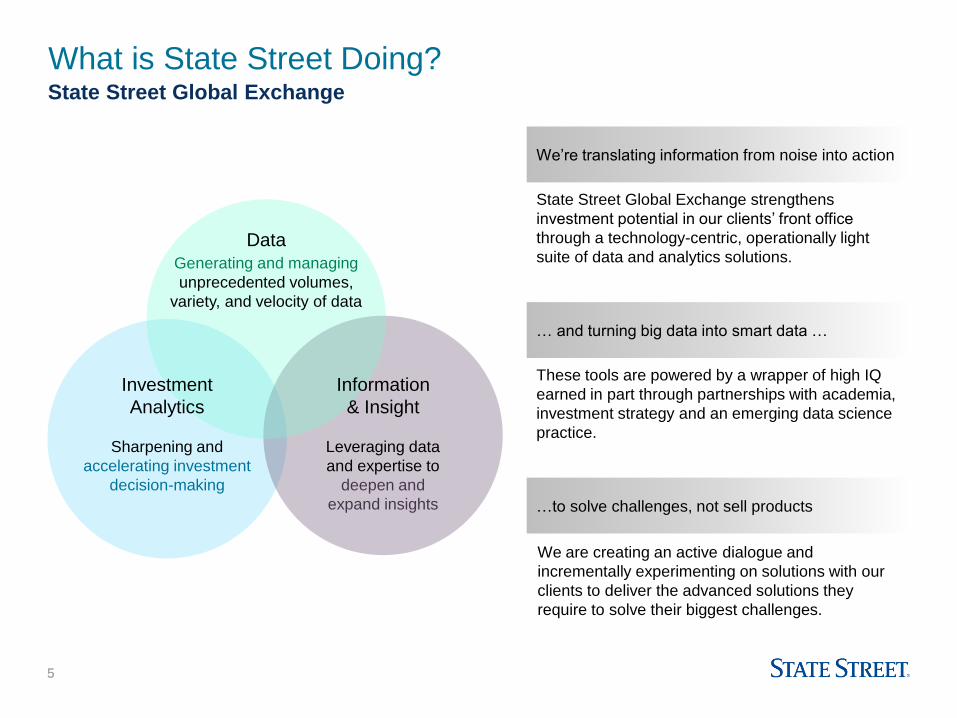
What is State Street Doing? State Street Global Exchange
State Street Global Exchange strengthens
investment potential in our clients’ front office
through a technology-centric, operationally light
suite of data and analytics solutions.
We’re translating information from noise into action
These tools are powered by a wrapper of high IQ
earned in part through partnerships with academia,
investment strategy and an emerging data science
practice.
… and turning big data into smart data …
…to solve challenges, not sell products
We are creating an active dialogue and
incrementally experimenting on solutions with our
clients to deliver the advanced solutions they
require to solve their biggest challenges.
Leveraging data
and expertise to
deepen and
expand insights
Sharpening and
accelerating investment
decision-making
Data
Investment
Analytics
Information
& Insight
Generating and managing
unprecedented volumes,
variety, and velocity of data

6 6
State Street Global Exchange by the Numbers Scale and Expertise
*State Street and McKinsey Global Institute, Global Capital Markets 2013
Scale • A division of State Street and its $28.5 trillion* of post-trade data and insights
comprise 12 percent* of all tradable assets
• One of only 28 global systemically important financial institutions (G-SIFI)
• Strong credit rating and counterparty positioning
Expertise • Global presence of professionals with deep experience who provide solutions to
clients around the world
• Specialized research fueled by partnerships with leading academics
• A full spectrum of proprietary investor behavior, risk and inflation indicators
Trust • Focus on privacy, security and trust
• Shoulder-to-shoulder collaboration with clients
• Modular, open-architecture approach tailored to clients’ needs
• Strategic partner focus, offering clients a suite of front office-focused services
that complement our middle- and back-office capabilities
7 7
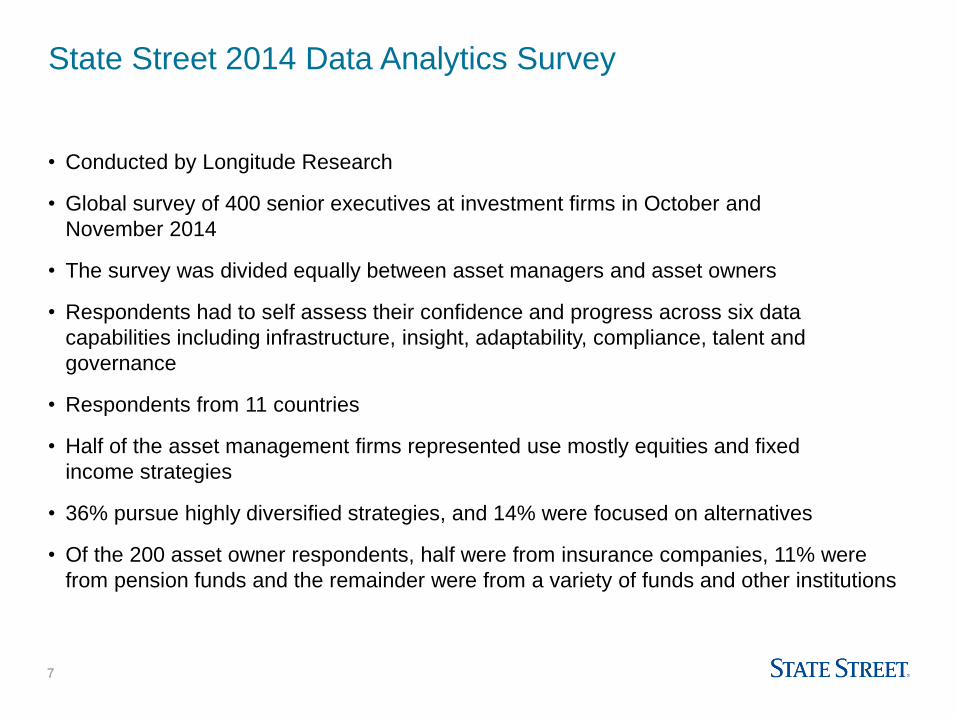
State Street 2014 Data Analytics Survey
• Conducted by Longitude Research
• Global survey of 400 senior executives at investment firms in October and
November 2014
• The survey was divided equally between asset managers and asset owners
• Respondents had to self assess their confidence and progress across six data
capabilities including infrastructure, insight, adaptability, compliance, talent and
governance
• Respondents from 11 countries
• Half of the asset management firms represented use mostly equities and fixed
income strategies
• 36% pursue highly diversified strategies, and 14% were focused on alternatives
• Of the 200 asset owner respondents, half were from insurance companies, 11% were
from pension funds and the remainder were from a variety of funds and other institutions

8 8
Importance of Investment in Data and Analytics
18%
47%
34%
2%
It is a mid-level strategic priority
It is a high strategic priority (near the top)
It is the most important strategic priority
It is a low-level strategic priority (near the bottom)
Source: State Street 2014 Data and Analytics Survey, conducted by
Longitude Research
9 9
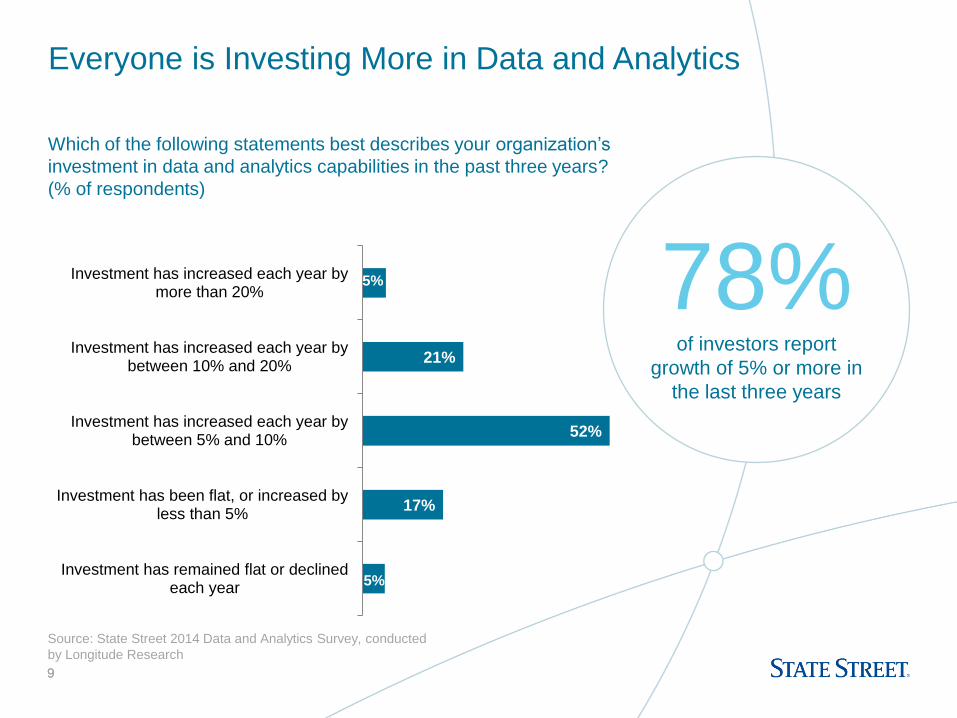
Everyone is Investing More in Data and Analytics
Which of the following statements best describes your organization’s
investment in data and analytics capabilities in the past three years?
(% of respondents)
5%
17%
52%
21%
5%
Investment has remained flat or declinedeach year
Investment has been flat, or increased byless than 5%
Investment has increased each year bybetween 5% and 10%
Investment has increased each year bybetween 10% and 20%
Investment has increased each year bymore than 20% 78%
of investors report
growth of 5% or more in
the last three years
Source: State Street 2014 Data and Analytics Survey, conducted
by Longitude Research

10 10
Our Analysis Identifies Three Key Groups at Different Stages in the Journey to Data Dexterity
Data Starters
Companies at an
early stage in their
data journey
Data Movers
Companies actively
moving toward better
data capabilities
Data Innovators
Companies with
advanced data
infrastructure,
expertise and high-
quality data
governance
27%
36%
37%
Source: State Street 2014 Data and Analytics Survey, conducted by Longitude Research

11 11
Data
Starters
Data
Movers
Data
Innovators
Infrastructure
• Incompatible
legacy systems
• Most data in
separate silos
• Separate
platforms for
different asset
classes
• Aggregation,
visualization,
other data
management
capabilities
upgraded
• Improved data
integration across
investment
portfolio
• Infrastructure &
tools fully
upgraded
• Silos broken
down
• Seamless
integration of
unstructured data
Insight Generation
• Limited ability to
generate
performance and
risk analysis
• Fragmented view
by asset class
• Ability to conduct
scenario & stress
testing across
portfolios
• Integrated view of
risk &
performance
across multi-
asset portfolios
Adaptability
• Capabilities take
much time &
effort to adapt to
any changes in
investment
strategy
• Capabilities can
adapt quickly to
support new
products or
investment
strategies
Compliance
• Capabilities can
adapt quickly to
support new
investment
strategies
Skills
• Data team can
manage data
collection and
basic analytics
functions
Governance
• Basic data
policies and
processes in
place, but
governance is
patchy; little
standardization
• Data gaps,
errors
identified;
cleaning under
way
• Coherent,
agreed
framework for
data
governance
• Reduction in
time to market
for new product
additions, or
new asset
classes
• Systems fully
compliant with
existing
requirements,
but slow to
adapt to new
rules
• Team can
manage data
collection &
integration;
some
capabilities to
perform &
manage
analytics
• Rich, partly
integrated
performance &
risk analysis in
individual asset
classes
• Ability to analyze
performance &
risk of wide range
of alternative
assets
• Excellent data
quality and
traceability
back to source
• Reporting
systems adapt
quickly to new
requirements
across global
footprint
• Regular flow of
insights;
smooth
interaction with
fund managers
• Team has fully
optimized data
management;
advanced
Insight
generation
• Large degree of
standardization
across internal
databases;
external
providers
aligned
• Strong
leadership on
data
governance;
policies &
processes
entrenched
throughout
Our Survey Benchmarked Companies on Six Paths to Innovation
Note: Above sequencing is illustrative only; milestones may be reached simultaneously or in other sequences.

12 12
Excellence Across These Six Areas Gives the Innovators Much Greater Confidence For the Future
Please indicate the level of confidence you have in your institution’s current data capabilities in the
following specific areas. (% respondents with very high confidence)
34%
39%
36%
31%
31%
44%
29%
17%
17%
21%
15%
11%
20%
15%
5%
4%
14%
6%
5%
4%
4%
Reducing investment costs across your asset portfolio
Evaluating risk and performance across the entire portfolio
Optimising our electronic trading strategies
Extracting investable insights from a large volume of data
Managing multiple internal and external data streams in varyingformats
Generating forward-looking insights from our data
Conducting comprehensive, accurate scenario and stress testing onour investment portfolio
Starters Movers Innovators
Source: State Street 2014 Data and Analytics Survey, conducted by Longitude Research
CORP-1309
13 13
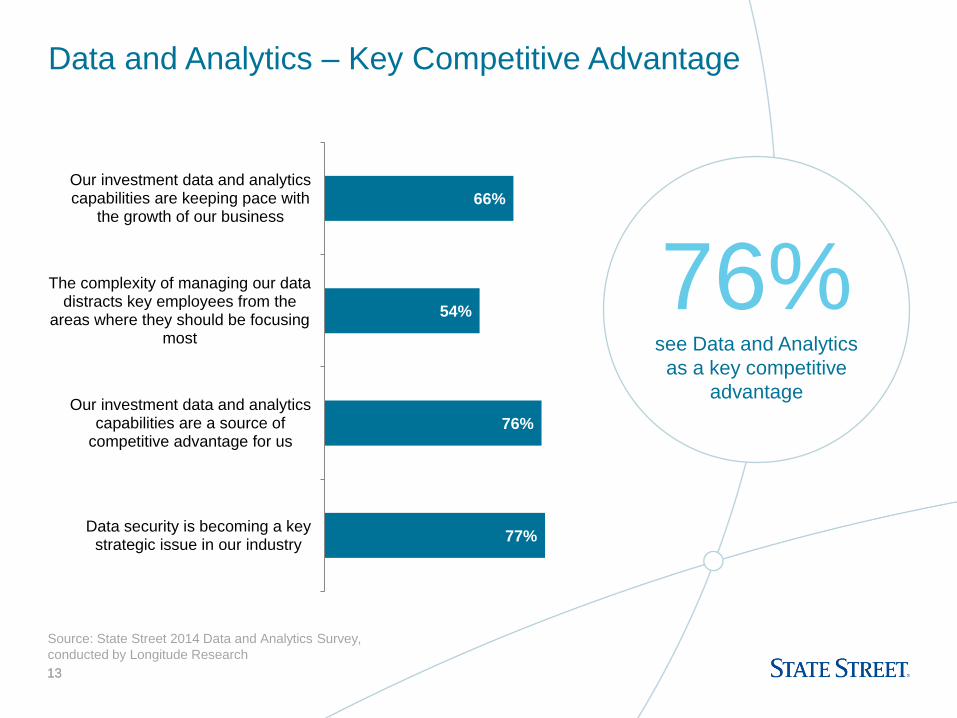
Data and Analytics – Key Competitive Advantage
76% see Data and Analytics
as a key competitive
advantage
77%
76%
54%
66%
Data security is becoming a keystrategic issue in our industry
Our investment data and analyticscapabilities are a source of
competitive advantage for us
The complexity of managing our datadistracts key employees from the
areas where they should be focusingmost
Our investment data and analyticscapabilities are keeping pace with
the growth of our business
Source: State Street 2014 Data and Analytics Survey,
conducted by Longitude Research

14 14
40%
50%
9% 2%
Reporting requirements will increase, but our data capabilities will cope adequately
Reporting requirements will increase, and our data capabilities will struggle to cope
Reporting requirements will largely remain unchanged from today
Reporting requirements will ease
Many Believe They Will Struggle to Cope With More Regulation
55%
Which of the following statements best characterises your expectations for regulatory reporting
requirements over the next three years?
Source: State Street 2014 Data and Analytics Survey, conducted by Longitude Research

15 15
UK Findings
Source: State Street 2014 Data and Analytics Survey, conducted by Longitude Research

16 16
UK Findings – Significant Differences From the Global Picture
40 Respondents
from the UK
33 Work for organisations
with AUM of
$10 billion or more
Source: State Street 2014 Data and Analytics Survey, conducted by Longitude Research

17 17
Three Key Groups at Different Stages in the Journey to Data Dexterity – UK Findings
Data Starters
Companies at an
early stage in their
data journey
Data Movers
Companies actively
moving toward better
data capabilities
Data Innovators Companies with
advanced data
infrastructure,
expertise and high-
quality data
governance
30% 47% 23%
Source: State Street 2014 Data and Analytics Survey, conducted by Longitude Research
(Global = 27%) (Global = 36%) (Global = 37%)
18 18
UK Findings – Strategic Priorities
How do most senior leaders at your institution view the importance of investment data and analytics
relative to other major strategic priorities?
34%
47%
18%
48%
33%
20%
It is the most important strategic priority
It is a high strategic priority (near the top)
It is a mid-level strategic priority
UK Globally
Source: State Street 2014 Data and Analytics Survey, conducted by Longitude Research

19 19
UK Findings – Top Five Factors
Top five factors that are most likely to require changes to the way their firms manage investment data
over the next three years are:
24%
27%
29%
32%
30%
33%
33%
30%
30%
30%
Increased demand from regulators
Competitive pressure
Gowing volume of trading data
Expansion into new asset classes
Expansion into new regions
UK Globally
Source: State Street 2014 Data and Analytics Survey, conducted by Longitude Research
20 20
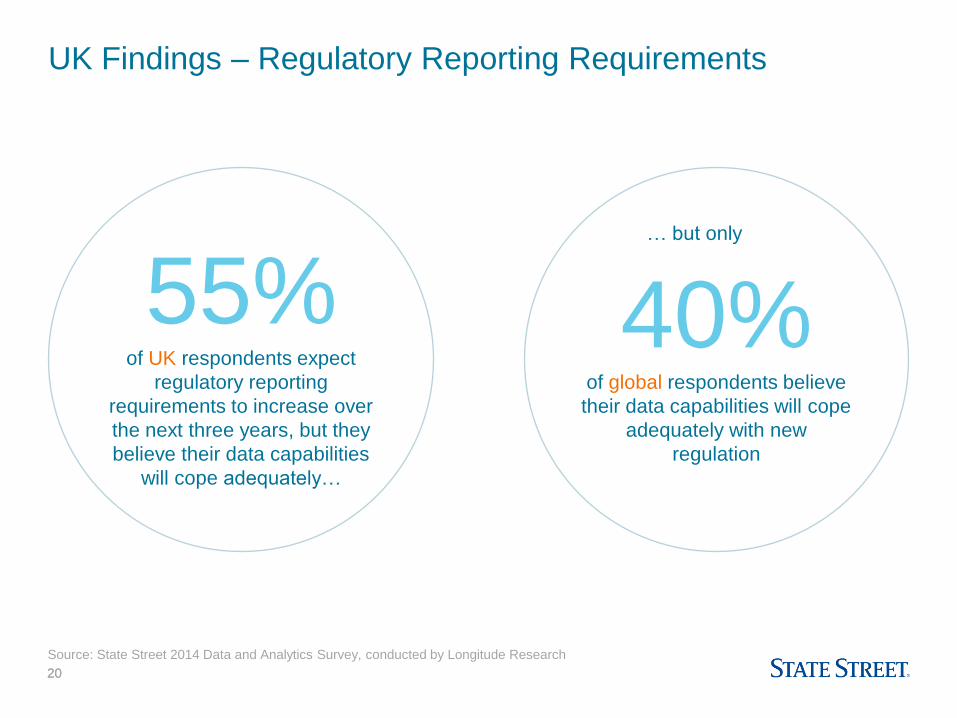
UK Findings – Regulatory Reporting Requirements
55% of UK respondents expect
regulatory reporting
requirements to increase over
the next three years, but they
believe their data capabilities
will cope adequately…
40% of global respondents believe
their data capabilities will cope
adequately with new
regulation
Source: State Street 2014 Data and Analytics Survey, conducted by Longitude Research
… but only

21 21
UK Findings – Competitive Advantage Keeping Pace
Our investment in
analytics and data is
keeping pace
with our business
70% of UK respondents believe
this compared to
66% of all respondents
70% of UK respondents believe
that their investment in
data and analytics is a
competitive advantage
for them compared to
66% of all respondents
Source: State Street 2014 Data and Analytics Survey, conducted by Longitude Research
22 22
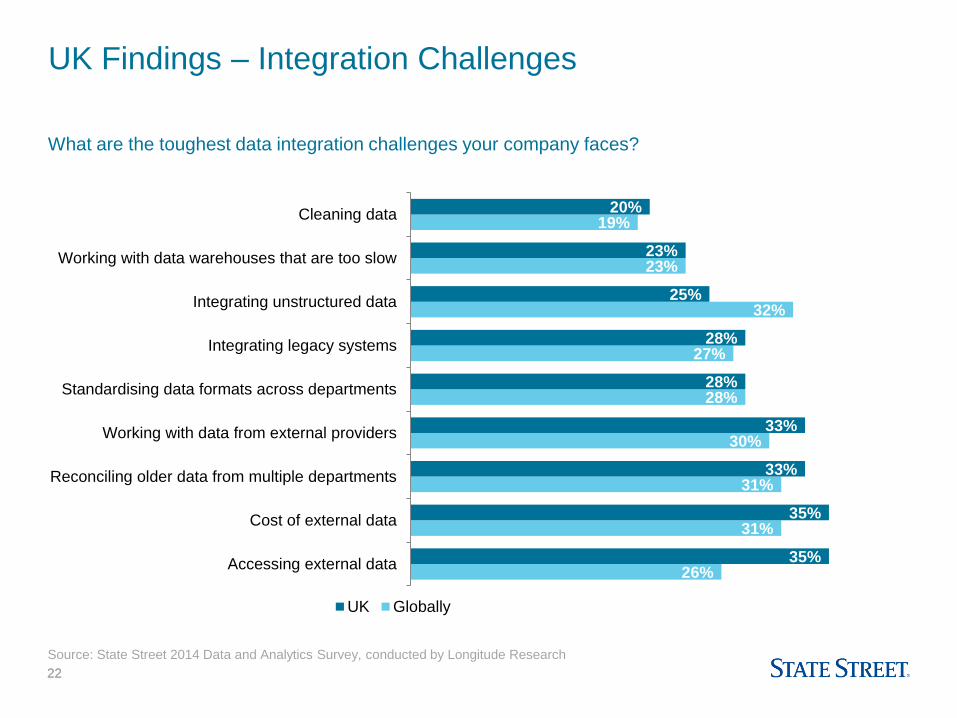
26%
31%
31%
30%
28%
27%
32%
23%
19%
35%
35%
33%
33%
28%
28%
25%
23%
20%
Accessing external data
Cost of external data
Reconciling older data from multiple departments
Working with data from external providers
Standardising data formats across departments
Integrating legacy systems
Integrating unstructured data
Working with data warehouses that are too slow
Cleaning data
UK Globally
UK Findings – Integration Challenges
What are the toughest data integration challenges your company faces?
Source: State Street 2014 Data and Analytics Survey, conducted by Longitude Research
23 23
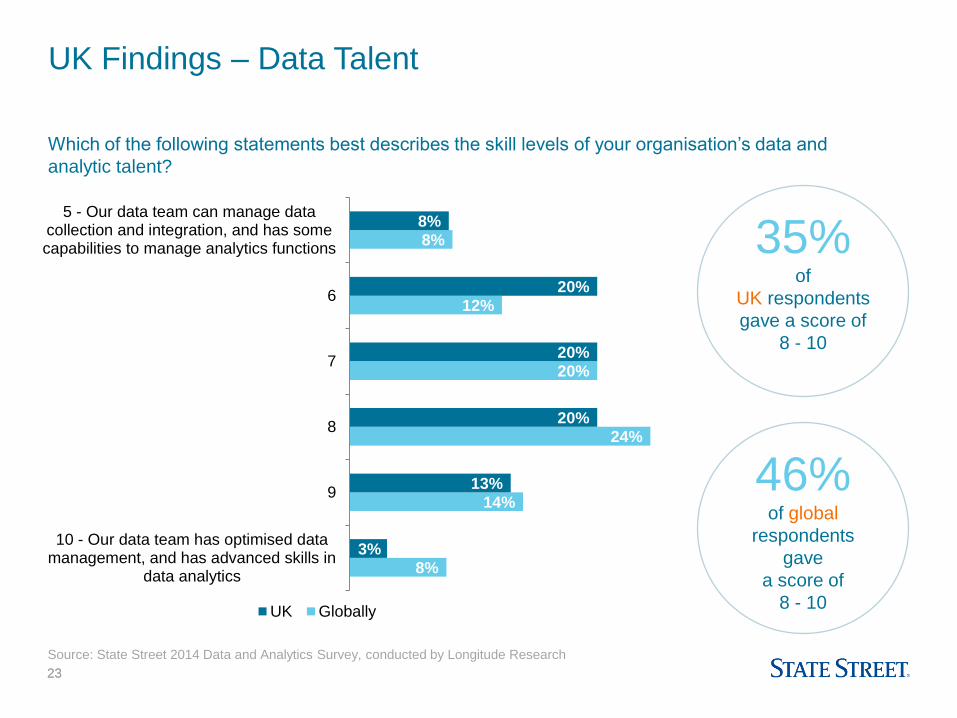
UK Findings – Data Talent
Which of the following statements best describes the skill levels of your organisation’s data and
analytic talent?
8%
14%
24%
20%
12%
8%
3%
13%
20%
20%
20%
8%
10 - Our data team has optimised datamanagement, and has advanced skills in
data analytics
9
8
7
6
5 - Our data team can manage datacollection and integration, and has somecapabilities to manage analytics functions
UK Globally
46% of global
respondents
gave
a score of
8 - 10
35% of
UK respondents
gave a score of
8 - 10
Source: State Street 2014 Data and Analytics Survey, conducted by Longitude Research

24 24
Prioritised Investment in the Next Three Years
24
42%
40%
35%
35%
39%
50%
33%
33%
38%
38%
50%
58%
Adaptability of your data systems to new needs
Analysis and visualisation of data
Data governance (e.g. clear policies, processes andleadership)
Ability of data systems to keep pace with regulatoryrequirements
Data infrastructure
Quality and availability of data talent
UK Global
Source: State Street 2014 Data and Analytics Survey, conducted by Longitude Research
25 25
Conclusion
• The UK places a much bigger priority on data infrastructure and analytics than their
counterparts elsewhere in the world
• The impact of regulation is a much bigger driving force in the UK than elsewhere
• When compared to their global counterparts, a higher percentage of UK respondents
believe their investment in analytics and data is keeping pace with their business growth,
and that this gives them a competitive advantage
• In terms of investment priorities, UK respondents are placing a bigger focus on attracting
and improving data talent and on building data infrastructure

26 26
Appendix:
State Street Global Exchange
27 27
Extending State Street’s Data Capabilities with New Sources and Types of Data
Overview Future Investments
• Extension of State Street Global Exchange
structured data model to accommodate
unstructured information
• Uses State Street’s investment in data
management technology
• Enables new analytics (e.g. sentiment
analysis)
• Investment and pilot work to provide new sentiment
based indicators and indexes
• Opportunity to align product strategy with State
Street Portfolio Solutions business (equity trading)
• ‘Light’ data aggregation capability – 3rd
parties incl. custodians, hedge funds, PE,
etc.
• Feeds analytic tools for transparency and
look-through
• Integrate truView® with DataGXSM*
• Enhance UI to provide modular access to data and
analytics
• Integrate with State Street Global Exchange risk
and attribution with back office performance to
provide full State Street Investment Analytics
solution
• Extends the capabilities of ESP
• Aggregate State Street and 3rd party data
including reference data, custodians, etc
• Self-service technology platform
• Integrated self service capabilities
• Enhanced data management
• Integration of visualization tools
• ‘High def cable’ to LABS
Portfolio
Monitor
DataGXSM*
Unstructured
Data
Aggregation
Sta
te S
tre
et G
lob
al E
xch
an
ge
* Registration is for the EU only
CORP-1304

28 28
Providing End-to-End Investment Analytics Solutions
Overview
• Assess overall fund liquidity and ability to meet funding liabilities and redemption requests
• Insights into the impacts of different types of liquidity events
• Custom reports are tailored to clients’ specific requirements
• Front-office targeted position-based performance reporting offering a comparison of risk v. return
• Attribution analysis based on identifiable fundamental factors, macroeconomic factors, or indexes
that serve as proxies for factors
• Integration with risk for a holistic view of risk / return
• Monitor exposures at the instrument-level and the parent-entity level
• Exposure analysis including per entity pledged collateral, OTC positions and unsettled trades
outstanding, as well as equities and issued debt
• Multi asset class enterprise risk solution based on historical VaR
• Regulatory client and internal board reporting capabilities
• Forward looking simulation capabilities for understanding return, risk, and extreme loss of
investment portfolios
• Integrated Equity, Fixed Income and Credit factor models (based upon latent factor models)
• Provides buy-side firms a measure of the trading costs in the equity, fixed income and foreign
exchange marketplaces
• Solution helps compliance officers fulfill fiduciary responsibility to satisfy best execution
Performance
Risk
Liquidity
Sta
te S
tre
et G
lob
al E
xch
an
ge
Exposure
Monitoring
Trade Cost
Analytics
CORP-1304
29 29
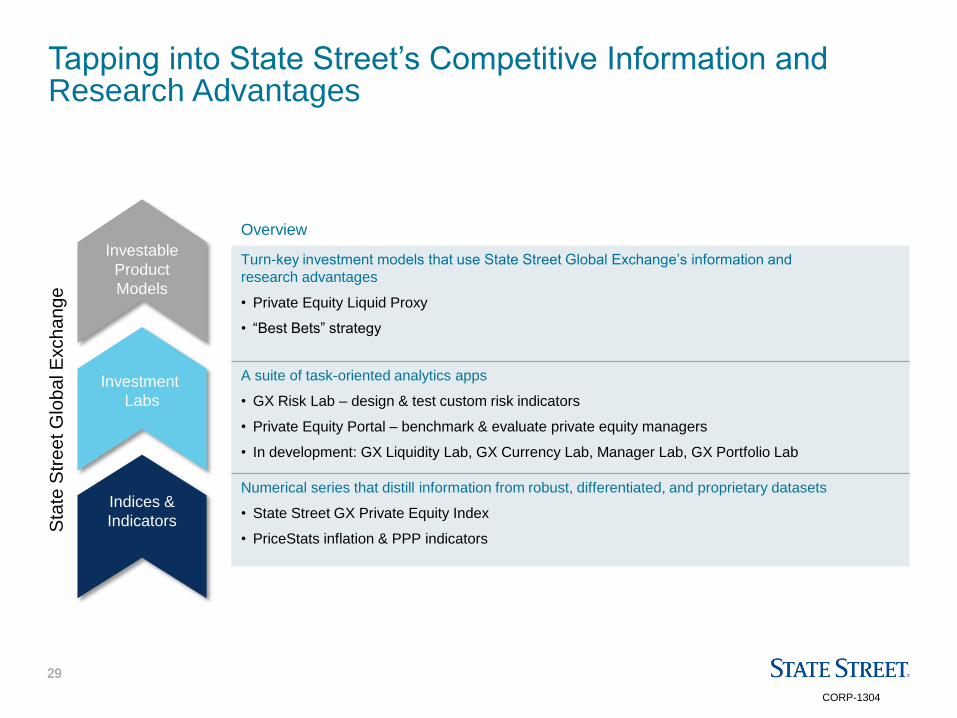
Tapping into State Street’s Competitive Information and Research Advantages
Overview
Turn-key investment models that use State Street Global Exchange’s information and
research advantages
• Private Equity Liquid Proxy
• “Best Bets” strategy
A suite of task-oriented analytics apps
• GX Risk Lab – design & test custom risk indicators
• Private Equity Portal – benchmark & evaluate private equity managers
• In development: GX Liquidity Lab, GX Currency Lab, Manager Lab, GX Portfolio Lab
Numerical series that distill information from robust, differentiated, and proprietary datasets
• State Street GX Private Equity Index
• PriceStats inflation & PPP indicators
Investment
Labs
Indices &
Indicators
Investable
Product
Models
Sta
te S
tre
et G
lob
al E
xch
an
ge
CORP-1304
30 30
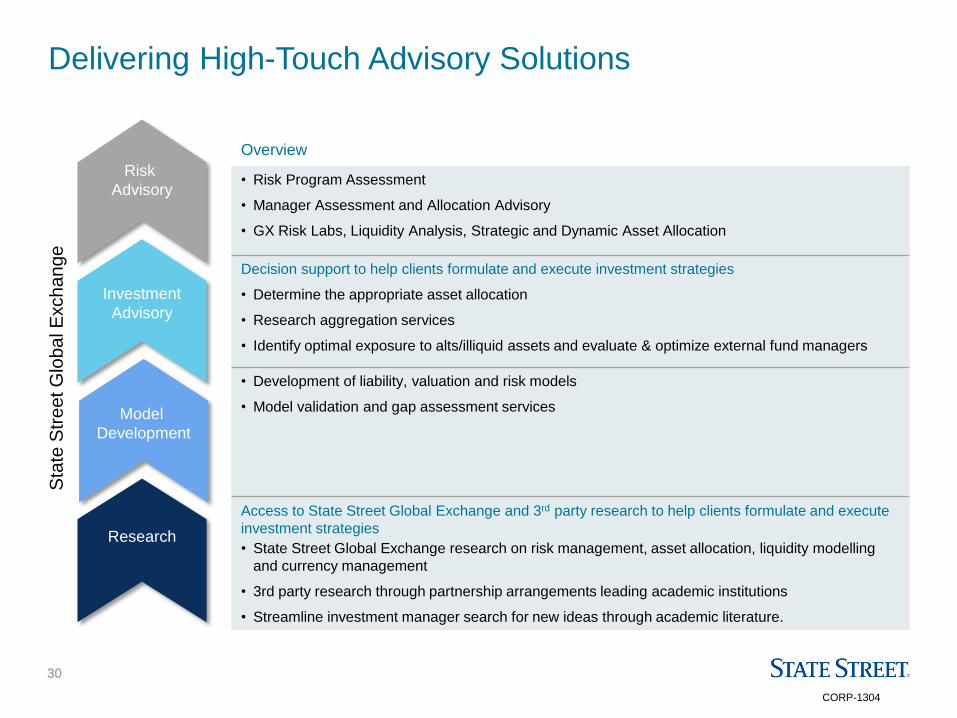
Delivering High-Touch Advisory Solutions
Overview
• Risk Program Assessment
• Manager Assessment and Allocation Advisory
• GX Risk Labs, Liquidity Analysis, Strategic and Dynamic Asset Allocation
Decision support to help clients formulate and execute investment strategies
• Determine the appropriate asset allocation
• Research aggregation services
• Identify optimal exposure to alts/illiquid assets and evaluate & optimize external fund managers
• Development of liability, valuation and risk models
• Model validation and gap assessment services
Access to State Street Global Exchange and 3rd party research to help clients formulate and execute
investment strategies
• State Street Global Exchange research on risk management, asset allocation, liquidity modelling
and currency management
• 3rd party research through partnership arrangements leading academic institutions
• Streamline investment manager search for new ideas through academic literature.
Investment
Advisory
Research
Risk
Advisory
Sta
te S
tre
et G
lob
al E
xch
an
ge
Model
Development
CORP-1304

31 31
Adjust allocations, rebalance
portfolio, implement manager
changes
Construct Measure Manage Report
Model scenarios, explore
new investment strategies,
build your portfolio
Understand how your portfolio is
doing relative to your objectives
and target allocation
Create reports to track adherence
to regulatory mandates and inform
key constituents
Research
• Macro regime indicators
• Flow & behavior indicators
Investment Advisory
• Portfolio & allocation
• Strategy development
• Optimal manager allocation
• Liquidity analysis
• Currency hedging
• Enterprise risk advisory services
Strategy & Scenario Analysis
• State Street Global Exchange
Investment Labs
• Model validation
Portfolio Construction
• Opportunistic hedges / overlays
• Investable product models
Portfolio Analytics
• Returns-based portfolio & factor
analysis
• Alternative analytics
• Manager assessment
Benchmarking
• State Street Global Exchange
GX Private Equity Index / Real
Estate Index
• FX fixing rates
• State Street Universe
Risk Monitoring
• Enterprise risk solutions
• Stress & scenario testing
Regime Monitoring
• Investor Confidence Index
• Inflation indices
• Risk indices
Portfolio Management
• Performance attribution
• Re-balancing services
• Manager monitoring and
selection
Regulatory
• Money Market stress tests
• AIFMD and Form PF
• CPO-PQR
• Solvency II
Investor /Shareholder
• Performance and attribution
• Risk analysis
• Trade Cost Analysis
Boards of Directors, Management
and Compliance
• Standard reports (Best Practice)
• Custom reports
State Street Global Exchange A Deeper Dive: Integrated Client Solutions
Our Solutions Allow You to
Execute on Your Strategies • Data aggregation as an underpinning to our suite of analytics capabilities
• Differentiated research & advisory capabilities as a ‘tip of the spear’ for front
office engagement
CORP-1304
32
State Street Global Exchange℠ is a trademark of State Street Corporation (incorporated in Massachusetts) and is registered or has
registrations pending in multiple jurisdictions.
This information is for general, marketing and/or informational purposes only and it does not constitute investment research or
investment, legal, or tax advice, and it is not an offer or solicitation to buy or sell any product, service, or securities or any financial
instrument, and it does not constitute any binding contractual arrangement or commitment of any kind. State Street Corporation and
its subsidiaries and affiliates (“State Street”) provide products and services to professional and institutional clients, and this is not
directed at retail clients. Any opinions expressed in this document are subject to change without notice. This information has been
prepared and obtained from sources believed to be reliable at the time of publication, however it is provided “as-is” and State Street
makes no guarantee, representation, or warranty of any kind as to its accuracy, suitability, timeliness, merchantability, fitness for a
particular purpose, non-infringement of third-party rights, etc. This information is not intended to be relied upon by any person or
entity. State Street disclaims all liability, whether arising in contract, tort or otherwise, for any losses, liabilities, damages, expenses or
costs arising, either direct or consequential, from or in connection with the use of this document and/or the information herein. No
permission is granted to reprint, sell, copy, distribute, or modify any material herein, in any form or by any means without the prior
written consent of State Street.
This document contains certain statements that may be deemed forward-looking statements. Please note that any such statements
are not guarantees of any future performance, and actual results or developments may differ materially from those
projected. Investing involves risk, including the risk of loss of principal. Diversification does not ensure a profit or guarantee against
loss. This document does not take into account any investor’s particular investment objectives, strategies, or tax and legal status,
relevant regulations, nor does it purport to be comprehensive or intended to replace the exercise of an investor’s own careful
independent review regarding any corresponding investment decision or related analysis. Any forecasted information in the document
is not a reliable indicator for future performance.
Copyright © 2015 State Street Corporation, All rights reserved.
CORP 1369