investigation on protein aggregation in natural and
TRANSCRIPT

University of Naples “Federico II”
Department of Chemical Sciences
Doctoral Thesis
Investigation on protein aggregation in
natural and artificial models
Federica Donnarumma
Tutor: Prof. Delia Picone
Advisor: Prof. Renata Piccoli
XXIX cycle - 2014/2017

2
Contents
List of Abbreviations ................................................................................................ 7
Preface ....................................................................................................................... 9
References ............................................................................................................... 14
Route map of this Thesis ......................................................................................... 19
Part A Natural Models: Ribonuclease A ................................................................. 21
State of art ............................................................................................................... 22
References ............................................................................................................... 24
CHAPTER 1 ........................................................................................................... 25
Bovine pancreatic ribonuclease metalation by Platinum-based drugs: insight on
protein oligomerization ........................................................................................... 26
Abstract ................................................................................................................... 26
1.1 Introduction ....................................................................................................... 27
1.2 Materials and methods ...................................................................................... 30
1.2.1 Production and purification of platinated species .......................................... 30
1.2.2 Circular dichroism spectroscopy .................................................................... 30
1.2.3 Enzymatic activity.......................................................................................... 31
1.2.4 Dissociation experiments ............................................................................... 31
1.2.5 Crystallization and X-ray diffraction data collection ..................................... 31
1.2.6 Cell lines and cellular proliferation assay ...................................................... 32
1.3 Results and Discussion...................................................................................... 33
1.3.1 Platinum complexes influence the oligomerization state of RNase A ...... 33
1.3.2 Production and purification of platinated oligomers .................................. 35

3
1.3.3 Biochemical characterization: Pt-species are interestingly SDS resistant and
strongly stable over time ......................................................................................... 37
1.3.7 Structural characterization: crystallographic structures of cisPt-monomer and
carbo-Pt monomer ................................................................................................... 50
1.4 Conclusions and ongoing works ....................................................................... 52
1.5 References ......................................................................................................... 54
CHAPTER 2 ........................................................................................................... 59
Engineered C-terminal domain exploited to study the pleiotropic effects of hinge
loop.......................................................................................................................... 60
Abstract ................................................................................................................... 60
2.1 Introduction ....................................................................................................... 61
2.2 Materials and Methods ...................................................................................... 63
2.2.1 Production of RNase A mutants: design, cloning, expression and purification
63
2.2.2 Circular dichroism spectroscopy .................................................................... 63
2.2.3 Size exclusion chromatography ..................................................................... 64
2.2.4 Crystallization and data collection ................................................................. 64
2.3 Results and Discussion...................................................................................... 65
2.3.1 C-terminus engineered RNase A mutant: background and design ................ 65
2.3.2 C-terminus engineered RNase A mutant: production of RNase A-Onc ........ 66
2.3.3 Motif β-loop-β in RNase A-Onc: effects on protein stability ....................... 67
2.3.4 Crystal structure of RNaseA-Onc monomer .................................................. 69
2.3.5 Aggregation propensity .................................................................................. 72
2.4 Conclusions and ongoing works ....................................................................... 75

4
2.5 References ......................................................................................................... 76
Part B Artificial Models: MNEI ............................................................................. 78
State of art ............................................................................................................... 79
References ............................................................................................................... 82
CHAPTER 3 ........................................................................................................... 85
From monomers to fibres: temperature, pH and ionic strength influence MNEI
stability .................................................................................................................... 86
Abstract ................................................................................................................... 86
3.1 Introduction ....................................................................................................... 87
3.2 Materials and methods ...................................................................................... 88
3.2.1 Production of recombinant MNEI .................................................................. 88
3.2.2 Sample preparation ........................................................................................ 89
3.2.4 Circular dichroism (CD) spectroscopy .......................................................... 89
3.2.5 Fourier Transform Infrared Spectroscopy (FT-IR) ........................................ 90
3.2.6 Thioflavin T (ThT) binding assay .................................................................. 91
3.2.7 Atomic Force Microscopy (AFM) ................................................................. 91
3.3 Results and Discussion...................................................................................... 92
3.3.1 Thermal stability ............................................................................................ 92
3.3.2 Aggregation propensity under non-denaturing conditions............................. 93
3.3.3 FT-IR spectroscopy: a new tool to study soluble and insoluble species ........ 97
3.3.4 The influence of NaCl on the formation of high molecular aggregates ....... 101
3.3.5 MNEI fibrillization: new conditions ............................................................ 104
3.3.5 ThT binding.................................................................................................. 107

5
3.3.6 Fibres and amorphous species...................................................................... 109
3.4 Conclusions and ongoing works ..................................................................... 111
3.5 References ....................................................................................................... 113
CHAPTER 4 ........................................................................................................ 115
MNEI early steps of unfolding: new NMR insight ............................................... 116
Abstract ................................................................................................................. 116
4.1 Introduction ..................................................................................................... 117
4.2 Materials and Methods .................................................................................... 119
4.2.1 Protein expression and purification.............................................................. 119
4.2.2 NMR spectroscopy ....................................................................................... 119
4.2.3 Hydrogen/ Deuterium exchange .................................................................. 120
4.3 Results and Discussion.................................................................................... 121
4.3.1 HSQC spectrum at high magnetic field ....................................................... 121
4.3.2 Temperature effect ....................................................................................... 122
4.3.3 NaCl effect ................................................................................................... 123
4.3.4 Stability and compactness: H/D exchange experiments .............................. 126
4.4 Conclusions and ongoing works ..................................................................... 130
4.5 References ....................................................................................................... 132
Part C Recombinant Proteins: Procedures ........................................................... 134
C.1 Expression and purification of recombinant RNase A-Onc ........................... 135
Preparation of the mutant RNase A-Onc: design .................................................. 135
Preparation of the mutant RNase A-Onc: cloning procedures .............................. 136
Recombinant expression of RNaseA-Onc ............................................................ 139

6
Isolation and denaturation of inclusion bodies ..................................................... 140
Renaturation procedures ....................................................................................... 141
Purification of RNase A-Onc monomeric form .................................................... 142
C.2 Expression and purification of recombinant MNEI ....................................... 143
Expression procedures .......................................................................................... 143
Purification procedures ......................................................................................... 144
Final remarks......................................................................................................... 146

7
List of Abbreviations
3D-DS: 3-dimensional domain swapping
AFM: Atomic Force Microscopy
AMP: ampicillin
carboPt: carboplatin
cisPt: cisplatin
CD: circular dichroism
CDDP: cis-diamminedichloroplatinum(II)
DSS: 2,2-dimethyl-2-silapentene- 5-sulfonate sodium
DTT: dithiothreitol
FPLC: Fast Performance Liquid Chromatography
FT-IR: Fourier-Trasform Infrared (spectroscopy)
H/D: Hydrogen/Deuterium (exchange)
HSQC: Heteronuclear Single Quantum Correlation
IPTG: isopropil-β-D-1-tiogalattopiranoside
KAN: kanamicine
LB: Luria-Bertani medium
NMR: Nuclear Magnetic Resonance (spectroscopy)
oxaPt: oxaliplatin
PAGE: poly-acrylamide gel electrophoresis
RNase A: bovine pancreatic ribonuclease
RNase A-Onc: bovine pancreatic ribonuclease-onconase
SDS: sodium dodecyl sulphate
Tm: Temperature of melting

8

9
Preface
Protein aggregation is a very fascinating topic concerning the behaviour of proteins
that can form high molecular structures either spontaneously or artificially, when the
environmental conditions are modified. The smallest structural unit from which take
origin an aggregate, called protomer, can assemble in supramolecular structures,
which are sometimes selected by nature ab initio, or often built up as a response to
natural or non-natural events. Anyway, in both cases oligomers can follow different
fates. They can be highly stable, mainly when formed by irreversible phenomena, or
can represent metastable or even transient events, thus undergoing fast or slow
dissociation. Covalently linked oligomers are the most stable supra-molecular
protein structures. The majority of protein oligomers forms through non-covalent
associations, which can often lead to metastable dimers or oligomers. Their lability
is essentially related to the nature of the interaction between the subunits, and to the
extent of interface area. H-bonds are weaker than electrostatic interactions, but they
can be crucial in anchoring a domain into a specific orientation that can be further
stabilized by hydrophobic or electrostatic interactions.
Proteins accomplish several cellular functions required to live and their
folding/unfolding are constantly checked in cells. Since the biosynthesis on ribosome,
the protein chains adopt a definite three-dimensional structure known as native
conformation, thanks to an efficient control-system. When the native state is neither
achieved either maintained, the proteins can self-assemble forming insoluble
deposits. The accumulation of these aggregates causes the loss of function of the
protein and the saturation of the protein control systems (chaperones and proteases);
this process can causes toxicity and pathogenicity [1-2]. Researchers have been
aware since the early days of protein studies that, under stress conditions, proteins
may aggregate, often in an irreversible way. What is new in modern Protein

10
Chemistry is the realization that aggregation is the first etiologic event in an
increasing number of pathologies and that aggregation often occurs through
misfolding rather than just unfolding [2,3]. Dramatic examples of pathologies
associated with misfolding include Alzheimer’s and Parkinson’s diseases, the
Huntington’s chorea, prion diseases and amyloid lateral sclerosis [4,5]. The common
feature in all these devasting pathologies is the accumulation of amorphous or more
often fibrillar protein aggregates, called amyloid fibres, that causes neuronal toxicity
[6]. The growing interest in protein aggregation is not exclusively restricted to its
medical implications and to a relatively small number of proteins involved in
diseases. Oligomeric proteins are prevalent in nature more than we suppose. Several
proteins have been found to lead to higher oligomers and fibres, suggesting the
hypothesis that most, if not all, amino acid sequences might be able to misfold in a
similar ordered way [7]. This evidence places protein misfolding into a much wider
perspective. It has also been shown more recently that protein aggregation is not
always toxic but it is an advantageous feature for a number of reasons, including new
opportunities for functional control, such as allosteric regulation and the
establishment of higher-order complexity [7]. Oligomerization represents a very
important phenomenon in the formation of molecular machines, like for motor
proteins (kinesin, microtubules) that are indispensable to confer cellular integrity,
intra/intercellular communication and movement. The formation of essential
“cellular bodies” such as melanosomes, dendritic cell aggresome-like structures, P-
bodies and stress granules depends on protein aggregation [8]. It is also well
established that some cellular functions involve the formation of amyloid-like
structures, as occurs for CPEB (cytoplasmic polyadenylation element-binding
protein) fibres that improve the intraneuronal communications and the consolidation
of long term memory when they accumulate on the synapsis [9]. The aggregation
propensity have been exploited by a large number of organism. Even viruses, that
are not completely “organized” as a cell, are able to infect and destroy the host-cell
thanks to the capability of the proteins on their envelope to self-assembly [10].

11
In vivo, protein aggregation occurs in response to a wide range of “stimuli” that could
be:
- genetic, i.e. a modifications in DNA and or RNA encoding for a monomeric
precursor;
- biochemical, i.e. a modifications during the protein anabolism and/or
catabolism;
- physicochemical, i.e. changes in pH, temperature, protein concentration,
ionic strength.
As described, such environmental conditions can have negative or positive effects
on aggregation propensity and protein functionality. Understanding how proteins
aggregate has therefore become an important goal of modern Structural Biology.
Protein aggregates can have very different morphologies which may range from
amorphous to well ordered fibrillar structures. In the latter case, the aggregated
species are usually named amyloid fibres from the original idea of Rudolph Virchow
who, around 1854, thought sugars as important components of the aggregates [11].
The current accepted definition is ‘an unbranched protein fibre whose repeating
substructure consists of β-strands that run perpendicular to the fibre axis, forming a
cross-β sheet of indefinite length’ [12]. This structure would be a universal fold that
most if not all proteins may be able to adopt in given conditions [13] It is known that
the repeating cross-β sheet motif is characterised by an X-ray diffraction pattern with
a meridional reflection at around 4.7 Å corresponding to the inter-β strand spacing
and an equatorial reflection at around 6–11 Å corresponding to the distance between
stacked β-sheets [13,14]. Since these structural features have been observed in
several aggregates both in vitro than in vivo, the amyloid fold seems to be a very
stable structure [7]. Another important property of the amyloid deposits is that they
have inherent birefringence that increases intensely after staining, for instance, with
the Congo red dye. They are also very resistant to proteolytic degradation. However,

12
there are other mechanisms by which proteins can form ordered aggregates without
raising the cross-β motif. These include domain-swapping and end-to-end stacking
[15-17].
The medical [18], biological [19] and fundamental [20] interest associated with
protein aggregation and fibrillogenesis raises the important question of which
characteristics promote oligomerization and how it is possible to predict and
modulate this behaviour. A set of principles has been identified. First of all, it is
assumed that the information is stored linearly along the amino acid sequence [21].
Regions with high propensity to aggregate are rich in hydrophobic amino acids and
poor in charged residues. π–stacking of aromatic residues has also been implicated
to play an important role [22,23]. Second, the sequence must have some tendency to
adopt structural features compatible with the semi-ordered structure observed in the
repetitive assembly proper of fibres [17,24]. This observation may be easily
rationalized by considering that essential elements in stabilizing β structures are not
only the inter-strand hydrogen bonds but also packing of the side chains. Therefore,
while polyproline is unlikely to form fibres since its conformation is hardly
compatible with a β-structure, sequences with β-propensity could easily form
amyloids. Sequences which adopt an α-helical structure in a globular protein can act
as chameleons and form packed fibrillar β-structures [25-28].
Finally, the last aspect that seems to be important in fibre formation is that
aggregation prone regions need to be at least partially if not completely accessible.
This is easily obtained in peptides and intrinsically unstructured proteins but can be
more difficult in globular proteins, in which potential β-prone sequences are usually
well buried in the protein core. Under given conditions it is possible to affect the
solvent accessibility and the proteins self-assemble.
Much of what it is known about protein aggregation and misfolding, derives from
biophysical studies in vitro. Proteins can be grouped into two main families: the
intrinsically unfolded proteins [29,30], and globular proteins or domains [2]. There
is a distinct difference between the two families. How the disordered proteins

13
aggregate is quite easy to understand: regions in the linear sequence more
aggregation prone start the event when their concentration in the cell is above their
solubility [31,32]. Conversely, it is more difficult to understand how globular
proteins aggregate. In fact, they generally do not unless exposed to environmental
perturbations [33]. High temperature [34, 35], high pressure [36,37], low pH [38],
alcohols [39], chaotropic solvents and sample shaking [40] have widely been used
for this purpose to study aggregation in vitro. Under these conditions, proteins that
have evolved to protect their buried hydrophobic core from the solvent accessibility,
may misfold and aggregate [5,41]. More recently, a subfamily of globular proteins
was identified whose members have the tendency to aggregate spontaneously
without the involvment of highly denaturing conditions [42]. To explain this
behaviour it was hypothesized that local structural fluctuations, rather than global
changes, could promote conformational transitions which would then initiate
aggregation. This hypothesis may well explain, for instance, the fibrillation of
acylphosphatase from S. solfataricus, which retains its global fold and enzymatic
function under mildly destabilizing conditions [43].
The molecular mechanisms leading to aggregation are still unclear. For this reason,
small globular proteins may serve as useful models to study aggregation. They are
simple systems and it is easier to follow the behaviour by changing few parameters
systematically. Additionally, thanks to their small size, are amenable to
computational analysis. Finally, it is straightforward to design and produce mutants
aimed to rigorously investigation on a feature of interest.

14
References
[1] Knowles TP, Vendruscolo M, Dobson CM. (2014) The amyloid state and its
association with protein misfolding diseases. Nat Rev Mol Cell Biol. 15(6):384-96.
[2] Chiti F., Dobson C.M. (2006) Protein misfolding, functional amyloid, and human
disease Annu. Rev. Biochem. 75:333–366.
[3] Luheshi L M and Dobson C M. Bridging the gap: From protein misfolding to
protein misfolding diseases (2009) FEBS Lett. 583 2581–6
[4] Bellotti V, Mangione P and Stoppini M (1999) Biological activity and
pathological implications of misfolded proteins Cell. Mol. Life Sci.55 977–91
[5] Dobson C M (1999) Protein misfolding, evolution and disease.Trends Biochem.
Sci. 24 329–32
[6] Stefani M and Dobson C M (2003) Protein aggregation and aggregate toxicity:
new insights into protein folding, misfolding diseases and biological evolution J. Mol.
Med. 81 678–99
[7] Pastore A, Temussi PA. (2012) Protein aggregation and misfolding: good or evil?
J. Phys.: Condens. Matter 24 244101-244110
[8] Huff M E, Balch W E and Kelly J W (2003) Pathological and functional amyloid
formation orchestrated by the secretory pathway Curr. Opin. Struct. Biol. 13 674–82
[9] Kausik S and Kandel ER. (2016) The Role of Functional Prion-Like Proteins in
the Persistence of Memory. Cold Spring Harbor Laboratory Press. 8:a021774
[10] Marreiros R, Müller-Schiffmann A, Bader V, Selvarajah S, Dey D, Lingappa
VR and Korth C. (2015) Viral capsid assembly as a model for protein aggregation

15
diseases: Active processes catalyzed by cellular assembly machines comprising
novel drug targets. Virus Res 207:155-64
[11] Sipe JD and Cohen AS (2000) Review: History of the Amyloid Fibril. J. Struct.
Biol. 130 88–98
[12] Greenwald J and Riek R (2010) Biology of amyloid: structure, function, and
regulation. Structure 18 1244–60
[13] Astbury WT. (1935) X-Ray Studies of Protein Structure. Nature 137, 803-805
[14] Sunde M, Serpell LC, Bartlam M, Fraser PE, Pepys MB and Blake CC (1997)
Common core structure of amyloid fibrils by synchrotron X-ray diffraction. J. Mol.
Biol. 273 729–39
[15] Bennett MJ, Sawaya M R and Eisenberg D. (2006) Deposition diseases and 3D
domain swapping. Structure 14 811–24
[16] Eisenberg D, Nelson R, Sawaya MR, Balbirnie M, Sambashivan S, Ivanova M
I, Madsen AØ and Riekel C (2006) The Structural Biology of Protein Aggregation
Diseases: Fundamental Questions and Some Answers. Acc. Chem. Res.39 568–75
[17] Nelson R and Eisenberg D (2006) Structural models of amyloid-like fibrils. Adv.
Protein Chem. 73 235–82
[18] Powers ET, Morimoto RI, Dillin A, Kelly JW and Balch WE (2009) Biological
and chemical approaches to diseases of proteostasis deficiency. Annu. Rev. Biochem.
78 959–91
[19] Fowler DM, Koulov AV, Balch WE and Kelly JW (2007) Functional amyloid-
-from bacteria to humans. Trends Biochem. Sci. 32 217–24

16
[20] Zhang S (2003) Nature Biotechnol. Fabrication of novel biomaterials through
molecular self-assembly21 1171–8
[21] Chiti F, Stefani M, Taddei N, Ramponi G and Dobson CM (2003)
Rationalization of the effects of mutations on peptide andprotein aggregation rates
Nature 424 805–8
[22] Tartaglia, G.G., Cavalli, A., Pellarin, R. & Caflisch, A. (2004). The role of
aromaticity, exposed surface, and dipole moment in determining protein aggregation
rates. Protein Sci 13(7), 1939-41.
[23] Gazit, E. (2002). A possible role for π-stacking in the self-assembly of amyloid
fibrils. Faseb J 16(1), 77-83.
[24] Marshall KE and Serpell LC 2(009) Structural integrity of β-sheet assembly
Biochem. Soc. Trans. 37 671–6
[25] Zou W Q and Gambetti P (2007) Prion: the chameleon protein Cell. Mol. Life
Sci. 64 3266–70
[26] Atwood CS, Obrenovich ME, Liu T, Chan H, Perry G, Smith MA and Martins
RN (2003) Amyloid-β: a chameleon walking in two worlds: a review of the trophic
and toxic properties of amyloid-β Brain Res. Brain Res. Rev. 43 1–16
[27] Uversky VN (2003) A Protein-Chameleon: Conformational Plasticity of α-
Synuclein, a Disordered Protein Involved in Neurodegenerative Disorders. J. Biomol.
Struct. Dyn. 21 211–34
[28] de Chiara C and Pastore A (2011) Supramolecular Structure and Function vol
10, ed J Brnjas-Kraljevi´c and G Pifat-Mrzljak (Dordrecht: Springer) pp 87–100

17
[29] Huang A and Stultz CM (2009) Finding order within disorder: elucidating the
structure of proteins associated with neurodegenerative disease. Future Med. Chem.
1 467–82
[30] Babu MM, van der Lee R, de Groot NS and Gsponer J (2011) Intrinsically
disordered proteins: regulation and disease. Curr.Opin. Struct. Biol. 21 432–40
[31] Gsponer J, Futschik ME, Teichmann A and Babu M M (2008) Tight Regulation
of Unstructured Proteins: From Transcript Synthesis to Protein Degradation.Science
322 1365–8
[32] Jain N, Bhattacharya M and Mukhopadhyay S (2011) Chain Collapse of an
Amyloidogenic Intrinsically Disordered Protein. Biophys. J. 101 1720–9
[33] Chiti F, Webster P, Taddei N, Clark A, Stefani M, Ramponi G and Dobson CM
(1999) Designing conditions for in vitro formation of amyloid protofilaments and
fibrils. Proc. Natl Acad. Sci. USA 96 3590–4
[34] Litvinovich SV, Brew SA, Aota S, Akiyama SK, Haudenschild C and Ingham
KC (1998) Formation of amyloid-like fibrils by self-association of a partially
unfolded fibronectin type III module. J. Mol. Biol. 280 245–58
[35] F¨andrich M, Fletcher MA and Dobson CM (2001) Amyloid fibrils from muscle
myoglobin. Nature 410 165–6
[36] Ferr˜ao-Gonzales AD, Souto SO, Silva JL and Foguel D (2000) The
preaggregated state of an amyloidogenic protein: Hydrostatic pressure converts
native transthyretin into the amyloidogenic state. Proc. Natl Acad. Sci. USA 97
6445–50

18
[37] De Felice FG, Vieira MN, Meirelles MN, Morozova-Roche LA,Dobson CM
and Ferreira ST (2004) Targeting the neurotoxic species in Alzheimer’s disease:
inhibitors of Aβ oligomerization FASEB J. 18 1099–101
[38] McParland VJ, Kad NM, Kalverda AP, Brown A, Kirwin-Jones P, Hunter MG,
Sunde M and Radford SE (2000) Partially Unfolded States of β2-Microglobulin and
Amyloid Formation in Vitro. Biochemistry 39 8735–46
[39] Sassi P, Giugliarelli A, Paolantoni M, Morresi A and Onori G (2011) Unfolding
and aggregation of lysozyme: A thermodynamic and kinetic study by FTIR
spectroscopy. Biophys. Chem. 158 46–53
[40] Apetri AC and Surewicz WK (2003) Atypical Effect of Salts on the
Thermodynamic Stability of Human Prion Protein. J. Biol. Chem. 278 22187–92
[41] Kelly JW (1996) Alternative conformations of amyloidogenic proteins govern
their behaviour. Curr. Opin. Struct. Biol. 6 11–7
[42] Chiti F and Dobson CM. (2009) Amyloid formation by globular proteins under
native conditions. Nature Chem. Biol. 5 15–22
[43] Plakoutsi G, Bemporad F, Monti M, Pagnozzi D, Pucci P and Chiti F. (2006)
Exploring the Mechanism of Formation of Native-like and Precursor Amyloid
Oligomers for the Native Acylphosphatase from Sulfolobus solfataricus.Structure 14
993–1001

19
Route map of this Thesis
In this Thesis, two proteins, RNase A and MNEI have been proposed as models for
aggregation studies. Although different in structure and in function, they share
common hallmarks. Both of them are:
a) aggregation prone: their aggregation propensity is well known;
b) small: their molecular weight, i.e 13.7 KDa for RNase A and 11 KDa for
MNEI, make them suitable proteins to be studied by several
physicochemical technics. Additionally it can be easier to produce them as
recombinant proteins thanks to well optimized procedures;
c) Monomeric: their native monomeric fold make them useful systems to
monitor the oligomerization pathways starting from a most simple
protomeric subunit;
Through a multidisciplinary approach, an extensive investigation on the relationship
between environmental changes and aggregation propensity has been performed.
Wide attention has been focused on the most common physicochemical agents, such
as pH, temperature, ionic strength, metalation on stability and aggregation. At the
same time genetic mutations in “hot- regions” were also investigated.
The Thesis is divided into three big sections. The Part A, is completely dedicated to
RNaseA, the natural model. In the Chapter 1 an extensive study on the influence of
metalation on protein aggregation has been pursued. The following Chapter 2 is
focused on a RNaseA-Onc mutant designed to investigate the role of hinge loop on
protein stability and aggregation propensity.

20
The second part of this Thesis, Part B, is ruled by MNEI, the artificial model. In the
Chapter 3, high attention is given on the characterization of the physicochemical
properties of MNEI and the propensity to form insoluble, both ordered and
disordered aggregates, in response to environmental parameters, i.e. pH, temperature
and ionic strength. In the Chapter 4, the study is aimed to understand the molecular
basis leading to fibrilization with insight on early steps of unfolding.
In the third section, Part C, a full description on the production procedures referred
to the two proteins studied has been reported.
Each Chapter is a result of an extensive study supported by a wide range of technics
and by precious collaborations with national and international groups who are greatly
acknowledged.
21
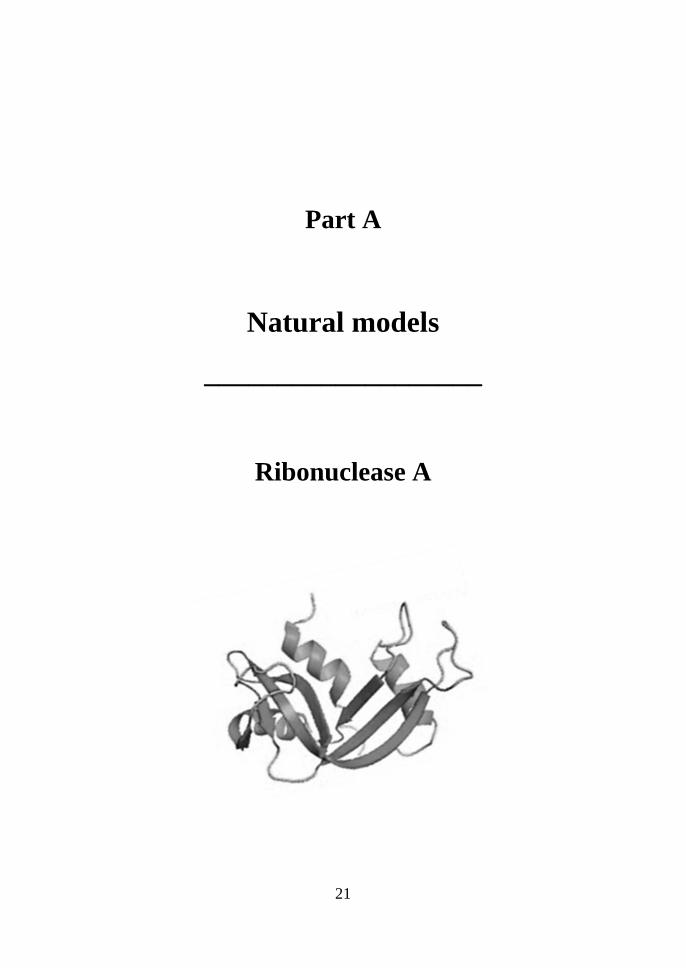
Part A
Natural models
___________________
Ribonuclease A

22
State of art
Bovine pancreatic RNase A (ribonuclease A) is one of the most studied protein in
structural biology. By lyophilization from 40% acetic acid solutions, it can
oligomerize in form of dimers, trimers, tetramers, higher order oligomers [1,2].
RNase A can also form amyloid fibers [2]. Oligomerization of RNase A also occurs
in solution at high substrate concentrations or high temperature [3]. The most
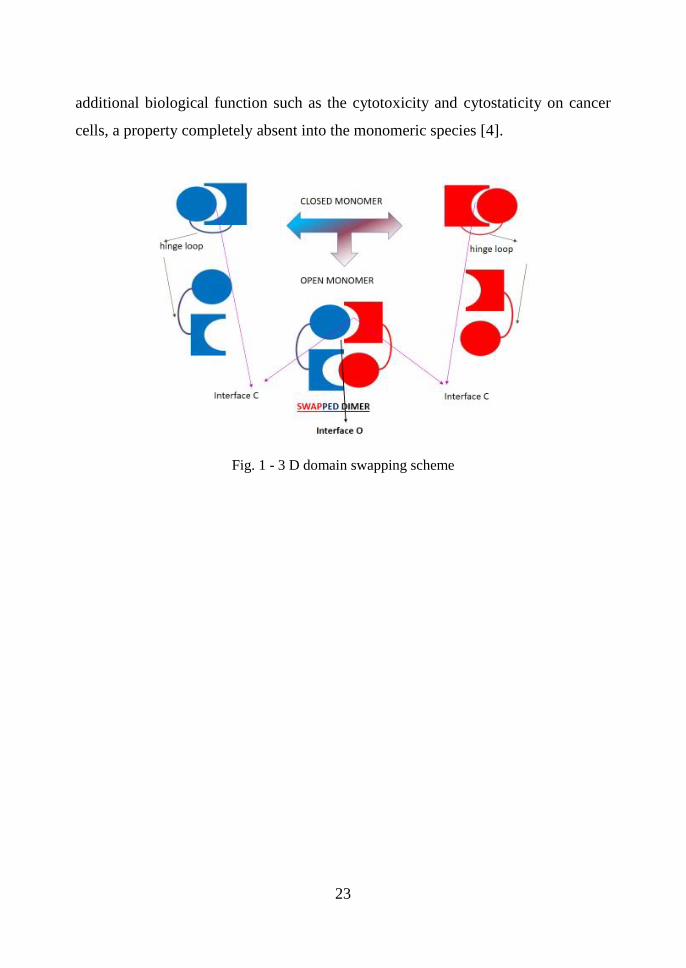
accepted mechanism through RNase A oligomerizes is the so called 3D-domain
swapping (3D-DS), i.e. the capability to reciprocally exchange protein domains [4].
In Fig. 1 a schematic overview is reported. In 3D domain swapping, one domain of
a monomeric protein is replaced by the same domain from an identical protein chain.
The result is an intertwined dimer or higher oligomer, with one domain of each
subunit replaced by the identical domain from another subunit. A protein able to
swap may interchange a large tertiary globular domain or a small secondary structure
element as α-helix or a β-sheet [4]. RNase A can exchange both N-domain and the
C-domain forming two dimeric isomers called as N-dimer and C-dimer, respectively.
The structure of the more basic or minor trimer has also been solved [1,4]; it is
formed by three monomers linked to each other by swapping their C-strands, thereby
forming a circular structure that looks like a propeller. It was called C-trimer. A
plausible linear model was proposed for the less basic, major trimer. In this linear
model, two monomers are linked through swapping of their N-termini, and a third
monomer is bound to one of them by a C-terminal domain swapping. It will be called
the NC-trimer. According to modelling studies, only plausible models for tetramers
and higher oligomers are reported. At the moment no X-ray or NMR structures for
tetramers and oligomers are deposited on databank. In Fig. 2 the cartoon
representations for N-dimer, C-dimer and C-trimer. All the model structures for
RNase A oligomers are also reported. Oligomerization through 3D-DS, does not
affect the enzymatic activity because the interchanging domains reconstitute the
catalytic site. The conformers are enzymatically active and are endowed with
23
additional biological function such as the cytotoxicity and cytostaticity on cancer
cells, a property completely absent into the monomeric species [4].
Fig. 1 - 3 D domain swapping scheme

24
Fig. 2 RNase A oligomers. Structures and models
References
[1] Bennett MJ, Schlunegger MP, Eisenberg D. (1995) 3D domain swapping: a
mechanism for oligomer assembly. Protein Sci. 4(12):2455-68
[2] Liu Y, Eisenberg D. (2002) 3D domain swapping: as domains continue to swap
Protein Sci. 11(6):1285-99
[3] Teng PK,AndersonNJ,GoldschmidtL, Eisenberg D.(2012) Ribonuclease A
suggests how proteins self-chaperone against amyloid fiber formation. Protein Sci.
21(1):26-37

25
CHAPTER
1

26
Bovine pancreatic ribonuclease metalation by Platinum-
based drugs: insight on protein oligomerization
Abstract
Metalation can influence the oligomerization state of proteins, can alter their
hydrodynamic properties and/or can cause fine structural variations. Platinum-
complexes are the most successful families of compounds clinically effective and
commercialized against malignant tumours. In this work, the reaction between
RNase A and three Pt-complexes clinically effective (cis-platinum, carboplatinum
and oxaliplatinum) has been analysed. They induce extensive protein aggregation
leading to the formation of dimers, trimers and higher oligomers that were purified
at homogeneity. Structural and functional properties of the platinated species,
together with their spontaneous dissociation and thermally induced denaturation,
have been characterised. The effects of platination on enzymatic activity and
biological properties induced by Pt-complexes exposure have been assayed. X-ray
structures of the Pt-monomeric adducts that RNase A forms provide a rational basis
to explain the different effects of the three anticancer agents on protein aggregation
and the relationship between structure and function. In this framework, RNase A
showed high versatility to study protein-metal interactions that could be crucial for
the biological (side) effects of several metallodrugs against malignant tumours.

27
1.1 Introduction
Platinum complexes (Fig.1) represent one of the most successful families of
clinically used anticancer drugs [1]. Cisplatin (cis-Pt Cl2(NH3)2, cis-
diamminedichloroplatinum(II), CDDP) is the best known Pt-based anticancer agent.
Carboplatin (cis-diammine(cyclobutane-1,1-dicarboxylate-O,O')platinum(II)) and
oxaliplatin (ethane-dioate(1R,2R)-1,2-cyclohexanediamineplatinum(II)) are two
CDDP analogues usually employed to treat tumours poorly responsive to cisplatin
treatments [2].
Fig. 1 Platinum complexes: structure of cisplatin, carboplatin and oxaliplatin
Pt-based drugs show their pharmacological action through the formation of stable
DNA adducts [1-3]. The Pt-DNA adducts roll out and bend the DNA duplex,
favouring the binding by high-mobility group (HMG) proteins that recognize these
modifications as damage and trigger cell in apoptosis [4]. The formation of DNA
adducts with CDDP, carboplatin and oxaliplatin has been extensively studied and the
X-ray structures of these adducts have been solved [3-9]. Nevertheless, nucleobases
are not the only biological targets of Pt-drugs [3]. Platinum can efficiently interact
with sulphur atoms of cysteine [7] or methionine residues [8] or even with nitrogen

28
atom of histidine [9,10] or oxygen atoms of aspartic/glutamic side chain residues
[11]. Actually, while the formation of Pt–DNA adducts has been extensively
investigated, less attention has been bestowed to the interaction between platinum
compounds and proteins. After injection into the bloodstream, most of the platinum
(65 to 98%) is associated with proteins, mainly to serum albumin and hemoglobin.
Moreover, a significant portion of Pt is bound to ℽ-glutamyl-cysteine-glycine
(glutathione, GSH) [12] and/or other cysteine-rich proteins [13], like a few small
proteins of the metallothionein family [14]. Platinum complexes entrance in cells is
helped by proteins belonging to the so-called “copper trafficking” system [15].
Therefore, exploring how platinum-based drugs interact with proteins is worth of
investigation for a deep understanding of the molecular basis of protein-drug
recognition, for studying the inherent or acquired pharmacological resistance, for
evaluating the bio-distribution and the clearance of Pt-based drugs, for the rational
design of new therapeutic agents more effective against proliferating malignant cells.
Furthermore, the interaction of these molecules with proteins has drawn increasing
attention in the last few year, given the role that it plays in defining the toxicity
profiles of the drugs [16, 17]. Previous studies have shown that Pt metalation can
alter the hydrodynamic properties in a protein and/or cause fine structural variations
resulting in oligomerization [18,19]. In order to clarify the relationship between
platination and aggregation, a comparative study has been pursued by evaluating the
behaviour of RNase A when incubated in presence of cisplatin, carboplatin and
oxaliplatin, respectively. RNase A was elected for this study since a) it has been used
as a model system in many fields of Protein Chemistry, including protein metalation
[19,20] and protein aggregation [21]; b) it binds cisplatin and details of this binding
are known [20]; c) it is able to form well characterized dimers and higher oligomers
[21] which can be used as reference. In particular, RNase A forms a N-terminal
swapped dimer, hereafter called N-Dimer [22], and a C-terminal swapped dimer, C-
Dimer [23], two trimers characterized by swapping of both C- and N-termini and
other oligomers [24-26], including tetramers, pentamers and hexamers [27]. Another
29
advantageous aspect is that it is an enzyme, therefore it possible to estimate the effect
of platination on protein functionality. Interestingly, RNase A aggregates acquire
selective cytotoxicity towards tumor cells [28]. This work reveals that cisplatin
(CDDP) deeply induces RNase A oligomerization allowing the isolation of dimer,
trimer and tetramers. The reaction with carboplatin and oxaliplatin equally produces
oligomers even if the yield is lower than cisPt reaction. All the platinated species
were isolated and carefully characterized from a biochemical and physicochemical
point of view. This work reveals that 24 h incubation at 37 °C of RNase A in the
presence of an excess of cisplatin, carboplatin and oxaliplatin (1:10 protein to
metallodrug ratio) induces the formation of platinated monomers (Pt-Mcis ,Pt-Mcarbo
and Pt-Moxa), dimers (Pt-Dcis ,Pt-Dcarbo and Pt-Doxa), trimers (Pt-Tcis ,Pt-Tcarbo and Pt-
Toxa) and a small amount of higher oligomers. Denaturing and non-denaturing
polyacrylamide gel electrophoresis and size-exclusion chromatography were used to
characterize the formation of the oligomers. Circular dichroism and UV-Vis
spectroscopy were used to investigate their structural stability and catalytic activity.
In collaboration with the groups of Proffs. M.Donadelli and G.Gotte from the
University of Verona, a functional characterisation on cytotoxic and cytostatic
properties has been pursued.
30
1.2 Materials and methods
1.2.1 Production and purification of platinated species
Cisplatin and RNase A (type XII-A) were purchased from Sigma- Aldrich. RNase A
was further purified as described in [29]. Carboplatin and oxaliplatin were purchased
from Santa Cruz Biotechnology. Preliminary incubations for analytical purposes
were pursued by incubating RNase A with cisplatin. Platinated species were obtained
by incubating RNase A at a protein: metallodrug molar ratio of 1:10. RNase A was
incubated at a concentration of 5 mg × ml-1 in 0.20 M sodium phosphate buffer pH
6.7 at 37° C for 24 hours with mild shaking. The platinated species were purified by
size exclusion chromatography. The reaction mixture was loaded on a Sephadex G75
column (1.5 × 72 cm) previously equilibrated in 0.20 M sodium phosphate buffer pH
6.7, at a flow rate of 0.15 ml×min-1. Concentration of all platinated species was
spectrophotometrically measured at 280 nm, using the extinction coefficient of
RNase A (ɛ 1% at 280 nm= 0.695). Sample homogeneity for all the platinated species
was assessed by polyacrylamide gel electrophoresis under denaturing (SDS-PAGE
15%) [30] and non-denaturing conditions (12% native PAGE) [31].
1.2.2 Circular dichroism spectroscopy
The gel-filtered Pt-species were analyzed with far-UV CD spectroscopy, at the
concentration of 0.1 mg × ml−1 in 0.20 M sodium phosphate buffer, pH 6.7. Circular
dichroism (CD) experiments were performed on a Jasco J-810 spectropolarimeter
(JASCO Corp., Milan, Italy) at 25 °C. Quartz cells with path length of 0.1 cm were
used in the far-UV region from 200 to 250 nm. Each spectrum was obtained
averaging three scans, subtracting contributions from the corresponding reference
and converting the signal to mean residue ellipticity in units of deg × cm2 × dmol−1.

31
Other experimental settings were: 20 nm × min−1 scan speed, 2.0 nm band width, 0.2
nm resolution, 50 mdeg sensitivity, and 4 s response. Thermal unfolding profiles
were obtained by monitoring the CD signal at 222 nm as function of temperature, in
the range 20–100 °C, with a heating rate of 1.0 °C × min−1.
1.2.3 Enzymatic activity
Ribonuclease activity of the purified RNase A platinated species was measured by
using the spectrophotometric Kunitz method, i.e. monitoring the cleavage of yeast
RNA via UV-Vis spectroscopy [32] at 25 °C in 0.050 M sodium acetate pH 5.0,
using 0.5 mg × ml-1 of RNA and an enzyme concentration of 0.5 μg × ml-1. The
activity of the platinated proteins was also compared to that obtained under the same
experimental conditions for RNase A.
1.2.4 Dissociation experiments
The stability of the gel filtered species was assessed by incubating at 4 and 37 °C
aliquots of the fraction corresponding to the maximum of each form, without any
further modification, in 0.20 M sodium phosphate buffer, pH 6.7, for time intervals
settled between 1 and 35 days. The dissociation kinetics was monitored by cathodic
polyacrylamide gel electrophoresis under non-denaturing conditions.
1.2.5 Crystallization and X-ray diffraction data collection
To obtain crystals, all the purified species were treated at 25 °C by Prof. A . Merlino
and coworkers using the hanging drop vapor diffusion method, protein concentration
of 15 mg × ml−1 and precipitant solution containing 30% ammonium sulfate and 0.30
M sodium chloride. Only crystals of purified cisplatin and carboplatin monomers

32
were obtained, within 7 days. Complete data sets for Pt-monomers wer collected at
100 K at the CNR Institute of Biostructures and Bioimages, Naples, Italy, using a
Saturn 944 CCD detector equipped with CuKα X-ray radiation from a Rigaku
Micromax 007 HF generator. The crystals diffract at 1.95 Ǻ resolution. Coordinates
and structure factors on cisplatin-monomer and carboplatin-monomer were
deposited in the Protein Data Bank under the accession codes 4RTE and 5NA9,
respectively.
1.2.6 Cell lines and cellular proliferation assay
Cytotoxic effect of each platinated species was assayed on tumoral cell lines Panc1
(deriving from pancreatic adenocarcinoma), A549 and SKBR3 (deriving from breast
cancer). Cellular proliferation assays were performed by the group of Prof. M.
Donadelli. Cells were seeded in 96-well plates (5x10³ cells/well) at 37 °C with 5%
CO2 and 24 h later were treated with the various compounds and further incubated
for 96 h. At the end of the treatments cells were stained with a Crystal Violet solution
(Sigma, Milan, Italy) to determine cell growth photometrically at 595 nm. ANOVA
(post hoc Bonferroni) analysis was performed by GraphPad Prism 5 software. P
value < 0.05 was indicated as statistically significant. Values are the means of three
independent experiments (± SD).

33
1.3 Results and Discussion
1.3.1 Platinum complexes influence the oligomerization state of
RNase A
Previous studies have shown that Pt metalation of proteins can induce the formation
of protein oligomers and/or cause subtle structural variations [18]. The first aim of
this work was to monitor the formation of possible aggregates produced by
incubation of RNase A with cisplatin, carboplatin and oxaliplatin. Preliminary
studies have been pursued using cisplatin (CDDP), the simplest Pt-compound.
RNase A was incubated at a concentration of 5 mg×ml-1 for 24 hours at 37 °C in the
presence of cisplatin in a 1:10 protein:cisplatin molar ratio in 0.20 M sodium
phosphate buffer, pH 6.7.. Additionally, another aliquot of RNase A was dissolved
at a concentration of 5 mg×ml-1 in 40% V/V acetic acid/water solution, incubated for
1 hour at 37° C, lyophilized and then dissolved in 0.20 M sodium phosphate buffer
according to the protocol described by Crestfield [34]. For further comparison, a
third aliquot of RNase A was also incubated without cisplatin in sodium phosphate
buffer. After incubation, the oligomerization was evaluated by cathodic PAGE under
non-denaturing conditions. Two different amounts of protein were loaded on
polyacrylamide gel, corresponding to 5 and 10 µg, respectively. The resulting
electrophoretic patterns are shown in Fig. 2-A. Cisplatin incubation results in an
appreciable oligomerization. Moreover, cisplatin induces structural modifications
also on the native monomeric RNase A, influencing its electrophoretic mobility: as
showed in Fig.2, the latter band in lanes 1-2 migrates more than the latter band in
lanes 3-4 and 5, corresponding to the monomeric RNase A present in solution upon
AcOH lyophilisation and the native RNase in pure buffer, respectively. In order to
investigate the effects on RNase A oligomerization of two other Pt-drugs, i.e.
carboplatin and oxaliplatin, the protein was incubated in the same experimental
34
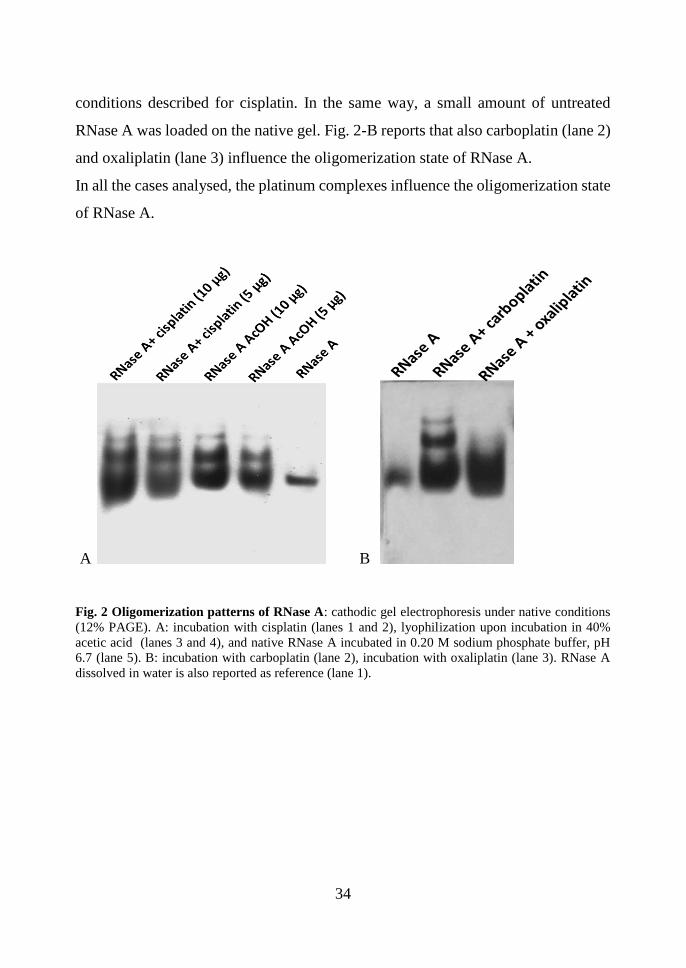
conditions described for cisplatin. In the same way, a small amount of untreated
RNase A was loaded on the native gel. Fig. 2-B reports that also carboplatin (lane 2)
and oxaliplatin (lane 3) influence the oligomerization state of RNase A.
In all the cases analysed, the platinum complexes influence the oligomerization state
of RNase A.
A B
Fig. 2 Oligomerization patterns of RNase A: cathodic gel electrophoresis under native conditions
(12% PAGE). A: incubation with cisplatin (lanes 1 and 2), lyophilization upon incubation in 40%
acetic acid (lanes 3 and 4), and native RNase A incubated in 0.20 M sodium phosphate buffer, pH
6.7 (lane 5). B: incubation with carboplatin (lane 2), incubation with oxaliplatin (lane 3). RNase A
dissolved in water is also reported as reference (lane 1).

35
1.3.2 Production and purification of platinated oligomers
Since analytical preparations show that cisplatin, carboplatin and oxaliplatin
influence the oligomerization state of RNase A, a new set of incubations were putted
on. Similar amounts of RNase A were incubated as described in “Materials and
Methods” section. For each preparation, 15 mg of protein were dissolved in 3 ml of
0.20 M sodium phosphate buffer, pH 6.7. To each protein solution were added the
following amounts of metallodrug: 3.3 mg of cisplatin, 4.1 mg of carboplatin and 4.3
mg of oxaliplatin to obtain the RNase A: Pt-drug molar ratio of 1:10. Each mixture
was incubated at 37 °C for 24 hours under gentle shacking. Since the electrophoretic
patterns (Fig. 2,panels A-B) suggest the presence of oligomers with different
molecular weights, the platinated species were purified by size-exclusion
chromatography. Thus, the protein-drug solutions were loaded on a Sephadex G75
(1.5 ×72 cm) column previously equilibrated in 0.20 M sodium phosphate buffer, pH
6.7. The elution was carried on at a flow rate of 0.15 ml×min-1. Fig. 3 reports the
corresponding gel-filtration profiles obtained for the three metallodrugs. In
accordance with the cathodic PAGE, high oligomerization occurs. A comparative
analysis of the peak area suggests that the oligomerization yield increases in the
direction oxaliplatin < carboplatin < CDDP. Cisplatin is the most effective giving
rise to the formation of high amount of dimer, trimer, tetramer and traces of
multimers of high molecular weight. Peak integration reveals that about 60% of the
protein is eluted as monomer (indicated as M), whilst approximately 25 % is eluted
as dimer (indicated as D), 8 % as trimer (indicated as T) and 4% as tetramer
(indicated as Tt). A small amount, roughly equivalent to the remaining 3% of the
total, corresponds to higher size aggregates (indicated as O). On the other hand, the
profiles obtained upon incubation with carboplatin and oxaliplatin reveal that the
amount of dimer, trimer and other oligomers decreases; in more detail, oxaliplatin
incubation results in dimerization lower than carboplatin.

36
Fig. 3 Chromatographic profiles: Gel-filtration pattern on a Sephadex G75 (1.5 × 72 cm) column
after 24 h of incubation at 37 °C in the presence of cisplatin (red line), carboplatin (blue line) and
oxaliplatin (green line) in 1:10 protein:metallodrug molar ratio in x nM sodium phosphate buffer, pH
6.7 . The peaks corresponding to metalated monomer (M), metalated dimer (D), metalated trimer
(T),metalated tetramer (Tt) and metalated oligomers (O) are highlighted. A zoomed section on dimer-
trimer and higher oligomers is also reported.
0
0.2
0.4
0.6
0.8
1
1.2
40 50 60 70 80 90 100
Ab
sorb
ance
Elution volume
M
D
T
Tt O

37
1.3.3 Biochemical characterization: Pt-species are interestingly SDS
resistant and strongly stable over time
All the platinated species purified were subjected to PAGE under native and
denaturing conditions. The gel filtered fractions migrate as a single spot in non-
denaturing conditions, suggesting the presence of a single conformer in each fraction
(Fig 4, panels B-C-D). Moreover, RNase A incubated in phosphate buffer was also
subjected to native PAGE as control, revealing that no oligomerization occurs if
platinum is not present. For a further comparison, an aliquot of RNase A dissolved
after lyophilization from 40% acetic acid was also loaded (panel A). Interesting
differences among the oligomerization observed upon lyophilization from acetic acid
solution and Pt-metalation are more evident on the denaturing SDS-PAGE (Fig.5,
panels B-C-D). In fact, while oligomers formed by acetic acid lyophilisation
dissociate thus migrating as a single spot corresponding to the monomeric protein
(panel A), platinated species show a peculiar SDS resistance. This suggests that
platinum allows interactions between subunits that are different from those occurring
in the well-known swapped dimers and oligomers of RNase A. Besides the chemical
resistance to denaturing SDS treatment, the resistance at two conditions of
temperature was also monitored over time. Each Pt-species was incubated at the
typical storage temperature of 4 °C and at the physiological temperature of 37 °C.
The stability of the different aggregates was monitored until 35 days. Samples were
analysed by native PAGE. The electrophoretic patterns after prolonged time is
reported in Fig. 6. Both carboplatin and oxaliplatin oligomers show a weak
dissociation at 4 °C and 37 °C. Differently, cisplatin species are resistant at least up
to 35 days at 4 °C while a slow but constant dissociation occurs at 37 °C. Anyway,
all the platinated species are more stable than the well-known swapped dimers in all
the experimental conditions investigated.

38
A B
C D
Fig. 4 Aggregation profiles: Gel-electrophoresis under native conditions (cathodic PAGE 12%) of
purified platinated oligomers obtained incubating RNase A in the presence of cisplatin (B),
carboplatin (C) and oxaliplatin (D). M: monomer, D: dimer; T: trimer; Tt: tetramer. RNase A
dissolved in water and in phosphate buffer are also loaded as references togheter with a RNase A
sample incubated in 40% acetic acid and liophylized.

39
A B
C D
Fig. 5 Aggregation profiles: Gel-electrophoresis under denaturing conditions (SDS-PAGE 15%) of
of purified platinated oligomers obtained incubating RNase A in the presence of cisplatin (B),
carboplatin (C) and oxaliplatin (D). M: monomer, D: dimer; T: trimer; Tt: tetramer. RNase A
dissolved in water and in phosphate buffer are also loaded as references togheter with a RNase A
sample incubated in 40% acetic acid and liophylized.

40
A
B
C
Fig. 6 Dissociation profiles. Gel-electrophoresis under native conditions (cathodic PAGE 12%) of
purified platinated oligomers obtained by incubating RNase A in the presence of cisplatin (A),
carboplatin ( B) and oxaliplatin (C) upon 35 days of storage at 4 °C and 37 °C. M: monomer, D:
dimer; T: trimer; Tt: tetramer.

41
1.3.4 Physicochemical characterization: Pt-species are folded and
moderately thermostable
In order to characterize from a structural point of view the effect of cisplatin,
carboplatin and oxaliplatin binding to RNase A in solution, the spectroscopic
properties of the platinated monomeric, dimeric and trimeric species were studied by
CD, which is a sensitive technique to monitor the secondary structure of proteins
[34]. Far-UV CD spectra are shown in Fig. 7 (panel A, cisplatin; panel B, carboplatin;
panel C, oxaliplatin). The spectra are almost indistinguishable from each other,
revealing that all the platinated species, i.e. monomeric and oligomeric forms, are
well-folded and suggest that they are assemblies of native RNase A monomers. This
behavior demonstrates that drug complexation causes no denaturation of RNase A,
supporting the idea that the formation of Pt adducts does not induce major
conformational changes of the native protein structure.
With the aim to characterize the thermal stability of the platinated monomer, dimer
and trimer, the CD signal at 222 nm was recorded as a function of temperature, in
0.20 M phosphate buffer at pH 6.7. These conditions are very similar to those used
to characterize the stability of N-Dimer and C-Dimer, i.e. the N-terminal and C-
terminal swapped dimers of RNase A (0.10 M phosphate buffer pH 6.8) [35]. The
thermal denaturation profiles are reported in Fig. 8 (panel A, cisplatin; panel B,
carboplatin; panel C, oxaliplatin). The curves of the Pt-species show a sharp
sigmoidal transition that can be described using a two-state model. All the Tm alues
obtained are summarized in Table 1. Cisplatinated species have the same Tm of the
native RNase A. Carboplatin species are moderately thermostable but less than the
native monomeric RNase A. Finally, oxaliplatin forms show Tm values highest than
native RNase A and other platinated species. Interestingly, all the platinated dimers
are more stable than the well known swapped dimers [35].

42
Fig. 7 Spectroscopic analysis on platinated species. CD spectra (25 °C) at a protein concentration
of 0.1 mg×ml -1in 0.20 M sodium phosphate buffer, pH 6.7. A: cisplatin; B: carboplatin; C: oxaliplatin.
M: monomer (red) ;D:dimer (blu); T:trimer (magenta). The CD spectra recorded for RNase A (black)
is also reported in panel A as reference.
195 200 205 210 215 220 225 230 235 240 245 250 255
-12000
-10000
-8000
-6000
-4000
-2000
0
2000
4000
6000
mola
r elli
pticity (
deg c
m2dm
ol-1
)
Pt-Mcarbo
Pt-Dcarbo
Pt-Tcarbo
wavelength (nm)
195 200 205 210 215 220 225 230 235 240 245 250 255
-12000
-10000
-8000
-6000
-4000
-2000
0
2000
4000
6000
mola
r e
llip
ticity (
deg
cm
2d
mo
l-1)
Pt-Moxa
Pt-Doxa
Pt-Toxa
wavelength (nm)
A
B
C

43
Fig 8 Thermal denaturation analysis on platinated species. Thermal unfolding curves at 222 nm
measured at a protein concentration of 0.1 mg×mL-1 in 0.20 M sodium phosphate buffer pH 6.7. A:
cisplatin; B: carboplatin; C: oxaliplatin. M: monomer (red) ;D:dimer (blu); T:trimer (magenta). The
CD spectra recorded for RNase A (black) is also reported in panel A as reference.
10 20 30 40 50 60 70 80 90 100
-8500
-8000
-7500
-7000
-6500
-6000
-5500
-5000
-4500
-4000
-3500
-3000
Mola
r elli
pticity (
deg c
m2dm
ol-1
)
Pt-Mcarbo
Pt-Dcarbo
Pt-Tcarbo
Temperature (°C)
10 20 30 40 50 60 70 80 90 100
-9000
-8000
-7000
-6000
-5000
-4000
-3000
Mola
r e
llip
ticity (
deg
cm
2d
mo
l-1)
Pt-Moxa
Pt-Doxa
Pt-Toxa
Temperature (°C)
A
B
C

44
Protein Tm °C)
RNase A 66 ± 1
Pt-MCDDP 66 ± 1
Pt-DCDDP 66 ± 1
Pt-TCDDP 65 ± 1
Pt-Mcarbo 63 ± 1
Pt-Dcarbo 62 ± 1
Pt-Tcarbo 64 ± 1
Pt-Moxa 67 ± 1
Pt-Doxa 67 ± 1
Pt-Toxa 69 ± 1
C-terminal swapped dimer of
RNase A*
66.4
N-terminal swapped dimer of
RNase A**
50.0
66.4
Tab. 1 Thermal unfolding parameters. Comparison between the denaturation temperatures of
platinated oligomers of RNase A obtained upon incubation with cisplatin, carboplatin and oxaliplatin,
with those found for RNase A, N-terminal and C-terminal swapped dimers of RNase A.
*Parameters of the temperature-induced denaturation of N-terminal and C-terminal swapped
dimer of RNase A have been obtained in 0.1 M phosphate buffer at pH 6.6, through DSC
measurement [35].
**N-terminal swapped dimer of RNase A unfolds according to a three-state denaturation
mechanism, which includes the formation of an intermediate; for this reason, in this case,
two T1/2 temperatures are reported [35].

45
1.3.5 Functional characterization: enzymatic activity
In order to estimate if platination could affect the protein functionality, the enzymatic
activity for all platinated species was assayed. As described in “Materials and
Methods” section, the ribonucleolytic action of platinated forms was measured by
monitoring hydrolysis of yeast RNA at pH 5.0 using the Kunitz method [32]. The
absorbance variations at 300 nm ( ΔA 300nm ) as a function of time, upon addition of
the same amount of RNase A or platinated species dissolved at a concentration of
0.5 μg × ml-1 to 1 ml of a 0.5 mg × ml-1 yeast RNA solution were monitored by UV-
spectroscopy. Fig. 9 reports the enzymatic activity profiles recorded for each species,
i.e. cisplatin (Panel A), carboplatin (Panel B) and oxaliplatin (Panel C). The
platinated species show different enzymatic activity. Indeed, CDDP-species retain a
significant, although reduced, enzymatic activity (Fig.9- panel A). CarboPt species
show catalytic properties comparable to native RNase (Fig.9-panel B). Finally,
oxaliPt adducts show a behaviour similar to the one observed for CDDP-forms
(Fig.9-panel C). The enzymatic activity analysed for each form can be summarized
according to the scheme: carboplatin activity > oxaliplatin activity > cisplatin activity . In
Fig. 10 an overview of the behaviours observed for Pt-dimers (Panel A) and Pt-
trimers (Panel B) is reported. As clearly indicated in Fig.10, all the carboplatinated
purified species (lane magenta) preserve an enzymatic action significantly higher
than the other forms obtained from the incubation with cisplatin or oxaliplatin.
Interestingly, the aggregation due to the exposure to carboplatin does not affect the
hydrolytic properties, differently from what observed in the two other cases, where
the functionality significantly decrease in proportion to the molecular weight.

46
Fig. 9 Enzymatic activity monitored by the Kunitz assay . Cisplatin (A), Carboplatin (B)
oxaliplatin (C). RNA hydrolysis was monitored at 300 at 25 °C in 0.050 M sodium acetate buffer pH
5 at a protein concentration of 0.5 µg×ml-1. A: cisplatin; B: carboplatin; C: oxaliplatin. M: monomer
(red) ;D:dimer (blu); T:trimer (magenta). The ribonucleolytic activity recorded for RNase A (black)
is also reported as reference.
A
B
C

47
Fig. 10 Enzymatic activity monitored by the Kunitz assay. Pt-Dimers (A); Pt-Trimers (C). RNA
hydrolysis at 600 at 25 °C in 0.050 M sodium acetate buffer pH 5 at a protein concentration of 0.5
µg×ml-1. CDDP: red; oxaliplatin: blu; carboplatin: magenta. The ribonucleolytic activity recorded for
the native monomeric RNase A (black) is also reported as reference
A
B

48
1.3.6 Functional characterization: cytotoxic action
Given the variety of effects observed on the enzymatic activity upon reaction with
the different Pt complexes, the cytotoxic action has been also assayed in a panel of
cancer cell lines from a series of solid tumors, as A549 (from lung carcinoma), Panc1
(from pancreatic adenocarcinoma) and SKBR3 (from breast cancer). The present
study has been performed by the group of Proffs. G. Gotte and M. Donadelli of the
University of Verona. Although the cell lines used are well known to be responsive
to Pt-based drugs (cisplatin, carboplatin and oxaliplatin), cell proliferation was not
affected by any of the platinated RNase A species. In particular, monomer, dimer,
trimer and oligomers of RNase A did not significantly affect proliferation of A549,
Panc1, and SKBR3 cells also when conjugated with cisplatin drug (Fig. 11, panel A).
An equivalent result has been obtained with monomer, dimer, and oligomers of
RNase A conjugated with carboplatin or oxaliplatin in A549 cells (Fig. 11, panel B).
Altogether, these data indicate that RNase A species conjugated with Pt-based drugs
did not acquire any cytotoxic property in cancer cells as compared to RNase A
species alone but, instead, metalation significantly reduces the cytotoxicity of the
drugs against the analyzed cell lines.

49
Fig. 11 Effect of platinated RNase A species on the proliferation of cancer cell lines. (A) Panc1,
SKBR3 and A549 cells were seeded in 96-well plates, incubated overnight, and treated for 96 hours
with 100 µg mL-1 of RNase A monomer or oligomers (a pool of dimers, trimers and larger oligomers)
before or after incubation with CDDP. (B) A549 cells were seeded in 96-well plates, incubated
overnight, and treated for 96 hours with 100 µg/ml of RNase A monomer or oligomers (a pool of
dimers, trimers and larger oligomers) before or after incubation with carboplatin or oxaliplatin. Cell
proliferation was determined using the Crystal Violet colorimetric assay. Values are means (±SD) of
three independent experiments, each performed in triplicate
A
B
50
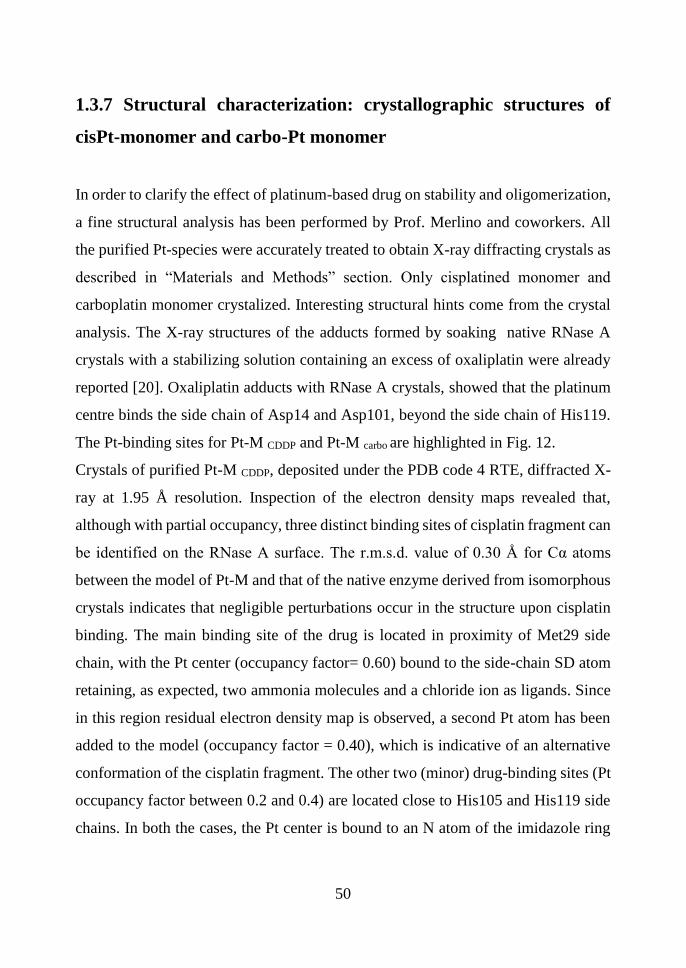
1.3.7 Structural characterization: crystallographic structures of
cisPt-monomer and carbo-Pt monomer
In order to clarify the effect of platinum-based drug on stability and oligomerization,
a fine structural analysis has been performed by Prof. Merlino and coworkers. All
the purified Pt-species were accurately treated to obtain X-ray diffracting crystals as
described in “Materials and Methods” section. Only cisplatined monomer and
carboplatin monomer crystalized. Interesting structural hints come from the crystal
analysis. The X-ray structures of the adducts formed by soaking native RNase A
crystals with a stabilizing solution containing an excess of oxaliplatin were already
reported [20]. Oxaliplatin adducts with RNase A crystals, showed that the platinum
centre binds the side chain of Asp14 and Asp101, beyond the side chain of His119.
The Pt-binding sites for Pt-M CDDP and Pt-M carbo are highlighted in Fig. 12.
Crystals of purified Pt-M CDDP, deposited under the PDB code 4 RTE, diffracted X-
ray at 1.95 Å resolution. Inspection of the electron density maps revealed that,
although with partial occupancy, three distinct binding sites of cisplatin fragment can
be identified on the RNase A surface. The r.m.s.d. value of 0.30 Å for Cα atoms
between the model of Pt-M and that of the native enzyme derived from isomorphous
crystals indicates that negligible perturbations occur in the structure upon cisplatin
binding. The main binding site of the drug is located in proximity of Met29 side
chain, with the Pt center (occupancy factor= 0.60) bound to the side-chain SD atom
retaining, as expected, two ammonia molecules and a chloride ion as ligands. Since
in this region residual electron density map is observed, a second Pt atom has been
added to the model (occupancy factor = 0.40), which is indicative of an alternative
conformation of the cisplatin fragment. The other two (minor) drug-binding sites (Pt
occupancy factor between 0.2 and 0.4) are located close to His105 and His119 side
chains. In both the cases, the Pt center is bound to an N atom of the imidazole ring

51
of His after releasing a chloride ion. Since His119 is involved in the catalytic site of
RNases, these data can partly explain the results of the decreased enzymatic activity.
Crystals of purified carbo-Pt monomer diffract X-ray at 2.07 Å resolution. The X-
ray structure is registered under the PDB code 5NA9. The crystallographic structure
is very similar to that of the ligand-free protein, and to those of Pt-M CDDP and RNase
A-carboplatin adduct obtained by soaking procedure, deposited in the PDB under the
accession code 4S0Q: Cα root mean square deviations from the corresponding atoms
of the two chains of the RNase A-carboplatin structure obtained by soaking
procedure are both equal to 0.49 Å. As observed in RNase A-carboplatin, carboPt-
monomer showed a single Pt binding site, close to Met29 side chain.
The low content of Pt bound to the protein and the finding that carboplatin fragments
does not bind protein active site residues, contrarily to what was observed for
cisplatin and oxaliplatin , can well explain both the the higher catalytic activity
exhibited by Pt-Mcarbo when compared with its analogues. Furthermore, the finding
that Pt-Mcarbo has just one Pt binding site allows to conclude that Met29 is very likely
involved in the process that leads to the formation of platinated RNase A dimers and
higher oligomers.
Fig. 12 Pt-binding sites on platinated monomer. Cartoon representation.

52
1.4 Conclusions and ongoing works
The formation of protein aggregates is a topic of great interest in molecular evolution,
medicine and biotechnology. The oligomerization state of a protein can be deeply
influenced by several environmental conditions. Metalation is one of the factors that
can affect protein stability and aggregation propensity. Recently high attention is
focused on the effects of metal-based drugs on protein-protein interaction. In fact,
even if the pharmacological effects are mainly related to nucleobases-metals
interactions, the direct effects of metalation on cellular uptake, biodistribution and
pharmacological clearance of these drugs are not completely clear. In this scenario,
this work investigates the relationship between Pt-metalation and protein
aggregation. Platinum-based drugs are the most effective chemotherapycs and show
different pharmacological response on the basis of their chemical composition.
RNase A turned out as a helpful model to study the protein oligomerization
propensity induced by the exposure to three common Pt-based drugs: cisplatin,
carboplatin and oxaliplatin. This study reveals that all the metallodrugs significantly
influence the RNase A aggregation propensity. In more details, the reaction with
cisplatin gives rise to a wide range of Pt-aggregates triggering the formation of one
dimer, one trimer, one tetramer and higher oligomers. Carboplatin and oxaliplatin
are also able of forming RNase A platinated oligomers even if the final amount of
dimers and higher oligomers is lower in comparison with the pattern obtained with
cisplatin. All the oligomers were purified and deeply characterized. These adducts
share similar folding and thermostability, and display SDS resistance and quite
prolonged survival in solution. Among the three drugs, CDDP, the most potent
oligomerization agent, is also the most effective in inhibiting the ribonucleolytic
activity of the protein. Oxaliplatin forms the lower amount of oligomeric adducts and
shows functional properties similar to the CDDP-adducts. On the other hand
oligomers obtained in the presence of carboplatin are the most active as enzymes. X-

53
ray structures of the monomeric adducts allowed to identify different binding
features of the three Pt compounds that account for their different influence on the
catalytic activity and on the aggregation features of the protein complexes. In
particular, the different influence of the Pt-based drugs on the catalytic activity can
be explained by looking at active site accessibility upon metal binding: carboplatin
adducts retain the full catalytic activity because their active site residues are not
involved in metal binding and thus the substrate binding is not affected, at variance
with what is observed in the adducts of the two other metallodrugs. The aggregation
propensity can be explained by looking at the number of metal binding sites on the
protein surface and at the chemical features of the Pt coordination sphere. Pt-Mcarbo
leads to the formation of a lower amount of oligomers when compared to CDDP,
since it possesses a single Pt binding site, whereas Pt-MCDDP can bind three CDDP
fragments, two of them involving residues located on the protein surface. The lowest
aggregation propensity of the oxaliplatin adduct can be explained considering that
the 1,2-diaminocyclohexane (DACH) ligand is not easily released from the Pt centre,
even upon the binding to the protein, hampering the assembly of two RNase A chains.
The evaluation of the effects of the presence of these adducts in cancer cell
proliferation sensitive to the treatment with pancreatic-like RNases [36,37] reveals
that the platinated RNase A oligomers are not cytotoxic. Thus, although protein
oligomerization generally increases RNase A cytotoxicity [38], platinated oligomers
of RNase A do not display any additional feature that could improve a possible
cytotoxic activity associated with the formation of oligomers, but on the contrary
they deprive the cytotoxic properties of cisplatin, carboplatin, and oxaliplatin.
Altogether, these data indicate that possible aggregation processes of proteins by
anticancer Pt-based drugs could represent a collateral drawback, which on one hand
can affect the functional state of several protein targets triggering their aggregation,
whereas on the other hand the efficacy of Pt-based drug treatment can be drastically
reduced.

54
1.5 References
[1] Comess KM and Lippard SJ. (1993) Molecular Aspects of Platinum-DNA
Interactions, Molecular Aspects of Anticancer Drug-DNA Interactions. Macmillan,
London
[2] Rixe O, Ortuzar W, Alvarez M, Parker R, Reed E, Paull K and Fojo T. (1996)
Oxaliplatin, tetraplatin, cisplatin, and carboplatin: Spectrum of activity in drug-
resistant cell lines and in the cell lines of the National Cancer Institute's Anticancer
Drug Screen panel, Biochemical pharmacology. 52, 1855-1865.
[3] Takahara PM, Rosenzweig AC, Frederick C A and Lippard SJ. (1995) Crystal
structure of double-stranded DNA containing the major adduct of the anticancer drug
cisplatin, Nature. 377, 649-52.
[4] Jamieson ER, Jacobson MP, Barnes C M, Chow CS and Lippard SJ. (1999)
Structural and kinetic studies of a cisplatin-modified DNA icosamer binding to
HMG1 domain B. J Biol Chem. 274, 12346-54
[5] Jamieson ER and Lippard SJ. (1999) Structure, recognition, and processing of
cisplatin–DNA adducts. Chem Rev. 99, 2467–2498.
[6] Arnesano F, Banci L, Bertini I, Felli IC, Losacco M and Natile G. (2011) Probing
the interaction of cisplatin with the human copper chaperone Atox1 by solution and
in-cell NMR spectroscopy. Journal of the American Chemical Society. 133, 18361-
9
[7] Messori L. and Merlino A. (2014) Cisplatin binding to proteins: molecular
structure of the ribonuclease A adduct. Inorganic chemistry. 53, 3929-31

55
[8] Casini A, Mastrobuoni G, Temperini C, Gabbiani C, Francese S, Moneti G,
Supuran C. T, Scozzafava A and Messori L. (2007) ESI mass spectrometry and X-
ray diffraction studies of adducts between anticancer platinum drugs and hen egg
white lysozyme, Chemical communications, 156-158
[9] Tanley SW, Schreurs AM, Kroon-Batenburg LM, Meredith J, Prendergast R,
Walsh D, Bryant P, Levy C and Helliwell J.R. (2012) Structural studies of the effect
that dimethyl sulfoxide (DMSO) has on cisplatin and carboplatin binding to histidine
in a protein, Acta crystallographica Section D, Biological crystallography. 68, 601-
12
[10] Mizumura Y, Matsumura Y, Hamaguchi T, Nishiyama N, Kataoka K,
Kawaguchi T, Hrushesky WJ, Moriyasu F and Kakizoe T. (2001) Cisplatin-
incorporated polymeric micelles eliminate nephrotoxicity, while maintaining
antitumor activity Jpn J Cancer Res. 92, 328-36
[12] Messori, L. & Merlino, A. (2014) Cisplatin binding to proteins: molecular
structure of the ribonuclease A adduct, Inorganic chemistry. 53, 3929-31
[13] A. Casini, G. Mastrobuoni, C. Temperini, C. Gabbiani, S. Francese, G. Moneti,
C.T. Supuran, A. Scozzafava, L. Messori, Chem. Commun. (2007) 156–158.
[14] Tanley SW, Schreurs AM, Kroon-Batenburg LM, Meredith J, Prendergast R,
Walsh D, Bryant P, Levy C and Helliwell JR (2012) Acta Crystallogr. D68 601–612.
[15] Kartalou M and Essigmann JM. (2001) Recognition of cisplatin adducts by
cellular proteins, Mutat Res. 478, 1-21
[16] Messori L and Merlino A. (2016) Cisplatin binding to proteins: A structural
perspective, Coordin Chem Rev. 315, 67-89.

56
[17] Pinato O, Musetti C and Sissi C. (2014) Pt-based drugs: the spotlight will be on
proteins, Metallomics : integrated biometal science. 6, 380-395.
[18] Li HL, Wells S A, Jimenez-Roldan J E, Romer R A, Zhao Y, Sadler PJ and
O'Connor PB. (2012) Protein flexibility is key to cisplatin crosslinking in calmodulin,
Protein Sci. 21, 1269-1279
[19] Picone D, Donnarumma F, Ferraro G, Russo Krauss I, Fagagnini A, Gotte G
and Merlino A. (2015) Platinated oligomers of bovine pancreatic ribonuclease:
Structure and stability, Journal of inorganic biochemistry. 146, 37-43
[20] Messori L, Marzo T and Merlino A. (2015) Interactions of Carboplatin and
Oxaliplatin with Proteins: Insights from X-ray structures and mass spectrometry
studies of their Ribonuclease A adducts, Journal of inorganic biochemistry. 153,
136-142.
[21] Gotte G, Laurents DV, Merlino A, Picone D, Spadaccini R. FEBS
Lett2013)15;587(22):3601-8
[22] Liu YS, Hart PJ, Schlunegger M P and Eisenberg D. (1998) The crystal structure
of a 3D domain-swapped dimer of RNase A at a 2.1-angstrom resolution, P Natl
Acad Sci USA. 95, 3437-3442.
[23] Liu YS, Gotte G, Libonati M and Eisenberg D. (2001) A domain-swapped
RNase A dimer with implications for amyloid formation, Nat Struct Biol. 8, 211-214.
[24] Liu YS, Gotte G, Libonati M and Eisenberg D. (2002) Structures of the two 3D
domain-swapped RNase A trimers, Protein Sci. 11, 371-380.
[25] Gotte G and Libonati M. (1998) Two different forms of aggregated dimers of
ribonuclease A, Bba-Protein Struct M. 1386, 106-112.
57
[26] Gotte G and Libonati M. (2008) Oligomerization of ribonuclease A under
reducing conditions, Bba-Proteins Proteom. 1784, 638-650.
[27] Gotte G and Libonati M. (2004) Oligomerization of ribonuclease A - Two novel
three-dimensional domain-swapped tetramers, J Biol Chem. 279, 36670-36679.
[28] Matousek J, Gotte G, Pouckova P, Soucek J, Slavik T, Vottariello F and Libonati
M. (2003) Antitumor activity and other biological actions of oligomers of
ribonuclease A, J Biol Chem. 278, 23817-22.
[29] Fagagnini A, Montioli R, Caloiu A, Ribó M, Laurents DV and Gotte G. (2017)
Extensive deamidation of RNase A inhibits its oligomerization through 3D domain
swapping. Biochim Biophys Acta. 1865(1):76-87
[30] Laemmli UK. (1970). Cleavage of structural proteins during the assembly of the
head of bacteriophage T4. Nature 227(5259), 680–685
[31] Sica F, Pica A, Merlino A, Russo Krauss I, Ercole C and Picone D. (2013) The
multiple forms of bovine seminal ribonuclease: Structure and stability of a C-
terminal swapped dimer. Febs Lett. 587, 3755-3762.
[32] Kunitz, M. (1946) A spectrophotometric method for the measurement of
ribonuclease activity, J Biol Chem. 164, 563-8
[33] Crestfield AM, Stein WH and Moore S. (1962) On the aggregation of bovine
pancreatic ribonuclease, Archives of biochemistry and biophysics. Suppl 1, 217-22.
[34] Greenfield NJ. (2006) Using circular dichroism spectra to estimate protein
secondary structure, Nature protocols. 1, 2876-90.

58
[35] Bucci E, Vitagliano L, Barone R, Sorrentino S, D'Alessio G. and Graziano G.
(2005) On the thermal stability of the two dimeric forms of ribonuclease A, Biophys
Chem. 116, 89-95.
[36] Fiorini C, Gotte G, Donnarumma F, Picone D and Donadelli M. (2014) Bovine
seminal ribonuclease triggers Beclin1-mediated autophagic cell death in pancreatic
cancer cells, Bba-Mol Cell Res. 1843, 976-984.
[37] Fiorini C, Cordani M, Gotte G, Picone D and Donadelli M. (2015) Onconase
induces autophagy sensitizing pancreatic cancer cells to gemcitabine and activates
Akt/mTOR pathway in a ROS-dependent manner, Bba-Mol Cell Res. 1853, 549-560.
[38] Gotte G, Helmy AM., Ercole C, Spadaccini R, Laurents DV, Donadelli M and
Picone D. (2012) Double Domain Swapping in Bovine Seminal RNase: Formation
of Distinct N- and C-swapped Tetramers and Multimers with Increasing Biological
Activities, PloS one. 7.

59
CHAPTER
2

60
Engineered C-terminal domain exploited to study the
pleiotropic effects of hinge loop
Abstract
RNase A is a very well characterized protein endowed with the capability to form
aggregates under well described conditions. Through 3D-DS, RNase A can exchange
both N-domain and C-domain. This propensity could be strictly related to a high
flexibility at hinge loops connecting each terminal domain to the protein body.
Rnasrpirnase (Onconase), an omologue of RNase A whose structural features are
comparable to those of RNase A, is a highly stable protein with short hinge loops.
New modifications into the RNase A primary structure were introduced at the C-
terminal hinge loop in order to get insights on the pleiotropic properties of this
responsive region. The corresponding C-terminal loop of Onconase was used as
template to design a new mutant, whose stability and swapping tendency were
compared to those of the native RNase A. Differently from the wild-type RNase A,
the mutant RNase A- Onc is able to form dimers spontaneously. This work allowed
to investigate the relationship between genetic modifications at C-hinge loop and
protein folding and misfolding.

61
2.1 Introduction
Pronounced modifications and alterations of the protein sequence may modulate both
the local and global flexibility. Among the possible consequences, the protein
stability may be affected and the oligomerization may start triggering a “gain of
structure” or a “loss of structure”. Many proteins are able to self-assembly by
exchanging domains or secondary structure elements by the so-called 3D domain
swapping (3D-DS) [1,2]. The structural determinants predictive of a swapping
attitude are difficult to identify, as they are diverse and subtle. Experimental
biophysical data coming from X-ray crystallography and NMR, and theoretical
studies demonstrated the relevant role played in this process by the hinge loop [3,4],
and by residues constituting the new interface created in the dimerization event, the
so-called “open interface” [2]. Mutational studies on a relevant number of proteins
have shown that the shortening or lengthening of the hinge loop can greatly alter
their propensity to form domain swapped oligomers [4-8]. RNase A still represents
a useful model to understand the peculiar role of hinge loops in oligomerization by
3D-DS. Wild-type RNase A, when lyophilized from 40% acetic acid, can swap and
form either an N-terminal or C-terminal swapped dimer. In the N dimer, the first
helix swap, whereas in the C dimer, a β-strand is exchanged. The N-terminal hinge
loop (16-22), which prompts the swapping of the N-terminal helix, consists of 7
residues, while the C-terminal hinge loop (112-115) is shorter and anchors the C-
terminal β-strand to the rest of the protein [6-8] In the C-swapped dimer the hinge
region from each monomer extends to form interactions between β-strands and form
β-stacking interactions reminiscent of the polar zipper characteristic of amyloid
fibirils [3]. Eisenberg and coworkers inserted a poly-Q sequence into the hinge
region resulting in an RNase A that swapped and formed amyloid fibrils. Therefore,
the role that this region plays for the C-terminal dimerization of RNase A and for
amyloid formation in the recombinant construct is decisive. This work focused

62
attention on the hinge loop at the C-terminus. This region has been engineered by
substituting the residues (112-115) of RNase A with the Onconase hinge loop.
Onconase is an homologous of RNase A, a ribonuclease endowed with interesting
biological and pharmacological properties, such as cytotoxicity and cytostaticity
against tumoral cells [9]. Onconase is characterized by a high thermal stability.
Recently, Vitagliano and coworkers investigated the influence of supersecondary
associations on the thermal stability in natural proteins [10]. Bioinformatics showed
that β-hairpins of proteins from thermophilic organisms are characterised by short
connecting loops [10]. The loop size can be highly correlated with
chirality/orientation preferences of secondary structure elements. This correlation
seems to be quite conserved from an evolutionary point of view in thermophilic
proteins. Moreover, it seems to be particularly relevant for β-loop-β. Both onconase
and RNase A possess this motif β-loop-β at the C-terminus. In Onconase the C-
terminal hinge loop is shorter than the corresponding region of RNase A. This could
explain the different stability between the two proteins. Indeed, RNase A has a Tm
of 62° C against the 90° C measured for Onconase. In collaboration with Drs
L.Vitagliano and L. Esposito (Institute of Biostructures and Bioimages, CNR, Naples)
a new RNase A derivative has been designed by genetic modifications at the C-
terminal hinge loop of RNase A by using Onconase C-term loop as template. The
resulting recombinant protein RNaseA-Onc has been produced and characterised.
The aggregation propensity of RNaseA-Onc has been also evaluated in comparison
with that of the wild type RNase A.

63
2.2 Materials and Methods
2.2.1 Production of RNase A mutants: design, cloning, expression
and purification
The mutants were designed comparing the sequence of RNase A and ONC. The
computational analysis and the resulting design were performed by Vitagliano and
coworkers as previously reported [10]. The synthetic gene encoding RNase A-Onc
was purchased from GENEWIZ and cloned from the commercial vector pUC57 into
the expression vector pET22b+ (Novagen). To express the protein, BL21(DE3) cells
were transformed with the said plasmid. Expression and purification procedures are
reported in more detail in Section C-1. Recombinant RNase A-Onc was obtained in
pure monomeric form with a yield of about 12 mg per liter of LB culture medium.
Protein identity, purity and homogeneity were confirmed by mass spectrometry and
gel electrophoresis.
2.2.2 Circular dichroism spectroscopy
For the CD spectra, solutions of 0.15 mg×ml-1 of protein in 0.10 M phosphate buffer
pH 6.8 were used. The measurements were performed on a JASCO J-810
spectrometer using a cell with a 0.1 cm path length. The spectra were recorded in the
range 195-250 nm, with a time constant of 4s, a 2 nm bandwidth, and a scan rate of
20 nm × min−1. Spectra were signal-averaged over 3 scans and they were baseline
corrected by subtracting the buffer spectra recorded under the same conditions.
Thermal unfolding was studied by monitoring the CD signal at 222 nm in the
temperature range from 25 °C to 85 °C. The scan rate was 0.5 °C × min−1.

64
2.2.3 Size exclusion chromatography
Liophylized pure monomeric RNase A-Onc was dissolved in water at a final
concentration of 10 mg×ml-1. This stock solution was used to prepare three
incubation mixtures at a final concentration of 5 mg×ml-1 in three different solvents:
ultrapure water, sodium phosphate buffer 0.40 M pH 6.7 and acetic acid solution 40%
v/v. RNase A-Onc was incubated for 2 hours at 25 °C according to the procedure
described by x and y [11]. After this time, each mixture was loaded on a Superdex
75 HR 10/30 column attached to an AKTA FPLC system (GE-Healthcare), at room
temperature, previously equilibrated with 0.40 M sodium phosphate pH 6.7. Elution
was performed with the same buffer at a flow rate of 0.6 mL ×min-1.
2.2.4 Crystallization and data collection
The crystallographic study was performed by Dr. L. Esposito. The purified protein
was concentrated to 15 mg× ml -1 in 0.01 M phosphate buffer at pH 6.8. Crystals
were grown by hanging-drop vapor diffusion at 296 K. The protein solution was
equilibrated with 0.1 M Bis-Tris pH 6.5, and 28% w/v Polyethylene glycol
monomethyl ether 2000. A single crystal was transferred to a stabilizing solution
containing 15% glycerol as cryoprotectant. X-ray data were then collected at 100 K
using in-house X-ray source. A complete data set (93.6% completeness) was
collected at 2.31 Å resolution. Data were processed and scaled using the
DENZO/SCALEPACK package.

65
2.3 Results and Discussion
2.3.1 C-terminus engineered RNase A mutant: background
and design
The C-terminal hinge loop of Onconase was used as template to design a new mutant,
RNase A-Onc. As highlighted in Fig.1, the residues GNPYV in RNase A have been
substituted with the residues NQA, reminiscent of the β-loop-β motif of Onconase.
Fig. 1 Design of RNase A-Onc. Genetic modification at C-Terminus hinge loops. Wild type RNase
A and RNaseA.Onc sequences are also reported.

66
2.3.2 C-terminus engineered RNase A mutant: production
of RNase A-Onc
Recombinant RNase A-Onc was produced in E.coli BL21 (DE3) transformed with
a pET22b+ expression vector containing the corresponding cDNA. The transformed
cells were grown in LB medium at 37° C until reaching the final OD600 nm of 0.6
when the protein expression was induced adding 0.4 mM IPTG. After 3 hours from
the induction, the cells were harvested and subsequently were sonicated to extract
the protein. The engineered RNase A was accumulated into the inclusion bodies so,
after lysis by sonication, the cytosolic fraction and the insoluble fraction were
separated by centrifugation and the following purification procedures were operated
on the insoluble fraction. After many cycles of sonication and washing with
detergents (Triton X) and denaturants (Urea), the protein was purified from all the
endogenous proteins. Subsequently, detergents and denaturants were removed to
allow the second purification level concerning the refolding under controlled
conditions. The incubation of the protein using the red/ox couple Glutathion reduced
and oxyded, was followed to obtain a correctly folded recombinant ribonuclease.
After 20 hours, the reaction was stopped and the protein solution was loaded on a
Sephadex G-75 (1.5×72 cm) column equilibrated in 0.1 ammonium acetate buffer
pH 5.1 in order to purify RNaseA-Onc. The protein was eluted as monomer and its
molecular weight was assessed on the basis of the elution volume on a G-75
calibrated column (Fig.2-A). The homogeneity of the sample was also assessed by
SDS-PAGE and cathodic PAGE. In particular, as reported in Fig.2-B, the protein
migrates as a single pure band on the native polyacrilammide gel. Interestingly, it
migrates more than the wild type RNase A, accordingly to its smaller and more
compact shape.
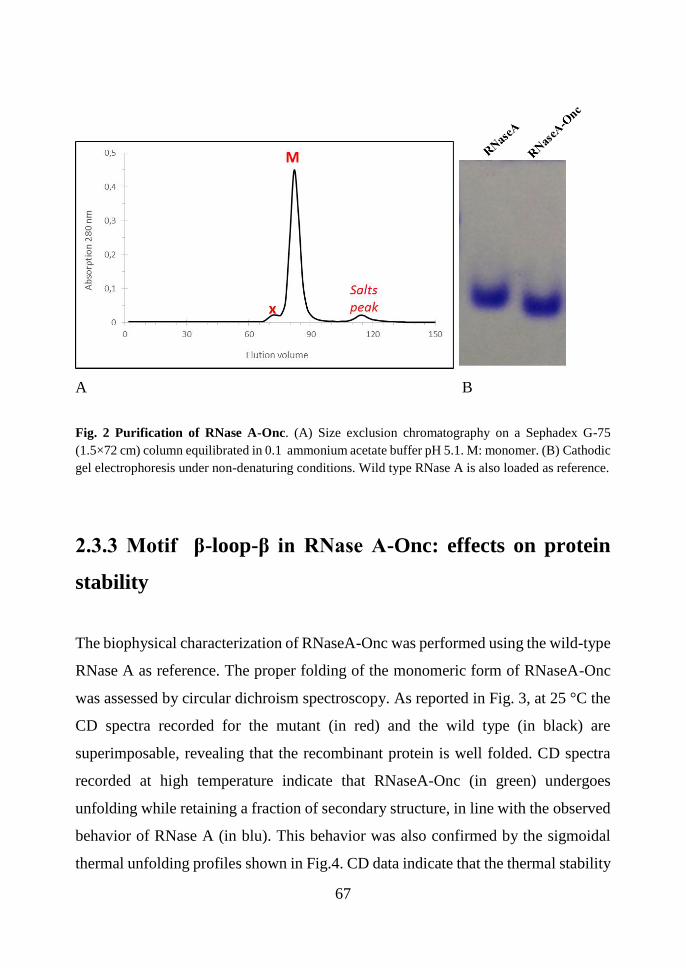
67
A B
Fig. 2 Purification of RNase A-Onc. (A) Size exclusion chromatography on a Sephadex G-75
(1.5×72 cm) column equilibrated in 0.1 ammonium acetate buffer pH 5.1. M: monomer. (B) Cathodic
gel electrophoresis under non-denaturing conditions. Wild type RNase A is also loaded as reference.
2.3.3 Motif β-loop-β in RNase A-Onc: effects on protein
stability
The biophysical characterization of RNaseA-Onc was performed using the wild-type
RNase A as reference. The proper folding of the monomeric form of RNaseA-Onc
was assessed by circular dichroism spectroscopy. As reported in Fig. 3, at 25 °C the
CD spectra recorded for the mutant (in red) and the wild type (in black) are
superimposable, revealing that the recombinant protein is well folded. CD spectra
recorded at high temperature indicate that RNaseA-Onc (in green) undergoes
unfolding while retaining a fraction of secondary structure, in line with the observed
behavior of RNase A (in blu). This behavior was also confirmed by the sigmoidal
thermal unfolding profiles shown in Fig.4. CD data indicate that the thermal stability

68
of RNaseA-Onc is comparable to the wild-type RNase despite the replacement of the
key residues Pro114. Indeed, the T m are 59 °C and 61 °C for RNaseA-Onc and
RNase A, respectively.
Fig. 3. Spectroscopic analysis on RNase A-Onc and RNase A wild type. CD spectra in 0.10 M
sodium phosphate buffer pH 6.8 at a protein concentration of 0.15 mg×ml-1. The temperature of the
measurements is also reported with the following color code: 25 °C (RNase A, black), 85 °C (RNase
A,blu), 25 °C (RNaseA-Onc, red), 85 °C (RNase A-Onc, green).
195 205 215 225 235 245 255-25
-20
-15
-10
-5
0
5
10
15
Elli
pticity (
mdeg)
RNase A 25°C
RNase A 85°C
RNaseA-Onc25°C
RNaseA-Onc 85°C
Wavelenght (nm)

69
Fig. 4 Spectroscopic analysis on RNase A-Onc and RNase A wild type. Thermal unfolding profiles
at 222 nm in 0.10 M sodium phosphate buffer pH 6.8 at a protein concentration of 0.15 mg×ml -1 .
RNase A-Onc and RNase A are shown in green and in blu, respectively
2.3.4 Crystal structure of RNaseA-Onc monomer
The structure of the variant RNaseA-Onc has been solved at 2.3 Å resolution by Drs.
L. Vitagliano and L. Esposito. RNaseA-Onc crystals contain three molecules in the
asymmetric unit that are overall very similar. Indeed, the pairwise superposition of
C atoms of two molecules (in the range of residues 3-121) yields RMSDs which are
on average 0.42 Å (chain A-B RMSD=0.35 Å; chain A-C RMSD=0.45 Å; chain B-
C RMSD=0.46 Å). The chain A is the best defined in the electron density out of the
three, therefore it will serve as the reference model in the following discussion. To
evaluate the impact of the inserted modification on the RNase A structure, the C
trace of RNaseA-Onc was superimposed with that of RNase A, excluding the
segment containing the mutated loop (residues 110-115 in RNaseA-Onc numbering).
The RMS deviation is 0.37 Å, thus indicating that the fold is essentially unaffected
20 30 40 50 60 70 80 90-13
-12
-11
-10
-9
-8
-7
-6
-5RNase A
RNaseA-Onc
Elli
pticity (
md
eg
)
Temperature (°C)

70
by the shortening and replacement of the loop. The main differences are concentrated
in the loop region as also highlighted in Fig 5.
Fig. 5. Ribbon representation of the backbone trace of superimposed RNase A (cyan) and
RNaseA-Onc (magenta). In yellow is shown the segment 90CENQAP95 of Onconase which
corresponds to segment 110-115 of RNaseA-Onc.
In RNaseA-Onc the modified loop adopts the same conformation of the loop in
Onconase ; indeed the Cα RMSD for the segment 110-115 is as low as 0.22 Å.
Specifically, the tetrapeptide E111-A114 forms a β-turn (type I’) in which the two
central residues (N112 and Q113) adopt unusual conformations located in the αL
region of the Ramachandran plot. As for Onconase, the local structure of RNaseA-
Onc is stabilized by the hydrogen bonds E111 O…N A114 and E111 N…O A114.
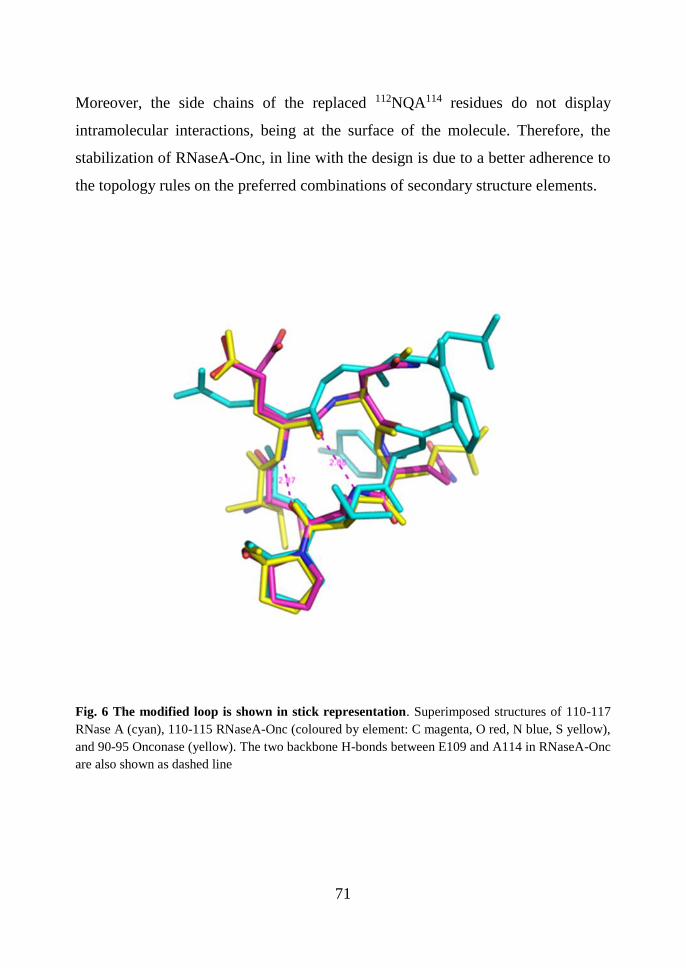
71
Moreover, the side chains of the replaced 112NQA114 residues do not display
intramolecular interactions, being at the surface of the molecule. Therefore, the
stabilization of RNaseA-Onc, in line with the design is due to a better adherence to
the topology rules on the preferred combinations of secondary structure elements.
Fig. 6 The modified loop is shown in stick representation. Superimposed structures of 110-117
RNase A (cyan), 110-115 RNaseA-Onc (coloured by element: C magenta, O red, N blue, S yellow),
and 90-95 Onconase (yellow). The two backbone H-bonds between E109 and A114 in RNaseA-Onc
are also shown as dashed line

72
Furthermore, the electron density of the loop E111-A114 clearly shows that all
peptide bonds adopt a trans state (Fig. 6). It is important to remember that the
correspondent N113-P114 in RNase A is in cis state.
Fig. 6. The omit electron density of the mutated region in RNaseA-Onc is contoured in green. The
loop 110-115 loop as well as the Cys 58 of the disulfide bridge Cys58-Cys110 are shown in stick
representations, whereas the rest of the neighboring residues are depicted as lines.
2.3.5 Aggregation propensity
The aggregation propensity of the recombinant RNase A-Onc has been evaluated. A
little amount of protein was incubated in 40% acetic acid solution at a concentration
of 5 mg×ml-1 for 2 hours at 37 °C and then lyophilized. The powder obtained was
dissolved in sodium phosphate buffer 0.40 M pH 6.7. As control, a similar amount

73
of protein was dissolved in ultrapure water at a final protein concentration of 5
mg×ml-1 and incubated at 37 °C for 2 hours. Furthermore, an aliquot of native RNase
A was also incubated in acid acid solution 40% v/v and in water for comparison.
After 2 hours, each protein sample was loaded on a Superdex 75 HR 10/30 column
attached to an AKTA FPLC system previously equilibrated in sodium phosphate
buffer 0.40 M pH 6.7. The chromatographic profiles reported in Fig.9, show that
RNaseA-Onc oligomerizes both under denaturing conditions, i.e upon acetic acid
liophylization, and under native conditions, i.e. in water. The 20% of the protein
was eluted as dimer, independently on the incubation condition. On the other hand,
as expected RNase A does not give rise to oligomers in ultrapure water but only
under denaturing conditions, i.e. dissolution in 40% acetic acid solution (Fig.10 ).
Thus, the chromatographic profiles obtained showed that the mutant RNase A-Onc
is endowed with a spontaneous aggregation propensity, differently from the parental
protein.

74
Fig. 9 Gel filtration profiles. RNase A-Onc incubation under native (blue) and denaturing (orange)
conditions.
Fig. 10 Gel filtration profiles. RNase incubation under native (blue) and denaturing (magenta)
conditions

75
2.4 Conclusions and ongoing works
Ribonucleases represent wide-spread models to study protein stability and
aggregation propensity in vitro. In particular, RNase A is a very well characterised
protein whose aggregation path is due to the well-known 3D-DS. According to this
molecular mechanism proposed by Eisenberg, proteins can oligomerize through the
reciprocal exchange of small or large regions (peptide(s) or entire domain(s)) of the
monomeric subunits. Monomers exploit short flexible hinge-loops present in their
sequence to address a definite domain (or more than one) into the corresponding
partner subunit that will reciprocally swap an identical domain with the former
subunit. Several studies indicate that hinge loops can be putative regions to trigger
RNAse A oligomerization via 3D-DS involving both the hinge loops at N-terminus
and that one at C-terminus. In this work, the role of C-terminal hinge loop sequence
has been investigated. The short Onconase C-terminal β-hairpin element has been
used as template to design a new RNase A mutant: RNase A-Onc. The effect of the
mutations introduced in this sensitive region has been investigated with the aim to
shed light on the pleiotropic role played by the C-hinge loop in folding/misfolding
and stability. Biophysical data reveal that the shortness of the loop does not
compromise the folding and the thermal stability. Moreover, the local structural
arrangement was not disturbed resulting in a tertiary structure comparable to the
native RNase A in the region modified. Interestingly, despite the absence of proline
in this loop, RNase A-Onc shows a spontaneous aggregation propensity. Indeed, it
forms dimers also under native conditions, i.e. when dissolved in water differently
from the parental RNase A. According to Laurents and coworkers [12], RNase A is
chiefly unfolded in 40% acetic acid; indeed even if it partially retains the native
helices, the β-sheet is fully denatured and all X-Pro peptide bonds are in the trans
conformation. Refolding occurs via an intermediate, IN, with non-native X-Pro
peptide bonds. The intermediate is an “activated form” triggering the system to swap

76
domains and oligomerize. In the mutant RNase A-Onc all the peptide bonds in the
modified hinge loop (i.e. E111-A114) are in trans conformation. This evidence could
explain why RNaseA-Onc aggregates spontaneously without requiring a
denaturation step, as revealed by gel-filtration experiments. The structural
characterization of these aggregates has not yet been performed, but it is reasonably
assume that all of them are stabilized through 3D-DS. At any rate, further studies on
the purified protein forms will provide a deeper characterization of the relationships
between loop length and flexibility on protein aggregation, folding and stability.
2.5 References
[1] Bennett MJ, Schlunegger MP, Eisenberg D. (1995) 3D domain swapping: a
mechanism for oligomer assembly. Protein Sci. 4(12):2455-68
[2] Liu Y, Eisenberg D. (2002) 3D domain swapping: as domains continue to swap
Protein Sci. 11(6):1285-99
[3] Teng PK,AndersonNJ,GoldschmidtL, Eisenberg D.(2012) Ribonuclease A
suggests how proteins self-chaperone against amyloid fiber formation. Protein Sci.
21(1):26-37
[4] Ercole C, Laurents DV. (2011) 3D domain swapping provides a minor alternative
refolding pathway for ribonuclease A. Protein Pept Lett 18(5):467-70.
[5] Miller K.H,Karr J.R., and Marqusee S. (2010) A hinge region cis-proline in
ribonuclease A acts as a conformational gatekeeper for C-terminal domain swapping.
J. Mol. Biol. 400, 567–578

77
[6] Merlino A, Picone D, Ercole C, Balsamo A and Sica F. (2012) Chain termini
cross-talk in the swapping process of bovine pancreatic ribonuclease. Biochimie 94
1108-1118
[7] Gotte G, Laurents DV and Libonati M. (2006) Three-dimensional domain-
swapped oligomers of ribonuclease A: identification of a fifth tetramer, pentamers
and hexamers, and detection of trace heptameric, octameric and nonameric
species.Biochim. Biophys. Acta 1764. 44-54.
[8] Sambashivan S, Liu Y, Sawaya MR, Gingery M and Eisenberg D. (2005)
Amyloid-like fibrils of ribonuclease A with three-dimensional domain-swapped and
native-like structure. Nature.437 266-269.
[9] Notomista E, Catanzano F, Graziano G, Dal Piaz F, Barone G, D'Alessio G and
Di Donato A. (2000) Onconase: an unusually stable protein. Biochemistry.
39(30):8711-8.
[10] Balasco N, Esposito L, De Simone A, Vitagliano L. (2013) Role of loops
connecting secondary structure elements in the stabilization of proteins isolated from
thermophilic organisms.Protein Sci. 22(7):1016-23.
[11] Crestfield AM, Stein WH and Moore S. (1962) On the aggregation of bovine
pancreatic ribonuclease, Archives of biochemistry and biophysics. Suppl 1, 217-22.
[12] Lòpez-Alonso J, Bruix M, Font J, Ribo M ,Vilanova M, Jiménez MA, Santoro
J, Gonzalez C, Laurents DV. (2010) NMR spectroscopy reveals that RNase A is
chiefly denatured in 40% acetic acid: implications for oligomer formation by 3D
domain swapping. J.Am.Chem.Soc. 132(5): 1621-3

78
Part B
_____________
Artificial models
MNEI

79
State of art
Amyloid-type protein aggregation is an important subject worth of investigation in
biochemical and biophysical field [1-3].The growth of this research area has been
improved by the pathological significance of the aggregation events [4-7]. From a
biophysical point of view, amyloid has attracted attention because of its regular
fibrous architecture and its correlation to the protein-misfolding problem [8].
Amyloidgenesis is the nucleation-dependent aggregation process mostly initiated in
partially denatured states of amyloidgenic proteins [9-11]. It was also demonstrated
that the amyloid-like fibrous aggregation with a β-sheet rich structure is a universal
phenomenon which is not restricted to a special category of proteins [12,13]. Many
unsolved problems still remain that may be coupled with diversity in the amyloid
formation mechanisms.
In this Thesis, the sweet-tasting protein MNEI has been proposed to investigate
fibrous aggregation.
MNEI is a single-chain derivative of the sweet protein monellin that, in recent years,
has become an accepted model for studying protein dynamic properties, folding and
aggregation [14-17]. Monellin is one of the best-known sweet-tasting proteins; it has
been first isolated from the fruit of the tropical berry Dioscoreophyllum cumminsii
by Morris and Cagan at the Monell Institute of California [18]. Monellin is a
heterodimeric protein composed of two subunits, made of 45 (A chain) and 50
residues (B chain), respectively [19]. The protein is very stable against acidification
of the solution, but undergoes heat and chemical denaturation rather easily at neutral
or alkaline pH [20]. These denaturation processes are often irreversible [20] thus
hampering industrial applications in food preparations of monellin as edulcorant. In
order to increase the physicochemical stability and to retain the perceived sweetness,
two classes of single-chain monellin derivatives have been designed, where the two
chains are covalently linked [21,22]. The first single-chain monellin designed,
named SCM, is a protein of 94 residues; it was obtained by directly joining the C-

80
terminal residue of B chain (B50E) to the N-terminal residue on the A chain (A1R)
[21]. The second single-chain monellin, known as MNEI, is a protein of 96 residues
obtained by linking the A and B chains through the G51-F52 dipeptide [22]. In Fig.
1 the aminoacidic sequence corresponding to monellin, SCM and MNEI is reported.
The mutant SCM was the first to be characterized both in the solid state [23] and in
solution [24]. Structural information about MNEI has been derived from NMR [25]
and X-ray methods [26]. The topology of MNEI, like that of the parental monellin
and of SCM, consists of a α-helix cradled into the concave side of a strand of five
anti-parallel β-sheets [25,26]. The total folding pattern is analogous to a
pathologically important amyloidgenic protein, cystatin C [27,28]. In Fig. 2, the
NMR structure of MNEI is reported (PDB code: 1FA3). Even if MNEI was
engineered to be more stable than the natural monellin against physicochemical
changes, it shows a prominent aggregation propensity like the parental precursor and
its homologous SCM [14,15]. ThT fluorescence and TEM show that MNEI gives
rise to amyloid aggregation upon incubation at high temperature in presence of 0.150
M NaCl [15]. For this environment-driven aggregation-prone behaviour, MNEI
represents a widespread model to study the influence of pH, temperature, ionic
strength on amyloid-like protein aggregation.
Monellin
Chain A: REIKGYEYQLYVYASDKLFRADISEDYKTRGRKLLRFNGPVPP
Chain B:
GEWEIIDIGPFTQNLGKFAVDEENKIGQYGRLTFNKVIRPCMKKTIYEEN
SCM
GEWEIIDIGPFTQNLGKFAVDEENKIGQYGRLTFNKVIRPCMKKTIYEENREIK
GYEYQLYVYASDKLFRADISEDYKTRGRKLLRFNGPVPP

81
MNEI
GEWEIIDIGPFTQNLGKFAVDEENKIGQYGRLTFNKVIRPCMKKTIYENE(GF)
REIKGYEYQLYVYASDKLFRADISEDYKTRGRKLLRFNGPVPP
Fig. 1 Primary structure of Monellin, SCM and MNEI
Fig. 2 3D structure of MNEI solved by NMR. PDB code 1FA3.
Green: A chain ; Orange B chain ; Blue: dipeptide linker GF

82
References
[1] Fink AL. (1998) Protein aggregation: Folding aggregates,inclusion bodies and
amyloid. Fold. Des. 3: R9–23.
[2] Kelly JW. (1998) The alternative conformations of amyloidogenic proteins and
their multi-step assembly pathways. Cur. Opin. Struct. Biol. 8: 101–106.
[3] Dobson CM. and Karplus M. (1999) The fundamentals of protein folding:
Bringing together theory and experiment. Curr. Opin. Struct. Biol. 9: 92–101.
[4] Sipe JD. (1992) Amyloidosis. Annu. Rev. Biochem. 61: 947–975.
[5] Tan SY. and Pepys MB. (1994)Amyloidosis. Histopathology 25: 403–414.
[6] Prusiner SB,Scott MR, De Armond SJ and Cohen F.E. (1998) Prion protein
biology. Cell 93: 337–348
[7] Koo EH, Lansbury PT Jr and Kelly JW. (1999) Amyloid diseases: Abnormal
protein aggregation in neurodegeneration. Proc. Natl. Acad. Sci. 96:9989–9990.
[8] Dobson CM and Ellis RJ. (1998) Protein folding and misfolding inside and
outside the cell. EMBO J. 17: 5251–5254.
[9] Jarrett JT and Lansbury PT Jr. (1993) Seeding “one-dimensional crystallization”
of amyloid: A pathogenic mechanism in Alzheimer’s disease and scrapie? Cell 73:
1055–1058
[10] Kelly JW. (1998) The alternative conformations of amyloidogenic proteins and
their multi-step assembly pathways. Cur. Opin. Struct. Biol. 8: 101–106.

83
[11] Rochet JC and Lansbury PT Jr. (2000) Amyloid fibrillogenesis: Themes and
variations. Curr. Opin. Struct. Biol. 10: 60–68.
[12] Guijarro JI,Sunde M, Jones JA, Campbell I and Dobson CM. (1998) Amyloid
fibril formation by an SH3 domain. Proc. Natl. Acad. Sci. 95: 4224–4228.
[13] Chiti F, Webster P, Taddei N, Clark A, Stefani M, Ramponi, G and Dobson
CM. (1999) Designing conditions for in vitro formation of amyloid protofilaments
and fibrils. Proc. Natl. Acad. Sci. 96: 3590–3594
[14] Rega MF, Di Monaco R, Leone S, Donnarumma F, Spadaccini R, Cavella S and
Picone D (2015) Design of sweet protein based sweeteners: Hints from structure–
function relationships. Food Chem 173, 1179–1186.
[15] Esposito V, Guglielmi F, Martin SR, Pauwels K,Pastore A, Piccoli R and
Temussi PA (2010) Aggregation mechanisms of cystatins: a comparative study of
monellin and oryzacystatin. Biochemistry 49, 2805–2810.
[16] Spadaccini R, Leone S, Rega MF, Richter C, Picone D. (2016) Influence of pH
on the structure and stability of the sweet protein MNEI. FEBS Letters 590: 3681–
3689I.
[17] Konno T, (2001) Multistep nucleus formation and a separate subunit
contribution of the amyloidgenesis of heat-denatured monellin Protein
Sci.(10):2093-101
[18] Morris JA and Cagan RH (1972) Purification of monellin, the sweet principle
of Dioscoreophyllum cumminsii. Biochim Biophys Acta (BBA) – General Subjects
261, 114–122
[19] Morris JA. and Cagan RH. (1980) Formation of oligomeric monellin in protein
denaturants. Proc. Soc. Exp. Biol. Med. 164: 351–354.

84
[20] Konno T, Murata K and Nagayama K (1999) Amyloid-like aggregates of a plant
protein: a case of a sweet-tasting protein, monellin. FEBS Lett 454, 122–126.
[21] Kim SH, Kang CH, Kim R, Cho JM, Lee Y-B and Lee TK (1989) Redesigning
a sweet protein: increased stability and renaturability. Protein Eng 2, 571–575.
[22] Tancredi T, Iijima H, Saviano G, Amodeo P and Temussi PA (1992) Structural
determination of the active site of a sweet protein A 1H NMR investigation of
pMNEI. FEBS Lett 310, 27–30.
[23] Somoza JR, Jiang F, Tong L, Kang CH, Cho JM and Kim SH. (1993) Two
crystal structures of a potently sweet protein. Natural monellin at 2.75 A resolution
and single-chain monellin at 1.7 A resolution. J. Mol. Biol. 234: 390–404.
[24] Lee SY, Lee JH, Chang HJ, Cho JM, Jung JW and Lee W. (1999) Solution
structure of a sweet protein single-chain monellin determined by nuclear magnetic
resonance and dynamical simulated annealing calculations. Biochemistry, 38, 2340-
2346
[25] Spadaccini R, Crescenzi O, Tancredi T, De Casamassimi N, Saviano G,
Scognamiglio R, Di Donato A and Temussi PA (2001) Solution structure of a sweet
protein: NMR study of MNEI, a single chain monellin. J Mol Biol 305, 505–514.
[26] Hobbs JR, Munger SD, Conn GL. (2007) Monellin (MNEI) at 1.15 A resolution.
Acta Crystallogr Sect F Struct Biol Cryst Commun. 1;63(Pt 3):162-7.
[27] Ghiso J, Jensson O and Frangione B (1986) Amyloid fibrils in hereditary
cerebral hemorrhage with amyloidosis of Icelandic type is a variant of gamma-trace
basic protein (cystatin C). Proc. Natl. Acad. Sci. 83: 2974–2978.
[28] Murzin AG. (1993) Sweet-tasting protein monellin is related to the cystatin
family of thiol proteinase inhibitors. J. Mol. Biol. 230: 689–694.

85
CHAPTER
3

86
From monomers to fibres: temperature, pH and ionic
strength influence MNEI stability
Abstract
Several physicochemical factors can influence the solubility of the sweet protein
MNEI and its aggregation propensity. This study aimed to increase the knowledge
about the factors that could affect the solubility of MNEI and direct towards different
kinds of aggregates, corroborating the validity of MNEI as a model to study protein
aggregation in vitro. An explorative investigation on the influence of the
environmental changes, i.e. pH, temperature and ionic strength, on the protein
stability has been performed. These parameters can affect the solubility and improve
the tendency to form SDS-resistant aggregates. A detailed FT-IR spectroscopy
analysis allowed monitoring the behaviour of MNEI both in solution and in solid
state. FT-IR spectroscopy has revealed that MNEI can form aggregates rich in β-
structures. A morphological characterization by AFM has allowed discriminating
between ordered and amorphous species. New conditions of pH, temperature and
ionic strength where MNEI gives rise to fibrillar aggregates were found.

87
3.1 Introduction
Protein aggregation is a general, widely observed phenomenon in proteins, but most
of the times it only leads to the formation of amorphous masses of denatured proteins
[1]. For biophysicists who study conformational changes of proteins, aggregation has
often been an artefact disturbing their analyses. However, this situation has largely
changed recently, since it has become evident that deposits of aggregates of proteins
or peptides in biological tissues are often correlated with the pathogenesis of
important human diseases. The conversion of globular native proteins into amyloid
fibrils represents the crucial pathogenic event of systemic amyloidoses and its
molecular mechanism has been extensively studied in vitro [2]. For prototypic
globular amyloidogenic proteins, such as lysozyme [3], transthyretin [4] and wild-
type β2-microgobulin (WT β2m) [5], the fibrillogenesis in vitro is primed by non-
physiological conditions including high temperature, prolonged incubation at acidic
pH, or addition of organic solvent. Structures of the fibrillar aggregates of several
amyloidoogenic proteins and the mechanisms of their formation are now one of the
most attractive subjects of biochemical and biophysical research. In this Thesis, the
small globular protein MNEI has been proposed as a model to study the
physicochemical factors that can trigger the system towards different aggregation
patterns. MNEI is a very well characterized protein and it represents a prototype
system for many structure-function relationship studies [6],as well as for folding,
stability and self-assembly investigations [6-8]. Previous experiments carried out on
this system have shown that MNEI can form amyloid fibrils when heated above its
Tm at low pH in presence of NaCl [9]. The molecular mechanism leading to the
fibrous aggregation is still unclear. It has been hypothesized [9], that under these
conditions MNEI can open by a translocation of the α-helix; the β- elements become
more exposed thus favouring the stacking between subunits and the formation of
higher ordered aggregates.

88
Fig. 1 Schematic model for MNEI aggregation. Image adapted from Esposito et. al (2010) [9]
In this work, an extensive study on the conditions that affect protein stability has
been pursued. Biochemical and spectroscopic analysis allow monitoring the
conditions triggering the fibrillar aggregation. In collaboration with Prof. S.M.
Doglia and Dr. A. Natalello of the University of Milan “Bicocca” a detailed FT-IR
spectroscopy study has been pursued to screen new conditions where MNEI may
form fibres. Additionally, in collaboration with Proffs. C. De Rosa and F. Auriemma
and Dr. R. Di Girolamo, a morphological analysis of the insoluble aggregates by
AFM has been performed .
3.2 Materials and methods
3.2.1 Production of recombinant MNEI
To express the recombinant protein, cells of Escherichia coli BL21(DE3) were
transformed with the expression plasmid pET22b+ containing the cDNA encoding
for MNEI. Protein expression and purification were performed following the
procedures reported in Section C “Recombinant Proteins- Procedures”, part 2.
Protein identity, purity and homogeneity were assessed by mass spectrometry and
electrophoresis.

89
3.2.2 Sample preparation
In order to ensure experimental reproducibility, before each experiment MNEI was
dissolved at a protein concentration of at 10 mg×mL-1 in 1 mM HCl (pH 3.0) and
incubated at 60 °C for 20 hours. This approach is necessary to increase solubility at
high protein concentration and to to have an optimal starting point for subsequent
experiments.
3.2.4 Circular dichroism (CD) spectroscopy
Circular dichroism measurements have been performed on a Jasco J815
spectropolarimeter (Jasco, Essex, UK), equipped with a Peltier temperature control
system, using a 0.1 cm quartz cell. Thermal denaturation experiments were recorded
following the signal at 215 nm while varying the temperature from 30 to 95 °C at a
rate of 1 °C×min-1. For each condition, three independent measures were performed.
Experimental points were fitted to a Boltzmann curve, and fraction of unfolded
protein (fu) was calculated according to the formula (1):
where θf and θu are the CD signal of the folded and unfolded state from the fitted
curve, respectively, and θ is the CD signal at each temperature. In all experiments,
the concentration of MNE was 0.2 mg mL-1 as measured by UV absorbance at 280
nm using an ε (0.1%) of 1.41. The thermal denaturation curves have been obtained
at different pHs, namely: 2.5, 3.5, 5.1, 6.8 and 8.4 in 0.020 M sodium phosphate
buffer. In selected pH conditions, i.e. pH 2.5 and 6.8, the thermal denaturation curves
were measured for two conditions of ionic strength: 0 and 0.150 M NaCl.

90
3.2.3 Electrophoresis
MNEI was incubated at a concentration of 5 mg ×mL-1 in 0.020 M sodium phosphate
buffer at different pHs (2.5, 3.5, 5.1, 6.8, 8.4) with or without 0.150 M NaCl at
different temperatures (4-37-60 °C) for 2 or 24 hours. At the appropriate time points,
aliquots of 20 µl were withdrawn from the experimental mixture. The remaining
sample was centrifuged at 13.000 rpm for 3 min, to separate the soluble and
unsoluble fractions. The latter one was resuspended in 100 µl of loading buffer.
Identical volumes (20 µl) of supernatant and precipitated fractions, together with 20
µl of the total mixture, were then loaded on the same gel, to evaluate protein
solubility and tendency to form SDS- resistant aggregates. SDS polyacrylamide gel
electrophoresis (PAGE) was performed according to the Laemmli protocol [10]
using 15% polyacrylamide gels. The oligomerization patterns were also analysed by
cathodic electrophoresis under non denaturing conditions using 12% acidic
polyacrylamide gels [11]. Gels were stained with Coomassie Brilliant Blue R-250.
3.2.5 Fourier Transform Infrared Spectroscopy (FT-IR)
Aliquots of MNEI at 5 mg × mL-1 were incubated from 2 to 24 hours in 0.020 M
sodium phosphate buffer at different pHs (2.5, 3.5, 5.1, 6.8, 8.4) at different
temperatures (4-60-75-85 °C) with or without 0.150 M NaCl. The protein
conformational changes occurring in the time course of MNEI aggregation were
monitored by FTIR measurements in Attenuated Total Reflection (ATR). For these
analyses, 2 µl of the protein samples were deposed on the single reflection diamond
crystal of the ATR device (ATR; Quest, Specac, USA) and dried at room temperature
in order to obtain a protein hydrated film [12-13] .FT-IR spectra of the hydrated films
were acquired were collected by the Varian 670-IR spectrometer (Varian Australia
Pty Ltd, Mulgrave VIC, Australia) under the following parameters: 2 cm-1 resolution,
scan speed of 25 kHz, 1000 scan coadditions, triangular apodization, and a nitrogen-

91
cooled Mercury Cadmium Telluride detector. Spectra were smoothed using the
Savitsky-Golay method before the second derivative analysis, both performed with
the Resolutions-Pro software (Varian Australia Pty Ltd., Mulgrave VIC, Australia).
3.2.6 Thioflavin T (ThT) binding assay
MNEI was incubated at a concentration of 3 mg × mL-1 in 0.020 M sodium phosphate
buffer pH 2.5 and pH 6.8 at 75 °C with or without 0.150 M NaCl for one week. At
each aggregation kinetic time point, a sample aliquot was withdrawn and diluted to
10 µM in 0.020 M sodium phosphate buffer pH 2.5 and pH 6.8 containing 30 µM of
ThT just before the measurement. Fluorescence emission spectra were acquired on a
HORIBA Fluoromax spectrofluorimeter in the range 460–600 nm with scan speed
of 100 nm×min-1, upon excitation at 440 nm. Excitation and emission slits were both
set at 5 nm. Fluorescence intensity values at 485 nm were normalized with respect
to the values obtained for a 30 µM ThT sample recorded in the same day, and plotted
as a function of time. The reported values represent the means from three
independent experiments.
3.2.7 Atomic Force Microscopy (AFM)
MNEI was incubated at 3 mg ×mL-1 0.020 M phosphate buffer at pH 2.5 and 6.8
with or without 0.150 M NaCl at 75 °C. After one week of incubation, a sample
aliquot was withdrawn and diluted 100-fold (0.03 mg×mL-1) in ultrapure water,
deposited on a clean mica sheet and air dried. The mica was then washed with
ultrapure water to remove any deposited salt and gently dried again. AFM
measurements were carried on a Bruker Multimode 8. Images were taken in air under
ambient conditions at a scan frequency of 1 Hz. Scan size was varied from 2 x 2 µm
to 0.5 x 0.5 µm, depending on sample homogeneity.

92
3.3 Results and Discussion
3.3.1 Thermal stability
In order to evaluate the structural stability of MNEI in a wide range of
physicochemical conditions, the thermal denaturation profiles were compared by CD
spectroscopy at five different pH values, 2.5, 3.5, 5.1, 6.8 and 8.4. Full heat
denaturation curves were acquired by monitoring the CD signal intensity at 215 nm
over the range 30–90 °C, as described in the experimental section. All the curves
recorded are consistent with a simple two state equilibrium between folded and
unfolded forms (Fig. 2). In table 1 are reported the Tm estimated for each condition
of pH.
Fig. 1 Spectroscopic analysis at different pHs. Thermal unfolding profiles at 222 nm in 0.020 M
sodium phosphate buffer pH 2.5 (black), 3.5 (red), 5.1 (blue), 6.8 (magenta), 8.4 (green).

93
Tab. 1 Thermal unfolding parameters. Comparison between the denaturation temperatures of
MNEI at pH 2.5, 3.5, 5.1, 6.8 and 8.4
CD data show that pH affects thermal stability at different levels. At pH 2.5 MNEI
is less stable as indicated by its lower Tm; maximum stability is observed at
intermediate acidic pHs (3.5 and 5.1). At neutral (pH 6.8) and alkaline (8.4) pHs,
stability reverts to values close to those observed at pH 2.5.
3.3.2 Aggregation propensity under non-denaturing
conditions
Several conditions were firstly explored by SDS-PAGE 15% to assess the
aggregation propensity of MNEI. As reported in the experimental section, MNEI was
incubated at a final protein concentration of 5 mg×ml-1 for 2 hours in 0.020 M sodium
phosphate buffer at different pH (2.5, 5.1, 6.8, 8.4) and at 4, 37 and 60 °C, i.e. at
temperatures under its Tm. After 2 hours of incubation, aliquot of 20 µl were
withdrawn for the control, while the remaining parts were centrifuged at 13000 rpm
for 5 minutes to separate the soluble fraction from the insoluble one. Identical
volumes of 20 µl of supernatant and precipitate were then loaded on the same gel.
pH T m (°C)
2.5 73 ±1
3.5 88 ±1
5.1 86 ±1
6.8 76 ±1
8.4 79 ±1

94
As reported in Fig. 2 (panels A-D) a prominent aggregation is revealed in all the
explored conditions. The oligomers formed in every experimental condition, would
appear to be SDS resistant.
The observations deriving from these experiments can be summarized in more
details as follows:
- at acidic pH (2.5, panel A) MNEI can form dimers and minor amounts of
higher oligomers . Higher temperature (60 °C) favours solubility, because the
amount of insoluble species decreases if compared to the patterns obtained at
4 or 37 °C;
- at weakly acidic pH (5.1, panel B), high temperature compromises solubility,
as indicated by the presence of aggregates into the precipitated fraction. The
amount of soluble dimer slightly decreases;
- at neutral pH (6.8, panel C) and alkaline pH (8.4, panel D), higher size
insoluble oligomers are predominantly formed. Differently from the acidic
condition, a temperature increase has a deleterious effect on the protein
solubility, leading to massive precipitation. Additionally, at pH 8.4,
significant amount of oligomers of high molecular weight are detected also
into the upper side of the stacking gel.

95
Fig. 2 MNEI aggregation profiles. Gel-electrophoresis under denaturing conditions (SDS-PAGE
15%) after 2 h of incubation of MNEI (5 mg×ml-1 ) at 4,37 and 60 °C in sodium phosphate buffer pH
2.5 (A), pH 5.1 (B), pH 6.8 (C), pH 8.4 (D). T: total; S: supernatant; P: precipitated. Temperatures
are indicated as superscript. A starting point is also reported and indicated with I: initial point.
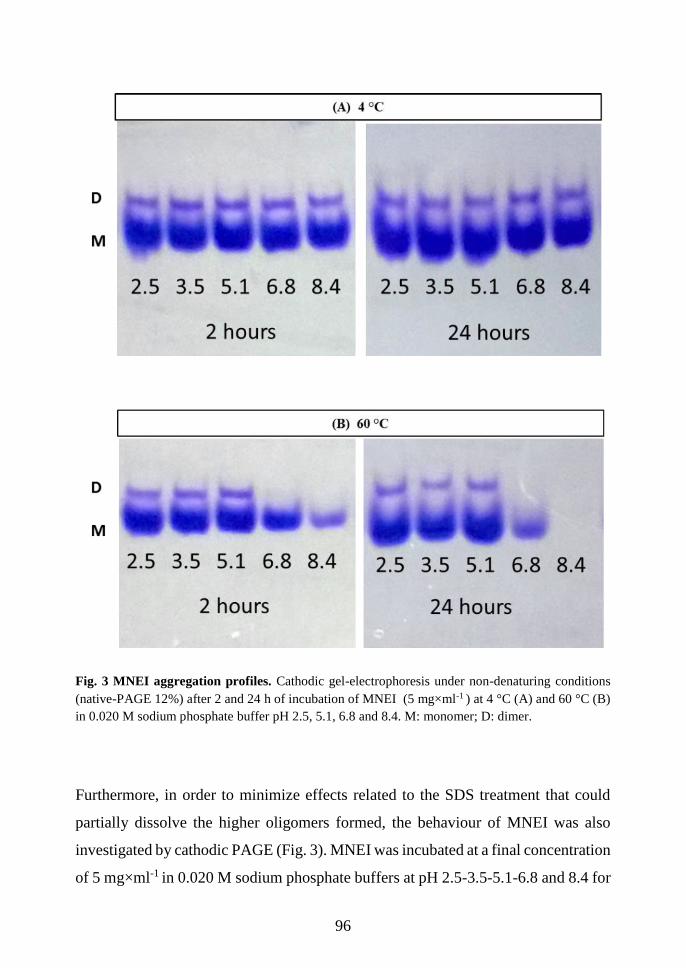
96
Fig. 3 MNEI aggregation profiles. Cathodic gel-electrophoresis under non-denaturing conditions
(native-PAGE 12%) after 2 and 24 h of incubation of MNEI (5 mg×ml-1 ) at 4 °C (A) and 60 °C (B)
in 0.020 M sodium phosphate buffer pH 2.5, 5.1, 6.8 and 8.4. M: monomer; D: dimer.
Furthermore, in order to minimize effects related to the SDS treatment that could
partially dissolve the higher oligomers formed, the behaviour of MNEI was also
investigated by cathodic PAGE (Fig. 3). MNEI was incubated at a final concentration
of 5 mg×ml-1 in 0.020 M sodium phosphate buffers at pH 2.5-3.5-5.1-6.8 and 8.4 for

97
2 or 24 hours at 4 °C (panel A) and 60 °C (panel B). As reported in Fig.4-A, lower
temperature does not affect protein solubility in any of the pH conditions. Indeed
significant amounts of about 20% of dimer still remain in solution and are detectable
on gels. Major differences in the aggregation patterns are more remarked at 60 °C
(Fig.3-B). In particular:
- at acidic pHs (2.5-3.5 and 5.1), both the monomer and the dimer remain in
solution after 24 hours;
- at neutral (6.8) and alkaline (8.4) pHs, the solubility prominently decreases
in a time dependent way. In fact, after 24 hours, only a little amount of
monomer is revealed in solution at neutral pH. At alkaline pH, the solubility
is instantly decreased and after 24h no precipitation is quantitative.
Comparison of the aggregation patterns obtained by denaturing and non-denaturing
PAGE reveals that higher oligomers may be detectable only by SDS-denaturing
electrophoresis upon partial dissolution of these forms that migrate as dimers and
small size aggregates. On the other hand, besides the monomeric protein, only
dimeric forms are detectable on the native PAGE because of the low solubility of the
higher oligomers.
3.3.3 FT-IR spectroscopy: a new tool to study soluble and
insoluble species
In order to improve the investigation on the effects of pH and temperature on MNEI
aggregation, kinetics measurements performed by FT-IR spectroscopy were
collected. Whit this aim, MNEI was incubated at 5 mg × ml-1 in 0.020 M sodium
phosphate buffers at pH 2.5- 3.5- 5.1- 6.8- 8.4 at 4 and 60 °C. As described in the
experimental section, aliquots of 2 µl of samples were deposed on the ATR diamond
and FT-IR spectra were collected before and after 2-6 and 24 hours of incubation.
After 24 hours, the mixtures were centrifuged at 13000 rpm for 5 minutes to

98
additionally analyse the precipitated fraction eventually formed during prolonged
incubation. FT-IR approach allowed monitoring the behaviour of MNEI with an eye
both on the soluble and insoluble species at the same time thus extending the
information deriving from the electrophoretic analyses and overcoming the side
effects of SDS treatment. FT-IR spectroscopy very precisely discriminates between
closely related protein secondary structures by analysing the Amide I band mainly
associated with C=O stretching vibrations of the peptide bonds in the 1700-1600 cm-
1 spectral regions [15-17]. Tab. 2 reports the peak positions related to secondary
structures elements, which were considered during FT-IR analyses to monitor the
conformational changes.
Fig. 4 (panels A-D) reports the second derivative spectra acquired at 4 °C. In all the
conditions of pH explored, MNEI preserves all its secondary structure elements.
Indeed, the signal around 1660 cm-1 is not affected revealing that the α-helix was not
perturbed. At the same time, the signal at 1635 cm-1 referred to intramolecular β-
sheets is also preserved even if its intensity slowly increases in a time dependent way
suggesting that the intramolecular interactions, mainly H-bounds, became weaker
[16,18]. On the other hand, a shoulder around 1620 cm-1 start appearing: it is
diagnostic for intermolecular β-sheets and hints aggregation. This negative peak is
more clearly appreciable into the precipitated fraction isolated by centrifugation after
24 hours (red lines). This behaviour suggests that a low temperature only a weak
aggregation occurs even if no significant differences among the pH are significant.
Tab. 2 FT-IR spectroscopy. Spectral regions and secondary structure elements.

99
Fig. 4 MNEI aggregation profile at 4 °C monitored by FT-IR spectroscopy in ATR mode. Second
derivative spectra recorded after 2-6 and 24 h. MNEI incubation in 0.020 M phosphate buffers at
different pH: 2.5(A); 5.1 (B); 6.8 (C); 8.4 (D). Each line corresponds to different time of incubation:
starting point (blue); 2 h (cyan); 6 h (violet); 24 h (green). After 24 h, the supernatant (magenta line)
and precipitate (red line) are also analysed.
At 60 °C, major differences between acidic, neutral and alkaline pH were observed
(Fig. 5, panels A-D). As reported in panels A-B, MNEI has a similar behaviour when
incubated at low and weakly acidic pH, because the comparison of panels A and B
shows that all the secondary structure elements are conserved and the negative peak
around 1620 cm-1 is only found after prolonged incubation in the precipitated fraction
(red lines), suggesting that aggregation occurs slowly.
pH 2.5 pH 5.1
pH 6.8 pH 8.4
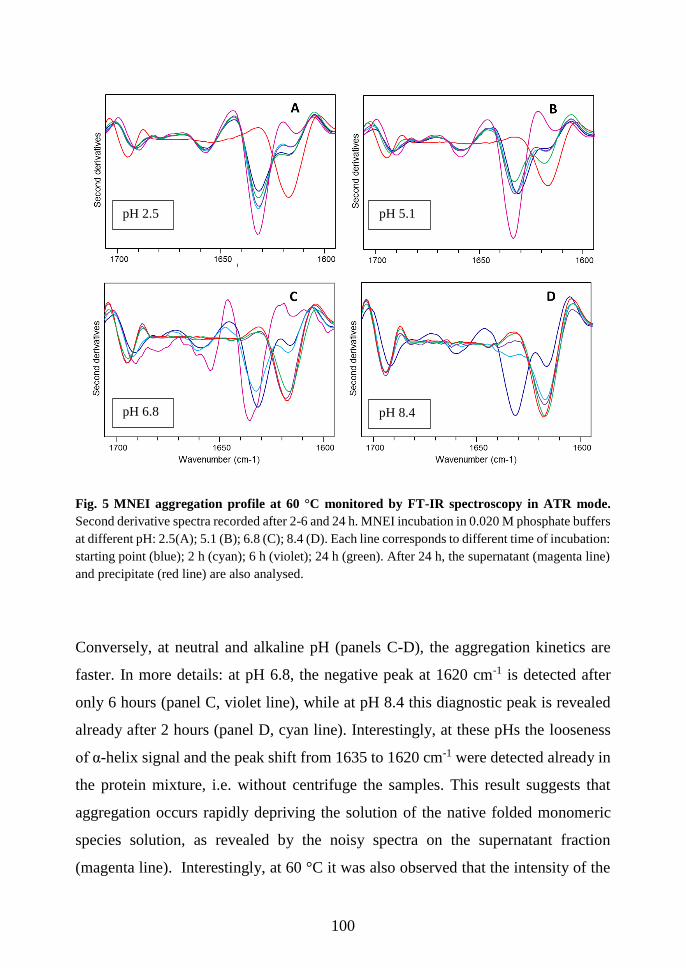
100
Fig. 5 MNEI aggregation profile at 60 °C monitored by FT-IR spectroscopy in ATR mode.
Second derivative spectra recorded after 2-6 and 24 h. MNEI incubation in 0.020 M phosphate buffers
at different pH: 2.5(A); 5.1 (B); 6.8 (C); 8.4 (D). Each line corresponds to different time of incubation:
starting point (blue); 2 h (cyan); 6 h (violet); 24 h (green). After 24 h, the supernatant (magenta line)
and precipitate (red line) are also analysed.
Conversely, at neutral and alkaline pH (panels C-D), the aggregation kinetics are
faster. In more details: at pH 6.8, the negative peak at 1620 cm-1 is detected after
only 6 hours (panel C, violet line), while at pH 8.4 this diagnostic peak is revealed
already after 2 hours (panel D, cyan line). Interestingly, at these pHs the looseness
of α-helix signal and the peak shift from 1635 to 1620 cm-1 were detected already in
the protein mixture, i.e. without centrifuge the samples. This result suggests that
aggregation occurs rapidly depriving the solution of the native folded monomeric
species solution, as revealed by the noisy spectra on the supernatant fraction
(magenta line). Interestingly, at 60 °C it was also observed that the intensity of the
pH 2.5 pH 5.1
pH 6.8 pH 8.4

101
negative peak at 1620 cm -1 significantly decreases when pH changes suggesting that
the aggregates are characterised by stronger interactions (H-bounds) between the β-
elements [16,18].
FT-IR spectroscopy clearly reveals the formation of insoluble aggregates confirming
the behaviours observed by electrophoresis, i.e. that neutral and alkaline pHs deeply
influence solubility and aggregation. The temperature only affect the rate of the
process.
3.3.4 The influence of NaCl on the formation of high
molecular aggregates
We have so far ascertained that pH deeply influences the solubility and the size of
aggregates and that, at neutral or alkaline pH, temperature accelerates the
aggregation. In the following experiments, the influence of ionic strength on the
aggregation propensity was also investigated. The analyses were restricted to two
conditions of pH reproducing the acidic and the neutral environment, i.e. pH 2.5 and
pH 6.8. Thermal stability was assessed by CD spectroscopy, collecting the thermal
denaturation profiles with or without 0.150 M (Fig.6) at pH 2.5 (panel A) and pH 6.8
(panel B). NaCl does not affect the thermal stability of MNEI. In fact, as shown in
Fig.6 and also summarized in Tab.2, at pH 2.5 (panel A) MNEI increases its Tm of
3 °C while at pH 6.8 (panel B) no further gain in stability is promoted by the addition
of salt.

102
A
B
Fig. 6 Effects of NaCl on thermal stability.. Thermal unfolding profiles at 222 nm in 0.020 M
sodium phosphate buffer pH 2.5 (A) and pH 6.8 (B) with or without 0.150 M NaCl.
pH NaCl T m (°C)
2.5 NO 73 ±1
2.5 0.150 M 76 ±1
6.8 NO 76 ±1
6.8 0.150 M 76 ±1
Tab.2 Thermal unfolding parameters. Comparison between the denaturation temperatures of
MNEI at pH 2.5 and 6.8 with or without 0.150 M NaCl

103
In order to evaluate the influence of NaCl on oligomerization, MNEI was incubated
in these two conditions of pH, i.e. 2.5 and 6.8 sodium phosphate buffers, with 0.150
M NaCl at 60 °C, under Tm. The oligomerization has been monitored by cathodic
electrophoresis under non-denaturing conditions. As reported in Fig.7-A, NaCl
affects the solubility of MNEI in all the conditions of pH explored.
Fig. 7 MNEI aggregation profiles. Cathodic gel-electrophoresis under non-denaturing conditions
(native-PAGE 12%) after 2 and 24 h of incubation of MNEI (5 mg×ml-1 ) at 60 °C in 0.020 M sodium
phosphate buffer pH 2.5,3.5, 5.1, 6.8 and 8.4 with (A) or without (B) 0.150 M NaCl. M: monomer;
D: dimer. St: MNEI monomeric form used as reference.
Differently from what observed without NaCl (panel B), no dimers are detectable on
the gels and the amount of monomers also significantly decreases prolonging the

104
time of incubation, especially at neutral and alkaline pH. This result suggests that
NaCl triggers the formation of insoluble species.
3.3.5 MNEI fibrillization: new conditions
It has been reported that MNEI forms fibrillar aggregates at low pH, high
temperature and by adding 0.150 M NaCl [9]. As described in the previous sections,
both at acidic and neutral pH, MNEI gives rise to insoluble aggregates characterised
by intermolecular β-sheets. In this section, new FT-IR spectroscopic analyses were
aimed to understand if any of the conditions so far explored could lead to the
formation of ordered fibrils instead of amorphous aggregates. FT-IR spectra were
collected upon incubation of MNEI at pH 2.5 and 6.8 with or without 0.150 M NaCl
at 75 °C and 85 °C, i.e. around and above the Tm. Two regions on the IR spectra were
monitored: 1620 cm-1 (focusing on the diagnostic peak shift from 1635 cm-1) and
1660 cm -1 (focusing on the looseness of the α-helix signal). The second derivatives
of the IR absorption spectra at pH 2.5 with or without 0.150 M NaCl at 75 and 85 °C
are reported in Fig.8 (panels A-D). It is worth to recall that condition D (pH 2.5-
0.150 M NaCl- 85 °C) corresponds to the one investigated by Esposito et al., [9] who
detected the presence of fibrils by TEM. At 75 °C without NaCl (panel A), a negative
peak around 1620 cm -1 appears in the sample analysed after 2 hours and
progressively increases after 4 hours. The signal around 1660 cm-1 was not affected.
Conversely, whit NaCl (panel B), the negative peak at 1620 cm -1 rapidly appears
and the signal at 1660 cm -1 disappears already after 2 hours. Specular behaviours
were observed at 85 °C (panels C-D). The high similarity of the FT-IR patterns
recorded at 75°C in presence of NaCl with the experimental conditions where MNEI
forms fibres, suggests that fibres could form also around the Tm. Without NaCl,
MNEI also shows a pattern diagnostic for fibrillization, even if the overall
aggregation rate is lower suggesting that NaCl deeply influences the kinetics of the
process.

105
At neutral pH different behaviours were observed (Fig. 9, panels A-D): by comparing
the two conditions of ionic strength at 75 ° C (panels A-B), similar aggregation
patterns are revealed with or without NaCl showing that the formation of
intermolecular β-sheets and the looseness of α-helix occur very quickly already after
2 hours. Similarly, MNEI also promptly aggregates at 85 °C whit or without NaCl
( Panels C-D). All the patterns obtained at neutral pH are also comparable to those
collected at low pH with NaCl, suggesting that at pH 6.8 the role of NaCl is not so
decisive.
Fig. 8 MNEI aggregation profiles at pH 2.5 at high temperature with or without NaCl monitored
by FT-IR spectroscopy. Second derivative spectra recorded for 4 hours. MNEI incubation in 0.020
M sodium phosphate buffers at: 75 °C without NaCl (A); 75 °C with 0.150 M NaCl (B); 85 °C without
NaCl (C); 85 °C with 0.150 M NaCl (D). Each line corresponds to different time of incubation:
starting point (blue); 2 h (purple); 4 h (green).

106
These FT-IR profiles reported that decreasing even at lower temperature, i.e. around
its Tm , MNEI shows patterns compatible to one obtained in fibrilization condition
reported in literature.
Fig. 9 MNEI aggregation profiles at pH 6.8 at high temperature with or without NaCl monitored
by FT-IR spectroscopy. Second derivative spectra recorded for 4 hours. MNEI incubation in 0.020
M sodium phosphate buffers at: 75 °C without NaCl (A); 75 °C with 0.150 M NaCl (B); 85 °C without
NaCl (C); 85 °C with 0.150 M NaCl (D). Each line corresponds to different time of incubation:
starting point (blue); 2 h (purple); 4 h (green).

107
3.3.5 ThT binding
Electrophoretic data provide a rational basis to select new conditions of pH,
temperature and ionic strength leading to insoluble species. FT-IR restrict the
investigation on the conditions triggering fibrilization. Indeed, it suggests that both
at acidic and neutral pH at 75 °C, intermolecular β-sheet can form with or without
NaCl and α-helix signal also progressively disappears. These behaviours may hints
the formation of fibrillar structures. A common hallmark of fibrillar aggregates rich
in β-elements is the capability to bind Thioflavin T (ThT). Thus, preliminary checks
were pursued by evaluating the ThT binding on β structures thorough a fluorescence
assay. MNEI has been dissolved at 3 mg×ml-1 in 0.020 M sodium phosphate at pH
2.5 and pH 6.8, with and without 0.150 M NaCl and incubated at 75 °C until one
week (168 hours) . At this time, a clear ThT fluorescence intensity plateau was
detected. ThT fluorescence intensities in function of time are reported in Fig.10,
panels A-B. In all the conditions explored, a positive ThT fluorescence signals were
detected but some differences in the kinetics of ThT binding are revealed.
a) ThT fluorescence emission was pH dependent. In fact, at acidic pH (panel A)
the kinetics is lower than what observed at neutral pH (panel B), where the
fluorescence reaches plateau very fast, already after 24 hours of incubation
while at pH 2.5 the plateau is detectable after one week.
b) The ionic strength deeply influence the formation of ThT+ aggregates at
acidic pH (panel A). In fact with NaCl at pH 2.5 the ThT fluorescence
intensities progressively for one week. Without NaCl the kinetics of ThT
binding is slower. At neutral pH (panel B) no significant differences among
the two conditions of ionic strength are appreciable at the end point.
In both the conditions of pH considered, no lag phases were detected suggesting that
the aggregation is very fast. These results are in accordance with the biochemical

108
and spectroscopic studies previously described. Furthermore, this behavior could
hint the formation of amyloid-like aggregates also close to Tm .
A
B
Thioflavin T binding assay. Fluorescence intensity at 485 nm upon incubation of MNEI (3 mg×mL-
1 ) at 75 °C in 0.020 sodium phosphate buffer pH 2.5 (A) and pH 6.8 (B) with or without 0.150 M
NaCl for one week.

109
3.3.6 Fibres and amorphous species
In order to reveal the nature of the insoluble aggregates formed close to the Tm ,a
morphological investigation has been performed by AFM, choosing to use 75 °C as
incubation temperature at pH 2.5 and pH 6.8 with or without 0.150 M NaCl for one
week. The AFM images were acquired by Dr. R. Di Girolamo. As reported in Fig.10
(panels A-B) at 75° C, fibres were detected at pH 2.5 with or without NaCl
corroborating the data deriving from FT-IR analyses and the aggregation kinetics
followed by ThT mesaurements. On the other hand, as reported in Fig.11 (panel A-
B) only disordered aggregates were detected at neutral pH with or without salt. This
behaviour is in accordance with the biochemical and spectroscopic data that revealed
a too fast aggregation, also confirmed by the early plateau detected by ThT
measurements. At neutral pH the system evolves towards disordered species that
rapidly collapse into an amorphous precipitated form.

110
A
B
Fig. 10 Morphology characterization by AFM at pH 2.5. MNEI fibres upon incubation in 0.020 M
sodium phosphate buffer pH 2.5 at 75 °C with 0.150 M NaCl (A) or without NaCl (B). A zoom section
of the fibres is also reported.

111
A B
Fig. 11 Morphology characterization by AFM at pH 6.8. MNEI amorphous aggregates upon
incubation in 0.020 M sodium phosphate buffer pH 6.8 at 75 °C with 0.150 M NaCl (A) or without
NaCl (B).
3.4 Conclusions and ongoing works
In this study, a very careful exploration of MNEI aggregation has been performed.
Several physicochemical factors have been investigated, including pH, temperature
and ionic strength. Biochemical and FT-IR spectroscopic data reveal that MNEI
shows a remarkable aggregation propensity, that can be powerfully influenced by
different factors. At low temperature, MNEI is stable in solution in all the pHs
examined and only a little amount of dimer is detectable in solution. When the
temperature is increased, MNEI rapidly oligomerizes giving rise to high size species
that are endowed with a surprising SDS resistance. Around its Tm , MNEI forms
insoluble aggregates which show a typical FT-IR profile found in fibrillar structures,
i.e. the peak shift from 1635 cm-1 to 1620 cm-1 and the looseness of the signal around
1660 cm-1 , which ar diagnostic of the formation of intermolecular β-sheets and the
disappearing of the native α-helix. FT-IR spectroscopy allows to define new

112
conditions triggering fibrilization. Indeed, fibrillar-like profiles were detected at
75 °C at pH 2.5 whit 0.150 M NaCl; the profiles collected without NaCl hints that
fibrilization could occur also without NaCl even if the lag phase was slower. These
suggestions were confirmed by ThT binding assays where high fluorescence
intensities were detected after one week. A similar fibrillar-like behaviour was also
observed at neutral pH even if the aggregation occurs very quickly whit or whitout
NaCl, as revealed by FT-IR spectroscopy and ThT assay. In order to resolve the
morphology of these insoluble aggregates, an AFM analysis was performed. It has
been found that at low pH MNEI forms ordered aggregates with or without NaCl,
thus supporting the biochemical and spectroscopic data. Indeed, they are SDS
resistant. Additionally they show a negative peak of very low intensity on FT-IR
curves around 1620 cm-1, suggesting that several weak interactions (H-bonds)
strongly connect the β-elements in an ordered structure. On the other hand, at neutral
pH the system evolves towards disordered species with or without NaCl. In this
condition, the aggregation occurs too fast and the system collapses into an
amorphous precipitated form. The influence of pH, temperature and ionic strength is
worth of further investigation. The understanding of the behaviour of MNEI under
new environmental conditions triggering fibrilization could allow understanding the
underlying molecular mechanism. A better knowledge could also support a rational
design of new mutants endowed with controlled aggregation propensity, as well as
support new biotechnological applications in the field of biopolymers.

113
3.5 References
[1] Pastore A, Temussi PA. (2012) Protein aggregation and misfolding: good or evil?
J. Phys.: Condens. Matter 24 244101-244110
[2] Bellotti, V., and Chiti, F. (2008) Amyloidogenesis in its biological environment:
challenging a fundamental issue in protein misfolding diseases. Curr. Opin. Struct.
Biol. 18, 771-779
[3] Booth, D. R., Sunde, M., Bellotti, V., Robinson, C. V., Hutchinson, W. L., Fraser,
P. E., Hawkins, P. N., Dobson, C. M., Radford, S. E., Blake, C. C., and Pepys, M. B.
(1997) Instability, unfolding and aggregation of human lysozyme variants
underlying amyloid fibrillogenesis. Nature 385, 787-793
[4] Colon, W., and Kelly, J. W. (1992) Partial denaturation of transthyretin is
sufficient for amyloid fibril formation in vitro. Biochemistry 31, 8654-8660
[5] Naiki, H., Hashimoto, N., Suzuki, S., Kimura, H., Nakakuki, K., and Gejyo, F.
(1997) Establishment of a kinetic model of dialysis-related amyloid fibril extension
in vitro. Amyloid 4, 223-232
[6] Rega MF, Di Monaco R, Leone S, Donnarumma F, Spadaccini R, Cavella S and
Picone D (2015) Design of sweet protein based sweeteners: Hints from structure–
function relationships. Food Chem 173, 1179–1186.
[7] Aghera N and Udgaonkar JB (2012) Kinetic studies of the folding of
heterodimeric monellin: evidence for switching between alternative parallel
pathways. Mol Biol 420, 235–250.
[8] Konno T (2001) Multistep nucleus formation and a separate subunit contribution
of the amyloidgenesis of heat-denatured monellin. Protein Sci 10, 2093 2101.

114
[9] Esposito V, Guglielmi F, Martin SR, Pauwels K, Pastore A, Piccoli R, Temussi
PA., (2010) Aggregation mechanisms of cystatins: a comparative study of monellin
and oryzacystatin. Biochemistry. 6;49(13
[11] Goormaghtigh, E., Raussens, V., and Ruysschaert, J. M. (1999) Attenuated total
reflection infrared spectroscopy of proteins and lipids in biological membranes.
Biochim. Biophys. Acta 1422, 105-185
[14] Natalello, A., Frana, A. M., Relini, A., Apicella, A., Invernizzi, G., Casari, C.,
Gliozzi, A., Doglia, S. M., Tortora, P., and Regonesi, M. E. (2011) A major role for
side-chain polyglutamine hydrogen bonding in irreversible ataxin-3 aggregation.
PLoS One 6, e18789
[15] Seshadri, S., Khurana, R., and Fink, A. L. (1999) Fourier transform infrared
spectroscopy in analysis of protein deposits. Methods Enzymol. 309, 559-576
[16] Barth, A. (2007) Infrared spectroscopy of proteins. Biochim. Biophys. Acta 1767,
1073-1101
[17] Natalello, A., and Doglia, S. M. (2015) Insoluble Proteins, Springer New York,
New York
[18] Zandomeneghi G, Mark RH, Krebs M. and Fändrich M. (2004) FTIR reveals
structural differences between native β-sheet proteins and amyloid fibrils. Protein
Science. 13:3314–3321

115
CHAPTER
4

116
MNEI early steps of unfolding: new NMR insight
Abstract
MNEI aggregation propensity can be evaluated at different level, since the protein is
able to form a wide range of aggregates making it a suitable model to study the
oligomerization process in vitro. Even if more stable than the parental protein
monellin, MNEI is an aggregation prone protein which, like its natural precursor, is
able to form fibrillar aggregates. In Chapter 3, a deep explorative study allowed to
find new conditions favouring fibrilization under prolonged incubation at acidic pH
around its Tm, with or without NaCl. In order to depict the correlation between
folding intermediates and the beginning of aggregation process, NMR studies have
been pursued. The analysis aimed to identify the early steps of unfolding process at
atomic detail to explain the fibrilization propensity under different experimental
conditions, i.e. evaluating the influence of temperature and ionic strength at acidic
pH, where MNEI is able to form ordered aggregates.

117
4.1 Introduction
MNEI and its derivatives have been proposed as potential low-caloric sugar replacers
for food and beverages, but their usage in this framework has been slowed down by
their intrinsic structural fragility. Although displaying higher thermal stability than
the heterodimeric natural precursor monellin [1], MNEI is still sensitive to pH and
temperature changes, that can trigger its unfolding, aggregation and precipitation,
thus reducing its usage for food preparation [2,3,4]. In recent years, MNEI has also
become a well-accepted model to study folding and aggregation properties of β-
sheet-rich proteins. In particular, the dynamics of the folding and unfolding
processes have been studied in great detail instance by the Udgaonkar group [5,6,7].
It had been previously found that the stability of MNEI at neutral pH is determined
by the protonation state of residue Glu23, located in a hydrophobic pocket and
possessing a pKa around 7.5 [8]. The anomalous value of this pKa is explained by
the general observation that side chains of acidic residues embedded in hydrophobic
environments titrate with high pKa, whereas the opposite behaviour is observed for
basic residues. Furthermore, it is generally reported that residues located within
hydrophobic pockets control the pH-dependent stability in proteins [9,10]. Very
recently Molecular Dynamic simulation studies at high temperature showed, that
deprotonation of Glu23 increases flexibility in loop Lα2, which connects the helix to
the β-strand 2, and leads to the disruption of a stabilising hydrogen bond zipper
between side chains and, in turn, lowers the thermal stability of the protein [12]. This
study had been confirmed experimentally by NMR; furthermore it has been found
that the proton chemical shift of the side-chain of Gln28 follows exactly the titration
of Glu23 [13] resulting in a rigid structure at acidic pH and more flexible one at
alkaline pH.
As discussed in Chapter 3, MNEI is highly sensitive to changes in pH and
temperature that can result in aggregation and/or precipitation. Biochemical and
biophysical studies previously described in Chapter 3, revealed that MNEI at low pH

118
can form a little amount of soluble dimer. Increasing temperature MNEI can form
unsoluble fibrillar aggregates. At high temperature and low pH, the presence of NaCl
accelerates the fibrilization. On the other hand, at neutral pH the amount of monomer
in solution rapidly decreases and the system evolves towards unsoluble and
amorphous species. In this study, the behaviour of MNEI at acidic pH has been
analysed in more detail. High resolution NMR studies have been performed to
investigate the role of temperature and ionic strength on the early unfolding events
of MNEI. NMR analysis have been performed in collaboration with Dr. D.V.
Laurents of the CSIC-IQFR (Consejo Superior de Investigation Cientificas - Istituto
de Quimica-Fisica “Rocasolano”) in Madrid.

119
4.2 Materials and Methods
4.2.1 Protein expression and purification
The protein, MNEI, was expressed in Escherichia coli BL21 (DE3) cells harbouring
the pET-22b+ plasmid and purified as described in Section C “Recombinant
Proteins- Procedures”, part 2. The 15N 13C labelled protein was expressed in M9
medium containing 0.5 g×l-1 of 15NH4Cl and 20 g×l-1 of 13C-glucose as sources of
labelled nitrogen and carbon, respectively. Sample purity and folding were
confirmed by SDS/PAGE, gel-filtration, circular dichroism and mass spectrometry
analysis. Protein secondary structure elements are described according to the
following nomenclature: Nt (1–3), β1 (4–6), Lα1 (7–9),α1 (10–27), Lα2 (28–34), β2
(35–48), L23 (49–54), β3 (55–64), L34 (65–68), β4 (69-78), L45 (79–83), β5 (84–
90), Ct (91–96).
4.2.2 NMR spectroscopy
15N 13C-MNEI was dissolved in 0.020 M sodium phosphate buffer pH 2.9, 10% D2O
at 5 mg×ml-1 for reference spectrum. 0.1 mM DSS salt was added for internal
referencing Standard experiments commonly used for protein assignment were
performed at 35 °C, including 15N HSQC, CACB(CO)N(H), HNCO, HNCA, HNN
and HNH spectra. The assignment process was carried out manually using Sparky
software (T. D. Goddard and D. G. Kneller, SPARKY 3,University of California,
San Francisco). To follow chemical shift variations as function of temperature or
ionic strength, series of 15N-HSQC spectra were acquired by dissolving MNEI in
and the same buffer used for the assignment at a concentration of 2.5 mg×mL-1.
Spectra were acquired by increasing the temperature from 35-45-55-65 °C, and then
going back from 65 to 35 °C with or without 0.150 M NaCl. All the spectra were
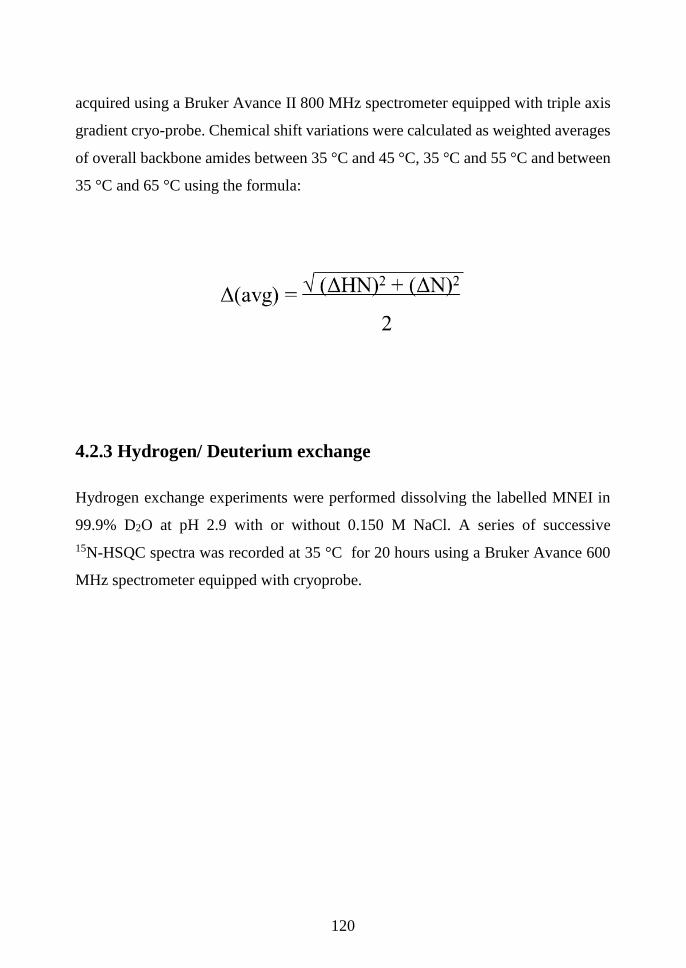
120
acquired using a Bruker Avance II 800 MHz spectrometer equipped with triple axis
gradient cryo-probe. Chemical shift variations were calculated as weighted averages
of overall backbone amides between 35 °C and 45 °C, 35 °C and 55 °C and between
35 °C and 65 °C using the formula:
4.2.3 Hydrogen/ Deuterium exchange
Hydrogen exchange experiments were performed dissolving the labelled MNEI in
99.9% D2O at pH 2.9 with or without 0.150 M NaCl. A series of successive
15N-HSQC spectra was recorded at 35 °C for 20 hours using a Bruker Avance 600
MHz spectrometer equipped with cryoprobe.

121
4.3 Results and Discussion
4.3.1 HSQC spectrum at high magnetic field
MNEI 15N-13C was dissolved at a final concentration of 5 mg×ml-1 in sodium
phosphate buffer pH 2.5 to acquire a full dataset necessary to complete the
assignment at 35 °C, as described in the experimental section. The 15N-HSQC
spectrum reported in Fig. 1 indicate that all the residues were identified. The
spectrum acquired in this conditions has been used as reference to identify the amide
and proton chemical shift variations in different experimental conditions of
temperature and ionic strength.
Fig. 1 15N-HSQC spectrum of MNEI at 35 °C

122
4.3.2 Temperature effect
With the aim to investigate at atomic detail the variations on tertiary structure
occurring when temperature was changing, 15N-HSQC spectra were acquired by
increasing progressively the temperature of 10° C, i.e from 35 to 45 °C, from 45 to
55 °C and from 55 to 65 °C. At the end, an additional spectrum was acquired cooling
back the sample to the starting point, i.e. decreasing temperature from 65 to 35 °C.
In order to find the putative regions involved in local unfolding events, the shift of
the resonances of amide and proton chemical shifts for each aminoacidic residue
have been calculated for each range of temperature. Fig. 2 summarizes the chemical
shift variations upon heating of MNEI when temperature was increased from 35 to
45 °C (blue bars), from 35 to 55 °C (green bars) and from 35 to 65 °C (red bars). The
secondary structure elements are also reported on the top of the figure, using the
following color-code: loop (magenta), α-helix (grey), β-sheet (yellow).
Fig. 2 Chemical shift variations (Δ avg) upon MNEI heating. The temperature was increased of
10 °C (blue), 20 °C (green) and 30 °C (red), progressively. Missing values correspond to peaks not
assigned for overlap/broadening.

123
As indicated by the blue bars, when temperature was increased of 10 °C, only the
residues located in loop regions show significant chemical shifts variations. By
increasing the temperature of additional 10 °C, until 55 °C (green bars), it can be
observed that loop regions are still influenced, together C41. Furthermore, the signals
relative to residues D7 (Lα1), A19 (α1), E50-R53-E54 (L23) and F89 (β5) were
shifted in very crowded region of the spectrum (8.3-8.0 ppm on 1H axis, 123-118
ppm on 15N axis), making difficult their identification. When temperature was
increased until 65 °C (red bars), besides the loop regions and C41 (β2), also the
residues located in β4 (I75-S76- E77- D78-Y79) and β5 (R84-L86) significantly
change their positions.
Interestingly, MNEI signals were completely recovered when the temperature was
decreased from 65 °C to 35 °C (data not shown) suggesting that, the protein
completely refolds and its 3D structure is completely restored.
4.3.3 NaCl effect
In order to extend the analysis at acidic pH, the influence of NaCl on MNEI stability
has been also investigated. A set of 15N-HSQC spectra were acquired following the
peak positions upon increasing temperature from 35 °C to 65 °C as previously
described. When 0.150 M NaCl was added, the better quality of the spectra allowed
to carefully assign the residues when temperature was increased. The amide and
proton chemical shift variations upon MNEI heating were calculated and were
reported on histograms (Fig. 3). Blue bars correspond to chemical shift variations
calculated when temperature was increased of 10 °C (i.e. from 35 to 45 °C), green
bars correspond to chemical shift variations calculated when temperature was
increased of 20 °C (i.e. from 35 to 55 °C) while red bars are relative to chemical shift
variations observed when temperature was increased of 30 °C (i.e. from 35 to 65 °C).

124
The secondary structure elements are also reported: loop (magenta), α-helix (grey),
β-sheet (yellow).
Fig. 3 Chemical shift variations (Δ avg) upon MNEI heating with NaCl 150 mM. The temperature
was increased of 10 °C (A), 20 °C (B) and 30 °C (C), progressively. Missing values correspond to
peaks difficult to assign.
When temperature was increased of 10 °C (blue bars), only a few residues belonging
to the loop regions and the residues R88-F89 located in β5 show significant amide
chemical shift variations. By increasing the temperature of further 10 °C reaching
55 °C (in green), loop regions are still deeply influenced as revealed by their high
chemical shift variations; additionally, the signal for G51 disappears. Residues R88
and F89 are still characterised by high chemical shift variations together with F71
which is located in β4 strand. Finally, when temperature was increased up to 65 °C
(in red) all the loop regions are strongly influenced; in more detail, the signal of
residues located in the loop 23, i.e. 49-54, become very broad and are no more
detectable in the spectrum. Moreover, high chemical shift variations were detected
for K43 in β2 and for many residues located in β4 and β5 strands, suggesting that
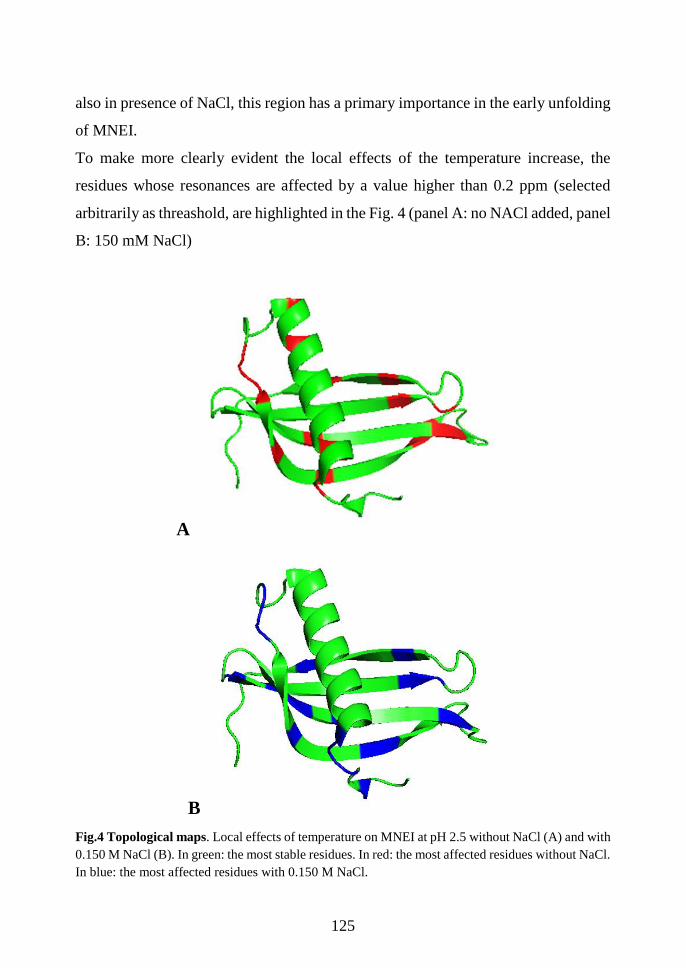
125
also in presence of NaCl, this region has a primary importance in the early unfolding
of MNEI.
To make more clearly evident the local effects of the temperature increase, the
residues whose resonances are affected by a value higher than 0.2 ppm (selected
arbitrarily as threashold, are highlighted in the Fig. 4 (panel A: no NACl added, panel
B: 150 mM NaCl)
A
B
Fig.4 Topological maps. Local effects of temperature on MNEI at pH 2.5 without NaCl (A) and with
0.150 M NaCl (B). In green: the most stable residues. In red: the most affected residues without NaCl.
In blue: the most affected residues with 0.150 M NaCl.

126
4.3.4 Stability and compactness: H/D exchange experiments
Detailed information on MNEI solvent accessibility was derived from H/D exchange
experiments. 15N MNEI was dissolved in 99% D2O at pH 2.9 and a series of HSQC
data sets was collected at 35 °C every 40 minutes for 20 hours. Based on the intensity
of HN signal over time, the amide protons were classified as fast or slow exchanging.
In detail, peaks that disappeared soon after the protein dissolution, i.e. were absent
already in the first spectrum acquired in D2O, were classified as fast-exchanging.
Peaks that were still present in the last spectrum, i.e. 20 hours after the protein
dissolution in D2O, were classified as slow-exchanging. All other peaks detected
were considered as medium-exchanging ones. In Fig. 6 and 7, the topological maps
of MNEI comparing the H/D exchange with or without NaCl are reported. The slow
exchanging residues are highlighted with the following color-code:
- green: absent at the beginning, i.e. high accessibility;
- red: still present at the beginning, i.e. medium accessibility;
- blue: still present after 20 hours, i.e. low accessibility.
In Tab.1 and Tab.2 a detailed classification of each residue is reported by estimating
the H/D exchange at different time in both the condition of ionic strength explored,
i.e. 0 mM NaCl in Tab.1 and 150 mM NaCl in Tab.2, respectively. After 20 hours,
only few residues were detected including: 4E- I6 (β1), A19-I26 (α1), V37-I38-R39
(β2),E54-E59-Y60-Q61-L62-Y63-V64-Y65-A66 (β3), L70-F71-R72-I75 (β4), L87-
V93 (C-t). In the sample containing 0.150 M NaCl, more residues are classified slow
exchangers, including Q13-L15-G16-K17-V20-E22-E23 (α1), N35-K36-V37-I38-
M42-K43-T45-I46-E48 (β2), E54-K56-Y58-E59-Y60-Q61-L62-V64-Y65 (β3),
K69-L70-F71-D74-I75-S76 (β4), L87-N90 (β5) and V93 (Ct) (Fig.7). Overall, the
comparison between these experiments suggest that MNEI is more compact and rigid
with NaCl.

127
Tab. 1 H/D exchange experiments at pH 2.9 (noNaCl added). Classification of residues as Fast
(F), Intermediate (I) and Slow (S) exchangers. Time of HSQC spectra acquisition is also reported: t 1
and t 2, corresponding to 40 minutes and 20 hours after dissolution of MNEI in D2O.
(x): identification; (-): no identification
Aa t 1
40’
t 2
20h
H/D
exchange
Aa t
1
t 2
20h
H/D
exchange
Aa t 1
40’
t 2
20h
H/D
exchange
G1 - - F L32 x - I Y63 x x S
E2 - - F T33 - - F V64 x x S
W3 - - F F34 - - F Y65 x x S
E4 x x S N35 - - F A66 x x S
I5 x - I K36 - - F S67 - - F
I6 x x S V37 x x S D68 - - F
D7 - - F I38 x x S K69 - - F
I8 - - F R39 x x S L70 x x S
G9 - - F C41 - - F F71 x x S
F11 - - F M42 - - F R72 x x S
T12 - - F K43 - - F A73 - - F
Q13 x - I K44 - - F D74 - - F
N14 - - F T45 x - I I75 x x S
L15 x x S I46 - - F S76 x - I
G16 - - F Y47 - - F E77 - - F
K17 - - S E48 - - F D78 - - F
F18 x - I N49 - - F Y79 - - F
A19 x x S E50 - - F K80 - - F
V20 x x S G51 - - F T81 - - F
D21 - - F F52 - - F R82 - - F
E22 - - F R53 - - F G83 - - F
E23 - - F E54 x x S R84 - - F
N24 - - F I55 - - F K85 - - F
K25 - - F K56 x - I L86 - - F
I26 x x S G57 - - F L87 x - I
G27 - - F Y58 x - I R88 x - I
Q28 - - F E59 x x S F89 - - F
Y29 - - F Y60 x x S N90 - - F
G30 - - F Q61 x x S G91 - - F
R31 - - F L62 x x S V93 x - I

128
Tab. 2 H/D exchange experiments at pH 2.9 containing 150 mM NaCl. Classification of residues
as Fast
(F), Intermediate (I) and Slow (S) exchangers. Time of HSQC spectra acquisition is also reported: t 1
and t 2, corresponding to 40 minutes and 20 hours after dissolution of MNEI in D2O.
(x): identification; (-): no identification.
Aa t 1
40’
t 2
20h
H/D
exchange
Aa t 1
40’
t 2
20h
H/D
exchange
Aa t 1
40’
t 2
20h
H/D
exchange
G1 - - F L32 x - I Y63 - - F
E2 x x S T33 x - I V64 x x S
W3 - - F F34 - - F Y65 x x S
E4 x x I N35 x x S A66 x x S
I5 x - I K36 x x S S67 x - I
I6 x x S V37 x x S D68 - - F
D7 - - F I38 x x S K69 x x S
I8 - - F R39 x - I L70 x x S
G9 x - I C41 - - F F71 x x S
F11 - - F M42 x x S R72 - - F
T12 - - F K43 x x S A73 - - F
Q13 x x S K44 - - F D74 x x S
N14 x - I T45 x x S I75 x x S
L15 x x S I46 x x S S76 - - F
G16 x x S Y47 - - F E77 x - I
K17 x x S E48 x x S D78 - - F
F18 x x S N49 - - F Y79 - - F
A19 - x F E50 - - F K80 - - F
V20 x x S G51 - - F T81 - - F
D21 x - I F52 - - F R82 - - F
E22 x x S R53 - - F G83 - - F
E23 - - F E54 x x S R84 - - F
N24 - - F I55 - - F K85 - - F
K25 x - I K56 x x S L86 - - F
I26 x - I G57 - - F L87 x x S
G27 - - F Y58 x x S R88 x - I
Q28 - - F E59 x x S F89 - - F
Y29 - - F Y60 x x S N90 x x S
G30 - - F Q61 x x S G91 - - F
R31 - - F L62 x x S V93 x x S

129
Fig. 6 Topological maps of MNEI. H/D exchange experiments at pH 2.9 without NaCl. Fast
exchanger residues (green); intermediate exchanger residues still present at the starting point (red);
low exchanger residues still present after 20 hours (blue)
Fig.7 Topological maps of MNEI. H/D exchange experiments at pH 2.9 with 150 mM NaCl. Fast
exchanger residues (green); intermediate exchanger residues still present at the starting point (red);
low exchanger residues still present after 20 hours (blue)
By comparing the information obtained from temperature titration experiments and
from the H/D exchange measurements, putative regions of early unfolding steps were
identified. In both the conditions of ionic strength explored, except form the loop
regions, which are naturally more influenced by environment, the aminoacid residues
located in β4 (I75-S76- E77- D78-Y79) and β5 strands ( R84-L86) were strongly
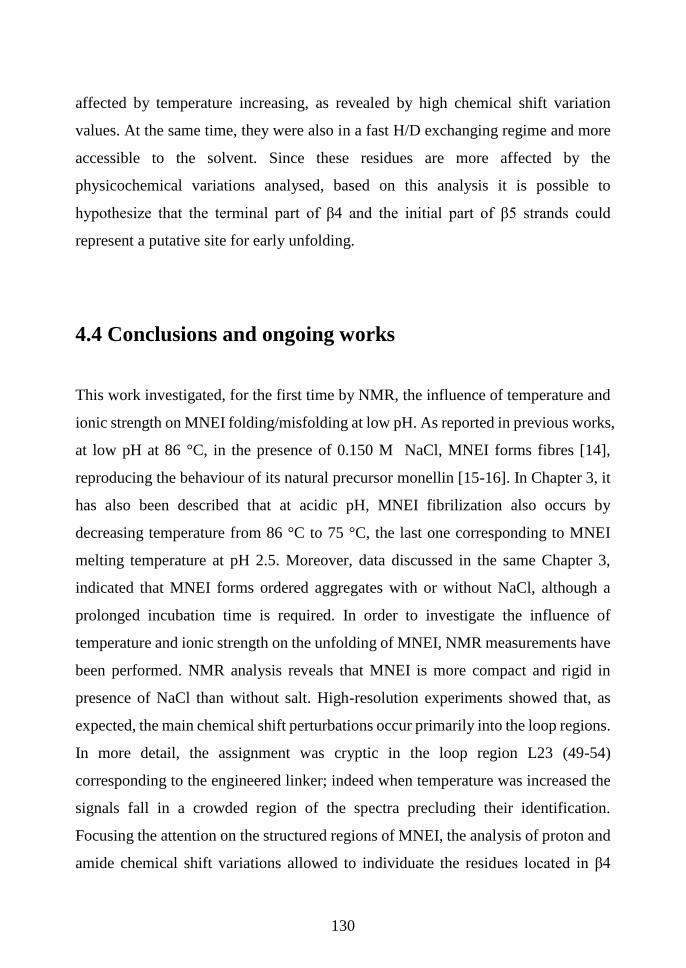
130
affected by temperature increasing, as revealed by high chemical shift variation
values. At the same time, they were also in a fast H/D exchanging regime and more
accessible to the solvent. Since these residues are more affected by the
physicochemical variations analysed, based on this analysis it is possible to
hypothesize that the terminal part of β4 and the initial part of β5 strands could
represent a putative site for early unfolding.
4.4 Conclusions and ongoing works
This work investigated, for the first time by NMR, the influence of temperature and
ionic strength on MNEI folding/misfolding at low pH. As reported in previous works,
at low pH at 86 °C, in the presence of 0.150 M NaCl, MNEI forms fibres [14],
reproducing the behaviour of its natural precursor monellin [15-16]. In Chapter 3, it
has also been described that at acidic pH, MNEI fibrilization also occurs by
decreasing temperature from 86 °C to 75 °C, the last one corresponding to MNEI
melting temperature at pH 2.5. Moreover, data discussed in the same Chapter 3,
indicated that MNEI forms ordered aggregates with or without NaCl, although a
prolonged incubation time is required. In order to investigate the influence of
temperature and ionic strength on the unfolding of MNEI, NMR measurements have
been performed. NMR analysis reveals that MNEI is more compact and rigid in
presence of NaCl than without salt. High-resolution experiments showed that, as
expected, the main chemical shift perturbations occur primarily into the loop regions.
In more detail, the assignment was cryptic in the loop region L23 (49-54)
corresponding to the engineered linker; indeed when temperature was increased the
signals fall in a crowded region of the spectra precluding their identification.
Focusing the attention on the structured regions of MNEI, the analysis of proton and
amide chemical shift variations allowed to individuate the residues located in β4
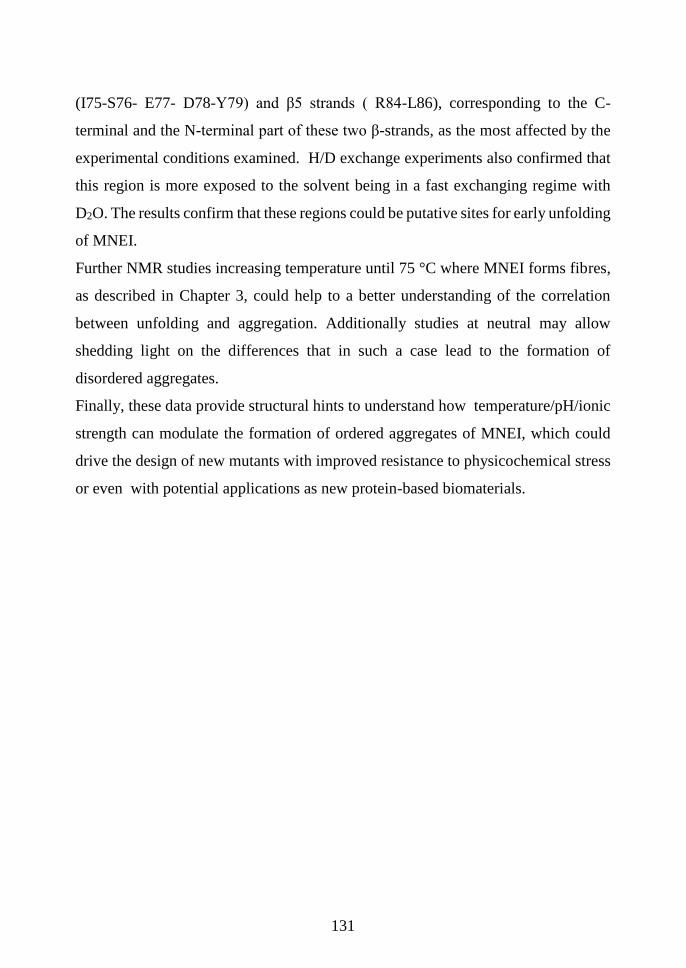
131
(I75-S76- E77- D78-Y79) and β5 strands ( R84-L86), corresponding to the C-
terminal and the N-terminal part of these two β-strands, as the most affected by the
experimental conditions examined. H/D exchange experiments also confirmed that
this region is more exposed to the solvent being in a fast exchanging regime with
D2O. The results confirm that these regions could be putative sites for early unfolding
of MNEI.
Further NMR studies increasing temperature until 75 °C where MNEI forms fibres,
as described in Chapter 3, could help to a better understanding of the correlation
between unfolding and aggregation. Additionally studies at neutral may allow
shedding light on the differences that in such a case lead to the formation of
disordered aggregates.
Finally, these data provide structural hints to understand how temperature/pH/ionic
strength can modulate the formation of ordered aggregates of MNEI, which could
drive the design of new mutants with improved resistance to physicochemical stress
or even with potential applications as new protein-based biomaterials.

132
4.5 References
[1] Morris JA and Cagan RH (1972) Purification of monellin, the sweet principle of
Dioscoreophyllum cumminsii. Biochim Biophys Acta (BBA) – General Subjects 261,
114–122.
[2] Aghera N, Earanna N and Udgaonkar JB (2011) Equilibrium unfolding studies
of Monellin: the doublechain variant appears to be more stable than the singlechain
variant. Biochemistry 50, 2434–2444.
[3] Aghera N and Udgaonkar JB (2012) Kinetic studies of the folding of
heterodimeric monellin: evidence for switching between alternative parallel
pathways. Mol Biol 420, 235–250.
[4] Aghera N and Udgaonkar JB (2013) The utilization of competing unfolding
pathways of monellin is dictated by enthalpic barriers.Biochemistry 52, 5770–5779.
[5] Goluguri RR and Udgaonkar JB (2015) Rise of the helix from a collapsed globule
during the folding of monellin. Biochemistry 54, 5356–5365.
[6] Jha SK, Dhar D, Krishnamoorthy G and Udgaonkar JB (2009) Continuous
dissolution of structure during the unfolding of a small protein Proc Natl Acad
SciUSA 106, 11113–11118.
[7] Rega MF, Di Monaco R, Leone S, Donnarumma F, Spadaccini R, Cavella S and
Picone D (2015) Design of sweet protein based sweeteners: Hints from structure–
function relationships. Food Chem 173, 1179–1186.
[8] Spadaccini R, Crescenzi O, Tancredi T, De Casamassimi N, Saviano G,
Scognamiglio R, Di Donato A and Temussi PA (2001) Solution structure of a sweet
protein: NMR study of MNEI, a single chain monellin. J Mol Biol 305, 505–514.

133
[9] Garcia-Seisdedos H, Ibarra-Molero B and Sanchez- Ruiz JM (2012) How many
ionizable groups can sit on a protein hydrophobic core? Proteins 80, 1–7.
[10] Harms MJ, Casta~neda CA, Schlessman JL, Sue GR, Isom DG, Cannon BR and
Garcıa-Moreno EB (2009) The pKa values of acidic and basic residues buried at the
same internal location in a protein are governed by different factors. J Mol Biol 389,
34–47.
[11] Langsetmo K, Fuchs JA and Woodward C (1991) The conserved, buried
aspartic acid in oxidized Escherichia coli thioredoxin has a pKa of 7.5. Its titration
produces a related shift in global stability. Biochemistry 30, 7603–7609.
[12] Leone S and Picone D (2016) Molecular dynamics driven design of pH-
stabilized mutants of MNEI, a sweet proteinPLoS One 11, e0158372.
[13] Spadaccini R, Leone S,Rega MF, Richter C and Picone S. (2016) Influence of
pH on MNEI structure and stability. FEBS Letters 590 3681–3689
[14] Esposito V, Guglielmi F, Martin SR, Pauwels K, Pastore A, Piccoli R, Temussi
PA., (2010) Aggregation mechanisms of cystatins: a comparative study of monellin
and oryzacystatin. Biochemistry. 6;49(13)
[15] Konno T, Murata K and Nagayama K (1999) Amyloid-like aggregates of a plant
protein: a case of a sweet-tasting protein, monellin. FEBS Lett 454, 122–126.
[16] Konno T (2001) Multistep nucleus formation and a separate subunit
contribution of the amyloidgenesis of heat-denatured monellin. Protein Sci 10, 2093
2101.

134
Part C
_____________
Recombinant Proteins
Procedures

135
Fig.1 RNase A and RNase A-Onc aminoacidic sequences
C.1 Expression and purification of recombinant RNase A-
Onc
Here is reported the effective expression of recombinant onconase in Escherichia
coli inclusion bodies, the refolding of the protein, followed by its purification in high
yields.
Preparation of the mutant RNase A-Onc: design
RNase A and Onconase share high sequence identity. The C-terminal hinge loop of
Onconase was used as template to design the new mutant RNase A-Onc. As
highlighted in Fig.1, the residues GNPYV corresponding to the sequence 112-116 of
RNase A have been substituted with the residues NQA.
RNase A
KETAAAKFERQHMDSSTSAASSSNYCNQMMKSRNLTKDRCKP
VNTFVHESLADVQAVCSQKNVACKNGQTNCYQSYSTMSITDC
RETGSSKYPNCAYKTTQANKHIIVACEGNPYVPVHFDASV
RNase A-Onc
KETAAAKFERQHMDSSTSAASSSNYCNQMMKSRNLTKDRCKP
VNTFVHESLADVQAVCSQKNVACKNGQTNCYQSYSTMSITDC
RETGSSKYPNCAYKTTQANKHIIVACENQAPVHFDASV

136
The corresponding cDNA sequence was obtained from the aminoacid one
CATATG AAA GAA ACA GCT GCA GCG AAA TTT GAG CGT CAA CAC
ATG GAC AGT AGC ACT TCT GCA GCC TCA TCC AGC AAC TAT TGC AAC
CAG ATG ATG AAA TCA CGC AAT CTG ACC AAA GAT CGC TGT AAA
CCG GTG AAC ACG TTT GTG CAT GAA TCG TTA GCG GAT GTT CAG GCC
GTA TGC TCT CAG AAG AAC GTT GCG TGC AAG AAT GGC CAG ACC
AAC TGC TAT CAG AGC TAT TCC ACC ATG TCG ATT ACG GAC TGT CGT
GAA ACC GGT AGT AGC AAA TAC CCG AAT TGT GCG TAC AAA ACG
ACT CAA GCC AAC AAA CAC ATC ATT GTC GCG TGT GAG AAT CAA
GCT CCA GTC CAT TTC GAT GCA TCG GTG TGA GGTACC GGATCC
At the 5’ of the nucleotide sequence was added the CATATG restriction site for Nde
I; the enzymatic cutting between A and T produces a fragment with the start-codon
ATG in frame for the N-terminal Methyonine synthesis. At the 3’ of the cDNA 3
sequences were included: a) the stop-codon TGA; b) the GGTACC restriction site
for Kpn I to screen the positive clones after ligase reaction into the expression vector;
c) the GGATCC restriction site for BamHI. The two restriction sites GGTACC and
GGATCC, were added after the stop-codon TGA.
Preparation of the mutant RNase A-Onc: cloning
procedures
The cDNA encoding the mutant designed was purchased from GENEWIZ,Inc
cloned into a pUC57-KAN commercial vector between BamHI and NdeI restriction
sites (Fig.2). The vector pUC57-KAN was linearized with NdeI and BamHI to isolate
the cDNA encoding RNase A-Onc (Fig.3). The expected fragment was isolated after

137
agarose-gel extraction and inserted with T4 ligase reaction into the expression vector
pET22b+ between the NdeI/BamHI restriction sites (Fig.4). The resulting vector was
used to transform TOP10 E.coli cells to follow the subsequent screening procedures.
The transformed cells were growth on LB-agar plates containing 100 µg of AMP;
five well-shaped cell colonies were picked and inoculated in LB medium containing
100 µg of AMP. After the overnight growth at 37 °C, the cells were harvested and
the plasmidic DNA was extracted by miniprep procedures. The integrity and the
purity of the plasmidic DNA was checked by agarose gel electrophoresis. Each DNA
sample was digested with KpnI to screen the effective internalization of the sequence
encoding the RNase A-Onc mutant (Fig. 5). The KpnI+ clone, was selected and used
to follow the expression procedures.
Fig. 2 RNase A-Onc pUC57-Kan vector map
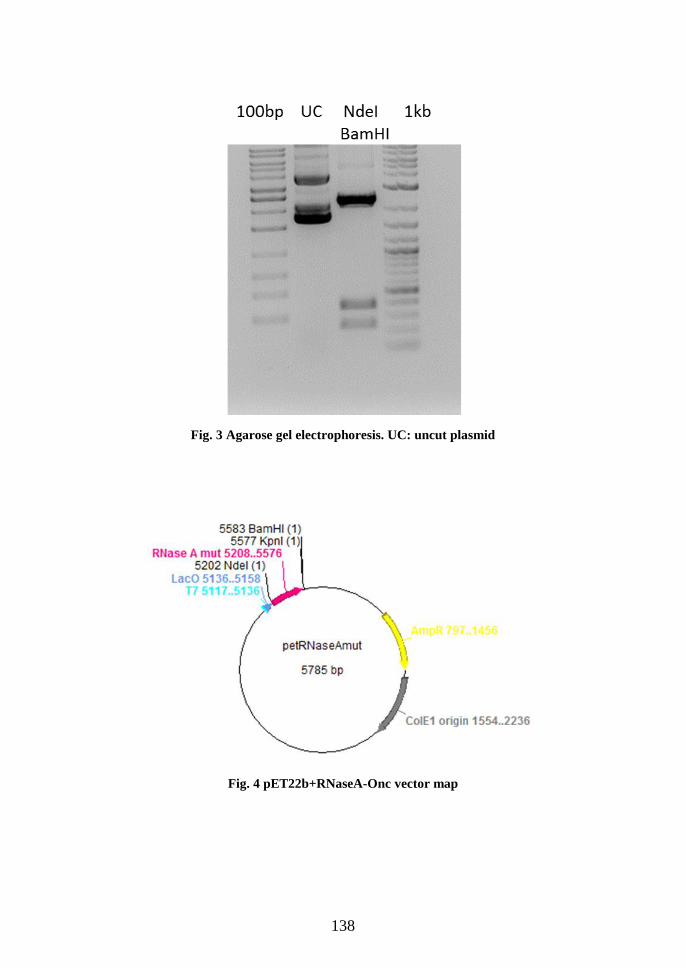
138
Fig. 3 Agarose gel electrophoresis. UC: uncut plasmid
Fig. 4 pET22b+RNaseA-Onc vector map

139
Fig. 5 Agarose gel electrophoresis. KpnI enzymatic restriction screening
Recombinant expression of RNaseA-Onc
The plasmid obtained was transferred in BL21(DE3) cells strain of E.coli. The
transformed cells were grown in LB medium at 37° C on analytical scale (5 mL)
until reaching the final OD600 nm of 0.6 when the protein expression was induced
adding 100 mM IPTG. After 3 hours from the induction, 1 mL of cultured cells was
harvested while the remaining culture was keep at 37 °C for a comparative overnight
induction. The corresponding pellets were treated with SDS-lysis buffer and boiled
to extract the proteins. A little amount of sample corresponding to 5 µg of total
proteins was loaded on SDS-poliacrilamide gel to check the RNaseA-Onc expression
(Fig.6).

140
Fig. 6 SDS-PAGE. RNase A-Onc effective expression. 1: Marker; 2: No induction; 3: Induction fro
3 hours; 4: Overnight induction; 5: RNase A wild type
As showed in Fig. 6 (lane 3), an effective protein expression was reached after 3
hours of induction while increasing the incubation time for the night does not
significantly increase the RNaseA-Onc expression but only endogenous proteins
were over-expressed.
For preparative purposes, the transformed cells were inoculate in 1L fresh LB/AMP
medium and grown until reaching the final OD600 nm of 0.6 when the protein
expression was induced adding 0.4 mM IPTG. After 3 hours of induction, the cell
were divided into 4 aliquots and harvested for centrifugation at 6000 rpm at 4 °C for
30’.
Isolation and denaturation of inclusion bodies
Each aliquot was suspended in 20 ml of cold 0.10 M Tris-acetate pH 8.4 containing
5 mM EDTA. The cell lysis was performed by sonication at 15 W for 20’ (30’’ on-
30’’off cycle) using a Microson Ultrasonic Homogenizer XL2000. The engineered
RNase-Onc was accumulated into the inclusion bodies so, after lysis, the cytosolic

141
fraction and the insoluble fraction were separated by centrifugation at 17500 RCF
for 1 hour at 4 °C. The resulting pellets, containing the inclusion bodies, were treated
with 15 ml of a detergent and denaturing solution of 0.10 M Tris-acetate, pH 8.4
containing 2% Triton X100, 2M Urea,10 mM EDTA and sonicated for 20’. After
that the samples were centrifuged for 30’ at 4 °C at 12500 RCF. After another
sonication and centrifugation step, the pellet was washed in 15 ml of 0.10 M Tris-
acetate pH 8.4 containing 10 mM EDTA to remove Triton and urea. Finally, the
pellet corresponding to inclusion bodies mainly containing the recombinant
RNaseA-Onc, was washed in 0.10 mM Tris-acetate pH 8.4. All the washing
procedures are checked on SDS-PAGE. Inclusion bodies were then dissolved in 15
ml of 0.10 M Tris-acetate pH 8.4 containing 10 mM EDTA, 6 M Gdn-HCl and 25
mM DTT, purged with N2, and incubated at 37 °C for 3 hours. The protein solution
was dialyzed overnight versus 20 mM acetic acid at 4 °C to remove denaturants and
reducing agents. Any insoluble material was removed by centrifugation in order to
obtain a supernatant fraction containing the RNaseA-Onc in the completely reduced
and denatured form.
Renaturation procedures
Renaturation of the derivatized protein was achieved by diluting samples in 100 mM
Tris-acetate pH 8.4 at a final protein concentration of 0.1 mg ×mL-1 followed by
addition of a redox mixture containing 3 mM glutathione-reduced and 0.6 mM
glutathione-oxyded purged with N2. Maximal renaturation was obtained after 20
hours at 25 °C. The renaturation reaction was stopped removing the redox
glutathione by ultrafiltration on AMICON YM3 membrane (3000 Da exclusion cut-
off). By ultrafiltration, the sample containing RNase A-Onc was also equilibrated in
20 mM acetic acid solution to change the pH from alkaline to acidic to inhibit the
reoxidation reaction.

142
Purification of RNase A-Onc monomeric form
The last step in the RNase A-Onc production, was represented by a gel filtration
chromatography. The protein solution obtained from AMICON ultrafiltration, was
loaded on a Sephadex G75 (1.5×72 cm) column previously equilibrated in 0.10 M
ammonium acetate buffer pH 5.1. The monomeric RNase A-Onc was successfully
purified from high molecular weight contaminants, as shown in Fig.7. The purity
was also assessed by SDS-PAGE 15% and native PAGE 12% as reported in Fig. 8.
The final yeld of pure monomeric RNaseA-Onc obtained by the corresponded to 13
mg per liter of cultured cells in LB medium.
Fig. 3 G75 pattern. RNase A-Onc isolated as monomeric form (M)

143
Fig. 4 Gel electrophoresis. A: SDS- PAGE 15%. B: native PAGE 12%. 1: RNase A wild type; 2:
RNase A-Onc
C.2 Expression and purification of recombinant MNEI
Expression procedures
The recombinant protein MNEI was expressed using a protocol set up in my
laboratory. Cells of Escherichia coli BL21 (DE3) were transformed with plasmid
pET22b+ carrying the gene encoding for MNEI. Cells were cultured on LB/Agar
with ampicillin 100 mg×L-1 and they were grown over night at 37 °C. Subsequently,
the cells were grown in LB medium containing the same antibiotic, at 37 °C with
stir. Protein expression was induced at 0.8 OD/mL by supplying lactose 5 mM and
carried on at 25 °C for 20 hours. The cells were harvested by centrifugation (4 °C,
A B

144
4000 x g, 20 min), washed with cold PBS 1x (NaCl 7.6 g/L, Na2HPO4 1.875
g/L, NaH2PO4 0.41 g/L) and stored frozen until protein extraction.
Purification procedures
To extract the protein, cells were re-suspended in cold sodium acetate 50 mM at pH
5.5 and lysed by sonication on ice with a Microson Ultrasonic Homogenizer XL2000
for 20’ (30’’ on-30’’ off). The protein-containing supernatant was recovered by
centrifugation (4 °C, 7500 x g, 25 min). Purification was achieved by a one-step Ion-
Exchange Chromatography procedure: the cell lysate was applied to an anionic
exchanger DEAE-Sepharose column (20 mL, GE Lifesciences) connected in series
to a Macro-Prep High S cationic exchanger column (15 mL, Bio-Rad). The
chromatography was monitored by UV absorbance at 280 nm. After loading the
supernatant and washing the columns until to absorbance baseline, the recombinant
protein was eluted from the Macro-Prep High S with NaCl 100 mM in sodium acetate
50 mM, pH 5.5. The protein containing fractions were pooled, desalted by Size
Exclusion Chromatography on a Sephadex G-25 column (GE Lifesciences) and
eluted with acetic acid 100 mM. The fractions containing the desalted protein were
put togheter and subjected to freeze-drying. Purity was assessed by Coomassie
stained SDS-PAG. Protein yield was estimated by UV absorbance at 280 nm using
the (0.1%) of 1.41 and corresponds to 50 mg per liter of cultured cells in LB
medium.

145

146
Final remarks
The two proteins selected as natural and artificial models are very useful systems for
aggregation studies. Thanks to their wide aggregation propensity, they allowed to
investigate the influence of chemical, genetic and physical agents.
RNase A is presented as a model to study the metalation of proteins. The interaction
between RNase A and Pt drugs improves protein oligomerization. Pt oligomers are
endowed with peculiar characteristics such us SDS resistance and prolonged stability
in solution. These results might suggest alternative aggregation mechanisms
different from the well-known domain swapping. Pt-drugs selected also affect the
biological action of RNase A evaluated both as enzymatic activity in a standard assay
and also as cytotoxicity on tumoral cells.This suggest that the Pt-drugs deeply
influence the structure and the function pf the protein as explained by solving the
crystallographic structure of the cisplatinated monomer and of the carboplatinated
monomer adducts. Further investigation on dimers may allow obtain structural
information on Pt-dependent dimerization.
RNase A is also presented as a helpful model to design new mutant with different
structural features. The structural characterization of the mutant RNase A-Onc
showed that shortening of the C-terminal hinge loop does not affect the global
folding but can improve the aggregation propensity that, in this protein occurs
spontaneously. Very likely, in this case 3D-DS is involved. Biophysical studies on
dimers obtained in native conditions allow to characterise them and to compare their
structures with the well-known swapped dimers.
In this thesis, the artificial model MNEI was also presented as a suitable system. It
represents a very fascinating model to study the influence of several physicochemical
factors. It has been proven that pH, temperature and ionic strength deeply influence
MNEI solubility and the aggregation towards amyloid-like patterns. The aggregation
mechanism is worth of investigation whit the aim to obtain ordered assemblies under
controlled conditions or avoid their formation and preserve the native structural and
functional elements.

147
Publications (include submitted and in preparation):
Picone D, Donnarumma F, Ferraro G, Russo Krauss I, Fagagnini A, Gotte G, Merlino
A. Platinated oligomers of bovine pancreatic ribonuclease: structure and stability. J
Inorg Biochem, 2015 May; 146:37- 43
Rega M.F, Di Monaco R, Leone S, Donnarumma F, Spadaccini R, Cavella S,Picone
D. Design of sweet protein based sweeteners: hints from structure-function
relationships. Food Chemistry, 2015 April;(173)1179- 1186
Fiorini C, Gotte G, Donnarumma F, Picone D, Donadelli M. Bovine seminal
ribonuclease triggers Beclin1–mediated autophagic cell death in pancreatic cancer
cells. Biochim Biophys Acta, 2014 May;1843(5)976-84
Picone D, Donnarumma F, Ferraro G, Gotte G, Fagagnini A, Butera G, Donadelli M
and Merlino A. A comparison study on RNase A oligomerization induced by
cisplatin, carboplatin and oxaliplatin. J Inorg Biochem submitted.
Pica A, Donnarumma F, Emendato A, Leone S, Rega MF, Di Girolamo R, Merlino
A, Picone D; Structure and aggregation propensity of the super-sweet protein Y65R-
MNEI, Manuscript in preparation
Attended congresses/workshops/summer schools/contribution:
June 12-14, 2014: 14th Naples Workshop on Bioactive Peptides. POSTER
SECTION on Industrial Peptides : F. Donnarumma, M. F. Rega, R. Di Monaco, S.
Cavella and D. Picone, “Design, production and characterization of new protein
sweeteners.
October 6-10, 2014: 1st European Summer School on Industrial Biotechnology
(Milan) – “Stability, Folding and Misfolding of Recombinant Proteins”
February, 11-15, 2017: Biophysical Society 61th Annual Meeting, New Orleans,
USA. Poster communication: Sweeter and stronger: structure-driven molecular
design to enhance sweetness and stability of the single chain monellin MNEI.

148