investigation of saltwater intrusion and salinity stratification in winter of 2007/2008 in the...
TRANSCRIPT
Acta Oceanol. Sin., 2012, Vol. 31, No. 3, P. 31-46
DOI: 10.1007/s13131-012-0204-1
http://www.hyxb.org.cn
E-mail: [email protected]
Investigation of saltwater intrusion and salinitystratification in winter of 2007/2008 in the
Zhujiang River Estuary in China
ZHOU Wei1,2, WANG Dongxiao1∗, LUO Lin1
1 Key Laboratory of Tropical Marine Environmental Dynamics, South China Sea Institute ofOceanology, Chinese Academy of Science, Guangzhou 510301, China
2 Graduate School, Chinese Academy of Sciences, Beijing 100049, China
Received 28 May 2011; accepted 20 October 2011
©The Chinese Society of Oceanography and Springer-Verlag Berlin Heidelberg 2012
AbstractSaltwater intrusion is a serious environmental problem in the Zhujiang River Estuary (ZRE), whichthreatens the water supply of fifteen million people. The hydrological observations as well asmeteorological and tidal forcing in the winter of 2007/2008 were analyzed to examine the saltwaterintrusion in the ZRE. The observational results suggest that the maximum vertical difference ofsalinity can reach 10 in the Humen Channel during neap tide, but is very small in the HengmenChannel. The vertically averaged salinity from time series stations during spring tide is higherthan that during neap tide. A three-dimensional finite difference model was developed based onthe environmental fluid dynamic code (EFDC) to study the mechanism of saltwater intrusion andsalinity stratification in the ZRE. By analyzing the salt transport and the temporal variation ofsaltwater intrusion, the authors found that the net salt transport due to the estuarine circulationduring neap tide was more than that during spring tide. This caused salt to advance more intothe estuary during neap tide. However, saltwater intrusion was stronger during spring tide thanthat during neap tide because the spring-neap variation in salt transport was small relative to thetotal length of the saltwater intrusion. The physical mechanism causing this saltwater intrusionwas investigated by a series of sensitivity experiments, in order to examine saltwater intrusion inresponse to river discharge and winds. The freshwater source was a dominant influencing factorto the saltwater intrusion and controlled salinity structure, vertical stratification and length of thesaltwater intrusion. The prevailing northeast monsoon during winter could increase the saltwaterintrusion in the ZRE. Though the southwest wind was unfavorable to saltwater intrusion duringspring tide, it could increase stratification and saltwater intrusion during neap tide.
Key words: saltwater intrusion, spring tide, neap tide, salt transport
1 Introduction
Saltwater intrusion is the movement of coastalsaline water into an estuary, which makes up-estuarywater become salty due to the mixing of freshwaterwith saltwater. It has become a serious environmentalproblem in the Zhujiang River Delta during dry season(winter), which has a considerable impact on residen-tial water supply, agricultural water supply as well asurban industrial production. The disaster of saltwa-ter intrusion usually occurs in spring tide, and thissituation has become much worse in recent years inthe Zhujiang River Estuary (ZRE) as a result of thelarge scale and continuous excavating sand from the
riverbed (Luo et al., 2006). The saltwater intrusionin the ZRE has received more and more attention dueto both economic and scientific concerns. The saltwa-ter intrusion in the ZRE is mainly controlled by riverdischarge and tidal current; other influencing factorsinclude bathymetry of the ZRE, wind amplitude anddirection, and sea level rising (Wong et al., 2003a).However, it is not clear how these physical factors in-fluence saltwater intrusion in the ZRE.
The Zhujiang River is the largest river in south-western China, and ranks as the 13th large river in theworld. The average annual discharge of the ZhujiangRiver is about 10 000 m3/s. About 80% of the dis-charge occurs between April and September, the ratio
Foundation item: The National Basic Research Program of China (973 Program) under contract No.2011CB403505; the NationalNatural Science Foundation of China under contract Nos 41175074, 41106003 and 41006010.
∗Corresponding author, E-mail: [email protected]
1
32 ZHOU Wei et al. Acta Oceanol. Sin., 2012, Vol. 31, No. 3, P. 31-46
of maximum-to-minimum discharge in a year varyingbetween 3 and 6 times. The Zhujiang River dischargesinto the northern South China Sea (SCS) continentalshelf through eight inlets. The four eastern-most in-lets, namely, Humen, Jiaomen, Hongqimen and Heng-men, discharge their waters into the Lingding Bay,which is also called “The Zhujiang River Estuary”.The ZRE is a micro tidal estuary, with mean tidalrange between 1.0 m and 1.7 m. M2 is usually thedominant semi-diurnal tidal constituent, followed byK1, O1 and S2 (Mao et al., 2004). Freshwater inflowsand tides are the two major external forcing mecha-nisms that control the hydrodynamic process in theZRE. Another important factor that governs the cir-culation in the ZRE is the surface wind stress (Zhao,1990; Dong et al., 2004). The ZRE is under the in-fluence of the East Asia monsoon, experiencing thenortheasterly monsoon (average wind speed of 7–10m/s) in winter and much weaker southwesterly mon-soon (generally less than 6 m/s) in summer. In addi-tion, the ZRE is a complex estuary with marked vari-ation in bottom topography. Most of the ZRE is quiteshallow, with water depth less than 10 m except forthe two channels. The eastern channel connects thecoastal ocean through the Hong Kong waters and thewestern one through the Lantau Channel on the east-ern side of the ZRE (Su, 2004).
Extensive efforts have been made to understandthe basic hydrographic characteristics of the ZRE,such as tide elevation (Yang et al., 1999; Li et al.,2000), tide current and circulation (Wong et al., 2004).The tides in the ZRE mainly come from the LuzonStrait. The tidal energy is concentrated and the tidalrange is amplified as the tidal wave progressing up-stream and the width of estuary becomes narrow. Inthe cross-estuary section, the tidal range in the eastis larger than that in the west, and the pattern of theresidual currents in the ZRE is counter-clockwise, re-sulting from stronger flood currents on the east sideand stronger ebb currents on the west side (Mao etal., 2004) . Moreover, researchers in China have car-ried out many studies about the salinity and tempera-ture distributions in the ZRE (e.g., Dong et al., 2004;Wong et al., 2003a). Temperature and salinity distri-butions show clear seasonal variability in the PRE. Inthe dry season, the relatively low river discharge sus-tains a classical partially mixed estuarine circulationonly in the upper reach of the ZRE (Dong et al., 2004).In the wet season, there exists a typical salt wedge cir-culation, where saltwater intrusion largely occurs via
the eastern channel (Mao et al., 2004). However, thesestudies mainly focused on the basic hydrodynamic pro-cess in the ZRE, and there are few reports about themechanism of saltwater intrusion, especially that inwinter.
In this paper, we first show the observational saltdistribution and meteorological condition in the win-ter of 2007/2008. Then, we present results from ahindcast, three-dimensional numerical simulation ofthe ZRE for the period covering December 2007 toFebruary 2008, corresponding to a period of low riverdischarge. This numerical model is calibrated andverified using measured data during December 2007-January 2008, including a spring and neap tide cy-cle. Salt transport and the temporal variation of salin-ity intrusion are analyzed to investigate mechanism ofsaltwater intrusion. Finally a series of sensitivity ex-periments are used to examine the influence of riverdischarge and wind on saltwater intrusion. This pa-per is organized as follows. Field observations carriedout during December 2007–January 2008 and the envi-ronmental conditions are presented in Section 2. Themodel and its set up are described in Section 3, andthe validation for the model follows in Section 4. Thesimulated results and salt transport are shown in Sec-tion 5. The factors influencing salinity intrusion areexplored in Section 6, and the conclusions are summa-rized in Section 7.
2 Field observations
2.1 Site description
Funded by “Guangdong Province’s MajorProjects for Science and Technology Development”,the Laboratory of Tropical Marine EnvironmentalDynamics (LED) the South China Sea Institute ofOceanology, the Chinese Academy of Sciences (CAS)carried out investigations to examine the saltwaterintrusion in the ZRE. The investigation period wasdivided into two phases: the spring tide (December26–28, 2007) and the neap tide (December 31, 2007to January 2, 2008). Observed hydrodynamic param-eters included water temperature, salinity, depth, andcurrent. Moreover, biological and chemical variables,such as nitrate, phosphate, dissolved oxygen, and oth-ers, were observed. Three ships were used at the sametime to investigate salinity intrusion in Humen, Heng-men and Modaomen Channels, each ship having twocruises. There were three longitudinal sections (L1,L2 and L3) and four time series stations (M1, M2, H1
ZHOU Wei et al. Acta Oceanol. Sin., 2012, Vol. 31, No. 3, P. 31-46 33
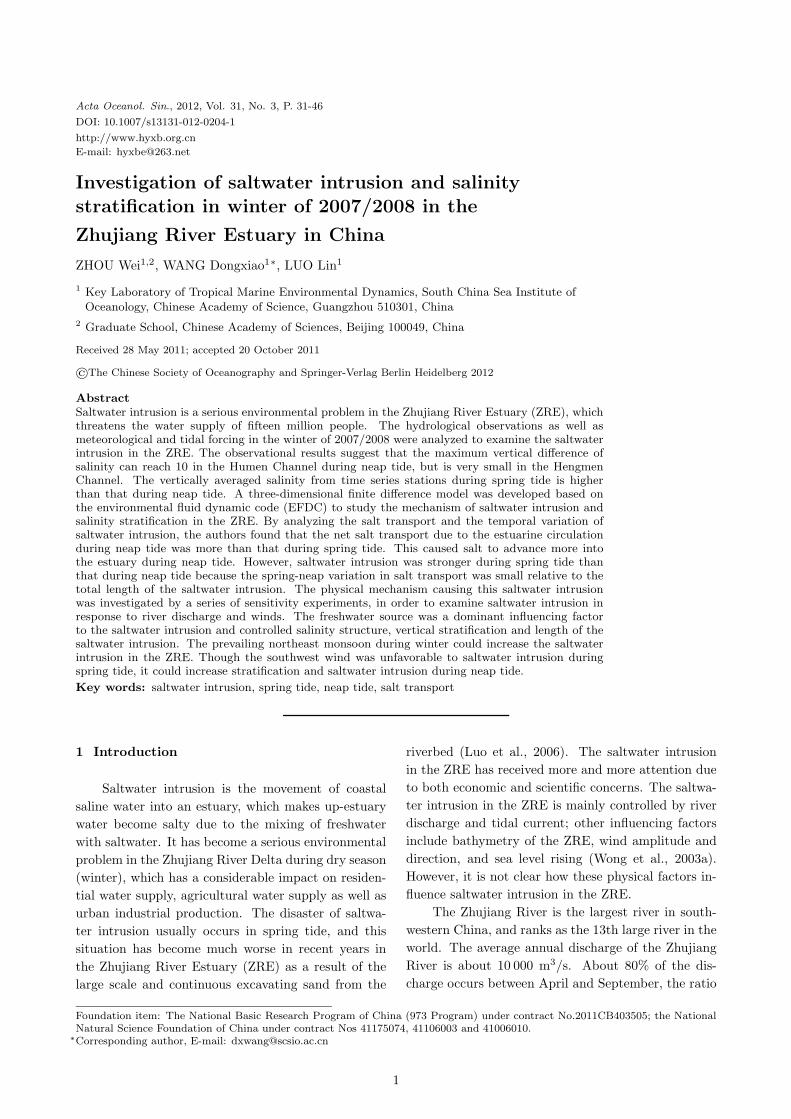
and H2) as shown in Fig. 1. Available observationsfor these cross sections included both hydrodynamicand bio-chemical data, but only hydrodynamic obser-vations were taken at time series stations.
Fig.1. Location of observation stations (H1,
H2, M1, M2), observation sections (L1, L2, L3)
and analysis section (L4, L5).
2.2 Observational procedure
Current and salinity measurements at the fourtime series stations were taken on four small boatsusing RCM9 ocean current meter and CTD. The verti-cal measurements were divided into three layers, whichwere near-surface layer, middle layer and near-bottomlayer. Measurements were repeated at about 1 h in-terval at each station for 50 h in each tide period. Thethree transects, L1, L2 and L3, have 12, 5 and 11 sam-ple points, respectively. Each transect took 7–25 h tocomplete.
2.3 River discharge and meteorological and
tidal forcing
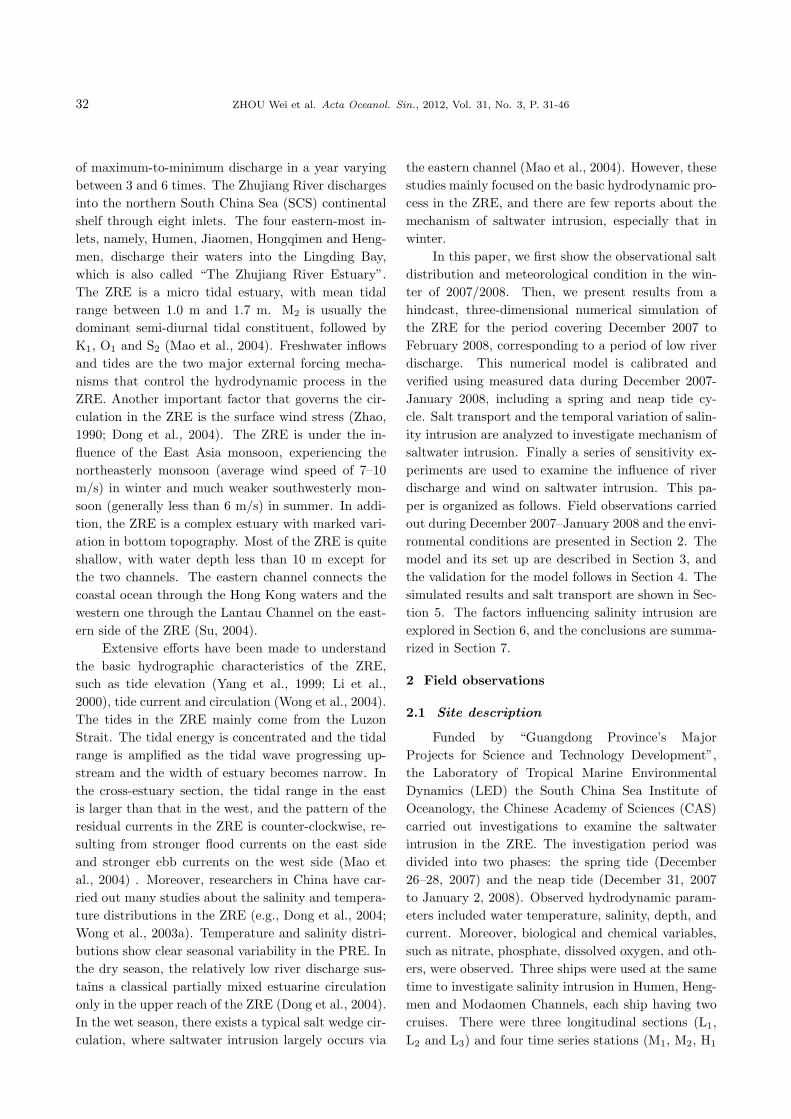
Saltwater intrusion generally starts from Septem-ber and ends in March–April of the following year,which mostly depends on the amount of river discharge(Xu et al., 2005). Saltwater intrudes most severely inDecember–February, while the river discharge duringthis period is less than 20% of the annual average dis-charge. Our investigations were carried out in thisperiod. The annual variation of river discharge in De-cember from 2004 to 2007 is shown in Fig. 2. The ZRE
has three principal tributaries, namely, the XijiangRiver, the Beijiang River and the Dongjiang River inthe upper drainage basin. The Xijiang River is thelargest and contributes about 77% of the total waterdischarge (Harrison et al., 2008). The river dischargeof Dongjiang varies greatly at different seasons andthe river discharge from April to September accountsfor 70% of the whole year’s discharge. The annualmean discharge of Dongjiang is 740 m3/s. The riverdischarge of Gaoyao (Xijiang) and Shijiao (Beijiang)hydrological stations were provided by the ZhujiangRiver Water Resource Conservancy and the dischargeof Dongjiang was not obtained. The daily freshwaterdischarges in Beijiang and Xijiang were measured atthese two stations, and the total river discharges ofthese two tributaries account for 86.9% of the totalfreshwater discharge into the ZRE (Zhao, 1990). Asshown in Fig. 2, the river discharge varies greatly;it ranges from 1 531 to 3 100 m3/s, which may resultin the variation of stratification in the ZRE especiallyduring the neap tide. The daily river discharge in ourobservational period is 2 701, 2 577 and 2 686 m3/sduring the spring tide and 2 209, 2 908 and 2 793 m3/sduring the neap tide.
Fig.2. River discharge of the whole Zhujiang
River in December of 2007.
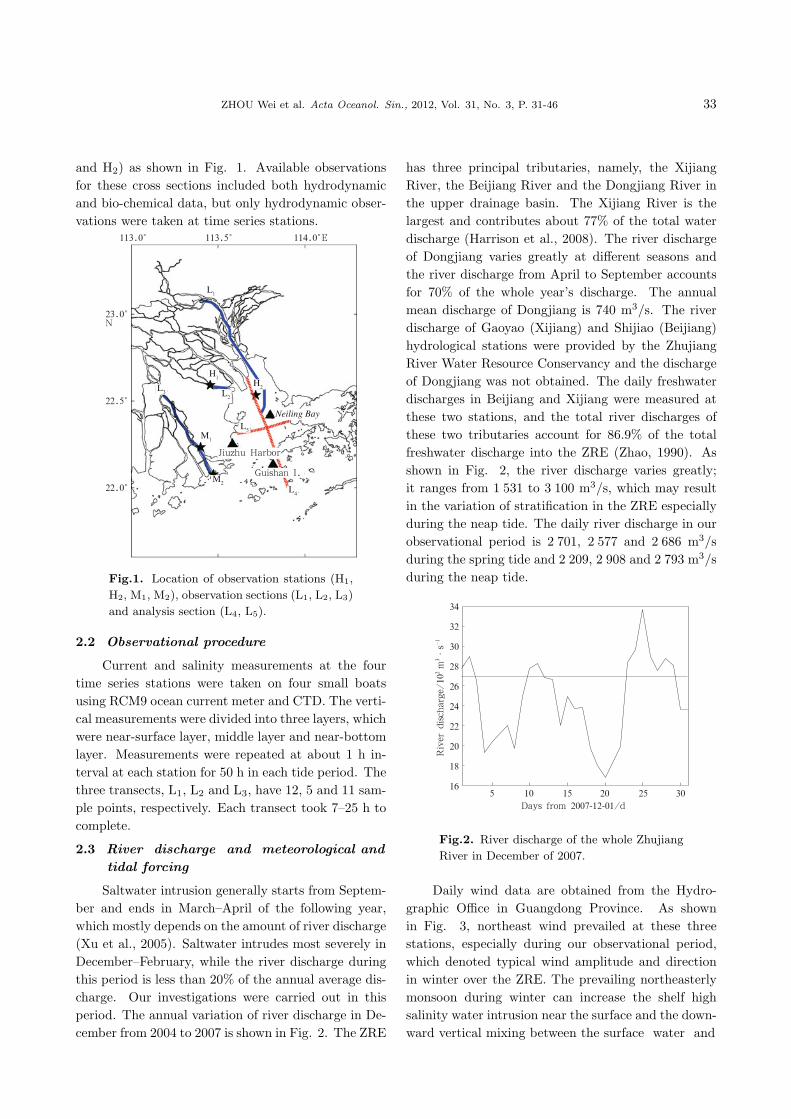
Daily wind data are obtained from the Hydro-graphic Office in Guangdong Province. As shownin Fig. 3, northeast wind prevailed at these threestations, especially during our observational period,which denoted typical wind amplitude and directionin winter over the ZRE. The prevailing northeasterlymonsoon during winter can increase the shelf highsalinity water intrusion near the surface and the down-ward vertical mixing between the surface water and
34 ZHOU Wei et al. Acta Oceanol. Sin., 2012, Vol. 31, No. 3, P. 31-46
Fig.3. Daily-averaged wind of Sanzao (a), Dahengqing (b), and Denglongshan (c) from December 1, 2007to January 31, 2008.
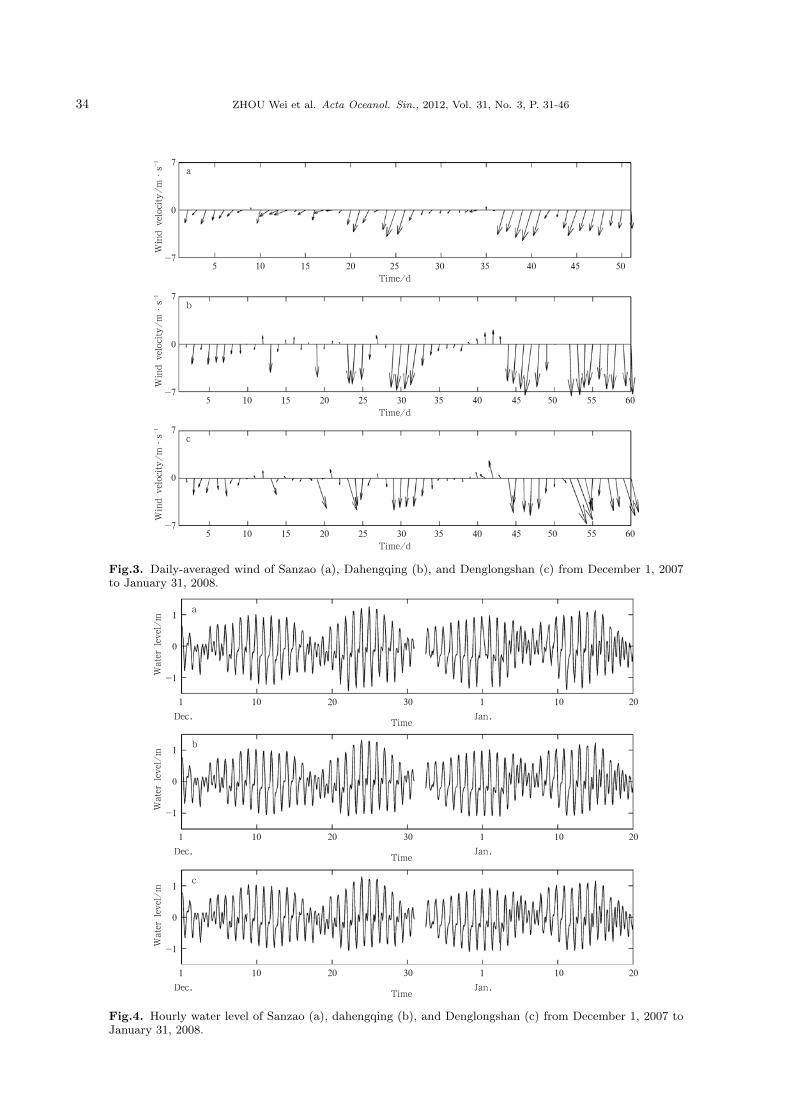
Fig.4. Hourly water level of Sanzao (a), dahengqing (b), and Denglongshan (c) from December 1, 2007 toJanuary 31, 2008.
ZHOU Wei et al. Acta Oceanol. Sin., 2012, Vol. 31, No. 3, P. 31-46 35
the subsurface water (Wong et al., 2003 a, b). The dif-ference of wind amplitude and direction among thesethree stations was relatively small; however, the tem-poral variation of wind at these stations was obvious,especially for wind amplitude, which had a range of0–7 m/s.
Hourly gauged water level was also obtained fromthe Hydrographic Office in Guangdong Province (Fig.4). These three stations locate mostly in the south-western part of the ZRE. Tidal harmonics analysisshowed that the M2 constituent had the largest ampli-tude at each of these stations, followed by K1, O1 andS2. The M2 amplitude was the largest at Dahengqing(37.8 cm) and the least at Sanzao (18.8 cm) that isnear the coast. The water level varies with fortnightlyand monthly modulation due to the beating of M2, S2
and N2 frequencies.
2.4 Results based on observations
2.4.1 Vertical distribution of salinity along the trans-ects
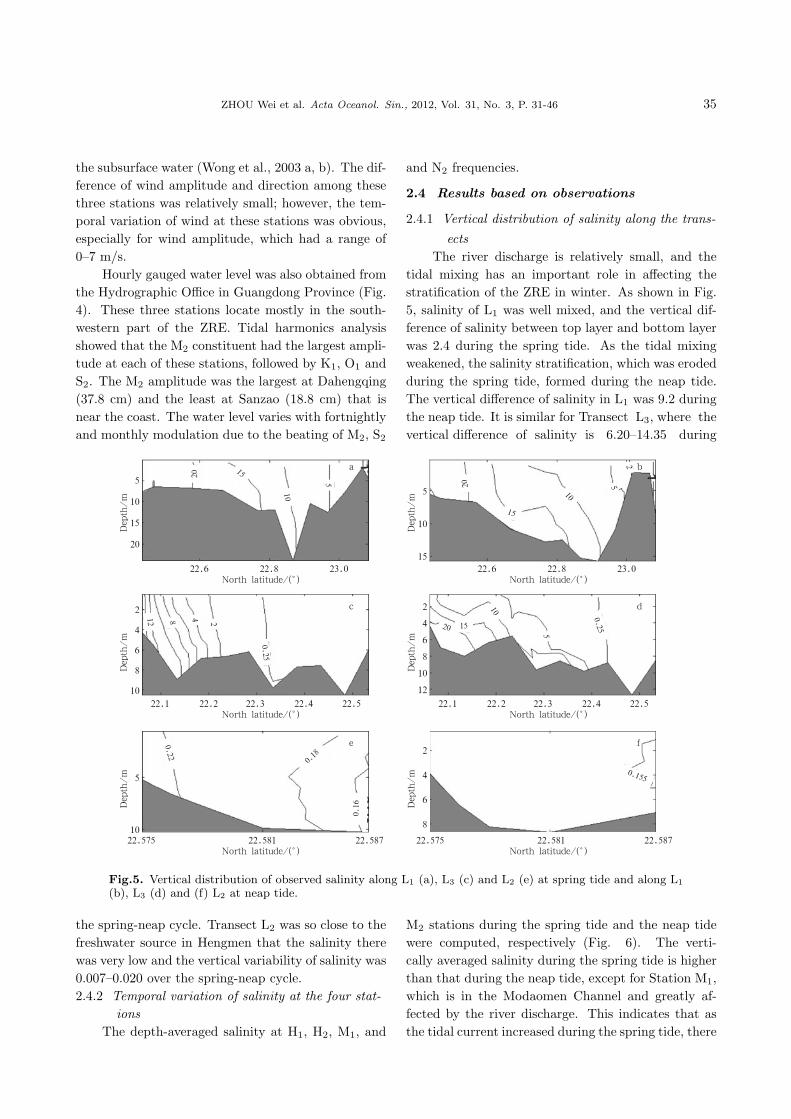
The river discharge is relatively small, and thetidal mixing has an important role in affecting thestratification of the ZRE in winter. As shown in Fig.5, salinity of L1 was well mixed, and the vertical dif-ference of salinity between top layer and bottom layerwas 2.4 during the spring tide. As the tidal mixingweakened, the salinity stratification, which was erodedduring the spring tide, formed during the neap tide.The vertical difference of salinity in L1 was 9.2 duringthe neap tide. It is similar for Transect L3, where thevertical difference of salinity is 6.20–14.35 during
Fig.5. Vertical distribution of observed salinity along L1 (a), L3 (c) and L2 (e) at spring tide and along L1
(b), L3 (d) and (f) L2 at neap tide.
the spring-neap cycle. Transect L2 was so close to thefreshwater source in Hengmen that the salinity therewas very low and the vertical variability of salinity was0.007–0.020 over the spring-neap cycle.2.4.2 Temporal variation of salinity at the four stat-
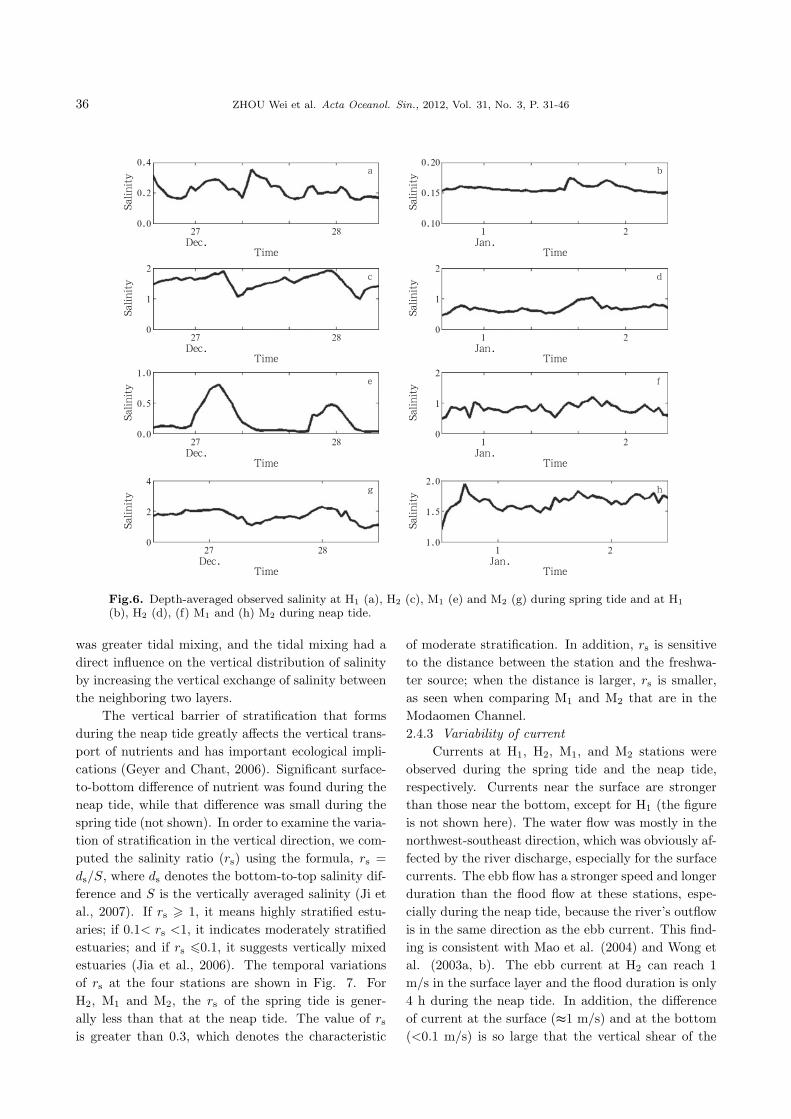
ionsThe depth-averaged salinity at H1, H2, M1, and
M2 stations during the spring tide and the neap tidewere computed, respectively (Fig. 6). The verti-cally averaged salinity during the spring tide is higherthan that during the neap tide, except for Station M1,which is in the Modaomen Channel and greatly af-fected by the river discharge. This indicates that asthe tidal current increased during the spring tide, there
36 ZHOU Wei et al. Acta Oceanol. Sin., 2012, Vol. 31, No. 3, P. 31-46
Fig.6. Depth-averaged observed salinity at H1 (a), H2 (c), M1 (e) and M2 (g) during spring tide and at H1
(b), H2 (d), (f) M1 and (h) M2 during neap tide.
was greater tidal mixing, and the tidal mixing had adirect influence on the vertical distribution of salinityby increasing the vertical exchange of salinity betweenthe neighboring two layers.
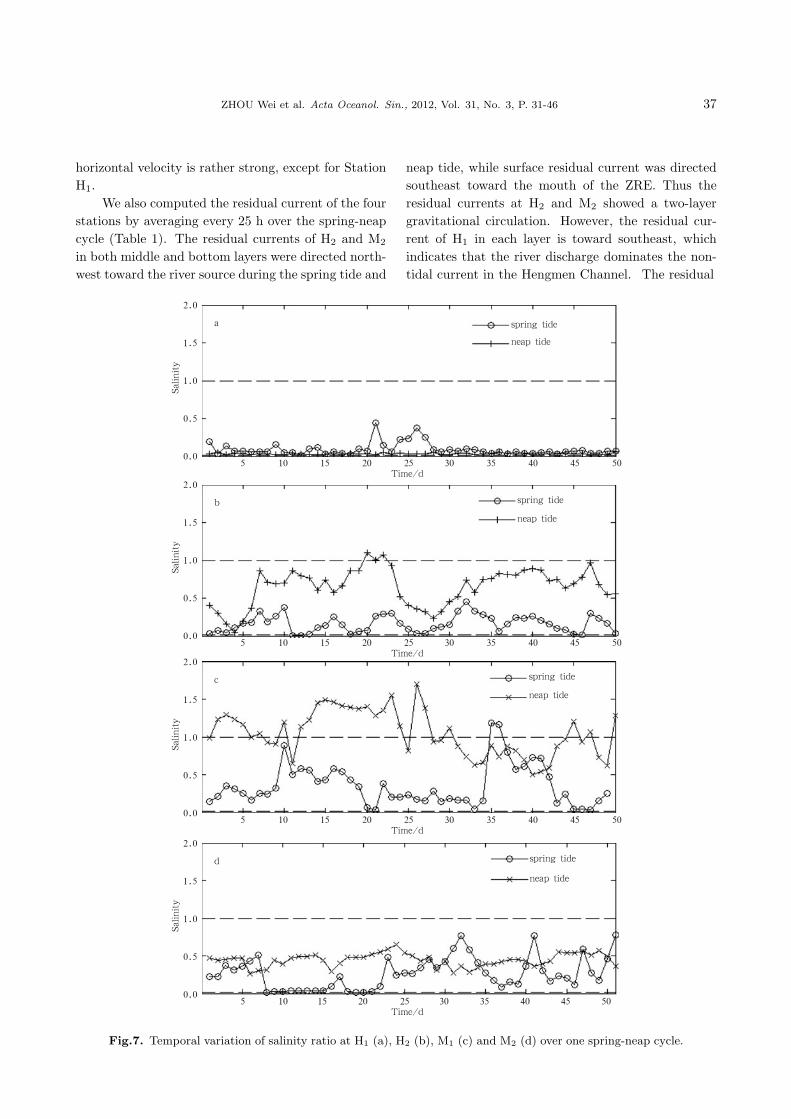
The vertical barrier of stratification that formsduring the neap tide greatly affects the vertical trans-port of nutrients and has important ecological impli-cations (Geyer and Chant, 2006). Significant surface-to-bottom difference of nutrient was found during theneap tide, while that difference was small during thespring tide (not shown). In order to examine the varia-tion of stratification in the vertical direction, we com-puted the salinity ratio (rs) using the formula, rs =ds/S, where ds denotes the bottom-to-top salinity dif-ference and S is the vertically averaged salinity (Ji etal., 2007). If rs � 1, it means highly stratified estu-aries; if 0.1< rs <1, it indicates moderately stratifiedestuaries; and if rs �0.1, it suggests vertically mixedestuaries (Jia et al., 2006). The temporal variationsof rs at the four stations are shown in Fig. 7. ForH2, M1 and M2, the rs of the spring tide is gener-ally less than that at the neap tide. The value of rs
is greater than 0.3, which denotes the characteristic
of moderate stratification. In addition, rs is sensitiveto the distance between the station and the freshwa-ter source; when the distance is larger, rs is smaller,as seen when comparing M1 and M2 that are in theModaomen Channel.2.4.3 Variability of current
Currents at H1, H2, M1, and M2 stations wereobserved during the spring tide and the neap tide,respectively. Currents near the surface are strongerthan those near the bottom, except for H1 (the figureis not shown here). The water flow was mostly in thenorthwest-southeast direction, which was obviously af-fected by the river discharge, especially for the surfacecurrents. The ebb flow has a stronger speed and longerduration than the flood flow at these stations, espe-cially during the neap tide, because the river’s outflowis in the same direction as the ebb current. This find-ing is consistent with Mao et al. (2004) and Wong etal. (2003a, b). The ebb current at H2 can reach 1m/s in the surface layer and the flood duration is only4 h during the neap tide. In addition, the differenceof current at the surface (≈1 m/s) and at the bottom(<0.1 m/s) is so large that the vertical shear of the
ZHOU Wei et al. Acta Oceanol. Sin., 2012, Vol. 31, No. 3, P. 31-46 37
horizontal velocity is rather strong, except for StationH1.
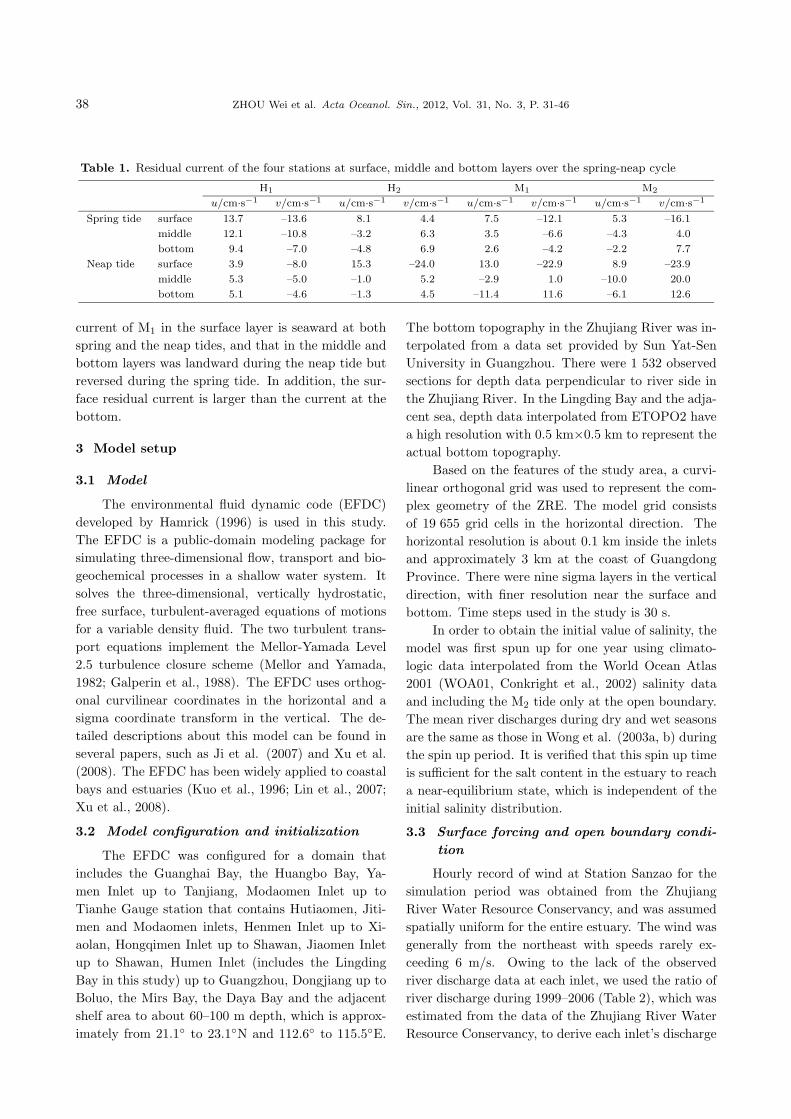
We also computed the residual current of the fourstations by averaging every 25 h over the spring-neapcycle (Table 1). The residual currents of H2 and M2
in both middle and bottom layers were directed north-west toward the river source during the spring tide and
neap tide, while surface residual current was directedsoutheast toward the mouth of the ZRE. Thus theresidual currents at H2 and M2 showed a two-layergravitational circulation. However, the residual cur-rent of H1 in each layer is toward southeast, whichindicates that the river discharge dominates the non-tidal current in the Hengmen Channel. The residual
Fig.7. Temporal variation of salinity ratio at H1 (a), H2 (b), M1 (c) and M2 (d) over one spring-neap cycle.
38 ZHOU Wei et al. Acta Oceanol. Sin., 2012, Vol. 31, No. 3, P. 31-46
Table 1. Residual current of the four stations at surface, middle and bottom layers over the spring-neap cycle
H1 H2 M1 M2
u/cm·s−1 v/cm·s−1 u/cm·s−1 v/cm·s−1 u/cm·s−1 v/cm·s−1 u/cm·s−1 v/cm·s−1
Spring tide surface 13.7 –13.6 8.1 4.4 7.5 –12.1 5.3 –16.1
middle 12.1 –10.8 –3.2 6.3 3.5 –6.6 –4.3 4.0
bottom 9.4 –7.0 –4.8 6.9 2.6 –4.2 –2.2 7.7
Neap tide surface 3.9 –8.0 15.3 –24.0 13.0 –22.9 8.9 –23.9
middle 5.3 –5.0 –1.0 5.2 –2.9 1.0 –10.0 20.0
bottom 5.1 –4.6 –1.3 4.5 –11.4 11.6 –6.1 12.6
current of M1 in the surface layer is seaward at bothspring and the neap tides, and that in the middle andbottom layers was landward during the neap tide butreversed during the spring tide. In addition, the sur-face residual current is larger than the current at thebottom.
3 Model setup
3.1 Model
The environmental fluid dynamic code (EFDC)developed by Hamrick (1996) is used in this study.The EFDC is a public-domain modeling package forsimulating three-dimensional flow, transport and bio-geochemical processes in a shallow water system. Itsolves the three-dimensional, vertically hydrostatic,free surface, turbulent-averaged equations of motionsfor a variable density fluid. The two turbulent trans-port equations implement the Mellor-Yamada Level2.5 turbulence closure scheme (Mellor and Yamada,1982; Galperin et al., 1988). The EFDC uses orthog-onal curvilinear coordinates in the horizontal and asigma coordinate transform in the vertical. The de-tailed descriptions about this model can be found inseveral papers, such as Ji et al. (2007) and Xu et al.(2008). The EFDC has been widely applied to coastalbays and estuaries (Kuo et al., 1996; Lin et al., 2007;Xu et al., 2008).
3.2 Model configuration and initialization
The EFDC was configured for a domain thatincludes the Guanghai Bay, the Huangbo Bay, Ya-men Inlet up to Tanjiang, Modaomen Inlet up toTianhe Gauge station that contains Hutiaomen, Jiti-men and Modaomen inlets, Henmen Inlet up to Xi-aolan, Hongqimen Inlet up to Shawan, Jiaomen Inletup to Shawan, Humen Inlet (includes the LingdingBay in this study) up to Guangzhou, Dongjiang up toBoluo, the Mirs Bay, the Daya Bay and the adjacentshelf area to about 60–100 m depth, which is approx-imately from 21.1◦ to 23.1◦N and 112.6◦ to 115.5◦E.
The bottom topography in the Zhujiang River was in-terpolated from a data set provided by Sun Yat-SenUniversity in Guangzhou. There were 1 532 observedsections for depth data perpendicular to river side inthe Zhujiang River. In the Lingding Bay and the adja-cent sea, depth data interpolated from ETOPO2 havea high resolution with 0.5 km×0.5 km to represent theactual bottom topography.
Based on the features of the study area, a curvi-linear orthogonal grid was used to represent the com-plex geometry of the ZRE. The model grid consistsof 19 655 grid cells in the horizontal direction. Thehorizontal resolution is about 0.1 km inside the inletsand approximately 3 km at the coast of GuangdongProvince. There were nine sigma layers in the verticaldirection, with finer resolution near the surface andbottom. Time steps used in the study is 30 s.
In order to obtain the initial value of salinity, themodel was first spun up for one year using climato-logic data interpolated from the World Ocean Atlas2001 (WOA01, Conkright et al., 2002) salinity dataand including the M2 tide only at the open boundary.The mean river discharges during dry and wet seasonsare the same as those in Wong et al. (2003a, b) duringthe spin up period. It is verified that this spin up timeis sufficient for the salt content in the estuary to reacha near-equilibrium state, which is independent of theinitial salinity distribution.
3.3 Surface forcing and open boundary condi-
tion
Hourly record of wind at Station Sanzao for thesimulation period was obtained from the ZhujiangRiver Water Resource Conservancy, and was assumedspatially uniform for the entire estuary. The wind wasgenerally from the northeast with speeds rarely ex-ceeding 6 m/s. Owing to the lack of the observedriver discharge data at each inlet, we used the ratio ofriver discharge during 1999–2006 (Table 2), which wasestimated from the data of the Zhujiang River WaterResource Conservancy, to derive each inlet’s discharge
ZHOU Wei et al. Acta Oceanol. Sin., 2012, Vol. 31, No. 3, P. 31-46 39
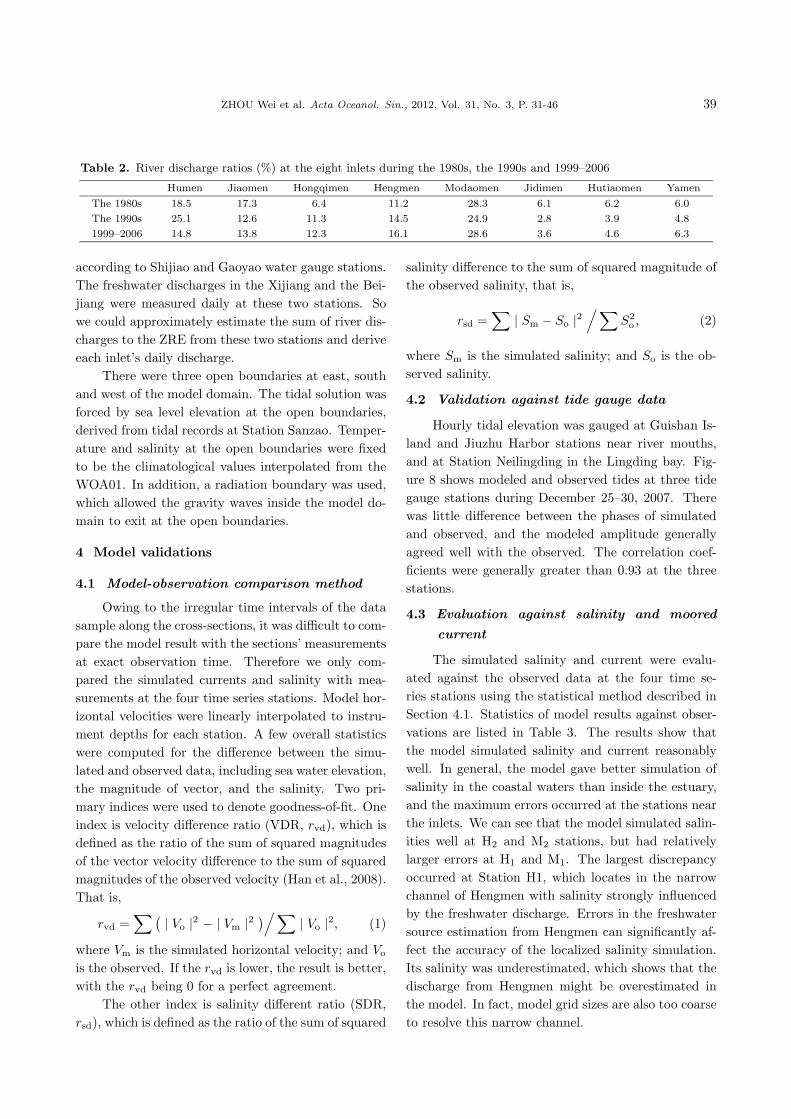
Table 2. River discharge ratios (%) at the eight inlets during the 1980s, the 1990s and 1999–2006
Humen Jiaomen Hongqimen Hengmen Modaomen Jidimen Hutiaomen Yamen
The 1980s 18.5 17.3 6.4 11.2 28.3 6.1 6.2 6.0
The 1990s 25.1 12.6 11.3 14.5 24.9 2.8 3.9 4.8
1999–2006 14.8 13.8 12.3 16.1 28.6 3.6 4.6 6.3
according to Shijiao and Gaoyao water gauge stations.The freshwater discharges in the Xijiang and the Bei-jiang were measured daily at these two stations. Sowe could approximately estimate the sum of river dis-charges to the ZRE from these two stations and deriveeach inlet’s daily discharge.
There were three open boundaries at east, southand west of the model domain. The tidal solution wasforced by sea level elevation at the open boundaries,derived from tidal records at Station Sanzao. Temper-ature and salinity at the open boundaries were fixedto be the climatological values interpolated from theWOA01. In addition, a radiation boundary was used,which allowed the gravity waves inside the model do-main to exit at the open boundaries.
4 Model validations
4.1 Model-observation comparison method
Owing to the irregular time intervals of the datasample along the cross-sections, it was difficult to com-pare the model result with the sections’ measurementsat exact observation time. Therefore we only com-pared the simulated currents and salinity with mea-surements at the four time series stations. Model hor-izontal velocities were linearly interpolated to instru-ment depths for each station. A few overall statisticswere computed for the difference between the simu-lated and observed data, including sea water elevation,the magnitude of vector, and the salinity. Two pri-mary indices were used to denote goodness-of-fit. Oneindex is velocity difference ratio (VDR, rvd), which isdefined as the ratio of the sum of squared magnitudesof the vector velocity difference to the sum of squaredmagnitudes of the observed velocity (Han et al., 2008).That is,
rvd =∑ ( | Vo |2 − | Vm |2 )/∑
| Vo |2, (1)
where Vm is the simulated horizontal velocity; and Vo
is the observed. If the rvd is lower, the result is better,with the rvd being 0 for a perfect agreement.
The other index is salinity different ratio (SDR,rsd), which is defined as the ratio of the sum of squared
salinity difference to the sum of squared magnitude ofthe observed salinity, that is,
rsd =∑
| Sm − So |2/∑
S2o , (2)
where Sm is the simulated salinity; and So is the ob-served salinity.
4.2 Validation against tide gauge data
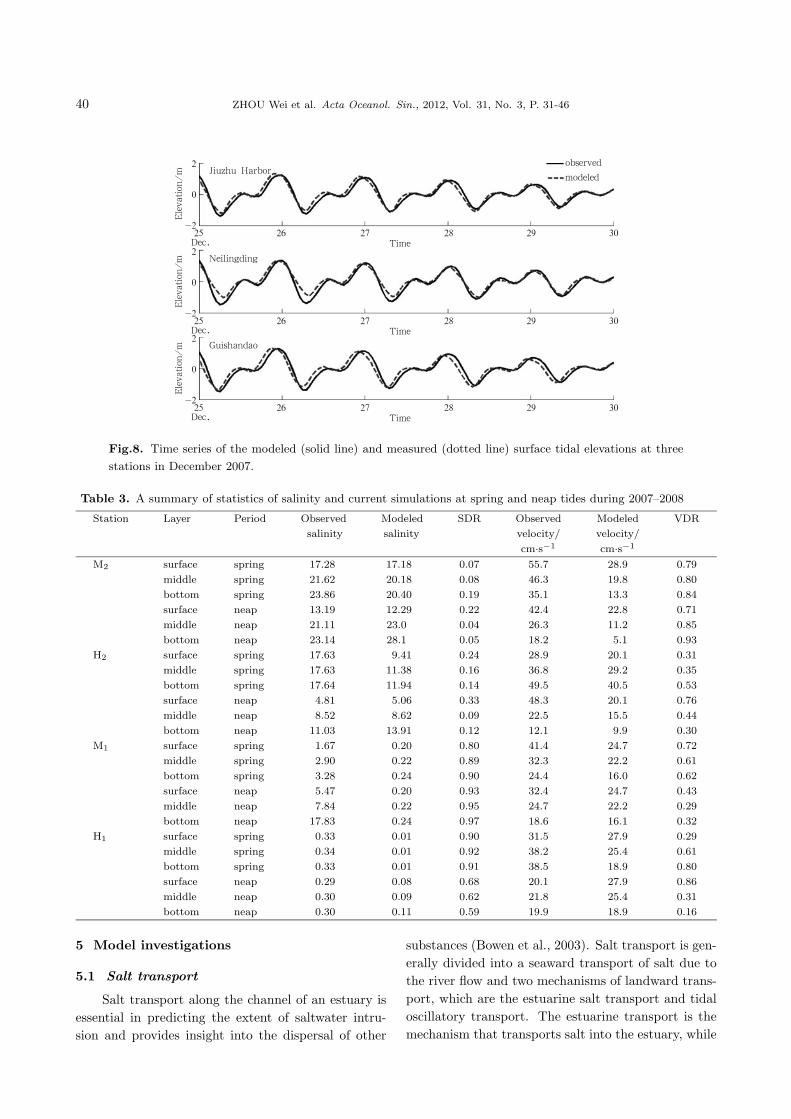
Hourly tidal elevation was gauged at Guishan Is-land and Jiuzhu Harbor stations near river mouths,and at Station Neilingding in the Lingding bay. Fig-ure 8 shows modeled and observed tides at three tidegauge stations during December 25–30, 2007. Therewas little difference between the phases of simulatedand observed, and the modeled amplitude generallyagreed well with the observed. The correlation coef-ficients were generally greater than 0.93 at the threestations.
4.3 Evaluation against salinity and moored
current
The simulated salinity and current were evalu-ated against the observed data at the four time se-ries stations using the statistical method described inSection 4.1. Statistics of model results against obser-vations are listed in Table 3. The results show thatthe model simulated salinity and current reasonablywell. In general, the model gave better simulation ofsalinity in the coastal waters than inside the estuary,and the maximum errors occurred at the stations nearthe inlets. We can see that the model simulated salin-ities well at H2 and M2 stations, but had relativelylarger errors at H1 and M1. The largest discrepancyoccurred at Station H1, which locates in the narrowchannel of Hengmen with salinity strongly influencedby the freshwater discharge. Errors in the freshwatersource estimation from Hengmen can significantly af-fect the accuracy of the localized salinity simulation.Its salinity was underestimated, which shows that thedischarge from Hengmen might be overestimated inthe model. In fact, model grid sizes are also too coarseto resolve this narrow channel.
40 ZHOU Wei et al. Acta Oceanol. Sin., 2012, Vol. 31, No. 3, P. 31-46
Fig.8. Time series of the modeled (solid line) and measured (dotted line) surface tidal elevations at three
stations in December 2007.
Table 3. A summary of statistics of salinity and current simulations at spring and neap tides during 2007–2008
Station Layer Period Observed Modeled SDR Observed Modeled VDR
salinity salinity velocity/ velocity/
cm·s−1 cm·s−1
M2 surface spring 17.28 17.18 0.07 55.7 28.9 0.79
middle spring 21.62 20.18 0.08 46.3 19.8 0.80
bottom spring 23.86 20.40 0.19 35.1 13.3 0.84
surface neap 13.19 12.29 0.22 42.4 22.8 0.71
middle neap 21.11 23.0 0.04 26.3 11.2 0.85
bottom neap 23.14 28.1 0.05 18.2 5.1 0.93
H2 surface spring 17.63 9.41 0.24 28.9 20.1 0.31
middle spring 17.63 11.38 0.16 36.8 29.2 0.35
bottom spring 17.64 11.94 0.14 49.5 40.5 0.53
surface neap 4.81 5.06 0.33 48.3 20.1 0.76
middle neap 8.52 8.62 0.09 22.5 15.5 0.44
bottom neap 11.03 13.91 0.12 12.1 9.9 0.30
M1 surface spring 1.67 0.20 0.80 41.4 24.7 0.72
middle spring 2.90 0.22 0.89 32.3 22.2 0.61
bottom spring 3.28 0.24 0.90 24.4 16.0 0.62
surface neap 5.47 0.20 0.93 32.4 24.7 0.43
middle neap 7.84 0.22 0.95 24.7 22.2 0.29
bottom neap 17.83 0.24 0.97 18.6 16.1 0.32
H1 surface spring 0.33 0.01 0.90 31.5 27.9 0.29
middle spring 0.34 0.01 0.92 38.2 25.4 0.61
bottom spring 0.33 0.01 0.91 38.5 18.9 0.80
surface neap 0.29 0.08 0.68 20.1 27.9 0.86
middle neap 0.30 0.09 0.62 21.8 25.4 0.31
bottom neap 0.30 0.11 0.59 19.9 18.9 0.16
5 Model investigations
5.1 Salt transport
Salt transport along the channel of an estuary isessential in predicting the extent of saltwater intru-sion and provides insight into the dispersal of other
substances (Bowen et al., 2003). Salt transport is gen-erally divided into a seaward transport of salt due tothe river flow and two mechanisms of landward trans-port, which are the estuarine salt transport and tidaloscillatory transport. The estuarine transport is themechanism that transports salt into the estuary, while
ZHOU Wei et al. Acta Oceanol. Sin., 2012, Vol. 31, No. 3, P. 31-46 41
the tidal oscillatory transport is the net transport dueto the asymmetry between the flood and ebb motionsthat result in net displacement of water parcels overa tidal cycle (Geyer and Chant, 2006). The estuarinesalt transport is the dominant contributor to the land-ward salt flux, especially in partially-stratified estuar-ies; tidal oscillatory transport is believed to increasewith the amplitude increase of the tidal velocity and toprovide most of the salt transport during well-mixedconditions (Bowen et al., 2003).
Following Lerczak et al. (2006), the total salt fluxis calculated as
FS = 〈∫
uSdA〉
= 〈∫
(u0 + ue + ut)(S0 + Se + St)dA〉
≈ 〈∫
(u0S0 + ueSe + utSt)dA〉= QfS0 + Fe + Ft,
where u and S are decomposed into tidally and cross-sectionally averaged (u0 and S0), tidally averaged andcross-sectionally varying (ue and Se), and tidally andcross-sectionally varying (ut and St) components; u0 isdefined as the 34 h averaged volume transport dividedby the 34 h averaged cross-sectional area; Qf includesboth river discharge and the volume transport result-
ing from correlations between tidal currents and fluc-tuations in the cross-sectional area (Stokes transport);QfS0 is the salt flux due to subtidal cross-sectionallyaveraged transport; Fe is estuarine salt flux resultingfrom gravitational circulation; and Ft is tidal oscilla-tory salt flux owing to temporal correlations betweenu and S.
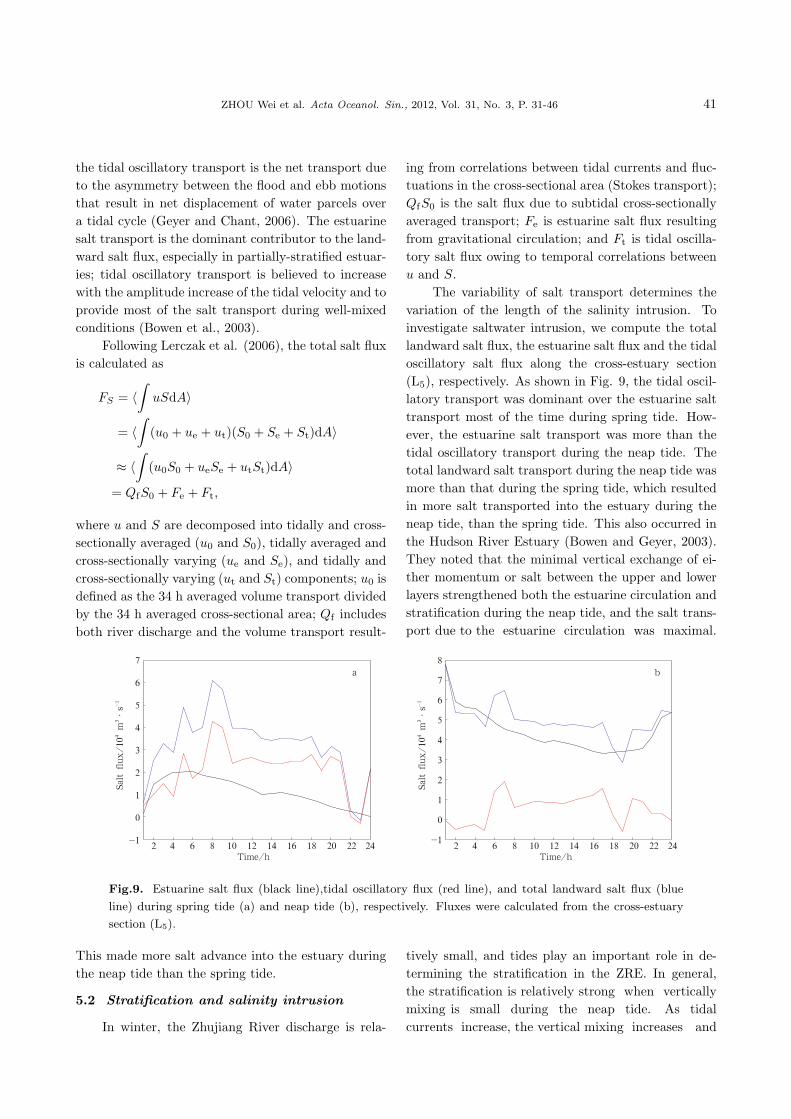
The variability of salt transport determines thevariation of the length of the salinity intrusion. Toinvestigate saltwater intrusion, we compute the totallandward salt flux, the estuarine salt flux and the tidaloscillatory salt flux along the cross-estuary section(L5), respectively. As shown in Fig. 9, the tidal oscil-latory transport was dominant over the estuarine salttransport most of the time during spring tide. How-ever, the estuarine salt transport was more than thetidal oscillatory transport during the neap tide. Thetotal landward salt transport during the neap tide wasmore than that during the spring tide, which resultedin more salt transported into the estuary during theneap tide, than the spring tide. This also occurred inthe Hudson River Estuary (Bowen and Geyer, 2003).They noted that the minimal vertical exchange of ei-ther momentum or salt between the upper and lowerlayers strengthened both the estuarine circulation andstratification during the neap tide, and the salt trans-port due to the estuarine circulation was maximal.
Fig.9. Estuarine salt flux (black line),tidal oscillatory flux (red line), and total landward salt flux (blue
line) during spring tide (a) and neap tide (b), respectively. Fluxes were calculated from the cross-estuary
section (L5).
This made more salt advance into the estuary duringthe neap tide than the spring tide.
5.2 Stratification and salinity intrusion
In winter, the Zhujiang River discharge is rela-
tively small, and tides play an important role in de-termining the stratification in the ZRE. In general,the stratification is relatively strong when verticallymixing is small during the neap tide. As tidalcurrents increase, the vertical mixing increases and
42 ZHOU Wei et al. Acta Oceanol. Sin., 2012, Vol. 31, No. 3, P. 31-46
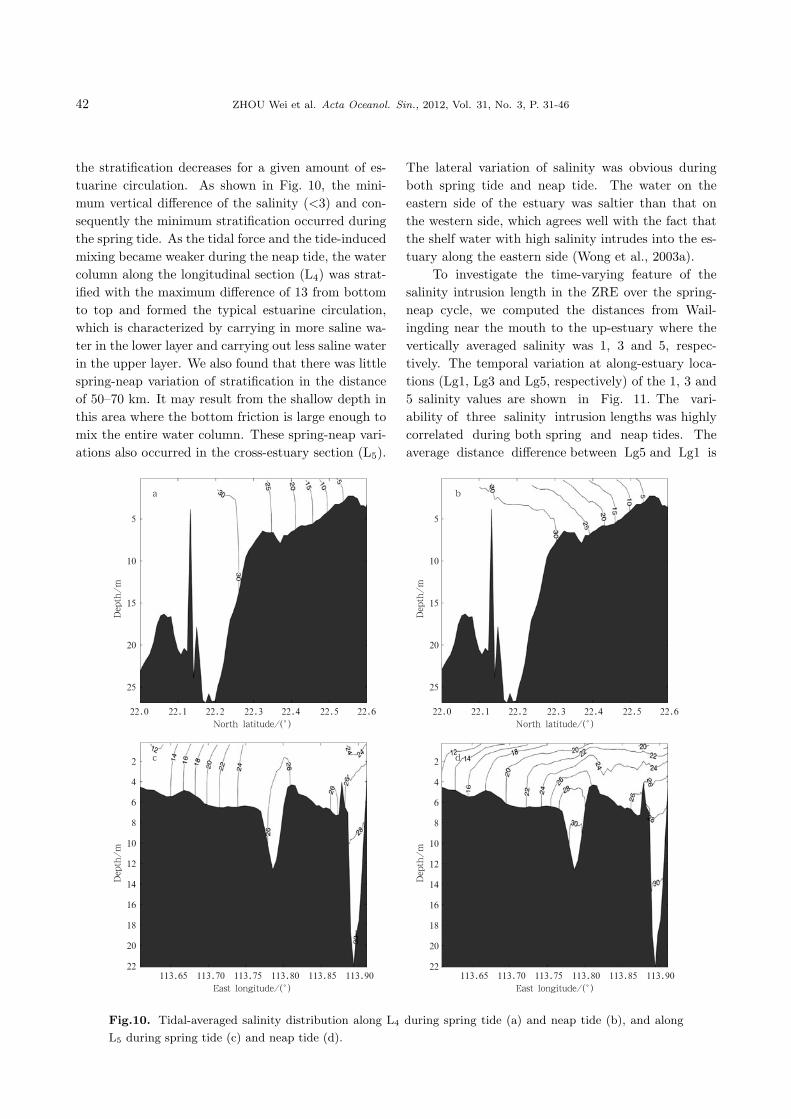
the stratification decreases for a given amount of es-tuarine circulation. As shown in Fig. 10, the mini-mum vertical difference of the salinity (<3) and con-sequently the minimum stratification occurred duringthe spring tide. As the tidal force and the tide-inducedmixing became weaker during the neap tide, the watercolumn along the longitudinal section (L4) was strat-ified with the maximum difference of 13 from bottomto top and formed the typical estuarine circulation,which is characterized by carrying in more saline wa-ter in the lower layer and carrying out less saline waterin the upper layer. We also found that there was littlespring-neap variation of stratification in the distanceof 50–70 km. It may result from the shallow depth inthis area where the bottom friction is large enough tomix the entire water column. These spring-neap vari-ations also occurred in the cross-estuary section (L5).
The lateral variation of salinity was obvious duringboth spring tide and neap tide. The water on theeastern side of the estuary was saltier than that onthe western side, which agrees well with the fact thatthe shelf water with high salinity intrudes into the es-tuary along the eastern side (Wong et al., 2003a).
To investigate the time-varying feature of thesalinity intrusion length in the ZRE over the spring-neap cycle, we computed the distances from Wail-ingding near the mouth to the up-estuary where thevertically averaged salinity was 1, 3 and 5, respec-tively. The temporal variation at along-estuary loca-tions (Lg1, Lg3 and Lg5, respectively) of the 1, 3 and5 salinity values are shown in Fig. 11. The vari-ability of three salinity intrusion lengths was highlycorrelated during both spring and neap tides. Theaverage distance difference between Lg5 and Lg1 is
Fig.10. Tidal-averaged salinity distribution along L4 during spring tide (a) and neap tide (b), and along
L5 during spring tide (c) and neap tide (d).
ZHOU Wei et al. Acta Oceanol. Sin., 2012, Vol. 31, No. 3, P. 31-46 43
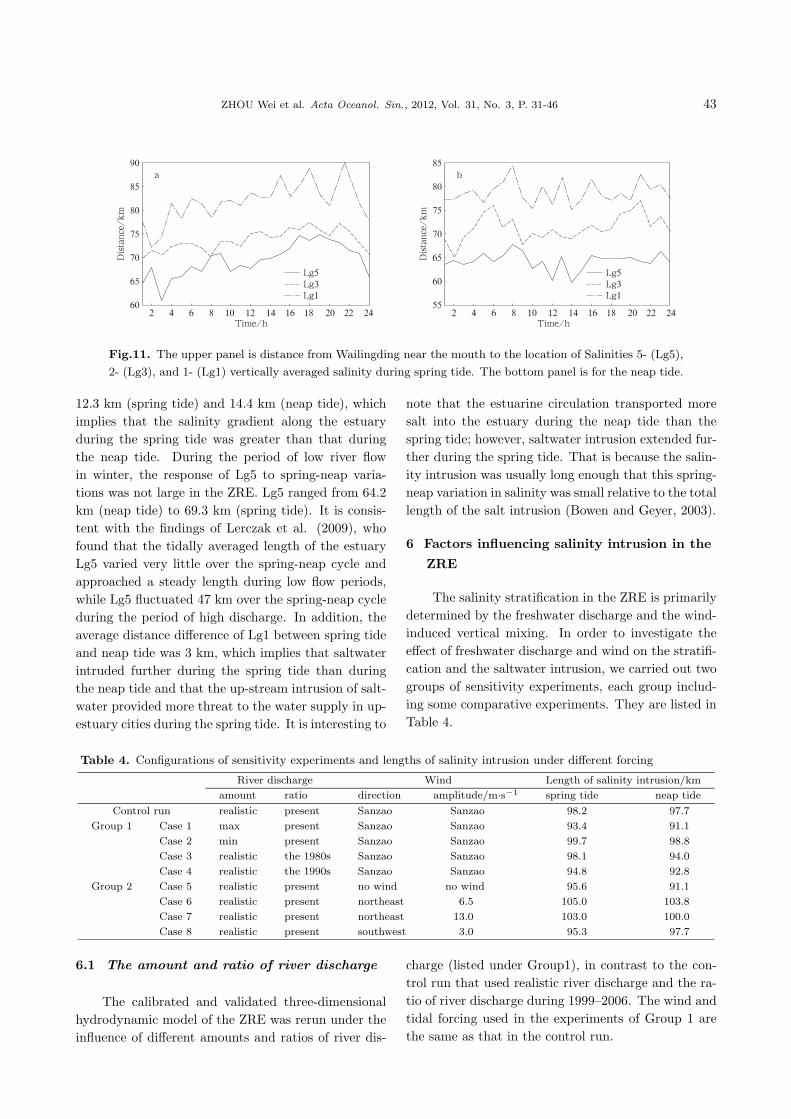
Fig.11. The upper panel is distance from Wailingding near the mouth to the location of Salinities 5- (Lg5),
2- (Lg3), and 1- (Lg1) vertically averaged salinity during spring tide. The bottom panel is for the neap tide.
12.3 km (spring tide) and 14.4 km (neap tide), whichimplies that the salinity gradient along the estuaryduring the spring tide was greater than that duringthe neap tide. During the period of low river flowin winter, the response of Lg5 to spring-neap varia-tions was not large in the ZRE. Lg5 ranged from 64.2km (neap tide) to 69.3 km (spring tide). It is consis-tent with the findings of Lerczak et al. (2009), whofound that the tidally averaged length of the estuaryLg5 varied very little over the spring-neap cycle andapproached a steady length during low flow periods,while Lg5 fluctuated 47 km over the spring-neap cycleduring the period of high discharge. In addition, theaverage distance difference of Lg1 between spring tideand neap tide was 3 km, which implies that saltwaterintruded further during the spring tide than duringthe neap tide and that the up-stream intrusion of salt-water provided more threat to the water supply in up-estuary cities during the spring tide. It is interesting to
note that the estuarine circulation transported moresalt into the estuary during the neap tide than thespring tide; however, saltwater intrusion extended fur-ther during the spring tide. That is because the salin-ity intrusion was usually long enough that this spring-neap variation in salinity was small relative to the totallength of the salt intrusion (Bowen and Geyer, 2003).
6 Factors influencing salinity intrusion in the
ZRE
The salinity stratification in the ZRE is primarilydetermined by the freshwater discharge and the wind-induced vertical mixing. In order to investigate theeffect of freshwater discharge and wind on the stratifi-cation and the saltwater intrusion, we carried out twogroups of sensitivity experiments, each group includ-ing some comparative experiments. They are listed inTable 4.
Table 4. Configurations of sensitivity experiments and lengths of salinity intrusion under different forcing
River discharge Wind Length of salinity intrusion/km
amount ratio direction amplitude/m·s−1 spring tide neap tide
Control run realistic present Sanzao Sanzao 98.2 97.7
Group 1 Case 1 max present Sanzao Sanzao 93.4 91.1
Case 2 min present Sanzao Sanzao 99.7 98.8
Case 3 realistic the 1980s Sanzao Sanzao 98.1 94.0
Case 4 realistic the 1990s Sanzao Sanzao 94.8 92.8
Group 2 Case 5 realistic present no wind no wind 95.6 91.1
Case 6 realistic present northeast 6.5 105.0 103.8
Case 7 realistic present northeast 13.0 103.0 100.0
Case 8 realistic present southwest 3.0 95.3 97.7
6.1 The amount and ratio of river discharge
The calibrated and validated three-dimensionalhydrodynamic model of the ZRE was rerun under theinfluence of different amounts and ratios of river dis-
charge (listed under Group1), in contrast to the con-trol run that used realistic river discharge and the ra-tio of river discharge during 1999–2006. The wind andtidal forcing used in the experiments of Group 1 arethe same as that in the control run.
44 ZHOU Wei et al. Acta Oceanol. Sin., 2012, Vol. 31, No. 3, P. 31-46
Cases 1 and 2 used the river discharge of minimumand maximum freshwater outflows in winter during2004–2007 and the ratios of the river discharge that aresame as in the control run. The minimum and max-imum monthly sums of the river discharge occurredin 2005 and 2006, respectively. Cases 3 and 4 usedthe ratios of the 1980s and the 1990s, which are listedin Table 2. The ratios of the river discharge and theamounts of the river discharge used in these two casesare the same as in the control run. We computed thetidally averaged distances from Wailingding near themouth to the up-estuary where the vertically averagedsalinity was 0.25 in these three cases as the lengths ofsaltwater intrusion. The lengths during the spring tide(model day of 25.3–26.5) and neap tide (model day of29.9–30.9) are listed in Table 4. As found in the controlrun, saltwater intruded further during the spring tidethan that during the neap tide under different fresh-water outflows. The salinity intrusion was sensitive tothe amount of freshwater discharge. The length of saltintrusion in Case 1 was less than that in the controlrun, because the river discharge of 2006 was greaterthan that of 2007 that was used in the control run.By comparing the results of Cases 3 and 4, we foundthat saltwater intruded further when using the ratiosof the 1980s than those of the 1990s for a given totalamount of the river discharge, due to the sum of thefour eastern inlets’ ratios was greater than that of the
1990s.
6.2 Wind amplitude and direction
In order to investigate the effect of wind on thesaltwater intrusion and the stratification in the ZRE,we made four experiments using different amplitudesand directions in Group 2 of Table 4 to represent thevariation of local wind. The river discharge and tidalforcing of these experiments are same as in the controlrun.
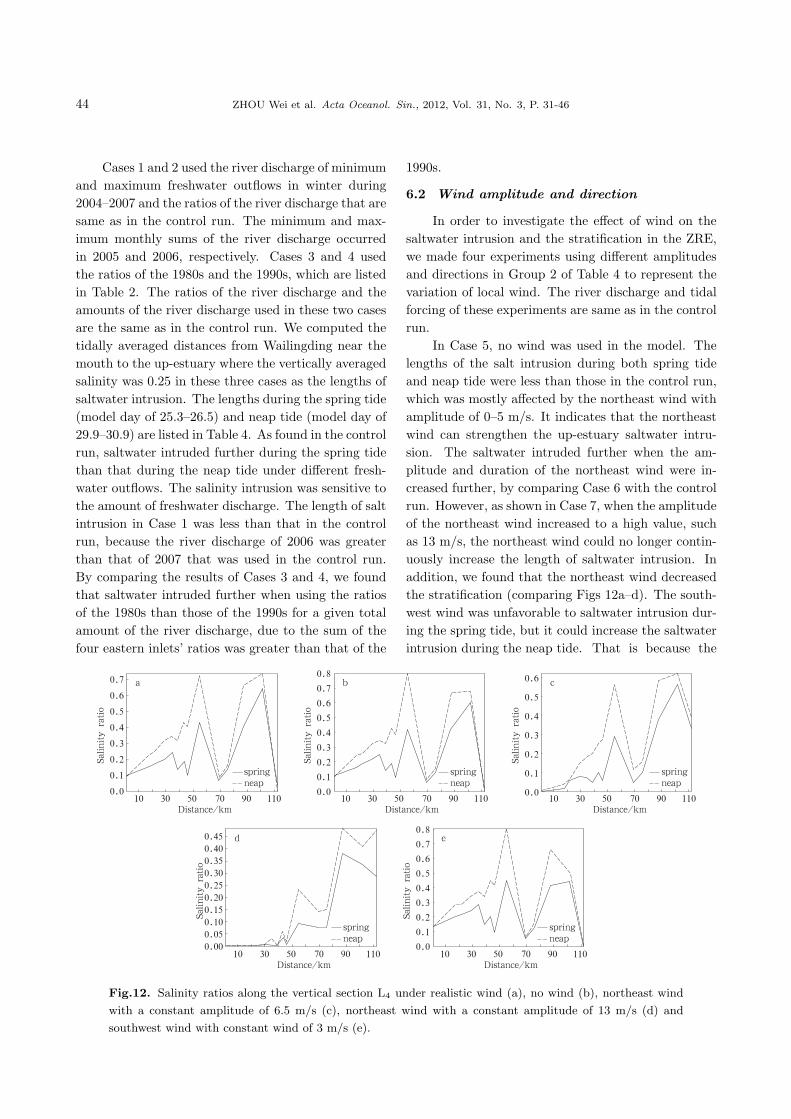
In Case 5, no wind was used in the model. Thelengths of the salt intrusion during both spring tideand neap tide were less than those in the control run,which was mostly affected by the northeast wind withamplitude of 0–5 m/s. It indicates that the northeastwind can strengthen the up-estuary saltwater intru-sion. The saltwater intruded further when the am-plitude and duration of the northeast wind were in-creased further, by comparing Case 6 with the controlrun. However, as shown in Case 7, when the amplitudeof the northeast wind increased to a high value, suchas 13 m/s, the northeast wind could no longer contin-uously increase the length of saltwater intrusion. Inaddition, we found that the northeast wind decreasedthe stratification (comparing Figs 12a–d). The south-west wind was unfavorable to saltwater intrusion dur-ing the spring tide, but it could increase the saltwaterintrusion during the neap tide. That is because the
Fig.12. Salinity ratios along the vertical section L4 under realistic wind (a), no wind (b), northeast wind
with a constant amplitude of 6.5 m/s (c), northeast wind with a constant amplitude of 13 m/s (d) and
southwest wind with constant wind of 3 m/s (e).
ZHOU Wei et al. Acta Oceanol. Sin., 2012, Vol. 31, No. 3, P. 31-46 45
amount of salt transported by the estuarine circula-tion depended on the salinity difference between thesurface and bottom waters: when the stratificationwas stronger, the transported salt was more. As inFig. 12e, the southwest wind increased the stratifi-cation during the neap tide (comparing Figs 12a andc), which may result in more up-estuary salt transportand stronger saltwater intrusion.
7 Conclusions
To study the saltwater intrusion of the ZRE dur-ing the dry season, we analyzed the observations in thewinter of 2007/2008. The maximum vertical differencesalinity can reach 10 in the Humen and ModaomenChannels during the neap tide and that difference wasvery small in the Hengmen Channel. The verticallyaveraged salinity at time series stations during thespring tide was higher than that during the neap tide.The water flow near inlet was mostly in the northwest-southeast direction due to the effect of river discharge.A hydrodynamic model for this area was developedusing the observed sea level, wind and river dischargefor the period of December–February 2007/2008. Themodel results were verified with the observations fromthe winter cruises in December 2007 and January 2008.Furthermore, the salt transport and the temporal vari-ation of salinity intrusion during the spring tide andthe neap tide were analyzed. The results suggest thatthe net salt transport due to the estuarine circula-tion during the neap tide is more than that duringthe spring tide. This difference caused salt to advancemore into the estuary during the neap tide; however,saltwater intrusion was stronger during the spring tidethan during the neap tide because these spring-neapvariations in salt transport are small relative to the to-tal length of the salt intrusion. In addition, the saltwa-ter intrusion was sensitive to the amount of river dis-charge, and more freshwater outflow resulted in weakersalinity intrusion. The prevailing northeasterly mon-soon during winter can increase the salinity intrusionin the ZRE. While the southwesterly wind was unfa-vorable to the salt intrusion during the spring tide, itcan increase the stratification and salt intrusion dur-ing the neap tide.Acknowledgements
The authors thank the two anonymous reviewersfor their helpful comments and suggestions.
References
Bowen M M, Geyer W R. 2003. Salt transport and the
time-dependent salt balance of a partially strati-
fied estuary. Journal of Geophysical Research, 108:
3158, doi:10.1029/2001JC001231
Conkright M E, Locarnini R A, Garcia H E, et al. 2002.
World Ocean Atlas 2001: Objective Analyses, Data
Statistics, and Figures[monograph on CD-ROM].
Silver Spring, MD: National Oceanographic Data
Center, 17
Dong Lixian, Su Jilan, Wong Laiah, et al. 2004. Seasonal
variation and dynamics of the Pearl River plume.
Continental Shelf Research, 24: 1761–1777
Galperin B, Kantan L H, Hassid S, et al. 1988. A quasi-
equilibrium turbulence energy model for geophysical
flows. Journal of Atmospheric Science, 45: 55–62
Geyer W R, Chant R. 2006. The physical oceanography
processes in the Hudson River estuary. The Hud-
son River Estuary. In: Levinton J S, Waldman J R,
eds. Cambridge: Cambridge University Press, 13–23
Hamrick J M. 1996. User’s manual of the environmen-
tal fluid dynamics computer code. Special Report
in Applied Marine Science and Ocean Engineering,
No. 331. Virginia: Virginia Institute of Marine
Science/School of Marine Science, the College of
William and Mary
Han B, Guo Z, Xian K, et al. 1992. Numerical mod-
eling of the tidal current in the Zhujiang Estuary.
Oceanologia et Limnologia Sinica, 23: 475–484
Han G, Lu Z, Wang Z, et al. 2008. Seasonal variability
of the Labrador Current and shelf circulation off
Newfoundland. J Geophys Res, 113: C10013, doi:
10.1029/2007JC004376
Harrison P J, Yin K, Lee J, et al. 2008. Physical-
biological coupling in the Pearl River Estuary. Con-
tinental Shelf Research, 28: 1405–1415
Ji Z, Hu G, Shen J, et al. 2007. Three-dimensional
modeling of hydrodynamic processes in the St Lucie
Estuary. Estuarine, Coastal and Shelf Science, 73:
188–200
Jia L, Wu C, Ren J, et al. 2006. Hydrologic character-
istics and estuarine dynamic process during the dry
season in Modaomen Estuary of the Pearl River.
Advance in Water Scicence, 17(1): 82–88
Kuo A Y, Shen J, Hamrick J M. 1996. The effect of
acceleration on bottom shear stress in tidal estuar-
ies. ASCE Journal of Waterways, Port, Coastal and
Ocean Engineering, 122: 75–83
Lerczak J A, Geyer W R, Chant R J. 2006. Mechanisms
driving the time-dependent salt flux in a partially
stratified estuary. Journal of Physical Oceanogra-
phy, 36: 2296–2311
46 ZHOU Wei et al. Acta Oceanol. Sin., 2012, Vol. 31, No. 3, P. 31-46
Lerczak J A, Geyer W R, Ralston D K. 2009. The tem-
poral response of the length of a partially stratified
estuary to changes in river flow and tidal amplitude.
Journal of Physical Oceanography, 39: 915–932
Li Suqiong, Ao Daguang. 2000. Rise of sea level and
change of saline water intrusion at the Pearl River
Estuary. Renmin Zhujiang (in Chinese), 6: 42–44
Lin J, Xie L, Pietrafesa L J, et al. 2007. Water quality
gradients across Albemarle-Pamlico estuarine sys-
tem: seasonal variations and model applications.
Journal of Coastal Research, 23(1): 213–229
Luo X, Ji R, Yang L. 2006. Main cause analysis of saline
water intrusion into Pear River Delta. Journal of
Natural Disasters, 6: 146–148
Mao Q, Shi P, Yin K, et al. 2004. Tides and tidal cur-
rent in the Pearl River Estuary. Continental Shelf
Research, 24: 1797–1808
Mellor G, Yamada T. 1982. Development of a turbu-
lent closure model for geophysical fluid problems.
Review of Geophysics and Space Physics, 20(4):
851–875
Shi Xiaojun, Chen Tegu, Yu Kefu. 2008. Sea-level
changes in Zhjjiang Estuary over last 40 years. Ma-
rine Geology & Quaternary Geology (in Chinese),
28: 127–134
Su Jilan. 2004. Overview of the South China Sea cir-
culation and its influence on the coastal physical
oceanography outside the Pearl River Estuary. Con-
tinental Shelf Research, 24: 1745–1760
Wong L, Chen J, Dong L. 2004. A model of the plume
front of the Pearl River Estuary, China and adjacent
coastal waters in the winter dry season. Continental
Shelf Research, 24: 1779–1795
Wong L, Chen J, Xue H, et al. 2003a. A model
study of the circulation in the Pearl River Es-
tuary (PRE) and its adjacent coastal waters: 1.
Simulations and comparison with observations.
Journal of Geophysical Research, 108(C5): 3156,
doi:10.1029/2002JC001451
Wong L, Chen J, Xue H, et al. 2003b. A model study
of the circulation in the Pearl River Estuary (PRE)
and its adjacent coastal waters: 2. Sensitivity exper-
iments. Journal of Geophysical Research, 108(C5):
3157, doi: 10.1029/2002JC001451
Xu H, Lin J, Wang D. 2008. Numerical study on salinity
stratification in the Pamlico River Estuary. Estuar-
ine, Coastal and Shelf Science, 80: 74–84
Xu Jiashi, Luo Chengping. 2005. Characteristics of saline
water activities in the Pearl River Delta in recent
years and major studied basin. Renmin Zhujiang
(in Chinese), 2: 21–23
Yang Qingshu, Luo Xianlin. 1999. The secular trends of
sea level change in LingdingYang Estuary. Scientia
Geographica Sinica (in Chinese), 19(2): 125–127
Zhao Huanting. 1990. The Evolution of the Pearl River
Estuary (in Chinese). Beijing: China Ocean Press,
357