invest - petrogress inc › ... › 2018 › 03 › saltpond-project-invest-50 … · as one...
TRANSCRIPT

THE OIL & GAS ENERGYINCORPORATION (TX)
Project: Saltpod (SOPCL) Oil Fields
Invest: $5,000,000.00
1

AIMING TO BE A VERTICALLY INTEGRATED GLOBAL ENERGY COMPANY
Petrogress Group’s management Vision is “in striving for harmony and symbiosis between our planet,mankind and society, we aim for sustainable growth towards a future of limitless possibilities”
Petrogress and Saltpond Project O IL & GAS ENERGY
I N C ORPORATIO N ( T X )
2SALTPOND PROJECT
Petrogress Oil & Gas Energy Inc., a wholly-owned subsidiary of Petrogress, Inc.,
www.petrogressinc.com, - a company listed in the OTC market- is engaged in the petroleum
product business, with emphasis in Natural Gas well, and the sea-transportation of wet
cargoes, including LNG;
Petrogress is a dynamic, results-oriented driven investment management company
committed to identifying and delivering investment opportunities in the oil and natural gas
industry. Our focus is delivering superior investment performance for our investors through
innovative, timely and tax-effective investment opportunities;
Petrogress executive management team has significant experience in shipping and oil
commodities with expertise to evaluate and profitably manage the risk and rewards inherent
in the oil and gas industry. As an independent oil company we are currently developing
projects in Texas and Ghana;;
As one initiative to expand our business, Petrogress signed a Memorandum of
Understanding to get partners with Lushann International Energy Ltd., for the establishment
of a strategic comprehensive alliance with Ghana National Petroleum Company for the
exploration of the oil fields in Saltpond (SOPCL), Ghana offshore;

The Saltpond field is located about 7 miles
offshore Saltpond Town;
The filed covers a surface are of 5sq. Km in a
water depth of 26 meters;
The field was discovered in 1979 by SIGNAL-
AMOCO Consortium with well 10-1 which had
light oil of 36.7° API;
Total of twenty-six wells:
• Six development wells;
• Three appraisal wells;
• Seventeen exploratory wells;
Gross hydrocarbon column is 162 feet, found
in the 10-A4 well;
Saltpond field – Location (Ghana) O IL & GAS ENERGY
I N C ORPORATIO N ( T X )
3SALTPOND PROJECT

Commercial production commenced October 1978,
reaching a maximum level of 4,800 barrels;
The field was shut-in 1985 when production declined
to 580 barrels per day;
The cumulative production at the time of shut-in was
3,55 million barrels of oil and 14 billion Cubic Feet of
Gas;
Estimated that the remaining reserves is about 1,5
million barrels of oil and 20 billion Cubic feet of Gas;
GNPC (Ghana National Petroleum Company)
commissioned several geological and engineering
studies. One of the studies was performed by
Braspetro in 1986 which estimated additional 1,2
million barrels of oil;
On February 2000, Lushann International Energy
Company of Houston entered into Agreement
whereby was to finance the Saltpond project in an
amount of $3,0 million. On that basis two Agreements
–Joint Venture and Operating agreement- signed
between GNPC and Lushann;
Saltpond field – Historical Development O IL & GAS ENERGY
I N C ORPORATIO N ( T X )
4SALTPOND PROJECT
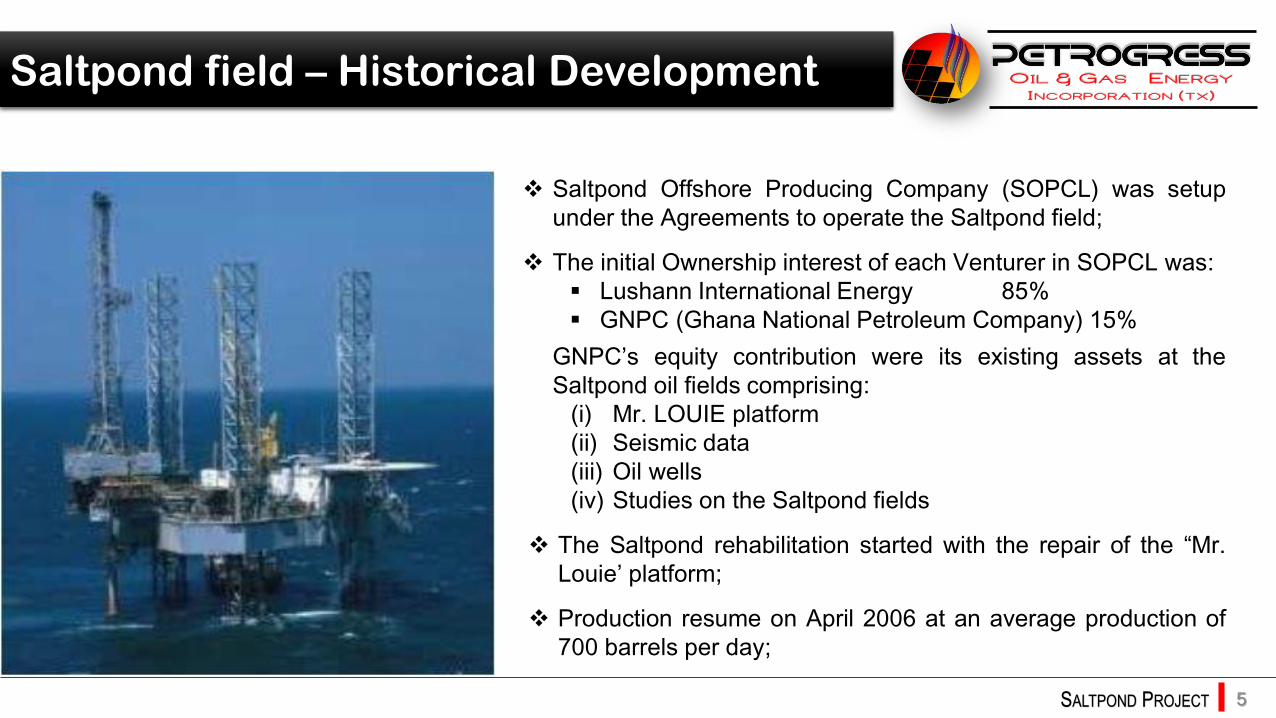
Saltpond Offshore Producing Company (SOPCL) was setup
under the Agreements to operate the Saltpond field;
The initial Ownership interest of each Venturer in SOPCL was:
Lushann International Energy 85%
GNPC (Ghana National Petroleum Company) 15%
GNPC’s equity contribution were its existing assets at the
Saltpond oil fields comprising:
(i) Mr. LOUIE platform
(ii) Seismic data
(iii) Oil wells
(iv) Studies on the Saltpond fields
The Saltpond rehabilitation started with the repair of the “Mr.
Louie’ platform;
Production resume on April 2006 at an average production of
700 barrels per day;
Saltpond field – Historical Development O IL & GAS ENERGY
I N C ORPORATIO N ( T X )
5SALTPOND PROJECT

Saltpond field – Present condition O IL & GAS ENERGY
I N C ORPORATIO N ( T X )
6SALTPOND PROJECT
Two major activities took place in 2008 to reduce the operating
cost of the project. A gas generating plant was purchased to
replace the diesel plant to run on part of the produced gas;
The current production rate is about 550 barrels with two well
production, however a refreshment-improvement of APG-1 (ex
“Mr. Louie”) is immediately required and a storage vessel must
take place in the platform to consolidate the daily production;
GNPC and Lushann decided to look for a partner to inject fresh
capital in the operations and assist in the acquisition of the 3D
seismic over the block. GNPC believes there is a great potential
in the area which needs to be explored;
On June 2016 Petrogres & Lushann sign an LOI for the
transaction where Petrogres will invest $3,5million in exchange of
fifty-five percent equity from Lushann interests in all agreements
and licenses with/from GNPC and additionally to place the
storage vessel under a daily charter to the new J/V;
Petrogres will be the major partner and player in Saltpond Fields
and will take the management of the entire operations!
Petrogres as major
partner and player in
Saltpond Fields

Saltpond field – Conclusion & Potential O IL & GAS ENERGY
I N C ORPORATIO N ( T X )
7SALTPOND PROJECT
High quality, regionally extensive 2D seismic, well control, and well defined hydrocarbons
system (Producing Field)
Large number of untested prospects
Exploration potential is very high in the central basin of offshore Ghana.
Current E & P efforts aimed at interpreting and updating existing data are ongoing.
3D seismic acquisition have become a key GNPC priority.
Current E & P efforts aimed at promoting the Blocks to technically and financially competent
Oil & gas companies in the industry
Good and negotiable fiscals regimes that encourage the development of marginal
discoveries
Over 10, 000 sq km of acreage available for licensing offshore
Saltpond field & blending – Project bullets O IL & GAS ENERGY
I N C ORPORATIO N ( T X )
8SALTPOND PROJECT
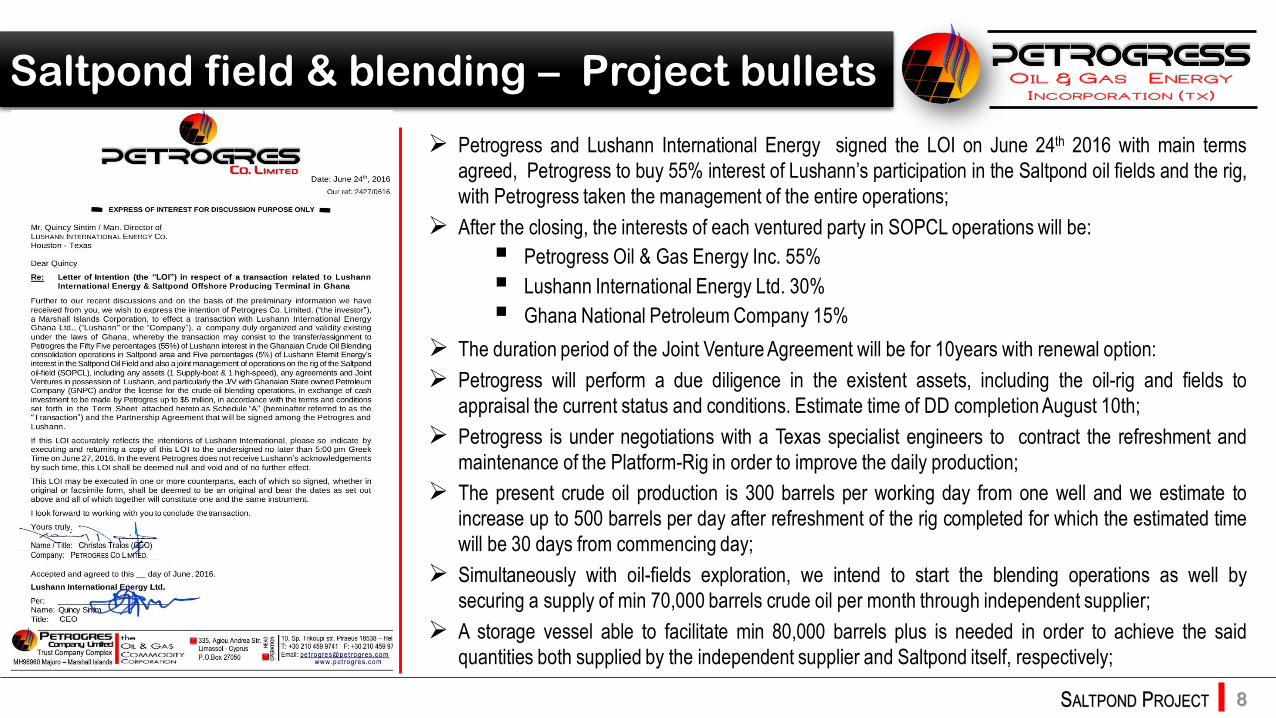
Petrogress and Lushann International Energy signed the LOI on June 24th 2016 with main terms
agreed, Petrogress to buy 55% interest of Lushann’s participation in the Saltpond oil fields and the rig,
with Petrogress taken the management of the entire operations;
After the closing, the interests of each ventured party in SOPCL operations will be:
Petrogress Oil & Gas Energy Inc. 55%
Lushann International Energy Ltd. 30%
Ghana National Petroleum Company 15%
The duration period of the Joint Venture Agreement will be for 10years with renewal option:
Petrogress will perform a due diligence in the existent assets, including the oil-rig and fields to
appraisal the current status and conditions. Estimate time of DD completion August 10th;
Petrogress is under negotiations with a Texas specialist engineers to contract the refreshment and
maintenance of the Platform-Rig in order to improve the daily production;
The present crude oil production is 300 barrels per working day from one well and we estimate to
increase up to 500 barrels per day after refreshment of the rig completed for which the estimated time
will be 30 days from commencing day;
Simultaneously with oil-fields exploration, we intend to start the blending operations as well by
securing a supply of min 70,000 barrels crude oil per month through independent supplier;
A storage vessel able to facilitate min 80,000 barrels plus is needed in order to achieve the said
quantities both supplied by the independent supplier and Saltpond itself, respectively;

Saltpond project: oil fields, blending & storage Phases (A+B+C) with respectively invests
O IL & GAS ENERGY
I N C ORPORATIO N ( T X )
9SALTPOND PROJECT
The entire Saltpond project consist in three phases with the respective invests as follows:
Phase A; August to September 2016 Project Oil Field production
Invest: $1,500,000
Timeline: within 30days of signing the final
agreement
Use of proceeds:
$250,000; old debts –staff – suppliers &
various
$500,000; repairs/maintenance of platform;
$250,000; repairs of support vessel & high-
speed boat
$500,000; working capital for about 60
days
Estimated Production: Startup 300bbls per day
with an increase to 500bbls after 6 months
operations;
Estimated Time: the expecting time for the first
production estimated within 60days from the
day of commencing the re[airs in the oil-rig;
Phase C; September 2016 Project: Consolidation & Blending
Invest: $2,000,000
Timeline: within 20days upon sign
Sale & Purchase Agreement with
Supplies
Use of proceeds: invest amount will
be used for the payment of the
independent supplier of crude oil
and consists to the supply of about
70,000 barrels monthly;
Purchase price: minus $25/bbl of
the Brent plats;
Payment to Supplier: within max
7days from the delivered day and
taken possession of product;
Operational & Shipping cost: $14
per barrel, all included;
Sale price: minus $6/bbl
Phase B; August 2016 Project: Storage Vessel
Invest: $1,500,000
Timeline: August 2016
Use of proceeds:
Acquire 50% interest of
10,000 tons capacity vessel;
The ownership of vessel will be
transferred and registered by
newly ship- owning company;
The management of the vessel
shall be taken by Petronav Co.,
a wholly owned subsidiary of
Petrogress;
The vessel shall be used as a
storage facility for the cargo
consolidation;
Hire: $4/ bbl or $320,000/month

Saltpond field – Projection (Phase A) O IL & GAS ENERGY
I N C ORPORATIO N ( T X )
10SALTPOND PROJECT
Revenue Projections 2016 2017 2018 2019 Total
(Jul. 2016 – Jun. ’19)
Number of Units ( Barrels) 60,000 bbls 120,000 bbls 120,000 bbls 60,000 bbls 360,000 bbls
Price per unit $ 42,00/ bbl $ 42,00/ bbl $ 42,00/ bbl $ 42,00/ bbl
Net Revenue $ 2,520,000 $ 5,040,000 $ 5,040,000 $ 2,520,000 $ 15,120,000
Revenues per Quarterlies
1st Quarterly $ 1,260,000 $ 1,260,000 $ 1,260,000 $ 3,780,000
2nd Quarterly $ 1,260,000 $ 1,260,000 $ 1,260,000 $ 3,780,000
3rd Quarterly $ 1,260,000 $ 1,260,000 $ 1,260,000 $ 3,780,000
4th Quarterly $ 1,260,000 $ 1,260,000 $ 1,260,000 $ 3,780,000
Yearly Total $ 2,520,000 $ 5,040,000 $ 5,040,000 $ 2,520,000 $ 15,120,000
Sales Revenues

Saltpond field – Projection (Phase A) O IL & GAS ENERGY
I N C ORPORATIO N ( T X )
11SALTPOND PROJECT
Cost of Revenues Cost of Revenues 2016 2017 2018 2019 Total
Revenues $ 2,520,000 $ 5,040,000 $ 5,040,000 $ 2,520,000 $ 15,120,000
Production
Units Production 60,000/bbls 120,000/bbls 120,000/bbls 60,000/bbls 360,000/bbls
Cost of Production per unit $ 23,00/bbl $ 23,00/bbl $ 23,00/bbl $ 23,00/bbl
Direct Cost
Cost of explorating $ 630,000 $ 1,260,000 $ 1,260,000 $ 630,000 $ 3,780,000
Royalty $ 120,000 $ 240,000 $ 240,000 $ 120,000 $ 720,000
Total Direct Costs $ 750,000 $ 1,500,000 $ 1,500,000 $ 750,0000 $ 4,500,000
Other Related Expenses
Platform hire $ 240,000 $ 480,000 $ 480,000 $ 240,000 $ 1,440,000
Bunkers Cost $ 42,000 $ 84,000 $ 84,000 $ 42,000 $ 252,000
Operation Cost $ 240,000 $ 480,000 $ 480,000 $ 240,000 $ 1,440,000
Survey Cost $ 6,000 $ 12,000 $ 12,000 $ 6,000 $ 36,000
Anchorage dues $ 6,000 $ 12,000 $ 12,000 $ 6,000 $ 36,000
Insurance Cost $ 6,000 $ 12,000 $ 12,000 $ 6,000 $ 36,000
Storage cost $ 90,000 $ 180,000 $ 180,000 $ 90,000 $ 540,000
$ 630,000 $ 1,260,000 $ 1,260,000 $ 630,000 $ 3,780,000
Total Cost of Revenues $ 1,380,000 $ 2,760,000 $ 2,760,000 $ 1,380,000 $ 8,280,000
% of Revenue 54,76% 54,76% 54,76% 54,76% 54,76%

Saltpond field – Projection (Phase A) O IL & GAS ENERGY
I N C ORPORATIO N ( T X )
12SALTPOND PROJECT
Income statementIncome Statement 2016 2017 2018 2019 Total
NET REVENUES $ 2,520,000 $ 5,040,000 $ 5,040,000 $ 2,520,000 $ 15,120,000
COST OF REVENUES $ 1,380,000 $ 2,760,000 $ 2,760,000 $ 1,380,000 $ 8,820,000
% of Revenues 54,76% 54,76% 54,76% 54,76% 54,76%
GROSS PROFIT $ 1,140,000 $ 2,280,000 $ 2,280,000 $ 1,140,000 $ 6,840,000
% of Revenues 45,24% 45,24% 45,24% 45,24% 45,24%
MANAGEMENT FEE $ 240,000 $ 480,000 $ 480,000 $ 240,000 $ 1,440,000
% of Revenues 9,52% 9,52% 9,52% 9,52% 9,52%
PROFIT BEFORE TAXES $ 900,000 $ 1,800,000 $ 1,800,000 $ 900,000 $ 5,400,000
TAXES $ 40,500 $ 81,000 $ 81,000 $ 40,500 $ 243,000
NET EARNINGS $ 859,500 $ 1,719,000 $ 1,719,000 $ 859,500 $ 5,157,000
% of Revenues 34,11% 34,11% 34,11% 34,11% 34,11%

Saltpond Storage – Projection (Phase B) O IL & GAS ENERGY
I N C ORPORATIO N ( T X )
13SALTPOND PROJECT
Sales Projection 2016 2017 2018 2019 Total(July 2016 – June 2019)
Freight & Hires Sales $ 1,920,000 $ 3,840,000 $ 3,840,000 $ 1,920,000 $ 11,520,000
Net Revenue $ 1,920,000 $ 3,840,000 $ 3,840,000 $ 1,920,000 $ 11,520,000
Revenues per Quarterlies
1st Quarterly $ 960,000 $ 960,000 $ 960,000 $ 2,880,000
2nd Quarterly $ 960,000 $ 960,000 $ 960,000 $ 2,880,000
3rd Quarterly $ 960,000 $ 960,000 $ 960,000 $ 2,880,000
4th Quarterly $ 960,000 $ 960,000 $ 960,000 $ 2,880,000
Yearlly’s Total $ 1,920,000 $ 3,840,000 $ 3,840,000 $ 1,920,000 $ 11,520,000
Sales Revenues
Saltpond Storage – Projection (Phase B) O IL & GAS ENERGY
I N C ORPORATIO N ( T X )
14SALTPOND PROJECT
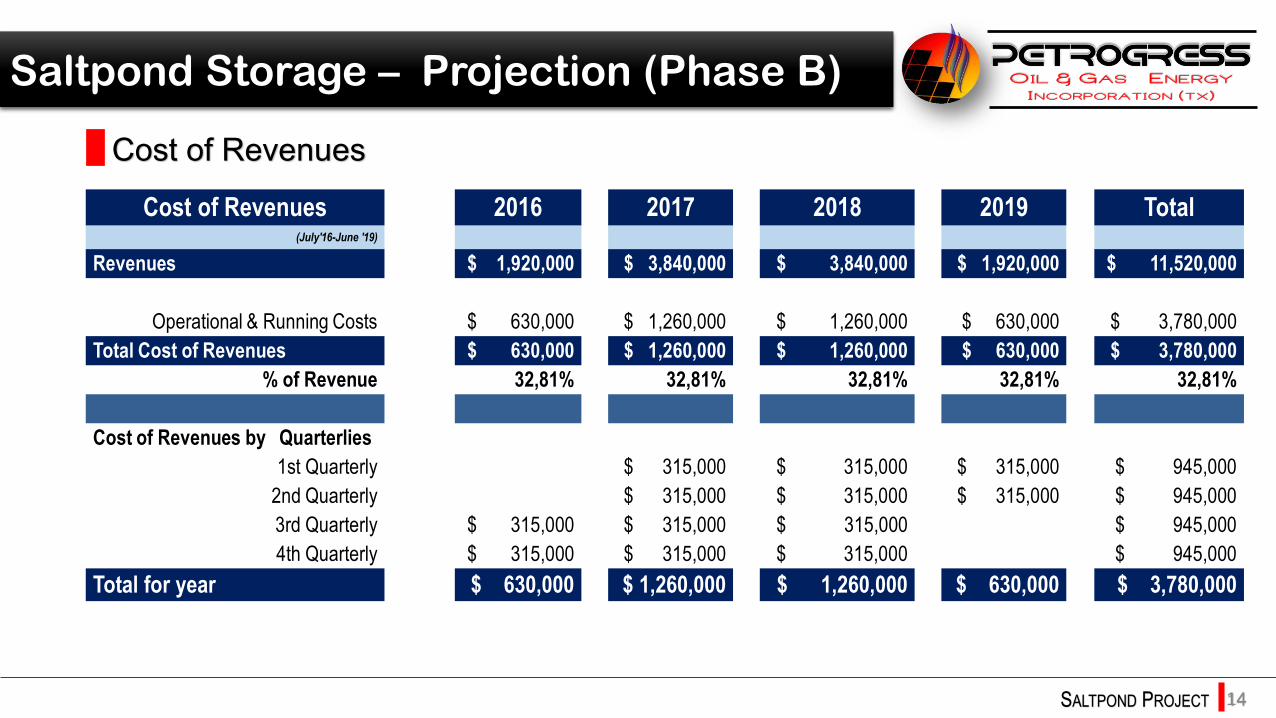
Cost of Revenues 2016 2017 2018 2019 Total(July'16-June '19)
Revenues $ 1,920,000 $ 3,840,000 $ 3,840,000 $ 1,920,000 $ 11,520,000
Operational & Running Costs $ 630,000 $ 1,260,000 $ 1,260,000 $ 630,000 $ 3,780,000
Total Cost of Revenues $ 630,000 $ 1,260,000 $ 1,260,000 $ 630,000 $ 3,780,000
% of Revenue 32,81% 32,81% 32,81% 32,81% 32,81%
Cost of Revenues by Quarterlies
1st Quarterly $ 315,000 $ 315,000 $ 315,000 $ 945,000
2nd Quarterly $ 315,000 $ 315,000 $ 315,000 $ 945,000
3rd Quarterly $ 315,000 $ 315,000 $ 315,000 $ 945,000
4th Quarterly $ 315,000 $ 315,000 $ 315,000 $ 945,000
Total for year $ 630,000 $ 1,260,000 $ 1,260,000 $ 630,000 $ 3,780,000
Cost of Revenues

Saltpond Storage – Projection (Phase B) O IL & GAS ENERGY
I N C ORPORATIO N ( T X )
15SALTPOND PROJECT
Income Statement 2016 2017 2018 2019 Total(July'16-June '19)
NET REVENUES $ 1,920,000 $ 3,840,000 $ 3,840,000 $ 1,920,000 $ 11,520,000
COST OF REVENUE $ 630,000 $ 1,260,000 $ 1,260,000 $ 630,000 $ 3,780,000
% of Revenues 32,81% 32,81% 32,81% 32,81% 32,81%
GROSS PROFIT $ 1,290,000 $ 2,580,000 $ 2,580,000 $ 1,290,000 $ 7,740,000
% of Revenues 67,19% 67,19% 67,19% 67,19% 67,19%
MANAGEMENT FEE (10%) $ 180,000 $ 360,000 $ 360,000 $ 180,000 $ 1,080,000
% of Revenues 9,38% 9,38% 9,38% 9,38% 9,38%
EBITDA $ 1,110,000 $ 2,220,000 $ 2,220,000 $ 1,110,000 $ 6,660,000
% of Revenues 57,81% 57,81% 57,81% 57,81% 57,81%
DEPRECIATION $ 60,000 $ 120,000 $ 120,000 $ 60,000 $ 360,000
PROFIT BEFORE TAXES $ 1,050,000 $ 2,100,000 $ 2,100,000 $ 1,050,000 $ 6,300,000
TAXES $ 52,500 $ 105,000 $ 105,000 $ 52,500 $ 315,000
NET EARNINGS $ 997,500 $ 1,995,000 $ 1,995,000 $ 997,500 $ 5,985,000
% of Revenues 51,95% 51,95% 51,95% 51,95% 51,95%
Income statement

Saltpond blending – Projection (Phase C) O IL & GAS ENERGY
I N C ORPORATIO N ( T X )
16SALTPOND PROJECT
Sales Revenues 2016 2017 2018 2019 Total(July 2016 – June 2019)
Number of Units (Barrels) 420,000 bbls 840,000 bbls 840,000 bbls 420,000 bbls 2,520,000 bbls
Price per unit $ 42/ bbl $ 42/ bbl $ 42/ bbl $ 42/ bbl $ 42/ bbl
Net Revenues $ 17,640,000 $ 35,280,000 $ 35,280,000 $ 17,640,000 $ 105,840,000
Revenues per Quarterlies
1st Quarterly $ 8,820,000 $ 8,820,000 $ 8,820,000 $ 26,460,000
2nd Quarterly $ 8,820,000 $ 8,820,000 $ 8,820,000 $ 26,460,000
3rd Quarterly $ 8,820,000 $ 8,820,000 $ 8,820,000 $ 26,460,000
4th Quarterly $ 8,820,000 $ 8,820,000 $ 8,820,000 $ 26,460,000
Yearly Total $ 17,640,000 $ 35,280,000 $ 35,280,000 $ 17,640,000 $ 105,840,000
Sales Revenues

Saltpond blending – Projection (Phase C) O IL & GAS ENERGY
I N C ORPORATIO N ( T X )
17SALTPOND PROJECT
Cost of Revenues 2016 2017 2018 2019 Total(July 2016 – June 2019)
Revenues $ 17,640,000 $ 35,280,000 $ 35,280,000 $ 17,640,000 $ 105,840,000
Cost of Revenue
Cost per Unit $ 20,00 $ 20,00 $ 20,00 $ 20,00 $ 20,00
Total Direct Costs per Unit $ 20,00 $ 20,00 $ 20,00 $ 20,00 $ 20,00
Unit Sales 420,000 840,000 840,000 420,000 2,520,000
Total Direct Costs $ 8,400,000 $ 16,800,000 $ 16,800,000 $ 8,400,000 $ 50,400,000
Otherr Expenses
Shipping cost $ 1,470,000 $ 2,940,000 $ 2,940,000 $ 1,470,000 $ 8,820,000
Bunkers Cost $ 1,050,000 $ 2,100,000 $ 2,100,000 $ 1,050,000 $ 6,300,000
Operation Cost $ 3,360,000 $ 6,720,000 $ 6,720,000 $ 3,360,000 $ 20,160,000
Survey Cost $ 105,000 $ 210,000 $ 210,000 $ 105,000 $ 630,000
Agency/Berth Cost $ 126,000 $ 252,000 $ 252,000 $ 126,000 $ 756,000
Insurance Cost $ 63,000 $ 126,000 $ 126,000 $ 63,000 $ 378,000
Storage cost $ 420,000 $ 840,000 $ 840,000 $ 420,000 $ 2,520,000
$ 6,594,000 $ 13,188,000 $ 13,188,000 $ 6,594,000 $ 39,564,000
Total Cost of Revenues $ 14,994,000 $ 29,988,000 $ 29,988,000 $ 14,994,000 $ 89,964,000
% of Revenue 85,00% 85,00% 85,00% 85,00% 85,00%
Cost of Revenues by Quarterlies
1st Quarter $ 7,497,000 $ 7,497,000 $ 7,497,000 $ 22,491,000
2nd Quarter $ 7,497,000 $ 7,497,000 $ 7,497,000 $ 22,491,000
3rd Quarter $ 7,497,000 $ 7,497,000 $ 7,497,000 $ 22,491,000
4th Quarter $ 7,497,000 $ 7,497,000 $ 7,497,000 $ 22,491,000
Total for year $ 14,994,000 $ 29,988,000 $ 29,988,000 $ 14,994,000 $ 89,964,000
Cost of Revenues

Saltpond blending – Projection (Phase C) O IL & GAS ENERGY
I N C ORPORATIO N ( T X )
18SALTPOND PROJECT
Income Statement 2016 2017 2018 2019 Total(July 2016 – June 2019)
NET REVENUES $ 17,640,000 $ 35,280,000 $ 35,280,000 $ 17,640,000 $ 105,840,000
COST OF REVENUE $ 14,994,000 $ 29,988,000 $ 29,988,000 $ 14,994,000 $ 89,964,000
% of Revenues 85,00% 85,00% 85,00% 85,00% 85,00%
GROSS PROFIT $ 2,646,000 $ 5,292,000 $ 5,292,000 $ 2,646,000 $ 15,876,000
% of Revenues 15,00% 15,00% 15,00% 15,00% 15,00%
MANAGEMENT FEE (10%) $ 264,600 $ 529,200 $ 529,200 $ 264,600 $ 1,587,600
% of Revenues 1,50% 1,50% 1,50% 1,50% 1,50%
PROFIT BEFORE TAXES $ 2,381,400 $ 4,762,800 $ 4,762,800 $ 2,381,400 $ 14,288,400
TAXES $ 119,070 $ 238,140 $ 238,140 $ 119,070 $ 714,420
NET EARNINGS $ 2,262,330 $ 4,524,660 $ 4,524,660 $ 2,262,330 $ 13,573,980
% of Revenues 12,83% 12,83% 12,83% 12,83% 12,83%
Income statement

Saltpond – Projection (Consolidated) O IL & GAS ENERGY
I N C ORPORATIO N ( T X )
19SALTPOND PROJECT
Cash FlowJuly'16-June '19
Cash and cash equivalents, beginning of the periond 7/1/2016 $ 1,500,000
Cash provided by operations July'16-June '19
Revenue $ 15,120,000
Cost of Revenue (-) $ 8,280,000
MANAGEMENT FEE (-) $ 1,440,000
TAXES (-) $ 243,000 $ 5,157,000
Cash and cash equivalents, end of the periond 6/30/2019 (a) $ 6,657,000
Cash and cash equivalents, beginning of the periond 7/1/2016 $ 2,000,000
Cash provided by operations July'16-June '19
Revenue $ 105,840,000
Cost of Revenue (-) $ 89,964,000
MANAGEMENT FEE (-) $ 1,587,600
TAXES (-) $ 714,420 $ 13,573,980
Cash and cash equivalents, end of the periond 6/30/2019 (b) $ 15,573,980
Cash and cash equivalents, beginning of the periond 7/1/2016 $ 1,500,000
Cash provided by operations July'16-June '19
Revenue $ 11,520,000
Cost of Revenue (-) $ 3,780,000
MANAGEMENT FEE (-) $ 1,080,000
TAXES (-) $ 315,000 $ 6,345,000
Cash and cash equivalents, end of the periond 6/30/2019 (c) $ 7,845,000
Total Cash and cash equivalents, end of the periond 6/30/2019 (a)+(b)+(c ) $ 30,075,980
Cash flow (Consolidated)

20O IL & GAS
ENERGY INC .
13601, Preston Rd. Suite E220
Dallas, TX 75240
HE
AD
OP
ER
AT
ION
S 10, Sp. Trikoupi str. Piraeus 18538 – Hellas
T: +30 210 459 9741 F: +30 210 459 9744
Email: [email protected]