introduction - edmstenviron.andrew.cmu.edu/m3/s2/atmos.pdf · introduction this section ... the sun...
TRANSCRIPT

Introduction
This section examines the atmosphere as a system, and several atmospheric phenomena that have become critical in theunderstanding and guardianship of our environment. The current state of the atmosphere is the result of a multitude offacts. The energy from the sun produces the movements or currents in the atmosphere. This energy, the Earth'smovement relative to the sun, and the components of the atmosphere and of the Earth's surface maintain the long-termclimate, the short-term weather, and the temperature conditions. These provide conditions fit for the forms of life foundon Earth. The condition of the physical world affects and is affected by the life present. The entire system is thereforecalled the biogeochemical system. In the last century especially, this system--which evolved over billions of years--hasbeen subject to rapid changes due to industrial activities increasing at unprecedented rates.
©stacey irvin www.staceyirvin.com
This unit discusses some of the basic science and details of the interactions involving the atmosphere. We begin byexamining the nature of the sun’s energy, and the actions and reactions it produces in the atmosphere. We then discusshow industrial activity has perturbed atmospheric conditions, and what policy actions are being taken to reduce ourimpact. Due to the complexity of the system, there are still large amounts of scientific uncertainty in predicting changesprecisely, but we do know enough to describe and project qualitative features of the system that lead to anunderstanding of the impacts of large scale human activity.
The Earth-Sun Relationship
A look at the Earth-Sun system provides important insight into current environmental phenomena. Since the beginning ofthe Earth's evolution four and a half billion years ago, the atmosphere and landscape have changed significantly. Today,global atmospheric problems such as global warming and ozone depletion arise from changes in the delicate balance ofthe Earth's atmosphere that alter the amount of the sun's radiation reaching humans and other living creatures. TheEarth's immediate physical environment is patterned by three primary influences:
1. The nearness of the sun.
2. The Earth's atmosphere, a mixture of gases held in a layer surrounding the Earth by the Earth's gravitationalforce. This layer has reached the current and somewhat steady composition of approximately 80% nitrogen and20% oxygen over the last four and a half billion years.
3. The composition of the solid mass of the Earth, which gives rise to the materials in and on the Earth (includingwater, an essential to our type of life). Also resulting from the composition and manner of the origin of the Earthis the temperature of the Earth's core.
This section will focus predominantly on the first two influences: the Earth's atmosphere, and the Earth's relationship tothe sun.
From a physical point of view alone, the Earth-Sun system can be represented simply as in Figure 1. The two main forcesand effects of the sun on the Earth are the gravitational force (maintaining the Earth in an orbit around the sun), and theelectromagnetic radiation from the sun (keeping the Earth's atmosphere at a particular temperature).

2
Figure 1: Earth-Sun system with primary influences.
Different components of the sun's (solar) spectrum interact with the atmosphere. Over billions of years, this interactionhas produced both the ozone layer and current climatic conditions with feedback from life that evolved. Thesephenomena form the major topics of this unit. We begin with a description of solar radiation.
The Sun & its Energy
The sun's energy is the primary source of energy for all surface phenomena and life on Earth. Combined with thematerial of the Earth (including the molecules held close by the Earth's gravitational force called the atmosphere), thisenergy provides for the immense diversity of life forms that are found on the Earth. We will now look in detail at solarenergy and its interplay with the constituents of the Earth's atmosphere.
Characteristics of the Sun
The sun is a medium, yellow star, consisting primarily of hydrogen at temperatures high enough to cause nuclear fusion.Nuclear fusion is a nuclear reaction in which hydrogen nuclei fuse together to form helium nuclei and release energy. Inthis state, some 120 million tons of matter - mostly hydrogen - are converted into helium on the sun every minute, withsome of the mass being converted into energy. The size of the sun determines its temperature and the amount of energyradiated.
Electromagnetic energy from the sun comes to Earth in the form of radiation. The term "radiation" simply denotes thefact that the energy travels as rays, that is, in straight lines. In general, the terms "solar energy" and "solar radiation"simply refer to energy from the sun. Electromagnetic energy is produced when electric charges change their potentialenergy. It is characterized by the property that it is pure energy, not requiring any matter (or medium) for its existenceor movement. Electromagnetic energy can therefore travel through space (which is a vacuum), traveling at a speed thatis the same for all forms of electromagnetic energy and is equal to the speed of light, 3 x 10⁸ m/sec (or 186,000 milesper second).
The sun radiates energy equally in all directions, and the Earth intercepts and receives part of this energy. The power fluxreaching the top of the Earth's atmosphere is about 1400 Watts/m2. This measure simply means that on the average,

3
one square meter on the side of the Earth facing the sun receives energy from the sun equal to that from fourteen 100Watt light bulbs every second!
The sun is in a relatively stable state, and as far as we can tell, will continue to be so for about another three billionyears. The sun and other stars do show periods of slightly higher than normal activity, detectable in our sun by anincrease in sunspot activity. During sunspot activity, more energy reaches the Earth. The sun spends about a quarter ofits time in a state with very few sunspots. It is suspected that the Sun dimmed about ten times in the last 100,000 yearscausing "Little Ice Ages" (extended periods of unusually cold temperatures) of about a couple of centuries each. The lastsuch quiescent state occurred in the late seventeenth century. The sun has also shone with considerable above-averagebrightness at least twice in our geological era: about 5,000 years ago, around the time of the beginning of the ancientcivilizations of China, Minoa, Sumeria, and the Indus Valley; and about 1,000 years ago, when the temperatures ofNorthern England rose high enough to allow vineyards to flourish there.
Electromagnetic Spectrum - Basic Science
The entire region of electromagnetic energy distinguished by wavelength and frequency is called the electromagneticspectrum. The propagation of the energy along the rays is in the form of a wave with the amount of energy alternatingbetween high and low values, as in a water wave. Thus we say that light, heat, etc., travel in the form of waves.Wavelength can be defined as the distance between two successive peaks (or troughs) in waves of energy, whilefrequency is measured by counting the number of peaks that pass a given point every second.
In the diagrams of the spectra in this section, we use two different scales in measuring wavelengths. The first is micronsor micrometers (µm), which is equal to 10-6 meters. The other is nanometers (nm), equal to 10-9 meters. In discussingsmall ranges of the spectrum, we use units of nm, and in discussing the overall spectrum or larger regions, we revert toµm.
Frequency is measured in units of cycles per second, or hertz (Hz). One cycle per second is equal to one hertz.
In order of decreasing frequency (and increasing wavelength), the various regions of the electromagnetic spectrum are:gamma rays, x-rays, ultraviolet, visible light, infrared, microwaves, and radio waves. Electromagnetic energy from thesun consists mostly of a small amount of ultraviolet, all visible light, and some infrared.
The full electromagnetic spectrum is depicted in Figure 2. Table 1 gives the same information, as well as sometechnological applications.
Figure 2: The electromagnetic spectrum.(from Lawrence Berkeley National Laboratory)
4
Name ofRegion
Wavelength Range(in m, µm, and nm)
Frequency RangeTechnologicalApplications /Role in Nature
Gamma Rays10-14 to 10-10 m10-8 to 10-4 µm10-5 to 10-1 nm
3x10²² to 3x10¹⁸ HzRadiation therapy
X - Rays10-14 to 10-8 m10-8 to 10-2 µm10-5 to 10 nm
3x10²² to 3x10¹⁶ HzRadiation therapy;diagnosis (lowerfrequencies)
Ultraviolet Rays
0-8 to 4x10⁻⁷ m10-2 to 0.4 µm10-5 to 400 nm
3x10¹⁶ to 0.75x10¹⁶ Hz
Tanning;Promotes production ofVitamin D in human skin;Photosynthesis in plants
Visible Light4x10-7 to 8x10⁻⁷ m
0.4 to 0.8 µm400 to 800 nm
0.75x10¹⁶ to 0.375x10¹⁶ HzLamps for seeing(Eyes respond to thisrange)
Infrared8x10-7 to 10-3 m
0.8 to 103µm800 to 106 nm
0.375x10¹⁶ to 3x10¹¹ HzInfrared photography
Radio Waves 10-4 to 106 m 3x10¹² to 300 Hz Communication devices
Table 1: Regions of the entire electromagnetic spectrum and general applications.Note that the regions are not strictly delineated.
We have specialized sensory organs that only detect some parts of the spectrum. For example, the eye detects visiblelight, and even distinguishes different wavelengths within the spectrum of visible light as color! The skin perceivesradiation from the infrared region of the spectrum as heat. Note that sound is not a form of electromagnetic energy.Because sound is really the energy of the motion of molecules through a medium (mechanical energy), it cannot travelthrough a vacuum. As we already noted, electromagnetic energy has no need for a medium through which to travel, andcan therefore travel through space from the sun to reach the Earth.
Different molecules absorb different regions of electromagnetic energy preferentially. For example, the water moleculepreferentially absorbs certain wavelengths in the microwave region of the electromagnetic spectrum. This preference isthe basis of the efficient cooking of food by microwave ovens. Calcium, a primary constituent of bones, absorbs energy inthe x-ray region more strongly than do the water or carbon in the cells of ordinary tissue, allowing for the use of x-raysto generate images that show unevenness such as broken bones or tumors. The chlorophyll molecule in green plantsabsorbs mostly ultraviolet (and also some blue violet, and red light) and uses this energy for photosynthesis. Most of thegreen light in sunlight is reflected by leaves, making them appear green to our eyes.
Solar Spectrum
The range of electromagnetic energy emitted by the sun is known as the solar spectrum, and lies mainly in three regions:ultraviolet, visible, and infrared. The solar spectrum extends from about 0.29 µm (or 290 nm) in the longer wavelengthsof the ultraviolet region, to over 3.2 µm (3,200 nm) in the far infrared. Small amounts of radio waves are also given offby the sun and other stars. In fact, if the sun's image is made from its radio waves, it appears 10% larger than if itsimage is made from visible light. There are some "cooler" stars that give off mostly radio waves and no visible radiation.
The range of energy given off by a star depends upon the temperature and size of the star. Smaller, hotter stars (called"white dwarfs") give off more energy in the blue region and appear "whiter" than our yellow sun. Rigel, a star in theconstellation Sirius, is a white dwarf. Larger, cooler stars, called "red giants," emit more light in the red region, and areexemplified by Antares and Betelgeuse. Note that even a "cool" star still has a temperature of a million degrees or so.
While the sun does emit ultraviolet radiation, the majority of solar energy comes in the form of "light" and "heat," in thevisible and infrared regions of the electromagnetic spectrum. As shown in Table 1, visible light spans the relativelynarrow range of 0.4 to 0.9 µm (or 400 to 700 nm). Light is special to humans and many other animals due to theevolution of the eye, a sensory organ that detects this part of the solar spectrum. As noted earlier, our eyes evenrecognize parts of the visible light spectrum as the sensations of color. Thus 400 nm radiation is perceived by the eye asviolet, and 600 nm radiation is perceived as red.
We are all familiar with the rainbow of colors - the range of different wavelengths that make up sunlight. The best way tovisualize this concept - and the most common scientific demonstration - is the image of a glass prism splitting up whitelight into the colors. When raindrops act as prisms, we see a rainbow. Often, when the sun is bright, various transparent

5
objects such as beveled edges of glass windows or glass pieces of a chandelier transmit light as a spectrum. Thisphenomenon occurs because different wavelengths of light (or different colors) travel through glass at different speeds,causing them to bend at different angles. Figure 3 shows the spectrum (violet, blue, green, yellow, orange, and red)going from the shortest wavelengths (highest frequency) to the longest wavelengths (lowest frequency). On either sideof the visible spectrum are the ultraviolet (shorter wavelength than violet) and infrared (longer wavelength than red).These wavelengths are mostly absorbed by the glass and are, of course, outside the range of wavelengths that our visioncan detect.
Figure 3: White light falling on a glass prism, dispersed into its constituent colors.(from Lawrence Berkeley National Laboratory)
While the eye effectively perceives and distinguishes visible light, infrared (wavelengths longer than red) is perceived asheat when it is absorbed by the skin and converted into energy of the molecules of the skin. Infrared plays an importantrole in the temperature of the Earth and its atmosphere, and in turn, the climate of the Earth. We will discuss this role inmore detail in the section pertaining to the interaction solar energy with the atmosphere.
We will now discuss how much energy is available in the different wavelength regions of the solar spectrum.
Energy Distribution in the Solar Spectrum
Electromagnetic energy can be discussed in terms of its energy distribution, or the spread of energy over a range ofwavelengths. This distribution of energy is also known as the spectral distribution. The measure of radiation may bequantified in terms of the amount of energy falling per second (measured in Watts) per unit area (in square meters, m2)in each band of 1 µm wavelength.
The sun provides a broad range of energy, primarily concentrated around the visible and infrared regions. This energy isan important feature of the background conditions that led to the evolution of our life forms on Earth, and continue tosupport this life. There is a small amount of high-energy radiation like x-rays in the sun's energy but these do notpenetrate below the topmost layer of the atmosphere, and we do not consider them here.
In the ultraviolet region of the solar spectrum around 0.28 µm wavelength, there is less than 100 W/m2 in a 1 µm bandof radiation. In a 1 µm band around the red wavelength of 0.6 µm, however, there is over 2,000 W/m2. From 0.75 µm orso, there is infrared radiation ranging from about 1,000 W/m2/µm at 0.8 µm to about 100 W/m2/µm at 2.2 µm. Thisrelatively low level of energy persists far into the infrared region.
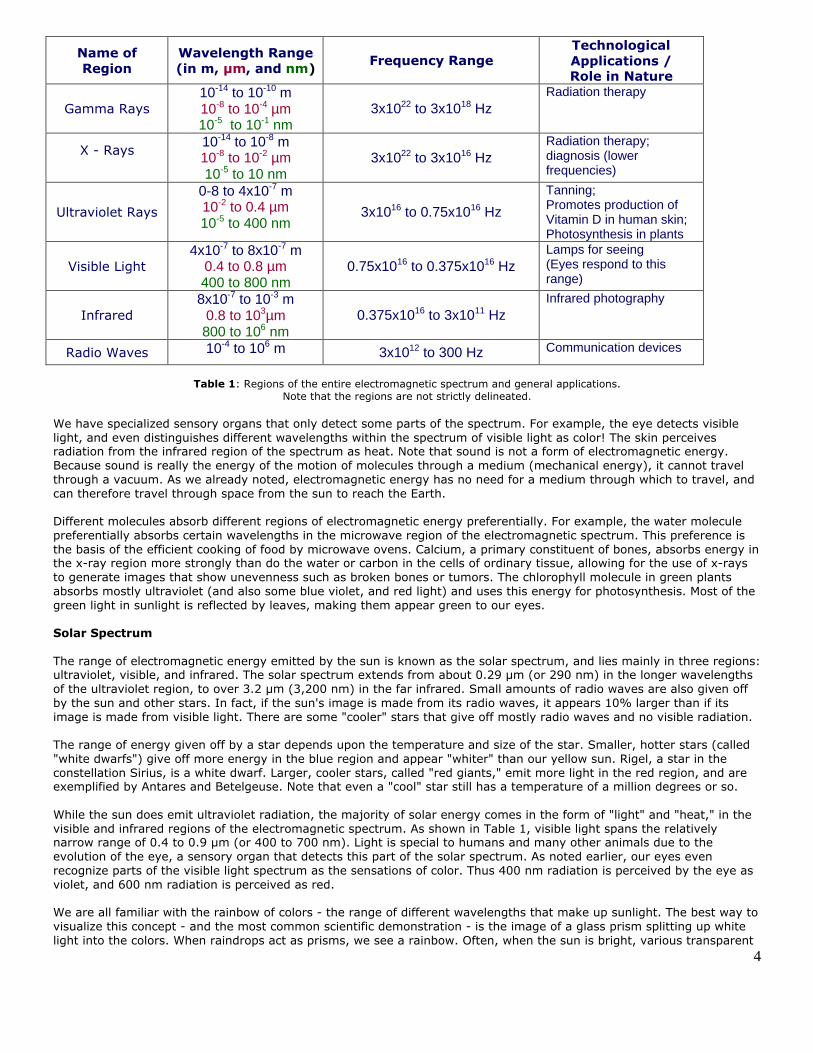
The spectral distribution (or range of energies) of the solar radiation that falls on top of the Earth's atmosphere isrepresented in Figure 4. As this spectral distribution is close to what the sun emits, we can say that this is the sun'semission spectrum. The x-axis (or horizontal axis) represents the range of wavelengths in the solar spectrum (measuredin nanometers), while the y-axis (or vertical axis) represents the amount of power (Watts) in each micron-wide band ofwavelength falling on each square meter just outside of the Earth's atmosphere (measured in units of Watts/meter2/µm).This figure shows that most of the energy coming from the sun is in the visible region of the electromagnetic spectrum,making up what we call sunlight (white light).
6
Figure 4: Solar spectral distribution entering the lower parts of the atmosphere.
Reflection and Absorption Spectra - Basic Science
When light falls on a surface, it can either be reflected, transmitted, absorbed, or varying degrees of all three. Differentcolored surfaces appear different to the eye because of differences in the way they reflect and absorb light. Stars aresources of radiation, giving off their own energy. Their color appears to us through the light they emit. So, a bluish stargives off more blue light than a yellow star like the sun. To see non-luminous objects, we need light from some othersource to fall on them, and the reflected light reaches our eye. The colors of non-luminous objects are thus dependent onwhat wavelengths of energy they reflect and what wavelengths they absorb.
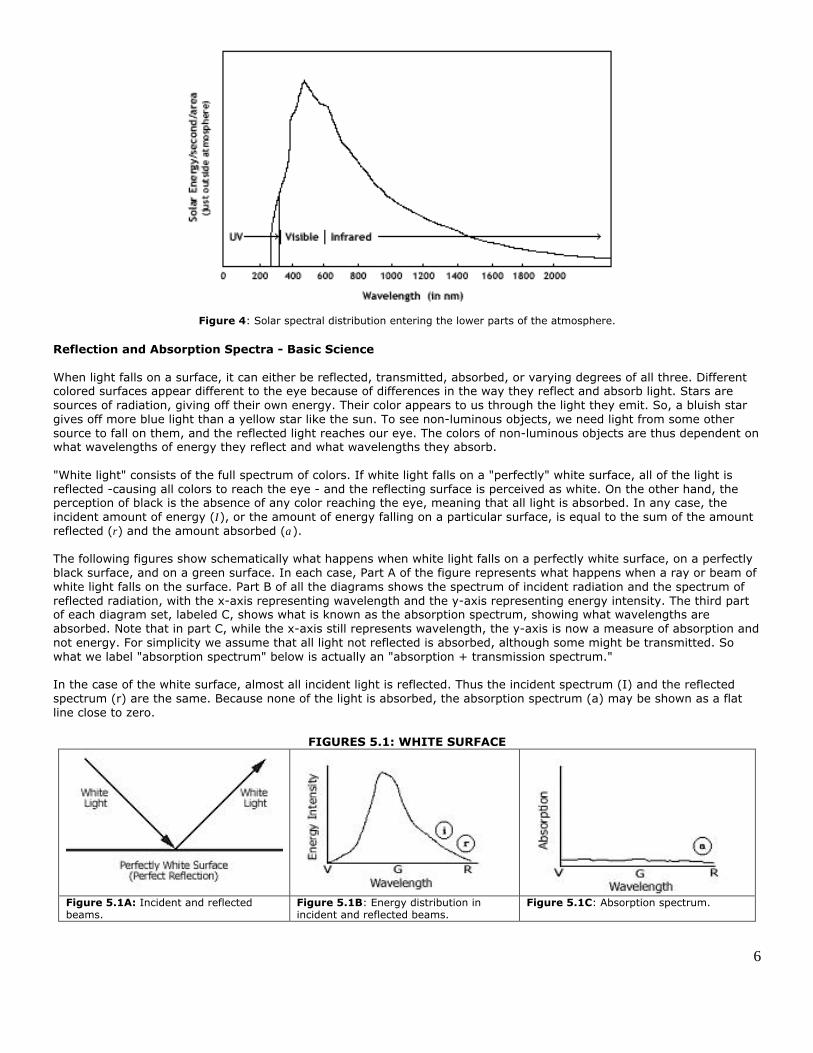
"White light" consists of the full spectrum of colors. If white light falls on a "perfectly" white surface, all of the light isreflected -causing all colors to reach the eye - and the reflecting surface is perceived as white. On the other hand, theperception of black is the absence of any color reaching the eye, meaning that all light is absorbed. In any case, theincident amount of energy (I), or the amount of energy falling on a particular surface, is equal to the sum of the amountreflected (r) and the amount absorbed (a).
The following figures show schematically what happens when white light falls on a perfectly white surface, on a perfectlyblack surface, and on a green surface. In each case, Part A of the figure represents what happens when a ray or beam ofwhite light falls on the surface. Part B of all the diagrams shows the spectrum of incident radiation and the spectrum ofreflected radiation, with the x-axis representing wavelength and the y-axis representing energy intensity. The third partof each diagram set, labeled C, shows what is known as the absorption spectrum, showing what wavelengths areabsorbed. Note that in part C, while the x-axis still represents wavelength, the y-axis is now a measure of absorption andnot energy. For simplicity we assume that all light not reflected is absorbed, although some might be transmitted. Sowhat we label "absorption spectrum" below is actually an "absorption + transmission spectrum."
In the case of the white surface, almost all incident light is reflected. Thus the incident spectrum (I) and the reflectedspectrum (r) are the same. Because none of the light is absorbed, the absorption spectrum (a) may be shown as a flatline close to zero.
FIGURES 5.1: WHITE SURFACE
Figure 5.1A: Incident and reflectedbeams.
Figure 5.1B: Energy distribution inincident and reflected beams.
Figure 5.1C: Absorption spectrum.
7
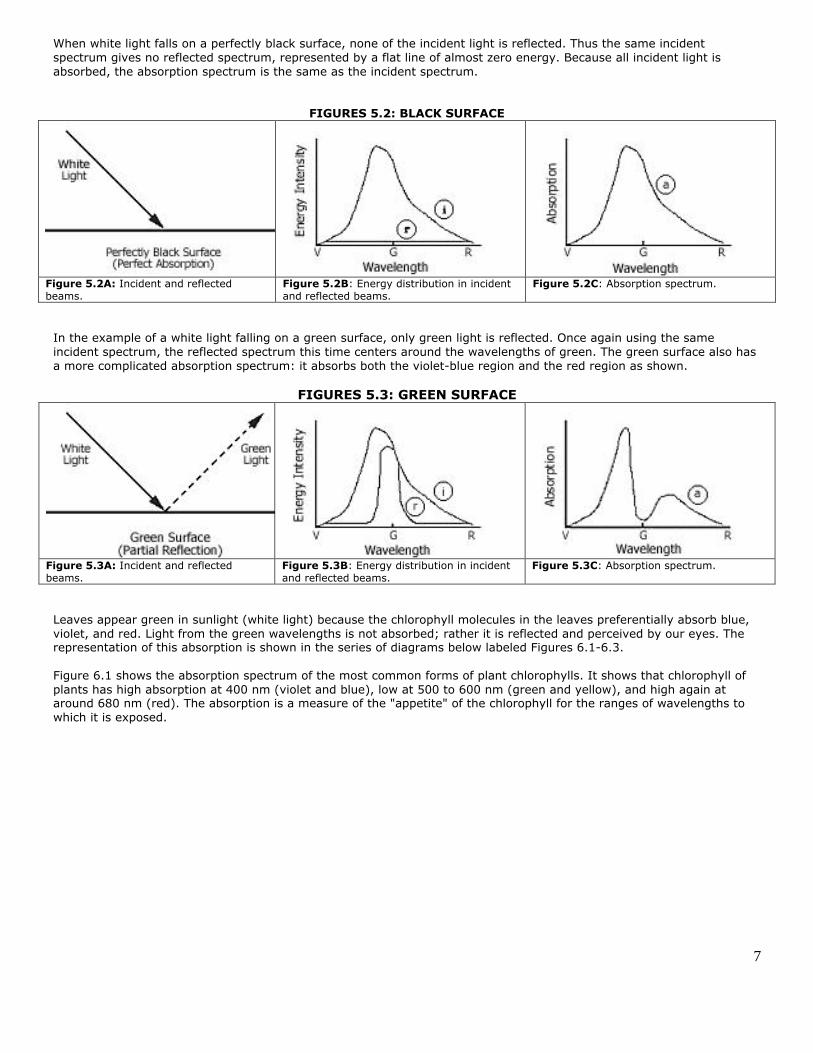
When white light falls on a perfectly black surface, none of the incident light is reflected. Thus the same incidentspectrum gives no reflected spectrum, represented by a flat line of almost zero energy. Because all incident light isabsorbed, the absorption spectrum is the same as the incident spectrum.
FIGURES 5.2: BLACK SURFACE
Figure 5.2A: Incident and reflectedbeams.
Figure 5.2B: Energy distribution in incidentand reflected beams.
Figure 5.2C: Absorption spectrum.
In the example of a white light falling on a green surface, only green light is reflected. Once again using the sameincident spectrum, the reflected spectrum this time centers around the wavelengths of green. The green surface also hasa more complicated absorption spectrum: it absorbs both the violet-blue region and the red region as shown.
FIGURES 5.3: GREEN SURFACE
Figure 5.3A: Incident and reflectedbeams.
Figure 5.3B: Energy distribution in incidentand reflected beams.
Figure 5.3C: Absorption spectrum.
Leaves appear green in sunlight (white light) because the chlorophyll molecules in the leaves preferentially absorb blue,violet, and red. Light from the green wavelengths is not absorbed; rather it is reflected and perceived by our eyes. Therepresentation of this absorption is shown in the series of diagrams below labeled Figures 6.1-6.3.
Figure 6.1 shows the absorption spectrum of the most common forms of plant chlorophylls. It shows that chlorophyll ofplants has high absorption at 400 nm (violet and blue), low at 500 to 600 nm (green and yellow), and high again ataround 680 nm (red). The absorption is a measure of the "appetite" of the chlorophyll for the ranges of wavelengths towhich it is exposed.

8
Figure 6.1: Absorption spectrum of chlorophyll.
Figure 6.2 shows this absorption spectrum (A) superimposed on a rough outline of the solar energy spectrum (B), whichis an enlarged section of the solar spectrum shown in Figure 4. This figure demonstrates that when solar energy falls onleaves, the chlorophyll will absorb violet, blue, and red. The reflected spectrum therefore will have lost large portions ofits energy around 400 nm and 800 nm, retaining energy mostly in the 500-600 nm (green) range, and in the infrared.The Ecological System describes photosynthesis in much greater detail.
Figure 6.2: Solar spectrum of visible region juxtaposed withthe absorption spectrum of chlorophyll.
Figure 6.3 shows the light that is left over after the absorption by chlorophyll occurs. This "reflected spectrum," then,actually represents the light (mostly green and yellow) that is reflected off the leaf. This is the detailed explanation ofwhy leaves appear green in white light. The violet light absorbed by the chlorophyll is responsible for photosynthesis.

9
Figure 6.3: Reflected spectrum, or what is left of the solar spectrum afterabsorption by chlorophyll in a leaf. Our eyes register this as
the leaf surface being green.
Earth & its Atmosphere
The Earth's mass exerts a gravitational force that holds to the Earth a large amount of gases, known as the atmosphere.In this section, we will look at the layers and general composition of the atmosphere and discuss its major roles inmaintaining life on Earth. We will not discuss in detail how the atmosphere has evolved over the history of the Earth, norhow living systems on Earth affect the atmosphere. Note briefly, however, that James Lovelock, author of Gaia, proposesthat the atmosphere owes its current composition to feedback from living systems. He remarks that life on Earth requiresa particular atmospheric composition, and this composition is in turn maintained by the interaction between biologicalsystems and the atmospheric system.
Layers of the Atmosphere
The atmosphere consists of five layers: the troposphere, the stratosphere, the mesosphere, the thermosphere, and theexosphere. The thickness of these layers is slightly different around the globe, and also varies according to temperatureand season. In this discussion, we will focus primarily on the troposphere and the stratosphere because they are themost affected by anthropogenic (or man-made) pollutants.
The troposphere is the layer closest to the Earth's surface. It is a layer of air approximately 10 to 15 kilometers thick thatis constantly in motion. The conditions in this layer determine practically all of the Earth's weather patterns. It derives itsname from the Greek word "Tropos," meaning "turning" or "mixing." The constant motion in this layer is significant indiscussing air quality because it results in the dispersion of pollutants. In one respect this dispersion is consideredbeneficial because it has the effect of diluting pollutants, which can reduce harmful impacts on a local level. On the otherhand, this dispersion also results in the movement of air pollutants (and therefore air pollution problems) from areas ofhigh pollution production to areas of lower production. For example, pollutants produced in an industrialized and heavilypopulated city often adversely impact smaller communities and ecosystems in a large surrounding area.
The stratosphere is the layer just above the troposphere. It is approximately 40 kilometers thick and is composed mostlyof dry stable air. In contrast to the troposphere, pollutants in the stratosphere do not disperse, and tend to remain in theatmosphere for long periods of time.

10
Figure 7: Layers of the Earth's atmosphere.(adapted from G.W. Vantoon and S.J. Duffy, Environmental Chemistry: A Global Perspective,
Oxford University Press, 2000.)
As electromagnetic radiation travels through the atmosphere, shorter wavelengths are absorbed by the molecules in thefirst few miles. This high frequency radiation is capable of stripping the electrons from the molecules and dissociating theO2 and N2 molecules into O and N atoms, and ions or charged units such as O2+, N2+ (O2 and N2 molecules with oneelectron missing), etc. Thus the upper layers of the atmosphere are also called the ionosphere because they contain ions(or charged atoms and molecules). Only radiation of wavelength 220 nm or longer penetrates deeper into theatmosphere, reaching the stratosphere.
A stream of charged particles from the sun and the galaxy in general also falls on the upper layers of the atmosphere.Because they are charged, they are affected by the Earth's magnetic field--and depending upon their charge (+ or -)spiral toward the North or South pole. These concentrated streams of particles (often referred to as "cosmic rays") fallingon the poles are visible as the Northern and Southern Lights (Auroral Lights).
Figure 2, Table 1, and Figure 4 all show that the spectral region from about 10 nm to about 350 nm is the ultravioletregion. The absorption spectrum of the ozone molecule is from 240 to 300 nm, while the O2 molecule absorbswavelengths shorter than 175 nm (splitting into O atoms). This absorption of the O3 and O2 molecules is the basis of theozone layer (more later).
Chemical Composition of the Atmosphere
The Earth's atmosphere is composed primarily of nitrogen and oxygen, as well as some argon. There are also severalother trace gases, meaning they occur in very small amounts. The proportion of molecules that naturally occur in the

11
troposphere is described in Table 2. It is important to note the concentrations of these chemical compounds compared tothe anthropogenically generated chemicals that may enter the atmosphere.
The major constituents are oxygen (O2) and nitrogen (N2). Other components such as argon, CO2, NO, and O3 areproduced in minute quantities in natural processes. However, industrial and other technological human activities (such asautomobile traffic) have begun to increase the amounts of materials such as CO2 by amounts that are beginning to makea difference in the balance of circulation and radiation absorption in the troposphere. Effects of these changes range fromlocal atmospheric problems, like smog, to problems of much greater scale, such as global climate change (more later).
Chlorofluorocarbons (CF2Cl2, CFCl3) are a family of chemicals that do not occur in nature, but were produced in largequantities in the last century. These chemically inert compounds rise into the stratosphere and cause disruptions in theozone layer (more later).
Numerous other gases circulate particularly in the troposphere in small quantities. The rare gases Argon (Ar), Neon (Ne),and Krypton (Kr) slowly drift up released from various processes on the ground, and remain non-reactive. Water vapor(H2O), carbon dioxide (CO2) and methane (CH4) also arise from natural processes.
Water is the most highly variable gas in the atmosphere. The water fraction in the atmosphere (measured by the relativehumidity) varies from place to place and day to day.
The water cycle described in the Materials System unit is, of course, vital to life on Earth, as is a certain level of C O2.H2O and C O2 are essential molecules for photosynthesis. H2O and CO2 are also central in moderating the temperature ofthe atmosphere as the Earth rotates (more later).
CO2 is produced in natural processes of decay and natural combustion processes such as forest fires and volcanoes.
Methane arises from natural processes such as cows and paddy fields. It is also produced in numerous undergroundprocesses of decay in the soil in the absence of oxygen, especially in marshes. Another source of the release of methaneinto the atmosphere is during the extraction and transportation of natural gas.
Carbon monoxide, oxides of nitrogen, NO, NO2, and more complex nitrogen compounds are formed as a byproduct of theoperation of the internal combustion engine and other fossil fuel-based technologies. Thus in countries with high levels oftransportation, these gases also exist in local regions of the atmosphere. Oxides of sulfur are also released in coalburning (more later).
The troposphere is therefore a highly varying mixture of gases. Note that compared to the amounts of oxygen andnitrogen, the other gases are in small quantities measured in units of parts per million (or ppm) meaning one molecule ofthe gas in every million molecules of air (approximately 780,000 N2 and 21,000 O2). These small ppm-level imbalances inthe composition of the atmosphere are enough to cause disruption in local and global atmospheric conditions and affecttemperature and weather patterns.
Constituent Concentration
Nitrogen 78.08%
Oxygen 20.95%
Argon 0.93%
Carbon Dioxide 355 ppm
Neon 18 ppm
Helium 5.2 ppm
Methane 1.8 ppm
Krypton 1.1 ppm
Nitrous Oxide 0.3 ppm
Hydrogen 0.5 ppm
Ozone 0.01 ppm
Table 2: 1990 Composition of Clean, Dry Air(fraction by volume).

12
Solar Radiation in the Atmosphere
The atmosphere may seem to be completely transparent to solar radiation, but in fact there are dynamic interactionsoccurring constantly that result in a complex and delicately balanced system crucial to the continuation of present lifeforms on Earth. In this section we will discuss how solar radiation is absorbed and reflected by the atmosphere and theEarth -- and two resulting phenomena that are crucial to the maintenance of life on Earth:
1. The atmosphere acts as a filter, absorbing and reflecting portions of the electromagnetic spectrum, such as theultraviolet region, that are harmful to humans and other life forms.
2. The atmosphere provides a natural "greenhouse effect," maintaining the temperatures and climates in which lifeforms on Earth have evolved to survive.
The atmosphere controls the amount of solar radiation reaching the surface of the earth, and regulates the amount ofradiation from the Earth escaping into space. Even seemingly slight changes in the concentrations of certain gases couldupset the balance of reactions and be detrimental to life as we know it. We will now explain these two exchanges indetail, and later discuss their relevance to two major environmental problems: global climate change and stratosphericozone depletion.
To demonstrate how the atmosphere affects incoming solar radiation, Figure 8 shows the solar radiation spectrum first atthe top of the atmosphere (A, in red), and again at sea level (B, in blue). The absorption of the molecules shown inFigure 8 is discussed in some detail because it is critical to maintaining some of the most important conditions for ourviability on Earth. Note that the solar spectrum shown here is the same as a part of Figure 4, enlarged to show thedetails of absorption.
Figure 8: Solar spectrum (A) above the atmosphere and (B) near the Earth's surface,with some of the radiation having been absorbed by molecules in the atmosphere.
Also depicted is a curve of the spectrum detectable by the eye (C).
This figure shows that ozone (O3) absorbs ultraviolet. O2 absorbs ultraviolet as well as some visible and infrared. Theultraviolet absorption properties of O3 and O2 are central to the protective ozone layer described later. Water vapor (H2O)absorbs highly in the range of 0.4 and 0.9 µm and again above 1.2 µm and also in the microwave region. The absorptionproperty of H2O in the microwave region is, of course, the basis for the efficient cooking of foods by microwave ovens.CO2 has high absorption around 1.4 µm and above.
When molecules absorb energy, the absorbed energy may go into causing a chemical change (as in cooking food in amicrowave oven), or it may be re-emitted. Often molecules re-emit energy at wavelengths longer than that at which it

13
was absorbed. Thus when molecules such as H2O and CO2 absorb visible or infrared light, they often re-emit it as longerwavelength infrared. This has great importance in our climate as described later.
The small black curve labeled C in Figure 8 approximates the sensitivity spectrum of our vision, or which wavelengths theeye can detect, with our maximum sensitivity by the green and yellow. This is why yellow light is used for markings onthe roads and as the warning light color in traffic lights.
Atmospheric Environmental Concerns
Air pollution problems occur due to the presence and movement of pollutants within and among the layers within theatmosphere. The location of the pollutants in a certain layer is an important factor in determining what type of airpollution problem may occur. For the most part, the polluting molecules are heavier than air and circulate in thetroposphere. A general description of these are given earlier. The different species of molecules remain in thetroposphere for different amounts of time depending upon their amount, reactivity, and local weather patterns. It is thenon-reactivity of chlorofluorocarbons that result in their drifting through the troposphere and finding their way tot hestratosphere. Most of the CFC's do remain in the upper part of the troposphere due to their weight. However very littleultraviolet reaches here because of the stratospheric ozone layer. Recall that their ability to disrupt the ozone layeroccurs due to ultraviolet knocking off a chlorine atom. So this does not happen in the troposphere. Otherwise we mighthave other problems stemming from free highly reactive chlorine in the troposphere!
The fastest transport of gases in the atmosphere occurs in the troposphere. This is the region where the circulationpatterns leading to the daily weather and eventually the climate conditions occurs. The water cycle (described in theMaterials System) occurs between the earth (particularly oceans and other bodies of water) and the lower half of thetroposphere. The troposphere extends to about 9.5 miles (15 km) from the Earth's surface. When pilots announce thealtitude of an airplane flight and you are above the clouds, it is usually at 30000 - 35000 feet which is about 5 - 6 miles.So the cloud activity is generally in the lowest part of the atmosphere. Even with the faster circulation in the troposphere,on the average, a water molecule spends about 9 days in the atmosphere once it gets released from the water bodies ofthe earth. This is called the residence time of the molecule in the water. Molecules like CFC's on the other hand haveresidence times varying from 60 years to hundreds of years!
Some of the effects of pollutants in the atmosphere are global, some regional, and some local, depending on the layer atwhich they primarily circulate, which in turn depends on how heavy the molecule is, its reactivity , and what thecirculation patterns are.
Climate change, indicated by the so-called greenhouse gases and stratospheric ozone depletion are global in nature. Acidprecipitation (or acid rain) due to release of oxides of sulfur and nitrogen from fossil fuel combustion is regional, andaffects areas up to hundreds of miles from the sources. Tropospheric (or ground-level) ozone concentrations, air pollutionfrom CO, NO2, and SO2, and heat island effects arising from the interaction of pollution with sunlight or with localcirculation patterns set up by buildings are local in nature and vary daily. These effects are now described in more detail.
Stratospheric Ozone Layer & Ozone Depletion
Ultraviolet Filtration and the Ozone Layer
Let us look in detail at the first protective mechanism afforded by the fact that O3 and O2 both absorb ultraviolet but atslightly different wavelengths. O3 absorbs in a region from 240 - 280 nm and O2 absorbs wavelengths shorter than 175nm. The energy absorbed in both cases is used to effect chemical change rather than re-emitted.
The UV radiation absorbed by O2 in the stratosphere actually splits the O2 into oxygen atoms. Each of these oxygenatoms combine with other oxygen atoms to form O2 or with O2 to form O3. O3 absorbs UV at the higher wavelengths(240-280 nm) to split into O and O2. The O released by O3 may recombine with an O to form O2 or with water to form2OH radicals. These changes may be outlined in terms of the following equations:
1. O2 + UV radiation (< 175 nm) à O + O
2. O + O2 à O3
orO + O à O2
3. O3 + UV radiation (240-280 nm) à O* + O2 gas

14
4. O* + O à O2
orO* + H2O 2OHand so on...
This cycle repeats and, over millions of years, has reached an equilibrium state. The net result of the above reactions isthat O2 and O3 are constantly changing into each other, and each cycle takes up energy in the form of ultravioletradiation, resulting in a large reduction of the amount of ultraviolet radiation reaching the troposphere. These reactionsalso result in there being a higher concentration of ozone gas in the lower region of the stratosphere with a maximum ofO3 occurring between 20 and 26 km above the Earth's surface. This area is called the "ozone layer."
In general, ultraviolet radiation of the smaller wavelength damages the skin, and can initiate the process of skin cancer.The stratospheric ozone layer forms a protective shield protecting us from receiving large amounts of UV. Note howeverthat some ultraviolet does get through and is responsible for sunburn, and skin cancer with excessive exposure.
The ultraviolet A absorbed by the skin can actually damage our DNA. Most of us have repair genes that can repair thisdamage, however when we are exposed to large amounts of UV, the repair is not enough to keep up with the damageand this damage can result in skin cancer. People who can not produce skin pigment (referred to as "albino") have agenetic condition known as xeroderma pigmentosum, which is accompanied by a lack of the UV repair gene. Thesepeople are therefore several hundred times as likely as the average person to contract skin cancer.
Ozone-Depleting Substances
Humans have introduced many compounds into the atmosphere that are capable of disrupting the cycle of creation anddestruction of ozone molecules in the stratosphere. A family of compounds known as chlorofluorocarbons (CFC's) havehad the most significant effect on the ozone layer by far. This discussion will focus primarily on CFC's, although the basicprocess of ozone depletion is very similar for any of the ozone-depleting substances (ODS).
CFC's have varying compositions, but all of them contain different proportions of three elements: carbon (C), Chlorine(Cl) and fluorine (F). Two of the CFC's that were in common use are: CFC-11 (CFCl3) and CFC-12 (CF2Cl2)
CFC's were produced and used extensively as refrigerants starting in the early 1930's. They were discovered by ascientist named Medgley who was searching for a more ideal cooling compound to replace the unsafe chemicals that werebeing used at that time, including ammonia and sulfur dioxide. Ammonia was most widely used, but was undesirablebecause it is a strong eye and respiratory irritant.
Chlorofluorocarbons were seen then as the ideal compounds because they are extremely non-reactive, and weretherefore thought to be harmless. They are chemical inert, non-toxic, and insoluble in water. For close to fifty years, theywere hailed as miracle substances, and were used extensively in aerosols, refrigerants, and foams.
What we did not know then was that because of their non-reactive nature, CFC's are able to rise undisturbed into theatmosphere. They are not destroyed by reactions or removed by precipitation in the tropospheric layer of theatmosphere, and migrate over several years, eventually reaching as high as the stratosphere.
Disruption of Ozone Cycle
When CFC's migrate high enough and are hit by enough ultraviolet radiation, they are broken down and release chlorineatoms. The chlorine atoms react with O3 gas and the following chain of reactions results:
Cl + O3 à ClO + O2
ClO + O à Cl + O2
These reactions make ozone molecules unavailable for the vital reactions that absorb incoming ultraviolet, and are themain source of ozone depletion. One chlorine atom can destroy over 100,000 molecules of ozone, and the result of thisdisruption is a markedly lower than expected concentration of stratospheric ozone at various points around the world.
Results
The possibility of ozone depletion in the stratosphere was predicted in the 1970s by two scientists named Roland andMolina. They based their prediction on the action of CFC's on the atmosphere. Although stratospheric ozone depletion isoften referred to as the "ozone hole," that term is misleading. What we call a hole is actually a sharp reduction inexpected ozone concentrations. Scientists have defined an ozone hole as an area having less than 220 dobson units (DU)of ozone in the overhead column (i.e., between the ground and space).

15
Lower ozone concentration means that less incoming ultraviolet radiation is absorbed by the reactions described earlier,and more reaches the troposphere and the Earth's surface. Humans and other forms of life are exposed to higher levelsof ultraviolet, which can cause more damage to skin cells and sensitive tissues of the eye than they are capable ofrepairing.
Ozone depletion, or the concentration of stratospheric ozone, varies seasonally and latitudinally. There tends to be moreozone depletion in the winter with more depletion at the polar regions. The science behind this is somewhat uncertain butis related to the reaction surfaces that are caused by cold cloud formations near the poles.
Possible impacts from ozone depletion are related to the effects on ecosystems by ultraviolet radiation. The exact causeand effect relationship for many of these impacts is uncertain. The impacts are:
• Malignant skin cancer• Non-malignant skin lesions• Lower crop productivity• Cataracts• Ecosystem abnormalities
Policy Efforts
In 1987, the first substantial international environmental treaty was passed. It is known as the Montreal Protocol andincludes agreements to reduce the worldwide production of CFCs. The Protocol was precedent-setting in that it includedfunds to the developing countries to compensate for the higher costs of using alternate technologies.
The Montreal Protocol has been effective in lowering the production of CFCs in the U.S., although many developingcountries have a longer time period for compliance. However, the CFC molecule is so stable (lasting 1700 years or morein the atmosphere) that previously produced CFC's will be entering the stratosphere continuously and we will feel theirimpacts for many years to come.
Several substitutes for CFC's are being developed. The desirable property of CFC -- its chemical inertness -- is also thereason it is able to reach the stratosphere. To engineer a substitute, one must design a compound that has the desirableproperties but will not contribute to stratospheric ozone depletion. The new compounds being considered have lesschlorine and fluorine. The most common replacements are HCFCs in which one chlorine is replaced by hydrogen, or HFCsin which chlorine is altogether replaced by hydrogen. Examples are CHClF2 and CH2F2. The lowered chlorine compoundsare also banned in the U.S. after 2000 by the Clean Air Act.
The Greenhouse Effect & Global Climate Change
Solar Radiation Absorption, Balance, and the Natural Greenhouse Effect
The atmosphere plays a role similar to that of a greenhouse. When solar radiation falls on the atmosphere, part of it istransmitted and part of it is immediately reflected back into space. As the transmitted radiation travels toward the Earth'ssurface, different regions of the spectrum are absorbed by the molecules of the atmosphere. Energy that is not reflectedor absorbed by the atmosphere falls on the surface of the Earth. In turn, the energy that falls on the surface of the Earthis either reflected back into the atmosphere or absorbed by the surface of the Earth. For every 100 units of solarradiation falling on the Earth and its atmosphere, 25 units are reflected by the atmosphere, and 25 units are absorbed bythe atmosphere. The remaining 50 units fall on the surface of the Earth. Of these 50 units, 5 units are reflected by thesurface of the Earth, and 45 units are absorbed. So altogether, approximately 30% of the incident energy is reflected bythe atmosphere and the surface of the earth. This portion is known as the "albedo." Thus, the atmosphere absorbsapproximately 25% of the radiation, and the earth's surface absorbs 45%.
Some of the energy absorbed by the Earth is used to evaporate water, driving the water cycle. The Earth then reradiatessome of the remaining energy. This re-radiated energy contains more infrared than the original incoming radiation. Sonow the total amount of radiation present in the atmosphere, on the whole, contains longer in wavelength ranges thanthe original solar radiation that came to the Earth. Certain gases in the atmosphere (known as greenhouse gases—seeAppendix I) do not allow this longer wavelength radiation to pass through as easily as the shorter-wavelengths thatentered. These gases absorb, retain, and re-radiate the infrared, keeping a "warm blanket" around the Earth thatprevents sudden cooling and heating effects each time the face of the Earth rotates away from or towards the sun. Thetwo components of the atmosphere primarily responsible for the natural greenhouse effect are H2O and CO2.Thismoderating effect - one that is a net result of visible radiation being transformed increasingly into infrared and shorterinfrared to longer is called the "natural greenhouse effect."

16
Figure 9: Solar energy balance.[© Steve Schneider (1989) "The Greenhouse Effect: Science and Policy." Science 243: 771-81.]
Most light energy that reaches the Earth (approximately 90%) is absorbed by the surface of the Earth and other objectson it. Energy is then converted to long-wave radiation and re-emitted, as described in the example of the greenhouseabove.
Figure 10: Energy balance of solar radiation.(from Climate Change Impacts on the United States Cambridge University Press: 2000.)

17
The phenomenon we described above is known as the natural greenhouse effect, and is responsible for keeping thetemperature of the Earth a full 33° C warmer than it would be otherwise. It creates a climate in which humans and otherlife forms can live under relatively hospitable conditions. However, human activities are causing a rapid increase in theconcentrations of greenhouse gases, and we are now facing an "enhanced" greenhouse effect. The result of the enhancedgreenhouse effect is an increase in the global average surface temperature of the Earth -- and possible changes inclimate on a global scale.
Figure 11: Scheme of greenhouse effect.(From John R. Herman and Richard A. Goldberg:
Sun, Weather, and Climate. Washington D.C.: NASA, 1978.)
Global Climate Change
We noted earlier that even slight increases in the concentrations of greenhouse gases in the atmosphere result in moreheat being trapped. In this section, we will summarize the scientific evidence that the increase in concentration ofgreenhouse gases impacts global climate conditions. We will also discuss the human activities that are causing theincrease, and the policies that have been put in place to slow or reduce the effects of global climate change.
Recall from the previous section that there is a natural greenhouse effect that is necessary to maintain temperatureswarm enough to sustain current ecosystems. This "temperature bath" occurs due to the absorption of short-wave(visible) solar radiation by surfaces on the Earth, and the subsequent transformation of that radiation into longer-waveinfrared. Infrared is then absorbed and "trapped" by greenhouse gases, causing the troposphere to maintain asignificantly warmer temperature than it would without this effect. Natural sources of greenhouse gases are part of abalanced chemical cycle that has been relatively steady during the time of human evolution to the present form.
As current ecosystems evolved over long time periods to acclimate to the environmental temperature, a permanentincrease of even 1° on the average can be very disruptive, especially when this change occurs too quickly for the systemto co-evolve.
Geologic evidence has been used to understand the correlation between the amount of CO2 in the atmosphere and globaltemperature and climate. For example, it is believed that when life began around 4 billion years ago, the sun was about30% fainter than it is today. However, much higher levels of CO2 in the air (about 1000 times what they are today) madefor enough warmth on the surface of the earth so at least some regions were above the freezing point of water, andbegan to provide conditions necessary for life to emerge. Analysis of CO2 in the frozen layers of ice in Antarctica providesevidence that over the past 160,000 years, climatic change and levels of carbon dioxide are closely related.
The greenhouse effect can become a "problem" when the amount of heat-absorbing gases in the atmosphere rapidlyrises far above the levels at which they have been historically present. Since the Industrial Revolution, there has been ahigh rate of increase in the concentration of greenhouse gases, due in large part to the combustion of fossil fuels and the

18
destruction of large plant systems such as tropical forests. Carbon dioxide concentrations, for example, have risen by30% since the late 1800's. Furthermore, scientists predict that CO2 concentration will continue to rise, likely reaching 2 to3 times its pre-industrial level by 2100.
The hypothesis that the known increase in greenhouse gas concentrations have led and will continue to lead to changesin the Earth's climate has been hotly debated in the past decade. However, a vast majority of scientists are now inagreement that evidence is sufficiently strong to prove the relationship. They are now mostly concerned with how topredict the impacts and scale of climate change, and how society can adapt to and minimize the harmful effects of thesechanges (see Appendix II).
Reliable temperature records only exist of the last century or so, and scientists use paleohydrologic studies to extractlonger-term records. These data show that global average surface temperature can vary greatly over short periods oftime. For example, there was an apparent temporary cooling during the 1940's, 50's, and 60's. However, the pastcentury has seen an overall increase in temperature by 1° F (or 0.6° C), with about half of that increase occurring sincethe late 1970's. Seventeen of the eighteen warmest years of the 20th century occurred between 1980 and 2000.
These studies have also shown a positive correlation between greenhouse gas concentration and temperature, as shownby Figures 12.1 and 12.2. Notice on each graph that the blue line indicates readings taken from historical records, treerings, corals, and air trapped in Antarctic ice, while the shift to a purple line indicates temperatures and CO2
concentrations directly measured and recorded.
Figure 12.1: Graph of temperature change over past 1000 years.(from Climate Change Impacts on the United States Cambridge University Press: 2000.)
Figure 12.2: Atmospheric CO2 concentration over past 1000 years.(from Climate Change Impacts on the United States Cambridge University Press: 2000.)

19
Figure 12.3: Carbon emissions over past 1000 years.(from Climate Change Impacts on the United States Cambridge University Press: 2000.)
Policy
Since fossil fuel combustion is one of the primary sources of greenhouse gases, fuel use is indicative of those countriesthat have contributed most to global climate change. The US leads the world in the gross amount of carbon emissionsfrom fossil fuels, followed by China. Overall, developing countries contribute a very small percentage as compared toindustrialized nations. In speaking of CO2 emissions, we normally speak in terms of carbon emitted, rather than CO2
emitted. The US is also the leader in terms of the amount of carbon dioxide emitted per person, while China is the leaderin terms of carbon emitted per dollar GNP.
While developed countries produce the vast majority of the carbon emissions from fossil fuel use, they often use moreenvironmentally efficient technology. As highly-populated developing countries are becoming more industrialized, we riska further leap in greenhouse gas concentrations due to the use of outdated (cheaper) technology.
There have been many international meetings regarding climate change since 1979 and they continue today. The mostrecent meeting that resulted in international agreement was the Kyoto conference in 1997. The debate there wasbetween industrialized and the developing nations. The points made by each are as follows:
• Industrialized countries claim that most of the population growth is occurring in the developing countries, andmost of the negative effects of climate change will affect those countries. Therefore, the developing world shouldbe active participants in curtails on greenhouse gas emissions.
• Developing countries claim that industrialized countries caused these problems as they achieved theirsocioeconomic status. As such, the industrialized countries should be solely responsible for minimizing emissionsetc., since emission limits would slow development in the developing countries.
The following preliminary agreement was reached as part of the Kyoto Treaty:
• 38 industrialized countries agreed to lower their greenhouse gas emissions by a combined 5.2% of 1990 levels by2008. Of this, the US agreed to 7%, Japan to 7%, and Europe to 8%.
• There were no emissions reductions for the developing countries.
• An analysis of these agreed reductions would mean that due to population growth, the USA would have to reduceits carbon emissions by 33% of what it would have been in 2008. However, because the US lobbied for theinclusion of the effects of carbon sinks (or the "recapturing" of carbon by new forest growth, etc.) the reductionof actual emissions of greenhouse gases by 2008 only amounts to 2-3% less what the emissions were in 1990.
• In spite of the efforts of industrialized nations to reduce greenhouse gas emissions, it is understood that theoverall atmospheric concentration of greenhouse gases would still increase due to the impacts of the developingworld.
In order for this initial agreement to be considered binding, at least 55 countries must have the Treaty officially ratifiedand put in place by their individual governments. Furthermore, the 55 countries that ratify the Treaty must produce atleast 55% of the world's greenhouse gas emissions. Otherwise, the Kyoto Treaty is not binding to the countries thatsigned it, and results will not be achieved.
20
Although the US signed the Kyoto Treaty within a year of its proposal, it has yet to be put before the Senate, where itwould need a 2/3 vote to ratified. Shortly after taking office in 2001, President Bush suggested that the US may bewithdrawing from the Kyoto treaty. His administration points to the "energy crisis" in California, possible threats to theeconomy, and lack of regulation of emissions in developing nations as the primary reasons for pulling out.
A more detailed explanation of the Kyoto Protocol can be found at http://www.cnie.org/nle/clim-3.html. This document isa Congressional Research Service Report for Congress, and was written by Susan R. Fletcher, Senior Analyst inInternational Environmental Policy, and was last updated March 2000.
Regional & Local Atmospheric Environmental Concerns
While the problems of stratospheric ozone depletion and climate change are global in scale, acid deposition, another air-related environmental problem, is regional.
Regional - Acid Rain
The composition of rain and snow depends upon the gases or other agents present in region of the atmosphere in whichthe clouds are formed. When water forms clouds, various chemicals and dust particles (both naturally-occurring andanthropogenic) are dissolved or trapped in the droplets, and eventually deposited back onto the ground.
Rain or snow can be acidic due to natural causes. However, the range of acidity varies, and precipitation may even bealkaline (or basic) in some places. "Natural" acidity occurs because of dissolved organic oxides (like CO2) and sulfurcompounds from decaying biomass. Acidity also occurs as a result of more extreme phenomena like volcanic eruptions,which spew large quantities of CO2, H2S, and SO2 into the air.
When acidic gases are emitted into the air, they react with water vapor molecules and form acid droplets. These dropletsdeposit as drops in what is known as acid rain (or acid precipitation). Some dry deposition also occurs, in which the NOxand SOx particles cling to dust and are deposited on surfaces. These two processes are generally referred to as aciddeposition.
Increasingly large and routine emissions of acidic gases from human activity result in a significant increase in aciddeposition, making it a significant regional environmental problem. Most prominent among the anthropogenic acidicgases are oxides of sulfur and oxides of nitrogen. Both nitrogen and sulfur have many oxides, varying in the amount ofoxygen relative to nitrogen or sulfur, and they are generally denoted by NOx and SOx.
Currently, approximately half of the compounds that add acidity to rain are anthropogenic. One major source of thesecompounds is the smelting of sulfur-based ores in metal processing. A classic case of acid deposition impacts due tometal processing occurred in Sudbury in Ontario, Canada. There, open roasting of nickel-copper ores released sulfurdioxide that destroyed much of the vegetation in the area.
The other major source of compounds causing acid deposition is the combustion of fossil fuels. Fossil fuels are used in theproduction of electricity and in powering automobiles. All fossil fuels contain some sulfur. Coal contains varying amountsof sulfur, depending on the region of its origin. The sulfur in natural gas is removed during refinement.
Acid deposition has several consequences. It alters the pH in the water cycle, thus upsetting the local ecological balance.This alteration stresses, and can even destroy, vegetation and aquatic animals. Acid deposition is injurious to life becauseof corrosive effects on the body when inhaled. It also corrodes marble and other stones, causing "pitting" of statues andother historical monuments. Examples of these harmful effects seen in eastern parts of the United States include loss ofsome trees and fish in Appalachian forests and streams and pitting of monuments in the Gettysburg National Park.
The problem of acid deposition came to be recognized in the 1970's, and since then many laws have been passed toregulate air pollution in the U.S. and Canada. Also, some technological measures have been taken to reduce acidprecipitation, including "clean coal" technologies, which clean coal of sulfur before combustion, and catalytic converters inthe exhaust systems of automobiles, which transforms hydrocarbons, carbon monoxide, and nitrous oxides into water,carbon dioxide, nitrogen, and oxygen.
Local - Photochemical Smog & Tropospheric Ozone
Smog (Smoke and fog) was a phenomenon recognized in the early 1950's when thousands of deaths and intenserespiratory problems occurred in London, England; Donora, Pennsylvania; and cities in other countries all over theindustrialized world. The city of Los Angeles and parts of Southern California have now come to be associated with smog.

21
There are different sources of smog. Early incidents of smog arose primarily from the combustion of coal with high sulfurcontent. The combustion resulted in the reaction of sulfur dioxide (SO2), nitrogen oxides, and dust particles reacted toform particles and droplets of sulfates (SO4
2- ) and nitrates (NO3- ). This mixture of smoke and fog clouded the
atmosphere, and irritated the mucous membranes and the eyes of the people exposed to it.
A new version of smog is the photochemical smog which comes from reactions between the solar radiation (ultravioletthat gets through the stratospheric ozone layer and visible light) and gases produced by various industrial processes.When solar radiation acts on some of the gases emitted from some processes, particularly exhaust from vehicles, ozoneand other gases are produced in the troposphere. This process is called a photochemical reaction because it is a chemicalreaction between light (photo) and the chemicals in exhaust gases. Predominant among the gases undergoingphotochemical reactions are hydrocarbons (compounds of hydrogen and carbon), oxides of nitrogen, NO (nitric oxide)and NO2 (nitrogen dioxide). Photochemical smog is an increasing problem in cities with high traffic. It is often associatedwith Los Angeles and Mexico City because of the large amounts of traffic and bright sunlight there.
Photochemical reactions produce a variety of gases, many of which are harmful to health. They often cause simpleirritation of the mucous membranes and eyes because of their acidic nature, and sometimes result in more seriousrespiratory problems because they overpower the immune and respiratory systems.
Among the gases produced in the photochemical smog are ozone and peroxyacetyl nitrate (often referred to as PAN). Thefollowing reactions produce ground-level ozone:
NO2 + uv à NO + OO + O2 (+ catalyst) à O3 (+ catalyst)
Numerous other reactions also occur, producing a variety of highly reactive compounds, and recycling nitrogen dioxide toproduce more of the reactions! A catalyst is a compound that helps speed a reaction while maintaining its own amountand composition being the same before and after the reaction. Carbon monoxide, which is present in plenty in vehicleexhaust, is a good catalyst for the above reaction.
Also note that sunlight is a requisite for this reaction. Figure 13 shows the time course of the tropospheric ozoneformation in a typical high traffic, sunny city. It shows the ozone buildup, after the exhaust gases and sunlight have hadtime to "cook" the reactive mixture that makes up the photochemical smog.
Figure 13: Rise of ozone smog toward mid day.
So, ozone whose presence in the stratosphere has a protective effect on us, becomes a health problem when it is presentin our layer of the atmosphere and we breathe it in. Because of this, the tropospheric ozone is often referred to as "badozone" and the stratospheric ozone as "good ozone".

22
Local - Urban Heat Islands
"Urban heat islands" are a sort of localized enhanced greenhouse phenomenon. They are simply built-up areas of citythat are significantly warmer than the surrounding area of countryside. The difference in temperature comes from thefact that buildings, paved surfaces, and other man-made structures absorb higher amounts of sunlight than most naturalobjects. This energy is re-radiated at longer wavelengths during the night, and atmospheric pollution in the form of heat-absorbing gases form a "local" atmosphere much like the glass of a greenhouse, trapping in the heat.
Figure 14: Graph of temperatures showing urban heat island effect.(from Lawrence Berkeley National Laboratory)
Meteorologists have noticed that metropolitan areas are creating their own weather patterns at night due to the collisionof cool air from the surrounding area with the warmer city air. It is important to note that urban heat islands are alocalized effect, whereas the general atmospheric greenhouse effect is global in extent.
Effects of Air Pollution
Air pollution has numerous impacts on ecosystems and human health. At an extreme is the devastation of areas likeSudbury, Canada, from acid rain and large areas of the Black Forest regions in East Germany from decades of uncheckedindustrial pollution. Human health effects include respiratory problems as well as effects on the eyes and skin. Differenteffects are associated with different concentrations of the pollutant. Although people react much more sharply to odors inthe air and early air pollution standards were set by aesthetic conditions, there are odorless but dangerous pollutantssuch as CO. Maximum allowed (or permissible) concentrations (MAC or MPC) are usually set on a citywide, regional, orstatewide basis to control air pollution. Emergency measures, such as closing industrial plants, limiting auto use, andadvising children or people with respiratory problems to remain indoors, are sometimes taken when there are dangerouspollutant levels.
Acidic oxides such as Sox and NOx cause corrosions of many materials such as metals and limestone and can causedamage to structures. Typical MAC of SO2 is about 0.3 ppm. NO2 changes vegetation. Both of these can contribute to thedevelopment of respiratory disease.
Carbon monoxide is formed by rapid burning of carbon in an environment with insufficient oxygen. CO in concentrationsof 2000 ppm causes death by interfering with the distribution of oxygen in the body. Hemoglobin is the molecule in theblood that carries O2 to all parts of the body. The CO molecule has the same overall shape as the O2 and fits into the partof the hemoglobin that normally carries O2, thus making the space unavailable for O2. The compound carboxyhemoglobincan affect the ability to track and see clearly if breathed at 30 ppm for 8 hours. At that rate of inhalation, 10% of thehemoglobin can become carboxyhemoglobin.
Ozone has a strong odor even at 0.02 ppm. it causes damage to biological tissues and to some materials like rubber.Ozone irritates the eyes and upper respiratory tract at concentrations of 0.1 ppm.
Lead, dust, soot, and other materials ejected in various processes can become airborne. Particulates in the air can alsocause health problems. Visibility is reduced when particulate concentration are high. Asthma, an in creasing problem inchildren and in populations and other respiratory problems are aggravated by inhaled particulates.

23
APPENDIX I – GREENHOUSE GASES
We noted earlier that water vapor (H2O) and carbon dioxide (CO2) are two of the major greenhouse gases. Both of thesemolecules are present on Earth naturally, their amounts having evolved to steady levels as a total effect of plant andanimal life. There are several other gases that contribute to the greenhouse effect. Most prominent among these aremethane (CH4), nitrous oxide (N2O), ozone (O3), and chlorofluorocarbons. Each gas is present in the atmosphere at adifferent concentration. In addition to knowing the concentration of the greenhouse gas, it is important to understandthat each gas has a different relative greenhouse efficiency. In other words, some gases are better at absorbing the solarradiation than others, and therefore have a greater overall impact on the greenhouse effect. As a measure of thisefficiency, greenhouse gases are often assigned a value for "Global Warming Potential" (GWP). This value is simply acomparison of the efficiency of a gas relative to CO2 over a time span of 100 years. Therefore a gas with a GWP of 20 is20 times more efficient at retaining heat than CO2 over a 100 year time period.
Another important characteristic to examine when considering the potential damage of a greenhouse gas is the averagetime they remain in the atmosphere once emitted. Policies made now that reduce industrial and other emissions ofgreenhouse gases take years to result in changes in the atmosphere and its nature. In fact, scientists have stated that nomatter how aggressively greenhouse gas emissions are restricted and reduced now, "the planet and the nation arecertain to experience more than a century of climate change, due to the long lifetime of greenhouse gases already in theatmosphere and the momentum of the climate system." (From Climate Change Impacts on the United States, CambridgeUniversity Press: 2000.)
Of all the greenhouse gases, carbon dioxide is present at the highest concentration by far. Based on 1990concentrations, carbon dioxide is said to be responsible for almost 60% of the total greenhouse effect when efficiencyand concentration are considered. Its concentration is increasing in the atmosphere due in large part to the extensiveburning of coal and other fossil fuels for energy production. Another cause of CO2 increase is the destruction of largeareas of trees that leads to a reduction in use of carbon dioxide for photosynthesis.
Methane is present in the atmosphere at less than 1% the levels of carbon dioxide, however it is 25 times more efficientas a greenhouse gas. It contributes to a little over 10% of the total greenhouse effect based on current concentrations.The primary anthropogenic sources are combustion of fossil fuel, and the decomposition of organic materials associatedwith wetlands, rice paddies, and livestock manure.
Nitrous oxide also occurs in low concentrations relative to carbon dioxide, but it is 230 times more efficient as agreenhouse gas. These factors combine to make it a 6% contributor to total the greenhouse effect. The primaryanthropogenic sources are fossil fuel combustion, fertilizers, and deforestation.
The only major greenhouse gases that are not naturally occurring are the chlorofluorocarbons. They come solely fromanthropogenic sources such as the production and/or use of foams, aerosols, refrigerants, and solvents. They are presentat an extremely low concentration in the atmosphere, however they are 15,000 times more efficient as a greenhouse gasrelative to carbon dioxide. As a result, they contribute to approximately 25% of the total greenhouse effect based on1990 concentrations.
Table 3 lists the major greenhouse gases, their emission levels and sources, and the approximate amount of time theyremain in the atmosphere once they are emitted. It also gives their approximate concentrations 100 years ago, today,and projected concentration for the year 2030. Note that concentrations are given in parts per billion (ppb), referring tothe proportion of molecules of the gas per billion molecules in the atmosphere. For example, the concentration of CO2
today is 350,000 ppb, meaning that for every billion molecules in the atmosphere, there are 350,000 molecules of CO2.

24
Gas MajorAnthropogenic
Sources
AmountReleasedper Year(millionsof tons)
Average Timein the
Atmosphere
GlobalWarmingPotential*(over 100
years)
Pre-industrialConcentration(around 1860)
(ppb)
AverageConcentration
now(ppb)
ExpectedConcentration
in 2030(ppb)
CO2 Burning ofFossil Fuels
5,500 100 years 1 290,000 350,000 500,000
CH4 Fossil FuelProduction,Rice Fields
500 10 years 21 850 1,700 2,300
N2O Fertilizers,Deforestatio,
BurningBiomass
30 days 310 .001 to 7 .001 to 50 .001 to 50
CFCs Aerosol Sprays,Refrigerants
1 60 to 100years
1500-8100
0 about 3 2.4 to 6
Table 3: Summary of greenhouse gases.

25
APPENDIX II – PREDICTING IMPACTS OF CLIMATE CHANGE
Scientists have developed several computer-run simulations, or models, that combine and express in mathematical formwhat we know about the processes that control the atmospheric and hydrologic systems. The most advanced climatemodels are called General Circulation Models, or GCM's. These models are the primary tools used by scientists to try topredict the impacts of increased greenhouse gas concentration. The strength of these models is their ability to replicateinput-response activities and relationships within complex systems that are far too elaborate for simple interpretation orlogic. They have the ability to integrate various feedback processes in order to determine their effects on overall impact,and quickly generate different scenarios under varied assumptions about human activities.
A feedback can be defined as a direct result of a given process that either magnifies (positive feedback) or diminishes(negative feedback) the total effect of that very same process. One example of a positive feedback of global warming isthe potential impact of increased concentration of water vapor in the atmosphere. As the oceans and atmosphere warm,the rate evaporation increases, causing more water vapor to accumulate in the atmosphere. As we noted earlier, watervapor is itself a greenhouse gas, causing even more heat to be trapped in the troposphere. Thus global warming ismagnified by a result of its own existence.
Another example is the possibility of melting arctic ice caps releasing large amounts of carbon into the atmosphere. Icecaps are a strong "sink" for carbon, storing the equivalent of almost one-third of the total carbon in Earth's atmosphere.As the Earth's temperature rises, and arctic permafrost and tundra melt, the carbon will be released into the atmosphere.The result is once again more heat being trapped and an even further increased global temperature.
To date, there are no known negative feedbacks resulting directly from increased greenhouse gas concentrations. Thereis, however, a negative feedback closely related to the burning of fossil fuels, particularly coal. Microscopic airborneparticles called "aerosols" exist naturally in the atmosphere, but their concentration has also shown a dramatic increasesince pre-industrial times. Sulfate aerosols (or aerosols containing sulfur and oxygen) have a known cooling influence onthe atmosphere, due to the fact that they reflect some incoming solar radiation back into space before it hits the surfaceof the Earth. Therefore, the increase in sulfate aerosols in the atmosphere could offset some of the warming resultingfrom increased greenhouse gas concentrations, but it is difficult to predict how much.
Unfortunately, there are still major areas of uncertainty that render the climate-modeling process highly complicated andfar from totally accurate. Eric J. Barron, chair of the USGCRP Forum on Global Change Modeling, writes:
"Predictions of future climate are imperfect because they are limited by significant uncertainties thatstem from: (1) the natural variability of climate; (2) our inability to predict accurately futuregreenhouse-gas and aerosol emissions; (3) the potential for unpredicted or unrecognized factors, suchas volcanic eruptions or new or unknown human influences, to perturb atmospheric conditions; and (4)our as-yet incomplete understanding of the total climate system."
--(from "Climate Models: How Reliable are Their Predictions?"Consequences, Vol. 1 No. 3, 1995.)
Continuous improvements to the bodies of knowledge in each of these areas leads to more and more accurate modelingof the global climate. Currently, scientists use several different models as cross-checks to create possible alternativescenarios of the future. For some aspects of climate (such as temperature rise and occurrence of precipitation in heavyand extreme events), virtually all climate models concur on consistent results, lending a high degree of confidence totheir accuracy. For other aspects, model results differ. For example, some models project extensive and frequent droughtin the US, while others do not. These scenarios offer differing yet plausible alternative futures, and help detect areas inwhich the models need improvement.
Predictions
Overall, the models predict that global average surface temperature will increase anywhere from 3 to 6° F in the 21stcentury, with change in the US ranging from 3 to 9° F. Scientists have used scenarios of global change to predict severalimpacts such as:
• sea level rise• shifts in population and farming centers• rise in water temperature• increase in storm frequency and severity• extensive droughts• threats to or loss of vulnerable yet valuable ecosystems (barrier islands, coastal forests, alpine meadows, coral
reefs, tropical mountain forests, and so on.)

26
Below is a list of the key findings of the National Assessment Synthesis Team regarding climate change impacts on theUS. The NAST is a committee of experts drawn from governments, universities, industry and non-governmentalorganizations (or NGO's) assembled to synthesize, evaluate and report on what is presently known about possibleimpacts of climate variability and change. Their Assessment was called for by a 1990 law, and has been conducted underthe United States Global Change Research Program. The Assessment Overview, as well as the more detailed FoundationReport, can be found at http://www.gcrio.org/NationalAssessment/index.html.
1. Increased warming Assuming continued growth in world greenhouse gas emissions, the primary climate
models used in this Assessment project that temperatures in the US will rise 5-9°F (3-5°C) on average in thenext 100 years. A wider range of outcomes is possible.
2. Differing regional impacts Climate change will vary widely across the US. Temperature increases will varysomewhat from one region to the next. Heavy and extreme precipitation events are likely to become morefrequent, yet some regions will get drier. The potential impacts of climate change will also vary widely across thenation.
3. Vulnerable ecosystems Many ecosystems are highly vulnerable to the projected rate and magnitude ofclimate change. A few, such as alpine meadows in the Rocky Mountains and some barrier islands, are likely todisappear entirely in some areas. Others, such as forests of the Southeast, are likely to experience major speciesshifts or break up into a mosaic of grasslands, woodlands, and forests. The goods and services lost through thedisappearance or fragmentation of certain ecosystems are likely to be costly or impossible to replace.
4. Widespread water concerns Water is an issue in every region, but the nature of the vulnerabilities varies.Drought is an important concern in every region. Floods and water quality are concerns in many regions.Snowpack changes are especially important in the West, Pacific Northwest, and Alaska
5. Secure food supply At the national level, the agriculture sector is likely to be able to adapt to climate change.Overall, US crop productivity is very likely to increase over the next few decades, but the gains will not beuniform across the nation. Falling prices and competitive pressures are very likely to stress some farmers, whilebenefiting consumers.
6. Near-term increase in forest growth Forest productivity is likely to increase over then next severaldecades in some areas as trees respond to higher carbon dioxide levels. Over the longer term, changes in larger-scale processes such as fire, insects, droughts, and disease will possibly decrease forest productivity. In addition,climate change is likely to cause long-term shifts in forest species, such as sugar maples moving north out of theUS.
7. Increased damage in coastal and permafrost areas Climate change and the resulting rise in sea levelare likely to exacerbate threats to buildings, roads, powerlines, and other infrastructure in climatically sensitiveplaces. For example, infrastructure damage is related to permafrost melting in Alaska, and to sea-level rise andstorm surge in low-lying coastal areas.
8. Adaptation determines health outcomes A range of negative health impacts is possible from climatechange, but adaptation is likely to help protect much of the US population. Maintaining our nation's public healthand community infrastructure, from water treatment systems to emergency shelters, will be important formminimizing the impacts of water-borne diseases, heat stress, air pollution, extreme weather events, and diseasestransmitted by insects, ticks, and rodents.
9. Other stresses magnified by climate change Climate change will very likely magnify the cumulativeimpacts of other stresses such as air and water pollution and habitat destruction due to human developmentpatterns. For some systems, such as coral reefs, the combined effects of climate change and other stresses arevery likely to exceed a critical threshold, bringing large, possibly irreversible impacts.
10. Uncertainties remain and surprises are expected Significant uncertainties remain in the science underlyingregional climate changes and their impacts. Further research would improve understanding and our ability toproject societal and ecosystem impacts, and provide the public with additional useful information about optionsfor adaptation. However, it is likely that some aspects and impacts of climate change will be totally unanticipatedas complex systems respond to ongoing climate change in unforeseeable ways.