internship report on financial performance analysis of the
TRANSCRIPT

i
©Daffodil International University
Internship Report
On
Financial Performance Analysis of the City Bank Limited-
Nawabpur Branch, Dhaka

ii
©Daffodil International University
Internship Report
On
Financial Performance Analysis of the City Bank Limited-
Nawabpur Branch, Dhaka
Submitted To
Gouranga Chandra Debnath
Associate Professor and Head
Faculty of Business and Entrepreneurship
Daffodil International University
Submitted By
Sajib Ahmed
ID: 153-11-4877
Program: Bachelor of Business Administration (BBA)
Major In Finance
Daffodil International University

iii
©Daffodil International University
Letter of Transmittal
Date: 23-07-2019
Gouranga Chandra Debnath
Associate Professor and Head
Faculty of Business & Entrepreneurship
Daffodil International University
Subject: Submission of Internship Report titled “Financial Performance Analysis of The City
Bank Limited-Nawabpur Branch, Dhaka”
Dear Sir,
It is privilege to let you know, I have finished my internship program. As an intern I have
worked the City Bank limited at Nawabpur branch last three month. During this period I have
gathered much practical and theoretical knowledge. After completed my report, now I would like
to submit this report titled ‘Financial Performance Analysis of The City Bank Limited-Nawabpur
Branch’ prepared as a part of the requirement of my BBA program.
I have thoroughly enjoyed the overall work during my internship period which is carrying vast
description of practical knowledge. This report along with all kinds of necessary information
regarding the internship is being submitted to you for your evaluation.
I sincerely hope that you will appreciate my effort.
Sincerely yours,
__________________
Sajib Ahmed
ID: 153-11-4877
Major: Finance
Faculty of Business & Entrepreneurship
Daffodil International University

iv
©Daffodil International University
Approval Letter
This is to guarantee that Sajib Ahmed, ID NO 153-11-4877, Student of Bachelor of Business
Administration (BBA), Department of Business and Entrepreneurship, Daffodil International
University, has effectively finished his doled out Internship Report on "Financial Performance
Analysis of the City Bank Limited-Nawabpur Branch, Dhaka
The Internship Report submitted on the topic, is sufficient in the terms of the quality and the
organization.
………………………………
Gouranga Chandra Debnath
Associate professor and Head
Faculty of Business &Entrepreneurship
Daffodil International University

v
©Daffodil International University
Acknowledgement
As a student of BBA Program, Internship is one of the most important partial requirements to
complete BBA degree. In this regard I would like to thank all my faculties of Daffodil
International University who helps me to finish my courses.
For the successful accomplishment of this report, first I would like to thank my Almighty. And
finally I would like to thank to my honorable supervisor for this report Associate Professor and
Head Gouranga Chandra Debnath who has always given support, effort and wise direction to
reach at the peak level of effectiveness to complete my report.
I also wish to render my grateful thanks to all senior and junior officers of The City Bank
Limited, Nawabpur branch, who helped me during my internship program at the bank. I must
mention the excellent working environment and the positive behavior of this bank, which helped
me tremendously to observe the banking activities.

vi
©Daffodil International University
Executive Summary
This report has attempted to highlight the financial performance evaluation of the CBL. The
CBL is one of the leading financial banks in the country. As an intern from business discipline, I
got the opportunity to work with this organization and tried to put my effort to make adept study.
I have tried my best to provide a clear idea about financial health of the CBL and for this I have
collected the most used financial statements- balance sheet & income statement where balance
sheet shows the financial position and income statement shows the net profit or net loss of a
bank. Ratio analysis deals with these statements.
This report contains four parts in which 1st part is for introduction, 2nd part gives an overview
about the CBL. 3rd part is the main focus of this report which is ratio analysis of the CBL. Ratio
analysis is one of the most popular methods to evaluate a bank’s performance. The other parts
contain findings from analysis, some recommendations, conclusion and references.
vii
©Daffodil International University
Table Of Contents
Chapter “One”
1.1 Introduction: .............................................................................................................................. 1
1.2 Back Ground of Study: ............................................................................................................. 1
1.3 Scope of the Study: ................................................................................................................... 1
1.4 Objective 0f the Study: ............................................................................................................. 2
1.5 Methodology of the Report: ...................................................................................................... 2
1.6 Limitation OF the Report: ......................................................................................................... 3
2.1 Overview of the City Bank Limited: ........................................................................................ 5
2.2 Organizational Structure: .......................................................................................................... 5
2.3 Mission, Vision and Core Values: ............................................................................................ 6
Vision: ............................................................................................................................................. 6
Mission:........................................................................................................................................... 6
Core Values:.................................................................................................................................... 6
3.1Financial Analysis:..................................................................................................................... 8
3.2Ratio Analysis: ........................................................................................................................... 8
3.3Balance Sheet: ............................................................................................................................ 9
3.4Common size Of Balance Sheet: ............................................................................................. 11
3.6 Common Size Analysis of Income Statement: ....................................................................... 15
1. Return on Assets: .................................................................................................................. 17
2. Return on Equity: .................................................................................................................. 18
3. Debt Ratio: ............................................................................................................................ 19
4. Equity Ratio: ......................................................................................................................... 20
5. Debt-Equity Ratio: ................................................................................................................ 21
6. Net Profit Margin: ................................................................................................................. 22
7. Equity Multiplier: .................................................................................................................. 23
8. Asset Utilization: ................................................................................................................... 24
9. Tax Management Efficiency: ................................................................................................ 25
10. Expense Control Efficiency: ............................................................................................... 26

viii
©Daffodil International University
11. Funds Management Efficiency: .......................................................................................... 27
12. Net Interest Margin: ............................................................................................................ 28
4.1 Findings from analysis: ........................................................................................................... 30
4.2 Recommendation: ................................................................................................................... 31
4.3 Conclusion: ............................................................................................................................. 32
4.4 References: .............................................................................................................................. 33

ix
©Daffodil International University
Chapter: One
Introduction
1
©Daffodil International University
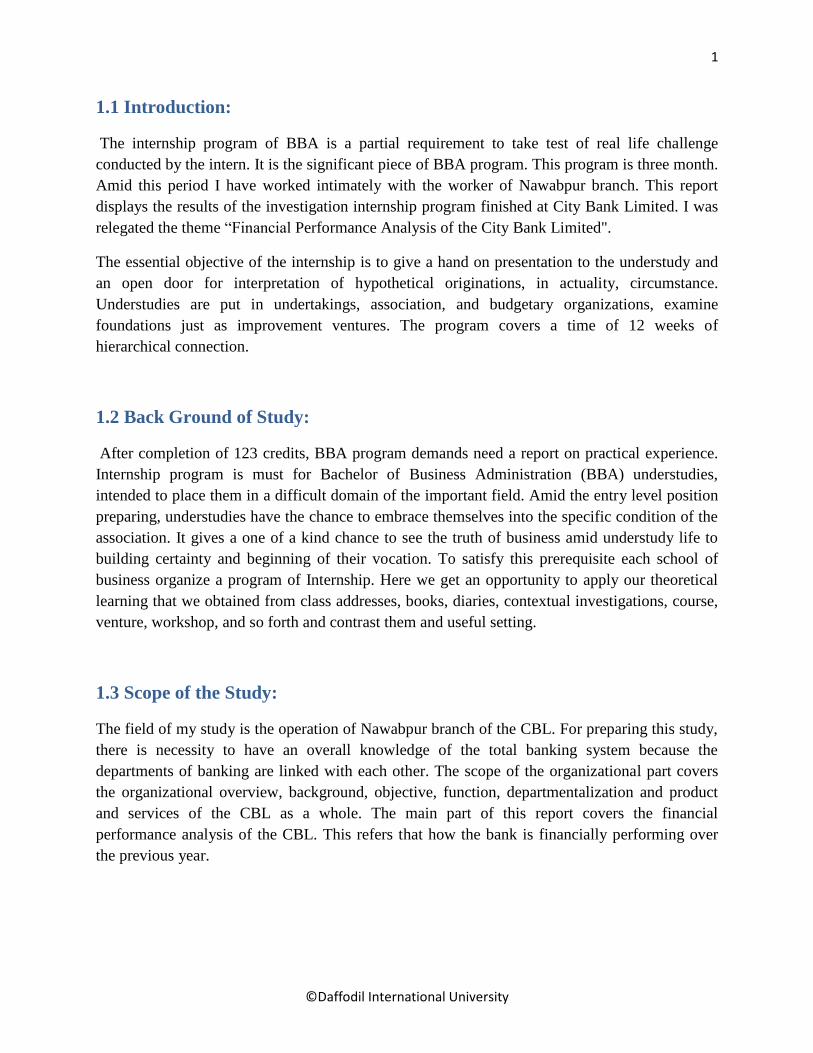
1.1 Introduction:
The internship program of BBA is a partial requirement to take test of real life challenge
conducted by the intern. It is the significant piece of BBA program. This program is three month.
Amid this period I have worked intimately with the worker of Nawabpur branch. This report
displays the results of the investigation internship program finished at City Bank Limited. I was
relegated the theme “Financial Performance Analysis of the City Bank Limited".
The essential objective of the internship is to give a hand on presentation to the understudy and
an open door for interpretation of hypothetical originations, in actuality, circumstance.
Understudies are put in undertakings, association, and budgetary organizations, examine
foundations just as improvement ventures. The program covers a time of 12 weeks of
hierarchical connection.
1.2 Back Ground of Study:
After completion of 123 credits, BBA program demands need a report on practical experience.
Internship program is must for Bachelor of Business Administration (BBA) understudies,
intended to place them in a difficult domain of the important field. Amid the entry level position
preparing, understudies have the chance to embrace themselves into the specific condition of the
association. It gives a one of a kind chance to see the truth of business amid understudy life to
building certainty and beginning of their vocation. To satisfy this prerequisite each school of
business organize a program of Internship. Here we get an opportunity to apply our theoretical
learning that we obtained from class addresses, books, diaries, contextual investigations, course,
venture, workshop, and so forth and contrast them and useful setting.
1.3 Scope of the Study:
The field of my study is the operation of Nawabpur branch of the CBL. For preparing this study,
there is necessity to have an overall knowledge of the total banking system because the
departments of banking are linked with each other. The scope of the organizational part covers
the organizational overview, background, objective, function, departmentalization and product
and services of the CBL as a whole. The main part of this report covers the financial
performance analysis of the CBL. This refers that how the bank is financially performing over
the previous year.

2
©Daffodil International University
1.4 Objective 0f the Study:
The primary objective of this report is to analyze the financial performance of the City bank
limited. And to evaluate this financial data have been collected from the City bank website and
articles.
This includes following specific objectives-
1. To know different activities of the City Bank Limited.
2. To relate theoretical knowledge with practical experience in several functions of the
City Bank limited.
3. To analyze the financial performance of the bank.
4. To find out problems and suggesting recommendations for improvement.
1.5 Methodology of the Report:
Total methodology of report has divided into two major parts.
1. Primary Data
2. Secondary Data
1. Primary Data:
1. Conversation about the banking activities with the officers , staffs and supervisor of the
bank
2. Conversation with customer.
3. Personal investigation with bankers.
3
©Daffodil International University
2. Secondary Data:
1. Annual report of The City Bank Limited 2013-2017
2. City Bank Web sites.
3. Official records files and documents.
4. Periodicals Published by Bangladesh bank.
5. Books and journals.
1.6 Limitation OF the Report:
1. The banking policy did not support to collect all type of data and information.
2. Lack of secondary source of data was not enough to complete the report.
3. In many cases the bank are not helpful to provide internal information.
4. In the duration of three months internship program, I didn’t get enough time to
understand properly each department’s activities.

4
©Daffodil International University
Chapter: Two
Organizational Profile

5
©Daffodil International University
2.1Overview of the City Bank Limited:
The CBL is the first private sector bank in Bangladesh. The bank has been operating since
1983with an authorized capital of Tk. 1.75 Billion under the entrepreneurship of twelve
prominent &leading businessman of the country. The CBL in progress its adventure on 27th
March 1983 through opening its first branch at B. B. Road Branch in the capital, Dhaka city. It
was the far-located enterprise of around 13 neighborhood businesspeople who conquered the
gigantic stresses and dangers with mettle and premium that made the foundation and forward
walk of the bank conceivable. Those support chiefs began the adventure with just Taka 3.4 core
worth of Capital, which currently is a decent Taka 2311.78 core as capital and hold. The vertical
aim behind beginning this Bank was to realize subjective adjustments in the extent of Banking
and Financial administration. Today The City Bank serves its clients at home and abroad with 88
branches spread over the nation and around three hundred abroad correspondences covering all
the real urban areas and business focal point of the world. The CBL by and by has 99 online
branches and 1 SME administration focuses also, 11 SME/Agra branch course of action over the
length and broadness of the nation that contains a well-constructed Islamic Banking branch.
Further these conventional conveyance focuses, the bank is additionally very dynamic in the
elective conveyance region. It at present has 294 ATMs of its own; and ATM assignment game
plan with an accomplice bank that has in excess of 1150 ATMs set up; SMS Banking;
Enthusiasm Banking, etc. CBL is currently begun its Customer Call Center task. The CBL has an
arrangement to close the present year with 200 individual ATMs.
2.2Organizational Structure:
The City Bank Ltd. is among the very few local banks which do not track the traditional,
decentralized, geographically coped, branch-based business profit model. In its place, the bank
manages its business and operation sharply from the head office through the five separate units
specifically:
1. Business Unit
2. Branch Banking
3. Risk Unit
4. Operations Unit
5. Support

6
©Daffodil International University
The City Bank is subject for all exercises partner the providing of the fresh cards, involving
charging and bookkeeping, client administration, credit supervision and charge endorsements
along with marketing the cards in Bangladesh. The City Bank likewise presented selective
benefits for the card individuals underneath the American Express chooses program in
Bangladesh. The CBL similarly bargains exceptional favorable circumstances everywhere
throughout the world with in excess of 13,000 ideas at over 10,000 dealers in 75 nations. The
CBL previously presented ongoing web, web banking framework I-managing an account with all
up-to date conveyance systems. For essential execution, the bank has gotten national and
universal acknowledgment. The Bank was one of the twelve banks of Bangladesh among the five
hundreds (500) Banks in Asia for its advantage, stores and benefit as evaluated by ASIA WEEK.
In 2000, The City Bank got "Top Ten Company Award" from the respectable Prime Minister of
Bangladesh.
2.3 Mission, Vision and Core Values:
Vision:
To be the leading bank in the country with best practices and highest social commitment.
Mission:
• To contribute to the socioeconomic development
• To attain highest level of customer satisfaction through extension of services by
dedicated
• A motivated team of professionals.
• To maintain continuous growth of market share ensuring Quality
• To maximize bank’s profits by ensuring its steady growth
• To ensure participative management system and empowerment of Human Resources.
• To nurture an enabling environment where innovativeness and performance is rewarded.
Core Values:
• Result Driven
• Accountable & Transparent
• Courageous & Respectful
• Engaged & Inspired
7
©Daffodil International University
Chapter: Three
Financial Analysis of the City Bank Limited

8
©Daffodil International University
3.1Financial Analysis: Financial analysis is structural and logical analysis and systematic way to present overall
financial performance of a financial institution. It’s also help to evaluate and decision making for
better business operation. In financial analysis process ratio analysis is the most dominant and
rational structure to help business related stakeholder. Under the financial ratio analysis process
there are profitability liquidity, assets management and solvency ratio analysis. So business
stakeholders try to concentrate to get overall business overview from this analysis. These ratios
not only help to decision making process also emphasis on risk avoiding and profit raising
related factors. To calculate this ratio need to take quantities data from bank trading activity and
other sources. Financial statement analysis involves a comparison of a firm’s performance with
that of other firm in the same line of business, which usually is identified by the firm industry
classification.
3.2Ratio Analysis:
Ratio analysis is a tool to diagnose helps to figure out problem areas and opportunities within a financial
institution. Ratio analysis is very essential for every business, because by calculating ratio analysis we can
have a bird’s eye view of the business position. Business strength and weakness by knowing this
information, management can take its necessary steps to organize their goal.
I have analyzed the performance of the City Bank Limited through.
1. Return on Assets
2. Return on Equity
3. Debt Ratio
4. Equity Ratio
5. Debt TO Equity Ratio
6. Net Profit Margin
7. Equity Multiplier
8. Assets Utilization
9. Tax management Efficiency
10. Expense Control Efficiency
11. Funds Management Efficiency
12. Net Interest Margin

9
©Daffodil International University
3.3Balance Sheet: Year 2014 2015 2016 2017 2018
Property & Assets
Cash 10,422,412,502 10,928,555,074 15,437,617,332 24,484,298,511 23,787,103,908
In hand 3,140,947,220 2,497,043,107 2,998,982,425 3,788,022,776 4,447,800,960
Balance with Bangladesh bank
7,281,465,282 8,431,511,967 12,438,634,907 20,696,275,735 19,339,302,948
Balance With Other Bank & FI
3,663,583,361 5,191,461,946 15,915,975,258 14,085,672,503 13,693,645,550
In Bangladesh 3,263,726,466 3,632,420,929 15,502,528,823 13,180,057,080 12,704,276,112
Outside Bangladesh
399,856,895 1,559,041,017 413,446,435 905,615,423 989,369,438
Money At Call 3,956,729,167 1,998,379,167 95,379,167 91,379,167 89,379,167
Investment 27,650,110,861 30,427,381,815 2,656,187,336 27,896,112,618 31,931,554,373
Government 21,985,302,692 23,737,817,554 19,691,517,972 22,048,912,713 22,099,527,532
Others 5,664,808,169 6,689,564,261 6,325,444,956 5,847,199,905 9,832,026,841
Loans & Advances
90,867,649,445 116,489,737,058 143,014,672,164 176,046,221,342 197,072,832,915
General Loans 86,008,995,489 111,476,616,174 138,156,604,652 168,770,828,388 192,350,678,263
BillsPurchase
d& Discounts 4,858,653,956 5,013,120,884 4,858,067,512 7,275,392,955 4,722,154,652
Fixed Assets 6,851,347,927 8,144,060,566 8,172,221,437 3,470,156,210 3,642,729,555
Other Asset 3,765,101,345 3,360,953,081 4,759,716,534 7,723,972,014 6,968,167,092
Non-Banking Assets
382,622,964 384,551,746 792,824,667 956,925,360 881,668,179
Total Assets 147,559,557,572 176,540,528,707 214,205,369,487 254,754,737,726 278,067,080,739
Liabilities & Capital
10,422,412,502 10,928,555,074 15,437,617,332 24,484,298,511 23,787,103,908
Bond 3,140,947,220 2,497,043,107 2,998,982,425 3,788,022,776 4,447,800,960
Borrowing From Other Banks, FI & Agents
7,281,465,282 8,431,511,967 12,438,634,907 20,696,275,735 19,339,302,948
Current Deposit
3,663,583,361 5,191,461,946 15,915,975,258 14,085,672,503 13,693,645,550
Bills Payable 3,263,726,466 3,632,420,929 15,502,528,823 13,180,057,080 12,704,276,112
Cost Free Deposit
399,856,895 1,559,041,017 413,446,435 905,615,423 989,369,438
Cost Bearing Deposit
3,956,729,167 1,998,379,167 95,379,167 91,379,167 89,379,167
Total Deposit 27,650,110,861 30,427,381,815 2,656,187,336 27,896,112,618 31,931,554,373

10
©Daffodil International University
Other Liabilities
21,985,302,692 23,737,817,554 19,691,517,972 22,048,912,713 22,099,527,532
Total Liabilities 5,664,808,169 6,689,564,261 6,325,444,956 5,847,199,905 9,832,026,841
Paid Up Capital
90,867,649,445 116,489,737,058 143,014,672,164 176,046,221,342 197,072,832,915
Statutory Reserve
86,008,995,489 111,476,616,174 138,156,604,652 168,770,828,388 192,350,678,263
Share Premium
4,858,653,956 5,013,120,884 4,858,067,512 7,275,392,955 4,722,154,652
Dividend Equalization Reserve
6,851,347,927.00
8,144,060,566.00 8,172,221,437.00 3,470,156,210.00 3,642,729,555
Other Reserve 3,765,101,345 3,360,953,081 4,759,716,534 7,723,972,014 6,968,167,092
Surplus In Profit & Loss Account
382,622,964 384,551,746 792,824,667 956,925,360 881,668,179
Equity 147,559,557,572 176,540,528,707 214,205,369,487 254,754,737,726 278,067,080,739
Minority Interest
10,422,412,502 10,928,555,074 15,437,617,332 24,484,298,511 23,787,103,908
Total Equity 3,140,947,220 2,497,043,107 2,998,982,425 3,788,022,776 4,447,800,960
Total Liability & Shareholders’ Equity
7,281,465,282 8,431,511,967 12,438,634,907 20,696,275,735 19,339,302,948

11
©Daffodil International University
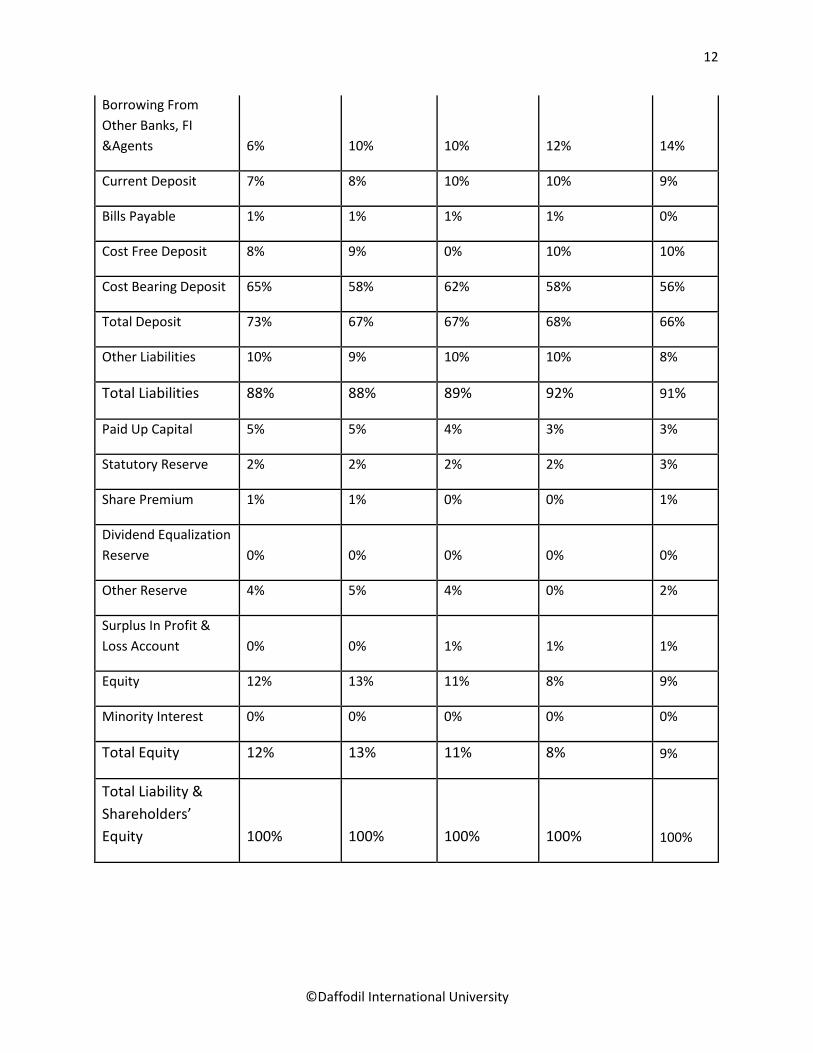
3.4Common size Of Balance Sheet: Year 2014 2015 2016 2017 2018
Property & Assets
Cash 7% 6% 7% 10% 9%
In Hand 2% 1% 1% 1% 2%
Balance With
Bangladesh Bank 5% 5% 6% 8% 7%
Balance With Other
Bank &FI 2% 3% 7% 6% 5%
In Bangladesh 2% 2% 7% 5% 5%
Outside Bangladesh 0% 1% 0% 0% 0%
Money At Call 3% 1% 0% 0% 0%
Investment 19% 17% 12% 11% 11%
Government 15% 13% 9% 9% 8%
Others 4% 4% 3% 2% 4%
Loans & Advances 62% 66% 67% 69% 71%
General Loans 58% 63% 64% 66% 69%
Bills Purchased &
Discounts 3% 3% 2% 3% 2%
Fixed Assets 5% 5% 4% 1% 1%
Other Asset 3% 2% 2% 3% 3%
Non-Banking Assets 0.26% 0.22% 0.37% 0.38% 0.32%
Total Assets 100% 100% 100% 100% 100%
Liabilities & Capital
Bond 0% 2% 1% 1% 3%
12
©Daffodil International University
Borrowing From
Other Banks, FI
&Agents 6% 10% 10% 12% 14%
Current Deposit 7% 8% 10% 10% 9%
Bills Payable 1% 1% 1% 1% 0%
Cost Free Deposit 8% 9% 0% 10% 10%
Cost Bearing Deposit 65% 58% 62% 58% 56%
Total Deposit 73% 67% 67% 68% 66%
Other Liabilities 10% 9% 10% 10% 8%
Total Liabilities 88% 88% 89% 92% 91%
Paid Up Capital 5% 5% 4% 3% 3%
Statutory Reserve 2% 2% 2% 2% 3%
Share Premium 1% 1% 0% 0% 1%
Dividend Equalization
Reserve 0% 0% 0% 0% 0%
Other Reserve 4% 5% 4% 0% 2%
Surplus In Profit &
Loss Account 0% 0% 1% 1% 1%
Equity 12% 13% 11% 8% 9%
Minority Interest 0% 0% 0% 0% 0%
Total Equity 12% 13% 11% 8% 9%
Total Liability &
Shareholders’
Equity 100% 100% 100% 100% 100%
13
©Daffodil International University
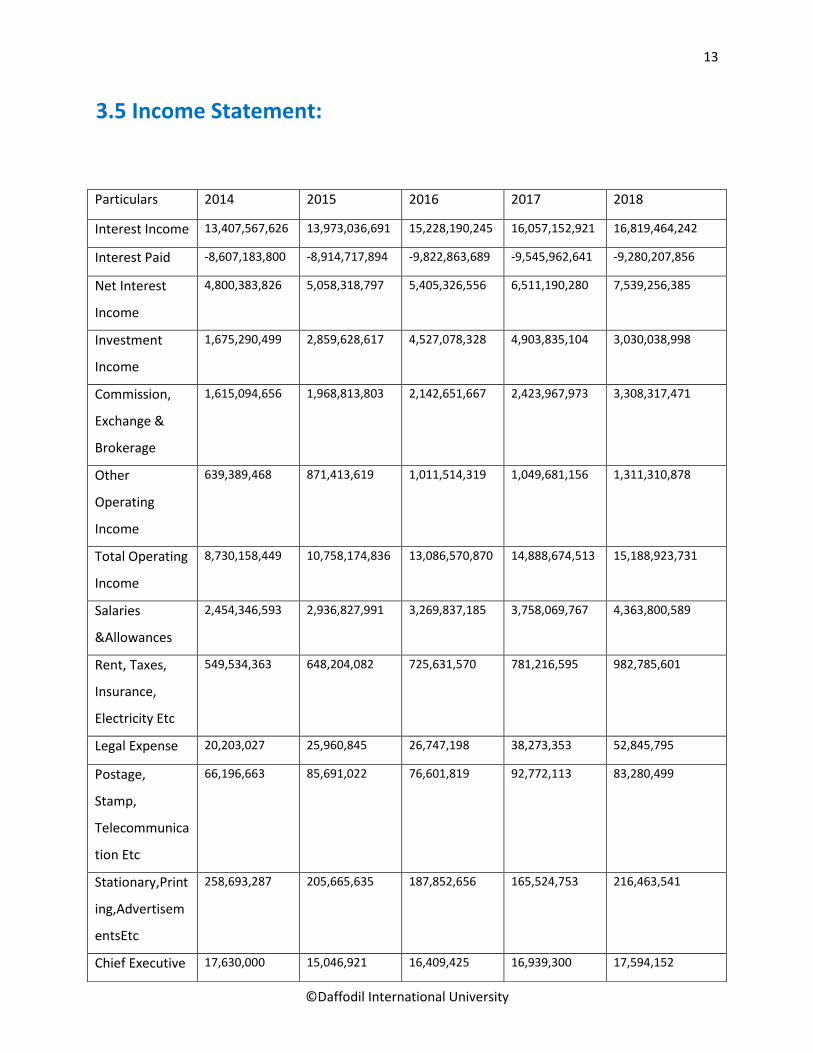
3.5 Income Statement:
Particulars 2014 2015 2016 2017 2018
Interest Income 13,407,567,626 13,973,036,691 15,228,190,245 16,057,152,921 16,819,464,242
Interest Paid -8,607,183,800 -8,914,717,894 -9,822,863,689 -9,545,962,641 -9,280,207,856
Net Interest
Income
4,800,383,826 5,058,318,797 5,405,326,556 6,511,190,280 7,539,256,385
Investment
Income
1,675,290,499 2,859,628,617 4,527,078,328 4,903,835,104 3,030,038,998
Commission,
Exchange &
Brokerage
1,615,094,656 1,968,813,803 2,142,651,667 2,423,967,973 3,308,317,471
Other
Operating
Income
639,389,468 871,413,619 1,011,514,319 1,049,681,156 1,311,310,878
Total Operating
Income
8,730,158,449 10,758,174,836 13,086,570,870 14,888,674,513 15,188,923,731
Salaries
&Allowances
2,454,346,593 2,936,827,991 3,269,837,185 3,758,069,767 4,363,800,589
Rent, Taxes,
Insurance,
Electricity Etc
549,534,363 648,204,082 725,631,570 781,216,595 982,785,601
Legal Expense 20,203,027 25,960,845 26,747,198 38,273,353 52,845,795
Postage,
Stamp,
Telecommunica
tion Etc
66,196,663 85,691,022 76,601,819 92,772,113 83,280,499
Stationary,Print
ing,Advertisem
entsEtc
258,693,287 205,665,635 187,852,656 165,524,753 216,463,541
Chief Executive 17,630,000 15,046,921 16,409,425 16,939,300 17,594,152
14
©Daffodil International University
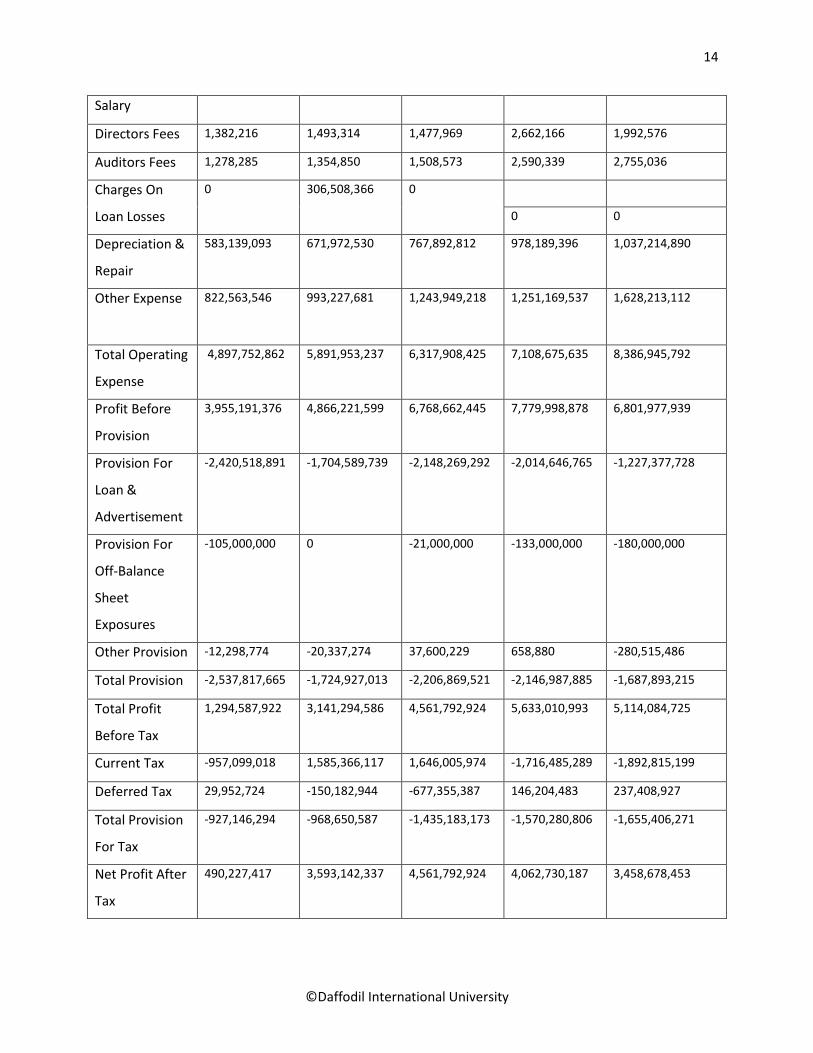
Salary
Directors Fees 1,382,216 1,493,314 1,477,969 2,662,166 1,992,576
Auditors Fees 1,278,285 1,354,850 1,508,573 2,590,339 2,755,036
Charges On
Loan Losses
0 306,508,366 0
0 0
Depreciation &
Repair
583,139,093 671,972,530 767,892,812 978,189,396 1,037,214,890
Other Expense 822,563,546 993,227,681 1,243,949,218 1,251,169,537 1,628,213,112
Total Operating
Expense
4,897,752,862 5,891,953,237 6,317,908,425 7,108,675,635 8,386,945,792
Profit Before
Provision
3,955,191,376 4,866,221,599 6,768,662,445 7,779,998,878 6,801,977,939
Provision For
Loan &
Advertisement
-2,420,518,891 -1,704,589,739 -2,148,269,292 -2,014,646,765 -1,227,377,728
Provision For
Off-Balance
Sheet
Exposures
-105,000,000 0 -21,000,000 -133,000,000 -180,000,000
Other Provision -12,298,774 -20,337,274 37,600,229 658,880 -280,515,486
Total Provision -2,537,817,665 -1,724,927,013 -2,206,869,521 -2,146,987,885 -1,687,893,215
Total Profit
Before Tax
1,294,587,922 3,141,294,586 4,561,792,924 5,633,010,993 5,114,084,725
Current Tax -957,099,018 1,585,366,117 1,646,005,974 -1,716,485,289 -1,892,815,199
Deferred Tax 29,952,724 -150,182,944 -677,355,387 146,204,483 237,408,927
Total Provision
For Tax
-927,146,294 -968,650,587 -1,435,183,173 -1,570,280,806 -1,655,406,271
Net Profit After
Tax
490,227,417 3,593,142,337 4,561,792,924 4,062,730,187 3,458,678,453
15
©Daffodil International University
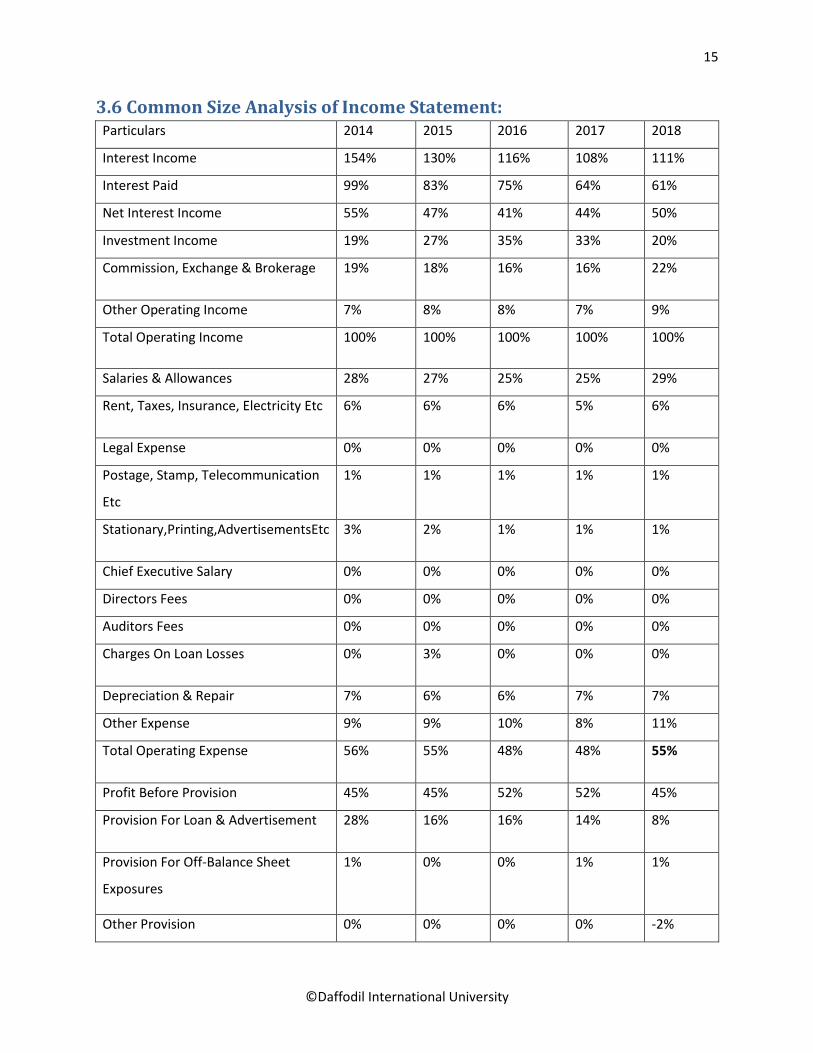
3.6 Common Size Analysis of Income Statement: Particulars 2014 2015 2016 2017 2018
Interest Income 154% 130% 116% 108% 111%
Interest Paid 99% 83% 75% 64% 61%
Net Interest Income 55% 47% 41% 44% 50%
Investment Income 19% 27% 35% 33% 20%
Commission, Exchange & Brokerage 19% 18% 16% 16% 22%
Other Operating Income 7% 8% 8% 7% 9%
Total Operating Income 100% 100% 100% 100% 100%
Salaries & Allowances 28% 27% 25% 25% 29%
Rent, Taxes, Insurance, Electricity Etc 6% 6% 6% 5% 6%
Legal Expense 0% 0% 0% 0% 0%
Postage, Stamp, Telecommunication
Etc
1% 1% 1% 1% 1%
Stationary,Printing,AdvertisementsEtc 3% 2% 1% 1% 1%
Chief Executive Salary 0% 0% 0% 0% 0%
Directors Fees 0% 0% 0% 0% 0%
Auditors Fees 0% 0% 0% 0% 0%
Charges On Loan Losses 0% 3% 0% 0% 0%
Depreciation & Repair 7% 6% 6% 7% 7%
Other Expense 9% 9% 10% 8% 11%
Total Operating Expense 56% 55% 48% 48% 55%
Profit Before Provision 45% 45% 52% 52% 45%
Provision For Loan & Advertisement 28% 16% 16% 14% 8%
Provision For Off-Balance Sheet
Exposures
1% 0% 0% 1% 1%
Other Provision 0% 0% 0% 0% -2%

16
©Daffodil International University
Total Provision 29% 16% 17% 14% 11%
Total Profit Before Tax 15% 29% 35% 38% 34%
Current Tax 11% 15% 13% 12% 12%
Deferred Tax 0% 1% 5% 1% 2%
Total Provision For Tax 11% 9% 11% 11% 11%
Net Profit After Tax 6% 33% 35% 27% 23%
17
©Daffodil International University
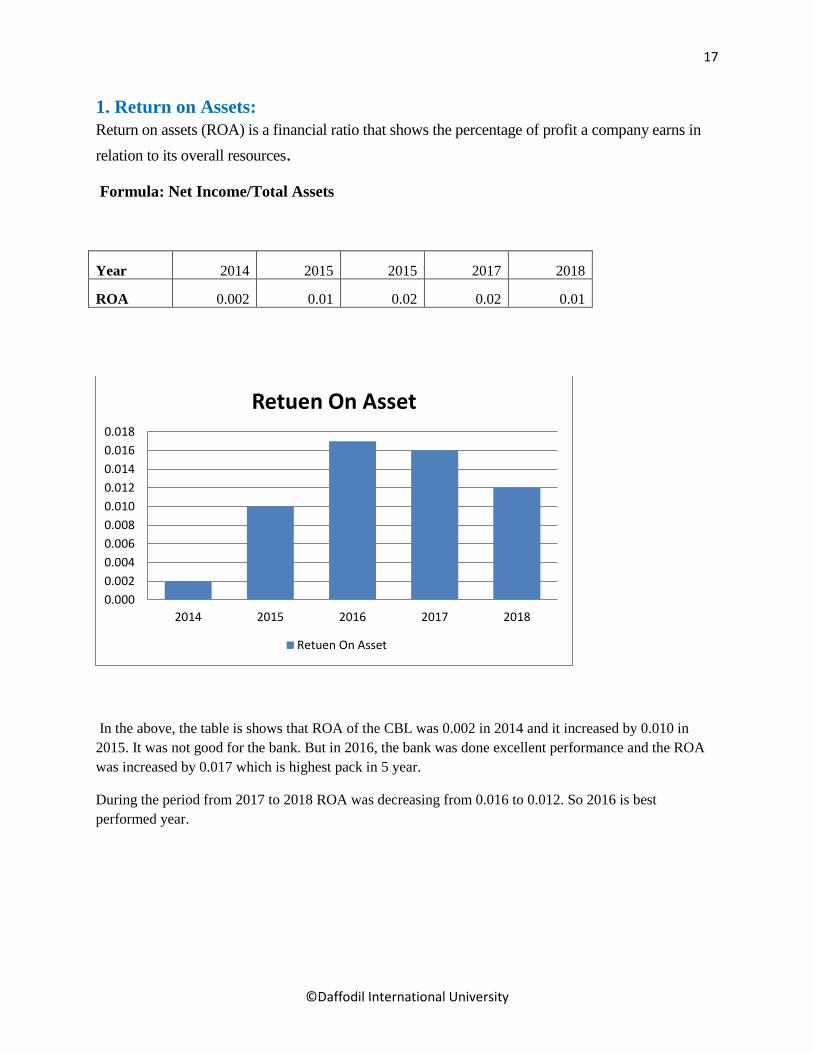
1. Return on Assets:
Return on assets (ROA) is a financial ratio that shows the percentage of profit a company earns in
relation to its overall resources.
Formula: Net Income/Total Assets
Year 2014 2015 2015 2017 2018
ROA 0.002 0.01 0.02 0.02 0.01
In the above, the table is shows that ROA of the CBL was 0.002 in 2014 and it increased by 0.010 in
2015. It was not good for the bank. But in 2016, the bank was done excellent performance and the ROA
was increased by 0.017 which is highest pack in 5 year.
During the period from 2017 to 2018 ROA was decreasing from 0.016 to 0.012. So 2016 is best
performed year.
0.000
0.002
0.004
0.006
0.008
0.010
0.012
0.014
0.016
0.018
2014 2015 2016 2017 2018
Retuen On Asset
Retuen On Asset

18
©Daffodil International University
2. Return on Equity:
This ratio is a profitability ratio that indicates the ability of a firm to generate profits with the
money that shareholders have invested.
Formula: Net Income / Stockholders' Equity
Year 2014 2015 2016 2017 2018
ROE 0.02 0.076 0.146 0.205 0.132
From the table and figure we see that return on stockholders’ equity of the CBL was 0.020 in
2014. In 2015 the rate was increased by 0.076. But in 2016 the bank was doing well and the rate
was increased. During the period of 2017 the bank was outperformed and achieved the
percentage of 0.205 in ROE but it was decreased in 2018 (0.132).
0
0.05
0.1
0.15
0.2
0.25
2014 2015 2016 2017 2018
Return On Equity
Return On Equity

19
©Daffodil International University
3. Debt Ratio:
It is a financial ratio that indicates the extent of a bank’s leverage. A higher ratio indicates that
the bank is more leverage.
Formula: Total Liabilities / Total Assets
Year 2014 2015 2016 2017 2018
Debt Ratio 0.877 0.876 0.885 0.922 0.906
From the table and figure we see that in 2014 the CBL’s debt ratio was 0.877.In 2015 it was
slightly decreased in 0.876. In 2016 and 2017 the ratio was increased from0.885 to 0.922.The
debt ratio of the CBL again decreased in 2018 to 0.906 it is good for the bank and indicates that
the bank is more leverage than other banks.
.
0.85
0.86
0.87
0.88
0.89
0.9
0.91
0.92
0.93
2014 2015 2016 2017 2018
Debt Ratio
Debt Ratio

20
©Daffodil International University
4. Equity Ratio:
Equity ratio is a solvency ratio. It can measure the amount of assets that are financed by equity of
a bank.
Formula: Total Equity / Total Assets
Year 2014 2015 2016 2017 2018
Equity Ratio 0.123 0.126 0.115 0.078 0.094
In the CBL, during the period 2014 & 2015 the figures are increasing from 0.123 to 0.126. After
the year 2015 the equity ratio of the CBL was continuously decreasing from the years 2016 to
2017. In 2016 the equity ratio was decreased by 0.115 but. In 2017 the ratio was again decreased.
During the year 2018, the equity ratio was increased by 0.094. So comparing with 2014-2018
fiscal year we can say that 2015 was well position.
0
0.02
0.04
0.06
0.08
0.1
0.12
0.14
2014 2015 2016 2017 2018
Equity Ratio
Equity Ratio

21
©Daffodil International University
5. Debt-Equity Ratio:
Debt-equity ratio is a financial ratio indicates the relative proportion of equity and debt used to
finance a company’s debt.
Formula: Total Liabilities / Total Equity
Year 2014 2015 2016 2017 2018
Debt To Equity Ratio 7.11 6.93 7.713 11.83 9.622
In the above from table and figure, we see that during the period of 2014-2018, the debt-equity
ratio of the CBL remains among 7% to 9%. In 2013 the ratio was 7.110. During the years from
2015 to 2017 the rate was increasing continuously from 6.930 to 11.830. In 2018 the ratio was
increased by 9.622.
0
2
4
6
8
10
12
14
2014 2015 2016 2017 2018
Debt To Equity Ratio
Debt To Equity Ratio

22
©Daffodil International University
6. Net Profit Margin:
Net profit margin ratio represents how much profit generates from each dollar of sales. This ratio
is the true indicator of a bank’s financial health. By calculating this ratio, one can understand
how efficiently a bank’s financially perform.
Formula: Net Income after Taxes/Total Operating Revenues
Year 2014 2015 2016 2017 2018
Net Profit Margin 0.042 0.159 0.275 0.273 0.228
This ratio is increasing from 2014 to 2018. In 2014 the net profit margin of the CBL was
0.042.In 2015 the ratio increased. In 2016 the ratio increased and became highest net profit
margin According to the CBL’s net profit margin, we can say that that bank is performing well in
0.275. In 2017 the ratio was 0.273 and 2018 was 0.0228. In last year, it is decreasing. So 2018 is
best profit margin CBL.
0
0.05
0.1
0.15
0.2
0.25
0.3
2014 2015 2016 2017 2018
Net Profit Margin
Net Profit Margin

23
©Daffodil International University
7. Equity Multiplier:
To determine a company’s financial leverage, equity multiplier is a straightforward ratio for this
purpose. A higher equity multiplier indicates that a larger portion of asset financing is attributed
to debt.
Formula: Total asset/ Stockholders Equity
Year 2014 2015 2016 2017 2018
Equity Multiplier 8.11 7.913 8.713 12.83 10.622
From the year 2014 to 2015 the ratio was decreasing from 8.110 to 7.913, in 2015 it was increase
in8.713, and again from 2017 to 2018 the ratio was decreasing from 12.830 to 10.622. So here
the scenario indicates that the bank trying to maintain lower equity multiplier.
0
2
4
6
8
10
12
14
2014 2015 2015 2017 2018
Equity Multiplier
Equity Multiplier

24
©Daffodil International University
8. Asset Utilization:
Asset utilization ratio determines total revenue earned relative to its total assets. It is an indicator
to identify the efficiency of a company’s assets to generate revenue.
Formula: Total revenues/Total Assets Operating
Year 2014 2015 2016 2017 2018
Asset Utilization 0.059 0.061 0.061 0.058 0.055
In above the table & figure shows the CBL is outperformed in every year from 2014 to 2018. In
2014 the ratio was 0.059.In 2015 the ratio increased in 0.061. In 2016 the ratio remains same as
2015 .In 2017 the ratio was decreased to 0.058. In last year, it was again decreasing to 0.055.
So we can see that the CBL’s asset utilization ratio was decreasing from 2016 to 2018.
0.052
0.054
0.056
0.058
0.06
0.062
2014 2015 2016 2017 2018
Assest Utilization
Assest Utilization

25
©Daffodil International University
9. Tax Management Efficiency:
This ratio indicates the percentage of a fund’s earnings is spent to taxation. Funds that lose little
for taxes have a high ratio.
Formula: Net income after Taxes/Net Income before Taxes & Security Gains or Losses
Year 2014 2015 2016 2017 2018
Tax Management Efficiency 0.096 0.351 0.788 0.721 0.676
In 2014 the ratio was 0.096 and 2015 the ratio was increased very high to 0.351, 2016 it increased by
0.788. In 2016 achieved high ratio. And 2017 decrease 0.721 In 2018 the ratio decreased in 0.676 .So we
can say that though there are exist high ratios in the CBL’s graph 2015 and it is highly tax payable year.
0
0.1
0.2
0.3
0.4
0.5
0.6
0.7
0.8
0.9
2014 2015 2016 2017 2018
Tax Management Efficiency
Tax Management Efficiency

26
©Daffodil International University
10. Expense Control Efficiency:
Formula: Net Income before Taxes & Security Gains (or Losses)/Total Operating revenue
Year 2014 2015 2016 2017 2018
Expense Control Efficiency 0.439 0.452 0.349 0.378 0.339
From the table we see that, it 2014 the CBL’s expense control efficiency ratio was 0.439. In 2015
the ratio increased slightly to 0.452. In 2016, both the ratios were decreased but the CBL’s
expense control in 2017 the CBL’s ratio was 0.378 and 2018 was 0.339. The lower the ratio the
better a bank’s perform. So 2018 year is expense control than other year.
0
0.1
0.2
0.3
0.4
0.5
2014 2015 2016 2017 2018
Expense Control Efficiency :
Expense Control Efficiency :

27
©Daffodil International University
11. Funds Management Efficiency:
Formula: Total Assets /Total Equity Capital Account
Funds management Efficiency 2014 2015 2016 2017 2018
Year 8.11 7.913 8.713 12.83 10.662
In case of funds management efficiency, the CBL is not in a good situation. In 2014-2015, the
ratio was decreased. In the year 2016 it was increase to 8.713. In 2017 was 12.830 is higher than
the other year. In 2018 again the bank failed to manage its funds properly compare to other
banks because the CBL’s ratio was decreased from 2017to 10.662. So in this graph 2017 is
efficient year for fund management.
0
2
4
6
8
10
12
14
2014 2015 2016 2017 2018
Funds management Efficiency
Funds management Efficiency

28
©Daffodil International University
12. Net Interest Margin:
Net interest margin is an indicator to measure that how successfully a bank invest its funds and
compare with the expenses that a bank occur on the same investment. A positive net interest
margin describe that the bank make the investment efficiently.
Formula: Interest Income from Loans & Security Investments-Interest expense on Deposits
on other Debt issued/Total assets
Year 2014 2015 2016 2017 2018
Net Interest Margin 0.033 0.029 0.025 0.026 0.027
From the above table and figure we can see that in 2014 the CBL’s net interest margin was
0.033and in 2015 it was decreased in 0.029.In 2016 the ratio was again decreased by 0.025.But it
was increased in 2017 and 2018 from 0.026 to 0.027 which is good.
.
0
0.005
0.01
0.015
0.02
0.025
0.03
0.035
2014 2015 2016 2017 2018
Net Interest Margin
Net Interest Margin

29
©Daffodil International University
Chapter: 4
Findings, Recommendations, Conclusion & References

30
©Daffodil International University
4.1 Findings from analysis:
• Return on asset (ROA) shows the effectiveness of the management of the financial
institution.CBL ROA upward. This refers that CBL has increased its efficiency from
2014 to 2018.
• A raising ROE suggests that a company is increasing its ability to generate profit without
as much capital, ROE of the bank in the year 2014 is least compared of others years. That
indicates sudden unstable position of the bank.
• Debt ratio is measures a financial leverage and lower ratio is more favorable. In year
2015 CBL was usually implies a more stable business with the potential of long early
than other years.
• A higher Equity ratio generally indicates less risk and greater financial strength. So, In
the Year 2015, the CBL was less risk and greater financial Strength than other years.
• Net profit margin indicates how much net income a company. A higher net profit margin
means that a company is more efficient at converting sales into actual profit. In the year
2016 the CBL was net profit margin is more efficient than other years.
• Higher equity multiplier means higher risk of insolvency. So in the year 2015 the CBL
was inefficacy in creating value for shareholders between other years.
• Expense Control Efficiency its measures the speed at which any bank is able to turn asset
into operating revenues. So in the year 2015 the CBL was more expense control
efficiency and speed to turn assets into operating revenues.
• Net interest margin positive figure indicates that the investment decision was successful
and the fund manager or the company was profitable. So in the year 2014 was more
successful and profitable year better than other years.
• Assets utilization ratio is identify the efficiency of company assets to generate revenue.
So 2015 and 2016 year more asset utilization to other years.
• Tax management Efficiency higher value is satisfactory. So in the year 2016 the CBL
was higher tax management efficiency than other years.
31
©Daffodil International University
4.2 Recommendation:
In this competitive market, the CBL must be conscious about the exclusivity and uniqueness
opportunity of the banking sector. The bank needs to give more focus to the customers as the
customers have more choice to choose. There are enormous organizations that are giving
heavenly client administration to the clients. To guarantee this kind of client administration, the
CBL needs legitimate data framework. To give right administrations client criticism is much
significant. It can make an incentive to expand faithfulness, trust and fulfillment of clients and
can fabricate a solid connection with them. The CBL needs to find a way to guarantee a smooth
support of the clients.
• The CBL needs to improve ROA, ROE, asset utilization and also some other ratios. In
2018 the bank cannot properly operate its operations. The bank cannot properly utilize its
assets and its shareholders equity to make profit. That’s why net profit decreased in 2018.
• Debt to equity ratio is also increasing so CBL should keep stable and maintain them
properly meet up the debt in time.
• Return on equity of CBL showed a fall in 2016, So CBL showed try to not repeat that
mistakes made in that years.
• Net operating margin has increased compared to the previous years of CBL. This is quite
satisfactory.
• In 2014 CBL net profit margin was too less than other years. So increasing net profit
margin CBL introduces some new product which again increases their net profit.
• From 2014 there was lower growth in compare to other years, it indicates that CBL has
no consistency in growth over the year .CBL should ensure a better growth over year to
reach a strong position.
• CBL should increase their finance on different projects to achieve more clients.
• CBL should decrease interest rate on loans to attract customer’s attention to take loan.

32
©Daffodil International University
4.3 Conclusion: In last few years, there are established lots of commercial banks in Bangladesh. So that today
there are tough competitions in the banking sectors and the banks are more focus on doing
outstanding performance, so modern people are now wanted a more secured, high quality and
timely service.
So now the CBL needs to arrange their activities all the more astutely and do their tasks and
administrations as indicated by the market needs. Banking divisions are ending up increasingly
aggressive and to get by in the market banks need to productively work their activities by
proficiently dealing with its advantages and liabilities. In a year ago, the CBL did not
proficiently deal with its advantages and reserves and couldn't make benefit sufficient. So the
supervisory crew of the CBL should give center around that.

33
©Daffodil International University
4.4 References:
• City Bank Annual Report 2014-2018
• https://www.thecitybank.com/home
• Definitions : Wikipedia.com
• Definitions : Investopedia.com
• https://www.thecitybank.com/retail_banking.php