internship report - 9er online9eronline.com/library/49er performance enhancement report by...
TRANSCRIPT

INTERNSHIP REPORT49er performance enhancement
CONFIDENTIAL
MEC 594 : Aérodynamique et Hydrodynamique
Directeurs d'option : Carlo Cossu /André LafonSupervisor : Julian Bethwaite
Simon WATIN Bethwaite DesignX2004 Rose Bay,Sydney
May-July 2007
Résumé
Le 49er, discipline phare de la voile olympique par son côté spectaculaire et médiatique a maintenant 10 ans. Afin de continuer à susciter l'engouement pour ce voilier de haute performance, il a été décidé d'en développer une nouvelle version plus performante qui devrait être présentée aux prochains jeux Olympiques de Pékin en 2008.
Le projet de recherche porte sur deux axes du développement de ce voilier : l'étude d'un nouveau mât en carbone et l'évaluation comparée des performances des coques actuelles, afin de servir de base à un nouveau design.
Ici nous validons le concept d'un mât carbone avec une voile adaptée et nous mettons en évidence les disparités existantes entres les différentes coques naviguant à l'heure actuelle. Le stage aura également permis d'obtenir une quantité inégalée de données sur les caractéristiques et les performances du 49er.
Summary
The 49er, the most spectacular and successful Olympic sailing class, is now 10 years old. In order to keep this high performance skiff attractive to sailors, it has been decided to develop a higher performing version of it, which will be sailed in Beijing Olympics 2008.
The Research project focuses on two axes of enhancement : The study of a new carbon mast and the comparative evaluation of the current hulls, as a reference point for a refined hull design.
Here we will validate the concept of a carbon mast with its adapted mainsail and will show the differences between the existing hulls. The project has also allowed us to gather an extensive and unique amount of data on the 49er characteristics and performance.
CONTENTS
INTRODUCTION................................................................. p4
THE HULL........................................................................... p51 Project description p62 The current 49er hull p73 Hull drag study p124 Results p16
THE RIG..............................................................................p271 Project description p282 The new rigs p293 Test objectives and protocol p344 Results p385 Conclusions p42
CONCLUSION.....................................................................p47
APPENDIX 1 : Tension reading apparatus....................p48
APPENDIX 2: 49er hydrodynamic drag curves............p49
APPENDIX 3 : Carbon rig speed polars.........................p51
GLOSSARY separate file
INTRODUCTION
The present report and appendixes sum up my work during the three months internship that has been closing my third year of study at the eEole Polytechnique. As it is a bridge between my general Engineer formation of the Ecole Polytechnique and my specialization in Naval Architecture at the ENSTA, the internship is co-supervised by both schools.
I worked during three months at Bethwaite Design's office in Rose Bay Sydney, from May to mid July 2007. My supervisor, Julian Bethwaite, is the designer of the "49er", a high performance sailing skiff sailed as an Olympic class since 2000. Bethwaite Design is one of the world's leading skiff design companies since its creation in 1968 by Frank Bethwaite, under the name of Starboard Products. Bethwaite Design combines the knowledge of world's top class sailors with the developing creativity of designers that can think outside the square to develop performing innovations.
The internship project is part of a wider performance enhancement project of the 49er, in order to present a higher performance version of the skiff in Beijing 2008 Olympics. The research focuses on three major parts of the 49er :
1. The rigging : study of a new carbon mast, with and adapted mainsail
2. The hull : amelioration of the current shape, and switching to a computer-cut mould
3. The wings : changing the design to gain weight and switching to a computer-cut mould
I was involved during my internship in the first two projects. I was in charge of the assessment of the carbon mast's performance and worked on the new hull design, studying the existing hulls to know where performance could be improved.
The project was ruled by a tight schedule and very practical goals, letting few room for more general study or research. I was though able to perform more general studies on some processes involved in skiff sailing and draw general conclusions about them.
The following report is divided in two independent parts, one presenting my work on the hull, and the other concerned with the rig study. The appendix 1 present the reading system designed for the 49er hull drag study. Appendix 2 sums up the performance of the new carbon rigs, and appendix 3 displays the some of the 49er hydrodynamic drag curves obtained during the study.
A glossary with both pictures and definitions serves to clarify most of the specific English terms related to sailing or ship design. It comes as a separate file in order to allow simultaneous reading with the report. It is to be referred to for a translation of the bold words in the report.

THE HULL
3D model and reality of the 49er hull
1.Project presentationThe performance development project had the goal to change completely the hull fabrication
and to switch to computer-shaped hull moulds.
The current 49er hull building process is the following : a unique male mould, the "master plug" has been designed and built by Bethwaite Design in 1995. Out of this plug were shaped 5 female moulds that were sent to different locations in the world to 49er builders (USA,UK, NZL & AUS...). Each existing 49er hull (theoretically identical to the original master plug) in the world is made from one of these five moulds.
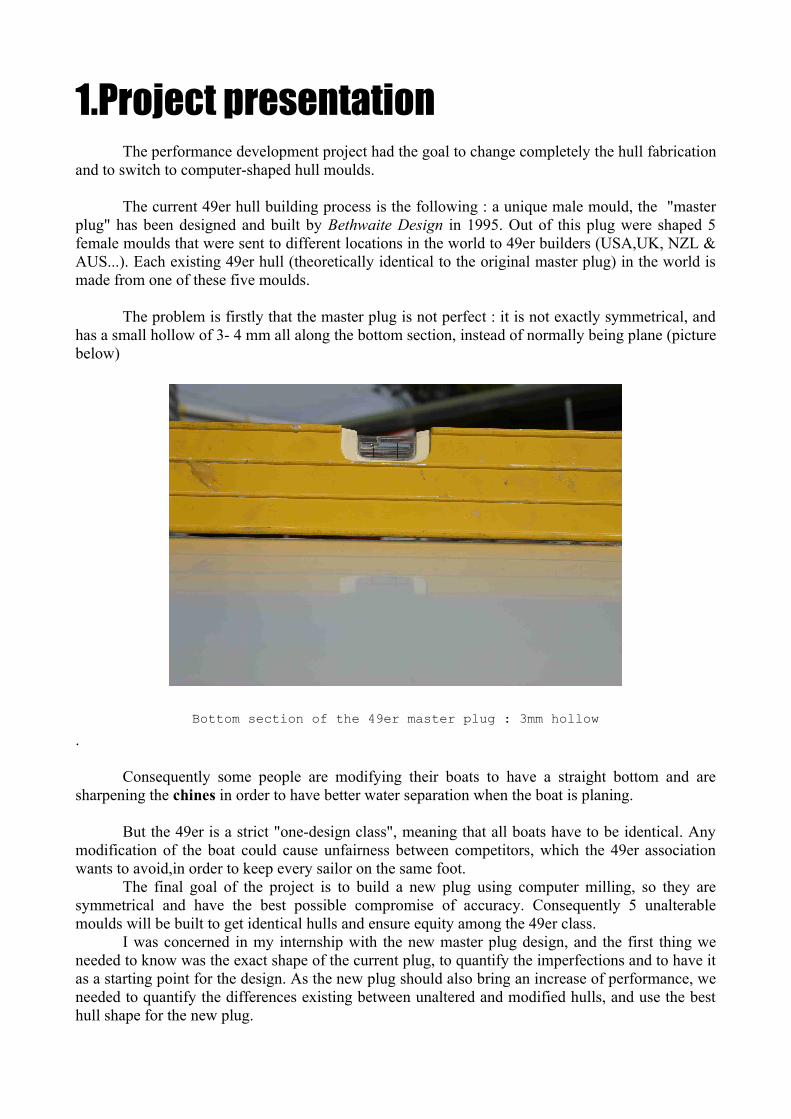
The problem is firstly that the master plug is not perfect : it is not exactly symmetrical, and has a small hollow of 3- 4 mm all along the bottom section, instead of normally being plane (picture below)
Bottom section of the 49er master plug : 3mm hollow.
Consequently some people are modifying their boats to have a straight bottom and are sharpening the chines in order to have better water separation when the boat is planing.
But the 49er is a strict "one-design class", meaning that all boats have to be identical. Any modification of the boat could cause unfairness between competitors, which the 49er association wants to avoid,in order to keep every sailor on the same foot.
The final goal of the project is to build a new plug using computer milling, so they are symmetrical and have the best possible compromise of accuracy. Consequently 5 unalterable moulds will be built to get identical hulls and ensure equity among the 49er class.
I was concerned in my internship with the new master plug design, and the first thing we needed to know was the exact shape of the current plug, to quantify the imperfections and to have it as a starting point for the design. As the new plug should also bring an increase of performance, we needed to quantify the differences existing between unaltered and modified hulls, and use the best hull shape for the new plug.
2.The current 49er hullA) Generation of the 3D model
The building of a computer-shaped plug needed the accurate determination of a 49er hull shape, in order to generate a numerical file to guide the machine. Surprisingly there was no accurate data existing on the 49er hull, and no one really recorded accurately the fine characteristics of a 49er shape. So we actually measured the existing plug and generated a 3D model out of it, as a starting point for the design.
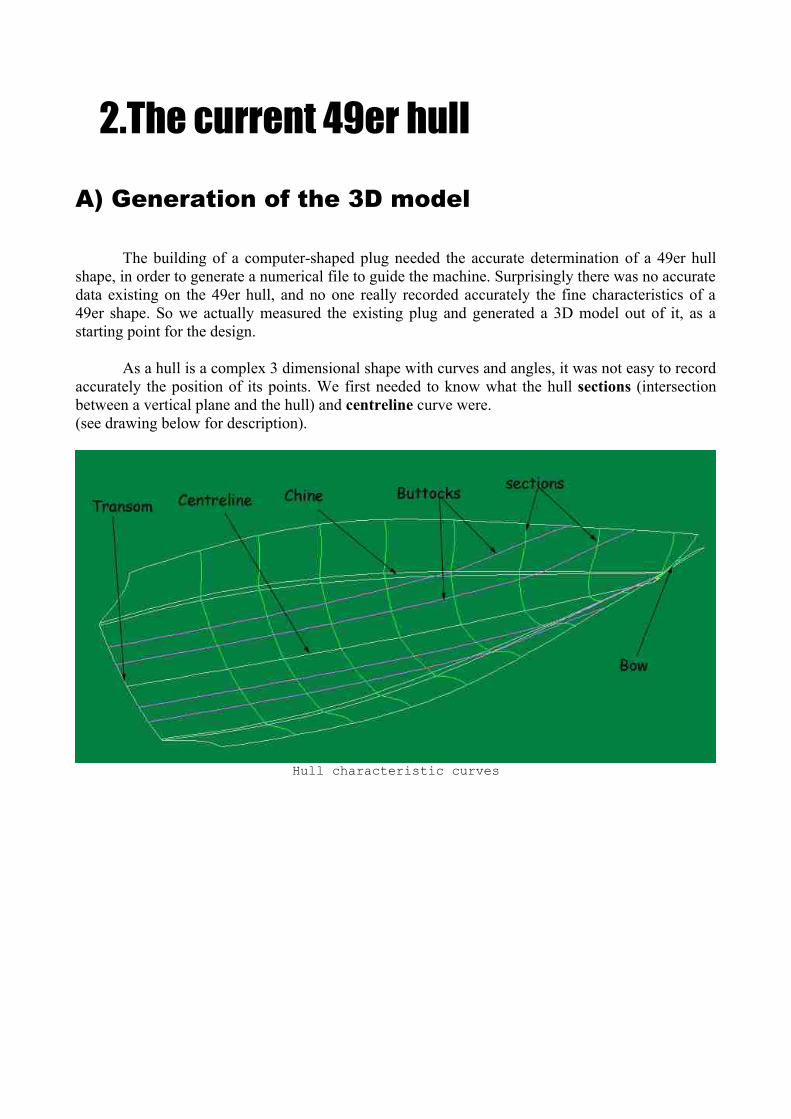
As a hull is a complex 3 dimensional shape with curves and angles, it was not easy to record accurately the position of its points. We first needed to know what the hull sections (intersection between a vertical plane and the hull) and centreline curve were.(see drawing below for description).
Hull characteristic curves
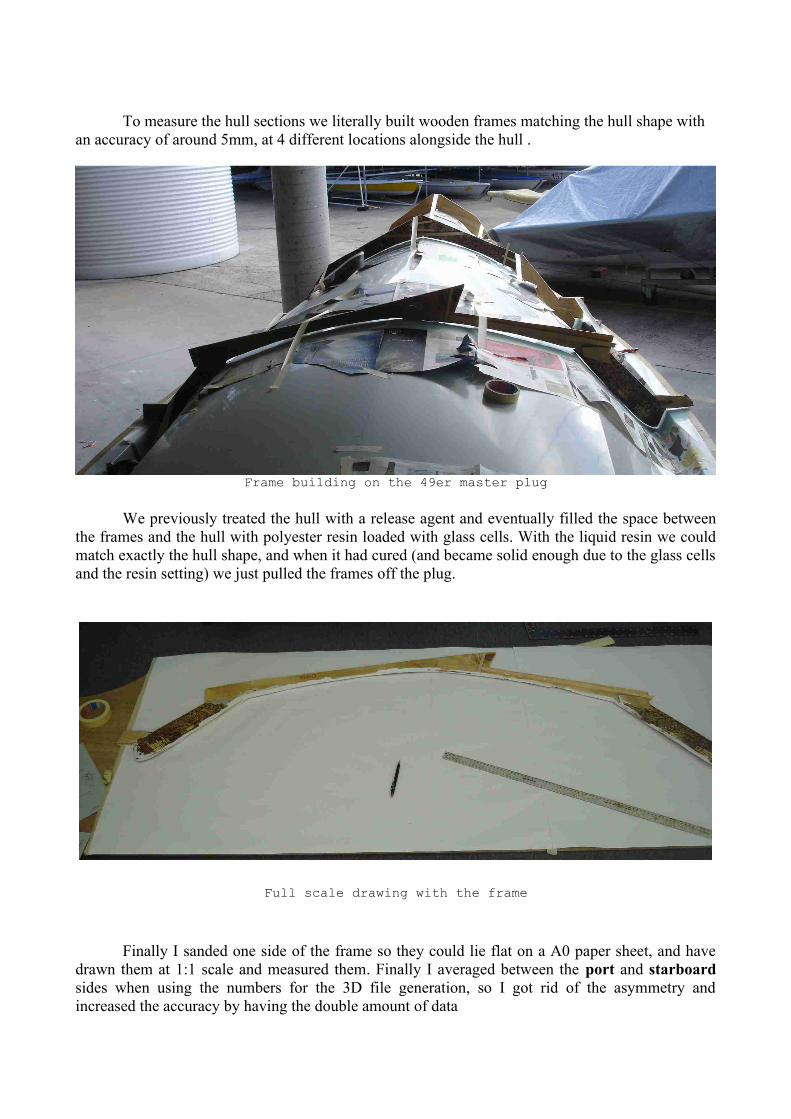
To measure the hull sections we literally built wooden frames matching the hull shape with an accuracy of around 5mm, at 4 different locations alongside the hull .
Frame building on the 49er master plug
We previously treated the hull with a release agent and eventually filled the space between the frames and the hull with polyester resin loaded with glass cells. With the liquid resin we could match exactly the hull shape, and when it had cured (and became solid enough due to the glass cells and the resin setting) we just pulled the frames off the plug.
Full scale drawing with the frame
Finally I sanded one side of the frame so they could lie flat on a A0 paper sheet, and have drawn them at 1:1 scale and measured them. Finally I averaged between the port and starboard sides when using the numbers for the 3D file generation, so I got rid of the asymmetry and increased the accuracy by having the double amount of data
This process is really accurate because the resin fills every space between the frame and the hull, and provided the frames are sanded properly to be flat enough and the point measuring is correct, you can drop the error to less than 0.5mm, for a frame that is almost 2m long.
The difficulty is to get the section planes parallel to each other, and perpendicular to the design waterline. This was achieved using an accurate zero reference on the hull, positioning the different sections along the centreline and drawing the section lines on the hull using a flexible square and ruler.
After the sections, we measured the keel line, measuring the distance between the hull and a string tied tight over it, parallel to the design waterline.
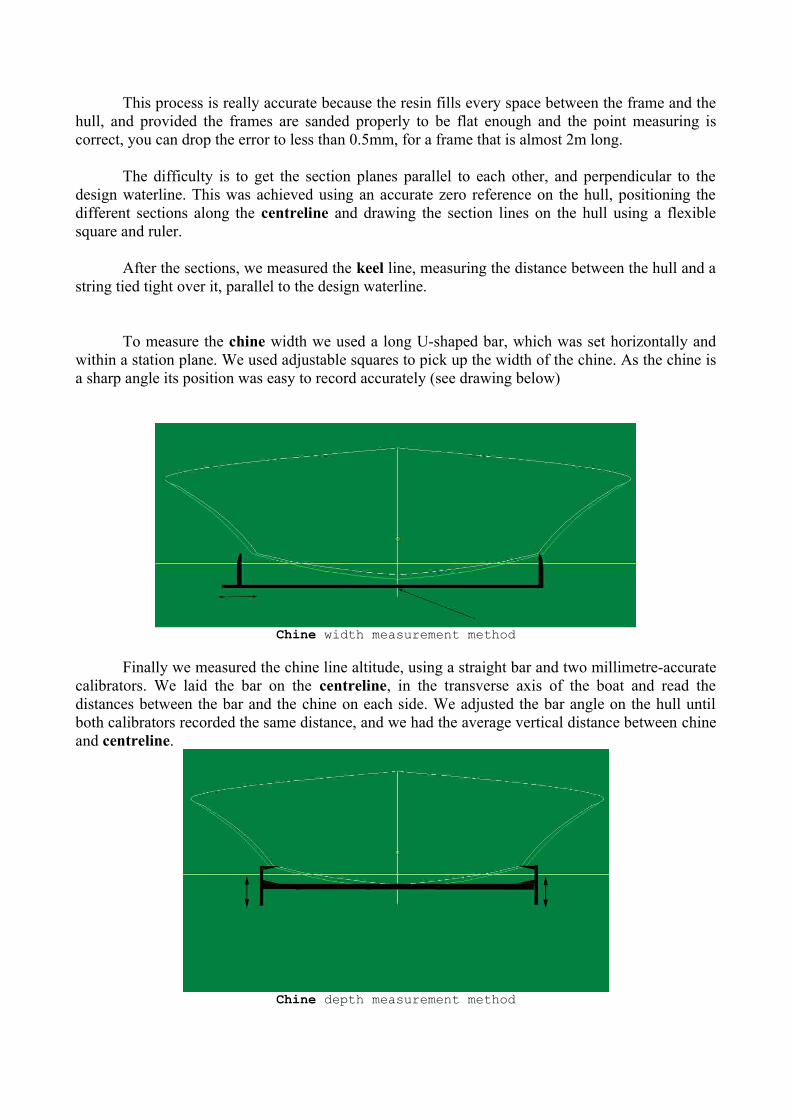
To measure the chine width we used a long U-shaped bar, which was set horizontally and within a station plane. We used adjustable squares to pick up the width of the chine. As the chine is a sharp angle its position was easy to record accurately (see drawing below)
Chine width measurement method
Finally we measured the chine line altitude, using a straight bar and two millimetre-accurate calibrators. We laid the bar on the centreline, in the transverse axis of the boat and read the distances between the bar and the chine on each side. We adjusted the bar angle on the hull until both calibrators recorded the same distance, and we had the average vertical distance between chine and centreline.
Chine depth measurement method
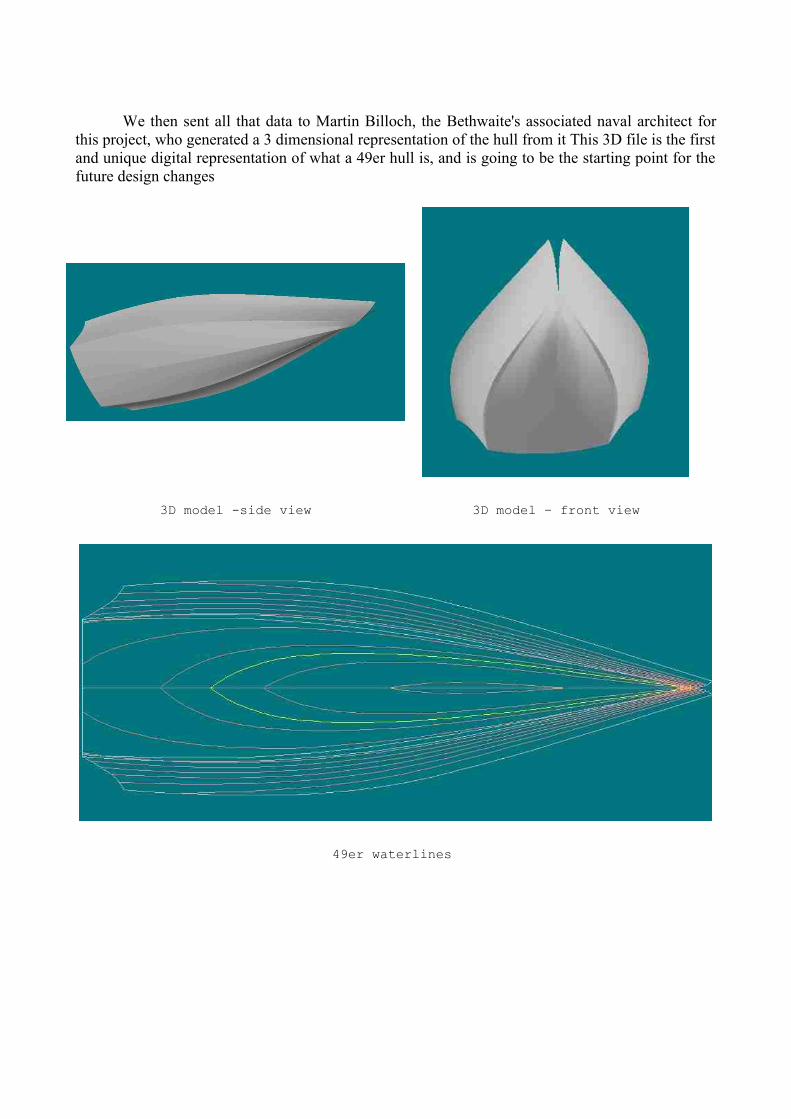
We then sent all that data to Martin Billoch, the Bethwaite's associated naval architect for this project, who generated a 3 dimensional representation of the hull from it This 3D file is the first and unique digital representation of what a 49er hull is, and is going to be the starting point for the future design changes
3D model -side view 3D model – front view
49er waterlines
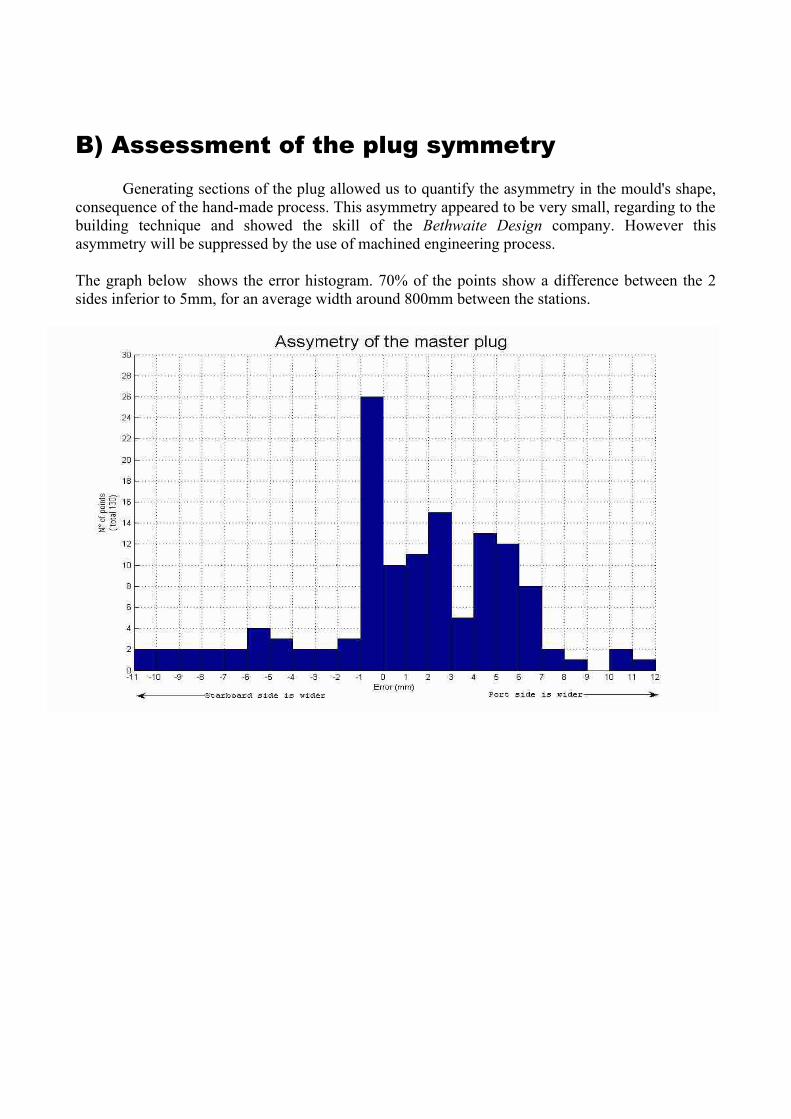
B) Assessment of the plug symmetryGenerating sections of the plug allowed us to quantify the asymmetry in the mould's shape,
consequence of the hand-made process. This asymmetry appeared to be very small, regarding to the building technique and showed the skill of the Bethwaite Design company. However this asymmetry will be suppressed by the use of machined engineering process.
The graph below shows the error histogram. 70% of the points show a difference between the 2 sides inferior to 5mm, for an average width around 800mm between the stations.
3. Hull drag studyThe next phase of the design project was an extensive series of full scale tow testing, in
order to get the 49er hull's hydrodynamic drag curves. These tow tests had 3 main goals :
1. Being able to quantify the differences between standard 49ers and modified ones2. Establish drag curves for different boat trims : test the influence on drag of pitch, yawl and
heel.3. Further Bethwaite Design's tow testing results from 1996 by gaining one step in terms of
accuracy and consistency
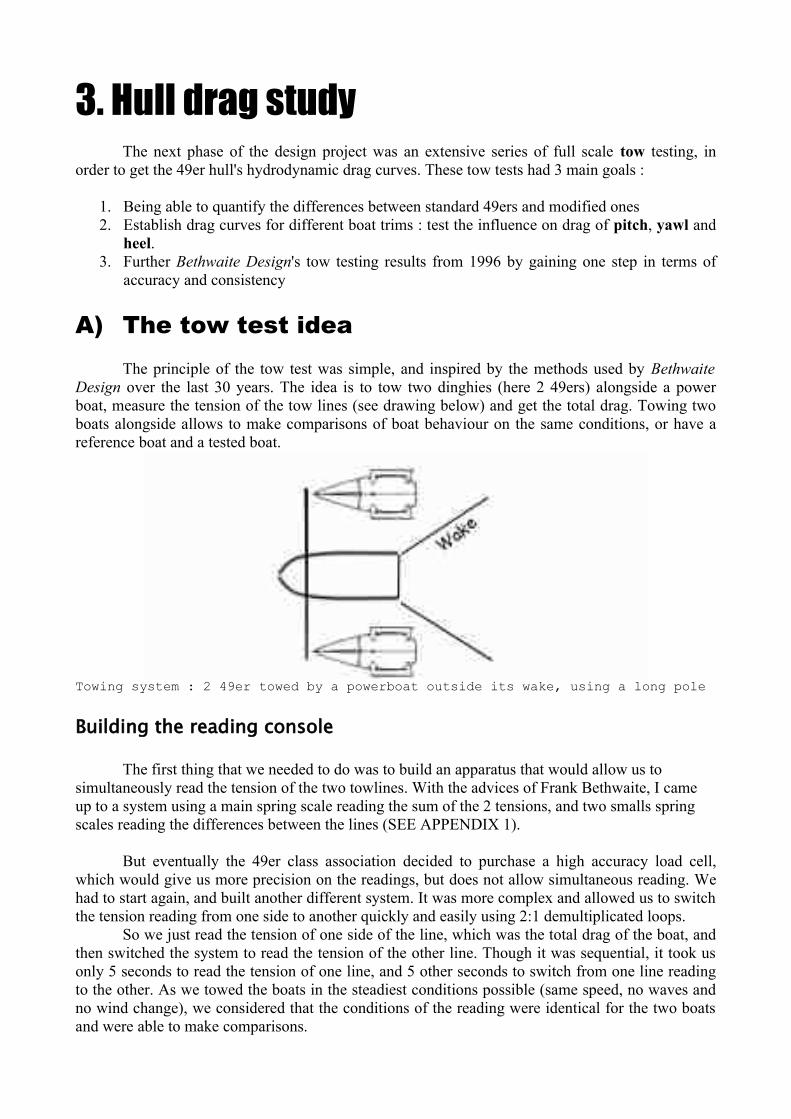
A) The tow test ideaThe principle of the tow test was simple, and inspired by the methods used by Bethwaite
Design over the last 30 years. The idea is to tow two dinghies (here 2 49ers) alongside a power boat, measure the tension of the tow lines (see drawing below) and get the total drag. Towing two boats alongside allows to make comparisons of boat behaviour on the same conditions, or have a reference boat and a tested boat.
Towing system : 2 49er towed by a powerboat outside its wake, using a long pole
Building the reading console
The first thing that we needed to do was to build an apparatus that would allow us to simultaneously read the tension of the two towlines. With the advices of Frank Bethwaite, I came up to a system using a main spring scale reading the sum of the 2 tensions, and two smalls spring scales reading the differences between the lines (SEE APPENDIX 1).
But eventually the 49er class association decided to purchase a high accuracy load cell, which would give us more precision on the readings, but does not allow simultaneous reading. We had to start again, and built another different system. It was more complex and allowed us to switch the tension reading from one side to another quickly and easily using 2:1 demultiplicated loops.
So we just read the tension of one side of the line, which was the total drag of the boat, and then switched the system to read the tension of the other line. Though it was sequential, it took us only 5 seconds to read the tension of one line, and 5 other seconds to switch from one line reading to the other. As we towed the boats in the steadiest conditions possible (same speed, no waves and no wind change), we considered that the conditions of the reading were identical for the two boats and were able to make comparisons.
Refining the apparatus
After the first trial on the water the system proved to be too hard to switch at high speeds (over 10 knots). The tensions were over 50kgs, meaning that switching lines required a 25kgs "force" from the operator. It was also overloading the load cell whose working limit was 100kgs (the system gave 1:2 ratio for the load cell)
Consequently we modified our apparatus to add another reading mode that allowed us to control the system with a 4:1 loop and have a 1:1 ratio on the load cell. Switching from the "low tension" mode to the "high tension" one took only a few seconds and was really easy to perform.
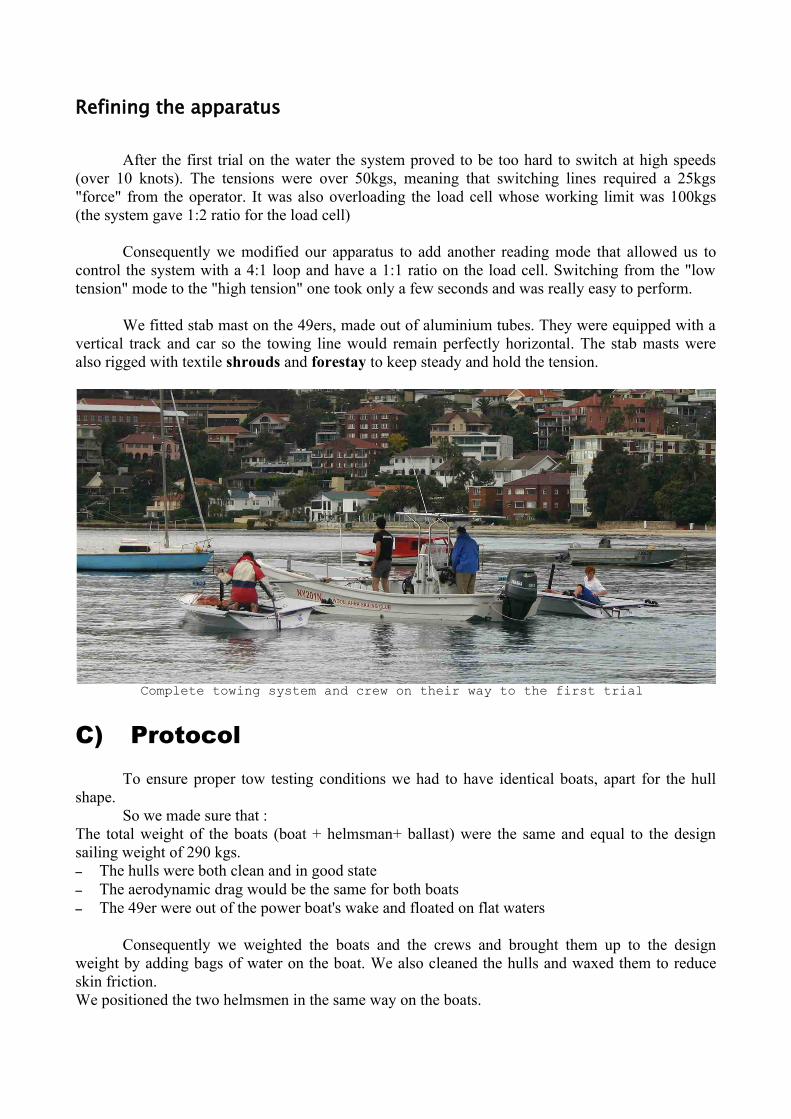
We fitted stab mast on the 49ers, made out of aluminium tubes. They were equipped with a vertical track and car so the towing line would remain perfectly horizontal. The stab masts were also rigged with textile shrouds and forestay to keep steady and hold the tension.
Complete towing system and crew on their way to the first trial
C) ProtocolTo ensure proper tow testing conditions we had to have identical boats, apart for the hull
shape. So we made sure that :
The total weight of the boats (boat + helmsman+ ballast) were the same and equal to the design sailing weight of 290 kgs.– The hulls were both clean and in good state– The aerodynamic drag would be the same for both boats– The 49er were out of the power boat's wake and floated on flat waters
Consequently we weighted the boats and the crews and brought them up to the design weight by adding bags of water on the boat. We also cleaned the hulls and waxed them to reduce skin friction.We positioned the two helmsmen in the same way on the boats.
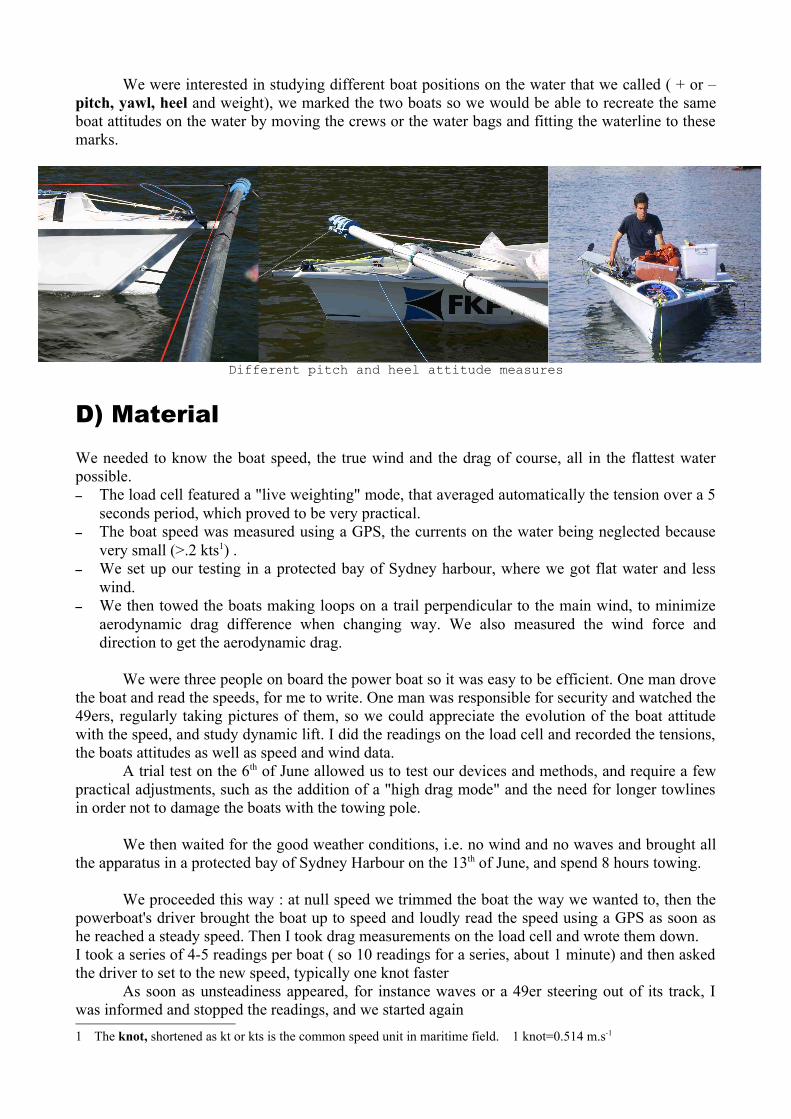
We were interested in studying different boat positions on the water that we called ( + or – pitch, yawl, heel and weight), we marked the two boats so we would be able to recreate the same boat attitudes on the water by moving the crews or the water bags and fitting the waterline to these marks.
Different pitch and heel attitude measures
D) MaterialWe needed to know the boat speed, the true wind and the drag of course, all in the flattest water possible.– The load cell featured a "live weighting" mode, that averaged automatically the tension over a 5
seconds period, which proved to be very practical.– The boat speed was measured using a GPS, the currents on the water being neglected because
very small (>.2 kts1) . – We set up our testing in a protected bay of Sydney harbour, where we got flat water and less
wind. – We then towed the boats making loops on a trail perpendicular to the main wind, to minimize
aerodynamic drag difference when changing way. We also measured the wind force and direction to get the aerodynamic drag.
We were three people on board the power boat so it was easy to be efficient. One man drove the boat and read the speeds, for me to write. One man was responsible for security and watched the 49ers, regularly taking pictures of them, so we could appreciate the evolution of the boat attitude with the speed, and study dynamic lift. I did the readings on the load cell and recorded the tensions, the boats attitudes as well as speed and wind data.
A trial test on the 6th of June allowed us to test our devices and methods, and require a few practical adjustments, such as the addition of a "high drag mode" and the need for longer towlines in order not to damage the boats with the towing pole.
We then waited for the good weather conditions, i.e. no wind and no waves and brought all the apparatus in a protected bay of Sydney Harbour on the 13th of June, and spend 8 hours towing.
We proceeded this way : at null speed we trimmed the boat the way we wanted to, then the powerboat's driver brought the boat up to speed and loudly read the speed using a GPS as soon as he reached a steady speed. Then I took drag measurements on the load cell and wrote them down. I took a series of 4-5 readings per boat ( so 10 readings for a series, about 1 minute) and then asked the driver to set to the new speed, typically one knot faster
As soon as unsteadiness appeared, for instance waves or a 49er steering out of its track, I was informed and stopped the readings, and we started again1 The knot, shortened as kt or kts is the common speed unit in maritime field. 1 knot=0.514 m.s-1

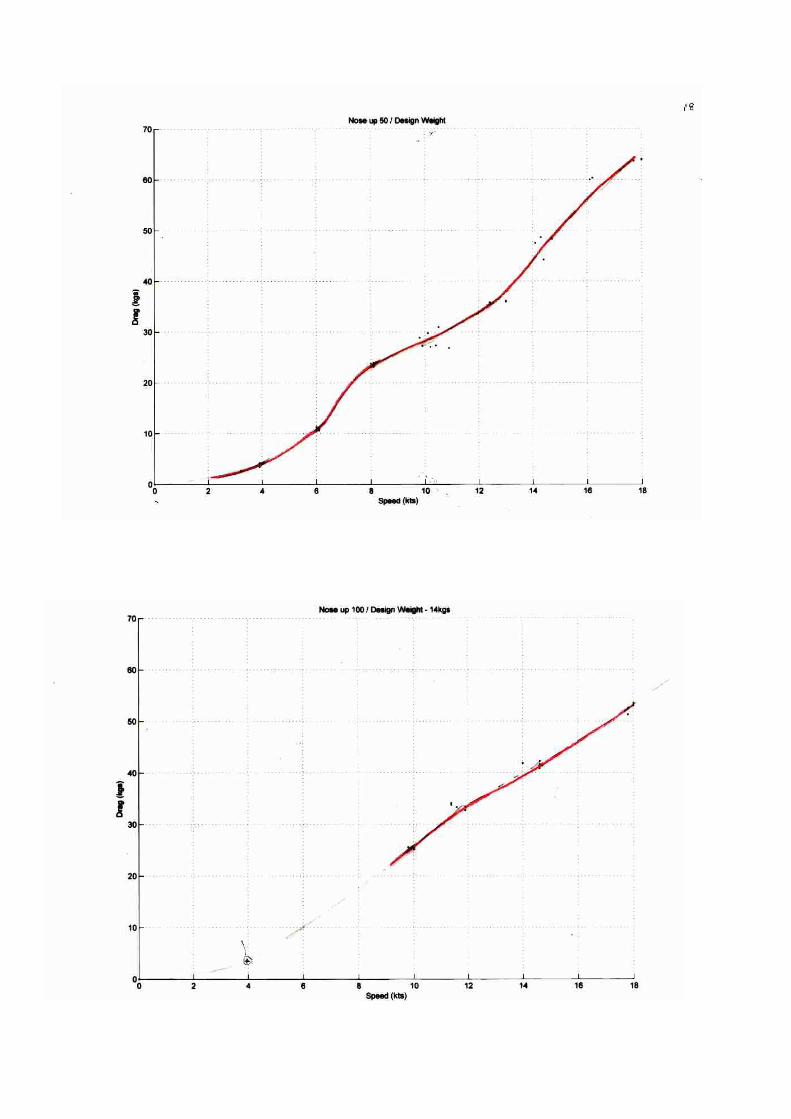
For each defined trim, we made a series of drag measurements throughout the speed range, starting at 4 knots, reading drags with one knot interval and stopping when the 49er became unstable. The stability speed depended on the boat attitude and eventually the horsepower of the towing boat. We reached a peak speed of 18 knots, which allowed us a very broad speed range. We doubled the testing for the standard attitudes (design waterline at 0 kts) in order to cross-check the reference data.
Series # Weight Heel Pitch Yawl Speed range (kts)1 Design 0 0 0 4-102 Design 0 0 0 4-123 Design 0 9° 0 10-184 Design 0 9° 0 4-105 Design 10° -9° 0 4-76 Design 10° 0 0 4-87 Design 0 -9° 0 4-88 Design -14kgs 0 0 0 4-109 Design -14kgs 0 0 0 4-1410 Design -14kgs 0 0 20° 4-811 Design -14kgs 0 -9° 20° 4-1012 Design - 14kgs 0 18° 0° 10-18
E) Data processingEventually all the readings were typed into an excel file, in which I made the aerodynamic
drag corrections, using boat speed and our wind readings to calculate the front component of the apparent wind.
The aerodynamic drag coefficients of the hull and helmsmen were determined using Hoerner Fluid-dynamic drag's coefficient of drag2
We assimilated the hull by a parallel-sided shape with a rounded leading edge, with a length ratio of 2.5. It has a projected area of around 7.5sq.ft and thus a drag coefficient of 0.6. The sailor, who has just his torso out of the boat has a projected area of 2.5sq.ft and a drag coefficient of 0.8.
The average aerodynamic drag being between 2 and 7 % of the total drag, these corrections achieved a significant reduction of the points scatter, showing consistent hydrodynamic drag regardless of the towing direction.
Then I plotted all the data into Matlab and tried to fit curves to it with the built-in tools, but this method proved not to give satisfactory results over the whole speed range. Finally I printed the experimental points after corrections on papers, at the exact same scale and draw interpolating curves on the paper sheets. Finally I scanned them on the computer and used an image working software to superimpose two curves on the computer. This is a more crude method but it was very practical, time efficient and gave good results.
2 Fluid Dynamic Drag pp3.12-3.15 1965, Hoerner fluid dynamics ltd.
4.ResultsA) Boat comparison
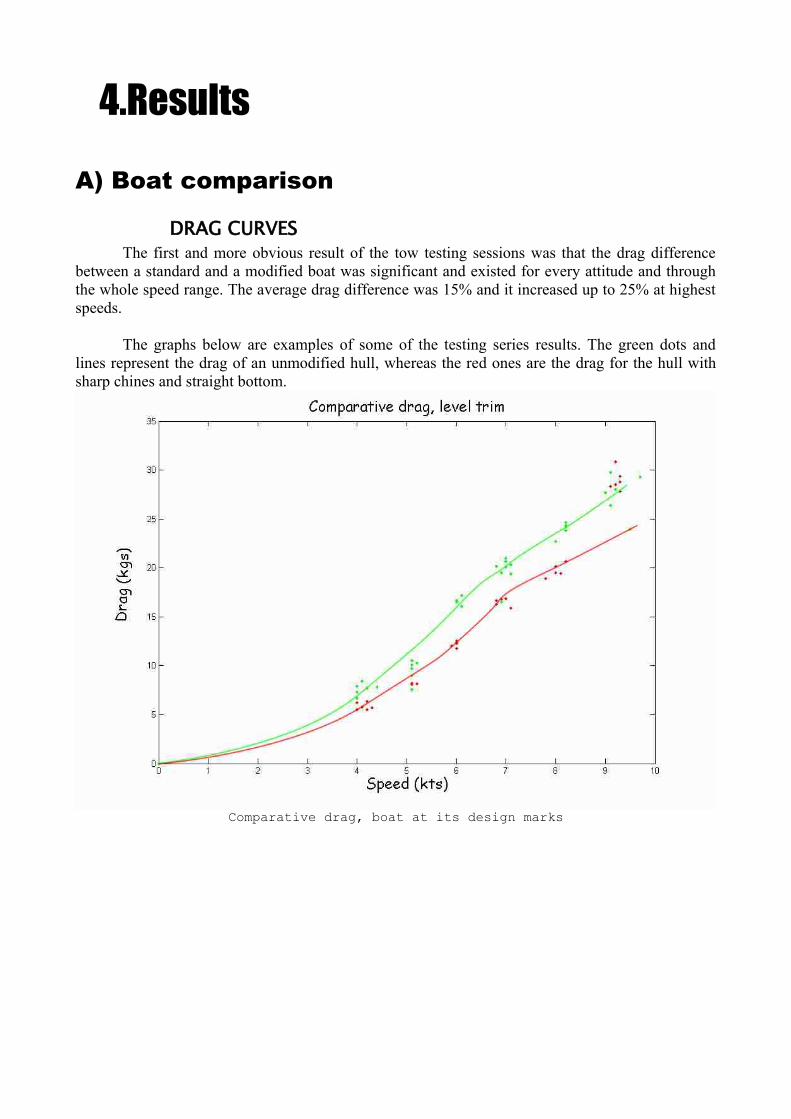
DRAG CURVESThe first and more obvious result of the tow testing sessions was that the drag difference
between a standard and a modified boat was significant and existed for every attitude and through the whole speed range. The average drag difference was 15% and it increased up to 25% at highest speeds.
The graphs below are examples of some of the testing series results. The green dots and lines represent the drag of an unmodified hull, whereas the red ones are the drag for the hull with sharp chines and straight bottom.
Comparative drag, boat at its design marks
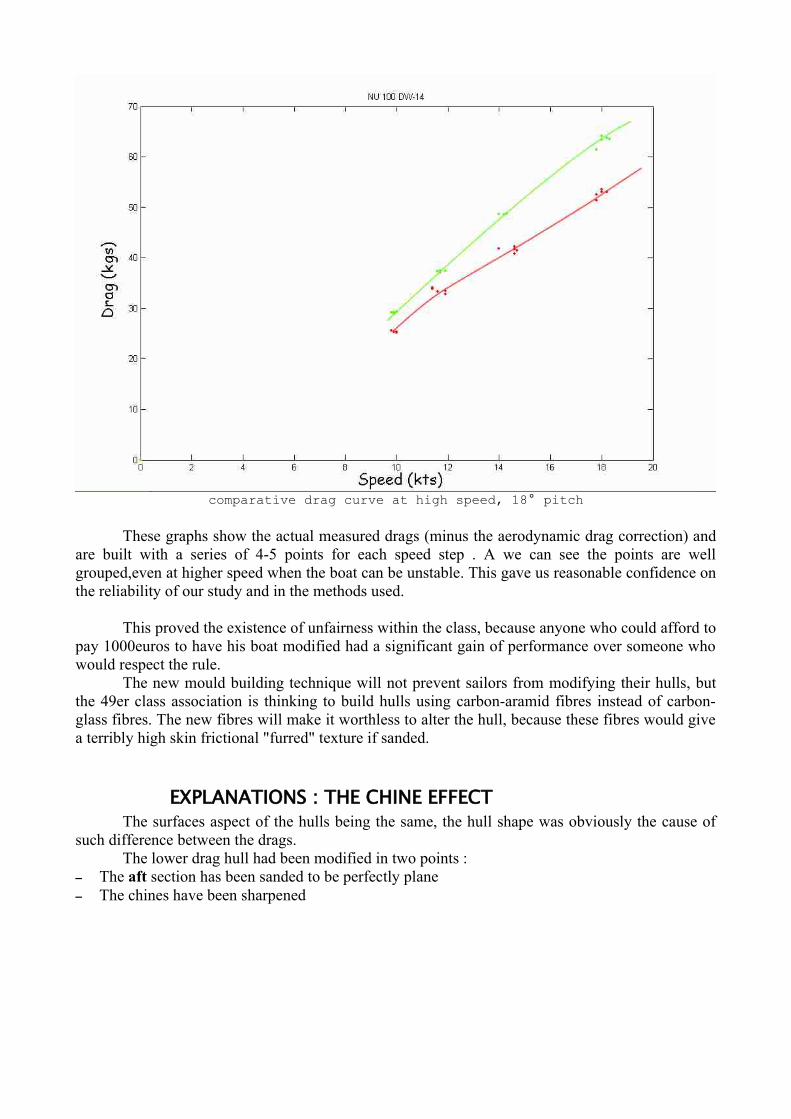
comparative drag curve at high speed, 18° pitch
These graphs show the actual measured drags (minus the aerodynamic drag correction) and are built with a series of 4-5 points for each speed step . A we can see the points are well grouped,even at higher speed when the boat can be unstable. This gave us reasonable confidence on the reliability of our study and in the methods used.
This proved the existence of unfairness within the class, because anyone who could afford to pay 1000euros to have his boat modified had a significant gain of performance over someone who would respect the rule.
The new mould building technique will not prevent sailors from modifying their hulls, but the 49er class association is thinking to build hulls using carbon-aramid fibres instead of carbon-glass fibres. The new fibres will make it worthless to alter the hull, because these fibres would give a terribly high skin frictional "furred" texture if sanded.
EXPLANATIONS : THE CHINE EFFECTThe surfaces aspect of the hulls being the same, the hull shape was obviously the cause of
such difference between the drags.The lower drag hull had been modified in two points :
– The aft section has been sanded to be perfectly plane – The chines have been sharpened

First the chine sharpening helped to get a better water flow separation when the boat is planning.
When a boat is moving on the water, it makes its way through the fluid by moving it aside and forward to have room for itself. The water is heaped up against the bow and accelerated away from the hull, then subsides to its original level because of the gravity force. The hull consequently generates a wave system of gravity waves that moves at the boat speed. In such a wave system, crest speed is proportional to the square root of the wavelength. As the speed increases the wavelength increases and at some point becomes longer than the boat's length. From that point on the boat will not float level on the water, but will experience pitch and will be virtually sailing "uphill", up the receding face of the bow wave of its own making3.
This uphill sailing requires a dramatically bigger amount of energy that is prohibitive, and sets a speed fence below which classical boats are stuck. This speed limit is called hull speed and is the speed of the gravity wave which wavelength is the boat length. For a 16ft skiff hull speed is around 5.4kts
Bow wave system below hull speed (2 periods)
1 bow wave at hull
speed,with the length of the
boat
Over hull speed, the
second crest is aft of the
transom
Note the evolution of the pitch as the speed increases: the boat noses up due to dynamic lift
Fast sailing boats can overpass the hull speed and sail significantly faster using a completely different motion over the water : planing. A planing boat has a particular hull shape with flat and wide aft section. It sails with the nose up and pushes the water outwards, so two fluids particles that come together on the bow will be separated and not join back at the transom. Planing allows considerably higher speeds, regardless of the boat length.
3Thanks to Frank Bethwaite for his clear explanations of the phenomena

Hard chines are an important element on the design of a planing hull : they help flow separation so the boat will "spray" the water away on the sides, allowing it to flow from the boat cleanly and quickly. A spraying flow will reduce skin friction because the water would be stuck to the hull on a lesser surface.
With an easy experience we could verify the effect of the chine sharpening on the water behaviour. We sprayed water on a hull varying the angle between the centreline and the stream and recorded the minimum angle required to separate the water flow from the hull. We could achieve angle measurement by setting the stream origin (a garden hose, with a flow speed of ~5m/s i.e. 10 kts) at a fixed point and aiming at marks set along the chine. We used the same protocol on the master plug and the modified hull at two different points of the hull and recorded the angle where the flow stopped sticking to the water and was sprayed from the hull. Even with this "crude" method we could see significant differences, as summarized in table below.
Plug Modified boat Plug Modified boatStation 1 (fore) 2 (aft)
Chine shape at station
Chine with spray rail Simple ChineFlow separation angle 25° 20° 45° 25°
The spray trail accentuates the angle of the chine to help the water flow separation. We see that the angle of separation is lesser at the fore station. Chine rails are commonly used on motorised speedboats, to reach the peak speed of 45kts.
The finer the angle of separation is, the lower the drag is going to be because the water will be separated earlier from the hull and the skin friction will be reduced.
Modified boat Master plug
Stream directed 25° to the centreline, the flow clearly separates
At 40°, the water is still remaining attached to the hull
The second factor was the reduction of the hollow in the aft section. The influence of this modification was harder to measure with the means we had, but we could think that the presence of this hollow would deflect the water on the hull. It would have to be accelerated then decelerated when flowing around it, which we assumed would cost more energy than just flowing on a flat surface. As the water is almost incompressible fluid, the motion of a 49er hull affects a very large volume of water. Thus pulling the water flow up and then down, even within a few millimetres and during fractions of second requires considerable energy and have a consequence on the drag
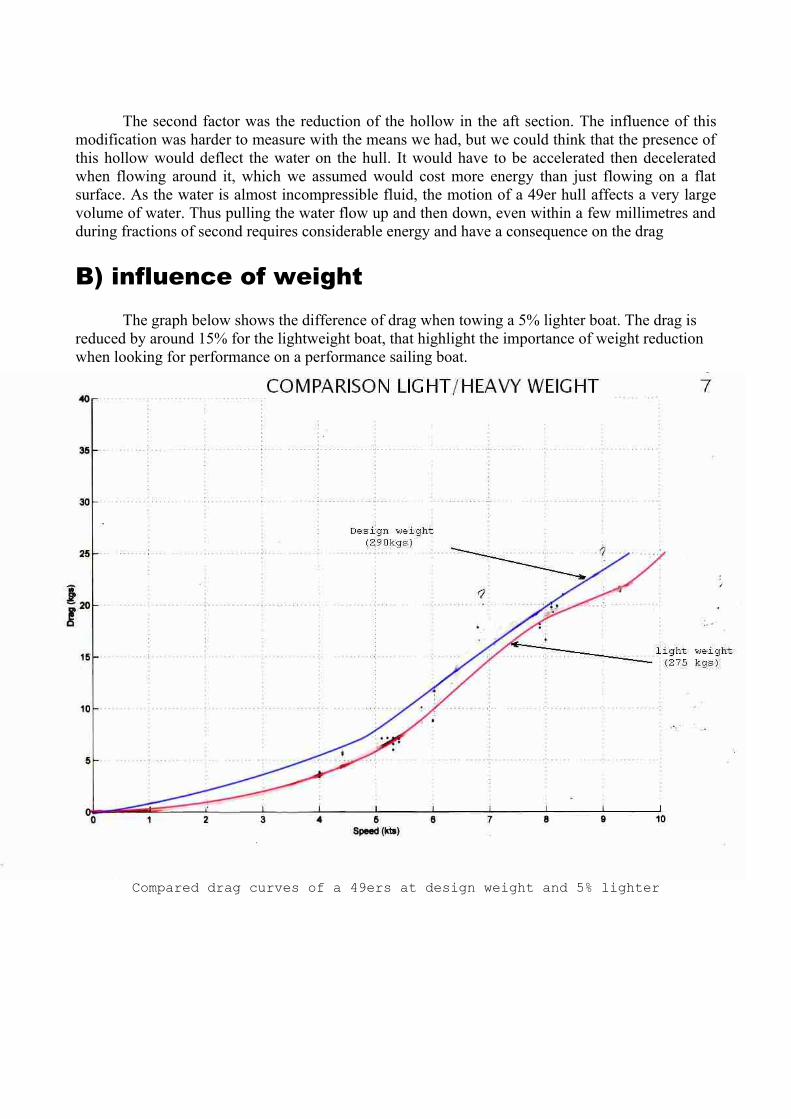
B) influence of weightThe graph below shows the difference of drag when towing a 5% lighter boat. The drag is
reduced by around 15% for the lightweight boat, that highlight the importance of weight reduction when looking for performance on a performance sailing boat.
Compared drag curves of a 49ers at design weight and 5% lighter
C) Influence of the hull trim
The most interesting part of the drag test was that we were able to look for the best attitude in terms of drag for different speeds.
At low speed : the 'fourth mode"
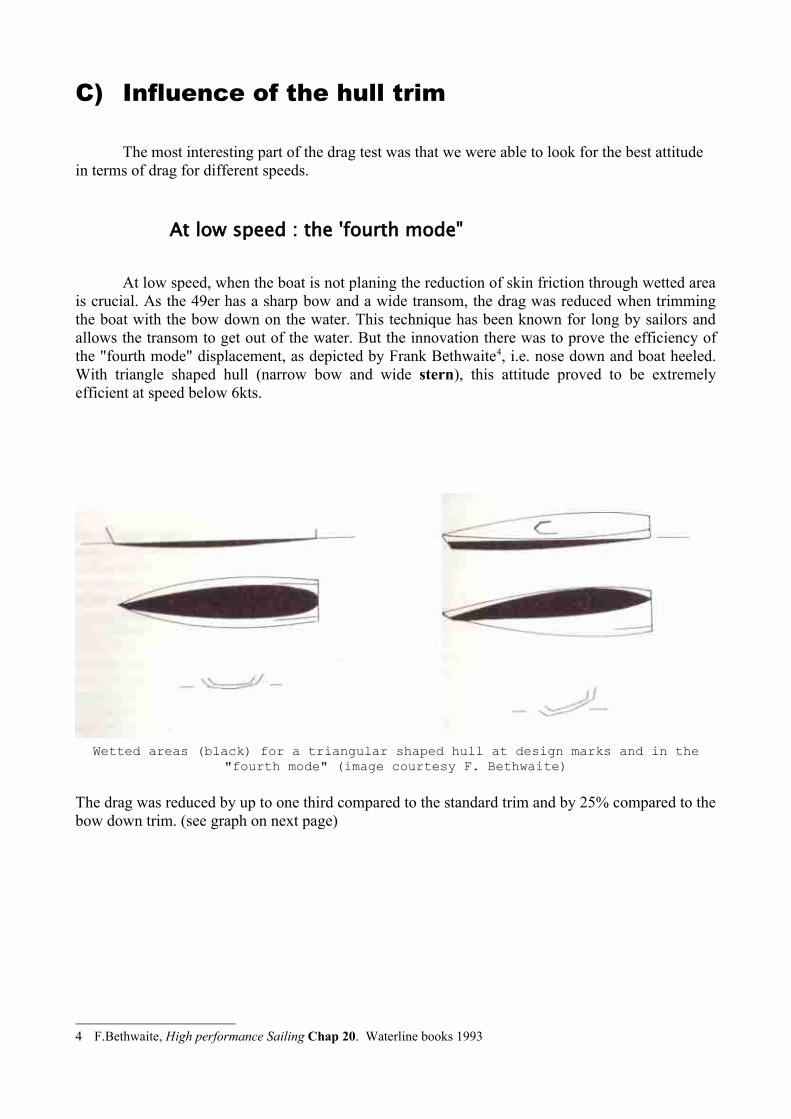
At low speed, when the boat is not planing the reduction of skin friction through wetted area is crucial. As the 49er has a sharp bow and a wide transom, the drag was reduced when trimming the boat with the bow down on the water. This technique has been known for long by sailors and allows the transom to get out of the water. But the innovation there was to prove the efficiency of the "fourth mode" displacement, as depicted by Frank Bethwaite4, i.e. nose down and boat heeled. With triangle shaped hull (narrow bow and wide stern), this attitude proved to be extremely efficient at speed below 6kts.
Wetted areas (black) for a triangular shaped hull at design marks and in the "fourth mode" (image courtesy F. Bethwaite)
The drag was reduced by up to one third compared to the standard trim and by 25% compared to the bow down trim. (see graph on next page)
4 F.Bethwaite, High performance Sailing Chap 20. Waterline books 1993

With a boat in real sailing conditions, i.e. driven on the water with its sails, this attitude would be a lose a part of its advantage due to the loss of effective sail area due to the heeling. In very light air though, this heeling could be helpful because it would stop the sail from flapping because they would keep their shape with gravity
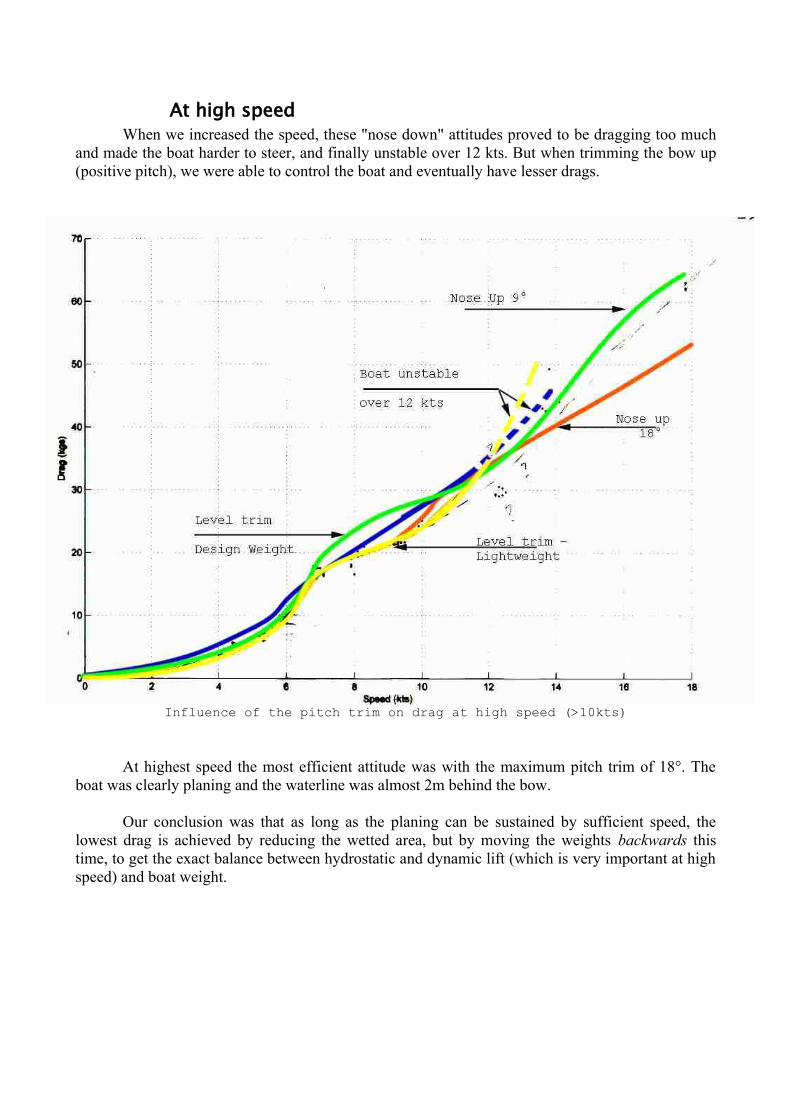
At high speed When we increased the speed, these "nose down" attitudes proved to be dragging too much
and made the boat harder to steer, and finally unstable over 12 kts. But when trimming the bow up (positive pitch), we were able to control the boat and eventually have lesser drags.
Influence of the pitch trim on drag at high speed (>10kts)
At highest speed the most efficient attitude was with the maximum pitch trim of 18°. The boat was clearly planing and the waterline was almost 2m behind the bow.
Our conclusion was that as long as the planing can be sustained by sufficient speed, the lowest drag is achieved by reducing the wetted area, but by moving the weights backwards this time, to get the exact balance between hydrostatic and dynamic lift (which is very important at high speed) and boat weight.
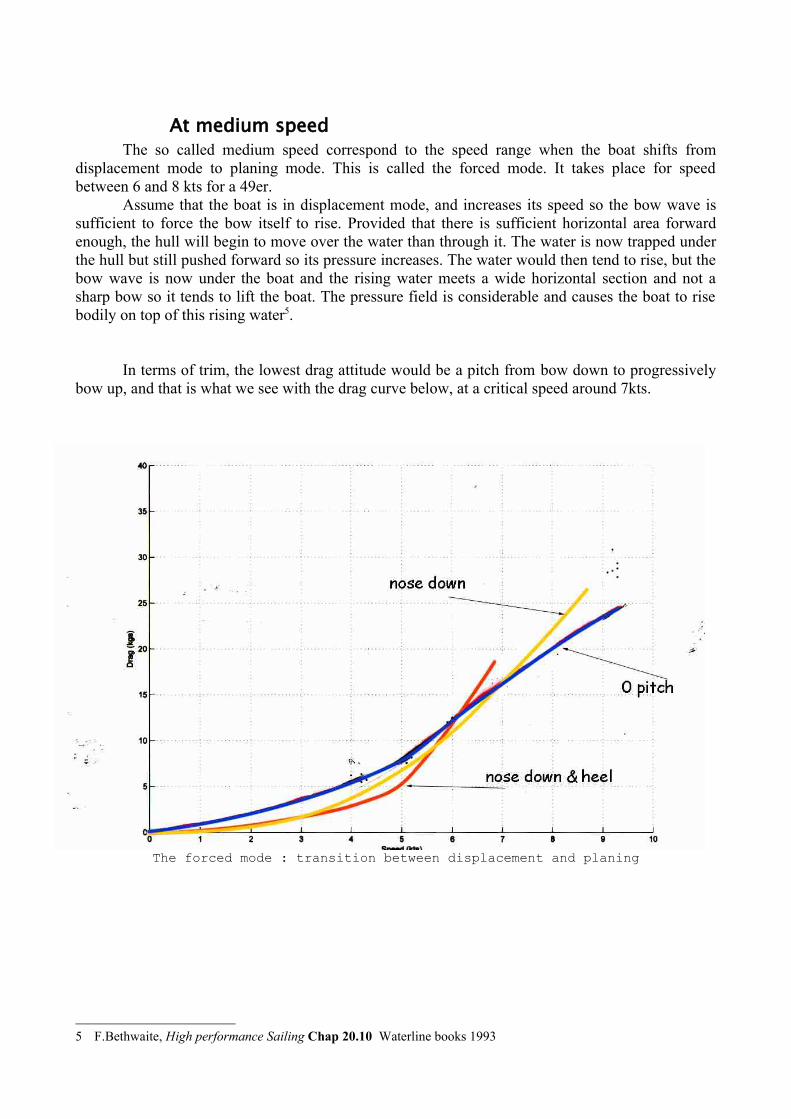
At medium speed The so called medium speed correspond to the speed range when the boat shifts from
displacement mode to planing mode. This is called the forced mode. It takes place for speed between 6 and 8 kts for a 49er.
Assume that the boat is in displacement mode, and increases its speed so the bow wave is sufficient to force the bow itself to rise. Provided that there is sufficient horizontal area forward enough, the hull will begin to move over the water than through it. The water is now trapped under the hull but still pushed forward so its pressure increases. The water would then tend to rise, but the bow wave is now under the boat and the rising water meets a wide horizontal section and not a sharp bow so it tends to lift the boat. The pressure field is considerable and causes the boat to rise bodily on top of this rising water5.
In terms of trim, the lowest drag attitude would be a pitch from bow down to progressively bow up, and that is what we see with the drag curve below, at a critical speed around 7kts.
The forced mode : transition between displacement and planing
5 F.Bethwaite, High performance Sailing Chap 20.10 Waterline books 1993
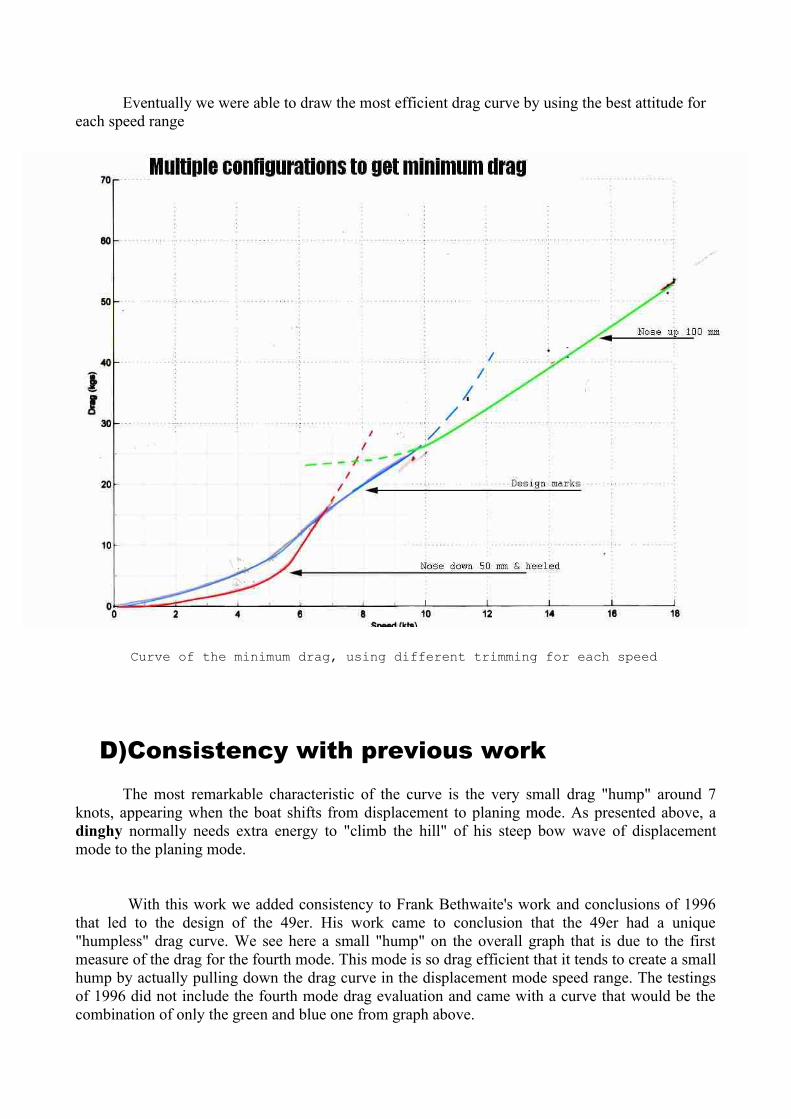
Eventually we were able to draw the most efficient drag curve by using the best attitude for each speed range
Curve of the minimum drag, using different trimming for each speed
D)Consistency with previous workThe most remarkable characteristic of the curve is the very small drag "hump" around 7
knots, appearing when the boat shifts from displacement to planing mode. As presented above, a dinghy normally needs extra energy to "climb the hill" of his steep bow wave of displacement mode to the planing mode.
With this work we added consistency to Frank Bethwaite's work and conclusions of 1996 that led to the design of the 49er. His work came to conclusion that the 49er had a unique "humpless" drag curve. We see here a small "hump" on the overall graph that is due to the first measure of the drag for the fourth mode. This mode is so drag efficient that it tends to create a small hump by actually pulling down the drag curve in the displacement mode speed range. The testings of 1996 did not include the fourth mode drag evaluation and came with a curve that would be the combination of only the green and blue one from graph above.
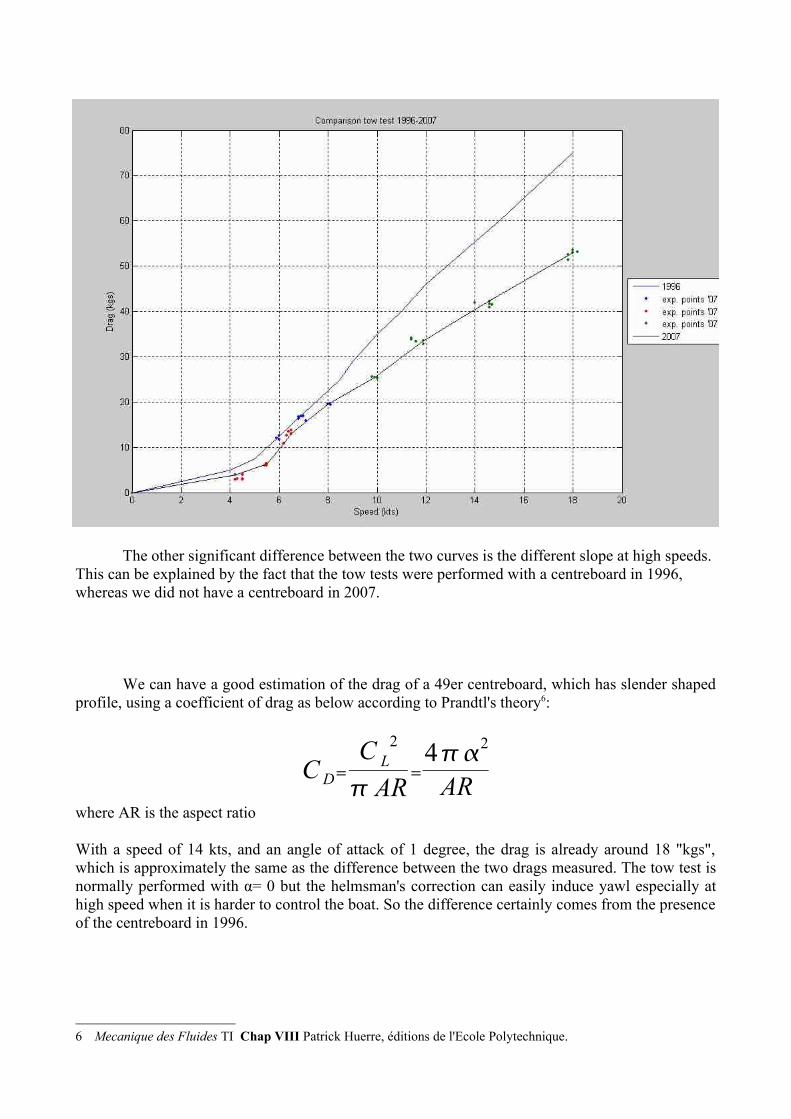
The other significant difference between the two curves is the different slope at high speeds. This can be explained by the fact that the tow tests were performed with a centreboard in 1996, whereas we did not have a centreboard in 2007.
We can have a good estimation of the drag of a 49er centreboard, which has slender shaped profile, using a coefficient of drag as below according to Prandtl's theory6:
where AR is the aspect ratio
With a speed of 14 kts, and an angle of attack of 1 degree, the drag is already around 18 "kgs", which is approximately the same as the difference between the two drags measured. The tow test is normally performed with α= 0 but the helmsman's correction can easily induce yawl especially at high speed when it is harder to control the boat. So the difference certainly comes from the presence of the centreboard in 1996.
6 Mecanique des Fluides TI Chap VIII Patrick Huerre, éditions de l'Ecole Polytechnique.
C D=C L
2
AR=
42
AR
THE RIG
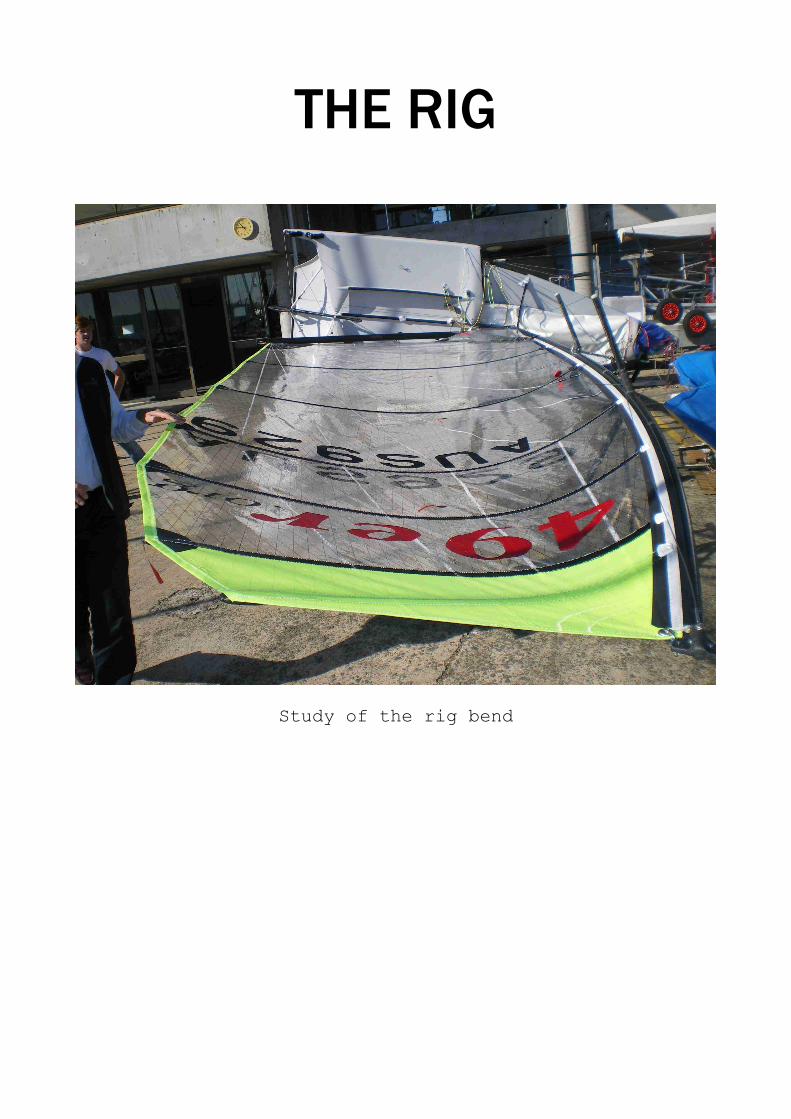
Study of the rig bend
1. Project descriptionOne of the major innovations of the performance enhancement program concerns the 49er
mast and mainsail.The current 49er rig (mast & mainsail) is made of a 2 parts alloy/carbon fibre mast
combined with a 15 square metres mainsail with an elliptical leech profile. It is the result of Bethwaite design's lifelong experience in both skiff sailing and designing and has been fully optimized since the first 49er, 10 years ago.
Direction was given by the 49er class association to study the concept of a 100% carbon mast of a slightly increased height, along with an adapted mainsail. The new rig would allow both weight reduction and sail area augmentation, and would thus offer a significant gain of power.
In this project Julian Bethwaite would not be developing the rig but would be the assessing authority, making sure that this evolution would be for the best interest for all 49er sailors, represented by the 49er class association. He would have to make sure that switching to a new rig is viable in terms of performance, production capacity and equity among sailors.
I was for my part involved in the performance assessment part, the production and commercial aspects being out of my competence field and did not fit with the objectives of my internship.
Beyond the weight reduction granted by using carbon fibre instead of alloy, it was obvious that a carbon mast would have a significantly different behaviour from a "classical" alloy mast, under both static and dynamic loads. That is why builders were required to provide a mast-sail combination, in order to offer a performing "sail-away" package, that would not require further mainsail adaptation.
2.The new rigsTwo companies have answered positively to this design challenge and have produced mast-
sail combination : CST composites in from Sydney region and Southern Spars from New Zealand.
A) Mast fabrication techniques
Both companies used different techniques to produce their masts : CST masts are Filimante wound, whereas Southern Spars masts are Table wound.
Both use male moulds, called mandrels that are normally made of steel or alloy and represent the internal shape of the mast.
In the case of the Filimante wound, the mandrel is set on a computer-controlled rotating machine. Alongside the mandrel is set up a guide that can move up and down and lays a carbon thread on the mandrel. By varying the speed and rotation and the speed of travel of the guide, you can trim the angle to which the thread is lead down. As the thread is an unidirectional carbon fibre the angle variation alters the properties of the material.
Table wound is quite different : an operator cuts various layers of carbon fibre cloth, mostly unidirectional. Then the layers are wrapped around the mandrel and stacked up in various orientations.
For both techniques the mast is then wrapped in cellophane, that consolidates it, baked in an oven so the metallic mandrel dilates and force the carbon to expand. When the whole piece cools the carbon keeps the same shape whereas the mandrel contracts so it can just be pulled off.
Filimante wound has the advantage of being fully automatic so the mast tubes can be standardised whereas Table wound requires human intervention and high skill so the quality of the finished product can vary a lot. But table wound is a very quicker process and allows better control of the tube properties through a wider range of angle and material interlay combination
B) Rig characteristics
On the 15h of May we received the Southern Spars mast and sail for testing. CST composite have continued their mast development throughout the month of May, coming to us with different prototypes of their masts and sails that they have refined with the time and the final product was delivered on May 31st for us to test.
So we were in possession of two new masts and sails that we had to assess, plus the standard rig that would be the reference point for all tests, as it is a sure and fully working rig for ten years.
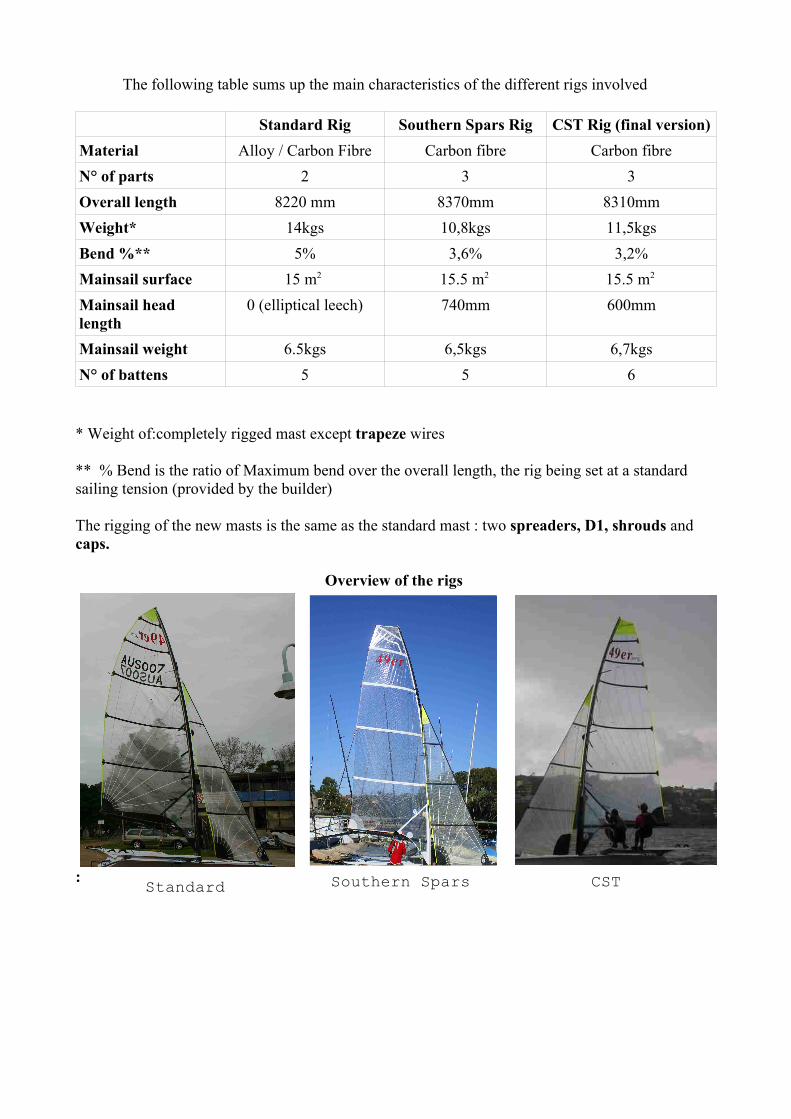
The following table sums up the main characteristics of the different rigs involved
Standard Rig Southern Spars Rig CST Rig (final version)Material Alloy / Carbon Fibre Carbon fibre Carbon fibreN° of parts 2 3 3Overall length 8220 mm 8370mm 8310mmWeight* 14kgs 10,8kgs 11,5kgsBend %** 5% 3,6% 3,2%Mainsail surface 15 m2 15.5 m2 15.5 m2
Mainsail head length
0 (elliptical leech) 740mm 600mm
Mainsail weight 6.5kgs 6,5kgs 6,7kgsN° of battens 5 5 6
* Weight of:completely rigged mast except trapeze wires
** % Bend is the ratio of Maximum bend over the overall length, the rig being set at a standard sailing tension (provided by the builder)
The rigging of the new masts is the same as the standard mast : two spreaders, D1, shrouds and caps.
Overview of the rigs
: Southern SparsStandard CST
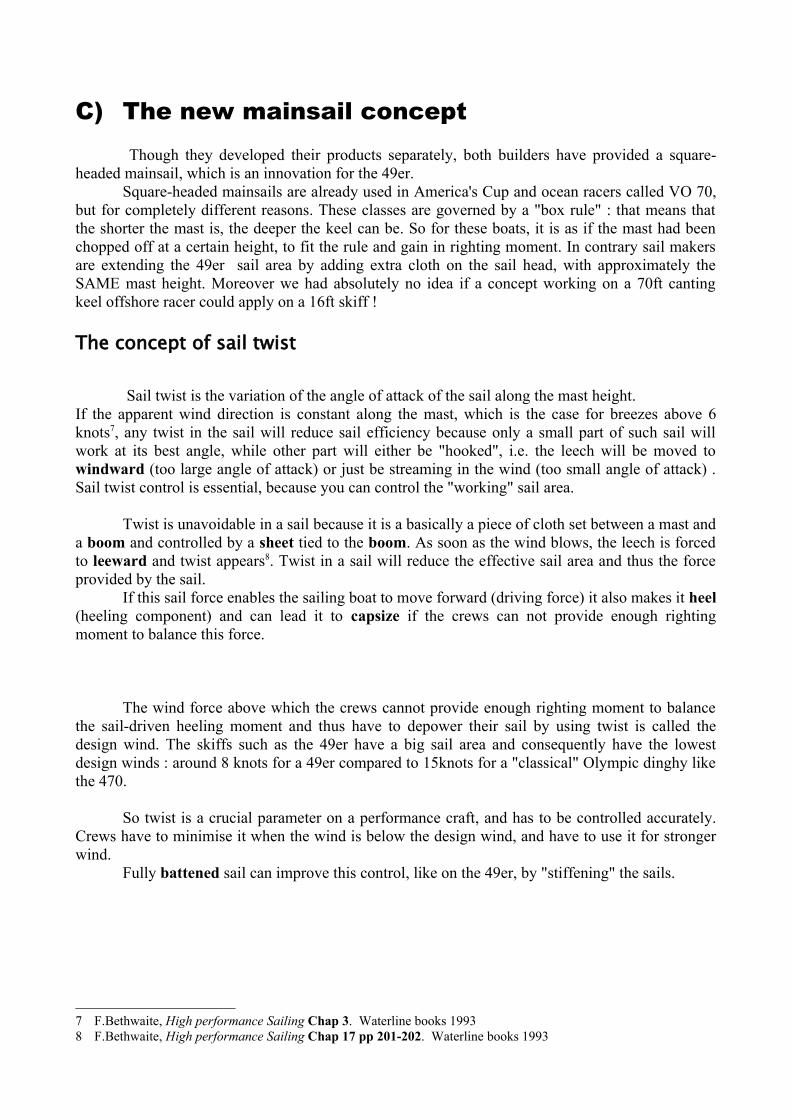
C) The new mainsail concept Though they developed their products separately, both builders have provided a square-
headed mainsail, which is an innovation for the 49er.Square-headed mainsails are already used in America's Cup and ocean racers called VO 70,
but for completely different reasons. These classes are governed by a "box rule" : that means that the shorter the mast is, the deeper the keel can be. So for these boats, it is as if the mast had been chopped off at a certain height, to fit the rule and gain in righting moment. In contrary sail makers are extending the 49er sail area by adding extra cloth on the sail head, with approximately the SAME mast height. Moreover we had absolutely no idea if a concept working on a 70ft canting keel offshore racer could apply on a 16ft skiff !
The concept of sail twist
Sail twist is the variation of the angle of attack of the sail along the mast height. If the apparent wind direction is constant along the mast, which is the case for breezes above 6 knots7, any twist in the sail will reduce sail efficiency because only a small part of such sail will work at its best angle, while other part will either be "hooked", i.e. the leech will be moved to windward (too large angle of attack) or just be streaming in the wind (too small angle of attack) . Sail twist control is essential, because you can control the "working" sail area.
Twist is unavoidable in a sail because it is a basically a piece of cloth set between a mast and a boom and controlled by a sheet tied to the boom. As soon as the wind blows, the leech is forced to leeward and twist appears8. Twist in a sail will reduce the effective sail area and thus the force provided by the sail.
If this sail force enables the sailing boat to move forward (driving force) it also makes it heel (heeling component) and can lead it to capsize if the crews can not provide enough righting moment to balance this force.
The wind force above which the crews cannot provide enough righting moment to balance the sail-driven heeling moment and thus have to depower their sail by using twist is called the design wind. The skiffs such as the 49er have a big sail area and consequently have the lowest design winds : around 8 knots for a 49er compared to 15knots for a "classical" Olympic dinghy like the 470.
So twist is a crucial parameter on a performance craft, and has to be controlled accurately. Crews have to minimise it when the wind is below the design wind, and have to use it for stronger wind.
Fully battened sail can improve this control, like on the 49er, by "stiffening" the sails.
7 F.Bethwaite, High performance Sailing Chap 3. Waterline books 19938 F.Bethwaite, High performance Sailing Chap 17 pp 201-202. Waterline books 1993

The following pictures illustrate the difference of sail shape with the wind
Wind ~6knots very low twist Projected sail shapeApparent wind ~30° from bow
Wind ~12 knots : controlled twist Projected sail shape. Apparent wind ~22° from bow
Note the different positions of the crew on the boat to provide adapted righting moment

The difficulty with a square-headed mainsail
So with a square headed mainsail, you add extra cloth on the leech section, exactly where it is harder to be controlled. A more "pointy-shaped" sail tip ensures a better control of the sail shape as the upper end of the leech (soft) is directly tied to the top of the mast (stiff) .
Moreover, the increased surface of the square-headed mainsail would have a greater influence on the rest of the sail, and would be more penalizing if not correctly trimmed, because it will destabilise the whole leech if flapping for instance.
Comparison of the standard mainsail head with the Southern spars mainsail
Note the difference of luff height between the two sails
3. Test objectives and protocol3.
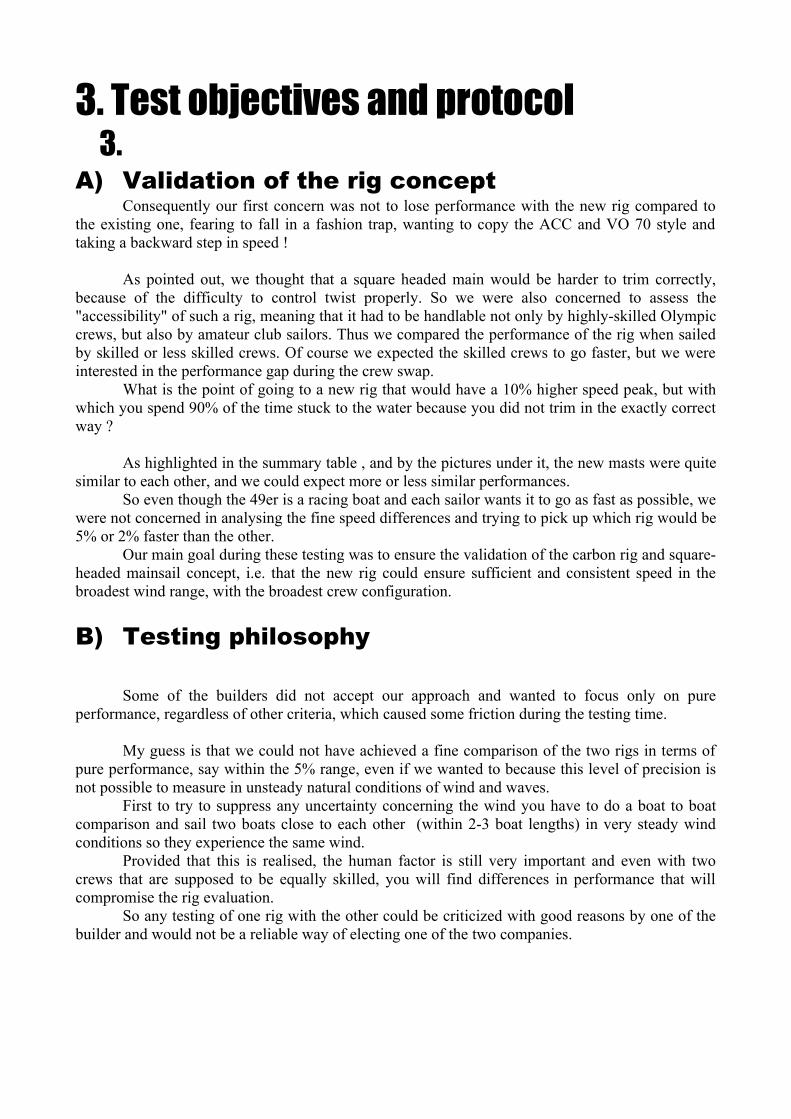
A) Validation of the rig conceptConsequently our first concern was not to lose performance with the new rig compared to
the existing one, fearing to fall in a fashion trap, wanting to copy the ACC and VO 70 style and taking a backward step in speed !
As pointed out, we thought that a square headed main would be harder to trim correctly, because of the difficulty to control twist properly. So we were also concerned to assess the "accessibility" of such a rig, meaning that it had to be handlable not only by highly-skilled Olympic crews, but also by amateur club sailors. Thus we compared the performance of the rig when sailed by skilled or less skilled crews. Of course we expected the skilled crews to go faster, but we were interested in the performance gap during the crew swap.
What is the point of going to a new rig that would have a 10% higher speed peak, but with which you spend 90% of the time stuck to the water because you did not trim in the exactly correct way ?
As highlighted in the summary table , and by the pictures under it, the new masts were quite similar to each other, and we could expect more or less similar performances.
So even though the 49er is a racing boat and each sailor wants it to go as fast as possible, we were not concerned in analysing the fine speed differences and trying to pick up which rig would be 5% or 2% faster than the other.
Our main goal during these testing was to ensure the validation of the carbon rig and square-headed mainsail concept, i.e. that the new rig could ensure sufficient and consistent speed in the broadest wind range, with the broadest crew configuration.
B) Testing philosophy
Some of the builders did not accept our approach and wanted to focus only on pure performance, regardless of other criteria, which caused some friction during the testing time.
My guess is that we could not have achieved a fine comparison of the two rigs in terms of pure performance, say within the 5% range, even if we wanted to because this level of precision is not possible to measure in unsteady natural conditions of wind and waves.
First to try to suppress any uncertainty concerning the wind you have to do a boat to boat comparison and sail two boats close to each other (within 2-3 boat lengths) in very steady wind conditions so they experience the same wind.
Provided that this is realised, the human factor is still very important and even with two crews that are supposed to be equally skilled, you will find differences in performance that will compromise the rig evaluation.
So any testing of one rig with the other could be criticized with good reasons by one of the builder and would not be a reliable way of electing one of the two companies.
I would like to underline the commercial importance for both companies of that evaluation : the elected one would be granted a significant amount of mast and sail orders, that will represent a great amount of money. Thus people sometimes were under pressure during the testing, and we had to be impartial and use our testing system and protocol within its limits. We avoided extrapolating any data or drawing conclusion too quickly and too strongly.
So we really focused on having the standard rig as a reference, and not comparing the new rigs to each other. This approach has three crucial consequences :– We insured that we would not miss any performance back step– Knowing that the standard rig has been fully optimized over the last decade, if the new rig
appeared have at least similar performance after only a few months of developments, we would be confident that over time and the optimization the rig at its full potential would be significantly better than the existing one !
– We avoided the trap of the rig competition in terms of fine performance, and its consequences in terms of pressure from the builder
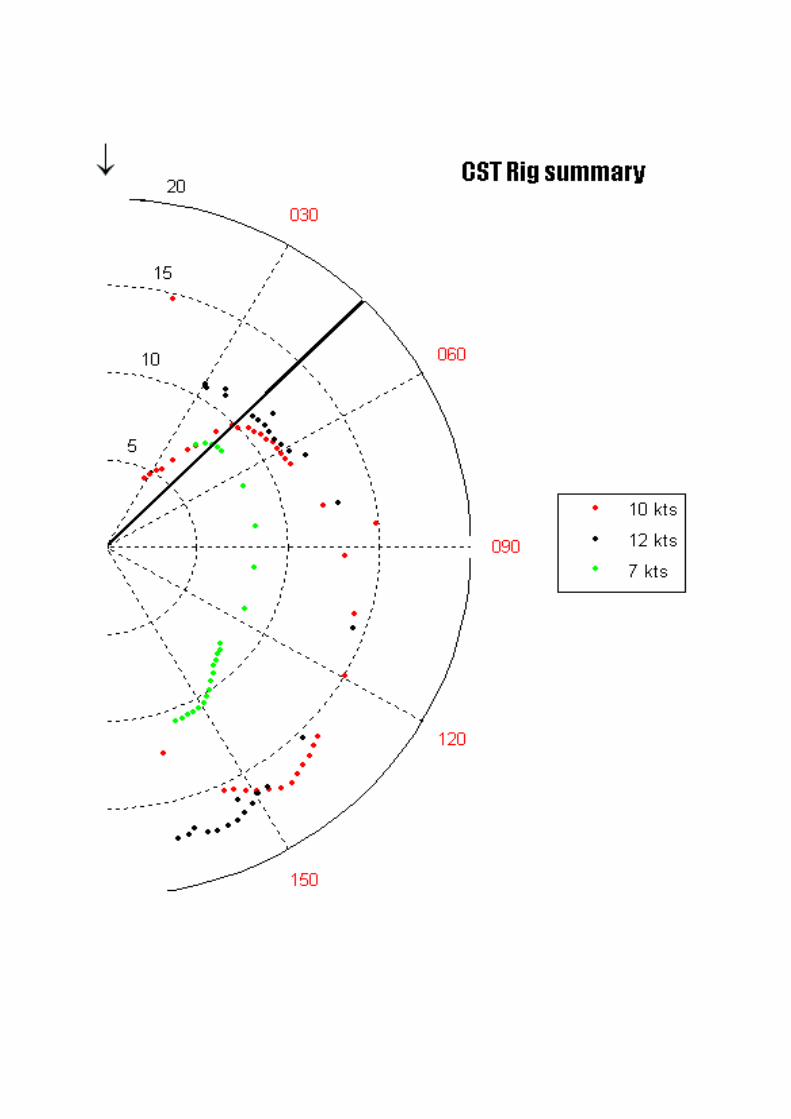
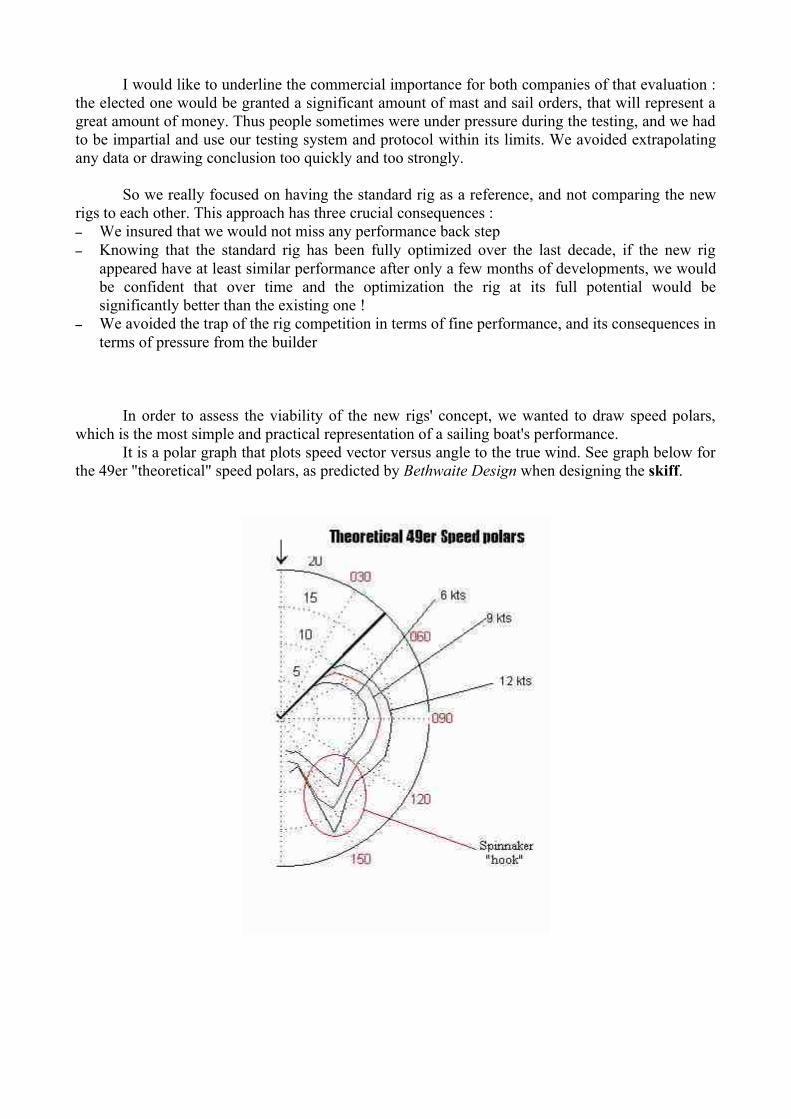
In order to assess the viability of the new rigs' concept, we wanted to draw speed polars, which is the most simple and practical representation of a sailing boat's performance.
It is a polar graph that plots speed vector versus angle to the true wind. See graph below for the 49er "theoretical" speed polars, as predicted by Bethwaite Design when designing the skiff.

C) MaterialTo test the rig performance, we equipped 49ers with an on board GPS that automatically
recorded speed, heading, position and time every two seconds.This acquisition rate did not allow us to analyse fine dynamic attitudes such as the rig
dynamic behaviour to a gust for instance, but as we wanted to focus more on speed analysis during a whole tack in which typical duration is 2 minutes, we had at least 60 recorded points per tack, which was sufficient.
The GPS in speedometer mode (the mode we used) had an error of less than .2 knot (constructor source), i.e. less than 2.5% at the typical speed of 8 knots, which was accurate enough for our purpose.
The other data we needed to have in order to assess the rigs were both wind speed and direction. The wind was measured on the water, aboard an inflatable powerboat, as close as possible to the sailing boats (distance < 200m). I used a standard anemometer and a standard compass with a light balanced feather on top of it. This data was cross-checked with meteorological wind readings, available on the Internet. Most of the tests were done at a distance less than 1 nautical mile from the station.
D) On-the-water protocolThe classical testing protocol was to sail the boats on the water for a given wind and crew
configuration, focusing on the "racing" angles, i.e. around 45° (upwind tack) and 150° (downwind tack, with spinnaker) to the true wind and recording the wind.
When doing two boats testing, the important issue was to insure fairness between the two boats : they have two be close enough to get the same wind but they should not interfere with each other. This is not hard to achieve and every racing sailor or coach knows that the boat have to be at one or two boat lengths of distance and on the same wind perpendicular direction.
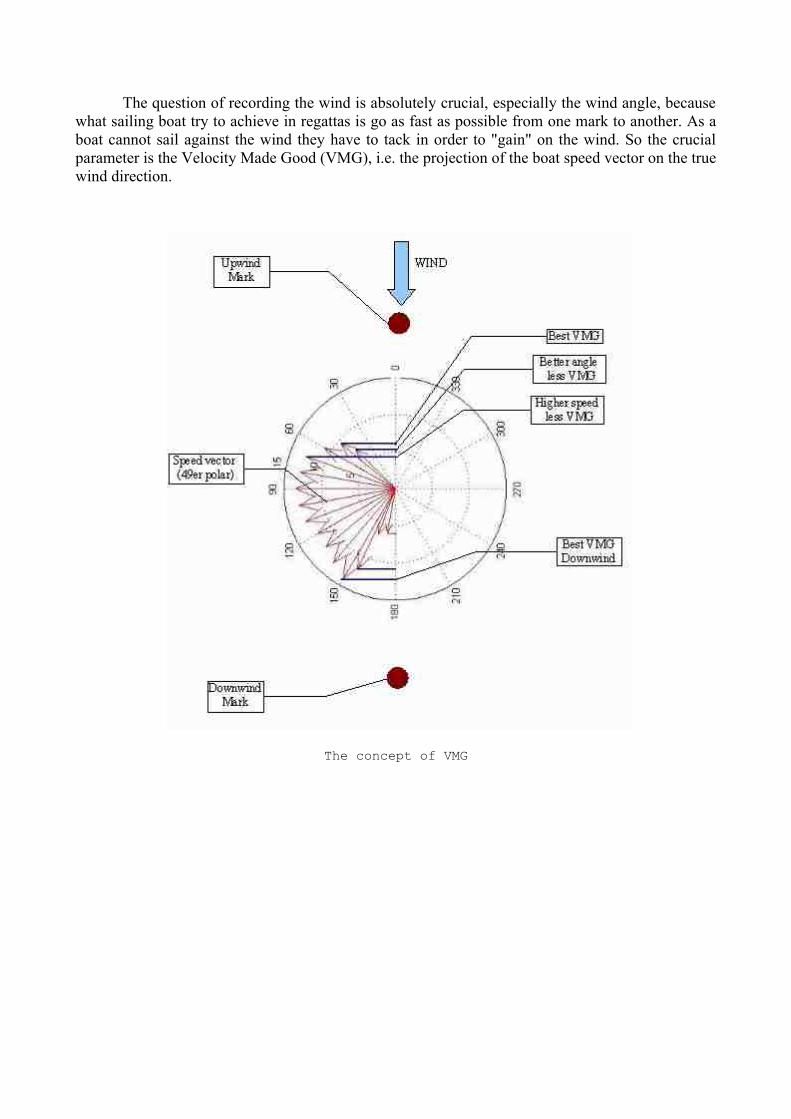
The question of recording the wind is absolutely crucial, especially the wind angle, because what sailing boat try to achieve in regattas is go as fast as possible from one mark to another. As a boat cannot sail against the wind they have to tack in order to "gain" on the wind. So the crucial parameter is the Velocity Made Good (VMG), i.e. the projection of the boat speed vector on the true wind direction.
The concept of VMG
4. ResultsA) Overview
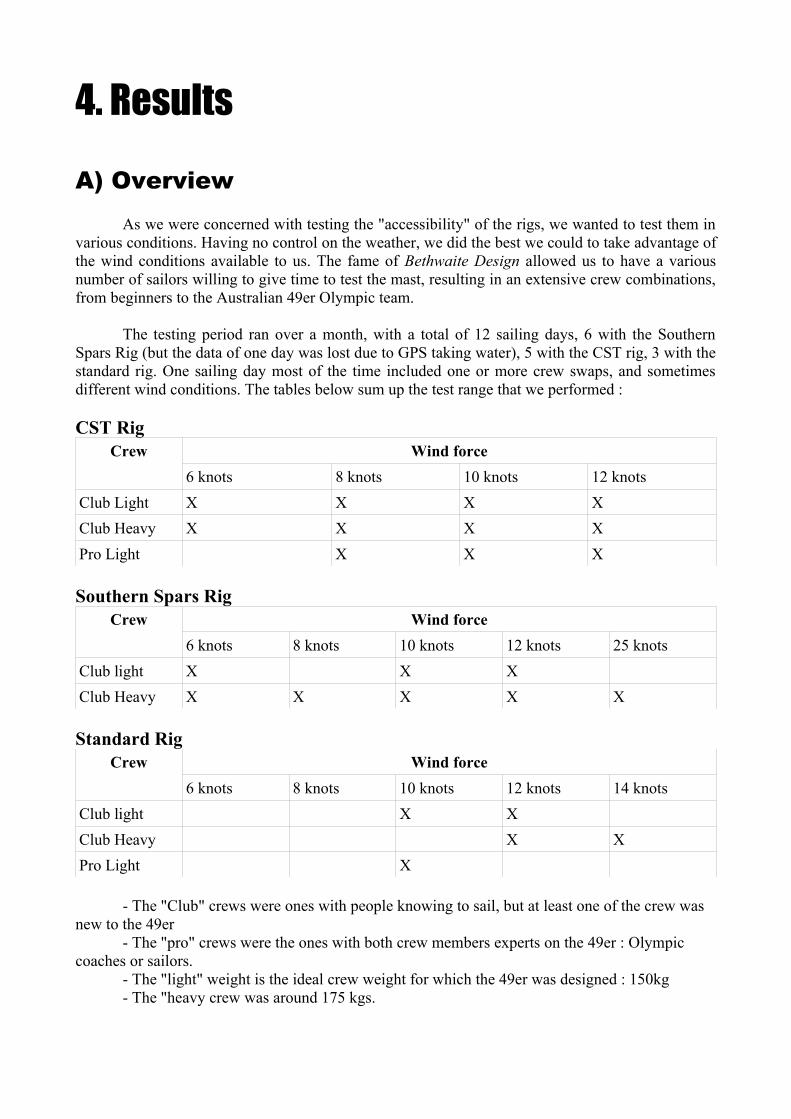
As we were concerned with testing the "accessibility" of the rigs, we wanted to test them in various conditions. Having no control on the weather, we did the best we could to take advantage of the wind conditions available to us. The fame of Bethwaite Design allowed us to have a various number of sailors willing to give time to test the mast, resulting in an extensive crew combinations, from beginners to the Australian 49er Olympic team.
The testing period ran over a month, with a total of 12 sailing days, 6 with the Southern Spars Rig (but the data of one day was lost due to GPS taking water), 5 with the CST rig, 3 with the standard rig. One sailing day most of the time included one or more crew swaps, and sometimes different wind conditions. The tables below sum up the test range that we performed :
CST RigCrew Wind force
6 knots 8 knots 10 knots 12 knotsClub Light X X X XClub Heavy X X X XPro Light X X X
Southern Spars RigCrew Wind force
6 knots 8 knots 10 knots 12 knots 25 knotsClub light X X XClub Heavy X X X X X
Standard RigCrew Wind force
6 knots 8 knots 10 knots 12 knots 14 knotsClub light X XClub Heavy X XPro Light X
- The "Club" crews were ones with people knowing to sail, but at least one of the crew was new to the 49er
- The "pro" crews were the ones with both crew members experts on the 49er : Olympic coaches or sailors.
- The "light" weight is the ideal crew weight for which the 49er was designed : 150kg - The "heavy crew was around 175 kgs.
B) Data processing
As we did not have continuous wind recording device such as an onboard wind calculator, common on racing yachts, I had to take wind readings from the powerboat as often as possible. The best I could achieve was a reading every 2 minutes, but this frequency was only necessary for unstable winds. The average wind recording frequency was one reading every five minutes during the tests.
When recording the wind I noted the wind direction and speed, for the average wind and gusts. Of course recording the wind at best every two minutes did not allow me to record the fine wind oscillations of gusts and lulls around the steady average wind. A good sailor has to take these variations into account to steer his boat or trim his sails. The problem was that the typical time duration of these wind variations being of 10-20 seconds (see F. Bethwaite, op. cit. for extensive study of the wind patterns) they appeared on the GPS record, significantly augmenting the scatter of the data.
To draw polars, I had to get rid of the scatter, and I used two methods to achieve it:– I averaged the speeds for each relative wind angle, and combined it with the average wind, to
get "average" polars– I picked up the highest speed for each wind angle and combined it with the gust wind speed and
thus got "gust" polars. With that I was able to get a broader wind range when drawing polars.
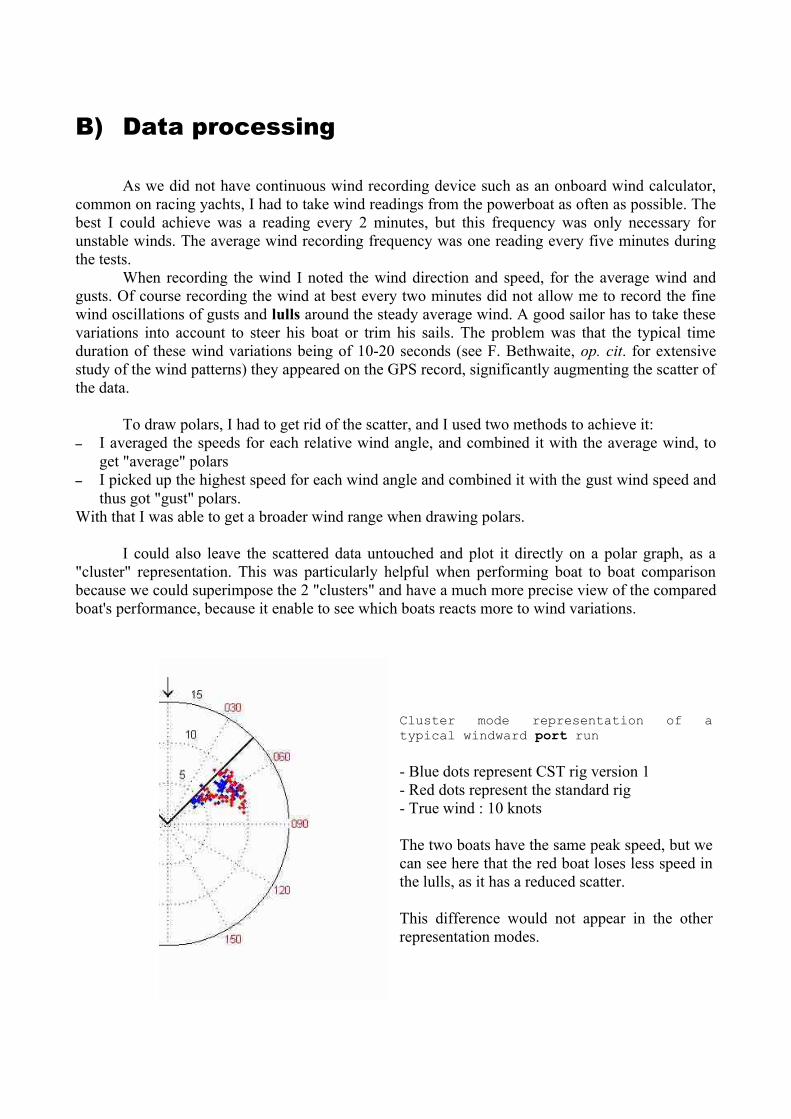
I could also leave the scattered data untouched and plot it directly on a polar graph, as a "cluster" representation. This was particularly helpful when performing boat to boat comparison because we could superimpose the 2 "clusters" and have a much more precise view of the compared boat's performance, because it enable to see which boats reacts more to wind variations.
Cluster mode representation of a typical windward port run
- Blue dots represent CST rig version 1- Red dots represent the standard rig- True wind : 10 knots
The two boats have the same peak speed, but we can see here that the red boat loses less speed in the lulls, as it has a reduced scatter.
This difference would not appear in the other representation modes.
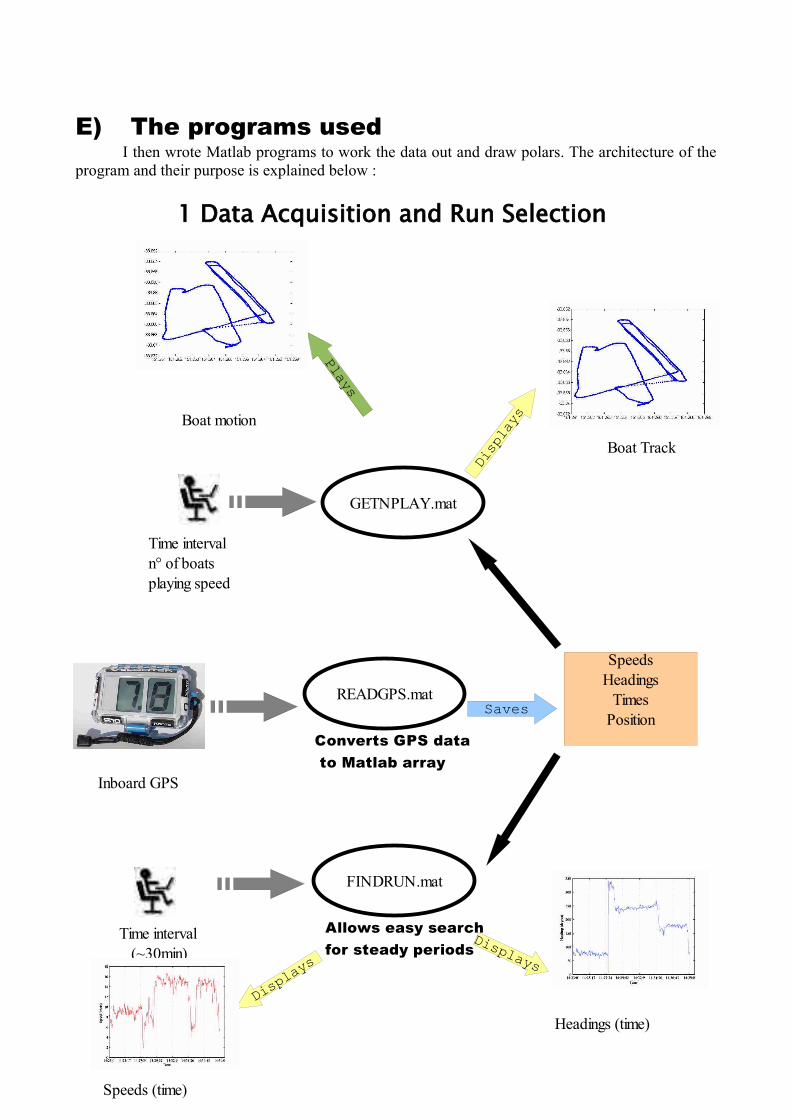
E) The programs used I then wrote Matlab programs to work the data out and draw polars. The architecture of the
program and their purpose is explained below :
1 Data Acquisition and Run Selection
Inboard GPS
Boat Track
Converts GPS data to Matlab array
GETNPLAY.mat
READGPS.matSaves
Boat motion
FINDRUN.mat
Time intervaln° of boatsplaying speed
Displays
Plays
Displa
ys
SpeedsHeadings
TimesPosition
Speeds (time)
Headings (time)
Displays
Allows easy search for steady periods
Time interval (~30min)
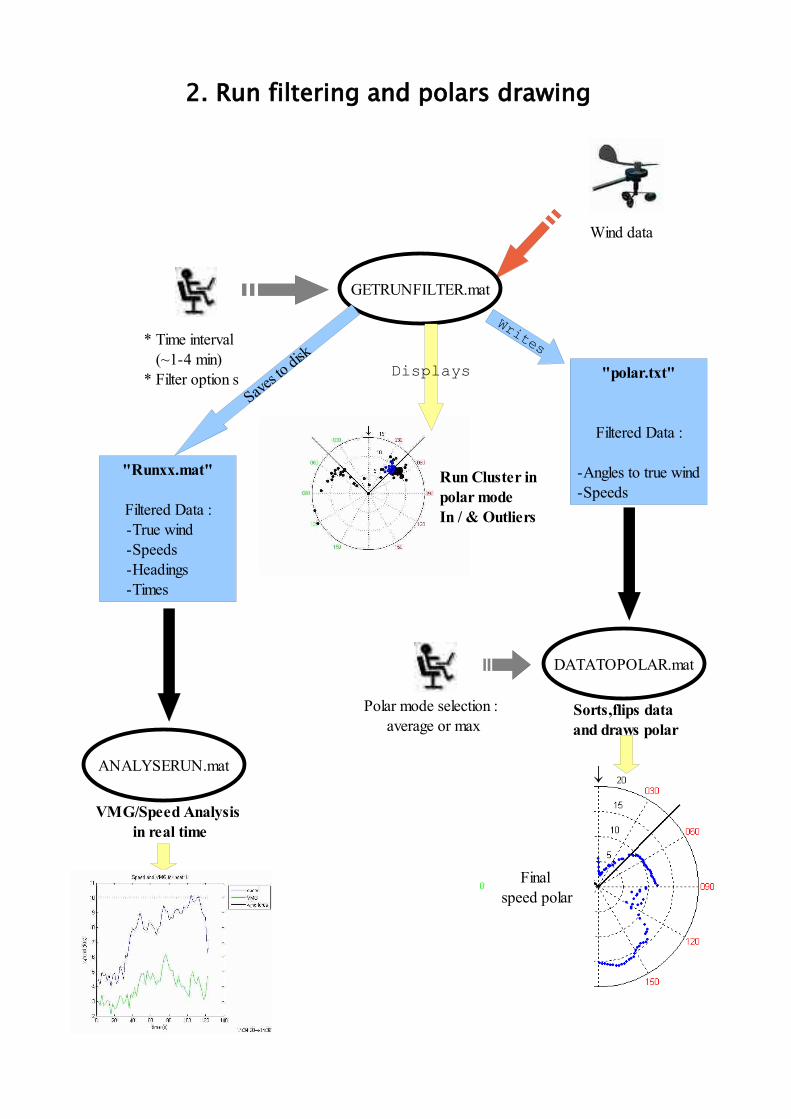
2. Run filtering and polars drawing
VMG/Speed Analysis in real time
* Time interval (~1-4 min)* Filter option s
Writes
GETRUNFILTER.mat
"polar.txt"
Filtered Data :
-Angles to true wind-Speeds
Saves to
disk
"Runxx.mat"
Filtered Data : -True wind -Speeds -Headings -Times
Displays
ANALYSERUN.mat
Run Cluster in polar modeIn / & Outliers
DATATOPOLAR.mat
Sorts,flips data and draws polar
Wind data
Polar mode selection : average or max
Final speed polar
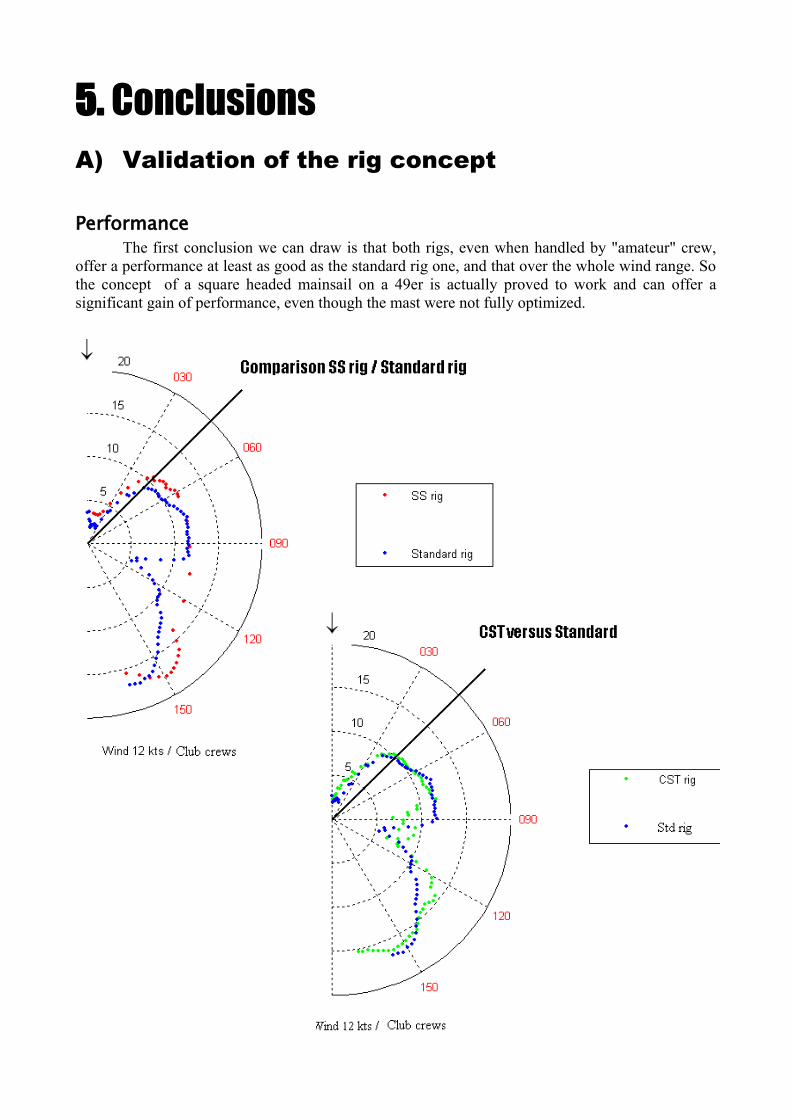
5. Conclusions
A) Validation of the rig concept
PerformanceThe first conclusion we can draw is that both rigs, even when handled by "amateur" crew,
offer a performance at least as good as the standard rig one, and that over the whole wind range. So the concept of a square headed mainsail on a 49er is actually proved to work and can offer a significant gain of performance, even though the mast were not fully optimized.
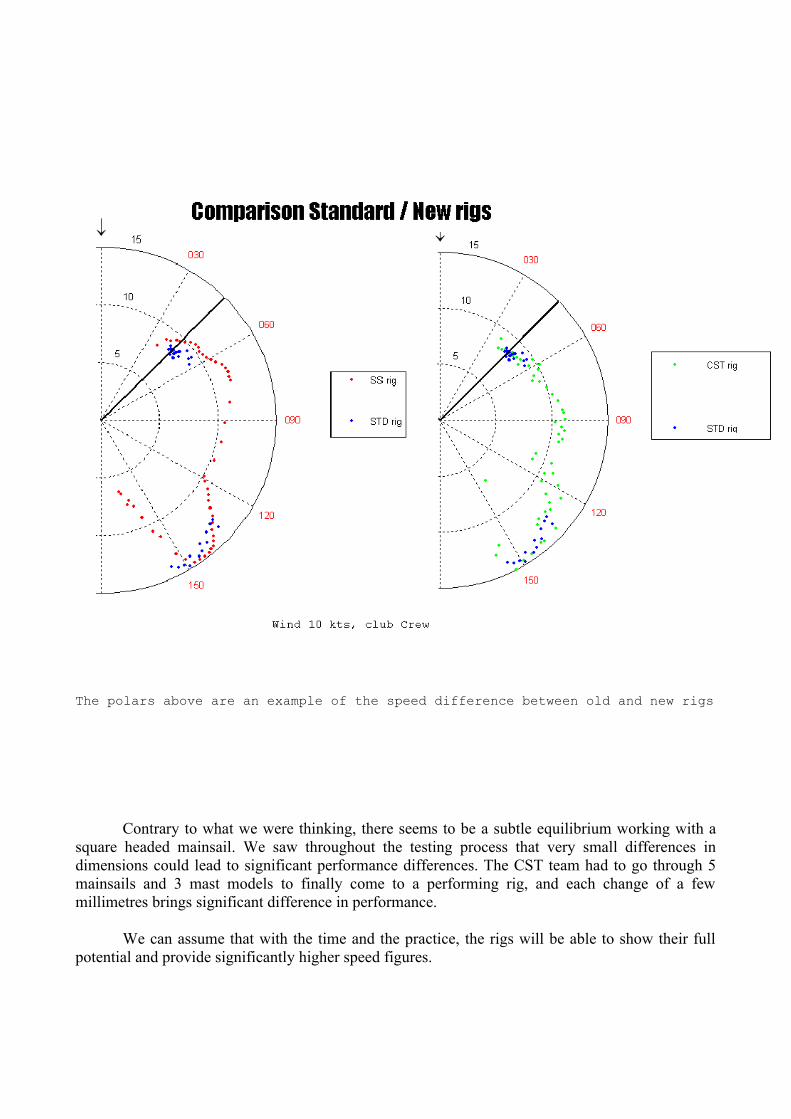
The polars above are an example of the speed difference between old and new rigs
Contrary to what we were thinking, there seems to be a subtle equilibrium working with a square headed mainsail. We saw throughout the testing process that very small differences in dimensions could lead to significant performance differences. The CST team had to go through 5 mainsails and 3 mast models to finally come to a performing rig, and each change of a few millimetres brings significant difference in performance.
We can assume that with the time and the practice, the rigs will be able to show their full potential and provide significantly higher speed figures.
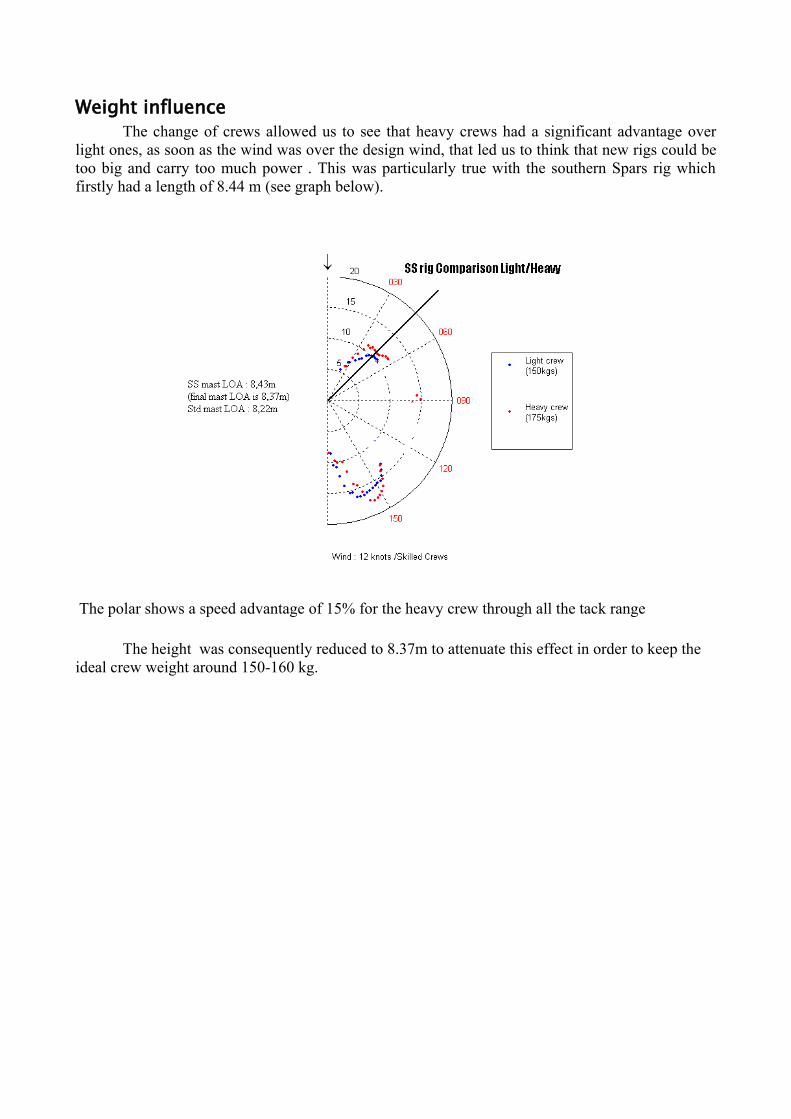
Weight influenceThe change of crews allowed us to see that heavy crews had a significant advantage over
light ones, as soon as the wind was over the design wind, that led us to think that new rigs could be too big and carry too much power . This was particularly true with the southern Spars rig which firstly had a length of 8.44 m (see graph below).
The polar shows a speed advantage of 15% for the heavy crew through all the tack range
The height was consequently reduced to 8.37m to attenuate this effect in order to keep the ideal crew weight around 150-160 kg.

Accessibility
The other assessed criteria was "accessibility", meaning that we were looking for differences between amateur and professional crews. The CST rig proved to be harder to handle, causing great differences between crews and showing bigger scatter on the cluster mode. It was hard to sail fast and thus required more attention in order to maintain good speed. In contrary the Southern spars rig was nicer to handle, being more tolerant to trimming errors and showing a reduced scatter on the cluster mode.
The scatter graph below illustrates that difference of behaviour
SS rig. True Wind 10 kts CST rig. True Wind 10 kts
The 2 rigs were sailed on a port Tack. CST shows more speed dispersion, whereas the points for the SS rig are more concentrated
Comparison of different crews for the CST rig
. The Southern spars was even sailed by an amateur crew on very strong wind conditions, and they were able to handle the boat correctly. On the other hand the performance gap between between a "Club" crew and a professional crew proved to be really important, much more than we could reasonably expect. Again this enforces our impression of the better accessibility of the Southern Spars rig at present.
B) Recalibration of the theoretical polarsUltimately this testing process allowed us to challenge the theoretical speed polars estimated
by the Bethwaite Design company. They proved to be quite close to the testing result we had, though they seemed to have a tendency to overestimate boat speed for a standard rig and would actually fit better to the new rig performance.With this testing we were able to recalibrate them by a scale factor of approximately 10 %
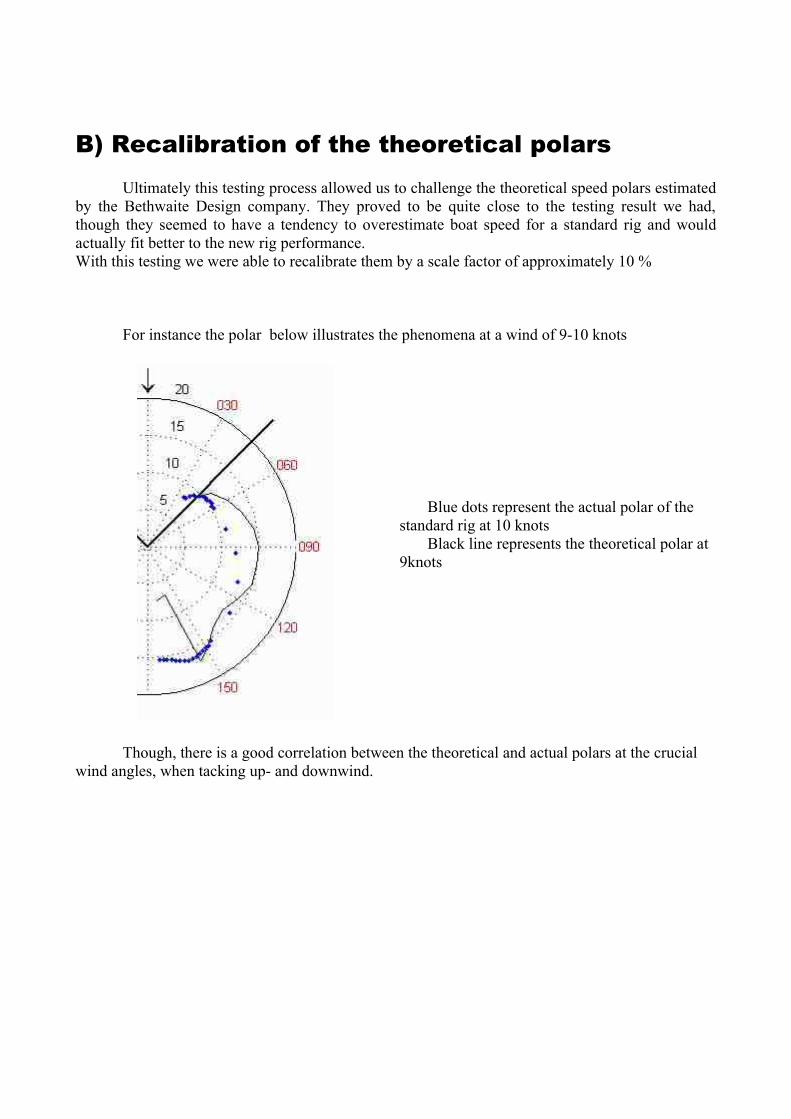
For instance the polar below illustrates the phenomena at a wind of 9-10 knots
Blue dots represent the actual polar of the standard rig at 10 knots Black line represents the theoretical polar at 9knots
Though, there is a good correlation between the theoretical and actual polars at the crucial wind angles, when tacking up- and downwind.

CONCLUSIONWhile my internship finshes, Julian Bethwaite is going to present the conclusions of our
work during these last three months to the 49er class official in Cascais, Portugal, during the world championships. The next step for the months to come is the decision of choosing one or the other mast builder and the actual building of the new 49er hull plug. Another student has just begun to work on the new wing design and its work will complete the performance development of the 49er. The new version of the skiff is to be operational for Beijing Olympics in 2008.
This internship was a really great experience for me, in the sense that I have been able to have a multidisciplinary overview of boat design and development, and have learned to work in a new environment in a foreign language. The most interesting part of it was the fact that I was offered the possibility to combine pure research with many practical aspects, because it was part of a structured project with tight schedules and expected results from sailors and builders.
For instance it was a chance for me to see the evolution of the designs through the different mast and sail model developed in May by the CST team. I was interested to understand how they were thinking and working to improve their prototypes, and see which criteria they assessed and how they modified it to come to the final product. On a more strategic and commercial point of view, it was also interesting to see how they interacted with my supervisor, who is the head of the jury that would have the final decision on the masts. Skiff sailing is a small world where everyone knows each other and sometimes the human factor can overtake the objective scientific criteria.
Scientifically speaking, it was innovative in many ways, and undoubtedly represents the most thorough performance study on the 49er skiff. The actual proof of the efficiency of the "fourth mode" sailing as well as the validation of a square headed mainsail on a skiff are completely new results, that are to be published soon in a specialized magazine.
In the very late days of the internship Frank Bethwaite came with some of the pieces of what could be the first skiff's velocity prediction program and shared them with me. With his knowledge on sail driving force and the results of the tow testings, we could be able to conceive such a program. I will keep this precious data and will try to work it out in the next months, being confident that it will find its place within my future studies in naval architecture next year.
APPENDIX 1 Tension reading apparatus
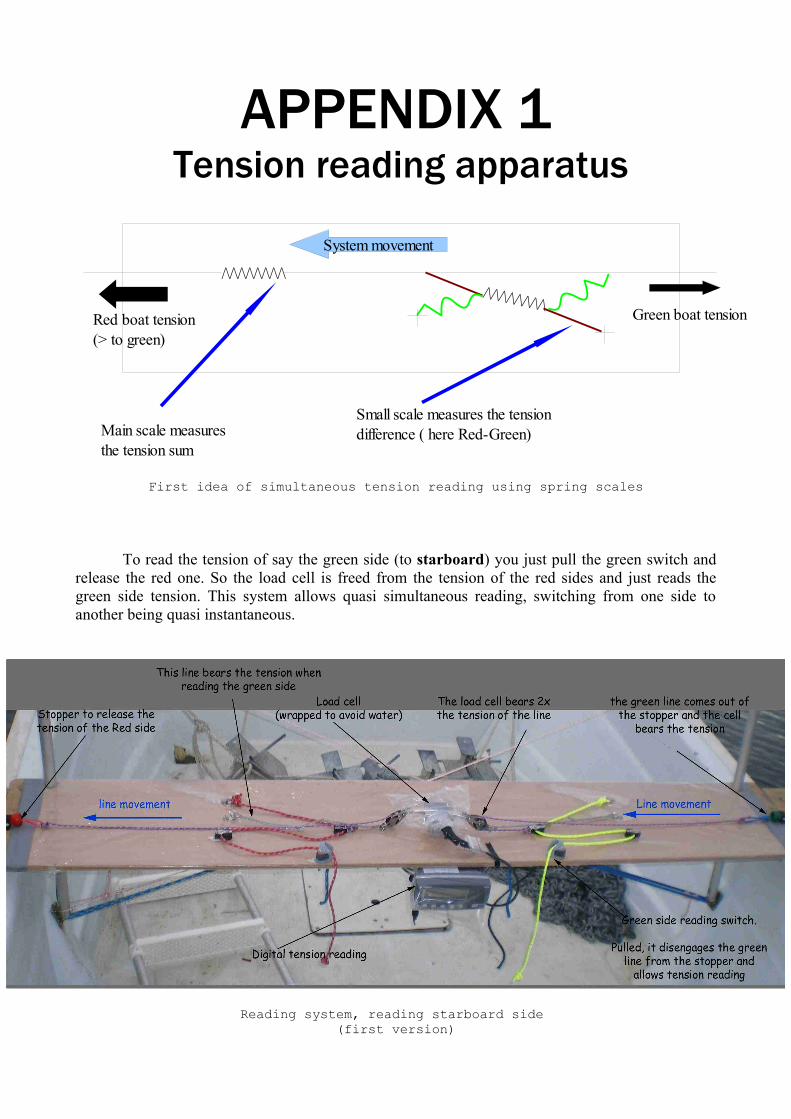
First idea of simultaneous tension reading using spring scales
To read the tension of say the green side (to starboard) you just pull the green switch and release the red one. So the load cell is freed from the tension of the red sides and just reads the green side tension. This system allows quasi simultaneous reading, switching from one side to another being quasi instantaneous.
Reading system, reading starboard side (first version)
/\/\/\/\/\/\/\/\/\/\/\/\/\/\/\/\
Red boat tension(> to green)
System movement
Small scale measures the tension difference ( here Red-Green)Main scale measures
the tension sum
Green boat tension
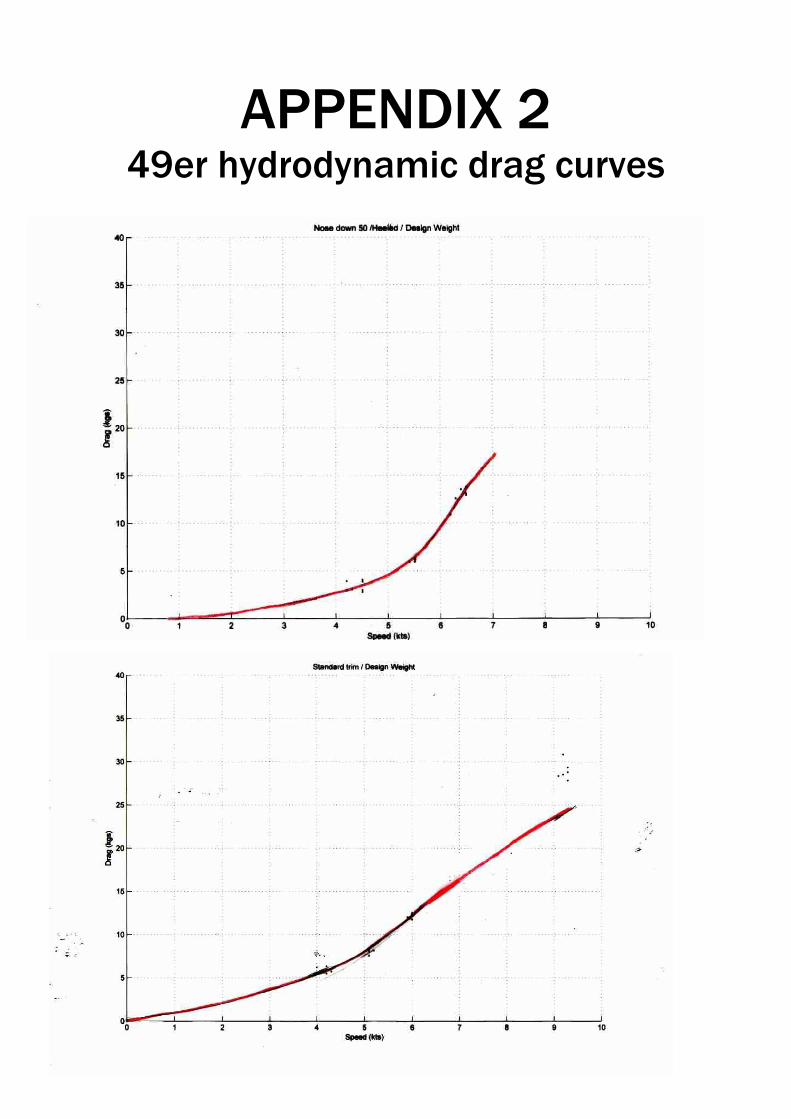
APPENDIX 249er hydrodynamic drag curves

APPENDIX 3CARBON RIG POLARS