internship assignment report
TRANSCRIPT

1
Internship Assignment Report
Simulation and Optimization of the Emas Semarang Container
Terminal Flow in Indonesia
Author:
Syed Ali Raza Rizvi
Supervisors:
Professor Syed Masood
Dr. Amir Abdekhodae
Co-Supervisor:
Research Student: Andre Sugiyono
June, 2009
Undergraduate Industrial and
Systems Engineering

2
ACKNOWLEDGEMENT
This report is the culmination of research work conducted by Syed Ali Raza Rizvi
and Andre Sugiyono at Swinburne University of Technology. The work is based
of from a six week internship program which started on May 18, 2009 and ended
on June 30, 2009. This research work was sponsored by the Faculty of
Engineering and Industrial Science professor, Professor Syed Masood. During
this internship, not only have I gained critical thinking and problem solving skills, I
have learned to utilize the Arena Simulation software and had the opportunity to
work in a team which will help me later in my career as an Industrial and Systems
Engineer.
I would like to thank Professor Syed Masood, Dr. Amir Abdekhodaee, and Andre
Sugiyono for being my mentor throughout the course of this research. I really
appreciate all the help, encouragement, and support that all of you have given
me during this internship. Thanks for everything.
Finally, I would like to thank my family. I would also like to thank my uncle,
Masroor Haider Rizvi and his wife Ismat Zehra, and their children Aun and Kisa,
along with Masood Haider Rizvi, my aunty, Nousheen Fatima Rizvi and my
cousins, Areeb, Minhal, Sakina, and Hussein for supporting me during my stay in
Australia. Spending time with my uncle’s family have changed me and made me
a better person. Now, I am able to better understand the importance of a family
bond. I would to conclude with my quote “Character of a person builds over time.”
Thanks

3
TABLE OF CONTENTS
Title Page 1
Acknowledgement 2
Executive Summary 4
Chapter 1: CONTAINER TERMINAL SYSTEM
1.1 Rationale, Setting and History of Containers 5
1.2 Description of Containers 6
1.3 Introduction and Motivation 6-7
1.4 Semarang Container Terminal Operations Overview 7
1.5 Research Background 8
1.6 Organization of Report 8
Chapter 2: LITERATURE REVIEW
2.1 Introduction 9
2.2 Container Terminal System Operations 10-11
2.3 Handling Equipment In Container Terminals 12
2.4 Facility Layout 12
2.5 Optimization Approaches 12-16
2.6 Steps, Methods, Algorithms, and Facility Layout 17-26
for Container Terminal
2.7 Simulation and Modeling 27-31
Chapter 3: CONTAINER TERMINAL SYSTEM OF SEMARANG
3.1 Background 32
3.2 Problem Definition 33
3.3 Description of Simulation Model 33-36
3.4 Detailed Explanation of Simulation Model 37-39
Chapter 4: RESULTS AND VALIDATION
4.1 Method 40
4.2 Results 41-46
4.3 Discussion 47
Chapter 5: CONCLUSION 48
5.1 RECOMMENDATIONS 48-50
Reference 51-54

4
EXECUTIVE SUMMARY
Container Terminals are used as a basis to transship containers from one
location to another. Inside the terminal, there are several container handling
equipments that are used to route the containers from one station to the next.
Anticipatory step in the growth of container arrivals and unproductive operating
procedures of the container terminal system in Port Of Indonesia III Semarang
has led to an inefficient system. As a result, the Semarang Sea Port manifestly
needs the supervision of professional management. This report is a case study of
the container terminal system operation in the Port Of Indonesia III Branch
Tanjung Emas Semarang. The main objective of this case study is to analyze the
systems operation to reduce the current cycle time and to increase utilization of
available resources for the Semarang Container Terminal System. To better
understand the current system, the simulation is focused on analyzing time to
service (how long containers wait for service), completion time (how long it takes
to complete process of unloading, loading, transport and stacking containers),
and the utilization of available resources. This case study uses Arena Simulation
software to model and optimize the current flow of the Semarang Container
terminal system. The simulation model consists of arrivals of deep sea vessels
with TEU (20 foot-equivalent unit) and 2 TEU (forty feet-equivalent-unit) size
containers to be loaded and unloaded with the following machines: quay crane,
internal trucks, and RTG/RMG. The simulation model shows that the cycle time
of the current system can be reduced in conjunction with other factors such as
queue build-up and delay in process due to unavailability of resources. For
various decision problems, an overview of relevant literature review is presented.
The report also presents various scenarios, algorithm, and techniques that are
utilized to optimize the container handling flow system of the Semarang Sea port
in Indonesia. Finally, after running the simulation for the container handling
system, a significant reduction in the cycle time and a drastic increase in the
productivity of the system were observed.
Keywords:
Container Terminals, Sea port, simulation, resource, decrease, inefficient system,
container handling system
Chapter 1: CONTAINER TERMINAL SYSTEM
1.1 Rationale, Setting, and History of Containers
As man stride toward civilization, he discovered seas, river, mountains and other
wonders of nature. The waterways of the world have provided man with much
greater mobility than before. The mobility provided by seas and river has
enriched and enlightened their users. Ships allowed people to travel and barter
their products with other people residing far and near. As time progressed,
trading via ship was becoming a common practice. People started trading more
and more goods for agricultural and industrial specialties of other lands. The
process of bulk trading was becoming unproductive and inefficient. Some of the
factors that led to this disturbance were weather, pilferage, in-transit damage and

5
pirates. Trading with ship was becoming harder, so there were numerous efforts
in the establishment of a better procedure for shipping (22).
In 1948, the first container was built by Transportation Corps. It was the called
the Transporter. The transporter was a rigid steel reusable container capable of
carrying 9000 pounds. It was 8’6’’ long, 6’5’’ wide, and 6’10” height. Figure 1
displays an image of a container from early 1950's. In late 1952 Transportation
Corps came with an invention which replaced the Transporter. It was called the
Container Express (CONEX). A shipment that took 55 days to deliver was
reduced to 27 days. Later during the Vietnam conflict, Sea Land Container Inc.
first introduced the containers that were designed to carry only containers.
Intermodal containers were then developed that could be shipped via truck, rail,
air or ship. The use of the intermodal containers were one of the most important
component of the global transportation in most industrialized countries (8).
Figure 1: Picture of a crane moving a container during early 1950’s
1.2 Description of Containers
The introduction of containers resulted in vast improvements in port handling
efficiency. Not only it lowered costs and help lowered freight charges, but it was
also responsible in boosting trade flows. Almost every manufactured product
humans consume spends some time in a container (7).
Containers are the foundation of a unit load concept. Containers are boxes whose
contents are not to be unpacked in between transfers. They are designed for
handling several types of materials and freight productively. One of the main
advantages of containers is the protection against weather, shrinkage, and
intransit damage. They also provide with improved and simplified control and
scheduling resulting in a cost-effective flow of the cargo (25). In Today’s market,
there are generally two conventional sized or standard containers used in cargo.
In maritime shipping, the containers are classified as the 1TEU (twenty-
feetequivalent-unit) and 2 TEU (forty-feet-equivalent-unit)(23).
The competition between container terminals has increased due to large growth
rates on major sea freight container routes. Today over 60 % of the world’s
deepsea general cargo is transported in containers, whereas some routes,
especially between economically strong and stable countries, are containerized
up to 100 % (Muller, 1995). An international containerization market analysis

6
shows that in 1995, 9.2 million Twenty feet Equivalent Units (TEU) were in
circulation. The container fleet had almost doubled in ten years from a size of 4.9
million TEU in 1985(27).
1.3 Introduction and motivation
Over the years, Containers Terminals have gained significant importance in
worldwide trade and in transportation of goods. Continuous growth in the
transshipment flow has become a crucial problem of the container terminal
system. As a result, new container terminals are being built and old ones are
forced to enlarge handling capacities and strive to achieve gains in productivity.
Due to increased sea port utilization, container terminal now face the challenge of
unloading freight from large ships of size 2 TEU’s in the shortest possible time. In
most cases this requires to build a decision support system that allows efficient
combination of activities within the terminal system.
The size of the container has directly impacted the flow process of the container
terminal system. Nowadays a typical container is either 1 TEU or 2 TEU in
length. The size is directly correlated to the weight of the container. Since the
containers are large and heavy, one quay crane can only load or unload one
container at a time. As a result there is queue build up and delays in the process
flow of the container terminal system. An efficient terminal is one that allows the
quick transhipment of containers to and from ships. This benefits the carriers, as
it provides significant operational efficiencies, and also the terminals, as it allows
them to handle a higher volume of containers per day. Most business sectors
are aiming to increase terminal throughput, and in particular, to decrease ship
turnaround times at the terminal.
1.4 Semarang Container Terminal Operations Overview
After a ship arrives at the port, it is assigned a terminal. Next, quay cranes unload
containers from the ship onto vehicles called internal trucks for transportation to
selected storage locations. At storage yard, RTG or RMG, yard cranes, will
remove the containers from the vehicle for storage. The container will be stored
in the Storage Yard until there is a call to move it to Landside. From the Storage
Yard, RTG or RMG is used to un-stack the containers from the Yard and the
containers are placed on the internal truck. The internal Truck transports the
containers to an assigned lot on the Landside. Similarly, for ship loading, RTG or
RMG, place containers onto vehicles for transport from the storage locations to
the ship area. There, the containers are loaded onto the ship using the quay
cranes. Quay cranes, in general, are relatively immobile compared to yard
cranes. Yard cranes, on the other hand, can serve a large region in the storage
area. It is of no surprise that managing, controlling, and operating such a system
is very complex. At the operational level the questions are clear: how should
vehicles be dispatched to containers in the terminal area, what is an optimal
storage location for each unloaded container, what is the schedule of operations
on the quay cranes, how should yard cranes be dispatched to vehicles in the
storage area, and how should vehicles be routed between the ship area and the
storage area to avoid congestion (5)?

7
After further investigation of the terminal process, it can be said that these issues
are correlated. It is very unlikely to have a simulation model that addresses all the
operational level decisions of the system. In order to capture most of the
operations of the system, we decompose the problem into several simpler
problems that we can handle. Looking at each specific operation will give us a
better understanding of the system flow. Using our simulation, we study the
operations that deal with (a) assigning a terminal position for the arriving vessel
(b) using quay crane to unload or load container (c) dispatch vehicles to
containers, assigning unloaded containers to storage locations (d) locating yard
cranes in the storage yard and determining the sequence of locations served by
each crane. The simulation ignores issues such as traffic control, congestion,
and vehicle and crane failures. In this report, we analyze the decisions
mentioned above. Given decision in (a), we analyze the decisions in (b). All
decision is analyzed in a sequential manner. Looking at the decision separately
gives a better understanding of the system operations. Thus, in this report we
address the problem of (i) Time to service (how long containers wait for service),
(ii) Completion time (how long it takes to complete process of unloading, loading,
transport and stacking containers), (iii) the utilization of available resources (iv)
determining an optimal storage location for each unloaded container.(5,19)
1.5 Research Background
This research was initiated a year ago by andre suyigono at Swinburnce
University of Tecnology. In this report we have anyalyzed the terminal operation
of the Semarang Sea port in Indonesia. Due to constant growth in the Semarang
Sea port freight, the container terminal operations at the port have become
inefficient. Several steps are taken in finding an optimal solution for the container
terminal system of Semarang in Indonesia. Most of the concepts and algorithms
developed in the previous research will be used by this container terminal to
develop an effective system for their scheduling operations. As most container
terminal systems operate in a similar fashion, this research is applicable to a
wide variety of container terminals.
1.6 Organization of Report
This paper is organized as follows. In Chapter 2, we give a brief description of the
system in which we review the related literature and methods used by the
different container terminal system. In Chapter 3, we discuss the container
terminal system. In this chapter, we give the problem definition, present our
model and assumptions. In Chapter 4, we give validation for our simulation
results. We outline the several cases for our simulation give interpretation of the
results produced by these cases. Finally, in chapter 5 we present our conclusion
and recommendation for the container terminal system.

8
Chapter 2: LITERATURE REVIEW
2.1 Introduction
Presently, sea port is used for moving 90 percent of cargo and eighty percent of
the seaborne cargo is shipped in containers (30). Numerous factors have
contributed to rapid increase in ship transportation; some of the factors include
cost, time, and reliability of transportation. Companies are now using more ships
to import or export good from one country to the next. Not only are they saving
money, but they are gaining independence from air shipping. Table 1 displays the
biggest ISO companies controlling sea cargo(7).
Top 10 container shipping companies in order of TEU capacity, 2006
Company TEU capacity(20
feet) Market Share # of ships
A.P. Moller-Maersk Group 1,900,000+ 18.2% 600+
Mediterranean Shipping
Company S.A. 865,890 11.7% 376
CMA CGM 507,954 5.6% 256
Evergreen Marine
Corporation 477,911 5.2% 153
Hapag-Lloyd 412,344 4.5% 140
China Shipping Container
Lines 346,493 3.8% 111
American President Lines 331,437 3.6% 99
Hanjin-Senator 328,794 3.6% 145
COSCO 322,326 3.5% 118
NYK Line 302,213 3.3% 105
Table 1: Biggest ISO container companies
Table 1 shows how the increased number of ships and TEU capacity has created
competition around the world. The increased traffic of containers has lead to a
disturbance in terminal operations. Several steps have been taken to solve
problems such as the increase in operation time due to larger and wider vessels,
high personnel expenses, lack of qualified manpower, and for the higher
efficiency of land utilization of modern port facilities. These steps are discussed
in the section 2.5 of this report. In some advanced countries, ideas promoting
efficiency in response to the terminal disturbance, discussed in section 2.5 of the
report, have been practically implemented.

9
2.1 Containers and Container Terminal Operations
Due to the increase in air shipping rates, several companies switched to shipping
cargo via ships in containers. Containers are being used as sole means to
transport bulks of mail, packages, freight, goods, and other materials across the
world. Today, there are five standard length containers that are used in maritime
shipping. They include (a) the 20-ft unit which is equivalent to 6.1 m, (b) the 40-ft
unit which is about 12.2 m, (c) the 45-ft unit which is around 13.7 m, (d) the 48-ft
unit which is 14.6 m, and (e) the largest 53-ft unit which equates to 16.2 m in
length. The United States domestic containers are usually 48 ft (15 m) and 53-ft
used with rail and truck transportation. Container capacity is often expressed in
twenty-foot equivalent units (TEU). A typical unit measure of containerized cargo
capacity equals to one standard 20 ft (length) × 8 ft (width) container. This is an
approximate measure of the containers and it ignores the height of the box. An
equivalent of 9 ft 6 in (2.9 m) High cube and the 4-ft 3-in (1.3 m) half height 20 ft
(6.1 m) containers also classified as one TEU. The maximum gross mass for a
20 ft dry cargo container is 30,480 kg, and for a 40-ft (including the 2.87 m (9 ft 6
in) high cube container), it is 34,000 kg. Allowing for the tare mass of the
container, the maximum payload mass is therefore reduced to approximately
28,380 kg for 20 ft (6.1 m), and 30,100 kg for 40 ft (12 m) containers.[9] With the
arrival of even taller containers, further enlargement and restructuring is proving
necessary(7).
Figure 2: Typical ISO 20 feet Container
Understanding the properties of container is important, but we also need to
understand some basics of terminal operations. Let first define what is meant by
containerization. Containerization is a system of intermodal freight transport
using intermodal containers that are standardized by the International
Organization for Standardization (ISO). These can be loaded and sealed intact
onto container ships, railroad cars, planes, and trucks (7).

10
Container terminals are open systems of material flow with two external
interfaces which are used to control the terminal operations. The interfaces
include the quayside with loading and unloading of ships, and the landside where
containers are loaded and unloaded on/off trucks and trains. Most containers are
stored in the storage yard and landside in stacks which facilitates the decoupling
of quayside and landside operation. Upon an arrival of a ship at the port, a
container vessel is assigned to a berth equipped with quay cranes to load and
unload containers. Unloaded import containers are transported to yard positions.
These containers are placed close to a location where they will be transshipped
next. Containers that arrive by road or railway at the terminal are handled within
the truck and train operation areas. They are picked up by the internal equipment
and distributed to the respective stocks in the storage yard. Additional moves are
required if sheds and/or empty depots exist within a terminal; these moves
encompass the transports between empty stock, packing center, and import and
export container stocks (Fig. 2.2). Figure 2.2 highlight the operations of the
container terminal flow (27).
Figure 3: Container terminal and flow of transport
2.3 Handling Equipment in Container Terminals
Although there are several equipments that are utilized in the operations of the
terminal system, all of these handling equipments can be classified into two
categories: stocks and transport vehicles. The category stocks consists of the yard
stacks, ships, trains, and trucks. Stocks are statically defined by their ability to store
containers. Looking at stock from a dynamic point of view a storage (or loading)
instruction is necessary in defining the rules about how and where containers have
to be stored. Transport vehicles means either transport containers in two or three
dimensions. Cranes and vehicles for horizontal transport belong to this category.
Their logistical specifics are that transport jobs have to be allocated to the means
of transport and sequences of jobs have to be performed. Chu and Huang (2005)
present a comparison of different container handling systems with regard to a
terminal’s capacity. The approach aims at supporting decisions on terminal

11
planning with regard to the design of a terminal and the employed handling
equipment (27).
2.4 Facility Layout
Facility layout design can have an effect on three measures optimization. Irani and
Huang (2000) discussed how these measures can be developed by excellence
facility layout: (a) Quality Improvement. From traditional layout (single part or very
small batch flow, product focused facility layouts and large scale or batch
processed oriented layouts) to manufacturing cell or even modular layouts, it
usually keeps for participated in lean manufacturing, (b) Accuration in quantity and
time delivery. Facilitation for focussing on cycle time can through the factory, which
can develop delivery performance that in requested or scheduled, (c) Cost
reduction. Two main costs equation that comes up on layout design are cost of
material handling and cost of design itself. These can be improved by better
location of equipment, reduced handling distances, and better coordination
between the entire handling activities (27).
2.5 Optimization Approaches
The integration of various operations connected with each other makes a system
operation complete. Over the years several studies and projects have been done
in optimizing the container terminal system. The studies can be subdivided into
analytical approaches, simulation approaches, and approaches based upon
distributed artificial intelligence.
In order to find an optimal solution, it is important to generate scenarios to find an
optimal solution for the container terminal logistics. Snoke Hartmann discusses
ways of generating scenarios of sea port container terminals. The scenarios are
used as input data for the simulation and as test data for algorithms to solve
optimization issues. A typical scenario consists of deep sea vessels, feeder ships,
train, and trucks together with the list of containers to be unloaded and loaded.
Container size, weight, and destination attributes are all included in the simulation.
It is very important to produce the realistic scenarios of the current reference or to
propose an algorithm that computes scenarios on the basis of parameters (13).
Another study of the simulation model for Kwai Cheng container terminal in Hong
Kong by A A. Shabayak and W W. Yeung focuses on the operational behavior of
the system. In this simulation model, customers and servers are designated a
container vessel and terminal operations. The processes were simulated to
investigate that to what extent a simulation model could predict the actual container
terminal operations with a higher order of accuracy (24).
Murty et al. and his team proposed an approach with an integrative Decision
Support System (DSS). A variety of interrelated daily decisions at a container
terminal is described and analyzed. The decisions aim at best use of storage
space as well as at minimizing the vessels’ berthing time, the resources, the
external trucks’ waiting time, and the congestions inside and outside the terminal
(20). Dunkieken and Mark B present the study of quay transport of Delta Sealand
container terminal(DSL) of ECT Rotterdam with the help of AGV’s(automated

12
guiding vehicles). They conducted experiments to find the number of
AGV’s,AGV’s speed, crane capacity and stack capacity (9).
Won Yon Young and Yong Seok Choi proposed a simulation model of the
container terminal system. The simulation is developed using an object-oriented
approach and SIMPLE, an object-oriented simulation software. The author
analyzed the performance of the system along with a focus on the terminal in
Pusan, Korea (30). Anglani presents a new procedure to develop flexible
manufacturing system (FMS) simulation models, based on the UML
analysis/design tools and on the ARENA_ simulation language. The two main
features of the his procedures includes the definition of a systematic conceptual
procedure to design FMS simulation models and of a set of rules for the
conceptual model translation in a simulation language(2).
Ebru K. Bish focused his research on container terminal operations. He analyzed
the loading and unloading procedures of containers to and from a set of ships,
and storing the containers in the terminal yard. In his study, each ship in the
terminal is served by multiple quay cranes, which load and unload containers to
and from ships. The containers are moved between the ships and the yard using
a fleet of vehicles, each with unit capacity. The author had to determine a storage
location for each unloaded container, when to dispatch vehicles to containers,
when to schedule the loading and unloading operations on the cranes, so as to
minimize the maximum time it takes to serve a given set of ships. The author
states that this problem is NP-hard, and therefore he developed a heuristic
algorithm based on formulating the problem as a transshipment problem. The
results were validated by checking the effectiveness of the heuristic method.
They were analyzed from both worst-case and computational points of view
(5,23).
Stan Wheately employed by the Center for Commercial Department of
Transportation Technologies was the principal investigator in researching
operations of agile and high speed ship technologies. In his report, he discussed
his experience of working in several projects that were related in analyzing and
optimizing operations of container terminals. In his report, he discussed ways of
developing neural networks based on multi-disciplinary design optimization tools
critically needed for the design of high speed multi-hull vessels. His study focused
on the Port of Los Angles using the Maglev technologies within the port. His study
provided with the detailed engineering plan for ultra-port cargo movement system
from a designated point, supporting terminals to a proposed Southern California
International container inter-modal facility. He used the MDO tool which is unique
in utilizing advanced multi-objective optimization methods, planning, stability, sea-
keeping, structural, optimization cost, and pay load capacity into a single design
tool. He presents his results in form of Pareto distribution which allows the designer
to select optimum solution of interest (29).
Pasque Legato and Rina M. Mazza presented a queuing network model of the
logistic activities related to the arrival, berthing, and departure process of vessels
of container terminal. They used visual SLAM language for discrete event
simulation. The model was used to estimate congestion effects on sojourn time of

13
the vessels belonging to the shipping company. Their model for the port terminal
was able to provide good validation results against responses measures on a real
system, obtained using aggregated data related to finite time horizon. They noticed
that the competitiveness of a terminal system is measured in terms of delegate
service level offered to visiting shipping companies. After going through several
scenarios they were able to conclude that the container terminal operations would
improve by increasing the number of berth cranes, reducing the non zero average
waiting time, having different traffic conditions and finally by presenting a steady
state simulation (17).
In terminal operations the storage yard plays a vital role in determining the flow of
the system. G Q. Zhang, J. Xue, and K K. Lai discussed the warehouse layout
problems and its impacts in terminal operations. The team worked on a multilevel
warehouse layout problem. Looking at each factor of the warehouse and at the
horizontal and vertical flow helped thhem in making an effective layout. The team
noticed that factors such as unit travel cost are item dependent and different item
can be mixed in a cell to have a balanced layout. They were able to solve the
problem by creating an IP model for the system. The end result was the
minimization of transportation cost between the facilities to the parts instead of
having transportation among the facilities (31).
Information technology is a key resource in managing sea port terminal. M Kia, E
Shayan, and F Ghotb present the importance of information technology in port
terminals. Information technology is needed in transferring and processing of
enormous data in international transport films and port organizations. Shayan, and
F Ghotb investigated the operations of port and showed the importance of
information technology and its role in improving the cargo handling system. The
study showed that container stay time is affected by several factors. The factors
included problems with having congestion within the terminal, long waiting time for
the ships at berth, inadequate container handling from ship to shore, container
throughput (Total Teu/yr/area of the terminal), height of the stacked containers,
and the high ratio of imported containers against expectedness ratio of empty/full
containers. Finally, having a properly designed computer system will increase the
operating efficiency of the terminal. By having fast discharge and loading of
containers, increase in productivity through faster turnaround of containers, better
monitoring of storage containers which leads to an increase in the stacking area's
capacity, high level of accuracy of information, high level of consistency of
information given to various parties of the chain of transport the system will show
a drastic change in the productivity of the system (15).
Leonid Novitsky, Egils Ginters, Yuri Merkuryev, Galina Merkuryeva,Vasily
Ragozin, and Elena Victorova presents a paper on the BALTPORTS-IT. Their aim
was to promote and support dissemination, industrial customization and transfer
of technologies and tools. They achieved their aim during execution stage of the
successfully completed EC projects AMCAI and DAMAC-HP. The paper discusses
the customization of a simulation model of container terminal operation, as well as
of maritime information systems. The team made use of a special technology for
the development and customization of maritime information systems, which is
based on infological models of data processing operations. The author mentions

14
that there were three-level inoflogical model (static, dynamic and expertise) that
were used to analyze the business information processing at the Ventspils Free
Port Authority. The optimal solution was found by analyzing the combination of
results from each method (21).
Shiegheun Koh, Junghee Jang, Chaesoo Kim, Daewon Choi and Sangbok Woo
proposed a spatial scheduling algorithm for the mega-block assembly yard. Their
research was motivated by a software development project in a shipbuilding
company. The author defines that term 'blocks', which in a shipbuilding industry
are the basic units in shipbuilding processes. Different block are combined
together into a block assembly shop, and then they are assembled into a ship in
the dry dock. In order to have productive measure, the shipbuilders assemble
several blocks into a big block before the dispatching them in the dock-side area.
The team objective was to make an efficient spatial schedule to use these
dockside pre-erection areas efficiently, and then elevate the productivity of the
shipbuilding company. They targeted the problem by formulating this situation
into a mathematical model and found an optimal solution by commercial
optimization software. Since the problem was very complicated and time
consuming, this approach did not produce optimal results for the practical sized
problems. The team took a different approach in solving the problem. They
applied the GA-based heuristic algorithm. With the aid of real shipyard data, they
managed to show that the spatial scheduling system based on the algorithm
turned out be an effective approach in producing optimal results (16). Richa
Agarwal and Ozlem Orgun worked on the design of service network. They solved
mixed inter program by applying several different algorithms that exploit the
instance of separation of a problem. More specifically, they used a greedy
heuristic approach. In this approach, a column generation based algorithm and a
two phase Benders decomposition based algorithm is developed. After
implantation, their computational efficiency in terms of the solution quality and the
computational time taken is evaluated (1).
Seaport Terminals are also used for the defense of a country. James W.
Hedderly states that there has been great emphasis placed on fighting
nonnational and irregular forces. The attacks on fortified or established military
positions have been replaced by single entity attacks on shipping and
transportation units. The war on terrorism also became a target of opportunity on
supply chain from sea to shore, putting lives in danger. James proposed the
design of having Autonomous containers. The replacement of old containers with
the new autonomous containers will play an essential role to deliver logistical
supplies to waterborne littoral vessels. The new container will allow the
maintenance of station and complete military operations all while eliminating the
threat to human life as the containers will be programmed to deliver supplies to a
specified local in a reasonable timetable. The containers could be used in
vessels such as Riverine Warfare patrol craft, Special Operations craft and Coast
Guard search and rescue boats and their crews. The research focused on the
seakeeping characteristics of an autonomous cargo container and the feasibility
of its deployment. The author made use of established geometric data along with
changing loading characteristics and ride effects. The in depth analysis were
focused on the responses of the container in varying sea conditions and at

15
varying loads to see if further refinement of the design or policies concerning
loading and deployment may be required (14).
Franklin Gonzalez, Rebbaca Norme, Austin Ruppert, and Joseph Schaffe worked
on a DUKW21 project for the Naval Surface Warfare Center. Their objective was
to provide means of transport for having large amounts of cargo to shore quickly
and inexpensively. The team came up with the discovery of a DUKW21, a
multipurpose vehicle that will aid in performing difficult transition mission between
Sea Base or amphibious transport vessels and inland supply. Single DUKW21 will
be able to load 20 foot container at the Sea Base carrying it to inland and unloading
the container quickly and autonomously. The team proposed that the current
system is able to operate in Sea and shore, making deliveries from 5 nm offshore
to 5 nm inland. It cruises at 15 knots in water and 30 knots in land. The vehicle is
capable of loading and unloading containers automatically. It is an amphibious
vehicle that has well-balanced performance on both sea and land. Implementation
of such vehicles in port terminals could improve the logistical and tactical
performance of a given system (12).
Next section will discuss methods in determining the optimal facility layout for the
Semarang container terminal system.
2.6 Steps, Methods, Algorithms, and Facility Layout for Container
Terminals
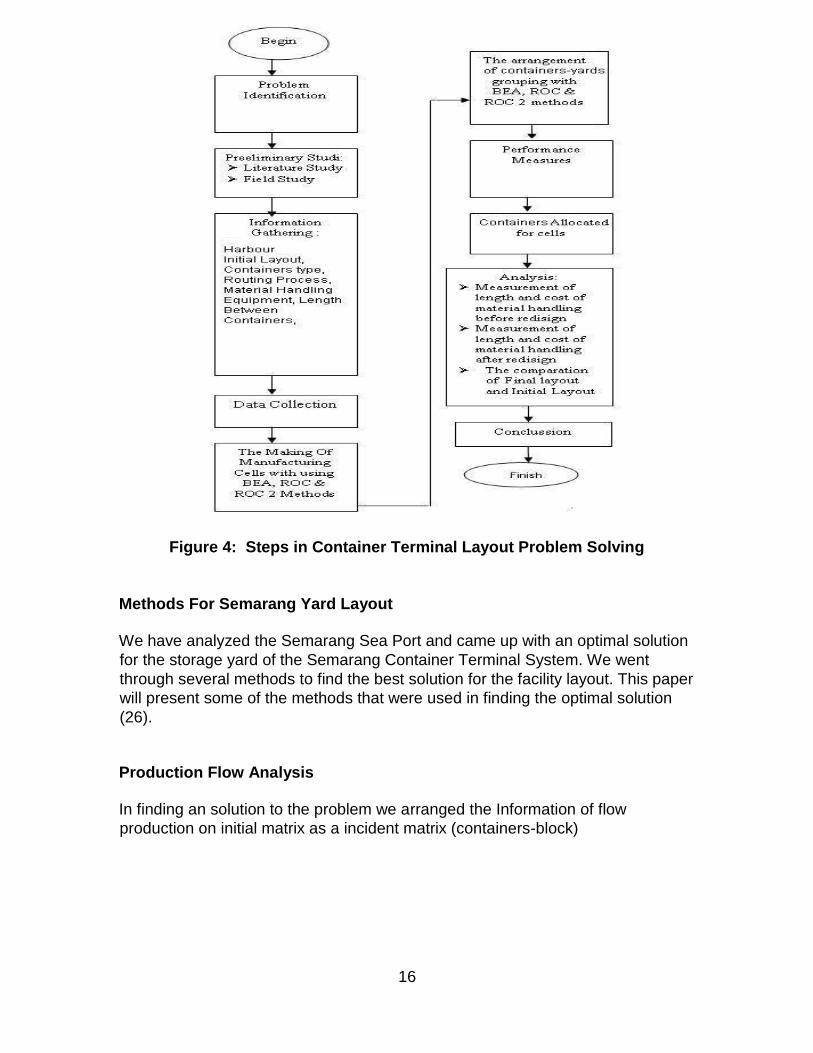
Before solving a complex problem, it is vital to understand the concept and
operations of the system completely. Figure 4 gives a detailed outline of the
steps to be taken in finding the best layout for storage yard of the Semarang
Container Terminal System (26).
16
Figure 4: Steps in Container Terminal Layout Problem Solving
Methods For Semarang Yard Layout
We have analyzed the Semarang Sea Port and came up with an optimal solution
for the storage yard of the Semarang Container Terminal System. We went
through several methods to find the best solution for the facility layout. This paper
will present some of the methods that were used in finding the optimal solution
(26).
Production Flow Analysis
In finding an solution to the problem we arranged the Information of flow
production on initial matrix as a incident matrix (containers-block)

17
Table 2: Initial Matrix for Layout Setup
Bond Energy Algorithm:
The first method presented will be the Bond Energy Algorithm. It was first
discovered by Cormick, Schweitzer, and White in 1972. The algorithm and
related strategies are used in data analysis that seeks to solve problems in
production research, imaging, and related engineering problems. We will focus
on having a type of input data and forms of matrix structure, adopted from other
areas of data analysis. This algorithm will serve for the purpose to find the best
allocation for storing containers in the storage yard. The algorithm initially
proposed for this approach is considered for estimating the row and block
sequence, and some of its properties and resulting limitations are combined to
produce an optimal matrix for facility layout. Some extensions of the original
technique are offered, and one alternative method is also presented to show the
difference in the optimum result (11).
We begin by column and container sequencing. Our goal is to find the optimal
combination of columns. We need to have two combinations from the following
column list (26):
ME (column 1-2) = (0 x 1) + (0 x 0) + (1 x 0) + (0 x 0) + (0 x 0) + (1 x 1) = 1
ME (colom 2-1) = (1 x 0) + (0 x 0) + (0 x 1) + (0 x 0) + (0 x 0) + (1 x 1) = 1
ME (colom 1-3) = (0 x 1) + (0 x 0) + (1 x 1) + (0 x 0) + (0 x 0) + (1 x 1) = 2
ME (colom 3-1) = (1 x 0) + (0 x 0) + (1 x 1) + (0 x 0) + (0 x 0) + (1 x 1) = 2
ME (colom 1-4) = (0 x 0) + (0 x 1) + (1 x 0) + (0 x 1) + (0 x 0) + (1 x 1) = 1
ME (colom 4-1) = (0 x 0) + (1 x 0) + (0 x 1) + (1 x 0) + (0 x 0) + (1 x 1) = 1
ME (colom 1-5) = (0 x 1) + (0 x 1) + (1 x 1) + (0 x 1) + (0 x 0) + (1 x 1) = 2
ME (colom 5-1) = (1 x 0) + (1 x 0) + (1 x 1) + (1 x 0) + (0 x 0) + (1 x 1) = 2
ME (kolom 1-6) = (0 x 0) + (0 x 1) + (1 x 0) + (0 x 0) + (0 x 0) + (1 x 1) = 1
ME (kolom 6-1) = (0 x 0) + (1 x 0) + (0 x 1) + (0 x 0) + (0 x 0) + (1 x 1) = 1 etc

18
Table 3: Results of 2 column combinations
Bond Energy Algorithm
After several iterations we determined a sequence of 3, 5, and 1,2,4,6 as shown
in the Table 4.
Table 4: Final Sequence of column is: 3-5-1-2-4-6 The
next step is to determine the row and block sequence. For column
sequencing, we used the following algorithm to find the output displayed in
Figure 7(26).
For row sequencing, we use the algorithm displayed in figure 7 to compute ME
row sequencing shown in table 5. Then, we place the row that gives the largest
ME in the best position for the facility.

19
Table 5: Row Sequencing
Finally, we combine the final columns and rows sequence into a final matrix of
BEA displayed in table 6. This matrix shows that the bond energy algorithm
allows us to effectively group containers to have an optimal and productive
storage. This grouping can be seen in the matrix with the cluster of 1's together.
Table 6: Bond Energy Algorithm showing optimal sequencing
Rank Order Clustering (1980, King)
This provides an efficient routine for taking an arbitrary 0 – 1 block-container
matrix and reordering the block rows and container columns to obtain a nearly
block diagonal structure. This is second method that we used in an attempt to
find an optimal solution for the storage yard. This algorithm reads the matrix as a
binary word. As shown in table 6, the procedure converts these binary words
(binary weights) for each row and column into decimal equivalents. Decimal
equivalent is value that read number of row/column as binary words (4).

20
Table 7: Matrix showing binary weight
conversion into decimal equivalents
Rank Order Clustering ( 1980,King)
The steps are: P
Cm=∑2P−p.apm
p=1
For each row, compute the decimal equivalent
Row 1 : 25.0 + 24 .1 + 23.1 + 22.0 + 21.1 + 20.0 = 26
Row 2 : 25.0 + 24 .0 + 23.0 + 22.1 + 21.1 + 20.1 = 7
Row 3 : 25.1 + 24 .0 + 23.1 + 22.0 + 21.1 + 20.0 = 42
Row 4 : 25.0 + 24 .0 + 23.0 + 22.1 + 21.1 + 20.0 = 6
Row 5 : 25.0 + 24 .0 + 23.0 + 22.0 + 21.0 + 20.0 = 0
Row 6 : 25.1 + 24 .1 + 23.1 + 22.1 + 21.1 + 20.1 = 63
Table 8 displays the complete results of the block sequencing with the
prospective length. The length aids in ranking the blocks for the containers. The
higher the measure, the higher the rank it has as shown in the table. Block T (6)
with length 63 cm has the highest rank amongst the rest of the blocks.
Table 8: Rank Order Clustering (1980, King)
The result of rows sequencing

21
Table 9: Rank Order Clustering (1980, King)
The result of rows sequencing
Rank Order Clustering (1980, King)
The steps are:
2. For column, we compute the decimal equivalent.
’
Coloumn 1 : 25.1 + 24 .1 + 23.0 + 22.0 + 21.0 + 20.0 = 48
Coloumn 2 : 25.1 + 24 .0 + 23.1 + 22.0 + 21.0 + 20.0 = 40
Coloumn 3 : 25.1 + 24 .1 + 23.1 + 22.0 + 21.0 + 20.0 = 56
Coloumn 4 : 25.1 + 24 .0 + 23.0 + 22.1 + 21.1 + 20.0 = 38
Coloumn 5 : 25.1 + 24 .1 + 23.1 + 22.1 + 21.1 + 20.0 = 62
Coloumn 6 : 25.1 + 24 .0 + 23.0 + 22.1 + 21.0 + 20.0 = 36
Table 10: column sequencing and ranking
We repeat steps 1 and 2 until no change are seen.
Rank Order Clustering 2 (1982, King and Narkochai)
Final matrix of grouping Block-Containers

22
Table 11: 1982, King and Narkochai Row and Column Sequencing
In order to find the best results, we compare the results from the two methods. In
doing so, we look at their performance measures used in comparing the quality of
solutions. There are three category of performance measure, which are:
Grouping Efficiency (η)
Grouping Efficacy (τ)
Grouping Measure (ηg)
Figure combines all the performance measures in comparing the results from the
Bond Energy Algorithm and the Rank Order Clustering methods.
Figure 5: Performance Measure
After comparing both results, it was observed that the BEA method have the
highest value of performance measurement. So, we choose to implement this
method in arranging the manufacturing cells of our system.
1st Cells :
Container family=C3 – C5 – C1 – C2 – C4 – C6 Blok
group =B6 – B1 – B3
2nd Cells :
Container family=C5 – C1 – C2 – C4 – C6
Blok group = B2 – B4
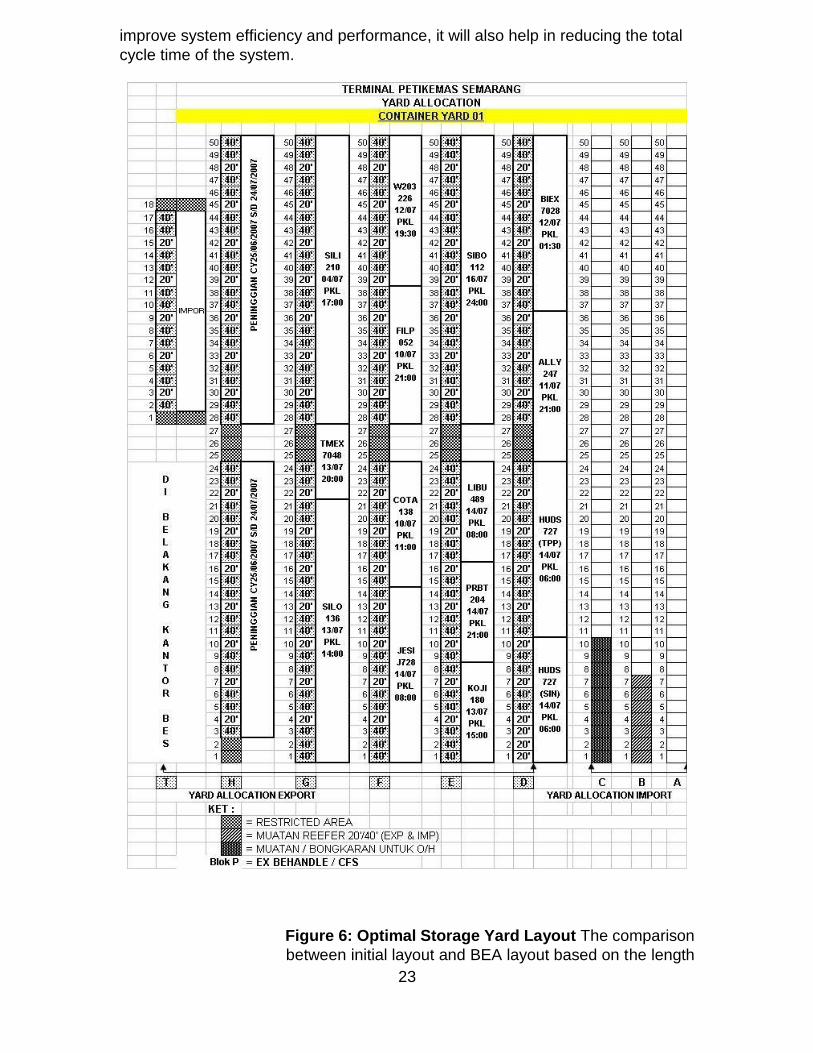
After completing the process, we were able to produce results in Figure 6 which
displays the optimal sequencing of block for storage yard. This will not only
23
improve system efficiency and performance, it will also help in reducing the total
cycle time of the system.
Figure 6: Optimal Storage Yard Layout The comparison
between initial layout and BEA layout based on the length

24
of containers handling can be measured using rectilinear
distance displayed in figure 7 and figure 8:
(Xa−Xb)2 +(Ya−Yb)2
Figure 7: Initial layout distance
In initial layout (Fig 7), the total length of material handling comes out to be
2080,515 m.
Figure 8: BEA layout distance
The revised BEA layout (Fig 8) gives a total length of material handling equaling
1892.455 m.Based on two tables, we can define that final layout gives us the
contribution on reducing the length of material handling for: 2080,515 – 1892,455
= 188, 06 m.
2.7 Simulation
The complexity and high cost of modern manufacturing systems and logistical
operations necessitate the use of formal models of the system to support
management decisions. To solve such problems, it is necessary to have discrete
event simulation models for a detailed performance evaluation of a complex
manufacturing system (19).

25
Simulation is the imitation of a real system or procedure that has been captured
over time. A simulation requires the programmer to generate the artificial history
of the real system and then to observe that history which enables him to draw
inferences about concerns regarding the operating characteristics of the real
system. Simulation is an important problem solving methodology that is common
in practice for analyzing real-world problems. Simulation is used to describe and
analyze the behavior of complex systems. Simulation is often generated for
quick results and to better understand the abnormal behavior within the system,
which cannot be performed quickly by doing a manual simulation on paper or by
mathematical problem solving technique. The Simulation asks “what if” question
about the real system and aids in the design of the real system. Today,
simulation by a software model is a common practice for the analysis and design
of complex system (3). The object oriented approach has proven to be very
successful and it has demonstrated to be an effective technique in terms of
design and implementation of complex software projects (2).
Modeling
A model is an actual representation of the system. A model should be short and
precise and it should not contain any unnecessary details about the system. A
discrete event system is a representation of the contents and interactions of the
system, as opposed to mathematical models which consider a formula in finding
a solution for the system. The Discrete event models are dynamic because the
passage of time plays a crucial rule. There are several steps that should be
understood prior to generating the simulation. The critical factors in simulation
are: modeling, events system state variables, entities, attributes resources,
queues, activities, and delays. Before we progress forward with the simulation, it
is critical to fully understand the meaning of each of these terms (3).
Modeling: An art of capturing the actual representation or behavior of the system
without unnecessary details.
Resource: It is an entity that provides service to dynamic entities, or loads.
Some common examples of resources may include person, machines, and
equipment.
Queues: It is a place where the system loads or entities reside physically and
graphically. Queues are used as places where loads wait (hence the
name “queue”). Loads can wait in a queue for storage, while they are waiting for
a resource, or while being processed by a resource. An easy example of a queue
would be a line in front of you to check out items at the shopping center.
An activity or process is a period of time with a duration that is known prior to
commencement of the activity. An activity would be unloading or stacking a
container.
A delay is an indefinite duration that is caused by some combination of
system conditions. An example of delay would be a delay for the resource

26
availability. For example, a process being delayed because it has to wait on a
machine to free before executing.
Simulation modeling methods
Although there are several methods in simulating a real system, however, there
are four major simulation methods used commonly by the simulation community.
They are as follows:
1. Process-interaction method 2. Event-scheduling method 3. Activity
scanning method 4. Three-phase method
The process interaction method is based on the process flow. If a process is
delayed then the simulation will also correspond to the process.
The basic concept of the event scheduling method is to advance time
to the moment when something happens next (that is, when one event
ends, time is advanced to the time of the next scheduled event).
The third simulation modeling structure is activity scanning. Activity
scanning is also known as the two-phase approach.
The fourth simulation modeling structure is known as the three phase
method time is advanced until there is a state change in the system or until
something happens next.
Advantages of Simulation
There are several advantages in simulating process. Listed below are some of
the following reasons why it is beneficial for a process to be simulated (3).
• In making correct decision. Since simulation creates a virtual imitation of
the real system, it aids in making wise decision which are unclear
during problem solving stage.
• Compressing and expanding time
• Understanding “Why?” Mostly ignored by programmers and process
analysts due to time, pressure, stress, and other factors. Most people just
do the job to get it done on time. They ignore the fact that it is crucial to
understand the system or process.
• It helps you to Explore possibilities
• Diagnosing problems
• Identifying constraints
• Developing understanding
• Visualizing the plan
• Building consensus
• Preparing for change
• Making wise investments
• Training the team
• Specifying requirements

27
Even though there are advantages in a system, it cannot exist without having
some disadvantages. Listed below are some disadvantages of a system (3).
Disadvantages
• Model building requires special training which results in added cost for
company expenses.
• Simulation modeling and analysis can be time-consuming and expensive.
• Simulation might be used inappropriately for illegal purpose. It could be
used a final solution to the system, which is completely irrelevant.
• Simulation results might be difficult to interpret since they areseveral
• Factors that simulation does not caporal of the real system.
Before beginning a simulation study, it is very important to follow each step in
order. Before solving any problem, we need a problem formulation. The next step
is to set an overall objective. Once we define our objective, we start our model
building. If data is available for the system, then we start coding, if not then stay
on model building step. We verify the coding and move to validation of results.
When we are done with validation step then we move to production and analysis
step. We check if we need more runs. If we do, then we wait for result, otherwise
we move to experimental design. Finally, we document all of our program results.
Figure 9 gives a detailed flow chart of the simulation steps.

28
Figure 9: Steps of Simulation Study Modeling
Arena
The Arena modeling system is provided by Systems Modeling Corporation. It is a
flexible and powerful tool that allows analysts to create animated simulation
models that accurately represent virtually any system. It was first released in
1993. The software employs an object-oriented design methodology for graphical
model development. The simple language software allows simulation analysts to
Steps in simulation study
Problem Formulation
Setting Overall Objective
Validated
Coding
Document Program Result
Production and Analysis
Wait For Result
Verified
Model Building
Experimental Design
YES
NO
YES
YES NO
NO
YES
Data Available
More Runs?
NO

29
place graphical objects-called modules-on a layout in order to define system
components such as machines, operators, and material handling devices. Arena
is built on the SIMAN simulation language. After creating a simulation model
graphically, Arena automatically generates the underlying SIMAN model used to
perform simulation runs. The graphical modules used to create models are
provided “off-the-shelf’ with Arena. These modules can also be custom designed
by the end user to produce a modeling environment that is tailored to a specific
application area (e.g., welding, cross-dock, etc.) or a specific vertical market
(e.g., semiconductor, textiles, etc.) (18).
Figure 10: Mortgage Review System Simulation in Arena
Chapter 3: CONTAINER TERMINAL SYSTEM OF SEMARANG
3.1 Background
Container Terminal of Semarang is a firm that provides service for container
handling to import or export materials. This Firm represents one of the division of
PT ( Persero) Port Of Indonesia III Branch Tanjung Emas Semarang.
Anticipatory step in the growth of container arrivals in Port Of Indonesia III
Semarang has created a need for supervision from professional management. As
there is a steady increase in the number of ships arriving at Port Semarang, the
Container Handling needs to be more productive. One way to become productive
and better is by applying a type arrange situation which orienting at make-up of
flexibility and productivity. Listed below is an image of the Semarang
Port Container Terminal. (27)

30
Figure 11: Container Terminal System in Port Of Indonesia III Semarang
3.2 Problem Definition
In recent years, port container traffic of twenty-foot equivalent units (TEUs), a
standard-size container has tremendously increased at Semarang Container
Terminal making it to be considered as one of the busiest port across the world.
Looking at some of the statistics we can see that the container arrivals at the
Semarang Sea port of the past few years. Table 1 will give us some insight (29).
Year Amount in (TEU) Rank
2005 5503176 15
2004 5369297 14
2003 5176982 14
2002 4539880 14
2001 3901761 14
2000 3979948 14
Table 1: World ranking for shipping containers in Indonesian Ports
Due to this large growth of incoming containers, the operations at the Semarang
terminal have become inefficient and unproductive. The terminal system is
experiencing long process delay, queue build-up, long cycle times for processing,

31
and a lower utilization of available resources. In order to become productive, we
have created a simulation model analyzing the flow for the system and a new
layout for storage yard to have productive operations at the terminal system. After
a complete analysis of the stem and manipulation of the storage yard area, we
propose to create a flexible arrangement at the facility to have optimal production.
The next section will present with the details of the simulation model.
3.3 Description of Simulation Model
The problem currently faced by the Semarang sea port is dealing with extended
cycle times for loading and unloading of containers from the docks. In order to
optimize the cycle time of the system, the simulation focuses on analyzing time to
service(how long containers wait for service), completion time(how long it takes
to complete process of unloading, loading transporting and stacking containers),
utilization of machines or resources available, the number of containers unloaded
or loaded onto a ship. The simulation consists of arriving containers, Quay
Crane, Internal Trucks, RMG/RTG, Storage Yard and Landside. The proposed
simulation model does not include the ships. Since the system is quite complex,
this simulation captures two instances of unloading operation for containers to be
stored at Yard position G and Yard position F. It also includes the loading
operation for the system.
Quay Cranes
Quay Crane is a machine that is used for loading containers from truck to ship
and unloading containers from the ship to truck. The current Simulation model
has 2 quay cranes as available resources. Below is a picture of Quay Crane
unloading containers from the ship to truck.
Figure 12: Quay Crane Unloading Containers at Container Terminal
Internal Trucks
Internal Trucks are vehicles that are used to transport containers from Quay Side
to the Yard and from yard to the ship. The simulation has a total of 20 internal
trucks available as a resource. Below is a picture of the Internal Trucks.

32
Figure 13: Internal Trucks transporting Containers
RTG_RMG Crane
RTG (rubber tired gantry) / RMG (rail mounted gantry) cranes are used in
stacking and un-stacking of containers. These cranes unload containers from the
internal trucks, stacking them in the storage yard. They serve to load containers
on the internal trucks, un-stacking them from the storage yard and are also used
for hinterland operations.
Figure 14: An RTG Crane Figure 15: An RMG Crane
Storage Yard
It is a storage area where containers are kept. The layout for the storage yard is
broken down into several lots which are labeled according the type of ship.Figure
16 displays the storage yard of Semarang.

33
Figure16: Semarang Port Terminal Storage Yard
Landside
It is an operational area where containers are kept and dispatched later to their
destinations.
System definitions for Semarang Seaport Terminal Simulation
The main entities for this simulation model include the two types of containers
being loaded and unloaded. The two containers include the (I) TEU (Twenty feet
Equivalent Unit) and (ii) FEU (Forty feet Equivalent Unit). Since both type of
container go through the same procedures, there is one principal entity of
containers. The resources of a given system cover a wide spectrum of things.
Resources may include people, equipment used in transporting entities,
performing maintenance, and operations of other tasks on either location. This
model consists of 2 Quay Crane, 20 Trucks, and 4 RTG/RMG units as resources.
Attributes for a system may include operation time, path network and frequency
but in this model attributes are mainly considered for dealing with the different
ships schedules for loading and unloading and for using a different terminal
assignment for the storage of containers. The process for the simulation includes
the Quay Side area where loading and unloading of containers is performed
using the quay crane. After process stage, containers are stored in the storage
yard with the help of internal trucks and RTG/RMG cranes. The final step is when
containers are routed to the land side on external trucks. Figure 17 displays a
schematic view of the operations at the Semarang Container Terminal.

34
Figure 17: Terminal Operations Schematic View
3.4 Detailed Explanation of Simulation
Due to the complexity of the real system and complex terminal operations, not all
operations are presented in the simulation. Our simulation only captures the
basic operations that are involved in causing process delays, queue build-up,
long cycle time for the system and low utilization of resources. Our simulation
broke the operations of the blocks and captured flow for the operations at each
block: block G and F from the facility layout. Since, most of the data was not
available to us; we made several assumptions regarding processing time of
resources and used these assumptions in finding the optimal result. We used the
triangular distribution for the process times often presented as triangular (a, m,
b), TRIANGULAR (Min, Mode, Max)(6).
Figure 18: Triangular Distribution
The minimum (a), mode (m), and maximum (b) values for the distribution
specified as real numbers with a < x < b.[a, b]
f(x) = { 2(x – a)(m – a)(b – a) for m ≤ x ≤ b
2(b – x) (b – m) (b – a) for a ≤ x ≤b

35
0 otherwise
The triangular distribution is commonly used in situations in which the exact form
of the distribution is not known, but estimates (or guesses) for the minimum,
maximum, and most likely values are available. The triangular distribution is
easier to use and explain than other distributions that may be used in this
situation (e.g., the beta distribution).Although, this simulation result may not truly
be the optimal result for the real system at the Semarang terminal, the
terminology can be applied in finding an optimal solution with real data (6).
The simulation is broken down into three different setups. The first and second
setups are identical in structure except for the ships arriving in the terminal. The
setup is composed of a docking station where the ships arrive and are assigned
block G and F on the storage Yard. Containers arrive randomly with maximum
arrivals of 30 containers for block G and 50 containers for block F. After an
arrival, containers are assigned an attribute for arrival time along with attributes
for the incoming ships that are assigned to block G and F. Then the containers
are unloaded from the ships having delay type of a triangular distribution (TRIA)
with a minimum of 3 mins, most-likely value of 5 mins, and a maximum value of 7
mins. We then record the time for processing by the entity statistics. We transport
the containers on internal trucks having a delay time of TRIA ((5, 9, and 12)
mins). We record the time interval for the job. We then use RTG/RMG to unload
containers from the trucks and stack them onto the assigned position on block G
and F. We record the number of containers in the storage yard for safekeeping.
The containers are held in the storage until they are called and requested to
move to the land side. Once requested, the external trucks are used to transport
the containers to the landside. This marks the end of first two unloading
simulation step. In the third step, loading operations, containers are un-stacked
from the storage yard using RTG/RMG and then placed on the internal trucks.
The arrivals are from storage yard are randomly distributed with a maximum
arrival of 60 containers. The RTG/RMG have delay type of processing of
TRIA((3,5,8) mins). We record the unloading time of containers. The containers
are then transported onto the ship following a delay type of TRIA ((5, 9, 12)
mins). We record the transport processing time. The Quay Crane are used to
remove the containers from the trucks and placed onto the assigned ship. The
process follow a delay type of TRIA(3,5,7) mins). The number of containers
loaded are recored in the system and the simulation terminates. Figure 19 shows
the steps taken for the simulation run.

36
Figure 19: Semarang Terminal Operational Flow Analysis
Chapter 4: RESULTS AND VALIDATION

37
METHOD
We have converted the terminal operation process flow chart in Figure 19 into a
discrete event simulation using Arena Simulation software. We used the
simulation to analyze the current system and then used Optquest, a feature of
Arena simulation software used in the optimization of simulation studies. Since
we were not given real data for the Semarang Terminal operations, we have
made a number of assumptions in order to proceed with the simulation.
Our assumptions for the simulation are as follows:
1) We model the inter-arrival time for the container arrival for unloading
operation as exponential distribution (EXP) of 6 mins for the baseline case
and 12 mins for the second case.
2) Operation at the terminal only happens when a ship arrives and it is only
done on certain day of a month following a set schedule. For that reason,
we have made the simulation run to have a setup of 4 hours with base
time unit of 24 hours/day.
3) Since the complete system was quite complex, we scaled down our
simulation of system operation. The operations are modeled based on 2
storage blocks, block G and block F shown in Figure 6. The basic version
of Arena can only handle a maximum of 150 entities. For that reason and
for the reason that the other blocks of the storage facility are identical in
structure as block G and block F, we did not model them.
4) Loading Operations are modeled having an inter-arrival time of 5 mins for
base case.
5) We model the unloading process of containers with quay crane having a
Triangular distribution TRIA (3, 5, 7) mins. We model the transporting of
containers with internal trucks to have a TRIA (5, 9, 12) mins. For
removing containers from trucks, we used TRIA (5, 10, 15) mins.
6) The containers are kept in the storage yard. The containers are only
transported to landside when called. Although this action is done several
days after the container arrives and stored in storage yard, but our
simulation simulates this process for the same day. The reason we took
this step is due to the fact the landside operations do not affect the
terminal operations as much.
RESULTS
We present our main simulation results in this section, followed by an
interpretation, discussion, and recommendation. In all cases, we have measured
performance and sensitivity as functions of the resource level (number of
machines) and demand for containers (rate of container arrivals). The results are

38
broken down into several different cases and will be explained in the discussion
section.
This case will presents problem in port terminals of average wait time that is a
direct result of delays in process flow.
Figure 20 shows that average wait time for different process in terminal system
going to block G. The inter-arrival time (IAT) for the container was 6 mins. The
times in the figure are broken down by operation of terminal operations:
unloading containers, transporting containers, remove containers form truck, and
transport containers to landside. We noticed that system had longer wait times
for each process. However, the wait time for using internal trucks showed the
most impact to the system. This is due to the fast pace of container arrivals and
the due to the number of resources available.
Figure 20: Average Wait time of Process for Block G (IAT 6 mins)
Figure 21 shows the average time for operations at block G. In this figure, we
assumed an inter-arrival time of 12 mins. The long wait time can be seen in
operations of transporting the container via the internal trucks. Increasing the
inter-arrival time for process can reduce the average wait time. However, doing
so will increase the total cycle time. This interpretation of this result would mean
that the process is delayed and has a longer wait time due to the unavailability of
resources. Since resources are unavailable, the internal trucks have to wait in a
queue, thus gaining the added wait time in the average wait time for the process.

39
Figure 21: Average Wait time of Operations for Block G (IAT 12 mins)
Figure 21 shows the average wait time for operations at block F. This block is
nearly identical in structure as block G, but the only difference is that it can have
a maximum arrivals of 50 units.
Figure 22: Average wait time for Block F(IAT 6 mins)
Figure 23 shows the average time of process in mins. Figure shows the average
time that an entity spends in the system in block F with an inter-arrival time (IAT)
of 12 mins. In this block, increasing the IAT showed a decrease in the wait time
of process.

40
Figure 23: Average Wait Time of Operations for Block F(IAT 12 mins)
The next case will look at the wait times for quues. By looking at wait times of
queues, we are able to determine and better understand the problem causing the
disturbance with the flow of the system
Figure 24 displays the wait time of queues for each process. The different wait
time in queue shows the process that it is caused by the delays in the system
and disturbance of the system flow. The largest queue was seen in two major
transporting containers. The reason for the large queue is non-availability of
resources and machine failures. For instance, since there are only two quay
crane and they can only unload two containers at maximum at one time. This will
lag the system because we will have trucks waiting on containers and quay crane
to finish unloading so it can start transporting them to the appropriate location.
The quay crane builds a queue for unloading which leads to a queue for trucks
and which leads to a queue for the RTG/RMG. Thus it is a chain effect resulting
in the ineffectiveness of the system.

41
Figure 24: Wait time for Queue for G(IAT 6mins)
Figure 25 shows the wait time for queue with an interarrival time of 12 mins.
Increasing the inter-arrival time has significantly reduced the wait time for the
queue.
Figure 25: Wait time Of Queue for G(12 mins)
Figure 26 and 27 shows the utilization of the three different resources. The
internal trucks showed to be most utilized resource as compared to quay crane
and RTG/RMG. The reason for that is the number of internal trucks available at
the port, and due to the backup process. The other two resources are less in
number and much slower in terms of speed in handling containers and maintain.
Since the trucks are fast and are used in three different operations at the
terminal: to transport containers from quay side to storage yard and then again
from storage yard to land side, the utilization is high. Quay Crane seemed to be
more productive than before and also has increased in its utilization.
42
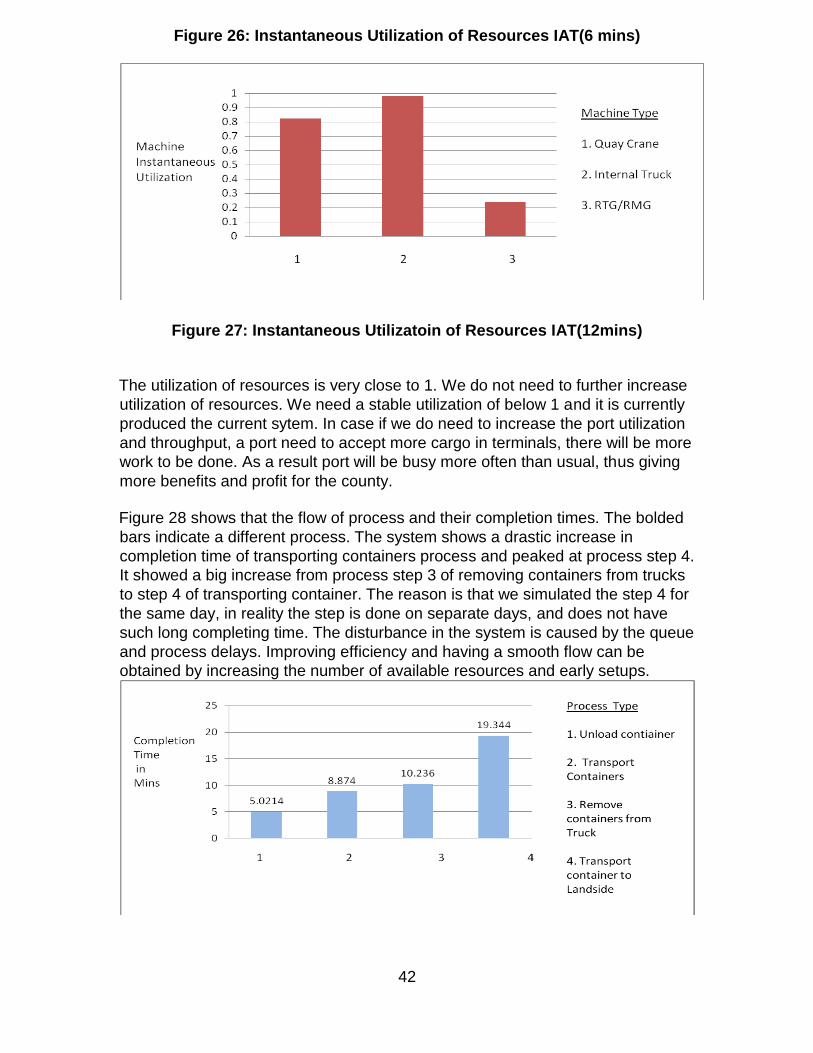
Figure 26: Instantaneous Utilization of Resources IAT(6 mins)
Figure 27: Instantaneous Utilizatoin of Resources IAT(12mins)
The utilization of resources is very close to 1. We do not need to further increase
utilization of resources. We need a stable utilization of below 1 and it is currently
produced the current sytem. In case if we do need to increase the port utilization
and throughput, a port need to accept more cargo in terminals, there will be more
work to be done. As a result port will be busy more often than usual, thus giving
more benefits and profit for the county.
Figure 28 shows that the flow of process and their completion times. The bolded
bars indicate a different process. The system shows a drastic increase in
completion time of transporting containers process and peaked at process step 4.
It showed a big increase from process step 3 of removing containers from trucks
to step 4 of transporting container. The reason is that we simulated the step 4 for
the same day, in reality the step is done on separate days, and does not have
such long completing time. The disturbance in the system is caused by the queue
and process delays. Improving efficiency and having a smooth flow can be
obtained by increasing the number of available resources and early setups.

43
Figure 28: Process Completion Time Block F(IAT 6 min)
Both block G and the loading operations step are identical in structure with . They
had similar completion times as shown in figure 28.
Figure 29: Process Completion Time Block F (IAT 12 mins)
DISCUSSION
We used OptQuest for arena to find a better solution for the system. We wrote an
objective function which was the summation of all the wait times. After doing 65
simulation runs, we were able to reduce the wait time zero for all process and a
value of 0.0078 mins for the unloading container process, which is very close to
zero and thus is the optimal solution. In doing so we would need a total of 96
resources. We would need 78 trucks, 6 Quay Crane, and 12 RTG’s. By reducing
the wait time, we were able to reduce the total cycle time.
By looking at figure 26 an figure 27 we can clearly see that the instantaneous
utilization of quay crane and internal trucks are very close to 1. Even though, a
system that has utilization below 1 is stable, it will most likely turn into a
bottleneck reducing the capacity of the whole flow system and increasing the
cycle time. In order to be productive, the terminal system needs another quay
crane. Increasing the number of resources will decrease the utilization for the
sytem and thus have positively impact the total cycle time.
After performing changes within the system and its parameters to find an optimal
solution, we used Optquest for Arena to further optimize the flow and each of the
process mentioned in the previous section of results. All the queues were
reduced down close to zero and the utilization of the available resources were set
at a stable position. Having a high utilization is also not good for a system. Our
system showed a high utilization of resources, so we decreased it to have a
balanced system. By taking the above measures and steps, we were able to
reduce the system cycle time and have a productive system. Although these

44
results have been validated, they are based on assumptions created by us. The
methodology behind the results could be used in other port terminal operations.
Chapter 5: CONCLUSION
We have analyzed the terminal operations of the Semarang Port. There were
several problems that were observed at the port terminal. Some of these
problems were correlated with each other. For instance non-availability of a
resource crane leads to a delay for the process following it and thus increasing
total cycle time. The delays lead to queues and an overall inefficient and
unproductive system. In order to better understand the operations, we used
Arena simulation software to determine the optimal results. Since the objective of
out simulation focused on analyzing time to service (how long containers wait for
service), completion time (how long it takes to complete process of unloading,
loading, transport and stacking containers), and the utilization of available
resources, we determined these results. After determining the results, we
optimized the system by reducing wait time, total cycle time thus reducing queue
size. We also increased the utilization of resources. Since our analysis was not
based on real data, our results are not valid for the real system, but the
terminology could be implemented to obtain optimal results.
RECOMMENDATIONS
Our first recommendation would be the implantations of the flat cart system for
double stacking. Most flat cars are not capable of carrying more than one
container. The invention of Double-stack containerization restrain system by
James J. Schuller and John A. Ritter of Ohio made it possible to accept a 40-foot
container and still leave enough clearance for another container on top. Figure
display the first design of the double stack cart. Even though most ports use train
to transport containers, they have not used the double-stack containerization
system. This methodology is used in mainly in railways, but it could also be
applied within a port terminal. The implementation would directly affect the
system performance, reducing the total cycle time to have productive operations.
Today, the rail road cart for double stack containers can support a 53 foot
container (10).

45
Figure 25: design of railroad car for double stack containerization
Terminalstar is a well known IT company dedicated to serving port terminals.
Terminalstar suggest breaking down the terminal operations in 7 different
stations. Figure 26 shows the transportation flow through a port container
terminal. In the figure, the import containers are arriving by ship that moves from
the quay side on the left. They pass through the central intermediate storage
area to the railhead and truck interface on the land side at the right. Export
containers move in the opposite direction.
Figure 26: Operations Flow at the Terminal
Terminalstar break down port operations in 7 Stations. The first station is process
control. It provides full control on workflows, and synchronization of processes.
An example of a synchronization step would be unloading containers of a ship by
quay cranes, followed by their transportation via internal trucks to the storage
yard, then transportation into the yard by RMG Data Radio Communication
technology, and at last communication of transport order details to and from SCs,
rail cranes, quay cranes, tractors communication with checkers to have excellent
productivity. The second station is the Vessel Manager which is used for several
tasks. The tasks include: the station serving as a interface to ship storage
planning system, receiving and processing of job requests, planning of
load/discharge operations, sequencing, STS work strategies, work load
balancing, user control of load/discharge operations, start/stop of operations,
elimination of disturbances and for graphical user interface for planning, and
control of ship/shore operations. The third station would be the
Hinterlandmanager station. In this station, we administer, optimize, and assign
landside work packages. The fourth station is Yard Control. This station is used
in balancing the utilization of yard capacity, and optimized stacking and
positioning of load units. Inside the port terminals there are different types of
yards and each one serves for a different purpose. Some of the most commonly
found yards within a port terminal include: the SC-yard, the RMG-yard, and a
yard for handling of empty containers reefers, and dangerous goods, etc. The
fifth station is of Gate Control. It is used in optimizing the schedule for external
trucks, minimization of truck handling times, and minimization of location changes

46
for trucks. The sixth station is Equipment Control. This station is second most
critical stations in terms of terminal operations. It manages: quay crane that are
used in steering of double-trolley gantry cranes with interface to PLC, steering of
tandem gantry cranes with interface to PLC, control of quay crane operation
under various working strategies, mobile container checking on handheld
computers, quay crane supervisor module for double-trolley gantry crane. It has
Stacking Crane that are used in the optimization and steering of yard stacking
cranes, synchronization if more than one crane works on block. The station also
monitors vehicle for the optimization and steering of SCs, tractors and trailers.
Last it has rail crane for the optimization, synchronization and steering of rail
cranes, representation of track and wagon occupation. The last and final station
is the station 7 of Operations Control. This is most critical station as it deals with
major terminal operation. It is used for the visualization of overall yard status,
workload of equipment and statistic data, operator's access for human interaction
and manual launch of transports, real time control for optimization parameters,
remote control functionality for RMG operation at landside, and comprehensive
user rights configuration. In having a complete system as mentioned above, the
terminal operations at Semarnag will be significantly improved by reducing
queues, total cycle time, and process delays. It will lead to an overall productive
and efficient system. By becoming a major port of the world, the port can handle
more freight and containers which will benefit the not only the port, but the
Indonesian country in having increase global trade and market share (28).
REFERENCES
1) Agarwal, Richa, and Ozlum1 Ergun. "Ship Scheduling and Network
Design for Cargo Routing in Liner Shipping." Transportation Science
Informs: 1-29.
2) Anglani, A., A. Greico, M. Pacella, and T. Tolio. "Object-oriented modeling
and simulation of flexible manufacturing systems: a rule-based
procedure." Elsevier Journal 10 (2002): 209-34.
3) Banks, Jerry. Getting Started with AutoMod TM. 2nd ed. Chelmsford:
Brook Automation, 2004.
4) "BINARY ORDERING ALGORITHM (RANK ORDR CLUSTERING)."
Weblog post. Http://nitc.ac.in/nitc/bulletin/files/opt_8065_764797184.pdf. 3
July 2009 <http://nitc.ac.in/nitc/bulletin/files/opt_8065_764797184.pdf>.

47
5) Bish, Ebru K. "A multiple-crane-constrained scheduling problem in a
container terminal." European Journal of Operations Research 144
(2003):
83-107.
6) Bradley, Allen. Arena Basic Edition User Guide. Ms. Rockwell Automation
Technologies U.S.
7) "Containerization -." Wikipedia, the free encyclopedia. 19 June 2009
<http://en.wikipedia.org/wiki/Containerization>.
8) "Containers." GlobalSecurity.org - Reliable Security Information. 19 June
2009
<http://www.globalsecurity.org/military/systems/ground/container
history.htm>.
9) Duinkerken, Mark B., and Jaap A. Ottjes. "Simulation Model For
Automated Container Terminals." Proceedings of Business and Industry
Symponesim (1999).
10) Et al., Schuller. United States Patent. Schuller et al., assignee. Patent
4759294. 1988.
11) Hubert, Arabie P. "Welcome to IEEE Xplore 2.0: The bond energy
algorithm revisited." IEEE Xplore: Guest Home Page. 05 July 2009
<http://ieeexplore.ieee.org/xpl/freeabs_all.jsp?arnumber=47829>.
12) Gonzalez, Franklin, Rebecca Orme, Austin Rupert, and Joseph Schaffer.
Amphibious Cargo Transfer from Ship to Shore. Tech. no. DUKW 21. MD:
Naval Surface Warfare Center, 2007.
13) Hartman, Sonk e. “Generating scenario for simulation and optimization of
container terminal logistics.” OR Spectrum, 26(2004) 171-192
14) Hedderly, James W. A SEAKEEPING STUDY ON THE AUTONOMOUS

48
USTAINMENT CARGO CONTAINER DELIVERY SYSTEM. Thesis.
MONTEREY, CALIFORNIA, March 2008.
15) Kia, M., E. Shayan, and F. Ghotb. "The importance of information
technology in port terminal operations." Port Terminal Operations: 331-
344.
16) Koh, Shiegheun, Junghee Jang, Chaesoo Kim, Daewon Choi, and
Sangbok Woo. "GA-based Spatial Scheduling Algorithm for
Megablock Assembly Yard in Shipbuilding Company." APIEMS 2008
Proceedings of the 9th Asia Pasific Industrial Engineering & Management
Systems Conference (2008): 890-98.
17) Legato, Pasquale, and Rina M. Mizza. "Berth Planning and Resources
optimisation at a container terminal via discrete event simulaiton."
European Journal of Operations Research 133 (2001): 537-47.
18) Markovich, Nancy A., and David M. Profiozich. "Arena Software Tutorial."
System
Modeling Corportation (1996).
19) Masood Syed, Venkat Kumar,Wakeland W. Wayne. “Using Simulation to
Understand and Optimize a Lean Service Process.”
Proceedings of the 2006 Spring Simulation MultiConference (2006).
20) Murty, Katta G., Yat Wah Wan, Jiyin Liu, Mitchell M. Tseng, Edmond
Leung, Kam-Keung Lai, and Herman W. C. Chiu. "Hongkong
International Terminals Gains Elastic Capacity Using a Data-Intensive
Decision-Support System." Informs 35 (2005): 61-75.
21) Novitsky, Leonid, Egils Ginters, Yuri Merkuryev, Galina Merkuryeva,
Vasily Ragozin, and Elena Victorova. "INDUSTRIAL CUSTOMISATION
OF MARITIME SIMULATION AND INFORMATION SYSTEMS IN THE

49
LATVIAN PORT AREAS." Latvian Intelligent Systems, Ltd., Sigulda,
Latvia: 1-3.
22) Potter, EB, and R. Fredland. Sea Power: A Naval History. 1981.
23) Roodbergen, Kees Jan, and Rene D. Koster. "Routing methods for
warehouses with multiple cross aisles." Int. j. prod. res (2001): 1865-883.
24) Shabayek, A. A., and W. W. Yeung. "A simulation model for the Kwai
Chung container terminals in Hong Kong." European Journal of
Operations Research 140 (2002): 1-11.
25) Steenken, Dirk, Stefan Voß, and Robert Stahlbock. "Container terminal
operation and operations research ? a classification and literature
review." OR Spectrum 26 (2004): 3-49.
26) Sugiyono, Andre. GROUP TECHNOLOGY APPROACH ON LAYOUT
REDESIGN TO OPTIMIZE CONTAINER HANDLING PROCESS. 23
June
2009.
27) Suyigono, Andre. Chapter 2 Literature Review. Working paper.
28) "TERMINALSTAR - Efficient terminal operations." TERMINALSTAR -
Optimizing terminal operations the smart way. 20 June 2009
<http://www.terminalstar.eu/application.htm>.
29. “Transportation Statistics, Container port traffic Indonesia”,
25 June, 2009 <http://www.nationmaster.com/time.php?
stat=tra_con_por_tra&country=id>
30. Wheately,Stan. Agile Port and High Speed Ship Technologies. Tech no.
FY05
Final Summary Report, Office of Naval Research, 2008

50
31. Yun, Won Young, and Yong Seok Choi. "A simulation model for
container-terminal operation analysis using an object-oriented approach."
Elsevier International Journal of Productino Economics 59 (1999): 221-30
32. Zhang, G. Q., J. Xue, and K. K. Lai. "A class of genetic algorithms for
multiple level warehouse layout." Int. J. Prod. Res. 40 (2002): 731-44.