international workplace productivity survey white … workplace productivity survey ... information...
TRANSCRIPT

October 2010
International Workplace Productivity Survey White Collar Highlights

2
• Background and Objectives 3
• Research Method 4
• White Collar Highlights 5-7
• Detailed Findings 8-25
– Section I: The Problem
– Section II: The Manifestation
– Section III: Solutions
• Appendix: Demographics 26-29
Table of Contents
3
• Background
– In order to build upon the success of the 2008 Workplace Productivity study, LexisNexis commissioned Ogilvy PR to track findings of the original study as well as identify emerging trends on the issue of information overload.
• Study Objectives
– The main objectives of the research are:
• To reveal the scope and impact of “information overload” in the workplace
• To highlight the various (formal and informal) solutions that white collar workers and companies have developed in response to the issue
• To expose key trends on the topic between the 2008 baseline study and the 2010 tracking wave
• To provide a multi-national perspective on the problem, including differences between the U.S., U.K., China, South Africa, and Australia markets.
Background and Objectives

4
Multi-national quantitative study• A survey was conducted among a sample of 1,700 white collar professionals across five countries.
• Interviews were conducted in each of the following countries: the United States (USA), United Kingdom (GBR), China (CHN), South Africa (ZAF), and Australia (AUS).
– In the United States, interviews were conducted online.
– In the United Kingdom, China, South Africa, and Australia, interviews were conducted via telephone.
• The study included 300 non-legal professionals and 200 legal professionals in the US and 200 non-legal professionals and 100 legal professionals in each of the other markets.
• Interviews averaged 15 minutes and were conducted from June 3, 2010 – July 9, 2010 using the field services of WorldOne.
• To ensure a broad representation of white collar professionals was obtained, quotas were established in each market for age and industry sector.
• The margin of sampling error at the 95% level of confidence is:– ±3.8%: 2008 U.S. respondents (n=650)– ±4.4%: 2010 U.S. respondents (n=500)– ±5.7%: U.K., China, South Africa, Australia (n=300)
• 2007 U.S. data has been weighted to 2010 U.S. data on age, gender, and industry sector.
• Throughout this report, an asterisk ‘*’ next to a number indicates a significant difference from the corresponding audience at the 95% level of confidence.
Research Method

5
White Collar Highlights
6
Problem: Too Much Information – A Global Challenge
• Two years ago, a LexisNexis Workplace Survey established that information overload was pushing American white collar workers to their breaking point
• Today, new data shows that the problem hasn’t gotten any better in the U.S. White collar workers are still struggling to cope with a flood of information which has only grown in size since the economic downturn.
• What is remarkable about the latest survey findings is how pervasive this problem is around the globe. From Boston to Beijing, Cape Town to the City of London, Sydney to San Francisco, white collar workers say they are close to the breaking point, and that information overload is taking a heavy toll, both psychologically, and in terms of productivity in the workplace.
White Collar Highlights
7
Manifestation: Drag on Productivity, Morale; Impact Varies from Market to Market; “24/7” Communications: Friend or Foe?
• The fall out from information overload manifests itself in the workplace in different ways depending on geographic location. For example, white collar workers in the U.S. report having trouble finding the right information at the right time, while information overload in China is leading professionals to miss deadlines and appointments at least once a week. In South Africa, a majority of white collar workers report having to deliver incomplete materials because the information they needed couldn’t be found in a timely fashion.
• Email has become a universally pervasive business tool; however, professionals in many countries have a love/hate relationship with it as it has been a major contributor to information overload. White collar professionals report that the constant flow of information and “24/7” accessibility is a huge distraction and hampers their ability to get their job done. A sizeable majority in every market, and as high as 9 out 10 workers in U.S. say they delete or discard their email without fully reading it. And yet, in 3 out of 5 markets, professionals say the best way to reach them with important information is email.
Solutions: More/Better Tools, Technology, Training
• Companies in some markets have taken actions to help their white collar workers manage the information overload problem, particularly in China, South Africa and the U.K.; however workers in the U.S. and Australia say their companies have done less to help them cope with the issue. Meanwhile, employers in China appear to take a more innovative and proactive approach to the problem than those in other countries, including the U.S.
White Collar Highlights (continued)

8
Too Much Information –A Global Challenge
Section I: Problem
9
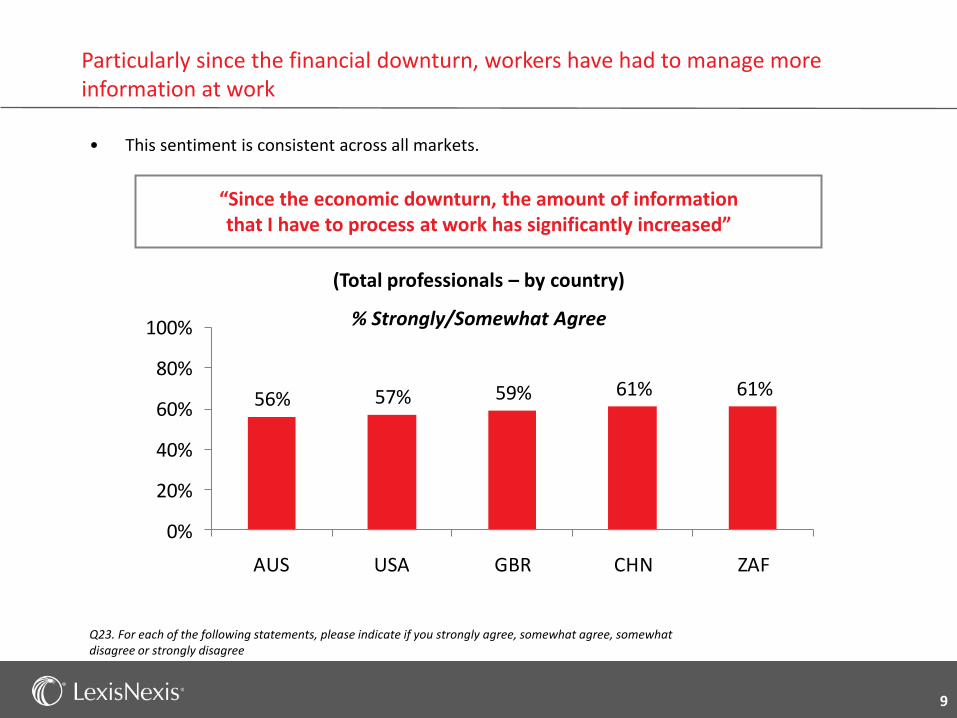
• This sentiment is consistent across all markets.
Particularly since the financial downturn, workers have had to manage more information at work
Q23. For each of the following statements, please indicate if you strongly agree, somewhat agree, somewhat disagree or strongly disagree
56% 57% 59% 61% 61%
0%
20%
40%
60%
80%
100%
AUS USA GBR CHN ZAF
“Since the economic downturn, the amount of information that I have to process at work has significantly increased”
(Total professionals – by country)
% Strongly/Somewhat Agree
10
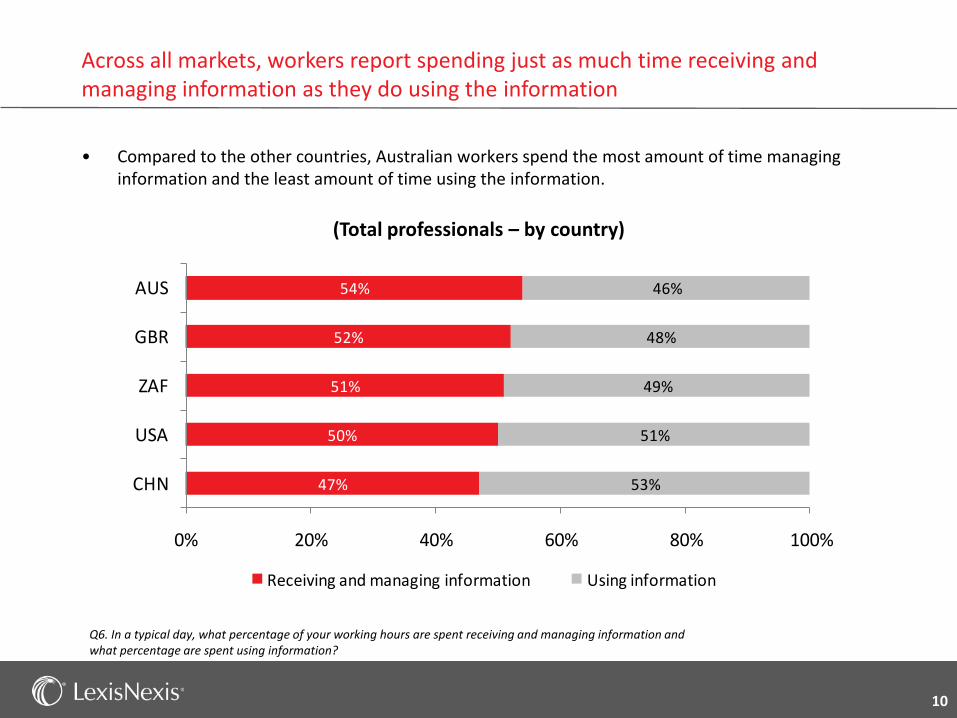
Q6. In a typical day, what percentage of your working hours are spent receiving and managing information and what percentage are spent using information?
47%
50%
51%
52%
54%
53%
51%
49%
48%
46%
0% 20% 40% 60% 80% 100%
CHN
USA
ZAF
GBR
AUS
Receiving and managing information Using information
(Total professionals – by country)
Across all markets, workers report spending just as much time receiving and managing information as they do using the information
• Compared to the other countries, Australian workers spend the most amount of time managing information and the least amount of time using the information.
11
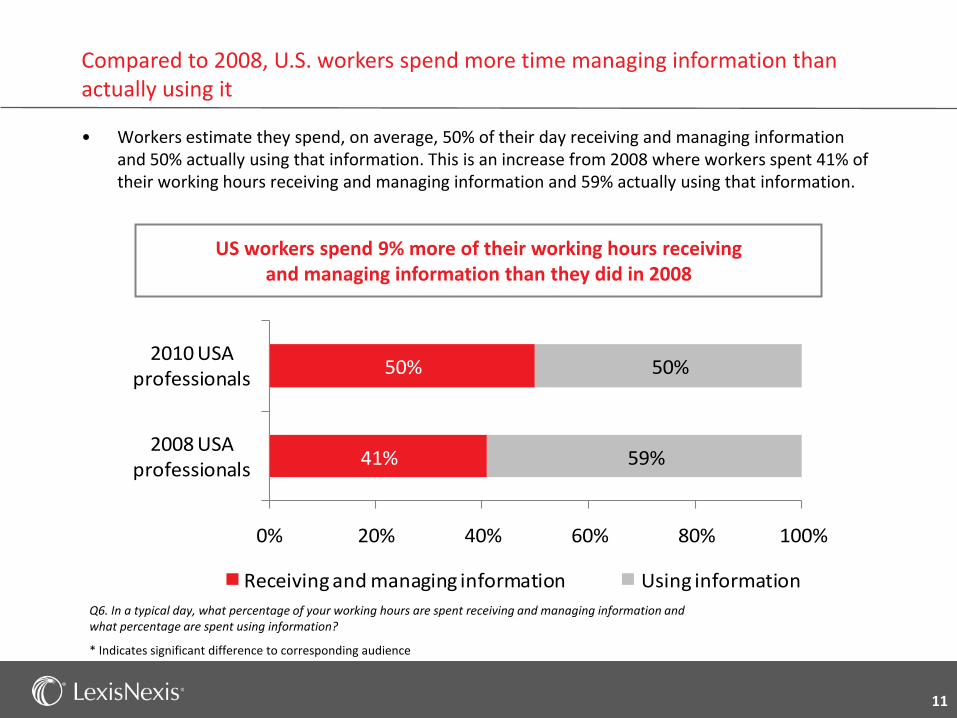
Q6. In a typical day, what percentage of your working hours are spent receiving and managing information and what percentage are spent using information?
* Indicates significant difference to corresponding audience
41%
50%
59%
50%
0% 20% 40% 60% 80% 100%
2008 USA professionals
2010 USA professionals
Receiving and managing information Using information
• Workers estimate they spend, on average, 50% of their day receiving and managing information and 50% actually using that information. This is an increase from 2008 where workers spent 41% of their working hours receiving and managing information and 59% actually using that information.
Compared to 2008, U.S. workers spend more time managing information than actually using it
US workers spend 9% more of their working hours receiving and managing information than they did in 2008

12
Q9. How much of the information that comes your way every day at work is actually important to you getting your job done?
50%
42%
38%
34%
0% 20% 40% 60%
AUS
USA
CHN
ZAF
GBR
(Total professionals – by country)% of Information That Is Not Important To Getting Job Done
• Australian workers are the most likely to report that the information that they receive every day at work is not actually important to getting their job done.
Workers say that much of the information that comes their way every day at work is not crucial to getting their job done
44%

13
Q18. For each of the following statements, please indicate if you strongly agree, somewhat agree, somewhat disagree or strongly disagree
* Indicates significant difference to corresponding audiences
• Australian workers are significantly more likely than the other countries surveyed to agree with this statement.
Workers globally believe search engines don’t do enough to help prioritize information for their needs
“Search engines give me access to huge amounts of information, but don’t help me prioritize it for my professional needs”
(Total professionals – by country)
% Strongly/Somewhat Agree
65% 73% 75% 75%95%
0%20%40%60%80%
100%
GBR USA CHN ZAF AUS
*
14
Drag on Productivity, Morale;Impact Varies from Market to Market;“24/7”Communications: Friend or Foe?
Section II: Manifestation
15
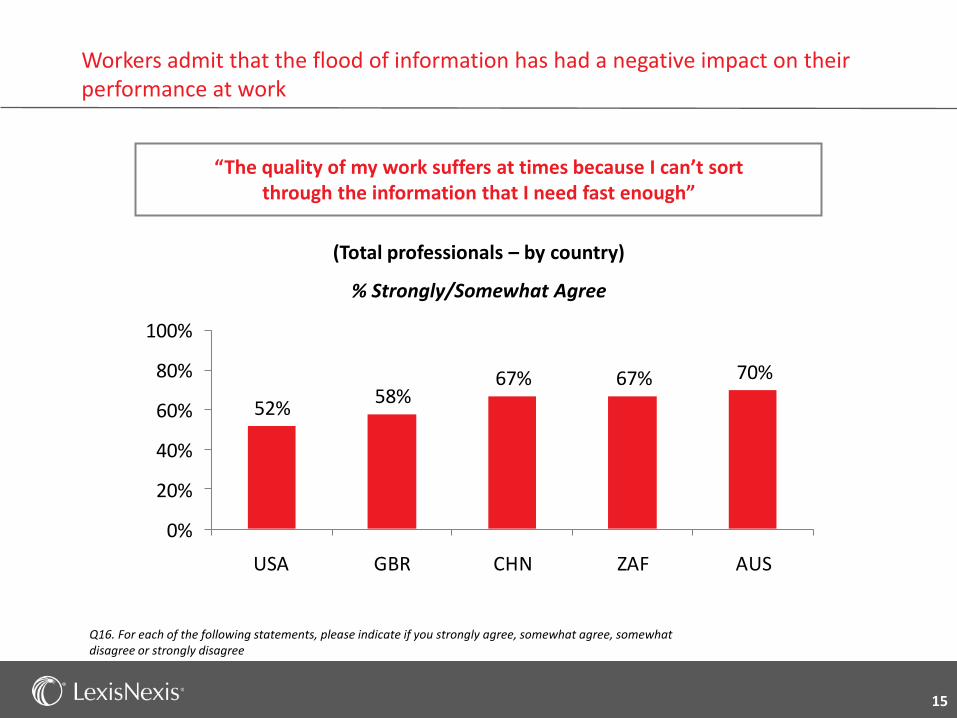
Q16. For each of the following statements, please indicate if you strongly agree, somewhat agree, somewhat disagree or strongly disagree
Workers admit that the flood of information has had a negative impact on their performance at work
“The quality of my work suffers at times because I can’t sort through the information that I need fast enough”
(Total professionals – by country)
% Strongly/Somewhat Agree
52%58%
67% 67% 70%
0%
20%
40%
60%
80%
100%
USA GBR CHN ZAF AUS

16
Q12/Q13/Q17. For each of the following statements, please indicate if you strongly agree, somewhat agree, somewhat disagree or strongly disagree.
* Indicates significant difference to corresponding audiences
• An average of half (51%) of all professionals surveyed in each country say that if the amount of information they receive continues to increase, they will soon reach a breaking point at which they will be unable to handle any more.
Workers across the globe report becoming discouraged when they can’t successfully manage all of the information they receive at work
% Agree (Strongly/Somewhat)Base: Total professionals
USA GBR CHN ZAF AUS
I feel de-moralized when I can’t manage all of the information that comes my way at work.
50% 44% 58% 59% 49%
If the amount of information I receive continues to increase, I will soon reach a breaking point where I can’t handle any more.
46% 46% 62% 56% 51%
17
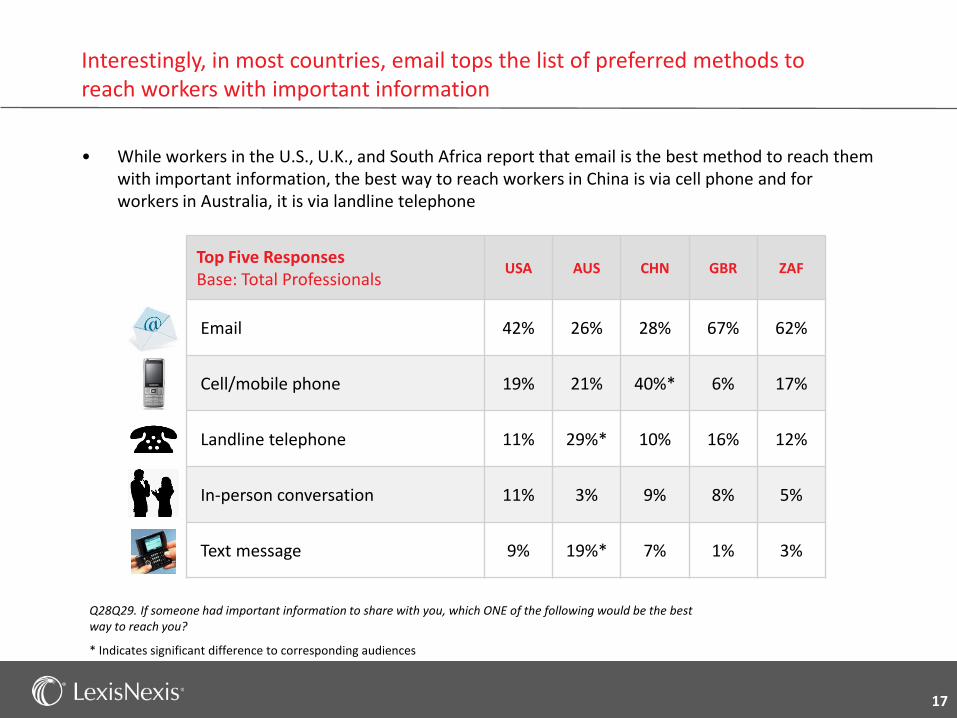
Q28Q29. If someone had important information to share with you, which ONE of the following would be the best way to reach you?
* Indicates significant difference to corresponding audiences
• While workers in the U.S., U.K., and South Africa report that email is the best method to reach them with important information, the best way to reach workers in China is via cell phone and for workers in Australia, it is via landline telephone
Interestingly, in most countries, email tops the list of preferred methods to reach workers with important information
Top Five ResponsesBase: Total Professionals
USA AUS CHN GBR ZAF
Email 42% 26% 28% 67% 62%
Cell/mobile phone 19% 21% 40%* 6% 17%
Landline telephone 11% 29%* 10% 16% 12%
In-person conversation 11% 3% 9% 8% 5%
Text message 9% 19%* 7% 1% 3%

18
Q21/Q22. For each of the following statements, please indicate if you strongly agree, somewhat agree, somewhat disagree or strongly disagree
* Indicates significant difference to corresponding audiences
• Compared to the other markets, workers in Australia are the most likely to say that “it is difficult to maintain their focus on the task at hand when they get distracted by the constant flow of emails and other information” and that “being constantly accessible through mobile phone, e-mail and other means, makes it harder for them to get their job done.”
The incessant flow of information, the majority of workers find it difficult to concentrate and get their job done
% Agree (Strongly/Somewhat)Base: Total Professionals
USA GBR CHN ZAF AUS
It is difficult to maintain my focus on the task at hand when I get distracted by the constant flow of emails and other information.
60% 62% 57% 69% 85%*
Being constantly accessible through mobile phone, e-mail and other means, makes it harder for me to get my job done.
58% 45% 63% 50% 71%

19
Q28. Do you ever delete or discard work information (e.g., emails, other documents, etc.) without fully reading it? Would you say you do this...?
* Indicates significant difference to corresponding audiences
• U.S. workers are significantly more likely than workers in other countries to say they’ve deleted or discarded work information without fully reading it
The majority of workers simply ignore work information that come their way in order to cope with constant flow of information
(Total Professionals – by country)
% Ever Delete or Discard Work Information Without Fully Reading It
71% 73%82% 84%
91%*
0%
20%
40%
60%
80%
100%
ZAF GBR AUS CHN USA

20
• Australian professionals are significantly more likely than other countries to agree that “not being able to access the right information at the right time is a huge time-waster.”
Workers across the globe report becoming discouraged when they can’t successfully manage all of the information they receive at work
% Agree (Strongly/Somewhat)Base: Total Professionals
USA GBR CHN ZAF AUS
Not being able to access the right information at the right time is a huge time-waster.
90% 85% 70% 88% 97%*
Q14. For each of the following statements, please indicate if you strongly agree, somewhat agree, somewhat disagree or strongly disagree
* Indicates significant difference to corresponding audiences
21
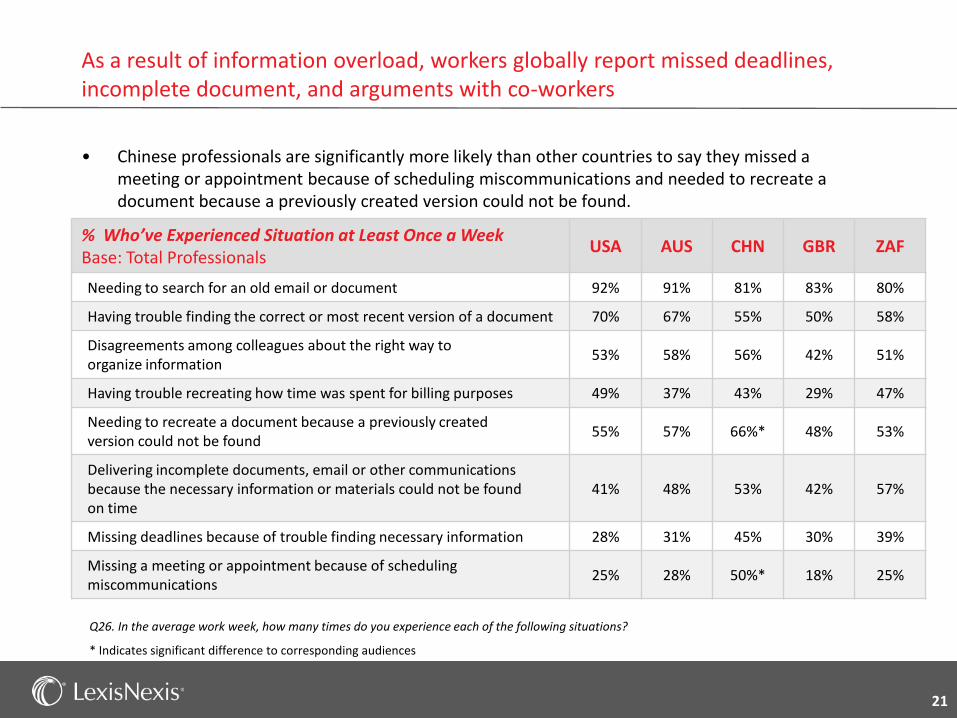
Q26. In the average work week, how many times do you experience each of the following situations?
* Indicates significant difference to corresponding audiences
• Chinese professionals are significantly more likely than other countries to say they missed a meeting or appointment because of scheduling miscommunications and needed to recreate a document because a previously created version could not be found.
As a result of information overload, workers globally report missed deadlines, incomplete document, and arguments with co-workers
% Who’ve Experienced Situation at Least Once a WeekBase: Total Professionals
USA AUS CHN GBR ZAF
Needing to search for an old email or document 92% 91% 81% 83% 80%
Having trouble finding the correct or most recent version of a document 70% 67% 55% 50% 58%
Disagreements among colleagues about the right way to organize information
53% 58% 56% 42% 51%
Having trouble recreating how time was spent for billing purposes 49% 37% 43% 29% 47%
Needing to recreate a document because a previously created version could not be found
55% 57% 66%* 48% 53%
Delivering incomplete documents, email or other communications because the necessary information or materials could not be found on time
41% 48% 53% 42% 57%
Missing deadlines because of trouble finding necessary information 28% 31% 45% 30% 39%
Missing a meeting or appointment because of scheduling miscommunications
25% 28% 50%* 18% 25%

22
Demand for Solutions
Section III: Solutions
23
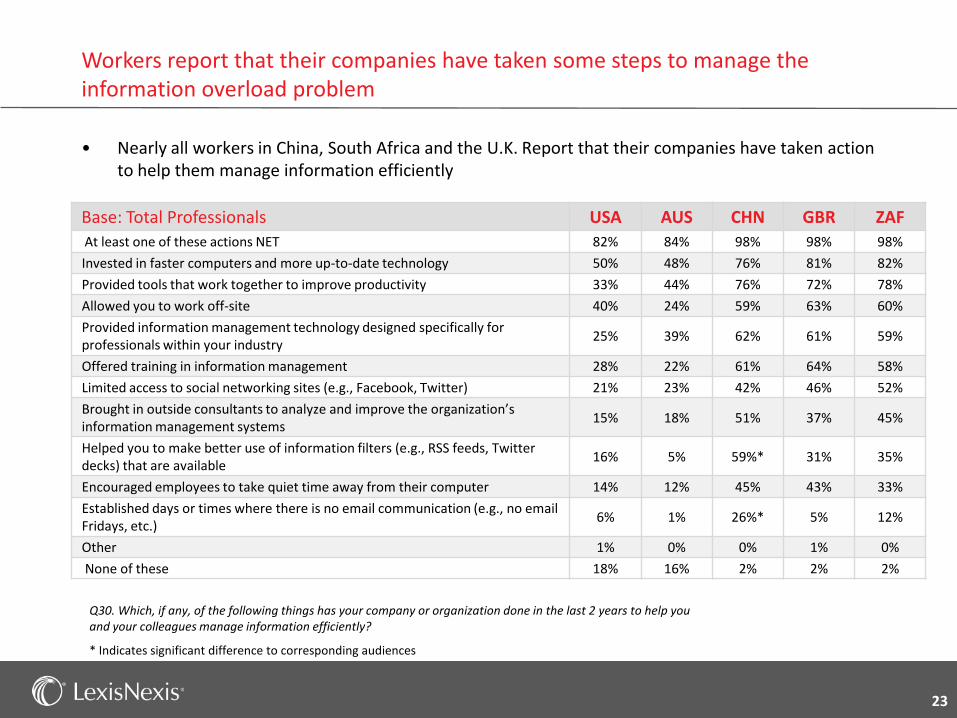
Q30. Which, if any, of the following things has your company or organization done in the last 2 years to help you and your colleagues manage information efficiently?
* Indicates significant difference to corresponding audiences
• Nearly all workers in China, South Africa and the U.K. Report that their companies have taken action to help them manage information efficiently
Workers report that their companies have taken some steps to manage the information overload problem
Base: Total Professionals USA AUS CHN GBR ZAF
At least one of these actions NET 82% 84% 98% 98% 98%
Invested in faster computers and more up-to-date technology 50% 48% 76% 81% 82%
Provided tools that work together to improve productivity 33% 44% 76% 72% 78%
Allowed you to work off-site 40% 24% 59% 63% 60%
Provided information management technology designed specifically for professionals within your industry
25% 39% 62% 61% 59%
Offered training in information management 28% 22% 61% 64% 58%
Limited access to social networking sites (e.g., Facebook, Twitter) 21% 23% 42% 46% 52%
Brought in outside consultants to analyze and improve the organization’s information management systems
15% 18% 51% 37% 45%
Helped you to make better use of information filters (e.g., RSS feeds, Twitter decks) that are available
16% 5% 59%* 31% 35%
Encouraged employees to take quiet time away from their computer 14% 12% 45% 43% 33%
Established days or times where there is no email communication (e.g., no email Fridays, etc.)
6% 1% 26%* 5% 12%
Other 1% 0% 0% 1% 0%
None of these 18% 16% 2% 2% 2%

24
Q31. Please indicate which, if any, of the following your company could do to help you better handle information in your job?
* Indicates significant difference to corresponding audiences
• Chinese workers are significantly more likely than other countries to report that they would like their company to bring in outside consultants, advise on using information filters and establish days without email.
Workers believe that companies could do more to help manage information more efficiently
Base: Total Professionals USA AUS CHN GBR ZAF
At least one of these actions NET 87% 94% 98% 97% 98%
Invest in faster computers and more up-to-date technology 39% 47% 83% 74% 82%
Provide tools that work together to improve productivity 39% 56% 84% 75% 86%
Allow you to work off-site 37% 36% 70% 61% 67%
Provide information management technology designed specifically for professionals within your industry
28% 47% 82% 68% 79%
Offer training in information management 27% 60% 83% 72% 79%
Limit access to social networking sites (e.g., Facebook, Twitter) 15% 18% 49% 47% 59%
Bring in outside consultants to analyze and improve the organization’s information management systems
18% 33% 70%* 41% 59%
Help you to make better use of information filters (e.g., RSS feeds, Twitter decks) that are available
20% 43% 76%* 47% 61%
Encourage employees to take quiet time away from their computer 26% 47% 63% 57% 54%
Establish days or times where there is no email communication (e.g., no email Fridays, etc.)
19% 12% 47%* 20% 32%
Other 1% 2% 0% 0% 0%
None of these 13%* 6% 2% 3% 2%

25
Q19/Q20. For each of the following statements, please indicate if you strongly agree, somewhat agree, somewhat disagree or strongly disagree
Globally, workers desire more customize tools to improve their productivity
% Agree (Strongly/Somewhat)Base: Total Professionals
USA GBR CHN ZAF AUS
I would be more productive if I didn’t have to switch back and forth between applications to get my work done.
72% 65% 81% 74% 84%
I could be more efficient if the software tools that I use were designed to work the way that I work.
79% 73% 92% 82% 85%

26
Demographics
Appendix:
27
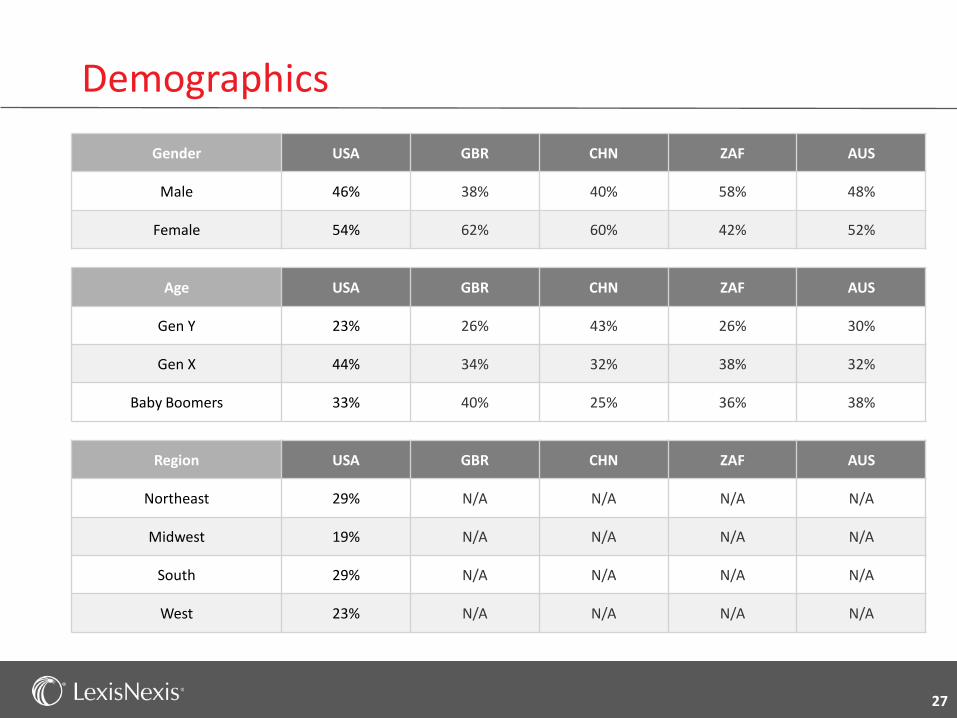
Demographics
Gender USA GBR CHN ZAF AUS
Male 46% 38% 40% 58% 48%
Female 54% 62% 60% 42% 52%
Age USA GBR CHN ZAF AUS
Gen Y 23% 26% 43% 26% 30%
Gen X 44% 34% 32% 38% 32%
Baby Boomers 33% 40% 25% 36% 38%
Region USA GBR CHN ZAF AUS
Northeast 29% N/A N/A N/A N/A
Midwest 19% N/A N/A N/A N/A
South 29% N/A N/A N/A N/A
West 23% N/A N/A N/A N/A
28
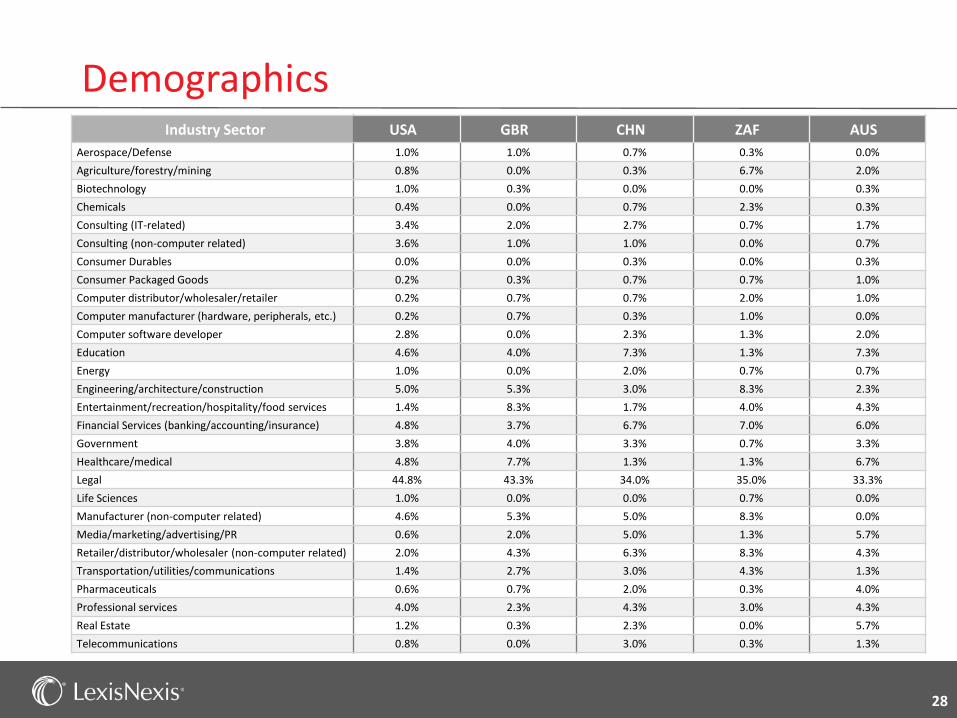
DemographicsIndustry Sector USA GBR CHN ZAF AUS
Aerospace/Defense 1.0% 1.0% 0.7% 0.3% 0.0%
Agriculture/forestry/mining 0.8% 0.0% 0.3% 6.7% 2.0%
Biotechnology 1.0% 0.3% 0.0% 0.0% 0.3%
Chemicals 0.4% 0.0% 0.7% 2.3% 0.3%
Consulting (IT-related) 3.4% 2.0% 2.7% 0.7% 1.7%
Consulting (non-computer related) 3.6% 1.0% 1.0% 0.0% 0.7%
Consumer Durables 0.0% 0.0% 0.3% 0.0% 0.3%
Consumer Packaged Goods 0.2% 0.3% 0.7% 0.7% 1.0%
Computer distributor/wholesaler/retailer 0.2% 0.7% 0.7% 2.0% 1.0%
Computer manufacturer (hardware, peripherals, etc.) 0.2% 0.7% 0.3% 1.0% 0.0%
Computer software developer 2.8% 0.0% 2.3% 1.3% 2.0%
Education 4.6% 4.0% 7.3% 1.3% 7.3%
Energy 1.0% 0.0% 2.0% 0.7% 0.7%
Engineering/architecture/construction 5.0% 5.3% 3.0% 8.3% 2.3%
Entertainment/recreation/hospitality/food services 1.4% 8.3% 1.7% 4.0% 4.3%
Financial Services (banking/accounting/insurance) 4.8% 3.7% 6.7% 7.0% 6.0%
Government 3.8% 4.0% 3.3% 0.7% 3.3%
Healthcare/medical 4.8% 7.7% 1.3% 1.3% 6.7%
Legal 44.8% 43.3% 34.0% 35.0% 33.3%
Life Sciences 1.0% 0.0% 0.0% 0.7% 0.0%
Manufacturer (non-computer related) 4.6% 5.3% 5.0% 8.3% 0.0%
Media/marketing/advertising/PR 0.6% 2.0% 5.0% 1.3% 5.7%
Retailer/distributor/wholesaler (non-computer related) 2.0% 4.3% 6.3% 8.3% 4.3%
Transportation/utilities/communications 1.4% 2.7% 3.0% 4.3% 1.3%
Pharmaceuticals 0.6% 0.7% 2.0% 0.3% 4.0%
Professional services 4.0% 2.3% 4.3% 3.0% 4.3%
Real Estate 1.2% 0.3% 2.3% 0.0% 5.7%
Telecommunications 0.8% 0.0% 3.0% 0.3% 1.3%

29
Demographics
Current Position(Legal professionals only)
USA GBR CHN ZAF AUS
Associate 40% 6% 38% 30% 13%
Partner 20% 11% 10% 42% 12%
Paralegal 36% 19% 38% 13% 20%
Legal secretary 3% 42% 13% 15% 55%
Law librarian 1% 22% 1% 0% 0%
None of these 0% 0% 0% 0% 0%
Current Position (Non-legal professionals only)
USA GBR CHN ZAF AUS
Non-manager 11% 17% 32% 7% 36%
Mid-level manager 47% 38% 45% 22% 19%
Senior manager 22% 34% 7% 44% 28%
Executive 12% 7% 13% 25% 12%
Other (please specify) 8% 4% 3% 2% 5%