international cotton advisory committee - · pdf fileinternational cotton advisory committee...
TRANSCRIPT
SURVEYOF FIBER TESTINGEQUIPMENT
INTERNATIONAL
COTTON
ADVISORY
COMMITTEE
September 2006

SURVEY OF THE FIBER TESTING EQUIPMENT
September 2006
A Report by the Secretariat of the
International Cotton Advisory Committee
Washington DC USA

Fiber Testing Equipment
1
IntroductionAll cotton produced in the world is tested at one stage or another before it is processed into an end product. Testing is done for two main objectives: assessing the true value of cotton so that it is priced correctly (from the buyer as well as the seller’s perspective) and making best use of the fiber quality. In countries where cotton is sold directly by farmers in the form of lint, classing of cotton has become popular because farmers market their cotton based on grades and they directly benefit from the fiber quality they produce. Classing and grading of cotton has not be-come popular in countries where farmers sell only seedcotton and ginners act as processors as well as merchants. Ginners buy seedcotton from growers directly or indirectly, gin it and they sell lint and seed.
Fiber quality cannot be assessed while fibers are still attached to the seed. Grading of seedcotton is not popular in most countries, and it is practically impossible when land holdings are small and every farmer is free to choose varieties and production practices, including irrigation, fertilizers and pesticide use. While varieties differ in their inherent abilities to produce qualitative differences, agronomic practices further amplify the magnitude of differ-ences in quality. Moreover, ginners are bound to mix lots of cotton from small growers.
The hygroscopic nature of the cotton adds to the difficulties of proper quality evaluation. A sample of fiber tested under various conditions, at different temperature and humidity levels, produces different data. Testing equipment is also a source of variability for fiber quality parameters. A variety of fiber testing equipment is used, but the field of fiber testing equipment has not received much attention. On the one hand the development and manufacture of testing equipment is in the private sector and driven by economic motives. On the other hand, the development of suitable equipment that will measure all cottons under all environments equally is probably the most challenging task of the entire cotton industry. To do so at a minimum cost only adds to the problem. Consequently, fiber testing has lagged other fields like breeding, pest control, and more recently, utilization of biochemical and physiological processes going on in the plant.
Certain characteristics of cotton fiber are known, and efforts are made to measure them as perfectly as possible. The cotton industry has succeeded in developing and measuring some characters betters than others. There are also some unknown characteristics that are still not popularly recorded. Even the characteristics currently measured are not universally agreed by all segments of the industry. In spite of all these limitations, there is a need to bring harmony in testing methods so that measured characteristics have equal meaning for all segments of the industry.
The Secretariat of the International Cotton Advisory Committee decided to undertake a survey of the fiber testing instruments in use in various countries. A survey questionnaire was prepared and sent to 55 cotton producing and consuming countries. Respondents were asked the following questions for each type of instrument.
1. No. of machines in your country 2. Year of purchase/approximate age 3. Manufacturer 4. Located at: (Name of the institution/lab and city) 5. Current condition 6. Main complaints 7. Do you have a service center in your country? 8. Do you use calibration cottons to check the instrument? a) If yes, what type (International, national, in-house)? b) If no, why not? 9. Do you use this instrument in a conditioned environment? Yes/No Temperature = Relative Humidity = 10. Additional suggestions/remarks
2
Twenty-four countries responded to the ICAC survey. The data has been compiled for rapid instrument testing, Advanced Fiber Information System (AFIS), strength, length, maturity and fineness, stickiness and trash measur-ing instruments. Even before the initiation of the survey, the Secretariat had realized the difficulty of getting the information in a complete form on all instruments and from every country. It is realized that the data are certainly not complete. Machines used in the textile sector are not reported here. In most cases the machines used in classing and research have been reported by most countries.
The ICAC Secretariat is thankful to Dr. Eric F. Hequet of the International Textile Center, Lubbock, Texas, USA, for his suggestions to design the survey questionnaire and review of the report. However, this does not constitute an endorsement of the report from him or the International Textile Center.
Rapid Instrument TestingThe most common rapid instrument testing machine is the high volume instrument (HVI) made by Uster Technolo-gies, Inc. The only other company that has over 100 machines installed in the world, mostly in Asia, is Premier Evolvics Pvt. Ltd. based in India. It is estimated that close to 2,000 rapid instrument testing machines have already been stalled in the world, mostly from Uster Technologies, Inc. Not only do the machines from each company differ, but various models from each company also differ among themselves. The ICAC did not ask about the per-formance of individual instruments in each lab or about differences among machines and companies. Therefore, the survey responses refer to most machines. In the USA, 292 machines are used in classing cotton. China (Mainland) is moving to test their entire crop on rapid instrument systems, and in the next few years China (Mainland) will surpass the USA in number of HVI machines used in cotton. It is estimated that almost 1/3 of world production is currently classed using rapid instrument testing. Australia and Israel are two other countries where all cotton is classed using rapid instruments. Uzbekistan has the infrastructure and equipment for 100% instrument testing and is in the process of implementing the program.
A number of other countries are also planning to move to machine classification of cotton. The ICAC’s Task Force on Commercial Standardization of Instrument Testing of Cotton (CSITC) is working to enhance standardization of instrument testing and bring uniformity and reliability in the data generated at labs. Out of 23 countries that participated in the survey, only 16 countries have rapid instrument testing machines. Others may have machines in the textile sector that are not used in research labs or for classing purposes.
The oldest machines in use in the countries that responded to the survey were manufactured in 1986 and are still in operation in Australia and Germany. The US has used HVI machines the largest, but most of the machines used by USDA were replaced in recent years. Now there are only three machines from 1992. In total, there are five compa-nies manufacturing rapid instrument testing machines in the world, Uster technologies, Inc., Premier Evolvics Pvt. Ltd., Lintronics and Changing Technologies (China, Mainland) and Statex Engineering (India). Most machines in use are from Uster Technologies, followed by Premier. Lintronics has manufactured only a few machines but the number of machines that have been produced by Changing Technologies and Statex Engineering are not known.
Out of the total of 705 machines in the table above, only seven machines are not working. This includes two ma-chines in Côte d’Ivoire that were damaged/mismanaged due to the civil war in the country. Only 1% of instruments are not in running condition. Three machines that require repair are in Australia, and one each in Bangladesh and Sudan. Many countries have only a few machines, and it is not possible to have service centers in every country. Service centers for quick repair and spare parts are available only in Argentina, Australia and USA. Many more countries that did not participate in the survey, including countries in Europe, Mexico and Turkey, do have service centers. Partial facilities for repair are also available in Colombia and Germany, but these facilities are considered inadequate. All other countries have to wait for help from other countries.
All countries calibrate machines and use USDA HVI cotton calibration standards. The USDA HVI cotton calibration standards are produced only by the US Department of Agriculture. Not every country has mentioned that they use USDA HVI cotton calibration standards, but it is the only standard cotton produced by the USDA, it is assumed that unless mentioned otherwise, as in the case of India, only USDA HVI standards are used for calibration of ma-
3
chines. Information on USDA HVI standards can be obtained from http://www.ams.usda.gov/cotton/ctnord.htm.
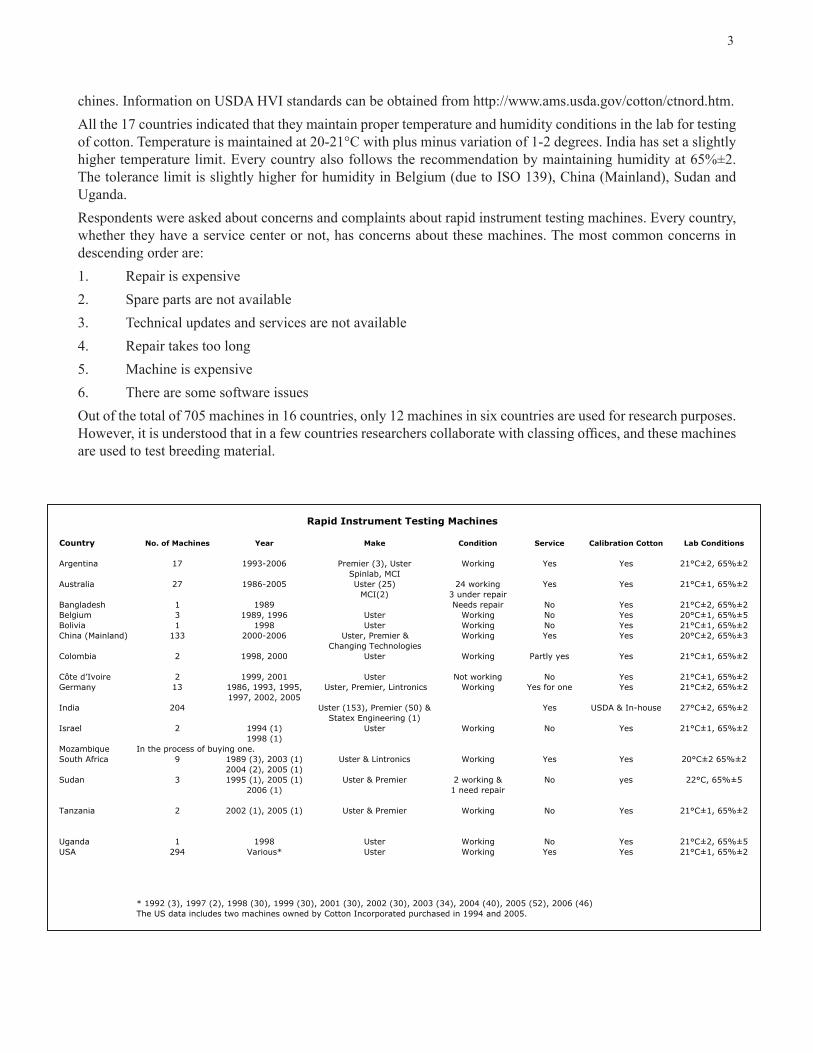
All the 17 countries indicated that they maintain proper temperature and humidity conditions in the lab for testing of cotton. Temperature is maintained at 20-21°C with plus minus variation of 1-2 degrees. India has set a slightly higher temperature limit. Every country also follows the recommendation by maintaining humidity at 65%±2. The tolerance limit is slightly higher for humidity in Belgium (due to ISO 139), China (Mainland), Sudan and Uganda.
Respondents were asked about concerns and complaints about rapid instrument testing machines. Every country, whether they have a service center or not, has concerns about these machines. The most common concerns in descending order are:
1. Repair is expensive
2. Spare parts are not available
3. Technical updates and services are not available
4. Repair takes too long
5. Machine is expensive
6. There are some software issues
Out of the total of 705 machines in 16 countries, only 12 machines in six countries are used for research purposes. However, it is understood that in a few countries researchers collaborate with classing offices, and these machines are used to test breeding material.
Rapid Instrument Testing Machines
Country No. of Machines Year Make Condition Service Calibration Cotton Lab Conditions
Argentina 17 1993-2006 Premier (3), Uster Working Yes Yes 21°C±2, 65%±2
Spinlab, MCI
Australia 27 1986-2005 Uster (25) 24 working Yes Yes 21°C±1, 65%±2
MCI(2) 3 under repair
Bangladesh 1 1989 Needs repair No Yes 21°C±2, 65%±2
Belgium 3 1989, 1996 Uster Working No Yes 20°C±1, 65%±5
Bolivia 1 1998 Uster Working No Yes 21°C±1, 65%±2
China (Mainland) 133 2000-2006 Uster, Premier & Working Yes Yes 20°C±2, 65%±3
Changing Technologies
Colombia 2 1998, 2000 Uster Working Partly yes Yes 21°C±1, 65%±2
Côte d’Ivoire 2 1999, 2001 Uster Not working No Yes 21°C±1, 65%±2
Germany 13 1986, 1993, 1995, Uster, Premier, Lintronics Working Yes for one Yes 21°C±2, 65%±2
1997, 2002, 2005
India 204 Uster (153), Premier (50) & Yes USDA & In-house 27°C±2, 65%±2
Statex Engineering (1)
Israel 2 1994 (1) Uster Working No Yes 21°C±1, 65%±2
1998 (1)
Mozambique In the process of buying one.
South Africa 9 1989 (3), 2003 (1) Uster & Lintronics Working Yes Yes 20°C±2 65%±2
2004 (2), 2005 (1)
Sudan 3 1995 (1), 2005 (1) Uster & Premier 2 working & No yes 22°C, 65%±5
2006 (1) 1 need repair
Tanzania 2 2002 (1), 2005 (1) Uster & Premier Working No Yes 21°C±1, 65%±2
Uganda 1 1998 Uster Working No Yes 21°C±2, 65%±5
USA 294 Various* Uster Working Yes Yes 21°C±1, 65%±2
* 1992 (3), 1997 (2), 1998 (30), 1999 (30), 2001 (30), 2002 (30), 2003 (34), 2004 (40), 2005 (52), 2006 (46)
The US data includes two machines owned by Cotton Incorporated purchased in 1994 and 2005.

4
Advanced Fiber Information SystemSame questions were asked about Advanced Fiber Information System (AFIS). Out of the total of 23 countries, only seven countries reported that they have AFIS. A total of 105 machines were reported, although other machines may exist in the private sector or at state universities. Uster Technologies, Inc. produced all the AFIS machines since 1993.
AFIS can measure length, neps, seedcoat fragments, fineness, maturity and trash. Among all physical properties of the cotton, fiber length varies the most within any one sample. There are two sources of variability; 1) variability that comes from mixing cottons of various lengths and 2) variability that is biological in nature and exists within a sample of the same origin. The same variety grown under different conditions, with lower or higher fertilizer doses, irrigation, or pest control, can produce various lengths. This is why fiber length is tested as an average of many fibers. Fibers also break during handling and processing thus, emphasizing the need for measurement of magnitude of the length variation.
There are many different measurements of fiber length, including staple length, model length, mean length (aver-age length), 2.5% span length, effective length, upper quartile length, upper-half mean length, length uniformity index, length uniformity ratio, span length, short fiber contents and floating fiber length. The AFIS test provides several length parameters deduced from individual fiber measurements. The main measurements include: the mean length, the length upper percentiles, the length CV%, and the Short Fiber Content (defined as the percentage of fibers less than 12.7 mm in length). Fiber length information is provided as a number, or as weight-based data (by number/by weight). The length distribution by weight is determined by the weight-frequency of fibers in the dif-ferent length categories, that is the proportion of the total weight of fibers in a given length category. The length distribution by number is given by the proportion of the total number of fibers in different length categories. The length parameters by weight and by number are computed from the two distributions accordingly. Once the AFIS machine determines the length distribution, the machine computes the length distribution by weight assuming that all fibers have the same fineness. Samples do not require any preparation and a result is obtained in 2-3 minutes. The results generally show a good correlation with other methods.
The survey showed that all AFIS machines are working, and six countries out of eight have service facilities. There are no USDA HVI cotton calibration standards for AFIS. The Uster calibration cottons or in-house cottons are used for calibration of AFIS machines, except in Argentina. Once again the apparatus is used under recommended temperature and humidity conditions.
Most of the equipment is used in research. While two countries have no complaints, others complained about is-sues related to hardware and software, problem with sensors, and cost and time to repair.
Advanced Fiber Information System
Country No. of Machines Year Make Condition Service Calibration Cotton Lab Conditions
Argentina 10 1993-2005 Uster Working Yes No 21°C, 65%
Australia 1 2005 Uster Working Yes In-house 21°C±1, 65%±2
Belgium 3 1990 (1), 1992 (2) Uster Working No Yes 20°C±1, 65%±5
China (Mainland) 1 1986 Uster Working No Yes 20°C±2, 65%±3
Germany 8 1993, 1996, 1997 Uster Working Yes Manufacturer & 20-21°C, 65%
2000, 2002 in-house
India 80 Uster Yes Manufacturer & 27°C±2, 65%±2
CIRCOT
South Africa 4 Uster Working Yes 20°C, 65%
USA 2 1994, 2001 Uster Working Yes In-house & Uster 21°C±1, 65%±2
5
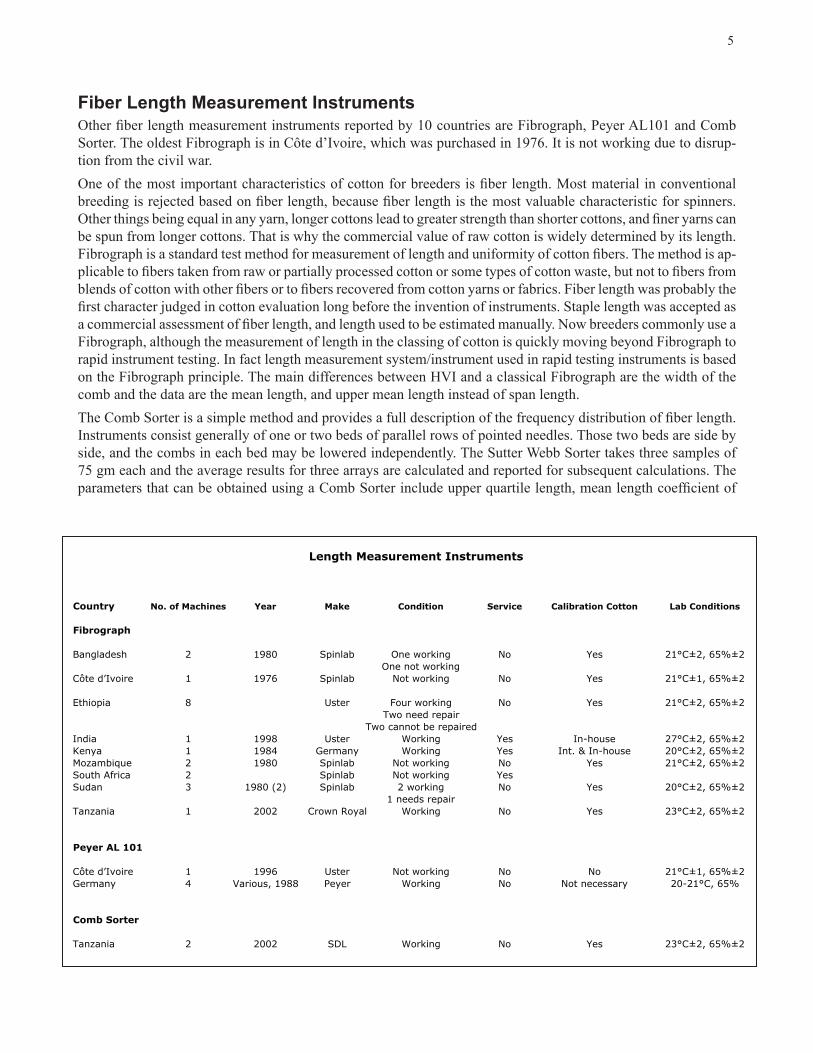
Fiber Length Measurement InstrumentsOther fiber length measurement instruments reported by 10 countries are Fibrograph, Peyer AL101 and Comb Sorter. The oldest Fibrograph is in Côte d’Ivoire, which was purchased in 1976. It is not working due to disrup-tion from the civil war.
One of the most important characteristics of cotton for breeders is fiber length. Most material in conventional breeding is rejected based on fiber length, because fiber length is the most valuable characteristic for spinners. Other things being equal in any yarn, longer cottons lead to greater strength than shorter cottons, and finer yarns can be spun from longer cottons. That is why the commercial value of raw cotton is widely determined by its length. Fibrograph is a standard test method for measurement of length and uniformity of cotton fibers. The method is ap-plicable to fibers taken from raw or partially processed cotton or some types of cotton waste, but not to fibers from blends of cotton with other fibers or to fibers recovered from cotton yarns or fabrics. Fiber length was probably the first character judged in cotton evaluation long before the invention of instruments. Staple length was accepted as a commercial assessment of fiber length, and length used to be estimated manually. Now breeders commonly use a Fibrograph, although the measurement of length in the classing of cotton is quickly moving beyond Fibrograph to rapid instrument testing. In fact length measurement system/instrument used in rapid testing instruments is based on the Fibrograph principle. The main differences between HVI and a classical Fibrograph are the width of the comb and the data are the mean length, and upper mean length instead of span length.
The Comb Sorter is a simple method and provides a full description of the frequency distribution of fiber length. Instruments consist generally of one or two beds of parallel rows of pointed needles. Those two beds are side by side, and the combs in each bed may be lowered independently. The Sutter Webb Sorter takes three samples of 75 gm each and the average results for three arrays are calculated and reported for subsequent calculations. The parameters that can be obtained using a Comb Sorter include upper quartile length, mean length coefficient of
Length Measurement Instruments
Country No. of Machines Year Make Condition Service Calibration Cotton Lab Conditions
Fibrograph
Bangladesh 2 1980 Spinlab One working No Yes 21°C±2, 65%±2
One not working
Côte d’Ivoire 1 1976 Spinlab Not working No Yes 21°C±1, 65%±2
Ethiopia 8 Uster Four working No Yes 21°C±2, 65%±2
Two need repair
Two cannot be repaired
India 1 1998 Uster Working Yes In-house 27°C±2, 65%±2
Kenya 1 1984 Germany Working Yes Int. & In-house 20°C±2, 65%±2
Mozambique 2 1980 Spinlab Not working No Yes 21°C±2, 65%±2
South Africa 2 Spinlab Not working Yes
Sudan 3 1980 (2) Spinlab 2 working No Yes 20°C±2, 65%±2
1 needs repair
Tanzania 1 2002 Crown Royal Working No Yes 23°C±2, 65%±2
Peyer AL 101
Côte d’Ivoire 1 1996 Uster Not working No No 21°C±1, 65%±2
Germany 4 Various, 1988 Peyer Working No Not necessary 20-21°C, 65%
Comb Sorter
Tanzania 2 2002 SDL Working No Yes 23°C±2, 65%±2
6
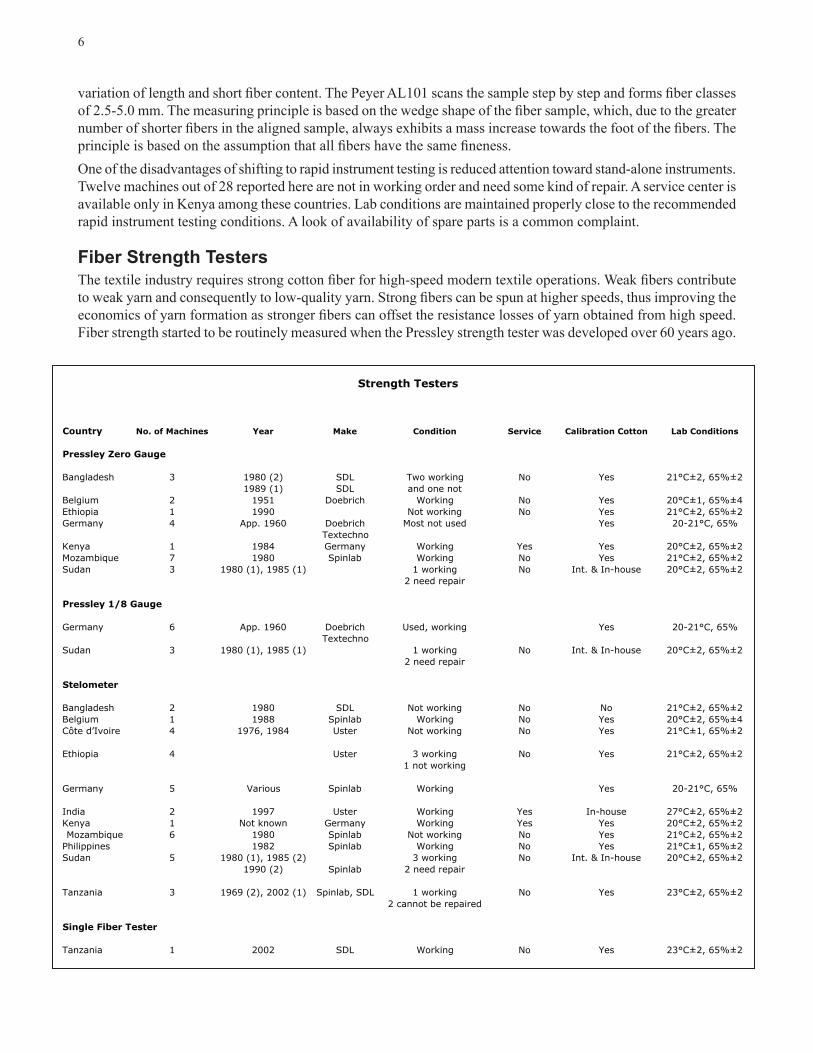
variation of length and short fiber content. The Peyer AL101 scans the sample step by step and forms fiber classes of 2.5-5.0 mm. The measuring principle is based on the wedge shape of the fiber sample, which, due to the greater number of shorter fibers in the aligned sample, always exhibits a mass increase towards the foot of the fibers. The principle is based on the assumption that all fibers have the same fineness.
One of the disadvantages of shifting to rapid instrument testing is reduced attention toward stand-alone instruments. Twelve machines out of 28 reported here are not in working order and need some kind of repair. A service center is available only in Kenya among these countries. Lab conditions are maintained properly close to the recommended rapid instrument testing conditions. A look of availability of spare parts is a common complaint.
Fiber Strength TestersThe textile industry requires strong cotton fiber for high-speed modern textile operations. Weak fibers contribute to weak yarn and consequently to low-quality yarn. Strong fibers can be spun at higher speeds, thus improving the economics of yarn formation as stronger fibers can offset the resistance losses of yarn obtained from high speed. Fiber strength started to be routinely measured when the Pressley strength tester was developed over 60 years ago.
Strength Testers
Country No. of Machines Year Make Condition Service Calibration Cotton Lab Conditions
Pressley Zero Gauge
Bangladesh 3 1980 (2) SDL Two working No Yes 21°C±2, 65%±2
1989 (1) SDL and one not
Belgium 2 1951 Doebrich Working No Yes 20°C±1, 65%±4
Ethiopia 1 1990 Not working No Yes 21°C±2, 65%±2
Germany 4 App. 1960 Doebrich Most not used Yes 20-21°C, 65%
Textechno
Kenya 1 1984 Germany Working Yes Yes 20°C±2, 65%±2
Mozambique 7 1980 Spinlab Working No Yes 21°C±2, 65%±2
Sudan 3 1980 (1), 1985 (1) 1 working No Int. & In-house 20°C±2, 65%±2
2 need repair
Pressley 1/8 Gauge
Germany 6 App. 1960 Doebrich Used, working Yes 20-21°C, 65%
Textechno
Sudan 3 1980 (1), 1985 (1) 1 working No Int. & In-house 20°C±2, 65%±2
2 need repair
Stelometer
Bangladesh 2 1980 SDL Not working No No 21°C±2, 65%±2
Belgium 1 1988 Spinlab Working No Yes 20°C±2, 65%±4
Côte d’Ivoire 4 1976, 1984 Uster Not working No Yes 21°C±1, 65%±2
Ethiopia 4 Uster 3 working No Yes 21°C±2, 65%±2
1 not working
Germany 5 Various Spinlab Working Yes 20-21°C, 65%
India 2 1997 Uster Working Yes In-house 27°C±2, 65%±2
Kenya 1 Not known Germany Working Yes Yes 20°C±2, 65%±2
Mozambique 6 1980 Spinlab Not working No Yes 21°C±2, 65%±2
Philippines 1982 Spinlab Working No Yes 21°C±1, 65%±2
Sudan 5 1980 (1), 1985 (2) 3 working No Int. & In-house 20°C±2, 65%±2
1990 (2) Spinlab 2 need repair
Tanzania 3 1969 (2), 2002 (1) Spinlab, SDL 1 working No Yes 23°C±2, 65%±2
2 cannot be repaired
Single Fiber Tester
Tanzania 1 2002 SDL Working No Yes 23°C±2, 65%±2
7
Twenty years later it was realized that “zero” gauge strength testing results were not reliable. The reason being that zero gauge was only slightly correlated with yarn strength. In 1986, the ITMF International Committee on Cotton Testing Methods recommended the adoption of 3.2 mm (1/8th inch) gauge gm/tex as the recognized interpretation of fiber bundle strength. The strength value of 3.2 mm gauge is drawn from the presence of “weak links” along the length of each fiber. It is still not known if weak links are genetically controlled, or if weather influences their occurrence. Most of the time, the zero gauge gives higher strength values and thus falsely gives the impression of stronger fibers. The 3.2 mm gauge fiber strength value better correlates with yarn strength. Most countries have changed, but zero gauge information is still used in some countries.
The expanded use of rapid instrument testing machines in the world has forced the cotton industry to use Stelometer 3.2 gauge readings, because data from Pressley measurements could not be converted into values equivalent to 3.2 gauge by a general formula for all varieties. The fundamental difference between Stelometer data and the HVI data lies in the way the data are recorded. The Stelometer gives a basic strength value that provides bundle fiber breakage following the rules of constant load. After the fiber bundle breaks, the actual sample weight is used to determine the strength value. The equipment gives bundle strength and elongation values. The strength reported in gm/tex is the force in grams required to break a bundle of fibers one tex unit in size.
The HVI system does not allow measurement of fiber bundle weight at the time of fiber breakage, and therefore HVI needs cotton standards with known strength and micronaire values for comparison purposes. This means that the HVI strength measurement is an indirect measurement of a value by comparison with a standard sample. The Stelometer readings are generally lower than HVI readings for strength. There is no exact conversion factor, but Stelometer readings can be multiplied by 1.28 in order to have an estimated HVI equivalent value.
Pressley machines are the oldest, and some of them are over 45 years, while most are 20-25 years old. They are still working because their handling does not require much sophistication. The age of Stelometer machines is also around 20 years in most cases. Measurement of bundle strength hides the low values of weaker fibers. Bundle strength is also influenced by the length of single fibers; because of this, and also for other reasons, there is a need to measure the strength of single fibers.
Fineness and Maturity TestingFiber length and strength relate directly and indirectly with fiber maturity and fineness. From the spinners’ perspec-tive, both fiber maturity and fineness are key parameters with sometimes opposing effects on mill productivity and yarn quality. For example, yarn is specified in terms of its weight per unit length and fiber fineness determines the number of fibers in a given yarn cross section. If fibers are finer, more fibers can be accommodated in the cross section of a given yarn, which improves spinning efficiency and yarn evenness. Equally, cotton fiber maturity is an important property to spinners and fabric manufacturers because it determines how well fibers will process, both from a chemical and a physical perspective. Immature fibers, that is fibers with little or no fiber wall thickening, are associated with the formation of small entanglements called neps, irregularities in processed fiber assemblies including finished yarns, non-uniform dyeing of fabrics, and decreased processing efficiency. Micronaire is common measurement that is used as a reflection of fiber fineness and maturity. There is a need to measure fiber maturity and fineness separately, but there are no convenient and accurate test methods to assess these properties.
A limitation of the testing methods currently available is slow test times, making large numbers of measurements impractical. However, the test for micronaire measures fiber parameters not solely related to each property. That is, micronaire measures specific surface area by the air pressure differential across a weighed plug of randomly distributed fibers. The micronaire scale is marked in micrograms per inch, and was based on an observed linear relationship between air permeability and linear density for a range of cotton samples of similar maturity. Sub-sequent testing of immature cotton produced results that varied significantly from the actual weight per unit inch determinations. These results are determined on the established theoretical relationship between the measured airflow resistance and the surface area per unit volume of solid fibers with regular cross sectional shapes. How-ever, because cotton fibers are hollow and have irregular cross sectional shapes, this relationship is compromised. Coarse, immature cotton, and a finer more mature sample, can both have the same micronaire value. Despite these shortcomings, the micronaire test is still the most widely used test for fiber fineness and maturity.
8
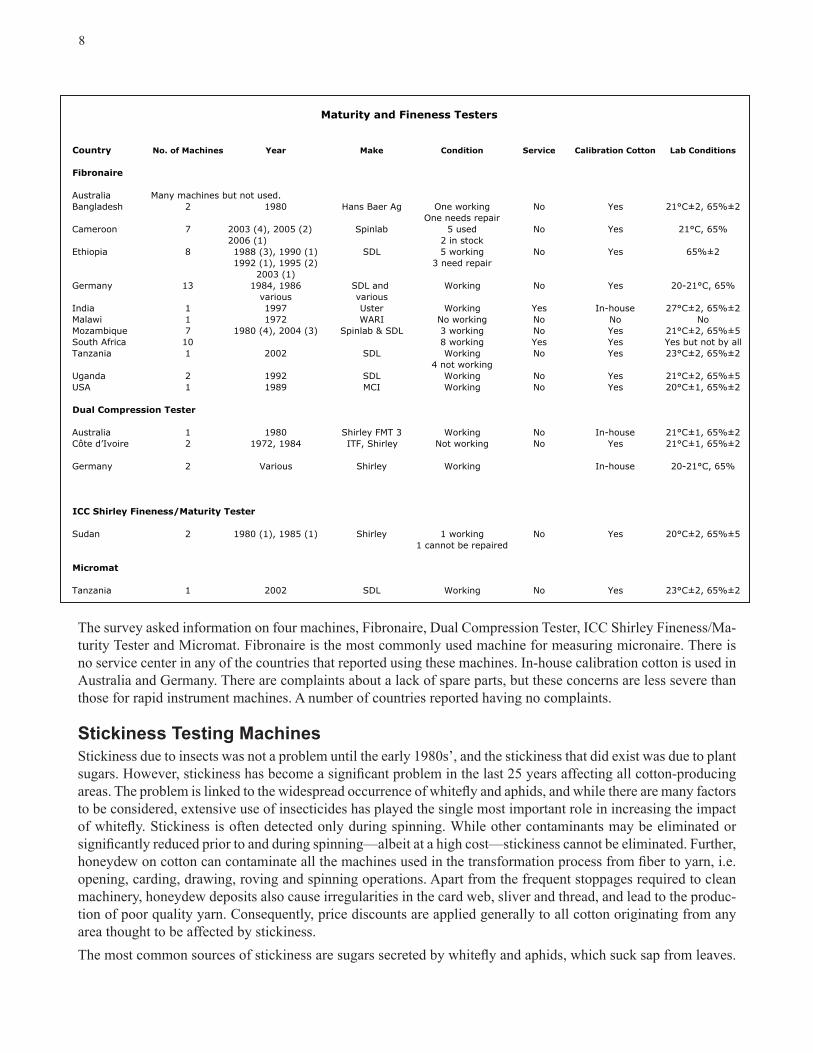
The survey asked information on four machines, Fibronaire, Dual Compression Tester, ICC Shirley Fineness/Ma-turity Tester and Micromat. Fibronaire is the most commonly used machine for measuring micronaire. There is no service center in any of the countries that reported using these machines. In-house calibration cotton is used in Australia and Germany. There are complaints about a lack of spare parts, but these concerns are less severe than those for rapid instrument machines. A number of countries reported having no complaints.
Stickiness Testing Machines Stickiness due to insects was not a problem until the early 1980s’, and the stickiness that did exist was due to plant sugars. However, stickiness has become a significant problem in the last 25 years affecting all cotton-producing areas. The problem is linked to the widespread occurrence of whitefly and aphids, and while there are many factors to be considered, extensive use of insecticides has played the single most important role in increasing the impact of whitefly. Stickiness is often detected only during spinning. While other contaminants may be eliminated or significantly reduced prior to and during spinning—albeit at a high cost—stickiness cannot be eliminated. Further, honeydew on cotton can contaminate all the machines used in the transformation process from fiber to yarn, i.e. opening, carding, drawing, roving and spinning operations. Apart from the frequent stoppages required to clean machinery, honeydew deposits also cause irregularities in the card web, sliver and thread, and lead to the produc-tion of poor quality yarn. Consequently, price discounts are applied generally to all cotton originating from any area thought to be affected by stickiness.
The most common sources of stickiness are sugars secreted by whitefly and aphids, which suck sap from leaves.
Country No. of Machines Year Make Condition Service Calibration Cotton Lab Conditions
Fibronaire
Australia Many machines but not used.
Bangladesh 2 1980 Hans Baer Ag One working No Yes 21°C±2, 65%±2
One needs repair
Cameroon 7 2003 (4), 2005 (2) Spinlab 5 used No Yes 21°C, 65%
2006 (1) 2 in stock
Ethiopia 8 1988 (3), 1990 (1) SDL 5 working No Yes 65%±2
1992 (1), 1995 (2) 3 need repair
2003 (1)
Germany 13 1984, 1986 SDL and Working No Yes 20-21°C, 65%
various various
India 1 1997 Uster Working Yes In-house 27°C±2, 65%±2
Malawi 1 1972 WARI No working No No No
Mozambique 7 1980 (4), 2004 (3) Spinlab & SDL 3 working No Yes 21°C±2, 65%±5
South Africa 10 8 working Yes Yes Yes but not by all
Tanzania 1 2002 SDL Working No Yes 23°C±2, 65%±2
4 not working
Uganda 2 1992 SDL Working No Yes 21°C±2, 65%±5
USA 1 1989 MCI Working No Yes 20°C±1, 65%±2
Dual Compression Tester
Australia 1 1980 Shirley FMT 3 Working No In-house 21°C±1, 65%±2
Côte d’Ivoire 2 1972, 1984 ITF, Shirley Not working No Yes 21°C±1, 65%±2
Germany 2 Various Shirley Working In-house 20-21°C, 65%
ICC Shirley Fineness/Maturity Tester
Sudan 2 1980 (1), 1985 (1) Shirley 1 working No Yes 20°C±2, 65%±5
1 cannot be repaired
Micromat
Tanzania 1 2002 SDL Working No Yes 23°C±2, 65%±2
Maturity and Fineness Testers
9
The insect sap is rich in sugars but poor in amino acids, and amino acids are essential for normal insect growth. Thus, whitefly and aphids have to suck a large amount of sap to meet their amino acid requirements. Unfortunately, they can digest only a small quantity of the liquid. The residual solution is ejected in the form of a droplet of hon-eydew. Honeydew is rich in excess sugars and becomes a source of stickiness in cotton. The honeydew secreted by whitefly is rich in trehalulose (sugar), which is the main source of stickiness during spinning.
There are only two recognized reference methods to test stickiness, and both have limitations. Most of the other methods test for entomological sugars, but none is capable of testing for stickiness related to crushed seed. In the present situation, different types of stickiness have to be identified by different methods. Stickiness may vary from year to year and equal levels of stickiness may not give rise to the same problems in spinning. The challenge thus is twofold: to develop an efficient, effective and automatic testing method for stickiness, and to correlate the level of stickiness to the problems encountered during spinning.
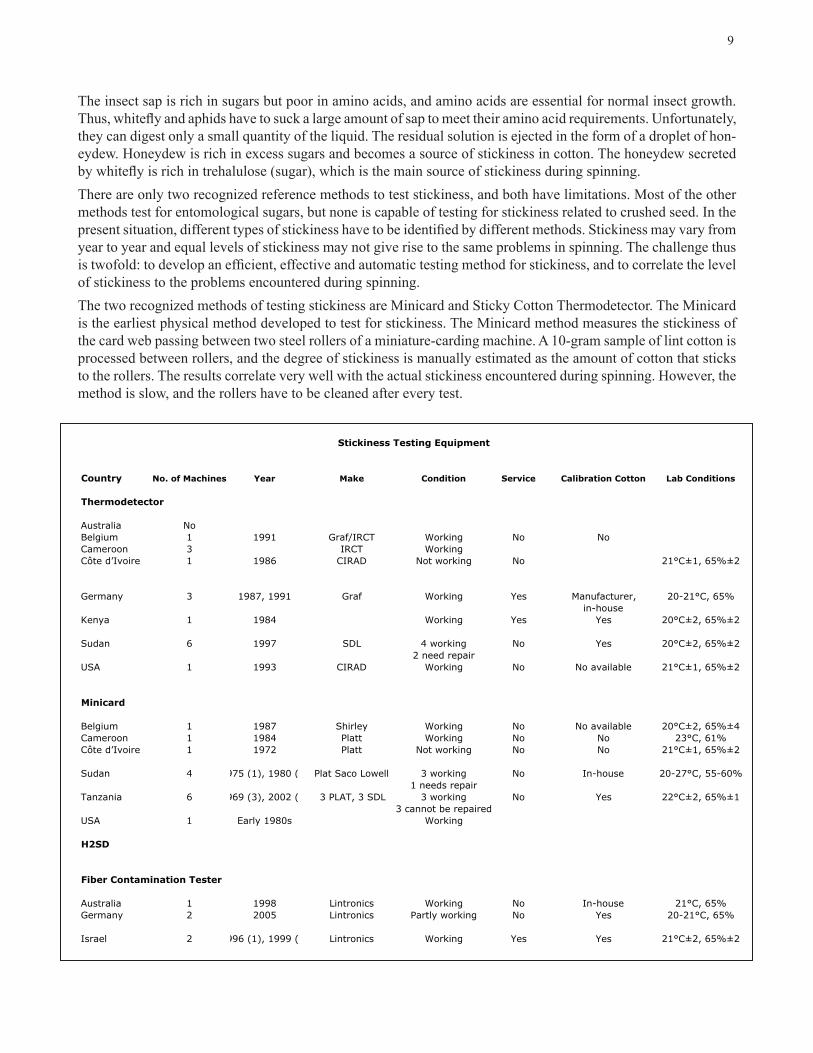
The two recognized methods of testing stickiness are Minicard and Sticky Cotton Thermodetector. The Minicard is the earliest physical method developed to test for stickiness. The Minicard method measures the stickiness of the card web passing between two steel rollers of a miniature-carding machine. A 10-gram sample of lint cotton is processed between rollers, and the degree of stickiness is manually estimated as the amount of cotton that sticks to the rollers. The results correlate very well with the actual stickiness encountered during spinning. However, the method is slow, and the rollers have to be cleaned after every test.
Stickiness Testing Equipment
Country No. of Machines Year Make Condition Service Calibration Cotton Lab Conditions
Thermodetector
Australia No
Belgium 1 1991 Graf/IRCT Working No No
Cameroon 3 IRCT Working
Côte d’Ivoire 1 1986 CIRAD Not working No 21°C±1, 65%±2
Germany 3 1987, 1991 Graf Working Yes Manufacturer, 20-21°C, 65%
in-house
Kenya 1 1984 Working Yes Yes 20°C±2, 65%±2
Sudan 6 1997 SDL 4 working No Yes 20°C±2, 65%±2
2 need repair
USA 1 1993 CIRAD Working No No available 21°C±1, 65%±2
Minicard
Belgium 1 1987 Shirley Working No No available 20°C±2, 65%±4
Cameroon 1 1984 Platt Working No No 23°C, 61%
Côte d’Ivoire 1 1972 Platt Not working No No 21°C±1, 65%±2
Sudan 4 975 (1), 1980 ( Plat Saco Lowell 3 working No In-house 20-27°C, 55-60%
1 needs repair
Tanzania 6 969 (3), 2002 ( 3 PLAT, 3 SDL 3 working No Yes 22°C±2, 65%±1
3 cannot be repaired
USA 1 Early 1980s Working
H2SD
Fiber Contamination Tester
Australia 1 1998 Lintronics Working No In-house 21°C, 65%
Germany 2 2005 Lintronics Partly working No Yes 20-21°C, 65%
Israel 2 996 (1), 1999 ( Lintronics Working Yes Yes 21°C±2, 65%±2
10
CIRAD-CA developed the Sticky Cotton Thermodetector for testing stickiness. A sample of cotton is placed on a sheet of aluminum foil on the bottom plate of a heating press and heated to 82.5∞C for 12 seconds. The honeydew droplets on the fibers melt and stick to the foil. The non-sticking cotton is removed and the remaining sticking points are manually counted. The Thermodetector is faster than the
Minicard, and its results correlate well with the Minicard method. However, the process is still slower than indus-try standards, and the human factor can result in high data variability. There are approximately 150 Sticky Cotton Thermodetectors in operation around the world.
Most stickiness testing machines are working. Calibration cottons are not available. There is no strict requirement for lab conditions and all countries report that lab conditions are still maintained. Common complaints are expensive repair, slow speeds and the reliability of the data. The Fiber Contamination Tester is the newest method for testing stickiness, but it is not recognized yet by the International Textile Manufacturers Federation. Spectrophotometer and chemical methods are also available, but they are not used in the industry on a commercial scale.
Trash TestersTrash is an important criteria for classification of cotton. High trash means lower grade and lower price, other things equal. Bolls on plants have no trash or non-lint contamination. But, when a boll opens, it is vulnerable to being contaminated by dry leaves and other plant parts. Hand picked cotton is expected to carry less plant mate-rial, while machine picked seedcotton may contain up to ¼ of non-lint material. Stripper harvested cotton, like that grown in the high plains of Texas, USA, carries the highest amount of trash and plant material. Trash particles other than leaf are collectively called “extraneous matter” in the cotton classing system. With visual evaluation of trash content, seven physical standards, designated as the seven white color standards, are used by the USDA to determine leaf grades designated “1” through “7.”
The HVI trashmeter scans the surface of a cotton sample, separates trash areas from lint, and reports the percent-age of the total trash area. However, the trashmeter is unable to provide information about trash categories, for instance leaf trash versus a piece of plastic.
Different trash categories have different influences on the textile processing of cotton and the quality of finished products. Breakage during spinning is the biggest concern regarding trash, and statistics show that breakage in-creases by approximately 60% with a 1% increase in bark content. Hence, cotton must be cleaned during ginning. However, excessive cleaning also damages cotton quality.
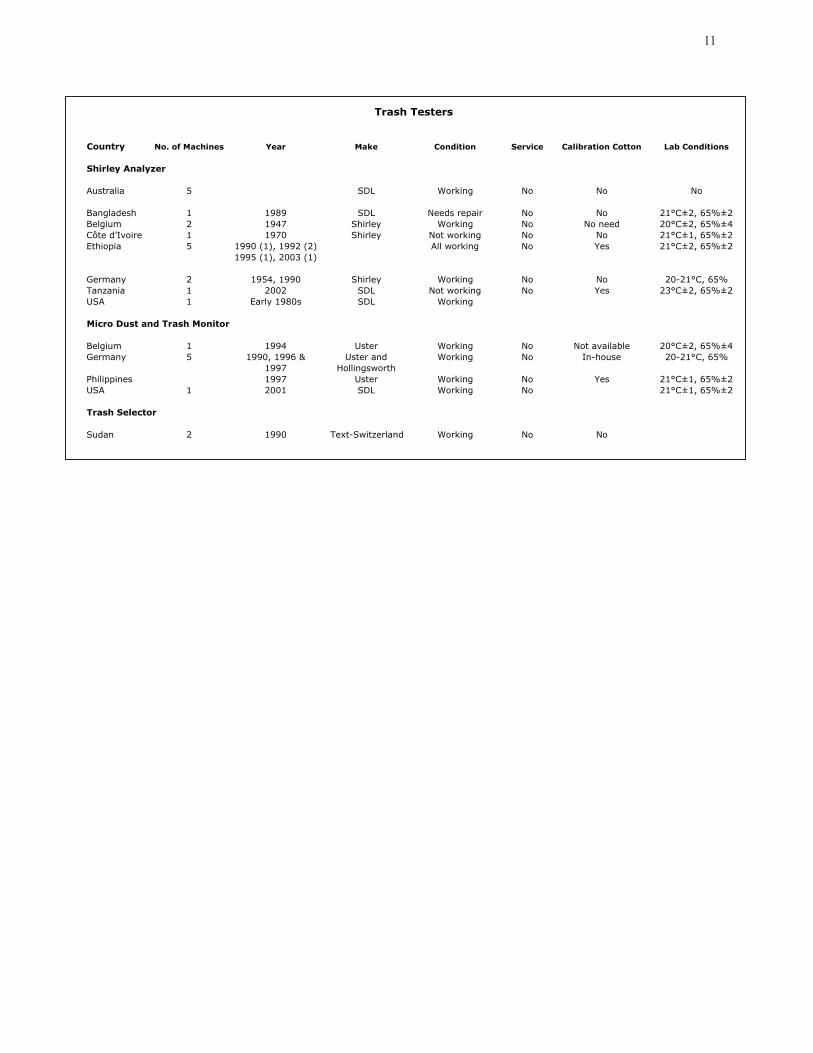
Studies show that the geometrical features of trash, shown by near-infrared spectra, can identify most trash types. Techniques that are currently available for the identification of trash in cotton include the Shirley Analyzer, Ad-vanced Fiber Information System (AFIS), and High Volume Instrumentation (HVI). The Shirley Analyzer is a gravimetric measure that indicates the amount of total trash present in cotton samples. Trash measurements from AFIS include the percent content of foreign matter, or visible foreign matter (dust and trash). The measurement is by an optical sensor and categorizes the trash objects in terms of the equivalent diameter of the objects.
Discussions continue on measurement of trash by weight or by area. The HVI measurement doe not typically present the size and type of trash particles found in a sample. Currently, no commercial techniques are available that can be accurately used in the cotton industry to measure and categorize trash.
11
Trash Testers
Country No. of Machines Year Make Condition Service Calibration Cotton Lab Conditions
Shirley Analyzer
Australia 5 SDL Working No No No
Bangladesh 1 1989 SDL Needs repair No No 21°C±2, 65%±2
Belgium 2 1947 Shirley Working No No need 20°C±2, 65%±4
Côte d’Ivoire 1 1970 Shirley Not working No No 21°C±1, 65%±2
Ethiopia 5 1990 (1), 1992 (2) All working No Yes 21°C±2, 65%±2
1995 (1), 2003 (1)
Germany 2 1954, 1990 Shirley Working No No 20-21°C, 65%
Tanzania 1 2002 SDL Not working No Yes 23°C±2, 65%±2
USA 1 Early 1980s SDL Working
Micro Dust and Trash Monitor
Belgium 1 1994 Uster Working No Not available 20°C±2, 65%±4
Germany 5 1990, 1996 & Uster and Working No In-house 20-21°C, 65%
1997 Hollingsworth
Philippines 1997 Uster Working No Yes 21°C±1, 65%±2
USA 1 2001 SDL Working No 21°C±1, 65%±2
Trash Selector
Sudan 2 1990 Text-Switzerland Working No No