internal and external factors of competitiveness in the ...eprints.ucm.es/9570/1/wp_08-09.pdf · 1...
TRANSCRIPT
1
Internal and external factors of competitiveness in the
middle-income countries Isabel Álvarez, Raquel Marín
Georgina Maldonado WP08/09

2

3
Resumen En el diverso grupo de países de renta media (PRM) se integra un conjunto de economías con un comportamiento exportador de bienes intensivos en tecnología que sobresale respecto al promedio del grupo. Una de las explicaciones de ese resultado estaría en la diferencia de capacidades tecno-lógicas nacionales, entendiendo éstas como un factor condicionante de la dinámica productiva y comercial que genera ganancias de competitividad. También los efectos que generan los flujos de comercio y de inversión directa (IDE) en estas economías en las que las empresas extranjeras han participado en la industrialización y modernización de su estructura productiva, formarían parte de la explicación. Por ello, en este trabajo analizamos las posibilidades de integración de los PRM en los dinámicos mercados de alta tecnología, a partir de la interacción que se define entre el papel de la IDE y la habilidad de absorción y creación de tecnología. Nuestro trabajo empírico trata de detectar la importancia relativa de factores internos y externos en las mejoras de competitividad internacional de estos países en desarrollo, haciendo uso de un panel de datos en el período com-prendido entre 1998 y 2005
Palabras clave: competitividad; IDE; alta tecnología; países de renta media El estudio en que se basa el presente Working Paper ha recibido la financiación de la Di-rección General de Planificación y Evaluación de Políticas de Desarrollo (DGPOLDE) del Ministerio de Asuntos Exteriores y Cooperación (MAEC).
Abstract The diverse group of middle-income countries (MIC) is composed by some economies with an active behavior in exports of technology-intensive goods that is strictly better than the group aver-age. One of the factors explaining such a result is the improvement of their national technological capabilities that affects the dynamism of their productive and trade structure generating competi-tiveness gains. There are grounded reasons to think that this is also a consequence of external ef-fects and the potential impacts that both trade and foreign direct investments (FDI) flows generate in those economies where foreign companies have contributed to the industrialization and mod-ernization of their productive systems. In this paper, we analyze the possibilities of integration of the MIC economies into the dynamic high-tech markets as the interplay between the role of FDI and their ability for the absorption and creation of technology. We will observe based upon em-pirical analysis with panel data (1998-2005), what is the relative importance of internal and exter-nal factors for the improvement of the international competitiveness in these developing econo-mies.
Key words: competitiveness; FDI; high-tech; middle income countries The study in which this Working Paper is based on has received the economic support from the General Direction of Planning and Evaluation of the Development Policies (DGPOLDE) of the Spanish Ministry of Foreign Affairs and Cooperation (MAEC).
Isabel Álvarez, Raquel Marín y Georgina Maldonado Instituto Complutense de Estudios Internacionales, Universidad Complutense de Madrid. Campus de Somo-saguas, Finca Mas Ferre. 28223, Pozuelo de Alarcón, Madrid, Spain.
© Isabel Álvarez, Raquel Marín y Georgina Maldonado
ISBN: 978-84-692-3892-9 Depósito legal: El ICEI no comparte necesariamente las opiniones expresadas en este trabajo, que son de exclusiva responsabilidad de sus autores.

4

5
Índice 1. Introduction……………………………………………………………………………………7 2. Literature background ………………………………………………………………………...8 3. Hypothesis development and analytical model ……..………………………………………12 4. Measuring competitiveness ...………………………………………………………………..15
4.1 The global competitiveness index ……………………………….……………….…15 4.2 The role of technology and innovation in competitiveness ..………………………17 4.3 The role of foreign owned companies in the
competitiveness of the MIC …………………………………………………..……..24
5. The empirical analysis……………………………..……...……………………….…………27
5.1 The technological position of MIC countries at the international level…………...27 5.2 The econometric model…………………………………………..………………….31 5.3 Discussion of results…………………………………………………………………32
6. Conclusions…………………………..….....…………………………………..……...…..…34
Appendix.……………………………………………………………………………………..36
Bibliographical references………………………...…………………...……………………..44

6

7
1. Introduction
The possibilities that Middle Income Countries (MIC) have to be more competitive and to integrate the most dynamic international mar-kets are dependent on the advantages derived from their productive and commercial spe-cialization. This is a consequence of their technological capabilities and also of the im-pact of external factors such as the influence of the foreign direct investments (FDI). Leaving aside a major and interesting discussion about the concept of competitiveness and its applica-tion at the aggregated level (Krugman, 1994), our understanding of the competitive position of countries in this paper would be certainly linked to the combination of their own na-tional abilities and their degree of international integration. These aspects, at the end of the day, are necessarily linked to the individual behavior, mainly to the abilities of firms and the scientific and technological institutional set-up of a given country to generate im-provements in the technological advance lev-els; therefore, it is methodologically accepted both the adaptation of the concept of competi-tiveness and the focus of the analysis at the country level. Most of the explanations found in the econom-ics literature, from either the static point of view of the factors’ endowment or the dynamic perspective that focused in technological op-portunities and innovation agrees on the role that domestic capabilities have into the defini-tion of the specialization patterns, these be-coming determinant factors of the firms’ com-petitiveness. In terms of national economies, the evolution of the international commercial patterns reveals that the shift in the advantages of technological specialization ultimately de-pends upon the industrial structure as well as on the characteristics of a more complex set of elements integrated in what is named the na-tional systems of innovation (Narula and Wakelin, 1995). In the case of developing economies, those abilities would be at least in the first stages of development (industrializa-tion) mainly focused on the adaptation and efficiently use of the already available technol-ogy worldwide (Lall, 1996; 2000); although a kind of external dependence is revealed, the efficient use of them that could be transformed in sustainable growth and higher technological development in the long run comes to under-
line the importance of the national efforts to build the appropriate absorption capabilities. On the other hand, assuming that openness does not necessarily mean growth and devel-opment per se (Rodrick, 1999; Fagerberg and Srholec, 2008), we will defend here that it is not less certain that in a World Economy in-creasingly internationalized, those national capabilities can be in many occasions gradu-ated and reinforced by external factors, par-ticularly in present years. In other words, pro-duction activities, the generation of value and even the technology transfer corresponding to large internationalized corporations in foreign countries enhance necessarily to take into ac-count their influence in the definition of the competitive patterns in MIC. Then, a narrow look to the analysis of competitiveness (that only looks at trade flows) may derive into mis-taken (or at least just vague) conclusions about the results achieved by these economies, mainly because multinational companies (MNC) could become in many developing countries some of the more (if not the most) active exporter players or promoting them (through the international fragmentation of production that is taking place nowadays). The deeper process of internationalization in last decades has ended by affecting markets and hierarchies although the benefits of the global value chain, the increasing fragmenta-tion among countries, have not been equally distributed. In some value chains, the role of coordination becomes more important in order to command different technologies and to guarantee the efficiency in both suppliers and customers; these are mainly characterized by the driving role of producers and FDI (Kap-linsky, 2000). Then, MNC that have had a crucial role in the large increase on the in-vestment’s flows among countries, may also had intervened in the definition of the com-petitiveness conditions in both home and host economies. For instance, the distance between production activities and R&D in the global value chain that could be seen as a result of the activities that affiliates of MNC perform in developing countries may contribute to the competitive results of these economies as well. Moreover, data show that there has been not only a raise in FDI inflows into developing economies (UNCTAD, 2005; 2007) but also the emergence of outward FDI from develop-

8
ing countries as well, a phenomenon that be-ing more recent in time, in our view should be integrated in the study of international com-petitiveness. Our conceptual construct is built upon the idea that competitiveness and technology de-fines a complex relationship that could be bidirectional, it is characterized by multiple loops and multiple possibilities for feedback and then, a diversity of factors can intervene simultaneously in both, the definition of com-petitive patterns and technology. The empiri-cal objective in this paper is to try to disentan-gle that diversity, exploring the differences in the competitive positions of the MIC in the international markets and their dynamic pos-sibilities to upgrade. In other words, we ex-plore different angles in the analysis of com-petitiveness, including the integration of the middle-income economies in the internation-alization process that has been accentuated by the MNC activities worldwide, and the inter-play with the technology adoption (creation) processes. Likewise, being aware of the heterogeneity that characterized the group of middle-income economies (Álvarez and Magaña, 2007), what-ever generalization of results about competi-tiveness based on the behavior of the group could conduit to just vague conclusions from an analysis that is specifically defined for the MIC. Therefore, this paper explores with data at country level the technological possibilities of the MIC as an indirect way to approach their integration in the more dynamic interna-tional markets, making use of a combination of different measurements and data sources. We will make a diagnosis about what the rela-tive abilities of this group of developing economies in the world market of technology-intense goods are, trying to detect what would define the threshold level in relation to both the external orientation (FDI flows) and the internal technological possibilities of them (national systems of innovation). The general proposition will be developed over the effects of international knowledge transfer in the competitiveness of the MIC, trying to identify at the end some opportunities for public poli-cies in both the national and the international spaces. In the next section, the literature review will be based on the factors that affect competitive-ness levels, with a focus into developing coun-tries. In the third section, we develop our hy-
pothesis integrating it into a conceptual framework based on the relationship between FDI (inward and outward) and technology (absorption and creation). In the fourth sec-tion we analyze the position of the MIC ac-cording to the Global Competitive Index and its components, following the methodology of the World Economic Forum with special at-tention to technology and innovation aspects; in this section we choose those countries in the tales of the ranking to explore in more detail the characteristics of the entrepreneurial fabric of those economies according to the Enterprises Surveys of the World Bank. In section fifth, we describe the main relation-ships among the variables integrating the em-pirical model, with data from the World Bank -World Development Indicators- and the UNCTAD for 1998-2005 period; that is to say, we will analyze under a dynamic perspective the impact of both technological indicators and external factors in the competitiveness shift of the MIC. We conclude in section sixth.
2. Literature background Competitiveness is a concept very discussed among academics; it allows for several level of analysis and there is not a common and undis-tinguished methodology to deal with. Al-though its most pertinent application is at the firm level and it refers to a comparative con-cept of competition or market gains, it has been applicable at the national level as well (Porter, 1985; Nelson, 1993; Fagerberg, 1996; Roessner et al, 1996). The more broad defini-tion of competitiveness relates to productivity and growth of countries (Krugman, 1994) while the more tractable definition has been focused on the ability of a country to compete in trade by exporting (Fagerberg, 1996; Lall, 2001). The huge number of contributions on competitiveness is justified by the fact that this fashionable concept has been a facilitator for the discussion and definition of policies and actions to enhance the national performance. Easy connections have been done between being competitive, economic growth and wealth creation in nations, while unemploy-ment and underdevelopment have been broadly associated to the lack of competitive-ness in countries. In this direction, Sala-i-Martin has recently contributed to the devel-opment and accuracy of the concept assuming that competitiveness can be assimilated to productivity and the connected influential factors at national level and this has served as

9
a common guidepost for the work on this issue in many international organizations (Sala-i-Martin, 2008). Notwithstanding that globalization has changed the markets functioning and hierar-chies, international firms, industries and commerce have been increasingly reshaped by technology. Then, we assume that the national structural competiveness definition seems to be related to a country’s ability to enhance collective techno-economic capacities in the world market-place; this implies a relative or comparative notion of performance that is shaped by multiple and diverse factors that would define the competitive results of coun-tries and how they rank in international classi-fications. Although there is a risk of becoming a “dangerous obsession” (Krugman, 1994), it is certain that virtually all the countries seek to take advantage of the structural and produc-tive changes that increase their competitive position; or in other words, to improve their share of world output, employment and trade of technology-intensive products (Aharoni and Hirsch, 1997). The competitive differences among countries are due to their technological capabilities, that is to say, to their ability for technology absorp-tion, adaptation, efficiently use, and of course technology creation. This is affected by several factors such as the macro environment condi-tions, the strategies of business organizations and the institutional framework as well. The choice between absorption and adaptation of the existing technologies and the creation through the expansion of R&D and innovation are quite unique for each nation and depend-ent also on the level of initial development (Gerschenkron, 1962) or on its degree of modernization. In this sense, some empirical analysis of the evolution followed by trade patterns and the technological advance in de-veloping countries (mostly Asian economies) argue that the relationship between commer-cial advantages and the technological advan-tages is clearer in some economies, such as Hong-Kong, Singapore and South Korea and it is less evident in those like Philippines, Malay-sia, Thailand and Indonesia. The analysis for these countries shows that this can be due to the industry structure of many developing economies –where the MIC are among them- in which there is a coexistence of traditional industries labor-intensive and industrial activi-ties technologically complex (Uchida and Cook, 2005).
We also assist to the fact that some developing countries have been even able to develop their own technologies (i.e. Brazil in aircraft, elec-tronics, computers; India in computers; Ma-laysia in electronics) and this is the result of a combined action of States, foreign capital and domestic capital. In many occasions, the suc-ceeding economies have based their strategy on the adaptation of imported technologies and their upgrading locally (most Asian NIC). Other empirical evidence, for Latin American countries, shows also the existence of a com-plementary relationship between technology imports and R&D effort (Katz, 1982), this making possible to argue that foreign know-how may stimulate the local absorption of technologies. Thus, the upgrading process can be conceived as the result of the efforts on building new capabilities not existing in de-veloping countries and which entail two levels of action: On the one hand, it is partly deter-mined by the investments at the national level in scientific and technological skills, informa-tion flows, infrastructures and supporting in-stitutions. On the other hand, at the micro level it depends upon the firms efforts to de-velop new organizational and technological skills and to tap into new information; this would permit them to be able to define the appropriate specialization vis-à-vis other firms (Lall, 1997). In any sense, acquiring the tech-nology expertise is a cumulative process that necessarily requires the development of ab-sorptive capacities and the involvement in networks of differentiated nature, the interac-tion with customers, suppliers and other fac-tors of the environment (Cantwell, 1989; Lundvall et al, 2002; Fagerberg and Srholec, 2007; Alvarez et al., 2009). Regarding the relationship between foreign MNC and development, it is meaningless to try to find a univocal causal relationship be-tween them (Narula and Dunning, 2000). Even though, FDI and the activities of foreign companies have had an important role in the industrialization and modernization processes of many developing countries, with notable effects in some of their productive transforma-tions; this is a consequence of the combination of both ownership and localization advantages of the incoming MNC that would contribute to the establishment of value creating activities in their territories (Dunning, 1993; 2006). Fur-thermore, the MNC-assisted development ap-proach defends that international divergences among economies are due to both supply and demand factors and this aspect would explain
10
the international configuration of FDI (Ozawa, 1992; Lall, 2002). This would recall the exis-tence of complementarities between both types of entry modes, namely FDI and trade since large internationalized firms can be seen as creators and traders of intangible assets. For this reason, it is suitable to underline the role of MNC as big players in the complex relation-ship between internationalization and com-petitiveness. The activities of such large com-panies have even led the trade specialization in technology-intensive industries although not always found a perfect match with the techno-logical specialization of the developing economies. For instance, the upgrading capa-bilities of Malaysia and Thailand as active ex-porters of electronics have driven and have been driven by the development of technologi-cal capabilities in these two MIC where FDI has evolved from the expansion into produc-tion operations to the process technology de-velopment (Rasiah, 2003). Hence, it is quite possible to ascertain that comparatives advan-tages are linked to the capabilities of technol-ogy deepening even in contexts of multiple specialization patterns, if the efforts would be concentrated in upgrading the possibilities for the development of technology-intensive ac-tivities (Rodrick, 1996). Nevertheless, in absence of a free lunch, tech-nology transfer entails costs for both the pro-vider and the recipient units (Teece, 1977), reason why this process would require a cer-tain degree of technology know-how on the part of the receiving firms. The appropriate election of techniques in favor of competitive-ness improvements and innovations are not in a vacuum but they are all part of a continuous technological effort that would enhance risks’ assumption in a context of imperfect informa-tion (Lall and Teubal, 1998). In addition, the attractiveness of countries are not only defined by the comparative advantages but also by the absolute advantages in production and trade (Dosi et al, 1990); specifically, the level of infrastructures, labor training and discipline and a risk-free environment are important determinants of attraction for the components outsourcing of FDI that is mostly entailing intra-firm trade (Katseli, 1997). Consequently, competitiveness seems to be not only deter-mined by the relative prices and productivity levels of production factors but also by the ability of countries to integrate themselves rightly in the global value chain; in other words, to gain access and to use effectively a range of products and services related to the
activities of MNC, that is, modern ITC ser-vices, managerial and accounting methods, banking services, etc (Aharoni and Hirsch, 1997; Rugman and Doh, 2008). A common conclusion merging from the findings of both the economics and the international business perspectives is that although the strategic be-havior of large multinational corporations may generate positive effects in development, this statement should be rejected as a panacea. On the other hand, being aware that MNC are able to provide new production facilities, managerial practices and also technology transfer to host locations, from the outward perspective there can also be some implica-tions from investing abroad; for example, the existence of reverse flows from the host economies to foreign subsidiaries since firms’ strategies look to tap into new knowledge in host locations as well (Cantwell, 1989; 1995; 2005; Frost, 2001; Piscitello, 2004; McCann and Mudambi, 2005; Singh, 2007; Mudambi, 2008). Specifically, in a recent contribution based on the analysis of patent citation data, Singh (2007) demonstrates the existence of significant outflows back from the host coun-try to foreign MNC. This result would give support to moderate the existing fears about the extent of the knowledge leakage that spill-over effects generate abroad; on the contrary, MNC abroad have the potential for the absorp-tion of new knowledge even in less advanced countries. The consideration of these two di-rections is adequate for the approach adopted in this paper, being possible to highlight the possibilities that national systems of innova-tion in host economies provide for a better understanding of the nation-specific system-atic differences between innovation practices and its connections with competitiveness. The national system of innovation’ concept has been often used in last decades by both schol-ars and policy makers, for international com-parisons between national styles of manage-ment and innovation (Freeman, 1987; Lund-vall, 1992; Nelson, 1993; Mowery and Oxley, 1995; Cantwell and Molero, 2003). In a broad sense, this would include in a unique analyti-cal framework the combination of more tradi-tional aspects of vertical linkages in the pro-duction systems –introducing learning by do-ing and learning by searching-, with some micro assumptions based on the chain-linked model of innovation (Kline and Rosenberg, 1986), the sources of innovation (Von Hippel, 1988) and the institutional dimension that
11
would enhance interactive learning (Lundvall, et al., 2002). The concept of national systems of innovation generally refers to the influence and evolution of the activities of production and the institutional setting, considering both informal institutions (such as trust) and for-mal arrangements (such as intellectual prop-erty rights or contract laws). The issue is that the shift toward a higher economic and politi-cal stability, as long as the countries improve their level of development and their growth opportunities, derives into a higher potential of markets’ dynamism. In this sense, it must be said that some of the middle-income econo-mies have committed important amount of resources and specific policies to activate their productive and education systems and have been successful to upgrade their national ca-pabilities becoming more attractive for foreign investors too (Mowery and Oxley, 1995; Hob-day, 1995). In this direction, it is pertinent to recall that the determinant factors for catching up are not only found among technology, FDI and trade openness but on the contrary, the success is dependent on other elements that are less considered in the economics analysis, such as the state of the institutions, the educa-tive system, the financial markets or the politi-cal system, that is to say, the elements of the innovation system in a given country (Fager-berg and Srholec, 2008). From the analysis of technological capabilities in the MIC, it has been confirmed elsewhere (Álvarez and Magaña, 2007) that one of the main outstanding features of this group of developing countries is its tremendous hetero-geneity. We find indeed that among the mid-dle-income economies, some of them have an important potential for catching-up in the economic globalization process while others are sharing a set of features that are more owned by the most laggard economies (Dur-lauf and Johnson, 1995; Alonso, 2007; Castel-lacci, 2008). The individual peculiarity is then an aspect of special relevance that would rein-force the need for carrying out specific analysis of competitiveness in developing countries. As a matter of fact, there are some examples of succeeding economies such as those strategies followed from the Asian economies that have shown a spectacular growth and although they have been very diverse, they have in common the role of the national systems of innovation supporting inward technology transfer (Mowery and Oxley, 1995). It is noticeable the efforts made by South Korea and Taiwan to try to nurture technological advanced domestic
firms in their industrialization process (Kim, 1997; Agosin and Machado, 2005). Singapore in the first phases of its takeoff began with some elementary actions addressed to enhance the absorption of universal technologies through the acquisition of capital equipment; then, the diffusion of embodied knowledge was prevailing since domestic firms in that country required that knowledge in order to be able to produce high-tech goods. MNC ac-count for a high proportion of exports, this as a consequence of the activities of foreign sub-sidiaries established in the country while local firms act as subcontractor of the large foreign companies. In the cases of Malaysia and Thai-land, these two countries have expanded their exports by combining low labor costs with enhanced skills that allowed them to export high-tech components. In some larger econo-mies such as India, they have adapted technol-ogy for local consumption to create local in-dustries and this has been able to take advan-tage of growing number of skills in computer programs. Likewise, governments may have an important role in the advance of many developing coun-tries as providers of many public goods, inter-vening in the definition of several policies (education, science and technology) that are crucial for the development process and as guarantors of the institutional stability condi-tions. Then, we find right policy interventions in many succeeding countries such as South-Korea, Singapore or Taiwan although it is not possible neither convenient to try to extract any common recipe among these experiences (Rodrick, 1999). Although openness may be positively associated to the development path of many countries, it is also quite certain that the combination of protective strategies with more outward oriented policies has suddenly coexist during some time periods in the ad-vancement of countries such as Japan or Ko-rea. Moreover, the spectacular growth and rapid industrialization process taken place in Korea is one of the paradigmatic cases where science and technology became key aspects and where government had a very clear or-chestrating role (Kim, 1997). Another issue where we find an important role for the definition of public policies is towards the promotion of both inward and outward FDI (seeking to engage in FDI), policies that at the end are undertaken by home and host economies in order to improve their competi-tiveness. Previous evidence about the effects of

12
foreign capital in the investment level of de-veloping countries for a long period of time (1971-2000) have confirmed that FDI has left domestic investment unchanged and only some crowding-out effects were found in the Latin American in some particular periods (Agosin and Machado, 2005). Then, taking into account that the aim of the developing countries is to try to maximize the creation of wealth within their borders by improving the share of world demand that is satisfied from their national territory, one possible way of achieving this can be obviously enhancing the expansion of firm-specific sectors to the great-est extent possible (Porter, 1990). This is clearly related to those policy interventions that have been defined to try to reinforce the clusters dynamics, being understood that ag-glomeration effects could contribute to the expansion of a core set of activities in ad-vanced industries that could maximize the externalities and welfare effects to the rest of the economies. This kind of strategies has also been in the base of many public policies of technological promotion while in many emerg-ing clusters foreign technologically active companies have been involved. Then, in a first view, MNC in public policies can be seen as a vehicle that provides incoming spillovers to host economies. In a second round where de-veloping economies move towards outflows FDI, they provide a more direct access to for-eign markets. However, at least in theory, the process of cumulative learning and know-how that is needed to get successful operations of MNC requires a long time period until a de-veloping country can create the conditions that will nurture the creation of home-based MNC as well. In fact, companies from some of the so-called emerging economies are chang-ing their international strategies and becoming more integrated in international flows and this could derive into competitive improvements for developing economies (Brouthers et al., 2005; Singh, 2007). Another implication that derive from this perspective is that MNC may constitute a highly efficient mechanism for creating firms-specific knowledge and transfer-ring this knowledge to the affiliates because large corporations are affecting the integration of dispersed and functionally separated mar-kets and operating activities, conceding an important space to reverse knowledge flows (Singh, 2007; Mudambi, 2008; Yang et al, 2008). This literature background comes to frame our questions about the peculiar competitive posi-
tion of the MIC and their technological advan-tages, being understood from the shift in their productive structure but also from their inte-gration in the international context as part of the global value chain that is a consequence of the MNC operations.
3. Hypothesis development and analytical model This study on competitiveness in MIC is built over a conceptual approach defined by the relationship between the integration in the international market of these economies, their level of development and technology. Particu-larly, we explore whether competitiveness shifts in countries can be associated and to what extent to a set of factors already identi-fied in the literature and that we group in two different but interrelated sides. On the one hand, there are internal factors or features of the national economies that obviously would contribute to define competitive advantages of industries and nations (à la Porter); from this point of view, the choice here is to focus on technology and innovation as the main key driving factors. On the other, the external in-fluence that a country receives in an increas-ingly internationalized environment, would allow us to detect some factors that are more closely linked to the integration of production and activities as a consequence of MNC opera-tions; the investment development path or IDP theory (à la Narula-Dunning) shows an exist-ing relationship between the advance of coun-tries in economic development, the reception of FDI and how it evolves through different stages of internationalization until it becomes an investor country abroad, in other words, becoming the home economy for MNC. Such a framework is delimitated by two main argu-ments: first, there is not a common pattern of evolution but on the contrary the path is quite unique for each country; and second, inward FDI does not necessarily guarantee growth in all the cases (Narula and Dunning, 2000; Na-rula and Dunning, forthcoming). Technical change and globalization have de-finitively contributed to redefine the notion of competitive advantages and also has been a helpful tool in the process of reshaping organ-izational forms inside MNC; for these reasons, it seems suitable to integrate FDI in the analy-sis of competitiveness in order to explore the factors affecting competitiveness in countries. The present understanding of MNC and their

13
effects in both host and home economies would require the consideration of the role of international networks and the implications associated to the more internationalized value chain (Kaplinsky, 2000). Particularly, two more updated visions of globalization allow us to embrace in a more real fashion the interplay between technology and competitiveness. Fur-thermore, it becomes crucial to take into ac-count that beyond company “replica” abroad, the internationalized organizations are increas-ingly defining the relationship between mother companies and affiliates in a more complex and interactive way, more closely inspired by the emergence of international network forms (Bartlett and Ghoshal, 1998). MNC are indeed becoming multi-centric firms exploiting the diversity of locations and behaving accordingly to the setting of a new geography of the value chain activities (Mudambi, 2008). This has important implications from the point of view of competitiveness since these organizational changes would permit the creation and enlargement of competitive advantages across borders: Subsidiaries could then adopt a key role in doing the exploitation of competencies from over the firm’ network but also trying to create entirely new competencies and taking advantage of the assets available at the diverse host countries (Rugman and Verbeke, 2001). On the other hand, international strategies of large MNC have also gone beyond the more traditional picture based on the seeking of markets or resources and it extended to effi-ciency and knowledge seeking types of deci-sions (Dunning, 2006). The relative impor-tance of each of them and the evolution of FDI flows interact with the stage of economic de-velopment of countries (Narula, 1996; 2004). Under the changing location patterns of the world economy, the search of new knowledge is understood at present as one of the more outstanding functions of FDI (Yang et al., 2008; Singh, 2007). Part of the justification of this point is found on the higher fragmenta-tion of production and how MNC in knowl-edge-intensive areas are even decentralizing core activities such as R&D and relocating increasingly the more standardized parts of their productive activities in emerging markets economies as well (Mudambi, 2008). The bulk of our analysis is to try to explore the competitiveness gains of countries in high- tech markets as a result of both internal factors (the level of technological skills) as well as to the external forces (inward and outward FDI).
We are voluntary not introducing here incom-ing trade flows as a main mechanism to under-stand competitiveness, assuming the important complementarities existing between both FDI and trade flows (Ozawa, 1992; Katseli; 1997). Although the relationship between the first set of factors and competitiveness could be seen in a more obvious and direct way, the second could be equally realistic from the point of view of present trends in the world economy. Particularly, it would mean that national economies have evolved until an advanced stage of the IDP that allow them to have the necessary entrepreneurship to be able to as-sume the risk to invest abroad and to begin doing business in other countries via FDI (Na-rula and Dunning, forthcoming). The com-plexity of globalised units and the importance of knowledge to compete invite to think that in the present context, it could be nicely as-sumed that outward FDI may adopt an impor-tant function of sourcing new knowledge from abroad and the possibilities for reverse knowl-edge to the home country finally ends for af-fecting competitiveness. Nonetheless, the measurement of this aspect in an accurate manner is not an easy task and it is still a topic under development. Our conceptual constructs can be followed according to the matrix represented in Figure 1 in which the relation between internal and external factors is shown. Technology absorp-tion (A) and creation (C) are seen as those functions that economies perform internally while inward (I) and outward (O) FDI will capture the external side of the mechanisms that would interact generating potential effects on competitiveness results. To some extent, the arrow would be representative in a very simplified manner of the more clear relation-ship that is postulated by the IDP proposition, this combined in both cases with the state of the national technological development. On the other hand, there are two hybrid positions that would combine the factors defining some kind of intermediate situations that developing economies could easily fit. Notwithstanding that the most developed and technological advanced economies in the world would likely shape the CO combination, the different de-velopment levels of the countries outside the world frontier would make differ the likeli-hood for shaping the alternatives in the two axis and hence the potential associated effects.

14
Figure 1. The construct on competitiveness: FDI and Technology
Source: Own elaboration As already said, the more common and out-standing relationships are those in the cells of the main diagonal (AI and CO). The “AI” situation combines the predominance of in-ward FDI and the absorption of technology. This could be representative of a FDI devel-opment assisted situation (Ozawa, 1992) more common in less developed economies where strategies oriented to adapt foreign technology to domestic market conditions would prevail. In this cell it is assumed that there could be still a low level of development and the lack of local entrepreneurial capabilities do not con-cede much space for positive externalities de-rived from the presence of foreign capital. In the opposite, the “CO” combination shows the complementary association between FDI out-ward and technology creation. This would be a typical economy in the world technological frontier or in terms of the IDP it would be a country that has transited from most of the development stages in such a framework and it is plausible to think that this situation would allow some degrees of exclusion with regard to less developed countries. The evidence con-firms that FDI has contributed to enhance the emergence of some developing countries with more sophisticated technologies but there are very few succeeding cases as licensors of tech-nology with an impact worldwide (Athreye and Cantwell, 2007; Singh, 2007). Nonethe-less, the shift in the FDI patterns shows the growth of outflows from the new industrial-ized Asian economies since the 1980s, prima-
rily from South Korea, Taiwan and China. This is also an aspect that can be considered in the explanation of the competitiveness shift in developing economies and it could enhance the catching up possibilities for those MIC that follow a positive evolutionary path. On the other hand, looking at the two situa-tions that would represent some kind of hy-brid possibilities, the cell called CI comes to reflect the indirect effects of the relationship between MNC and development that generally refers to spillover and technology transfer of foreign subsidiaries in location (Rugman and Doh, 2008). The possibility and size of these effects are irremediably linked to the domestic capabilities and its potential to benefit for the leakage of knowledge from foreign companies operating in the territory. In this sense, it can be expected that absorptive capacities in host economies would become crucial (Álvarez and Molero, 2005; Criscuolo and Narula, 2008; Narula and Dunning, forthcoming). For this reason, in more laggard countries the needed entrepreneurial and institutional capabilities would be missing to integrate this position while the higher relative advance of the MIC makes more likely to be placed on it. It must be said that the AO cell is rather representative of those economies that jump into the interna-tional markets via outward FDI although they still present an important technology gap.

15
In order to make operational this construct we proceed in two ways: on the one hand, through the use of different sources of infor-mation we will try to make a diagnosis of the competitiveness in the MIC and the relation-ship with both their national technology and the external enhancer factors (in section 4). On the other hand, we will make use of a set of indicators by countries that will make op-erational the previous proposition and they will be taken as variables and introduce in the empirical model to try to explain the competi-tiveness of the MIC (in section 5). The relative importance of high-tech products in the manu-facture exports of countries will be taken as the dependent variable and will be regress against a set of factors that would fit our con-ceptual approach. Particularly, we will con-sider indicators for FDI flows (external fac-tors) in both directions, inward and outward, as well as the level of openness of the coun-tries as a control aspect. We will combine them with other variables that relates to the technological capabilities of countries (internal factors) -specifically, the absorption capacities measured through R&D-, to the acquisition and international diffusion of technology and to the technology creation -measured through patents-.
4. Measuring competitiveness 4.1. THE GLOBAL COMPETITIVENESS
INDEX The Global Competitiveness Index (GCI) is elaborated under the auspices of the World Economic Forum (WEF) that has been pub-lishing since 1979 the Global Competitiveness Report, where the potential for productivity growth in countries is analyzed and shown. A special element of these Reports is the coun-tries’ ranking that provides policy makers with systematic and comparable information about national economies in order to make public
policy more efficient (Schwab, 2008). Then, this competitiveness Index1 constitutes a tool for benchmarking country strengths and weak-nesses and since 2004 it includes both the macroeconomic and microeconomic factors that affect competitiveness (Porter et al., 2008). A definition of competitiveness that a definition of competitiveness that is being as-similated in this method of benchmarking competitiveness is the one provided by Sala-I-Martin et al., (2008) who defines it as “the set of institutions, policies, and factors that de-termine the level of productivity of a country”. The implication of this broad definition is the derived complexity to measure competitive-ness; it would require taking into account dif-ferent factors at each level of aggregation while conceptually and methodologically the global index is conceived over two axis: microeco-nomic competitiveness and macroeconomic competitiveness (Porter et al., 2008). The Index is built over 12 different compo-nents related to the aspects that would define the competitiveness levels in countries. The components, called pillars from right now, are grouped into 3 subindexes corresponding to 1)Basic requirements, 2) Efficiency enhancers and 3) Innovation and sophistication factors that allow us to know the ranking position of countries in terms of competitiveness depend-ing on their stage of development2. The GCI index is calculated for 134 countries –see Ta-
1 The GCI as we know it at present days has been modified with the pass of the years. In the Report published in 2000, two indexes were built namely the Growth Competitiveness Index and the Business Competitiveness Index (BCI), these created by Jeffrey Sachs and Michael Porter, respectively. In 2004, Xavier Sala-I-Martin created the present Global Competitiveness Index (GCI) and this year, 2009, the WEF is preparing a New Global Competitiveness Index (NGCI) that tries to become an im-proved version of the GCI and the BCI (Porter et al., 2008). The NGCI will incorporate, most of the variables that the GCI is integrating now but it will try to be a more robust model that will focus on the level of productivity of the countries in a more accurate manner, aspect that is clearly related to competitive-ness. 2 See Table A.1 in Appendix.

16
ble A.2 in the Appendix corresponding to 2008, last edition of the GCI (Porter and Schwab, 2008). As it can be expected, the more developed countries achieve the best general scores being indisputable the positive relationship that exist between GDP per capita and competitiveness. Nonetheless, as we will see later, there are some countries belonging to the middle-income countries that behave par-ticularly well in some of the components or determinant factors of competitiveness, adopt-ing themselves better positions than some high-income economies. At least partially, this can be due to the fact that competitiveness is based in elements different than the obvious relationship between income and openness level, requiring the introduction of other con-textual factors that relate science, technology and the institutional environment of countries (Rodrick, 1999; Fagerberg and Srholec, 2008). Looking to the GCI scores, Table 1 shows the top ten countries in the world and the top ten positions achieved by middle-income coun-tries in this index. The top ten places are oc-cupied for high income countries, some of them are European such as Switzerland and the Netherlands, while other are American countries -obviously United States and Can-ada- and the rest are Asian economies, particu-larly Singapore and Japan. Regarding the MIC, the better positions occupied by these econo-mies in the world ranking range from the places 21st to 51st –out of 134 countries-. The first country of the group is Malaysia (21st), followed by Chile (28th) and the next is China (30th). As a matter of fact, the two first are above countries such as Ireland (place 22nd) or Spain (place 29th) while some middle-income economies such as China, Thailand or Tunisia rank in better positions than i.e. Portugal and Italy. This would come to show the possibility of some developing economies -not integrating the high income group- that are revealing some sort of opportunities in terms of better competitiveness results although they do not belong to the richest and most developed club of countries. On the other hand, at the end of Table 1 we can also see that in terms of global competitiveness, the larger and more active economies among the MIC such as India (50th) and the Russian Federation (51st) are not yet performing very well in terms of competitive-ness. Then, this diverse competitive behavior among the MIC would justify the interest to carrying out a detailed analysis about the fac-tors that would be behind the countries per-formance.
Table 1. Best ranked countries in the Global Competitiveness Index (GCI)
All Countries
Rank
Middle-Income
Countries
Rank
United States 1 Malaysia 21
Switzerland 2 Chile 28 Denmark 3 China 30 Sweden 4 Thailand 34
Singapore 5 Tunisia 36 Finland 6 Lithuania 44
Germany 7 South Africa 45 Netherlands 8 Jordan 48
Japan 9 India 50
Canada 10 Russian Federation 51
Source: Porter and Schwab (2008) According to the GCI methodology, there are three stages of advance in terms of competi-tiveness that are defined by the different pillars integrating each stage: (1) the factor driven stage; (2) the efficiency driven stage; and (3) the innovation driven stage. Then, we proceed building the Figure 2 in which each MIC country is placed in its corresponding stage. Reinforcing our previous argument, we can observe that MIC do not follow a common pattern but on the contrary, they split among the several stages: First, some of them are in the factor driven stage where the countries depend crucially on their endowments -the subindex is built over basic requirements in-cluding pillars 1 to 4 that correspond to fea-tures of some basic conditions of development; in this stage, most of the countries found are low-middle income economies. Secondly, in the efficiency driven stage countries compete on quality and their production processes are improved; the subindex of this stage is effi-ciency enhancers and contains pillars 5 to 10, those related to aspects such as labor and fi-nancial markets, higher education and training and even technological readiness. As it is shown in Figure 2, MIC are mainly oriented by this efficiency driven motivation since most of the countries in the group are placed in this stage. The third stage is, we can say, the more sophisticated since it is innovation driven, an stage where countries must try to replace technology imitation strategies and they should definitively embark on innovation; this would include pillars 11 and 12 that precisely refers to innovation and business sophistica-

17
tion (Sala-I-Martin et al., 2008). It should be noted that any of the MIC are found yet in that stage.
Nevertheless, some changes are observed re-garding the position of the middle-income economies: in the first transitional arrow a set of MIC are included and although they do not share an indisputable profile, it is noticeable the inclusion among them of economies such as China and Jordan, that have shown a dy-namic behavior recently and they are moving toward a more efficient driven competitiveness (Figure 2). Moreover, the second arrow would represent the upgrading of countries toward a more complex level of competitiveness, namely innovation driven. A set of MIC is also in this arrow that would reflect a higher level of sophistication; although, they are less nu-merous that those integrated in the first transi-tional phase. Particularly, we could note that most of them are European middle-income countries such as Poland and the Russian Fed-eration, as well as the dynamic Chilean econ-omy can be found there. In sum, most of the MIC (44%) are in the efficiency driven stage, 25% of them are in factor driven stage and anyone is in the innovation driven level. How-ever, there is still 20% of the MIC that are in the transitional phase from factor-driven to efficiency-driven stages being still a clear mi-nority, only 11% of them are moving toward a
transition from efficiency driven stage to inno-vation driven stage.
4.2. THE ROLE OF TECHNOLOGY AND INNOVATION IN COMPETITIVENESS
There are two pillars among the 12 compo-nents that integrate the GCI that are particu-larly interesting according to the purposes of our analysis: We will look to the position of the MIC in the “technological readiness” (TR) and the “innovation” (I) pillars. The TR pillar has a weight of 17% in the efficiency subindex while the pillar I represents 50% in the innovation and sophistication subindex. The technological readiness pillar is a meas-urement of the capacity and the speed for the absorption and adoption of knowledge and technology as well as the access to ICT in the country. The variables that integrate this pillar are defined in Table 2; the first four variables are coming from surveys while the last four correspond to hard data from national statis-tics –precise details about their measurement can be found in Table A3 and Table A4 in the Appendix. Among the eight components, some of them are particularly related to the availabil-ity of new technologies in the country (vari-able num. 1), to the abilities of firms for the absorption of technology (variable num. 2)
Figure 2. Stages of development, factors of competitiveness and middle income countries
Source: Own elaboration with information proceeding from Sala-I-Martin et al. (2008)

18
and to the possibilities for technology transfer that inward FDI generates (variable num. 4). On the other hand, this is a pillar that con-cedes an important role to the ICT in countries since the other five components relate to the regulation and use of ICT (variables num. 3, 5, 6, 7 and 8). Table 2. The components of the Techno-logical Readiness pillar and the Innova-
tion pillar
Technological Readi-ness pillar
Innovation pillar
1. Availability of latest technologies
1. Capacity for inno-vation
2. Firm-level technol-ogy absorption
2. Quality of scientific research institutions (university laborato-ries, government laboratories)
3. Laws relating to ICT (electronic commerce, digital signatures)
3. Company spending on R&D
4. FDI and technology transfer
4. University-industry research collaboration
5. Mobile telephone subscribers
5. Government pro-curement of advance technology products
6. Internet users 6. Availability of sci-entists and engineers
7. Personal computers
7. Utility patents
8. Broadband Internet subscribers
Source: Porter and Schwab (2008) Regarding the Innovation pillar, it measures the countries’ skills to introduce new or im-proved products and processes into the mar-ket. The components of this pillar are also shown in Table 2; in this case, most of the variables come from surveys but the last one that comes from the national statistics. Among the seven components integrated in the pillar, some of them are directed related to the capac-ity of innovation and whether the companies are more or less dependent on external sources or they perform their own R&D (variables num. 1 and 3) as well as to the ability of tech-nology creation in the country, approached by the patents utility (variable num. 7). On the other hand, there is a component related to human scientific and technological resources (variable num. 6) and three of them related to the institutional framework of the national systems of innovation (variables num. 2, 4 and 5).
Some high-income countries, according to the World Bank classification, range in the top ten places of the technological readiness pillar as it can be seen in Table 3. Some European coun-tries such as The Netherlands, Sweden, Den-mark, Norway, Switzerland, Iceland and the United Kingdom occupy the first positions, although there are others outside Europe such as Canada and the Asian Singapore and Hong-Kong as well. The ranking from the Innovation pillar (Table 3) shows the predominance of high-income countries as well. However, Ko-rean Republic and Taiwan rank among the top ten positions; the first one is considered a low-income country and the second one is not treated separately from China in the World Bank classification.
Table 3. Top-10 world places in the technological readiness and innovation
pillars
Technological Readiness Innovation
Country Rank Country Rank Netherlands 1 United
States 1
Sweden 2 Finland 2 Denmark 3 Switzerland 3 Norway 4 Japan 4 Switzerland 5 Sweden 5 Iceland 6 Israel 6 Singapore 7 Taiwan,
China 7
United Kingdom
8 Germany 8
Canada 9 Korea, Rep. 9 Hong Kong 10 Denmark 10
Source: WEF 2008: Global Competitiveness Report 2008. Before analyzing the MIC countries perfor-mance in these two pillars, it seems necessary to make some calculations for a better under-standing of their world rank positions and scores in terms of competitiveness. For this purpose, some descriptive statistics for the Global Competitiveness Index and its compo-nents are shown in Table 4. Focusing on the role of the technology and innovation in com-petitiveness, we can observed that the general average score obtained for the 134 studied countries in the Technological Readiness pillar is 3.62, while the values obtained for the top ten places range from 6.1 to 5.6, which are above the total average. Regarding the Innova-tion pillar, the total average score is 3.38 and the score obtained by the top ten places varies from 5.84 to 5.09.

19
Regarding the middle-income countries per-formance, Table 5 shows the top ten and the last ten places in the Technological Readiness and Innovation pillars rankings for the MIC. Looking to the different positions in the for-mer pillar, we can note that China is the first MIC in the ranking, obtaining the 33rd place.
The top ten middle-income countries are be-tween the 33rd and the 48th places, while the score of these countries varies from 4.48 to 3.7, values that also are found above the total average (3.62). Turning now to the last ten places occupied by middle income countries, we can note that Bolivia and Colombia are in
Table 4. Basic descriptive for competitiveness indexes and components
Average St Dev Max Min Median Global Competitiveness 4,20 0,67 5,74 2,85 4,11
Basic requirements 4,52 0,82 6,18 2,96 4,42 Efficiency enhancers 4,06 0,72 5,81 2,69 4,02
Business sophistication & innovation 3,77 0,77 5,80 2,70 3,65
Technological readiness 3,62 1,09 6,01 2,06 3,35 Innovation 3,38 0,84 5,84 2,06 3,15
Availability of latest technologies 4,65 1,02 6,70 2,70 4,60 Firm-level technology absorption 4,79 0,79 6,60 3,00 4,70
FDI & technology transfer 4,81 0,62 6,40 3,30 4,90 Utility patents 19,58 50,04 270.4 0 0,20
Company spending on R&D 3,36 0,94 6 2,1 3,00 Capacity for innovation 3,35 0,94 6 2 3,1
Availability of scientists and engineers 4,18 0,80 5,9 2,2 4,20
Source: own elaboration with information of WEF 2008: Global Competitiveness Report 2008.
Table 5. Top ten and last ten places of the MIC in Technological Readiness and Innovation
Technological Readiness Innovation
Top Ten Last Ten Top Ten Last Ten Country Rank Country Rank Country Rank Country Rank
China 33 Bosnia and Herzegovina
109 Malaysia 22 El Salvador 118
Malaysia 34 Cameroon 110 China 25 Guyana 124 Chile 35 Armenia 112 Tunisia 27 Nicaragua 127
Lithuania 38 Algeria 114 India 32 Bosnia and Herze-govina
128
Latvia 41 Timor-Leste 118 Sri Lanka 36 Ecuador 129
Costa Rica 42 Paraguay 119 South Africa
37 Colombia 130
Montenegro 43 Nicaragua 122 Azerbaijan 40 Timor-Leste 131 Jamaica 45 Lesotho 125 Chile 41 Albania 132 Poland 46 Bolivia 133 Brazil 43 Bolivia 133
Romania 48 Colombia 134 Indonesia 47 Paraguay 134
Source: WEF 2008: Global Competitiveness Report 2008.

20
the very last places of the world ranking, oc-cupying the 133rd and 134th places respectively; the rest of the MIC that occupy the latest posi-tions range from 109 to 125. The score ob-tained for these countries varies from 2.61 to 2.06, more than 1 point below the global aver-age for the 134 studied countries. In terms of the Innovation pillar, we can note that the MIC economies range from 22nd to 47th places with scores that vary from 4.28 to 3.42, values that again are above the total average. It is noteworthy that Brazil, India and China, are among the first ten middle-income countries in the ranking; these three countries are part of the BRIC and they have important notation in the world because of the large size of both their territory and population that derive into the importance of their internal markets. However, far from generalizations, Russian Federation, the other integrant of the BRIC, is in the 48th place, after Indonesia. Other coun-tries that are also well positioned in this pillar are Tunisia, South Africa and Chile. Analyzing the last positions in the ranking, we can note that the last ten middle income countries oc-cupy the spaces 118 to 134 with scores from 2.56 to 2.06, both of them far below the total average (3.38). It is noticeable that the last 8 places in the ranking are occupied by some MIC, mainly from Latin American and the European regions.
Deeping now in the particular components that are more closely related to the two pillars considered, a selection of them could provide us with a more detailed view of the abilities in technology and innovation of the MIC. In Ta-ble 6 we can see the countries that achieved the best positions in a selection of components in the Technological readiness pillar and all of them achieved values above the world average. Malaysia, Chile, Tunisia and India appear in the top ten MIC in the whole selection of components; while South Africa, Jordan and Turkey appear in three of them. Is noticeable the difference in rank of the component FDI and technology transfer, it goes from 6 to 31 while the others range from 19 to 50; in other words, MICs are very well positioned in the FDI component; for example: Malaysia and Costa Rica are among the top ten countries of the world in this component, in the 6th and 8th places respectively, with values in their scores notably over the world average and the median and closer to the max value –Table 4.
Table 6. Best scored MIC in some components of Technological Readiness pillar
Firm-level technology absorption
Availability of latest technologies
FDI and technology transfer
Country Rank Score Country Rank Score Country Rank Score
Malaysia 21 5,6 Malaysia 29 5,6 Malaysia 6 5,8 India 26 5,5 Jordan 31 5,6 Costa Rica 8 5,7 South Africa 32 5,5 Tunisia 36 5,4 Serbia 14 5,5
Chile 33 5,4 South Africa 37 5,4 Panama 19 5,4 Tunisia 34 5,4 Chile 42 5,2 India 20 5,4 Jordan 35 5,4 India 43 5,2 Indonesia 24 5,3 Brazil 42 5,3 Jamaica 44 5,2 Tunisia 27 5,3
Sri Lanka 45 5,2 Turkey 45 5,1 Honduras 29 5,3 China 46 5,1 Mauritius 47 5,1 Guatemala 30 5,3 Turkey 48 5,1 Thailand 50 5,1 Chile 31 5,3
Source: WEF 2008: Global Competitiveness Report 2008.

21
With respect to the pillar of Innovation, in Table 7 we can see that Malaysia is the country that appears in the whole selected compo-nents, even is the first country in three of them and it is in 3rd place in the other one. Several countries appear in three of the selected com-ponents, such as South Africa, India, Tunisia, Croatia and Sri Lanka, being noticeable that the 3rd and 10th places were obtained by India and Tunisia in the Availability of scientists and engineers component. In these four compo-nents, the values that obtained the MIC shown in the Table are above the general world aver-age as well as the median of the distribution. The exception would correspond to the vari-able of utility patents that is the indicator with the higher dispersion and where the MIC show values much lower than the world average although above the median.
There are at least two main results that could be underlined here in relation to our concep-tual approach. On the one hand, the results that in the component of FDI and technology transfer inside the technological readiness pillar have been achieved by the MIC, being especially relevant the differences intra-group and also in comparison with other countries in the world classification. It is also noticeable because the MIC group improves notably in this one regarding other components of the technology and innovation pillars. Malaysia occupies the 6th position in the world ranking and India is in the 20th while in terms of global competitiveness the position of the latter is
50th. Moreover, it must be noted that five out of the top ten MIC are lower-middle income countries. On the other hand, differences across coun-tries seem to be more pronounced in this FDI component since the MIC economies with the worst score are certainly at the very end of the world ranking. Graph 1 shows the positive relationship existing for the MIC between their global competitive position and their behavior in FDI and technology transfer, being notable the better behavior is shown by a set of coun-tries integrated by Malaysia, Chile, South Af-rica, China and India among the MIC. Their high positions in the ranking as well as in the relationship of the variables previously de-scribed justified a more detailed analysis that we will develop in the next section.
Graph 1. Global competitiveness, FDI and technology transfer in the MIC, 2008
Source: own elaboration with information of WEF 2008, Global Competitiveness Report 2008.
Table 7. Best classified MIC in a selection of components in the Innovation pillar
Utility patents Company spending on R&D Capacity for innovation Availability of scientists
and engineers
Country Rank Score Country Rank Score Country Rank Score Country Rank Score
Malaysia 29 6 Malaysia 18 4,6 Malaysia 21 4,3 India 3 5,7
Croatia 35 3,3 China 24 4,2 China 25 4,2 Tunisia 10 5,5 South Africa 39 1,7 South Africa 28 4 Brazil 27 4 Malaysia 24 5
Chile 40 1,5 India 29 3,9 Ukraine 31 3,8 Azerbaijan 28 4,9 Russian
F. 41 1,3 Costa Rica 30 3,9 Sri Lanka 34 3,8 Sri Lanka 30 4,9
Lithuania 43 1,2 Brazil 31 3,9 India 35 3,8 Indonesia 31 4,9
Georgia 44 1,1 Sri Lanka 32 3,9 South Af-rica 36 3,8 Russian
F. 34 4,8
Argentina 45 0,9 Indonesia 34 3,8 Tunisia 38 3,7 Chile 35 4,7
Uruguay 47 0,9 Tunisia 38 3,7 Azerbaijan 39 3,7 Jordan 39 4,6
Poland 48 0,8 Croatia 45 3,5 Croatia 42 3,5 Algeria 41 4,6
Source: WEF 2008: Global Competitiveness Report 2008.
22
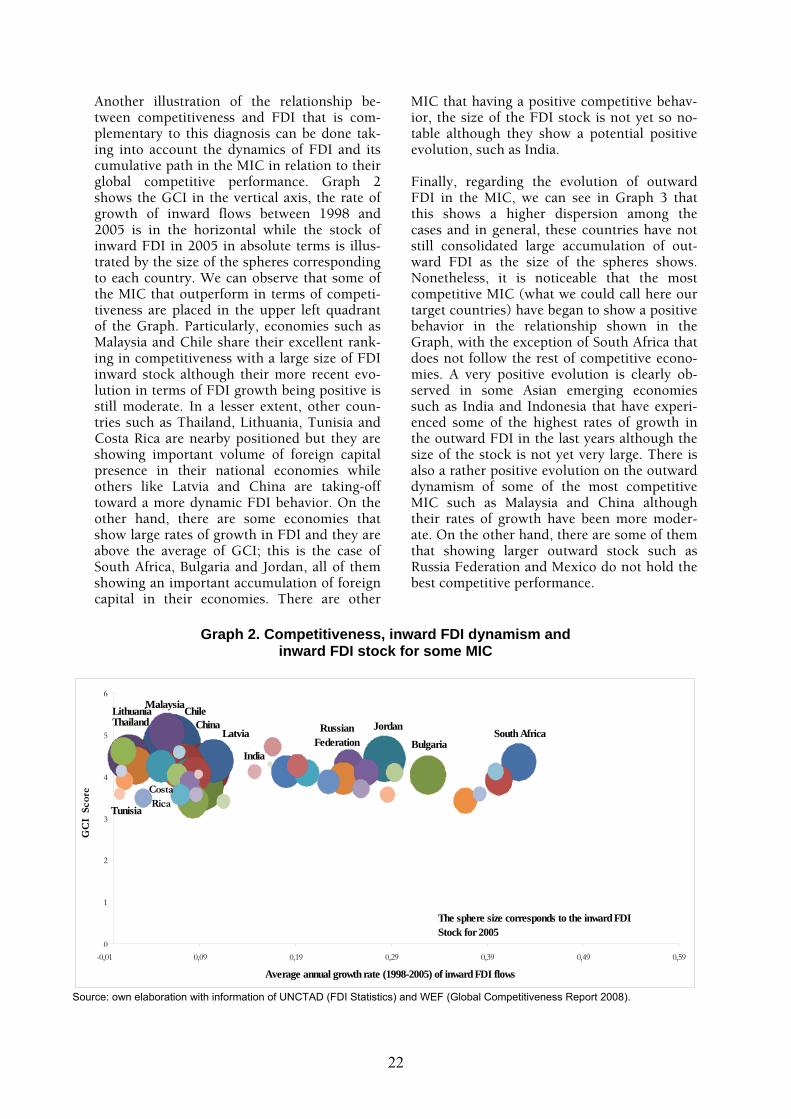
Another illustration of the relationship be-tween competitiveness and FDI that is com-plementary to this diagnosis can be done tak-ing into account the dynamics of FDI and its cumulative path in the MIC in relation to their global competitive performance. Graph 2 shows the GCI in the vertical axis, the rate of growth of inward flows between 1998 and 2005 is in the horizontal while the stock of inward FDI in 2005 in absolute terms is illus-trated by the size of the spheres corresponding to each country. We can observe that some of the MIC that outperform in terms of competi-tiveness are placed in the upper left quadrant of the Graph. Particularly, economies such as Malaysia and Chile share their excellent rank-ing in competitiveness with a large size of FDI inward stock although their more recent evo-lution in terms of FDI growth being positive is still moderate. In a lesser extent, other coun-tries such as Thailand, Lithuania, Tunisia and Costa Rica are nearby positioned but they are showing important volume of foreign capital presence in their national economies while others like Latvia and China are taking-off toward a more dynamic FDI behavior. On the other hand, there are some economies that show large rates of growth in FDI and they are above the average of GCI; this is the case of South Africa, Bulgaria and Jordan, all of them showing an important accumulation of foreign capital in their economies. There are other
MIC that having a positive competitive behav-ior, the size of the FDI stock is not yet so no-table although they show a potential positive evolution, such as India. Finally, regarding the evolution of outward FDI in the MIC, we can see in Graph 3 that this shows a higher dispersion among the cases and in general, these countries have not still consolidated large accumulation of out-ward FDI as the size of the spheres shows. Nonetheless, it is noticeable that the most competitive MIC (what we could call here our target countries) have began to show a positive behavior in the relationship shown in the Graph, with the exception of South Africa that does not follow the rest of competitive econo-mies. A very positive evolution is clearly ob-served in some Asian emerging economies such as India and Indonesia that have experi-enced some of the highest rates of growth in the outward FDI in the last years although the size of the stock is not yet very large. There is also a rather positive evolution on the outward dynamism of some of the most competitive MIC such as Malaysia and China although their rates of growth have been more moder-ate. On the other hand, there are some of them that showing larger outward stock such as Russia Federation and Mexico do not hold the best competitive performance.
Graph 2. Competitiveness, inward FDI dynamism and inward FDI stock for some MIC
0
1
2
3
4
5
6
-0,01 0,09 0,19 0,29 0,39 0,49 0,59
Average annual growth rate (1998-2005) of inward FDI flows
GC
I S
core
The sphere size corresponds to the inward FDI Stock for 2005
South Africa
India
ChileMalaysiaThailand
Tunisia
ChinaLatvia
LithuaniaJordan
Bulgaria
CostaRica
RussianFederation
Source: own elaboration with information of UNCTAD (FDI Statistics) and WEF (Global Competitiveness Report 2008).

23
Box: Features and strategies of FDI in some competitive MIC Chile The Chilean government has implemented a program oriented to augment FDI and attract it in sectors different from mining since this sector suffered a fall in 1999, along with the mergers and acquisitions in the services sector, after a bonanza period. This program has been focused on high technology, mainly in the sectors of ICT, electronics, new materials and biotechnology. Several incentives were offered with the goal of strengthen Chile´s position in the high technology interna-tional production networks (UNCTAD, 2008a y 2008b). In 2003, Chile tried to attract FDI pro-moting the country as the center of operations of the foreign companies with presence in Latin America, so the government offered tax exemptions and other incentives to the companies that selected the country as the hub of their operations (UNCTAD, 2008b). Regarding outward, in 2002, Chile invested mostly in the United States, Mexico and Ecuador; in 2000 had 14 foreign affiliates in the United States while in relation to inward investments, the US had in that year 197 foreign affiliates in Chile, Germany had 95 and Republic of Korea had 20. Almost 99% of the FDI in Chile comes from developed countries (UNCTAD, 2008b). By indus-tries, it is noticeable that 58% of these flows are invested in the primary sector, 35% in the tertiary sector and the remaining 6% in the secondary sector. South Africa The government has implemented several policies aimed to attract foreign investment, leaving behind the protectionist policies that predominated in the past; moreover, it has been created a specific agency focused on the promotion of the FDI, named Trade and Investment of South Africa (UNCTAD, 2008b). This country has signed agreements with several countries that exempt them from paying taxes twice, so that if a foreign investor has a permanent organization, this will pay taxes exclusively in South Africa. In 2004, South Africa invested abroad mostly in Germany and the United States and these investments represented more than 95% of the total; besides, this coun-try had 89 foreign affiliates in Sweden in the same year. On the other hand, in 2003, Germany had 227 foreign affiliates in the country and the United States had 206. It is noticeable that almost 98% of the inward FDI in this country came from developed countries. Regarding the industries, there was an even distribution of the foreign affiliates between the three large sectors in 2004, 32% of the FDI stock in the country was concentrated in the primary sector, 31% of this stock was in the sec-ondary sector and the remaining 37% was in the tertiary sector.
Graph 3. Competitiveness, outward FDI dynamism and outward FDI stock for some MIC
0
1
2
3
4
5
6
0 0,2 0,4 0,6 0,8 1
Average annual growth rate (1998-2005) of outward FDI flows
GC
I S
core
India
Indonesia
TunisiaThailand
MalaysiaChile Russian
F dChina
MexicoColombiaTurke
Venezuela
The sphere size corresponds to the outward FDI Stock for 2005
Source: own elaboration with information of UNCTAD (FDI Statistics) and WEF (Global Competitiveness Report 2008).

24
Tunisia The Tunisia government has tried to promote the country as a good place for foreign investors to set factories in order to serve the European markets, offering several incentives for FDI oriented to export (income tax exemption for several years). The government also promotes investment in industry, tourism and services, which get the same tax advantages plus aids in the cost of the pro-ject, some expenses and contributions to social security. Moreover, Tunisia has 2 free zones, which is an extra incentive for countries to invest there (UNCTAD, 2008b). Although oil is one of the main attractive of the country for the FDI, starting in 1998, the manufactures sector has receipt most of this investment; the most benefited sectors are cement, textiles, electronics, pharmaceuti-cal, among others. European countries are the ones that invest the most in Tunisia, such as France, the UK and Germany. Almost 99% of the outward FDI goes to developed countries: in 2004 Tuni-sia invested mostly in Germany and the United Sates and there were 18 foreign affiliates in Ger-many and 11 in the United States. On the other hand, it is noticeable that almost 10% of the FDI in the same year were coming from developing countries. United States had 606 foreign affiliates in Tunisia in 2003. Regarding to the inward FDI flows by industries, 42% of the flows went to the primary sector and 38% to the secondary sector, leaving only a 3% to the tertiary sector. Sources of information: UNCTAD (2008a) Latin America and the Caribbean 2004. http://www.unctad.org/en/docs/iteiit20044_en.pdf UNCTAD (2008b) FDI Country profiles: http://www.unctad.org/Templates/Page.asp?intItemID=3198&lang=1 UNCTAD (2008c) United Nations conference on trade and development. http://www.unctad.org/sections/dite_fdistat/docs/wid_ib_cl_en.pdf 4.3. THE ROLE OF FOREIGN OWNED COM-PANIES IN THE COMPETITIVENESS OF THE MIC As we have seen in previous sections, there is a subset of MIC that behaves differently and much better in terms of competitiveness than the rest of its group. Particularly, looking at the results on Tables 6 and 7, we could see that Malaysia is a country with an excellent performance among the middle-income coun-tries; it appears in the first top positions in all of the selected components of both techno-logical readiness and innovation pillars (it is the first country in six out of the seven com-ponents of our selection). Furthermore, India, and Tunisia are well positioned in six of them, while Chile and South Africa are in five and China is in the top positions in three of the selected seven components. Then, our choice here is to take a more closed look to this set of MIC in order to observe in more detail the features of their good competitive performance according to their firms’ characteristics3. For such a purpose, we turn now to another data source that allow us to explore the national features from a point of view related to the firms abilities, the Enterprise Surveys elabo-rated by the World Bank Group, in order to explore the relative importance of the enter-prise structure in the MIC that have shown a comparative better behavior in competitive-
3 The countries selected have been Chile, China, India, Malaysia and South Africa. Tunisia has not been included due to unavail-ability of statistic information.
ness. Data from this source are available on more than 90,000 firms in 111 countries, cov-ering business perceptions and dozens of indi-cators on the quality of the business environ-ment. The Enterprise Surveys capture business perceptions on the biggest obstacles to enter-prise growth, the relative importance of vari-ous constraints to increasing employment and productivity and the effects of a country’s business environment on its international competitiveness.
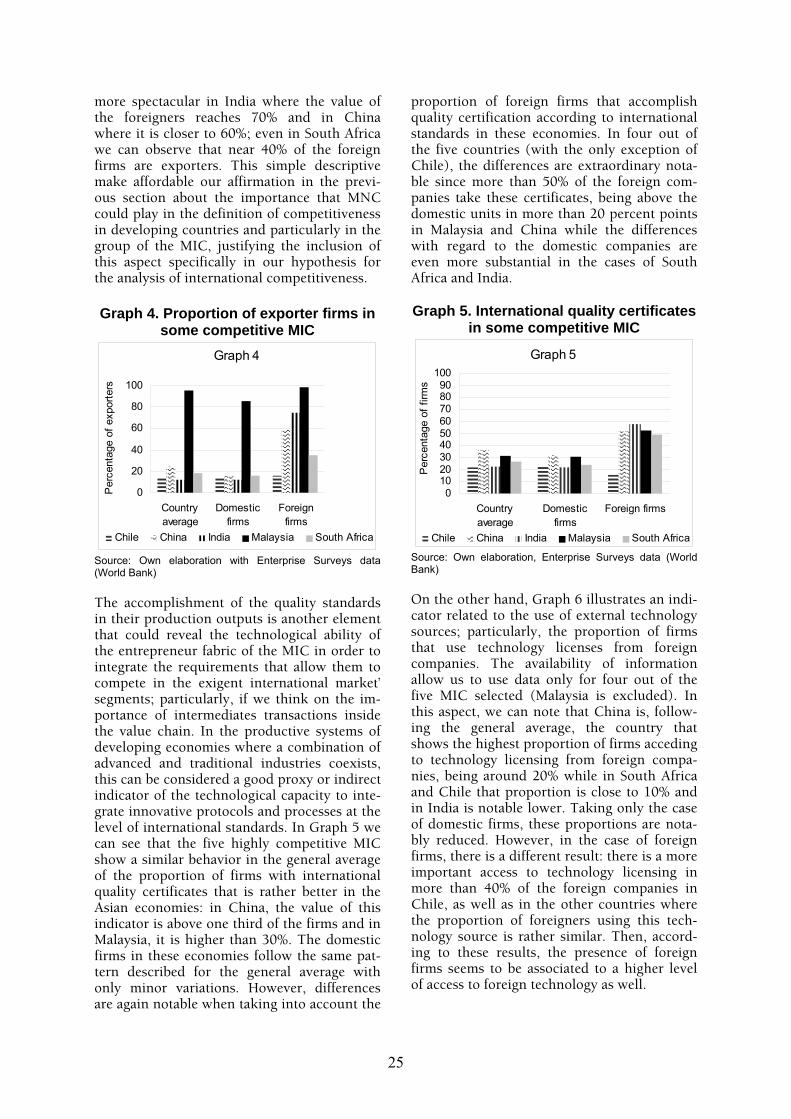
As it is illustrated in the Graph 4, the best po-sition that Malaysia obtained in terms of com-petitiveness as it seen in the previous section, seems to be clearly associated with a notable best export performance of their firms in com-parison to the other more competitive MIC that are included in our selection of best rank-ers. Taking the general average, more than 90% of Malaysian firms are exporters while this proportion is under 30% in China and even under 20% in South Africa, being closer to 10% in Chile and India. These values are lower when considering only the domestic firms of these countries. In contrast, this pat-tern is notably different when we look at the foreign firms, with the exception of Chile where the proportion of exporters among for-eign firms is only slightly better than for the average of the country. It is extremely high the value in the case of the Malayan economy where the proportion of exporter firms is near 100% for the foreign companies. The differ-ences regarding the domestic owned firms are
25
more spectacular in India where the value of the foreigners reaches 70% and in China where it is closer to 60%; even in South Africa we can observe that near 40% of the foreign firms are exporters. This simple descriptive make affordable our affirmation in the previ-ous section about the importance that MNC could play in the definition of competitiveness in developing countries and particularly in the group of the MIC, justifying the inclusion of this aspect specifically in our hypothesis for the analysis of international competitiveness.
Graph 4. Proportion of exporter firms in some competitive MIC
Graph 4
0
20
40
60
80
100
Countryaverage
Domesticfirms
Foreignfirms
Per
cent
age
of e
xpor
ters
Chile China India Malaysia South Africa
Source: Own elaboration with Enterprise Surveys data (World Bank) The accomplishment of the quality standards in their production outputs is another element that could reveal the technological ability of the entrepreneur fabric of the MIC in order to integrate the requirements that allow them to compete in the exigent international market’ segments; particularly, if we think on the im-portance of intermediates transactions inside the value chain. In the productive systems of developing economies where a combination of advanced and traditional industries coexists, this can be considered a good proxy or indirect indicator of the technological capacity to inte-grate innovative protocols and processes at the level of international standards. In Graph 5 we can see that the five highly competitive MIC show a similar behavior in the general average of the proportion of firms with international quality certificates that is rather better in the Asian economies: in China, the value of this indicator is above one third of the firms and in Malaysia, it is higher than 30%. The domestic firms in these economies follow the same pat-tern described for the general average with only minor variations. However, differences are again notable when taking into account the
proportion of foreign firms that accomplish quality certification according to international standards in these economies. In four out of the five countries (with the only exception of Chile), the differences are extraordinary nota-ble since more than 50% of the foreign com-panies take these certificates, being above the domestic units in more than 20 percent points in Malaysia and China while the differences with regard to the domestic companies are even more substantial in the cases of South Africa and India. Graph 5. International quality certificates
in some competitive MIC
Graph 5
0102030405060708090
100
Countryaverage
Domesticfirms
Foreign firms
Per
cent
age
of fi
rms
Chile China India Malaysia South Africa
Source: Own elaboration, Enterprise Surveys data (World Bank) On the other hand, Graph 6 illustrates an indi-cator related to the use of external technology sources; particularly, the proportion of firms that use technology licenses from foreign companies. The availability of information allow us to use data only for four out of the five MIC selected (Malaysia is excluded). In this aspect, we can note that China is, follow-ing the general average, the country that shows the highest proportion of firms acceding to technology licensing from foreign compa-nies, being around 20% while in South Africa and Chile that proportion is close to 10% and in India is notable lower. Taking only the case of domestic firms, these proportions are nota-bly reduced. However, in the case of foreign firms, there is a different result: there is a more important access to technology licensing in more than 40% of the foreign companies in Chile, as well as in the other countries where the proportion of foreigners using this tech-nology source is rather similar. Then, accord-ing to these results, the presence of foreign firms seems to be associated to a higher level of access to foreign technology as well.
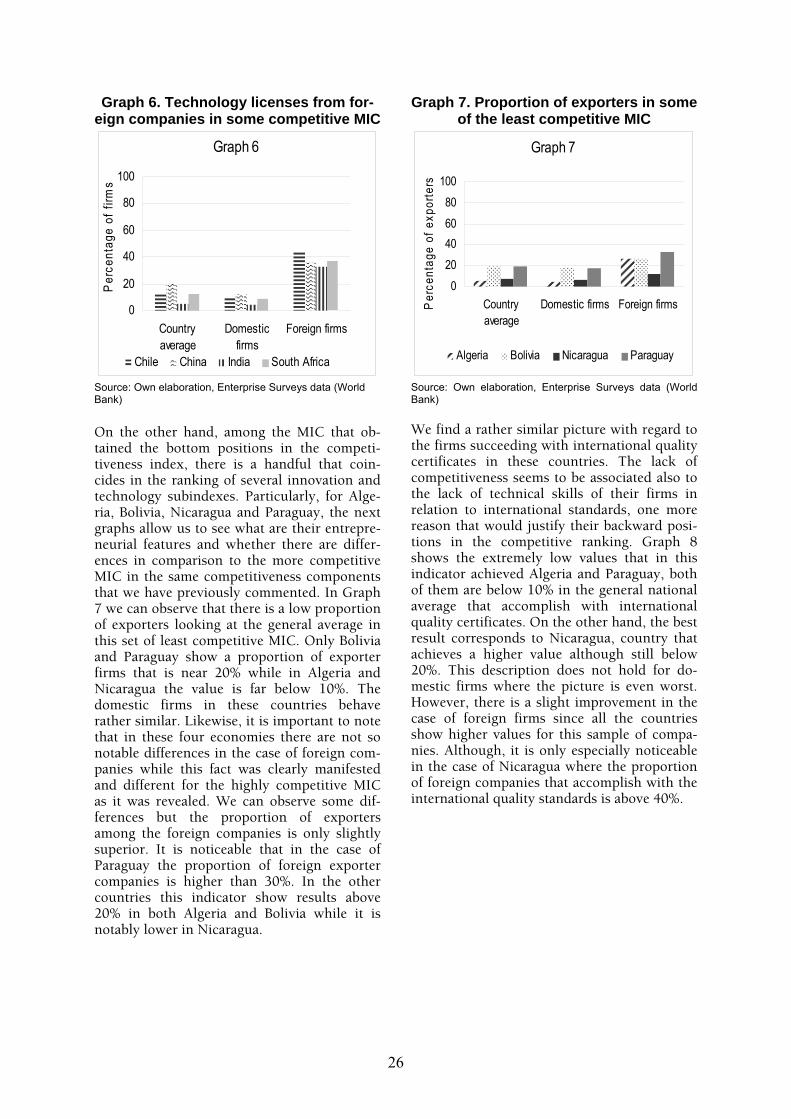
26
Graph 6. Technology licenses from for-eign companies in some competitive MIC
Graph 6
0
20
40
60
80
100
Countryaverage
Domesticfirms
Foreign firms
Per
cent
age
of fi
rms
Chile China India South Africa
Source: Own elaboration, Enterprise Surveys data (World Bank)
On the other hand, among the MIC that ob-tained the bottom positions in the competi-tiveness index, there is a handful that coin-cides in the ranking of several innovation and technology subindexes. Particularly, for Alge-ria, Bolivia, Nicaragua and Paraguay, the next graphs allow us to see what are their entrepre-neurial features and whether there are differ-ences in comparison to the more competitive MIC in the same competitiveness components that we have previously commented. In Graph 7 we can observe that there is a low proportion of exporters looking at the general average in this set of least competitive MIC. Only Bolivia and Paraguay show a proportion of exporter firms that is near 20% while in Algeria and Nicaragua the value is far below 10%. The domestic firms in these countries behave rather similar. Likewise, it is important to note that in these four economies there are not so notable differences in the case of foreign com-panies while this fact was clearly manifested and different for the highly competitive MIC as it was revealed. We can observe some dif-ferences but the proportion of exporters among the foreign companies is only slightly superior. It is noticeable that in the case of Paraguay the proportion of foreign exporter companies is higher than 30%. In the other countries this indicator show results above 20% in both Algeria and Bolivia while it is notably lower in Nicaragua.
Graph 7. Proportion of exporters in some of the least competitive MIC
Graph 7
0
20
4060
80
100
Countryaverage
Domestic firms Foreign firmsPer
cent
age
of e
xpor
ters
Algeria Bolivia Nicaragua Paraguay
Source: Own elaboration, Enterprise Surveys data (World Bank) We find a rather similar picture with regard to the firms succeeding with international quality certificates in these countries. The lack of competitiveness seems to be associated also to the lack of technical skills of their firms in relation to international standards, one more reason that would justify their backward posi-tions in the competitive ranking. Graph 8 shows the extremely low values that in this indicator achieved Algeria and Paraguay, both of them are below 10% in the general national average that accomplish with international quality certificates. On the other hand, the best result corresponds to Nicaragua, country that achieves a higher value although still below 20%. This description does not hold for do-mestic firms where the picture is even worst. However, there is a slight improvement in the case of foreign firms since all the countries show higher values for this sample of compa-nies. Although, it is only especially noticeable in the case of Nicaragua where the proportion of foreign companies that accomplish with the international quality standards is above 40%.

27
Graph 8. International quality certificates in some of the least competitive MIC
Graph 8
0
20
40
60
80
100
Countryaverage
Domestic firms Foreign firms
Per
cent
age
of fi
rms
Algeria Bolivia Nicaragua Paraguay
Source: Own elaboration, Enterprise Surveys data (World Bank) Finally, considering the firms that have access to foreign technologies through the acquisition of licenses to foreign companies, the general average shows a proportion that is 10% or less in Algeria, Bolivia and Paraguay while is nota-bly lower in the Nicaraguan case, in Graph 9. It is pretty the same when seeing the behavior of the domestic companies considered alone although with lower values in Nicaragua and Bolivia. However, looking at the proportion of foreign companies, it is rather high in Bolivia where 40% of these firms acquire foreign tech-nology, in Paraguay where the value is around 25% and even in Algeria with a proportion of 20%. Therefore, the aspect of technology ac-quisition seems to be more differentiated be-tween foreign companies and domestic in least competitive economies than across countries, being possible to assert that precisely these companies could generate a reinforcing mechanism of access to foreign technologies.
Graph 9. Technology licenses from foreign companies in some of the least
competitive MIC Graph 9
020
4060
80100
Countryaverage
Domestic firms Foreign firms
Per
cent
age
of fi
rms
Algeria Bolivia Nicaragua Paraguay
Source: Own elaboration, Enterprise Surveys data (World Bank)
In sum, from this description we can say that a close relationship emerges between the ele-ments that conduit to a good competitive per-formance and the relative importance that foreign firms achieved in the national systems of innovation, at least according to the set of elements that have been specifically studied. Nevertheless, it can be underline that this con-stitutes an element of differentiation of being more competitive, as it has been revealed in the comparison between the best and the least positioned MIC. In the latter, the strength of foreign companies as exporters as well as re-garding the implementation of international quality standards is not so noticeable. These results bring us to pinpoint the idea about the existence of a potential threshold effect in host countries and the reinforcing mechanism that foreign firms could generate in those develop-ing countries with higher abilities to catch up.
5. The empirical analysis The previous sections showed the importance of the absorption and creation of technology as well as the international integration via FDI in the world competitive position of the MIC countries. Moreover, an interesting issue has also risen regarding the role played by foreign firms in the transfer of technology to the MIC countries. In this section, we analyze the im-pact of these factors in the competitiveness shift of MIC countries, paying special attention to the relative importance of high-tech ex-ports. For this purpose, the analysis presented here is undertaken for the period defined be-tween 1998 and 2005, making use of data from the World Bank and the UNCTAD, and it is carried out for 60 countries (29 middle-income countries and 31 belonging to the high-income group)4. Before proceeding with the empirical analysis, a description of the technological position of the MIC in the inter-national context and its relationship with their ability to export high-tech products is carried out for the period analyzed. 5.1 THE TECHNOLOGICAL POSITION OF MIC COUNTRIES AT THE INTERNATIONAL LEVEL In order to describe the international techno-logical position of the MIC countries, we make use of those indicators related to the absorp-tion and creation of technology as well as
4 The list of countries included in the empirical analysis can be found in Table A.5 in the Appendix.
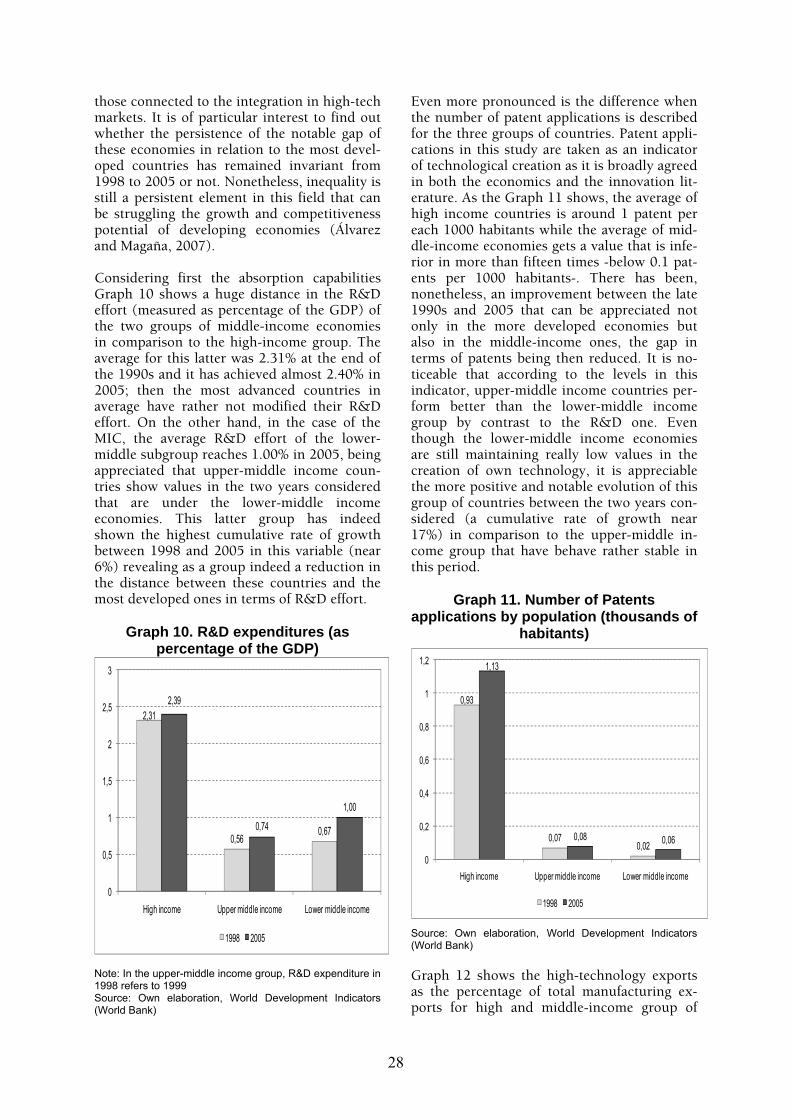
28
those connected to the integration in high-tech markets. It is of particular interest to find out whether the persistence of the notable gap of these economies in relation to the most devel-oped countries has remained invariant from 1998 to 2005 or not. Nonetheless, inequality is still a persistent element in this field that can be struggling the growth and competitiveness potential of developing economies (Álvarez and Magaña, 2007). Considering first the absorption capabilities Graph 10 shows a huge distance in the R&D effort (measured as percentage of the GDP) of the two groups of middle-income economies in comparison to the high-income group. The average for this latter was 2.31% at the end of the 1990s and it has achieved almost 2.40% in 2005; then the most advanced countries in average have rather not modified their R&D effort. On the other hand, in the case of the MIC, the average R&D effort of the lower-middle subgroup reaches 1.00% in 2005, being appreciated that upper-middle income coun-tries show values in the two years considered that are under the lower-middle income economies. This latter group has indeed shown the highest cumulative rate of growth between 1998 and 2005 in this variable (near 6%) revealing as a group indeed a reduction in the distance between these countries and the most developed ones in terms of R&D effort.
Graph 10. R&D expenditures (as percentage of the GDP)
2,31
0,560,67
2,39
0,74
1,00
0
0,5
1
1,5
2
2,5
3
High income Upper middle income Lower middle income
1998 2005
Note: In the upper-middle income group, R&D expenditure in 1998 refers to 1999 Source: Own elaboration, World Development Indicators (World Bank)
Even more pronounced is the difference when the number of patent applications is described for the three groups of countries. Patent appli-cations in this study are taken as an indicator of technological creation as it is broadly agreed in both the economics and the innovation lit-erature. As the Graph 11 shows, the average of high income countries is around 1 patent per each 1000 habitants while the average of mid-dle-income economies gets a value that is infe-rior in more than fifteen times -below 0.1 pat-ents per 1000 habitants-. There has been, nonetheless, an improvement between the late 1990s and 2005 that can be appreciated not only in the more developed economies but also in the middle-income ones, the gap in terms of patents being then reduced. It is no-ticeable that according to the levels in this indicator, upper-middle income countries per-form better than the lower-middle income group by contrast to the R&D one. Even though the lower-middle income economies are still maintaining really low values in the creation of own technology, it is appreciable the more positive and notable evolution of this group of countries between the two years con-sidered (a cumulative rate of growth near 17%) in comparison to the upper-middle in-come group that have behave rather stable in this period.
Graph 11. Number of Patents applications by population (thousands of
habitants)
0,93
0,070,02
1,13
0,08 0,06
0
0,2
0,4
0,6
0,8
1
1,2
High income Upper middle income Lower middle income
1998 2005
Source: Own elaboration, World Development Indicators (World Bank) Graph 12 shows the high-technology exports as the percentage of total manufacturing ex-ports for high and middle-income group of
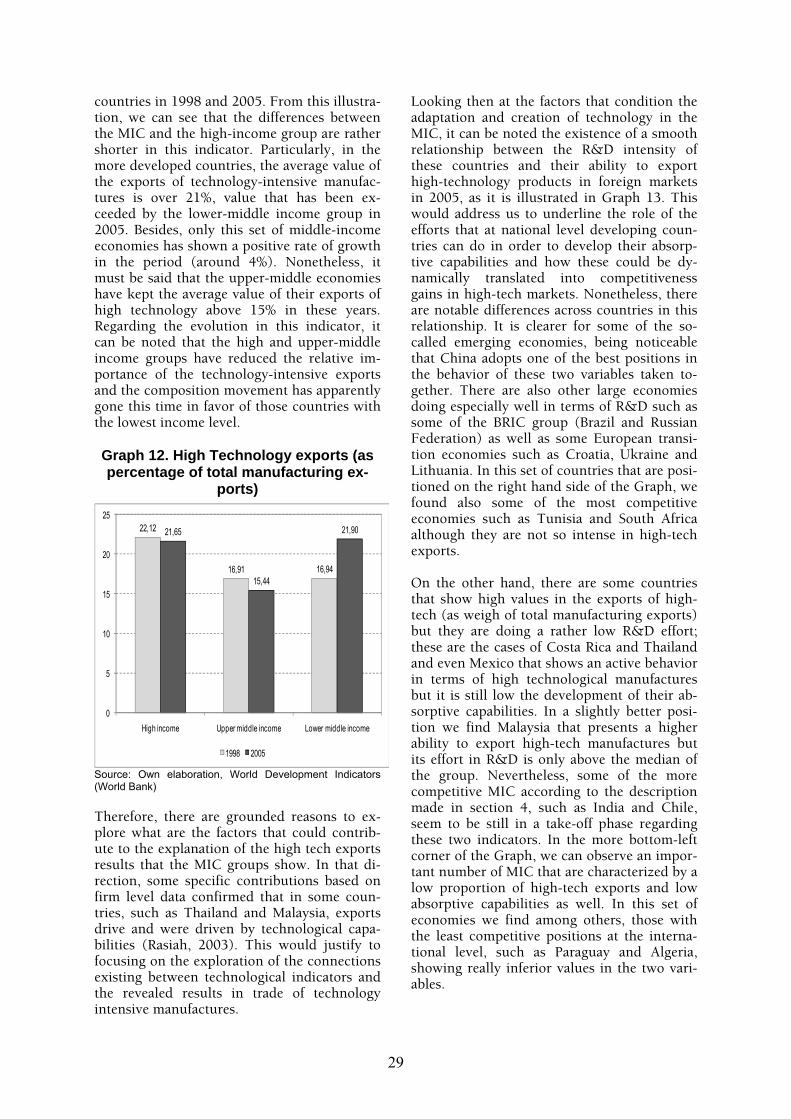
29
countries in 1998 and 2005. From this illustra-tion, we can see that the differences between the MIC and the high-income group are rather shorter in this indicator. Particularly, in the more developed countries, the average value of the exports of technology-intensive manufac-tures is over 21%, value that has been ex-ceeded by the lower-middle income group in 2005. Besides, only this set of middle-income economies has shown a positive rate of growth in the period (around 4%). Nonetheless, it must be said that the upper-middle economies have kept the average value of their exports of high technology above 15% in these years. Regarding the evolution in this indicator, it can be noted that the high and upper-middle income groups have reduced the relative im-portance of the technology-intensive exports and the composition movement has apparently gone this time in favor of those countries with the lowest income level. Graph 12. High Technology exports (as percentage of total manufacturing ex-
ports)
22,12
16,91 16,94
21,65
15,44
21,90
0
5
10
15
20
25
High income Upper middle income Lower middle income
1998 2005
Source: Own elaboration, World Development Indicators (World Bank) Therefore, there are grounded reasons to ex-plore what are the factors that could contrib-ute to the explanation of the high tech exports results that the MIC groups show. In that di-rection, some specific contributions based on firm level data confirmed that in some coun-tries, such as Thailand and Malaysia, exports drive and were driven by technological capa-bilities (Rasiah, 2003). This would justify to focusing on the exploration of the connections existing between technological indicators and the revealed results in trade of technology intensive manufactures.
Looking then at the factors that condition the adaptation and creation of technology in the MIC, it can be noted the existence of a smooth relationship between the R&D intensity of these countries and their ability to export high-technology products in foreign markets in 2005, as it is illustrated in Graph 13. This would address us to underline the role of the efforts that at national level developing coun-tries can do in order to develop their absorp-tive capabilities and how these could be dy-namically translated into competitiveness gains in high-tech markets. Nonetheless, there are notable differences across countries in this relationship. It is clearer for some of the so-called emerging economies, being noticeable that China adopts one of the best positions in the behavior of these two variables taken to-gether. There are also other large economies doing especially well in terms of R&D such as some of the BRIC group (Brazil and Russian Federation) as well as some European transi-tion economies such as Croatia, Ukraine and Lithuania. In this set of countries that are posi-tioned on the right hand side of the Graph, we found also some of the most competitive economies such as Tunisia and South Africa although they are not so intense in high-tech exports. On the other hand, there are some countries that show high values in the exports of high-tech (as weigh of total manufacturing exports) but they are doing a rather low R&D effort; these are the cases of Costa Rica and Thailand and even Mexico that shows an active behavior in terms of high technological manufactures but it is still low the development of their ab-sorptive capabilities. In a slightly better posi-tion we find Malaysia that presents a higher ability to export high-tech manufactures but its effort in R&D is only above the median of the group. Nevertheless, some of the more competitive MIC according to the description made in section 4, such as India and Chile, seem to be still in a take-off phase regarding these two indicators. In the more bottom-left corner of the Graph, we can observe an impor-tant number of MIC that are characterized by a low proportion of high-tech exports and low absorptive capabilities as well. In this set of economies we find among others, those with the least competitive positions at the interna-tional level, such as Paraguay and Algeria, showing really inferior values in the two vari-ables.

30
Therefore, this simple description allows us to easily build a matrix that would relate the ab-sorptive capacities of the MIC with their high-tech performance in foreign markets. Accord-ingly, it would be plausible to think in two different dynamics: the process of building absorptive capabilities and the process of be-coming competitive. From the combination of them, different factors can intervene in their evolution and in the potential definition of strategies, becoming helpful for the analysis of competitiveness at the aggregated level and for providing some ideas about the next steps to follow by countries in order to integrate the more sophisticated markets and to be more competitive –Figure 3. Graph 13. High technology exports and
R&D expenditure, 2005
Note: R&D data for Chile, Costa Rica, Malaysia and Thai-land refers to 2004
Specifically, according to the relationship shown in Figure 3, the more outstanding competitive position would be defined by cell 4 where economies would show a high com-mitment with R&D and at the same time have already changed their export structure, gaining sustained competitive advantages in the tech-nology-intensive segment. On the other hand, there are promising responses by those economies that are positioned in cell number 2 because they are already in a good phase of building the absorptive capabilities that could guarantee a potential growth of productivity in the long run. The position 3 represents those economies that already show a high level of exports in high-tech, what can be related to the internationalization trends and the frag-mentation of the global value chain, although this level of exports is achieved with a low development of their absorptive capabilities. Finally, those countries in the position 1 are the more backward ones and their transition to the other positions may require more intense efforts. Nonetheless, the most likely and desir-able transitions, that is, from positions 2 and 3 toward the position 4, would require specific actions to enhance their competitiveness gains regarding the increase on the R&D effort and actions oriented to become more attractive for the external factors.
Figure 3. Building capabilities for competitiveness
3 High exporters with potential absorptive capabilities (Malaysia, Costa Rica, Mexico)
4 High exporters with high R&D (China) Potential
CompetitiveHigh Tech Exports
1 Low exporters with low R&D (Algeria, Paraguay, Vene-zuela)
2 Potential exporters with high R&D (Brazil, Russia, Tunisia)
Building Absorptive Capabilities
Absorptive capabilities (R&D)
Source: Own elaboration.

31
5.2. THE ECONOMETRIC MODEL The relevance of the technological factors in the competitiveness position of countries in the international scene -shown in previous sections- supports our interest in analyzing the competitiveness gains of countries in high-tech markets as a function of a set of factors related to those aspects that could contribute to define a country’s competitive profile. For this pur-pose, we specify an econometric model where the dependent variable is the high technology exports as a percentage of the total manufac-turing exports. We regress this variable against the set of internal and external factors that integrate our analytical proposition and which were previously defined in section 3. This rela-tionship can be defined as follows: HTit = IFαit EFβit Xδit eηi eγt (1) where HTit represents the percentage of high tech exports; IFit and EFit represent the inter-nal and external factors, respectively; the sub-script it refers to the country i in period t; Xitδ represents the set of other factors; ηi represents individual time-invariant effects (capturing the unobserved heterogeneity among countries); and γt represents time-variant effects. Taking natural logarithms from equation (1), it can be rewritten as follows: htit = αifit + βefit + δxit +ηi + γt + εit (2) where the subscript it refers to the country i in period t, ηi and γt represent individual and time effects, respectively; εit is a random error term. We include as external factors the inward and outward FDI stock in order to capture the relevance of the impact of foreign firms on the competitiveness gains of host countries in the global high-tech markets. Besides, these two variables can be considered as proxies of the commitment and integration of countries in the international scene. As internal factors we take the level of technological skills measured through the absorptive capabilities (R&D in-tensity) and the creation of technology (pat-ents applications). We also include the open-ness degree to foreign markets and the acquisi-tion of technology (royalty and license pay-ments) as control variables for both, the rele-vance of trade flows in the economy and the potential technology transfer from the interna-tional context; these two indicators are captur-
ing at least indirectly the participation of for-eign firms in host countries as trader agents. All of these variables are included as inde-pendent variables as well in order to test their relevance as determinant factors of the com-petitive position of countries. Table 8 shows a summary and description of the variables in-cluded in the analysis5.
Table 8. Summary of variables Dependent variable
htit
Logarithm of high technology exports (as the percentage of the total manufacturing ex-ports), country i year t
Independent variables
FDInwSit Logarithms of FDI inward stock (million current US$), country i year t
FDIOutwSit Logarithms of FDI outward stock (million current US$), country i year t
Opit
Logarithm of exports and im-ports of goods and services (as the percentage of GDP), coun-try i year t
RoyPit
Logarithm of royalty and li-cense fees, payments ( current US$ by thousands of inhabi-tants), country i year t
RDit
Logarithm of research and development expenditures (as the percentage of GDP), coun-try i year t
Patit Logarithm of total patents ap-plications (by thousands of inhabitants), country i year t
The different evolution followed by the groups of countries in terms of high-tech exports and also in terms of technological indicators, as we seen in section 5.1, justifies to taking into ac-count the levels of income in order to explore whether the factors explaining competitiveness may differ accordingly to the levels of devel-opment. Then, the model previously described is estimated for a total sample that includes high and middle income countries, as well as for the subsample of both high-income and middle-income countries, assuming that dif-ferent levels of development could imply a
5 Some descriptive statistics of the variables included in the analysis can be found in the Appendix (Table A6).

32
different importance on the factors explaining the competitiveness behavior of countries. The availability of panel data makes of special relevance the selection of the estimation pro-cedure due to the inherent endogenous struc-ture of the model and, for this reason, we fol-low a dynamic approach. When selecting the estimation procedure is important to consider, on the one hand, that the dependent variable and its lag may be correlated with the inde-pendent variables due to the dynamics in the underlying process of competitiveness gains; that is, past results in terms of the absorption and creation of technology or in terms of inte-gration in international markets via FDI may determine the high technology exports in pre-sent times. The generalized method of mo-ments (GMM) uses the first differences trans-formation and all possible lags of regressors as instruments to wipe-out non-observable indi-vidual effects and to eliminate possible correla-tions with the individual effect (Arellano and Bond, 1991). Then, equation (2) can be rewrit-ten as follows: Δhtit = αΔifit + βΔefit + δΔxit + γt + εit (3) On the other hand, the presence of predeter-mined variables as regressors gives rise to a potential autocorrelation problem; i.e. the creation of technology (measured by patents applications) is not usually sporadic but de-scribes a cumulative process what implies that this regressor may be determined by past dis-
turbances and, then, is predetermined. In such a case, Arellano and Bover (1995) highlight the importance of identifying these variables and they propose the use of predetermined variables in first differences as instruments for equations in levels in order to obtain asymp-totically efficient and consistent GMM estima-tors. Therefore, we adopt the GMM estimation procedure because of its inherent advantages. In order to evaluate the relevance of our econometric model, we implement two differ-ent tests. The first one is the Sargan test for the validity of over-identifying restrictions and the quality of instruments. Failure to reject the null hypothesis indicates that the instruments are valid and that the model is correctly speci-fied. The second one is the Arellano and Bond test for first and second order serial autocorre-lation of residuals. If the residuals are not seri-ally correlated we should observe the absence of second order serial correlation. 5.3. DISCUSSION OF RESULTS The results of the estimations are shown in Table 9. The first estimation (column 1) indi-cates the results in terms of internal and exter-nal factors of competitiveness when the total sample is considered. The second estimation (column 2) shows the results for high-income countries. Finally, the third estimation (col-umn 3) reveals the findings for middle-income economies. According to the results for the total sample, the competitiveness’ improve-
Table 9. Estimations results
Total sample
High income countries
Middle income
countries Inward stock ,0607
(,0112)*** -,0598
(,0403) ,3803
(,0501)*** Outward stock ,0629
(,0094)*** ,1323
(,0357)*** -,0151
(,0291) Openness ,2151
(,0346)*** ,3102
(,1567)** ,3264
(,3892) Royalties payments ,0322
(,0032)*** ,0617
(,0169)*** ,0355
(,0136)*** R&D ,2982
(,0126)*** -,5534
(,1277)*** ,5537
(,0771)*** Patents ,1765
(,0076)*** -,0320
(,0294) ,1619
(,0267)*** Constant -,0302
(,0021)*** -,0221
(,0054)*** -,0442
(,0087)*** Number obs. 378 201 187 Number of groups 57 29 28 Sargan test (Chi2) 41,72 18,71 15,76 AR(1) -1,80** -1,65* -2,05** AR(2) -1,20 -1,09 -0,94
Robust standard errors in parenthesis *Significant at 10%; **Significant at 5%; ***Significant at 1%.

33
ment of countries is mainly affected by the national R&D effort as well as their degree of openness to international trade. Nonetheless, accordingly to our conceptual approach, some other factors could intervene positively in the dynamics of high tech exports and these are the acquisition and creation of technology and the internationalization level of countries by two means, inward and outward perspectives; the positive and significant coefficients of these variables would confirm our proposition. However, results differ when taking into ac-count the income level of countries. As we can see in column 2 of Table 9, the competitive dynamic of high-income economies shows a different picture. Beyond their commercial openness, the fact that they have became FDI emitters, via outward investments, has a posi-tive and important effect in their competitive-ness’ results while the stock of inward FDI loses its significance in this group of econo-mies. Moreover, the acquisition of technology abroad is still significant but neither the pat-ents nor the R&D enhance their market shares in the more dynamic markets. The negative relationship between the high-tech exports and the dynamics process of building absorp-tive capabilities in the most developed coun-tries in the period analyzed could reflect the evolution of the variables showed in section 5.1 for this group of countries. Particularly, we observed a raise in R&D effort during this period while the opposite trend characterized the high-tech exports of these countries. Moreover, this result could be also revealing the more positive evolution that the MIC have experienced in their technological indicators during the last years and even their more no-table improvement as exporters of high-tech in comparison to the most developed economies. Looking now at the results for the middle-income countries, it is noticeable the signifi-cant largest coefficient corresponding to the national R&D efforts and there is also a posi-tive impact of the inward FDI stock in these economies –in column 3. Moreover, the crea-tion of technology and also the technology acquisition worldwide are significant factors in the explanation of their positive competitive evolution in the MIC since both the patents and the payments for licenses and royalties show a positive sign. However, their openness level does not seem to be a relevant aspect while the investment capabilities of these countries via FDI seem to be kept still in a very moderate level; none of these variables
intervene in the definition of their dynamism in technology-intensive exports since both of them are not significant. Therefore, from this empirical model we would add, about the competitiveness evolu-tion of the MIC in the technology-intensive industries that the relationship based on tech-nology and FDI as we integrated in our ana-lytical construct (Figure 1) is quite justified. Even though it may hold in general terms, it is important to underline the emergence of im-portant differences by groups of countries. Regarding the MIC, the presence of foreign companies together with both the efforts to adapt foreign technologies and to create own techniques are the more suitable combinations that more clearly can contribute to the genera-tion of external effects from FDI in the host productive systems. By contrast, these coun-tries do not yet accomplish a competitive dy-namic that would be based on their integration in the international context via FDI. This would be coincident with the argument in favor of the regionalization of the world econ-omy instead of a truly globalization and the consideration to the modest role that develop-ing countries are still playing in the activities of the MNC worldwide (Rugman and Doh, 2008). Moreover, our findings would confirm that although this group of countries have began to manifest an active competitive behav-ior, it is more important the building process of their absorption capabilities than their role as technology creators in the world (Athreye and Cantwell, 2007). On the other hand, the results for the MIC reinforce the idea about the important role of their increasing internationalization although the variety of cases recall the relevance of the national specificity and the opportunities for the national systems of innovation to integrate the external factors in favor of a higher com-petitiveness level (Lundvall et al., 2002; Cantwell and Molero, 2003; Álvarez and Marin, 2008; Álvarez et al, 2009). In this direc-tion, actions and strategies at the level of coun-tries could consider either the potential effect of FDI which would revert in terms of spill-overs to host locations as well as the consoli-dation of more advanced systems that could take-off as investors abroad. Moreover, the positive impact of the inward FDI in the par-ticipation of the MIC in the international high-tech markets could reveal the positive role of foreign firms in the upgrading of their techno-logical capabilities. What is more, since the
34
openness level of MIC countries does not seem to affect their high-tech export capacity, it could be inferred that foreign firms are not only looking at the MIC countries as mere export platforms. Likewise, the interplay be-tween foreign firms and national technological capabilities would gain some ground in the improvement of their competitive dynamic behavior. This would derive into a direct im-plication that could be to accentuate those lines that would enhance the creation of tech-nology. Finally, among the limitations of this analysis we would say that our results do not allow us to affirm that the MIC group of economies have shown already an active behavior in terms of outward FDI, nor that reverse knowl-edge effects could be easily detected and trans-lated in their competitiveness results, aspect that seems to be more clear for the most de-veloped economies. The multiple specializa-tion patterns of the MIC and how that indus-trial diversity could derive into different com-petitive profiles in a given country, is another aspect that could improve the analysis carried out here. The competitiveness gains have been assimilated to the abilities of countries to ex-port technology-intensive manufactures al-though the analysis of data at the industrial level and even for intra-firm trade could pro-vide a more complete picture.
6. Conclusions There is a set of developing economies inte-grating the middle-income group that are re-vealing important opportunities in terms of competitiveness results, ranked in many as-pects even better that some of the economies included in the most rich and developed club of countries. Nonetheless, there seem to be still some elements of exclusion inside the own MIC group and there is not a clear pat-tern of behavior that could indisputable char-acterize their position in the more dynamic international markets. Our proposition here has been based on the interplay between na-tional technology capabilities and the impact of the international integration that FDI may generate. The objective has been to adopt this approach to explore the diversity that the MIC could offer in these fields in order to provide some new fresh empirical evidence about the factors explaining their competitive results and the actions than can be derived from.
Our analysis reveals the existence of a close relationship that emerges from those econo-mies that show a good competitive perform-ance and the relative importance that foreign firms achieved in their national systems of innovation; this constitutes an element of dif-ferentiation between the best and the least positioned MIC in the world ranking. None-theless, it is not just a matter of the presence of foreign companies in the national economies but their possible contribution to the devel-opment of technologies, to the realization of activities of higher value content and even to increase the exports levels in the MIC. These results could be related to the existence of a potential threshold effect in host countries that would permit the reinforcing mechanisms that foreign firms could generate in the industries of the developing economies with higher levels of benefits for their catch-up processes. More-over, the potential external effects that MNC can generate could require specific actions to develop the business and institutional envi-ronment that would be favorable to get those multiplicative effects. More substantial is the idea that would emerge clearly from the comparative analysis of the MIC in relation to the absorptive capabilities and how these become a crucial element for both processes of the creation and the adapta-tion of technology. With a new conceptual approach we confirm this statement that finds broad support in a large number of contribu-tions in different branches of the literature on innovation, spillover and multinational com-panies. Specifically, our findings confirm that in the middle-income economies, the stock of inward FDI is an important external factor that combines with both their ability to adapt tech-nology (more typical of less developed coun-tries) as well as with their effort to create it, revealing in any case the importance of their absorptive capabilities. However, the other way round regarding the integration of these countries abroad via FDI has not yet been con-firmed, this becoming precisely the most im-portant element of differentiation with regard to the competitive behavior of the most devel-oped economies. This is a process that seems to be at the beginning stage in some selected MIC countries. Accordingly, the individual country specificity and the different institutional contexts make especially relevant to integrate the possibilities for different policies and levels of action. One of them would be necessarily oriented to dis-
35
tinguish the potential effect of the external factors and the importance to create the neces-sary conditions to nurture from hosting MNC and also to enhance the ability of national firms to become international companies. This can be related not only with the development of technical skills but even with some educa-tion assets that countries could generate through the appropriate definition of the edu-cational background that finally could favor higher levels of entrepreneurship. Other fields of action can be indeed oriented toward get-ting the highest benefits as possible from the insertion of these countries in the different parts of the global value chain. In this sense, there are specific areas to which address those actions such as providing the necessary condi-tions to get the international quality standards in processes and products as well as to facili-tate the access to technology licensing from abroad that could be integrated in the MIC productive systems. These elements could
certainly be shaping a more general policy of exports promotion from these economies, as-pect that necessarily require a favorable framework in the international regulatory con-text. Finally, actions can be defined at the level of the national institutional setting in terms of universities, scientific and technological cen-ters but also in a more broad sense trying to integrate other elements of the institutional set up such as those related to fiscal and financial systems; in other words, the pieces of the na-tional system that frame a more dynamic economy that could define a sustainable strat-egy based on their own productive and com-mercial capacities. In other words, whatever the definition of policies would be, it must be based in a national vision of competitiveness that would be at the same time integrative of the international dynamics, rejecting any kind of generalization applicable and even succeed-ing in other contexts.
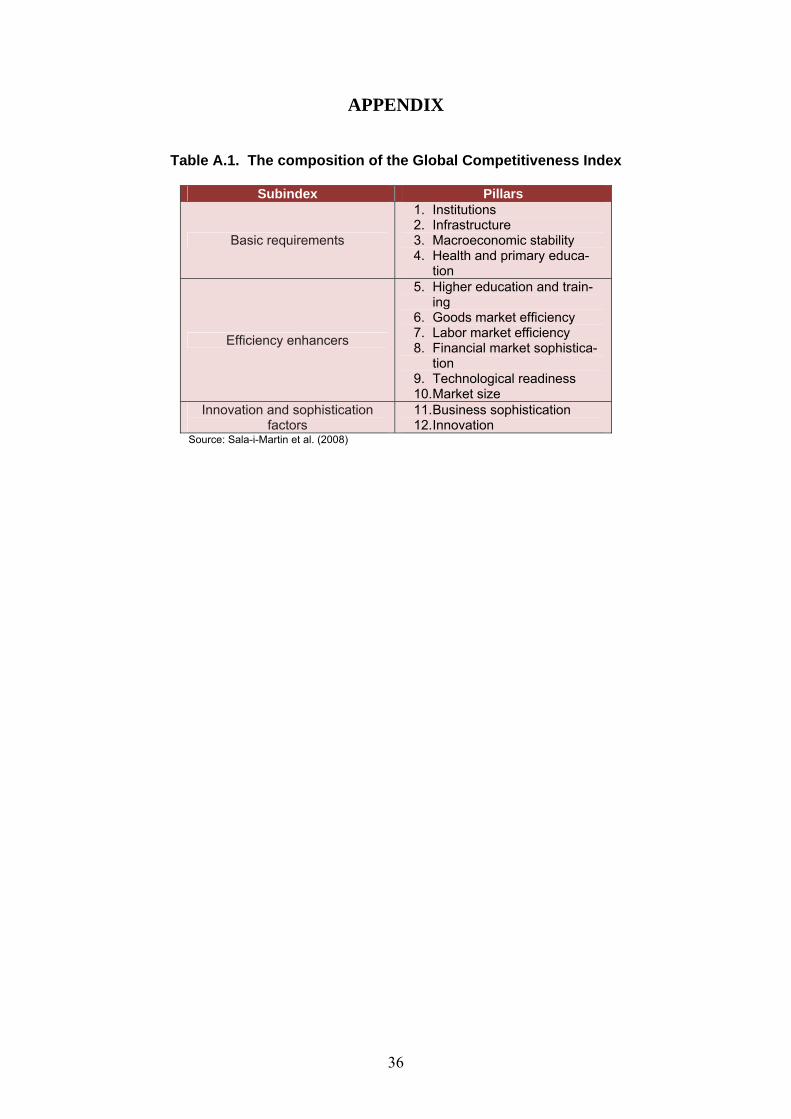
36
APPENDIX
Table A.1. The composition of the Global Competitiveness Index
Subindex Pillars
Basic requirements
1. Institutions 2. Infrastructure 3. Macroeconomic stability 4. Health and primary educa-
tion
Efficiency enhancers
5. Higher education and train-ing
6. Goods market efficiency 7. Labor market efficiency 8. Financial market sophistica-
tion 9. Technological readiness 10. Market size
Innovation and sophistication factors
11. Business sophistication 12. Innovation
Source: Sala-i-Martin et al. (2008)
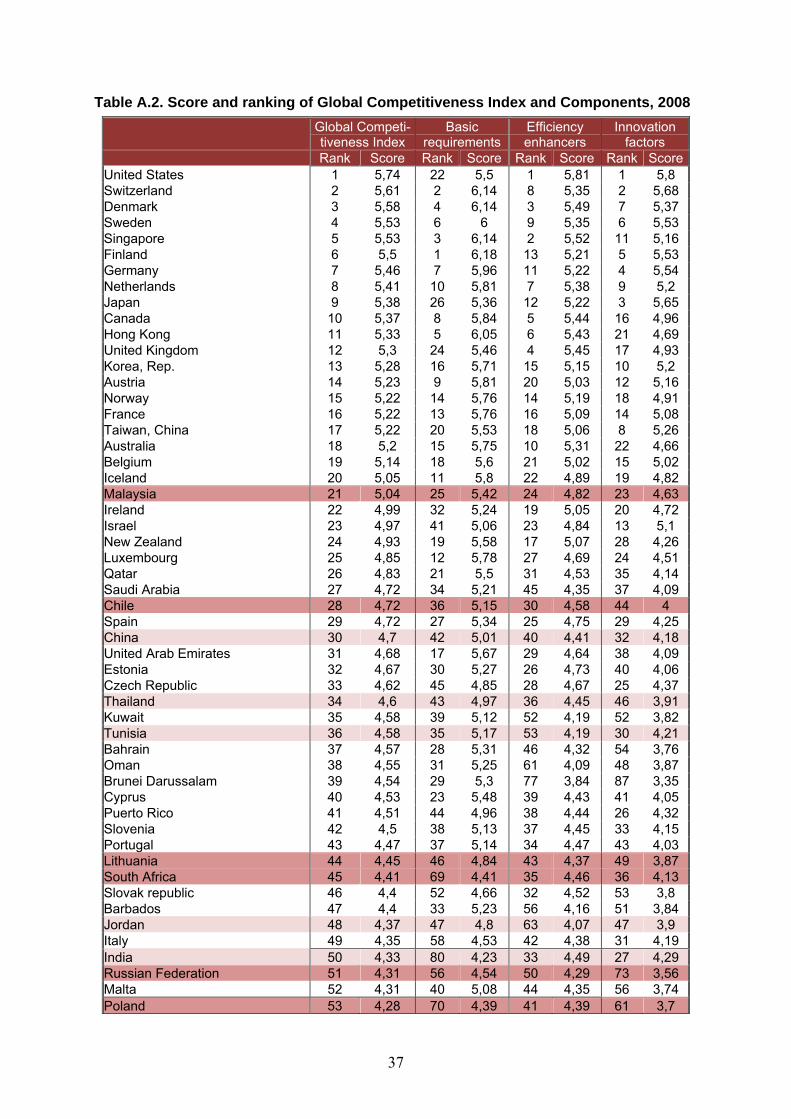
37
Table A.2. Score and ranking of Global Competitiveness Index and Components, 2008
Global Competi-tiveness Index
Basic requirements
Efficiency enhancers
Innovation factors
Rank Score Rank Score Rank Score Rank ScoreUnited States 1 5,74 22 5,5 1 5,81 1 5,8 Switzerland 2 5,61 2 6,14 8 5,35 2 5,68 Denmark 3 5,58 4 6,14 3 5,49 7 5,37 Sweden 4 5,53 6 6 9 5,35 6 5,53 Singapore 5 5,53 3 6,14 2 5,52 11 5,16 Finland 6 5,5 1 6,18 13 5,21 5 5,53 Germany 7 5,46 7 5,96 11 5,22 4 5,54 Netherlands 8 5,41 10 5,81 7 5,38 9 5,2 Japan 9 5,38 26 5,36 12 5,22 3 5,65 Canada 10 5,37 8 5,84 5 5,44 16 4,96 Hong Kong 11 5,33 5 6,05 6 5,43 21 4,69 United Kingdom 12 5,3 24 5,46 4 5,45 17 4,93 Korea, Rep. 13 5,28 16 5,71 15 5,15 10 5,2 Austria 14 5,23 9 5,81 20 5,03 12 5,16 Norway 15 5,22 14 5,76 14 5,19 18 4,91 France 16 5,22 13 5,76 16 5,09 14 5,08 Taiwan, China 17 5,22 20 5,53 18 5,06 8 5,26 Australia 18 5,2 15 5,75 10 5,31 22 4,66 Belgium 19 5,14 18 5,6 21 5,02 15 5,02 Iceland 20 5,05 11 5,8 22 4,89 19 4,82 Malaysia 21 5,04 25 5,42 24 4,82 23 4,63 Ireland 22 4,99 32 5,24 19 5,05 20 4,72 Israel 23 4,97 41 5,06 23 4,84 13 5,1 New Zealand 24 4,93 19 5,58 17 5,07 28 4,26 Luxembourg 25 4,85 12 5,78 27 4,69 24 4,51 Qatar 26 4,83 21 5,5 31 4,53 35 4,14 Saudi Arabia 27 4,72 34 5,21 45 4,35 37 4,09 Chile 28 4,72 36 5,15 30 4,58 44 4 Spain 29 4,72 27 5,34 25 4,75 29 4,25 China 30 4,7 42 5,01 40 4,41 32 4,18 United Arab Emirates 31 4,68 17 5,67 29 4,64 38 4,09 Estonia 32 4,67 30 5,27 26 4,73 40 4,06 Czech Republic 33 4,62 45 4,85 28 4,67 25 4,37 Thailand 34 4,6 43 4,97 36 4,45 46 3,91 Kuwait 35 4,58 39 5,12 52 4,19 52 3,82 Tunisia 36 4,58 35 5,17 53 4,19 30 4,21 Bahrain 37 4,57 28 5,31 46 4,32 54 3,76 Oman 38 4,55 31 5,25 61 4,09 48 3,87 Brunei Darussalam 39 4,54 29 5,3 77 3,84 87 3,35 Cyprus 40 4,53 23 5,48 39 4,43 41 4,05 Puerto Rico 41 4,51 44 4,96 38 4,44 26 4,32 Slovenia 42 4,5 38 5,13 37 4,45 33 4,15 Portugal 43 4,47 37 5,14 34 4,47 43 4,03 Lithuania 44 4,45 46 4,84 43 4,37 49 3,87 South Africa 45 4,41 69 4,41 35 4,46 36 4,13 Slovak republic 46 4,4 52 4,66 32 4,52 53 3,8 Barbados 47 4,4 33 5,23 56 4,16 51 3,84 Jordan 48 4,37 47 4,8 63 4,07 47 3,9 Italy 49 4,35 58 4,53 42 4,38 31 4,19 India 50 4,33 80 4,23 33 4,49 27 4,29 Russian Federation 51 4,31 56 4,54 50 4,29 73 3,56 Malta 52 4,31 40 5,08 44 4,35 56 3,74 Poland 53 4,28 70 4,39 41 4,39 61 3,7

38
Global Competi-tiveness Index
Basic requirements
Efficiency enhancers
Innovation factors
Rank Score Rank Score Rank Score Rank ScoreLatvia 54 4,26 55 4,63 47 4,31 84 3,39 Indonesia 55 4,25 76 4,25 49 4,29 45 3,98 Botswana 56 4,25 53 4,65 82 3,76 98 3,22 Mauritius 57 4,25 50 4,67 66 4,03 69 3,65 Panama 58 4,24 54 4,64 67 4,02 58 3,71 Costa Rica 59 4,23 63 4,45 60 4,09 39 4,07 Mexico 60 4,23 60 4,47 55 4,16 70 3,6 Croatia 61 4,22 49 4,69 62 4,08 62 3,7 Hungary 62 4,22 64 4,43 48 4,31 55 3,75 Turkey 63 4,15 72 4,34 59 4,1 63 3,7 Brazil 64 4,13 96 3,98 51 4,28 42 4,04 Montenegro 65 4,11 59 4,52 72 3,95 88 3,33 Kazakhstan 66 4,11 74 4,29 64 4,05 77 3,5 Greece 67 4,11 51 4,66 57 4,16 68 3,65 Romania 68 4,1 87 4,15 54 4,18 75 3,53 Azerbaijan 69 4,1 62 4,45 79 3,82 57 3,72 Vietnam 70 4,1 79 4,23 73 3,94 71 3,59 Philippines 71 4,09 85 4,17 68 4,02 67 3,65 Ukraine 72 4,09 86 4,15 58 4,12 66 3,66 Morocco 73 4,08 67 4,42 85 3,73 76 3,51 Colombia 74 4,05 77 4,24 70 3,96 60 3,71 Uruguay 75 4,04 57 4,53 83 3,76 82 3,42 Bulgaria 76 4,03 82 4,2 65 4,05 92 3,3 Sri Lanka 77 4,02 92 4,07 74 3,92 34 4,14 Syria 78 3,99 71 4,38 104 3,41 80 3,45 El Salvador 79 3,99 66 4,43 84 3,75 96 3,24 Namibia 80 3,99 48 4,71 93 3,57 104 3,16 Egypt 81 3,98 83 4,18 88 3,7 74 3,54 Honduras 82 3,98 78 4,24 91 3,62 89 3,32 Peru 83 3,95 94 4,02 69 4,01 83 3,4 Guatemala 84 3,94 84 4,17 86 3,72 65 3,69 Serbia 85 3,9 88 4,15 78 3,82 91 3,3 Jamaica 86 3,89 97 3,95 75 3,91 72 3,57 Gambia, The 87 3,88 81 4,22 107 3,36 78 3,48 Argentina 88 3,87 89 4,12 81 3,76 81 3,43 Macedonia, FYR 89 3,87 68 4,42 92 3,58 105 3,16 Georgia 90 3,86 91 4,07 87 3,72 109 3,07 Libya 91 3,85 75 4,27 114 3,29 102 3,16 Trinidad and Tobago 92 3,85 65 4,43 80 3,78 79 3,47 Kenya 93 3,84 104 3,8 76 3,9 50 3,87 Nigeria 94 3,81 105 3,74 71 3,96 64 3,69 Moldova 95 3,75 95 3,99 98 3,48 128 2,83 Senegal 96 3,73 101 3,88 96 3,48 59 3,71 Armenia 97 3,73 93 4,04 103 3,41 113 3,03 Dominican Republic 98 3,72 99 3,9 90 3,64 86 3,38 Algeria 99 3,71 61 4,46 113 3,29 126 2,85 Mongolia 100 3,65 102 3,87 105 3,39 119 2,94 Pakistan 101 3,65 110 3,67 89 3,67 85 3,39 Ghana 102 3,62 106 3,74 95 3,49 107 3,09 Suriname 103 3,58 73 4,31 127 3,11 117 2,97 Ecuador 104 3,58 90 4,12 117 3,27 118 2,95 Venezuela 105 3,56 111 3,65 94 3,55 116 2,98 Benin 106 3,56 103 3,81 123 3,2 100 3,21 Bosnia and Herzegovina 107 3,56 98 3,93 102 3,42 129 2,8
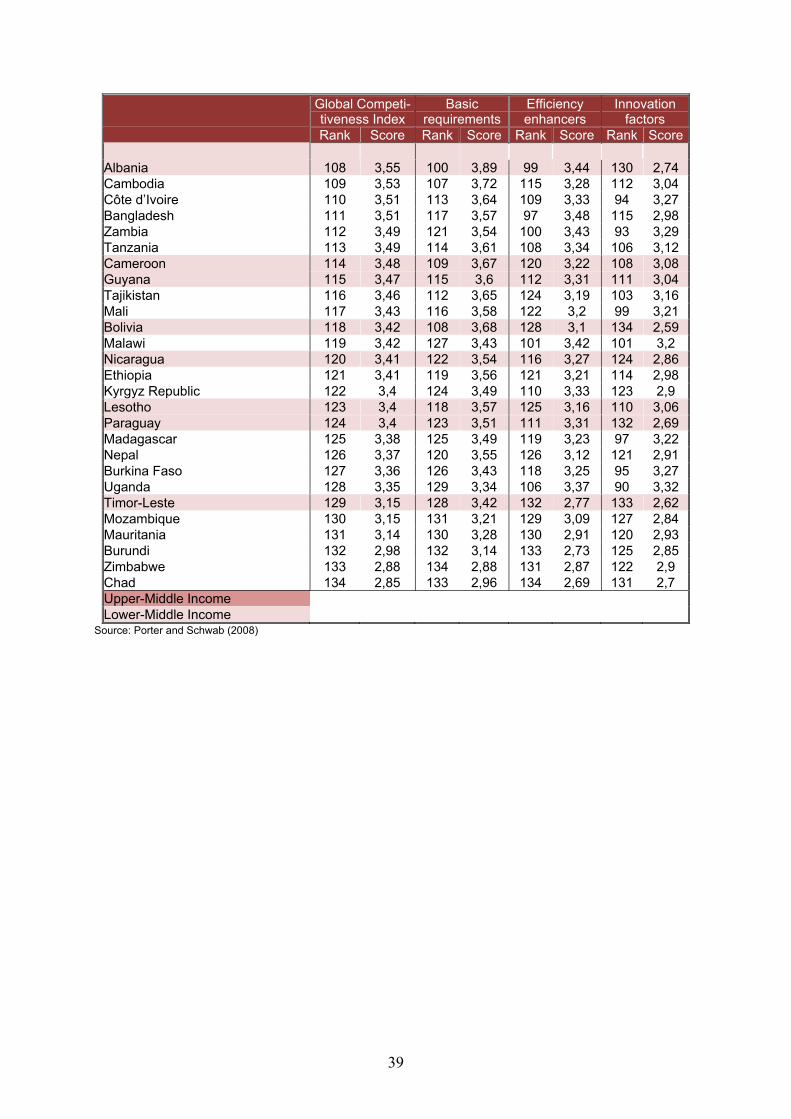
39
Global Competi-tiveness Index
Basic requirements
Efficiency enhancers
Innovation factors
Rank Score Rank Score Rank Score Rank Score Albania 108 3,55 100 3,89 99 3,44 130 2,74 Cambodia 109 3,53 107 3,72 115 3,28 112 3,04 Côte d’Ivoire 110 3,51 113 3,64 109 3,33 94 3,27 Bangladesh 111 3,51 117 3,57 97 3,48 115 2,98 Zambia 112 3,49 121 3,54 100 3,43 93 3,29 Tanzania 113 3,49 114 3,61 108 3,34 106 3,12 Cameroon 114 3,48 109 3,67 120 3,22 108 3,08 Guyana 115 3,47 115 3,6 112 3,31 111 3,04 Tajikistan 116 3,46 112 3,65 124 3,19 103 3,16 Mali 117 3,43 116 3,58 122 3,2 99 3,21 Bolivia 118 3,42 108 3,68 128 3,1 134 2,59 Malawi 119 3,42 127 3,43 101 3,42 101 3,2 Nicaragua 120 3,41 122 3,54 116 3,27 124 2,86 Ethiopia 121 3,41 119 3,56 121 3,21 114 2,98 Kyrgyz Republic 122 3,4 124 3,49 110 3,33 123 2,9 Lesotho 123 3,4 118 3,57 125 3,16 110 3,06 Paraguay 124 3,4 123 3,51 111 3,31 132 2,69 Madagascar 125 3,38 125 3,49 119 3,23 97 3,22 Nepal 126 3,37 120 3,55 126 3,12 121 2,91 Burkina Faso 127 3,36 126 3,43 118 3,25 95 3,27 Uganda 128 3,35 129 3,34 106 3,37 90 3,32 Timor-Leste 129 3,15 128 3,42 132 2,77 133 2,62 Mozambique 130 3,15 131 3,21 129 3,09 127 2,84 Mauritania 131 3,14 130 3,28 130 2,91 120 2,93 Burundi 132 2,98 132 3,14 133 2,73 125 2,85 Zimbabwe 133 2,88 134 2,88 131 2,87 122 2,9 Chad 134 2,85 133 2,96 134 2,69 131 2,7 Upper-Middle Income Lower-Middle Income
Source: Porter and Schwab (2008)

40
Table A3. The components of the Technological Readiness pillar
Variable Measure 1. Availability of latest tech-nologies
In your country, the latest technologies are (1 = not widely available or used, 7 = widely available and used).
2. Firm-level technology absorption
Companies in your country are (1 = not able to absorb new technology, 7 = ag-gressive in absorbing new technology).
3. Laws relating to ICT (elec-tronic commerce, digital sig-natures)
Laws relating to the use of information technology are (1 = nonexistent, 7 = well developed and enforced).
4. FDI and technology trans-fer
Foreign direct investment in your coun-try (1 = brings little new technology, 7 = is an important source of new technol-ogy).
5. Mobile telephone subscri-bers
Mobile telephone subscribers per 100 population in 2006. Source: International Telecommunication Union, World Tele-communication Indicators (June 2008) and national sources.
6. Internet users
Internet users per 100 population in 2006. Source: International Telecom-munication Union, World Telecommuni-cation Indicators (June 2008) and na-tional sources.
7. Personal computers
Personal computers per 100 population in 2006. Source: International Telecom-munication Union, World Telecommuni-cation Indicators (June 2008) and na-tional sources.
8. Broadband Internet sub-scribers
Broadband Internet subscribers per 100 population in 2006. Source: International Telecommunication Union, World Tele-communication Indicators (June 2008) and national sources.
Source: Porter and Schwab (2008)
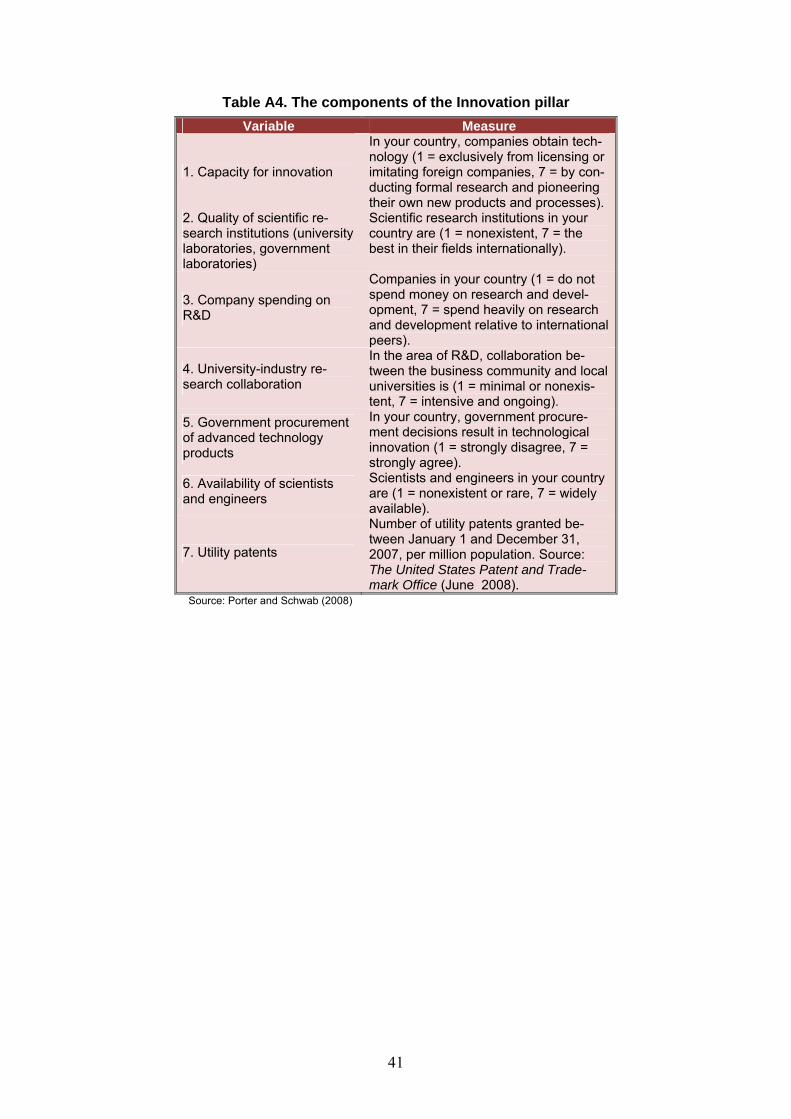
41
Table A4. The components of the Innovation pillar
Variable Measure
1. Capacity for innovation
In your country, companies obtain tech-nology (1 = exclusively from licensing or imitating foreign companies, 7 = by con-ducting formal research and pioneering their own new products and processes).
2. Quality of scientific re-search institutions (university laboratories, government laboratories)
Scientific research institutions in your country are (1 = nonexistent, 7 = the best in their fields internationally).
3. Company spending on R&D
Companies in your country (1 = do not spend money on research and devel-opment, 7 = spend heavily on research and development relative to international peers).
4. University-industry re-search collaboration
In the area of R&D, collaboration be-tween the business community and local universities is (1 = minimal or nonexis-tent, 7 = intensive and ongoing).
5. Government procurement of advanced technology products
In your country, government procure-ment decisions result in technological innovation (1 = strongly disagree, 7 = strongly agree).
6. Availability of scientists and engineers
Scientists and engineers in your country are (1 = nonexistent or rare, 7 = widely available).
7. Utility patents
Number of utility patents granted be-tween January 1 and December 31, 2007, per million population. Source: The United States Patent and Trade-mark Office (June 2008).
Source: Porter and Schwab (2008)
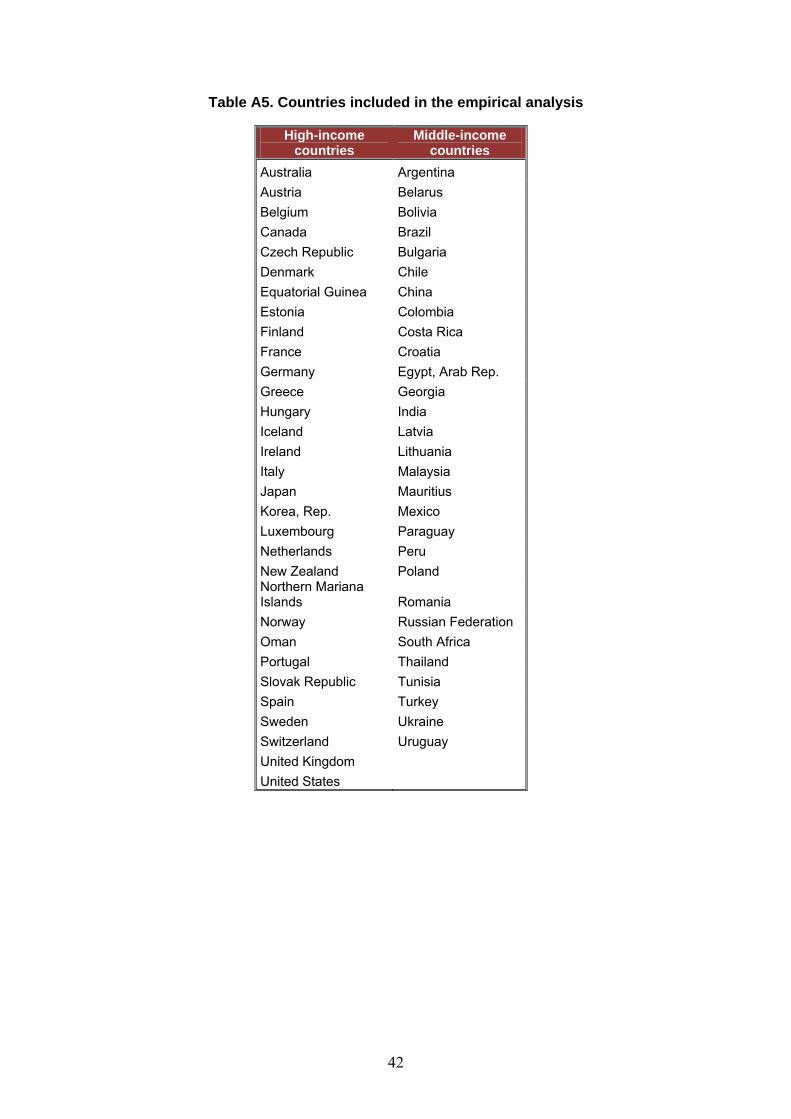
42
Table A5. Countries included in the empirical analysis
High-income countries
Middle-income countries
Australia Argentina Austria Belarus Belgium Bolivia Canada Brazil Czech Republic Bulgaria Denmark Chile Equatorial Guinea China Estonia Colombia Finland Costa Rica France Croatia Germany Egypt, Arab Rep. Greece Georgia Hungary India Iceland Latvia Ireland Lithuania Italy Malaysia Japan Mauritius Korea, Rep. Mexico Luxembourg Paraguay Netherlands Peru New Zealand Poland Northern Mariana Islands Romania Norway Russian Federation Oman South Africa Portugal Thailand Slovak Republic Tunisia Spain Turkey Sweden Ukraine Switzerland Uruguay United Kingdom
United States

43
Table A6. Descriptive statistics. Variables included in the model
High income Upper middle
income Lower middle
income
Mean Std. Dev/Mean Mean Std.
Dev/Mean Mean Std. Dev/Mean
High-technology exports (% of manu-factured exports)
17,62097 0,5432 9,4970 1,4278 7,7648 1,7649
FDI inward (Stock, %GDP) 37,02765 0,9200 36,8887 0,8688 34,3973 0,9869
FDI outward (Stock, %GDP) 28,89107 0,9495 10,0356 2,0404 1,5743 1,8029
Trade (% of GDP) 93,41928 0,5720 91,2971 0,4652 89,2526 0,4413Royalty and license fees, payments pc (current US$/1000hab)
201.175,71 3,1201 7.816,43 1,0225 4.985,84 2,2715
Research and devel-opment expenditure (% of GDP)
1,81561 0,4742 0,5411 0,4634 2,1482 3,4786
Total patents pc 0,00073 1,1505 0,0001 0,9131 0,0000 1,3894
Table A7. Correlations between high tech exports (as the percentage of total
manufacturing exports) and the variables included in the model
Total sample High income countries
Middle in-come coun-
tries Inward stock 0,0405 0,0974 0,2002*** Outward stock 0,2847*** 0,4631*** 0,2852* Openness 0,0286 0,1193* 0,1678 Royalties pay-ments 0,4330*** 0,5174** 0,2413**
R&D 0,4390*** 0,4929* 0,1436 Patents 0,5457*** 0,3328*** 0,3101***
*Significant at 10%; **Significant at 5%; Significant at 1%
44
Bibliographical references Aharoni, Y, Hirsch, S. (1997) “Enhancing competitive advantages in technological intensive industries” in J.H. Dunning and K.A. Hamdani, The new globalism and developing countries, United Nations University Press, Tokio, NY, Paris, pp 260-302 Agosin, M., Machado, R. (2005) Foreign investment in developing countries: Does it crowd in domestic investment? Oxford Development Studies, 33(2), pp. 149-162 Alonso, J.A. (2007) Cooperación con países de renta media, Editorial Complutense, Madrid Alvarez, I., Molero, J. (2005) “Technology and the generation of international spillovers: an application to Spanish manufacturing firms”, Research Policy, 34, 1440-1452 Alvarez, I., Magaña, G. (2007) “Capacidades tecnológicas en los países de renta media”, in Alonso, J.A. Co-operación con países de renta media, Editorial Complutense, Madrid Álvarez, I., Marín, R. (2008) FDI and World inequalities: The role of absorptive capabilities, ICEI Working Paper, WP06/08, Madrid Alvarez, I., Marín, R., Fonfría, A. (2009) The role of networking in the competitiveness of firms, Technologi-cal Forecasting & Social Change, 76 (2009) 410–421. Arellano, M., Bond, S. (1991) “Some tests of specification for panel data”, Journal of Econometrics, 59, 87-97 Arellano, M., Bover, O. (1995) “Another look at the instrumental variable estimation of error-components models”, Journal of Econometrics, 68, 29-51 Athreye, S., Cantwell, J. (2007) “Creating competition? Globalisation and the emergence of new technology producers”, Research Policy, 36,209-226 Bartlett, C. A., Ghoshal, S. (1998) Managing across borders: The transnational solution. Boston: Harvard Business School Press. Brouthers, L. E., O'Donnell, E., Hadjimarcou, J. (2005) Generic Product Strategies for Emerging Market Exports into Triad Nation Markets: A Mimetic Isomorphism Approach, Journal of Management Studies, 42, 207-225 Cantwell, J. (1989) Technological Innovation and Multinational Corporations, Basil Blackwell, Oxford Cantwell, J. (1995) The globalization of technology: What remains of the product cycle model?, Cambridge Journal of Economics, 19:1, 155-174 Cantwell, J. (2005) Innovation and competitiveness, in: J. Fagerberg, D. Mowery, R. Nelson (Eds.), The Ox-ford Handbook of Innovation, Oxford University Press, Oxford Cantwell, J. Molero, J. (2003) Multinational Enterprises, Innovative Strategies and Systems of Innovation, Edward Elgar, Cheltenham Castellacci, F. (2008) “Technology clubs, technology gaps and growth trajectories”, Structural Change and Economic Dynamics, 19(4), 301-314. Criscuolo, P., Narula, R. (2008) A novel approach to national technological accumulation and absorptive capacity: Aggregating Cohen and Levinthal, The European Journal of Development Research, 20(1), pp. 56-73 Dosi, G., Pavitt, K., Soete, L. (1990) The economics of technical change and international trade, Harvester Wheatsheaf, London Dunning, J.H. (1993) Multinational Enterprises and the Global Economy, Addison Weslay Pub. Co., New York

45
Dunning, J.H. (2006) “Towards a paradigm of development: implications for the determinants of interna-tional business activity”, Transnational Corporations, 15(1), 173-227 Durlauf, S.N., Jonson, P.A. (1995) “Multiple regimes and cross-country growth behaviour”, Journal of Ap-plied Econometrics, 10, 365-384 Fagerberg, J. (1996) Technology and competitiveness, Oxf. Rev. Econ. Policy 12, 39–51. Fagerberg, J., Srholec, M. (2007) National innovation systems, capabilities and economic development, Re-search Policy, 37, pp. 1417-1435 Fagerberg, J., Srholec, M (2008) Technology and development: Unpacking the relationship(s), TIK Working Papers on Innovation Studies No. 20080623, Centre for Technology, Innovation and Culture, University of Oslo, Oslo Freeman, C. (1987) Technology Policy and Economic Performance: Lessons from Japan, Pinter, London Frost, T. (2001) The geographic sources of Foreign Subsidiaries’ Innovations, Strategic Management Journal, 22, 101-123 Gerschenkron, A. (1962) Economic Backwardness in Historical perspective, Berlknap Press, Cambridge Mass. Hobday, M. (1995) Innovation in East Asia, Edward Elgar, Aldershot. Kaplinsky, R. (2000) Spreading the gains from globalisation: What can be learned from value chain analysis? Journal of Development Studies, 37(2), pp. 117-146. Katseli, L.T. (1997) “Investment, trade and International competitiveness” in J.H. Dunning and K.A. Ham-dani, The new globalism and developing countries, United Nations University Press, Tokio, NY, Paris, pp 181-215 Katz, J. (1982) Technology Generation in Latin American Manufacturing Industries. Pergamon Press, Oxford Kim, L. (1997) Imitation to Innovation: The Dynamics of Korea’s Technological Learning, Harvard Business School Press, Boston Kline, J., Rosenberg, N. (1986), “An Overview of Innovation”, in R. Landau and N. Rosenberg (eds), The Positive Sum Strategies: harnessing Technology for Economic Growth, National Academic Press, Washing-ton DC Krugman, P. (1994) Competitiveness: a dangerous obsession, Foreign Affairs 73, 28–44 Lall, S. (1996) Learning from the Asian Tigers. Macmillan, London. Lall, S. (1997) “Investment, technology and international competitiveness” in J.H. Dunning and K.A. Ham-dani, The new globalism and developing countries, United Nations University Press, Tokio, NY, Paris, pp 239-259 Lall, S. (2000) “Technological Change and Industrialization in the Asian Newly Industrializing Economies: Achievements and Challenges”, in Kim y Nelson, Technology, Learning & Innovation Experiences of Newly Industrializing Economies, Cambridge Lall, S. (2001) What Competitiveness is and why it is important, in S. Lall, Competitiveness, technology and skills, Edward Elgar, Cheltenham Lall S. (2002) “Implications of Cross-Border Mergers and Acquisitions by TNCs in Developing Countries: A Beginners’ Guide”, QEH Working Paper No. 88 Lall, S., Teubal, M. (1998) “Market-stimulating” technology policies in developing countries: A framework with examples from East Asia”, World Development, 26 (8), 1369-1385 Lundvall, B.A. (Ed.) (1992), National Systems of Innovation, Pinter Publishers, London.

46
Lundvall, B.A., Johnson, B., Andersen, E.S., Dalum, B. (2002) National systems of production, innovation and competence building, Research Policy 31, 213-231 McCann, P., Mudambi, R. (2005) “Analytical differences in the economics of geography: the case of the mul-tinational firm”, Environment and Planning A, 37, 1857- 1876. Mowery, D.C., Oxley, E. (1995) Inward technology transfer and competitiveness: the role of national innova-tion systems, Cambridge Journal of Economics, 19:1, 67-93 Mudambi, R. (2008) “Location, control and innovation in knowledge-intensive industries”, Journal of Eco-nomic Geography, 8, 699–725. Narula, R. (1996) Multinational Investments and Economic Structure, Routledge, London. Narula, R. (2004) “R&D collaboration by SMEs: new opportunities and limitations in the face of globalisa-tion”, Technovation, 24, 153-161. Narula, R., Dunning, J.H. (2000) “Industrial development, globalisation and multinational enterprises: new realities for developing countries”, Oxford Development Studies, 28(2), 141-167 Narula, R., Dunning, J.H. –forthcoming- Multinational enterprises, development and globalisation: Some clarifications and a research agenda Narula, R. and Wakelin, K. (1995) ‘Technological competitiveness, trade and foreign direct investment’, Research Memorandum, 2/95 - 019, MERIT, Maastricht. Nelson, R. (1993) National innovation systems: a comparative analysis, Oxford University Press, Oxford. Ozawa, T. (1992) Foreign direct investment and economic development, Transnational Corporation, vol. 1, No 1, 27-54 Piscitello, L. (2004), Corporate diversification, coherence and economic performance. Industrial and Corpo-rate Change 13 (5), 757-787 Porter, M.E. (1985) Competitive Advantage, Free Press, New York, 1985 Porter, M. E. (1990) The Competitive Advantage of Nations, New York: Free Press Porter, M.E., Delgado, M., Ketels, C., Stern, S. (2008) “Moving to a new global competitiveness index”, in Porter, Michael and Schwab, Klaus (2008) The global competitiveness report 2008-2009, World Economic Forum. www.weforum.org Porter, M.E., Schwab, K. (2008) The global competitiveness report 2008-2009, World Economic Forum. www.weforum.org Rasiah, R. (2003) ”Foreign ownership, technology and electronics exports from Malaysia and Thailand”, Journal of Asian Economics, 14, 785-811 Rodrik, D. (1996) Coordination failures and government policy: a model with applications to East Asia and Eastern Europe, Journal of International Economics, 40, 1-22 Rodrik, D. (1999) The New Global Economy and developing countries: Making Openness Work, Policy Essay no. 24, Overseas Development Council, Washington Roessner, J.D., Porter, A.L., Newman, N., Cauffiel, D. (1996) Anticipating the future high-tech competitive-ness of nations: indicators for twenty-eight countries, Technol.Forecast. Soc. Change 51, 133–149. Rugman, A.M., Doh, J.P. (2008) Multinationals and development, Yale University Press, New Haven and London Rugman, A.M., Verbeke, A. (2001) “Location, Competitiveness and the Multinational Enterprise” in: A.M.
47
Rugman and T.L. Brewer (Eds.), The Oxford Handbook of International Business, Oxford University Press, Oxford Sala-I-Martin, X., Blanke, J., Drzeniek, M., Geiger, T., Mia, I., Paua, F. (2008) The global competitiveness index: prioritizing the economic policy agenda, in Porter, Michael and Schwab, Klaus., The global competi-tiveness report 2008-2009, World Economic Forum. www.weforum.org Schwab, K. (2008) Preface, in Porter, Michael and Schwab, Klaus (2008) The global competitiveness report 2008-2009, World Economic Forum. www.weforum.org Singh, J. (2007) Asymmetry of knowledge spillovers between MNCs and host country firms, Journal of In-ternational Business Studies, 38, 764-786 Teece, D. (1977) “Technology transfer by multinational firms: the resoure cost of transferring technological know-how”, The Economic Journal, 87,242-262 Uchida, Y., Cook, P. (2005) The Transformation of Competitive Advantage in East Asia: An Analysis of Technological and Trade Specialization, World Development, Vol. 33, Issue 5, May 2005, Pages 701-728 UNCTAD (2005) World Investment Report Transnational Corporations and the Internationalization of R&D, United Nations, New York and Geneva. UNCTAD (2007) World Investment Report Transnational Corporations, Extractive Industries and develop-ment, United Nations, New York and Geneva. Von Hippel, E. (1988) The sources of innovation, Oxford University Press, Oxford. Yang, Q., Mudambi, R., Meyer, K.E. (2008) “Conventional and Reverse Knowledge Flows in Multinational Corporations”, Journal of Management –forthcoming 2008.

48
Últimos títulos publicados
DOCUMENTOS DE TRABAJO “EL VALOR ECONÓMICO DEL ESPAÑOL” DT 13/08 de Diego Álvarez, Dorotea; Rodrigues-Silveira, Rodrigo; Carrera Troyano Miguel: Estrate-
gias para el Desarrollo del Cluster de Enseñanza de Español en Salamanca DT 12/08 Quirós Romero, Cipriano: Lengua e internacionalización: El papel de la lengua en la inter-
nacionalización de las operadoras de telecomunicaciones. DT 11/08 Girón, Francisco Javier; Cañada, Agustín: La contribución de la lengua española al PIB y al
empleo: una aproximación macroeconómica. DT 10/08 Jiménez, Juan Carlos; Narbona, Aranzazu: El español en el comercio internacional. DT 09/07 Carrera, Miguel; Ogonowski, Michał: El valor económico del español: España ante el espejo
de Polonia. DT 08/07 Rojo, Guillermo: El español en la red. DT 07/07 Carrera, Miguel; Bonete, Rafael; Muñoz de Bustillo, Rafael: El programa ERASMUS en el
marco del valor económico de la Enseñanza del Español como Lengua Extranjera. DT 06/07 Criado, María Jesús: Inmigración y población latina en los Estados Unidos: un perfil socio-
demográfico. DT 05/07 Gutiérrez, Rodolfo: Lengua, migraciones y mercado de trabajo. DT 04/07 Quirós Romero, Cipriano; Crespo Galán, Jorge: Sociedad de la Información y presencia del
español en Internet. DT 03/06 Moreno Fernández, Francisco; Otero Roth, Jaime: Demografía de la lengua española. DT 02/06 Alonso, José Antonio: Naturaleza económica de la lengua. DT 01/06 Jiménez, Juan Carlos: La Economía de la lengua: una visión de conjunto. WORKING PAPERS WP 08/09 Álvarez, Isabel; Marín, Raquel; Maldonado, Georgina: Internal and external factors of com-
petitiveness in the middle-income countries. WP 07/09 Minondo, Asier: Especialización productiva y crecimiento en los países de renta media. WP 06/09 Martín, Víctor; Donoso Vicente: Selección de mercados prioritarios para los Países de Renta
Media. WP 05/09 Donoso, Vicente; Martín, Víctor: Exportaciones y crecimiento económico: estudios empíri-
cos. WP 04/09 Minondo, Asier; Requena, Francisco: ¿Qué explica las diferencias en el crecimiento de las
exportaciones entre los países de renta media? WP 03/09 Alonso, José Antonio; Garcimartín, Carlos: The Determinants of Institutional Quality. More
on the Debate. WP 02/09 Granda, Inés; Fonfría, Antonio: Technology and economic inequality effects on interna-
tional trade.

49
WP 01/09 Molero, José; Portela, Javier y Álvarez Isabel: Innovative MNEs’ Subsidiaries in different domestic environments.
WP 08/08 Boege, Volker; Brown, Anne; Clements, Kevin y Nolan Anna: ¿Qué es lo “fallido”? ¿Los
Estados del Sur,o la investigación y las políticas de Occidente? Un estudio sobre órdenes políticos híbridos y los Estados emergentes.
WP 07/08 Medialdea García, Bibiana; Álvarez Peralta, Nacho: Liberalización financiera internacional,
inversores institucionales y gobierno corporativo de la empresa WP 06/08 Álvarez, Isabel; Marín, Raquel: FDI and world heterogeneities: The role of absorptive ca-
pacities
WP 05/08 Molero, José; García, Antonio: Factors affecting innovation revisited
WP 04/08 Tezanos Vázquez, Sergio: The Spanish pattern of aid giving
WP 03/08 Fernández, Esther; Pérez, Rafaela; Ruiz, Jesús: Double Dividend in an Endogenous Growth Model with Pollution and Abatement
WP 02/08 Álvarez, Francisco; Camiña, Ester: Moral hazard and tradeable pollution emission permits. WP 01/08 Cerdá Tena, Emilio; Quiroga Gómez, Sonia: Cost-loss decision models with risk aversion.
WP 05/07 Palazuelos, Enrique; García, Clara: La transición energética en China.
WP 04/07 Palazuelos, Enrique: Dinámica macroeconómica de Estados Unidos: ¿Transición entre dos recesiones?
WP 03/07 Angulo, Gloria: Opinión pública, participación ciudadana y política de cooperación en Es-paña.
WP 02/07 Luengo, Fernando; Álvarez, Ignacio: Integración comercial y dinámica económica: España ante el reto de la ampliación.
WP 01/07 Álvarez, Isabel; Magaña, Gerardo: ICT and Cross-Country Comparisons: A proposal of a new composite index.
WP 05/06 Schünemann, Julia: Cooperación interregional e interregionalismo: una aproximación so-cial-constructivista.
WP 04/06 Kruijt, Dirk: América Latina. Democracia, pobreza y violencia: Viejos y nuevos actores. WP 03/06 Donoso, Vicente; Martín, Víctor: Exportaciones y crecimiento en España (1980-2004):
Cointegración y simulación de Montecarlo.
WP 02/06 García Sánchez, Antonio; Molero, José: Innovación en servicios en la UE: Una aproximación a la densidad de innovación y la importancia económica de los innovadores a partir de los datos agregados de la CIS3.
WP 01/06 Briscoe, Ivan: Debt crises, political change and the state in the developing world. WP 06/05 Palazuelos, Enrique: Fases del crecimiento económico de los países de la Unión Europea–
15.
WP 05/05 Leyra, Begoña: Trabajo infantil femenino: Las niñas en las calles de la Ciudad de México. WP 04/05 Álvarez, Isabel; Fonfría, Antonio; Marín Raquel: The role of networking in the competitive-
ness profile of Spanish firms.
WP 03/05 Kausch, Kristina; Barreñada, Isaías: Alliance of Civilizations. International Security and Cosmopolitan Democracy.
WP 02/05 Sastre, Luis: An alternative model for the trade balance of countries with open economies: the Spanish case.

50
WP 01/05 Díaz de la Guardia, Carlos; Molero, José; Valadez, Patricia: International competitiveness in services in some European countries: Basic facts and a preliminary attempt of interpreta-tion.
WP 03/04 Angulo, Gloria: La opinión pública española y la ayuda al desarrollo. WP 02/04 Freres, Christian; Mold, Andrew: European Union trade policy and the poor. Towards im-
proving the poverty impact of the GSP in Latin America. WP 01/04 Álvarez, Isabel; Molero, José: Technology and the generation of international knowledge
spillovers. An application to Spanish manufacturing firms.
POLICY PAPERS PP 02/09 Carrasco Gallego ,José Antonio: La Ronda de Doha y los países de renta media. PP 01/09 Rodríguez Blanco, Eugenia: Género, Cultura y Desarrollo: Límites y oportunidades para el
cambio cultural pro-igualdad de género en Mozambique. PP 04/08 Tezanos, Sergio: Políticas públicas de apoyo a la investigación para el desarrollo. Los casos
de Canadá, Holanda y Reino Unido
PP 03/08 Mattioli, Natalia Including Disability into Development Cooperation. Analysis of Initiatives
by National and International Donors PP 02/08 Elizondo, Luis: Espacio para Respirar: El humanitarismo en Afganistán (2001-2008). PP 01/08 Caramés Boada, Albert: Desarme como vínculo entre seguridad y desarrollo. La reintegra-
ción comunitaria en los programas de Desarme, desmovilización y reintegración (DDR) de combatientes en Haití.
PP 03/07 Guimón, José: Government strategies to attract R&D-intensive FDI. PP 02/07 Czaplińska, Agata: Building public support for development cooperation. PP 01/07 Martínez, Ignacio: La cooperación de las ONGD españolas en Perú: hacia una acción más
estratégica.
PP 02/06 Ruiz Sandoval, Erika: Latinoamericanos con destino a Europa: Migración, remesas y codesa-rrollo como temas emergentes en la relación UE-AL.
PP 01/06 Freres, Christian; Sanahuja, José Antonio: Hacia una nueva estrategia en las relaciones Unión Europea – América Latina.
PP 04/05 Manalo, Rosario; Reyes, Melanie: The MDGs: Boon or bane for gender equality and wo-men’s rights?
PP 03/05 Fernández, Rafael: Irlanda y Finlandia: dos modelos de especialización en tecnologías avan-zadas.
PP 02/05 Alonso, José Antonio; Garcimartín, Carlos: Apertura comercial y estrategia de desarrollo.
PP 01/05 Lorente, Maite: Diálogos entre culturas: una reflexión sobre feminismo, género, desarrollo y mujeres indígenas kichwuas.
PP 02/04 Álvarez, Isabel: La política europea de I+D: Situación actual y perspectivas. PP 01/04 Alonso, José Antonio; Lozano, Liliana; Prialé, María Ángela: La cooperación cultural espa-
ñola: Más allá de la promoción exterior.