investor day - nexans.com · the current strategic plan, ... this should allow for external growth...
TRANSCRIPT

NexansInvestor DayDecember 13, 2017

Disclaimer
Paced For Growth 2018-20222
The current strategic plan, the current 2017 outlook, and all initiatives mentioned withinthis document are based on assumptions and hypothetical scenarios. Theseassumptions and scenarios are exposed to all risk factors described in the 2016Financial statements and Registration document of the Group. Moreover, certainprojects considered in the current strategic plan will be further analyzed prior to decidingtheir implementation, and when needed, those decisions will be submitted to relevantlegal bodies.
Executive summary
Paced For Growth 2018-20223
Meeting tomorrow’s challenges today
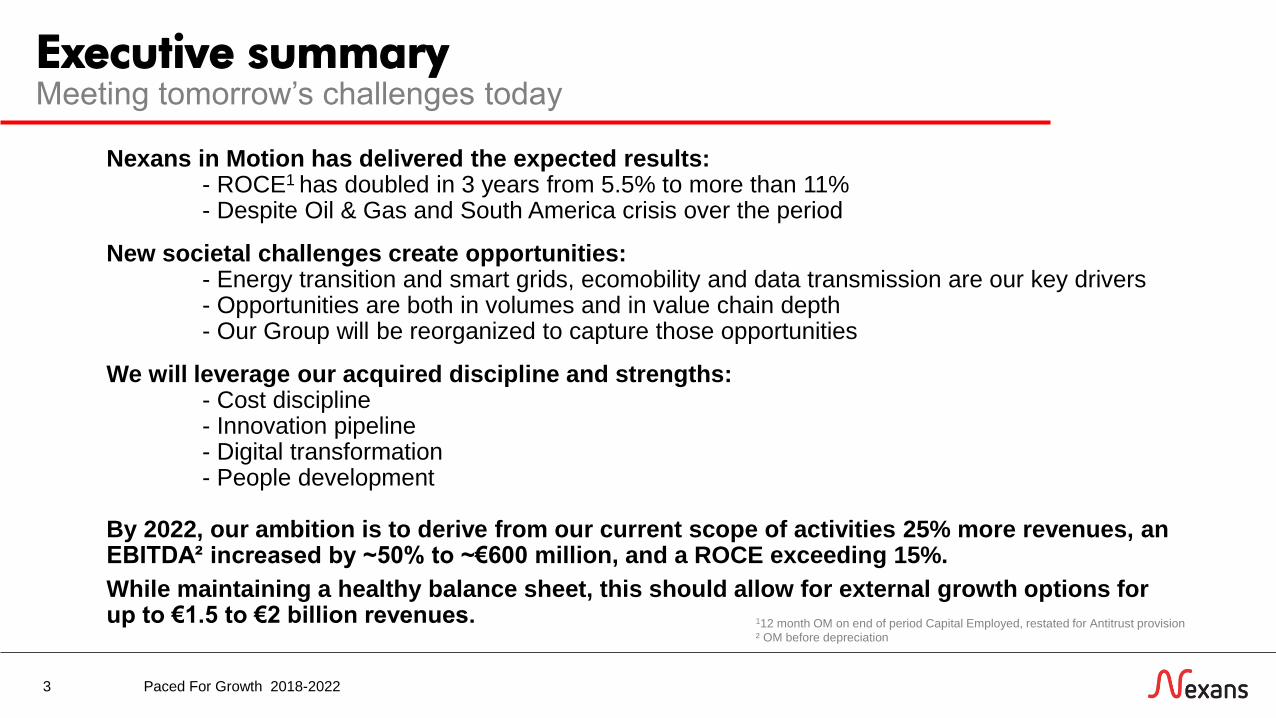
Nexans in Motion has delivered the expected results:- ROCE1 has doubled in 3 years from 5.5% to more than 11%- Despite Oil & Gas and South America crisis over the period
New societal challenges create opportunities:- Energy transition and smart grids, ecomobility and data transmission are our key drivers- Opportunities are both in volumes and in value chain depth- Our Group will be reorganized to capture those opportunities
We will leverage our acquired discipline and strengths:- Cost discipline- Innovation pipeline- Digital transformation- People development
By 2022, our ambition is to derive from our current scope of activities 25% more revenues, an EBITDA² increased by ~50% to ~€600 million, and a ROCE exceeding 15%.
While maintaining a healthy balance sheet, this should allow for external growth options for up to €1.5 to €2 billion revenues. 112 month OM on end of period Capital Employed, restated for Antitrust provision
² OM before depreciation

Agenda
4
Enablers & Actions
Ambition 2022
FinancialsBusiness Ambitions
Intro Conclusion
Paced for Growth 1. Building & Territories
2. High Voltage & Projects
3. Telecom & Data
4. Industry & Solutions
5. Beyond cables
1. Innovation, Digital & Sales
2. Costs competitiveness & Operational efficiency
3. Organization & People
1. Purpose
2. Nexans in Motion: Key learnings
3. Vision
Paced For Growth 2018-2022

Intro
5
1 Purpose
2 Nexans in Motion 2015-2017
3 Vision
Paced For Growth 2018-2022

By bringing energy and information to life, we are the critical link
6
OUR EXPERTISE
Cable maker
Producing cables, we are the material
link at the heart of industry with
high performance characteristics
developed through constant
innovation for over 120 years.
OUR MISSION
Beyond cables
Our systems deliver energy & data,
building the essential link that
transports information & power
everywhere to everyone.
OUR PURPOSE
Life link
Our purpose is to support
development, social contacts through
essential links. Without us, there can
be no communities, exchanges,
communications, energy,
modern life.
Paced For Growth 2018-2022
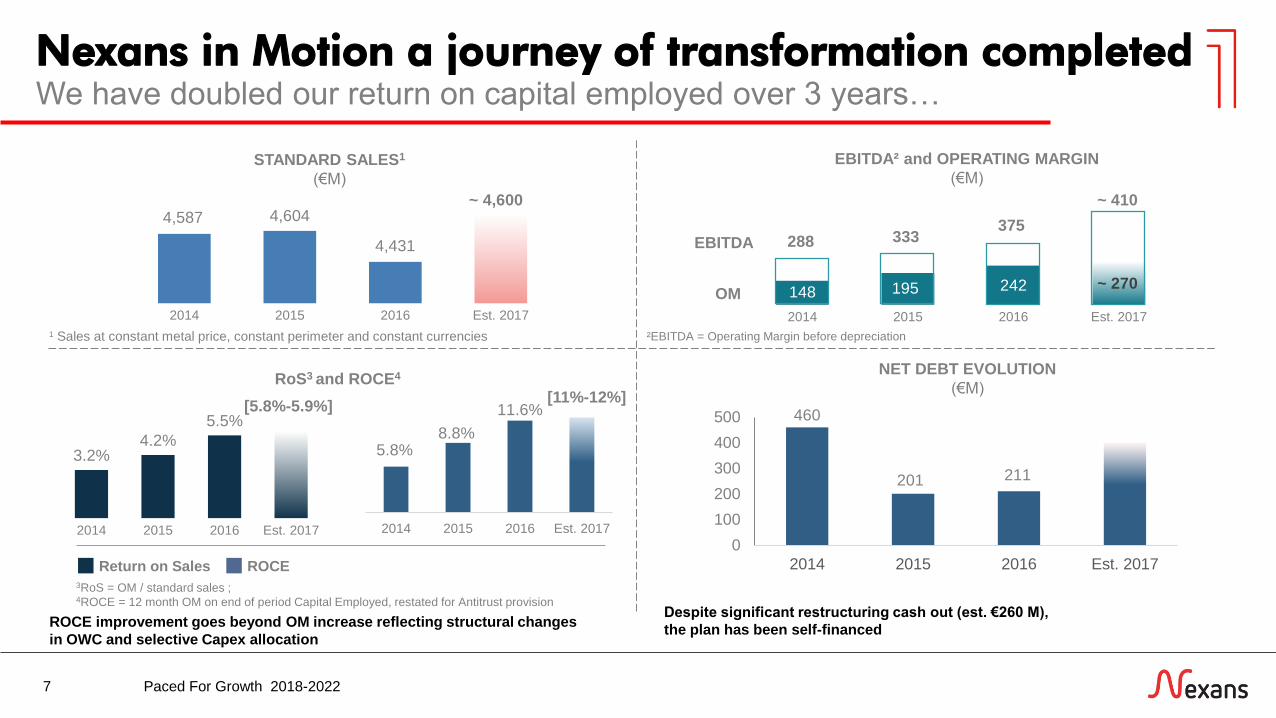
STANDARD SALES1
(€M)
Nexans in Motion a journey of transformation completed
7
We have doubled our return on capital employed over 3 years…
RoS3 and ROCE4
~ 4,600
[5.8%-5.9%][11%-12%]
148 195 242
2014 2015 2016 Est. 2017
3RoS = OM / standard sales ; 4ROCE = 12 month OM on end of period Capital Employed, restated for Antitrust provision
3.2%4.2%
5.5%
2014 2015 2016 Est. 2017
Despite significant restructuring cash out (est. €260 M),
the plan has been self-financed
NET DEBT EVOLUTION
(€M)
Return on Sales ROCE
EBITDA² and OPERATING MARGIN
(€M)
EBITDA375
~ 410
333288
~ 270OM
ROCE improvement goes beyond OM increase reflecting structural changes
in OWC and selective Capex allocation
460
201 211
0
100
200
300
400
500
2014 2015 2016 Est. 2017
1 Sales at constant metal price, constant perimeter and constant currencies
5.8%8.8%
11.6%
2014 2015 2016 Est. 2017
4,587 4,604
4,431
2014 2015 2016 Est. 2017
²EBITDA = Operating Margin before depreciation
Paced For Growth 2018-2022

CO
RE
CH
AN
GE
S
Delivering on turnaround
8
…offsetting price cost squeeze through transformation focus
2014 2017
Rationalized footprint:
– Turnaround Europe:
industrial cables’
rationalization
– Optimization of footprint in
China and Australia
– Portfolio adjustments:
Sell: Argentina, Russia;
Closed: Elm City
Support functions
Europe (SHAPE):
– Footprint optimization
in Utilities
– Reduction of indirect
costs in plants
– Redesign of support
functions: e.g. finance,
purchasing, IS, HR
Product Customer
Optimization initiatives
(SHIFT):
– SHIFT in Europe
– Product Customer
Optimization across
multiple geographies:
MERA, SAM, NAM
Innovation:
– Expansion of production
capabilities in HV, incl. MI
capacity (Halden) and
XLPE developments
– Cable dynamic designs for
floating wind turbines
– Improved safety with
Fire retardant cables
▪ Significant impact of the O&G and mining crises, with est. €50 M operating margin toll from 2014 to 2017, mostly outside of Europe
▪ Adverse events in South America
In a challenging environment:
▪ Significant Price Cost Squeeze impact of est. €75 M p.a.
EN
VIR
ON
ME
NT
Paced For Growth 2018-2022

The world is changing
9
Megatrends are creating new business opportunities…
Innovation acceleration
Evolving consumption
New governance model
Resource constraintsEconomic globalization
Bu
sin
es
s O
pp
ort
un
itie
sfo
r N
ex
an
s
Speed of Change
Energyrevolution
Urbanization &densification
Smart devices &infrastructures
Rise of digital
disruptors
Life sciences
booming
Health and
Wellness
Homing
War for
talents
IndustrySelective
deindustrializationPublic debt
crisis
Anxiety
Natural
disasters
Ageing
society
Low cost/Premiumpolarization
Changing balance of economic power
Rise of Asian & African
middleclass
Growing
world
populatio
n
Digital & Data
Usageeconomy
Globalmobility
Operations
Cable and connectivity production
Evolution of the Energy &
Data Management market€BN, 2015-2030
2020 2025 20302015
System ManagementAsset Management
Cable Services
+9.2%
+2.8%
+4.1%
+3.9%
+3.9%
CAGR
2015-2030
Ecosystem atrisk
Gender gap decreaseNew social network
Autonomous vehicles
Scarcity of natural
ressources
5.6
0
Paced For Growth 2018-2022
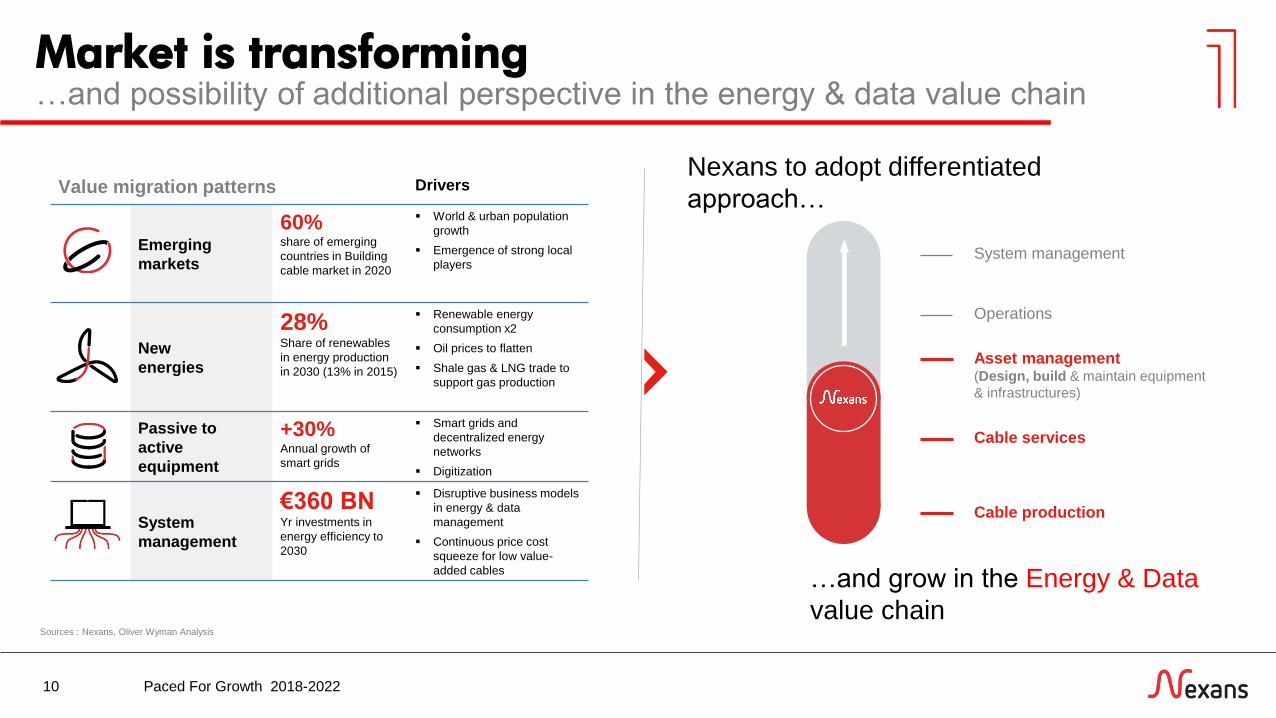
Market is transforming
10
…and possibility of additional perspective in the energy & data value chain
Sources : Nexans, Oliver Wyman Analysis
Value migration patterns Drivers
Emerging
markets
60%share of emerging
countries in Building
cable market in 2020
World & urban population
growth
Emergence of strong local
players
New
energies
28%Share of renewables
in energy production
in 2030 (13% in 2015)
Renewable energy
consumption x2
Oil prices to flatten
Shale gas & LNG trade to
support gas production
Passive to
active
equipment
+30%Annual growth of
smart grids
Smart grids and
decentralized energy
networks
Digitization
System
management
€360 BNYr investments in
energy efficiency to
2030
Disruptive business models
in energy & data
management
Continuous price cost
squeeze for low value-
added cables…and grow in the Energy & Data
value chain
Nexans to adopt differentiated
approach…
Cable production
Cable services
Asset management(Design, build & maintain equipment
& infrastructures)
Operations
System management
Paced For Growth 2018-2022

Aligning Nexans with customers
11
Capturing market opportunities implies a new business structure
Building & TerritoriesProvide reliable cabling and
smarter energy solutions to
support buildings and territories
to become more efficient,
livable and sustainable
High Voltage & ProjectsSupport customers from the
beginning (design, engineering,
funding, asset management) to
the end (system management)
in finding the right cable system
solution to address their
efficiency and reliability
challenges
Telecom & DataHelp customers to easily
deploy optical fiber
infrastructure with “plug-and-
play” cable, connectivity and
solutions
Industry & SolutionsSupport OEMs and industrial
infrastructure projects in
customizing their cabling &
connectivity solutions
addressing their electrification,
digitalization and automation
challenges
Paced For Growth 2018-2022
Paced for GrowthAmbition 2022
12 Paced For Growth 2018-2022
”
>15% ROCE3
Inorganic growth
up to
€1.5 - 2 BNsupporting
megatrends
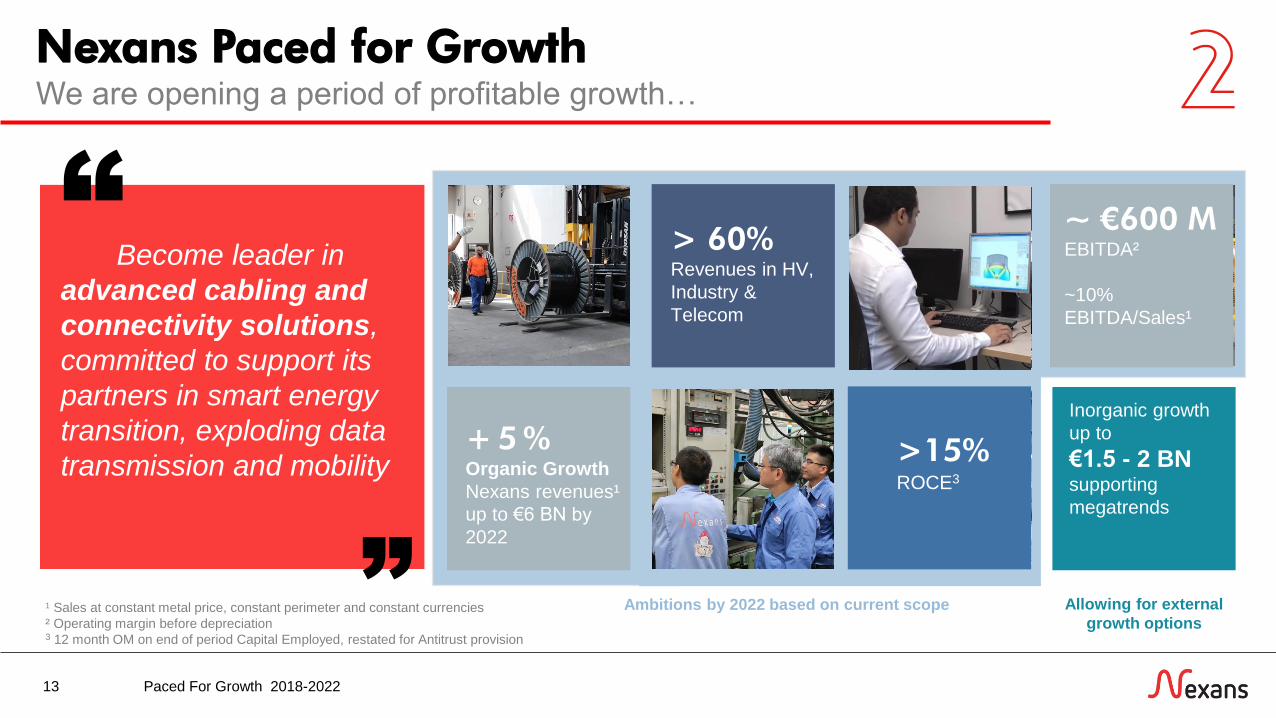
Nexans Paced for Growth
13
We are opening a period of profitable growth…
Become leader in
advanced cabling and
connectivity solutions,
committed to support its
partners in smart energy
transition, exploding data
transmission and mobility
“ ~ €600 MEBITDA²
~10%
EBITDA/Sales¹
+ 5 % Organic Growth
Nexans revenues¹
up to €6 BN by
2022
> 60% Revenues in HV,
Industry &
Telecom
1 Sales at constant metal price, constant perimeter and constant currencies
² Operating margin before depreciation3 12 month OM on end of period Capital Employed, restated for Antitrust provision
Ambitions by 2022 based on current scope Allowing for external
growth options
Paced For Growth 2018-2022

Paced for Growth: Driving shareholder value
14
…supported by a three axis strategy…
Focus investments on selected
areas with high returns and
promising business prospects.
For mature businesses, focus
on efficiency and lean efforts
to drive competitiveness,
from production to support
areas to erase price cost
squeeze
Develop new offers in the
solution space and accelerate
M&A
Continue to focus on cost
leadership
Build on strengths in
attractive markets
Accelerate growth through portfolio
of activities
C
A B
while respecting all stakeholders and CSR engagements
Paced For Growth 2018-2022
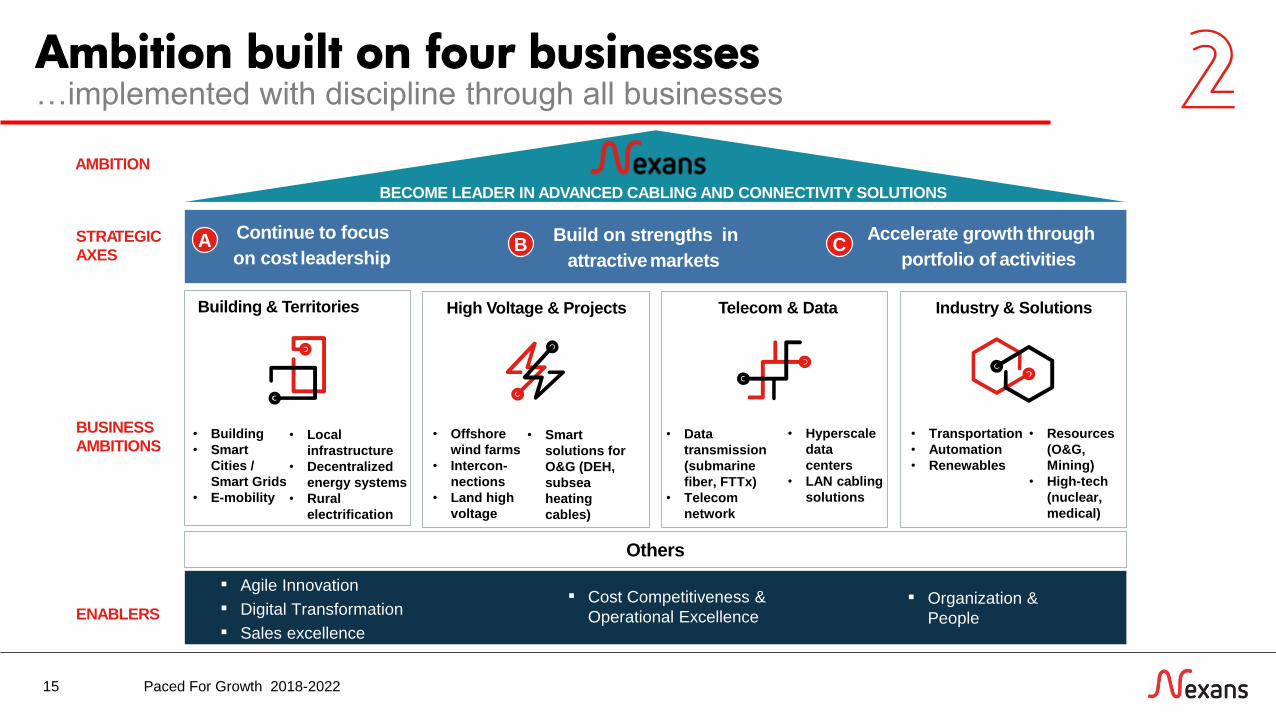
Ambition built on four businesses
15
…implemented with discipline through all businesses
▪ Innovation▪ Organization &
Agility
▪ Digital
Technology
Continue to focus
on cost leadership
Build on strengths in
attractivemarkets
Accelerate growth through
portfolio of activities
STRATEGIC AXES
BECOME LEADER IN ADVANCED CABLING AND CONNECTIVITY SOLUTIONS
BUSINESS AMBITIONS
ENABLERS
Others
AMBITION
Building & Territories
CA B
▪ Organization &
People
▪ Cost Competitiveness &
Operational Excellence
▪ Agile Innovation
▪ Digital Transformation
▪ Sales excellence
High Voltage & Projects Telecom & Data Industry & Solutions
• Local
infrastructure
• Decentralized
energy systems
• Rural
electrification
• Building
• Smart
Cities /
Smart Grids
• E-mobility
• Offshore
wind farms
• Intercon-
nections
• Land high
voltage
• Smart
solutions for
O&G (DEH,
subsea
heating
cables)
• Data
transmission
(submarine
fiber, FTTx)
• Telecom
network
• Hyperscale
data
centers
• LAN cabling
solutions
• Transportation
• Automation
• Renewables
• Resources
(O&G,
Mining)
• High-tech
(nuclear,
medical)
Paced For Growth 2018-2022
Business ambitions
16
1 Building & Territories
2 High Voltage & Projects
3 Telecom & Data
4 Industry & Solutions
5 Beyond cables
.
Paced For Growth 2018-2022
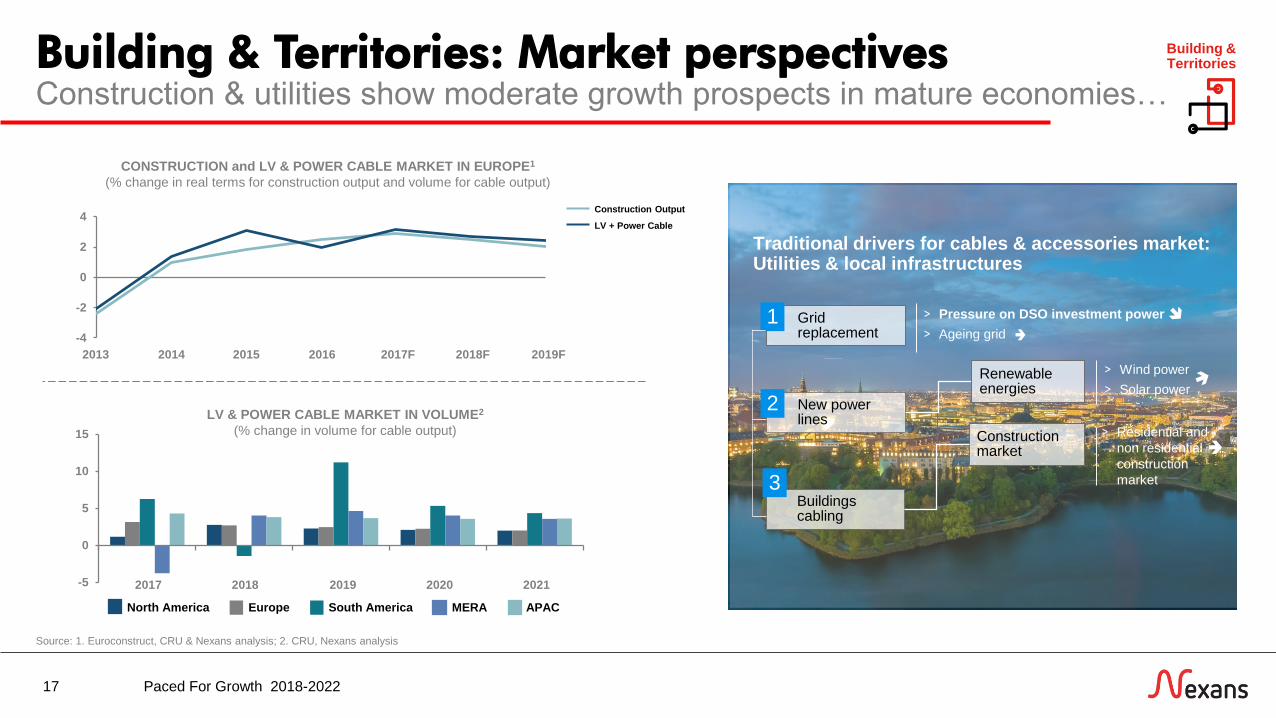
Building & Territories: Market perspectives
17
Construction & utilities show moderate growth prospects in mature economies…
Building & Territories
Source: 1. Euroconstruct, CRU & Nexans analysis; 2. CRU, Nexans analysis
-4
-2
0
2
4
20162015 2018F20142013 2019F2017F
Construction Output
LV + Power Cable
CONSTRUCTION and LV & POWER CABLE MARKET IN EUROPE1
(% change in real terms for construction output and volume for cable output)
LV & POWER CABLE MARKET IN VOLUME2
(% change in volume for cable output)
-5
0
5
10
15
20212017 20192018 2020
APACMERANorth America South AmericaEurope
Traditional drivers for cables & accessories market:Utilities & local infrastructures
New power lines
Grid replacement
1
2
> Pressure on DSO investment power
> Ageing grid
Construction market
Renewable energies
> Wind power
> Solar power
> Residential and
non residential
construction
market
Buildings cabling
3
Paced For Growth 2018-2022

Growth will come from new markets
18
…but future challenges are creating new opportunities
Building & Territories
Sources: 1.World Energy Investment Outlook, IEA, 2016; 2. TechNavio Analysis; 3. Bloomberg New Energy Finance
9630
70
382
118
278
APAC EMEA AM
GLOBAL IOT MARKET BY GEO2
$BN, 2014 vs. 2019
20192014
629
11232
234 268
APAC MERA SAM NAM Europe
PV SOLAR INVESTMENT BY GEO1
$BN, 2014-2035
Shift in city infrastructure
and smart buildings
CUMULATIVE NUMBER OF
PUBLIC EV CHARGING POINTS3
Thousand units installed, 2011-2016
28
98137 151
225
363
2011 2012 2013 2014 2015 2016
Changing topology of the
Grid MV and LV networksBooming integration of e-mobility
in the local infrastructures
Source: Oliver Wyman Analysis Source: CENEX
Decentralized
power generation
Source: Nexans, desk research, Roland Berger
Paced For Growth 2018-2022
Continue to focus on cost
leadership
Build on strengths in
attractive markets
Accelerate growth through portfolio
of activities
C
A B
Building & Territories: Paced for Growth
19
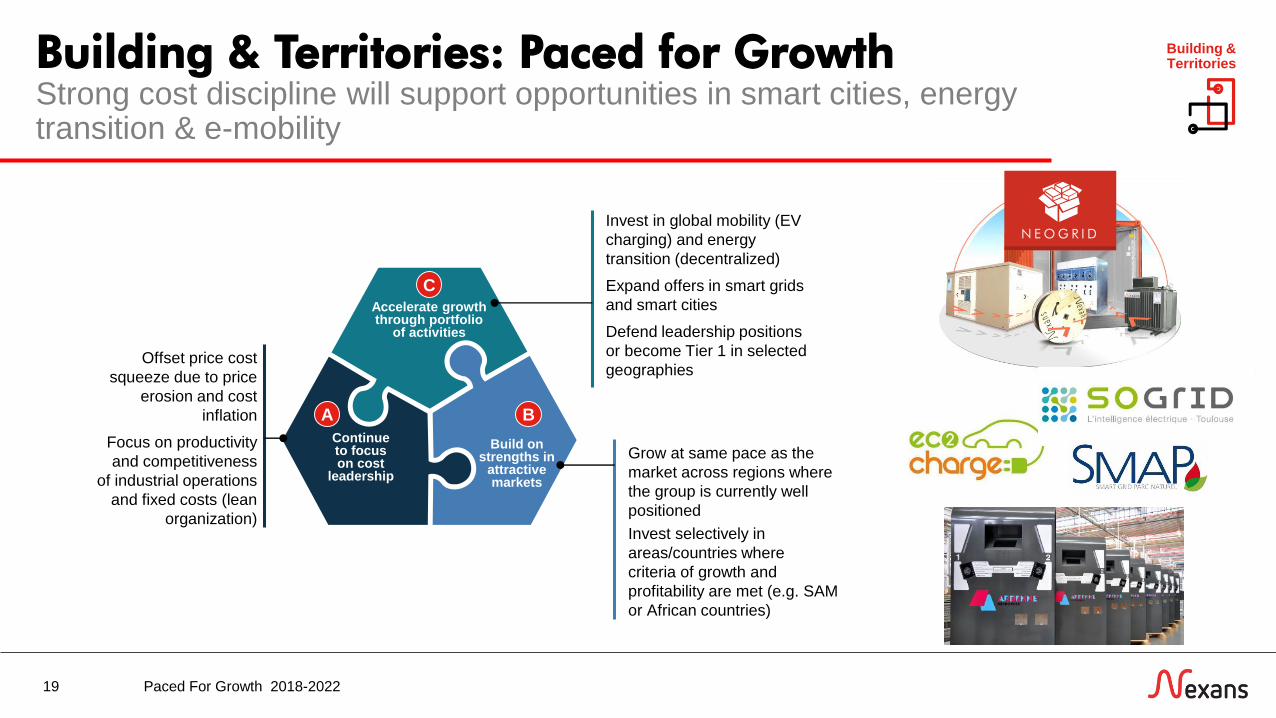
Strong cost discipline will support opportunities in smart cities, energy transition & e-mobility
Building & Territories
Grow at same pace as the
market across regions where
the group is currently well
positioned
Invest selectively in
areas/countries where
criteria of growth and
profitability are met (e.g. SAM
or African countries)
Offset price cost
squeeze due to price
erosion and cost
inflation
Focus on productivity
and competitiveness
of industrial operations
and fixed costs (lean
organization)
Invest in global mobility (EV
charging) and energy
transition (decentralized)
Expand offers in smart grids
and smart cities
Defend leadership positions
or become Tier 1 in selected
geographies 17%
N EOG R I D
Paced For Growth 2018-2022

Building & Territories: Key Financials
20
Leaner operations & market leadership will drive performance
Building & Territories
1 Sales at constant metal price, constant perimeter and constant currencies
² 12 month OM on end of period Capital Employed, restated for Antitrust provision3 OM before depreciation
• Nexans performs far better in countries where it holds tier 1 position
• Overall B&T performance will be improved with targeted actions in
competitiveness, leaner operations and increased market leadership
(pricing, differentiation and logistics)
2017 Est.Ambition
2022
Sales (€BN) ~1.75 ~ 2.0
Ogranic growth (5 years CAGR) ~ 2.5%
EBITDA3 / Sales > 7% ~ 9.5%
CAPEX / Depreciation 100% 100%
Key Figures1
Key Performance levers
0
ROCE²
Sa
les / C
E
RoS0
Un
de
rperf
orm
ers
Tra
din
g
Market leaders
0A
Focus on Cost
leadership
B
Build on
strengths in
attractive
markets
C
Accelerate
growth through
portfolio of
activities
Price Cost
Squeeze
Impact +++ + + ---
Paced For Growth 2018-2022
Business ambitions
21
.
1 Building & Territories
2 High Voltage & Projects
3 Telecom & Data
4 Industry & Solutions
5 Beyond cables
Paced For Growth 2018-2022

High Voltage & Projects: Market perspectivesEnergy transition in Europe, NAM & APAC will drive growth…
22
High Voltage & Projects
Key macro-indicators and trends
GLOBAL MARKET SALES OF HV CABLES1
€BN, 2017-2022
17
26+9% p.a.
11%
8%
Submarine HV Land HV XX CAGR
2017 2022
Source: 1. McKinsey analysis; Technavio Industry report; 2. World Energy Investment Outlook, IEA, 2016; 3. Bloomberg New Energy Finance, 2017; 4. IEA 2017 World Energy Investment
OFFSHORE WIND INVESTMENTS2
$BN, 2014-2035
HVDC TRANSMISSION & INTERCONNECTOR
PROJECTS (by status and commissioning yr)3
KM, 2017-2022
Announced Permitted
2017 2018 2019 2020 2021 2022
3,237
13,917
5,5785,159
1,732
212
14 9
94
231
APAC MEA SAM NAM Europe
WORLD UPSTREAM O&G INVESTMENTS4
$BN, 2011-2017
Upstream O&G investment
Exploration % of total (right axis)
0
200
400
600
800
1000
10%
12%
14%
16%
18%
20%
2011 2012 2013 2014 2015 2016 2017
5,268
Paced For Growth 2018-2022
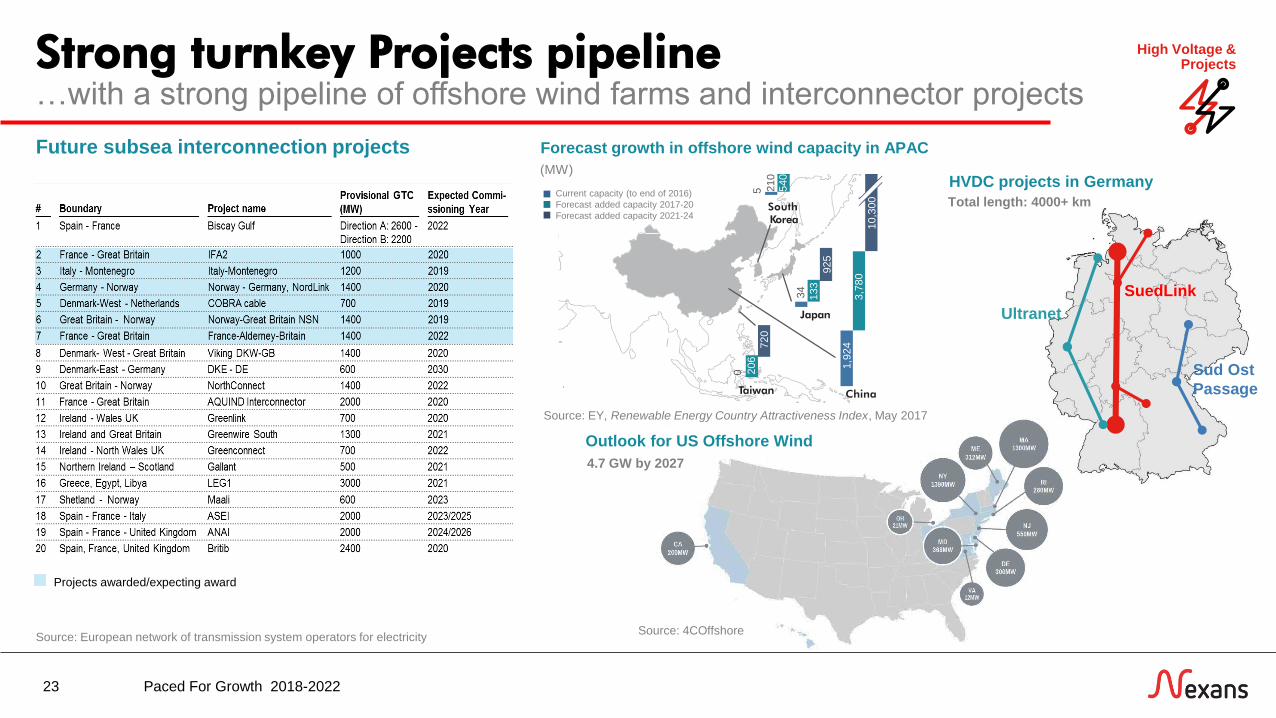
Strong turnkey Projects pipeline…with a strong pipeline of offshore wind farms and interconnector projects
23
SuedLink
Sud Ost
Passage
Ultranet
High Voltage & Projects
Future subsea interconnection projects
Projects awarded/expecting award
Total length: 4000+ km
HVDC projects in Germany
Source: European network of transmission system operators for electricity
4.7 GW by 2027
Outlook for US Offshore Wind
Source: 4COffshore
Forecast growth in offshore wind capacity in APAC
Taiwan
0
Japan
China
South Korea
Current capacity (to end of 2016)
Forecast added capacity 2017-20
Forecast added capacity 2021-24
206
720
210
5 540
34
133
925
1,9
24
3,7
80
10,3
00
(MW)
Source: EY, Renewable Energy Country Attractiveness Index, May 2017
Paced For Growth 2018-2022
Continue to focus on cost
leadership
Build on strengths in
attractive markets
Accelerate growth through portfolio
of activities
C
A B
24
High Voltage & Projects
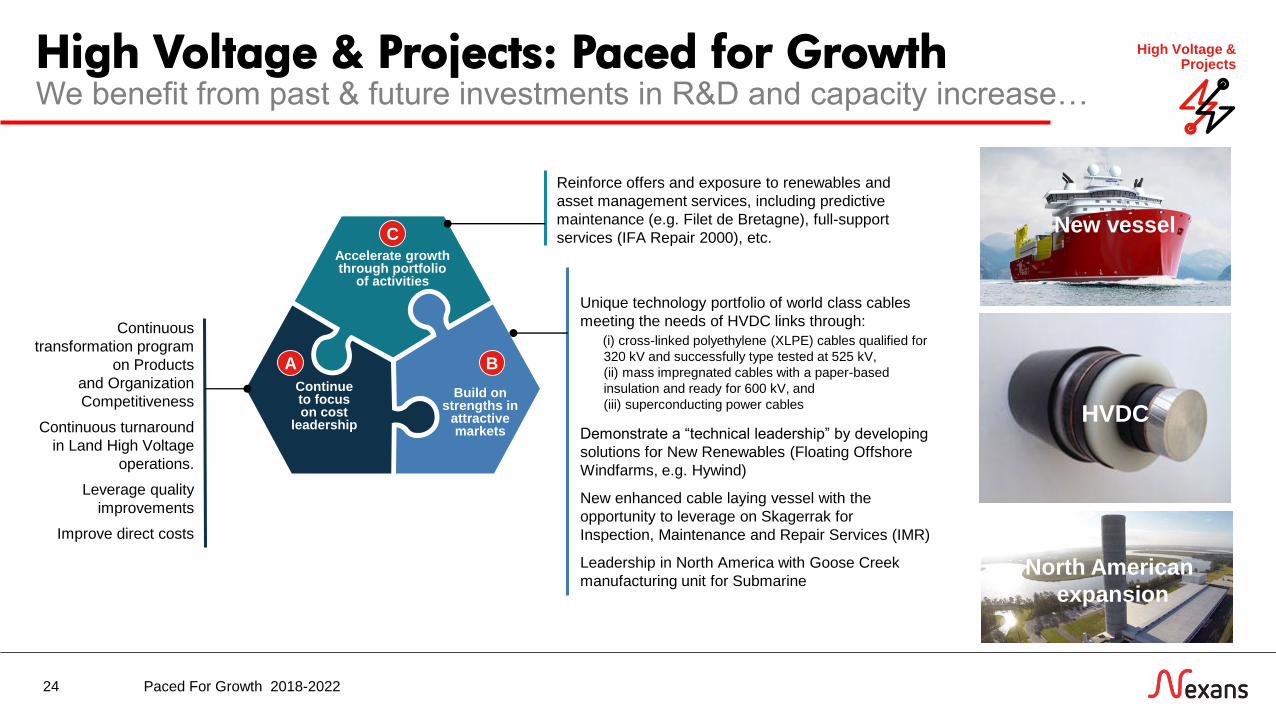
Unique technology portfolio of world class cables
meeting the needs of HVDC links through:
(i) cross-linked polyethylene (XLPE) cables qualified for
320 kV and successfully type tested at 525 kV,
(ii) mass impregnated cables with a paper-based
insulation and ready for 600 kV, and
(iii) superconducting power cables
Demonstrate a “technical leadership” by developing
solutions for New Renewables (Floating Offshore
Windfarms, e.g. Hywind)
New enhanced cable laying vessel with the
opportunity to leverage on Skagerrak for
Inspection, Maintenance and Repair Services (IMR)
Leadership in North America with Goose Creek
manufacturing unit for Submarine
Continuous
transformation program
on Products
and Organization
Competitiveness
Continuous turnaround
in Land High Voltage
operations.
Leverage quality
improvements
Improve direct costs
Reinforce offers and exposure to renewables and
asset management services, including predictive
maintenance (e.g. Filet de Bretagne), full-support
services (IFA Repair 2000), etc.
High Voltage & Projects: Paced for GrowthWe benefit from past & future investments in R&D and capacity increase…
New vessel
North American
expansion
HVDC
Paced For Growth 2018-2022

High Voltage & Projects: Key Financials
25
…leading to significant growth outlook
Sales of turnkey projects manufactured in Goose Creek (USA) to
start by 2020 and reach full sales potential by 2022 when
qualifications are completed
New cable laying vessel available for operations starting Q4 2020
Key Performance levers
Sales
202220212020201920182017
Other areas
NAM
A
Focus on Cost
leadership
B
Build on
strengths in
attractive
markets
C
Accelerate
growth through
portfolio of
activities
Price Cost
Squeeze
Impact + +++ + -
High Voltage & Projects
1 Sales at constant metal price, constant perimeter and constant currencies
² OM before depreciation
Key Figures1
2017 Est.Ambition
2022
Sales (€BN) ~ 0.9 ~ 1.3
Organic growth (5 years CAGR) ~ 8%
EBITDA² / Sales ~ 13% ~ 15%
CAPEX / Depreciation 160% 160%
Paced For Growth 2018-2022
Business ambitions
26
.
1 Building & Territories
2 High Voltage & Projects
3 Telecom & Data
4 Industry & Solutions
5 Beyond cables
Paced For Growth 2018-2022

Telecom & Data: Market perspectives
27
Telecom &Data
Telecom & data cabling infrastructure must meet expectations…
Source: CRU report – July 17 update; McKinsey analysis, BISRIA (March 2016), Discerning Analytics (May 2016)
Data centers having over 100,000 nodes
2016-2022 GLOBAL MARKET
INTERNAL TELECOM AND DATA CABLES,
€BN
2017 2022
Data CenterOther LAN
9.19.9
1.11.4
8.08.6
5%
1%
2016-2022 ZOOM ON DATA
CENTER SUB-MARKET,
€BN
2017 2022
Enterprise Large Hyperscale
1.1
1.4
15%
7%
-5%
2017-2022 GLOBAL MARKET
TELECOM AND DATA CABLES,
€BN
2017 2022
External Copper Telecom
Internal Telecom/Data
Fiber Optic
20.220.7
2.0 1.4
9.19.9
9.09.4
-7%
2%
1%
Paced For Growth 2018-2022
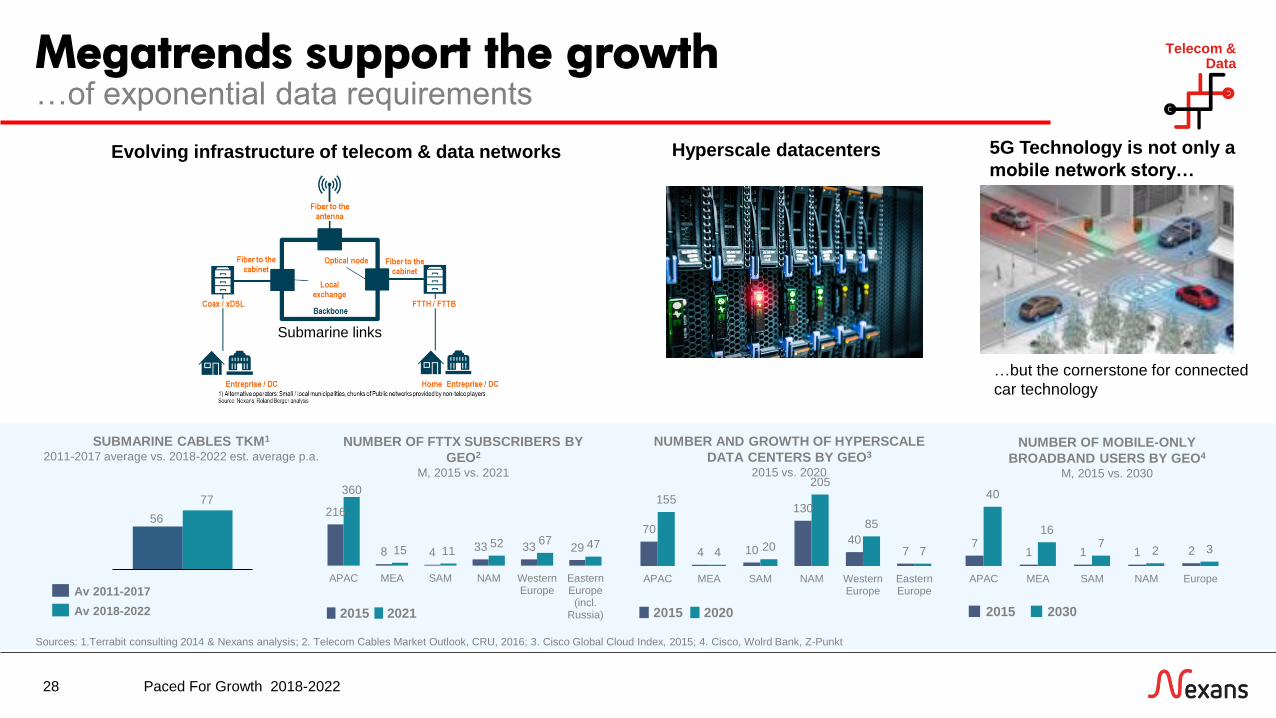
Megatrends support the growth Telecom &Data
…of exponential data requirements
Sources: 1.Terrabit consulting 2014 & Nexans analysis; 2. Telecom Cables Market Outlook, CRU, 2016; 3. Cisco Global Cloud Index, 2015; 4. Cisco, Wolrd Bank, Z-Punkt
SUBMARINE CABLES TKM1
2011-2017 average vs. 2018-2022 est. average p.a.
70
4 10
130
407
155
4 20
205
85
7
APAC MEA SAM NAM WesternEurope
EasternEurope
NUMBER AND GROWTH OF HYPERSCALE
DATA CENTERS BY GEO3
2015 vs. 2020
2015 2020
216
8 4 33 33 29
360
15 1152 67 47
APAC MEA SAM NAM WesternEurope
EasternEurope(incl.
Russia)
NUMBER OF FTTX SUBSCRIBERS BY
GEO2
M, 2015 vs. 2021
2015 2021
71 1 1 2
40
167
2 3
APAC MEA SAM NAM Europe
NUMBER OF MOBILE-ONLY
BROADBAND USERS BY GEO4
M, 2015 vs. 2030
2015 2030
…but the cornerstone for connected
car technology
5G Technology is not only a
mobile network story… Hyperscale datacenters
Submarine links
Evolving infrastructure of telecom & data networks
77
56
Av 2011-2017
Av 2018-2022
28 Paced For Growth 2018-2022

Telecom &Data
29
Match growing demand
through increased
production capacity
Develop “Ready-to-
install” cable &
connectivity solutions
and full turnkey solutions
for submarine fiber
installation
“Tailor approach” for
data centers: easy and
quick installation, cost-
efficiency and
optimization space
utilization
Maintain appropriate
fixed cost
productivity while
supporting growth
Create trust-based
partnerships to deploy
optical fiber networks
Increase share of
integrated systems and
connectivity solutions
Telecom & Data: Paced for GrowthNexans will double its presence in the market…
Continue to focus on cost
leadership
Build on strengths in
attractive markets
Accelerate growth through portfolio
of activities
C
A B
5G
FTTxHyperscale
Data Centers
Submarine
backbone
Paced For Growth 2018-2022

Telecom & DataTelecom & Data: Key Financials
30
…with a unique point to point connectivity offer
Key Performance levers
A
Focus on Cost
leadership
B
Build on
strengths in
attractive
markets
C
Accelerate
growth through
portfolio of
activities
Price Cost
Squeeze
Impact + +++ +++ -
All 3 sub-segments will contribute to organic growth
M&A needed to significantly accelerate Nexans’ exposure to
high growing telecom & data markets
Three Main Sub-segments
1 Sales at constant metal price, constant perimeter and constant currencies
² Approx. 100 M€ for CAPEX and OPEX 3 OM before depreciation
Telecom Operators
Special Telecom Subsea
LAN Cables & SystemsCAGR
5%
7%
12%
20222017
Key Figures1
2017 Est.Ambition
2022
Sales (€BN) ~ 0.5 ~ 0.8
Organic growth (5 years CAGR) ~ 10%
EBITDA3 / Sales ~ 12% ~ 15%
CAPEX / Depreciation 100% 110%²
Paced For Growth 2018-2022
Business ambitions
31
.
1 Building & Territories
2 High Voltage & Projects
3 Telecom & Data
4 Industry & Solutions
5 Beyond cables
Paced For Growth 2018-2022
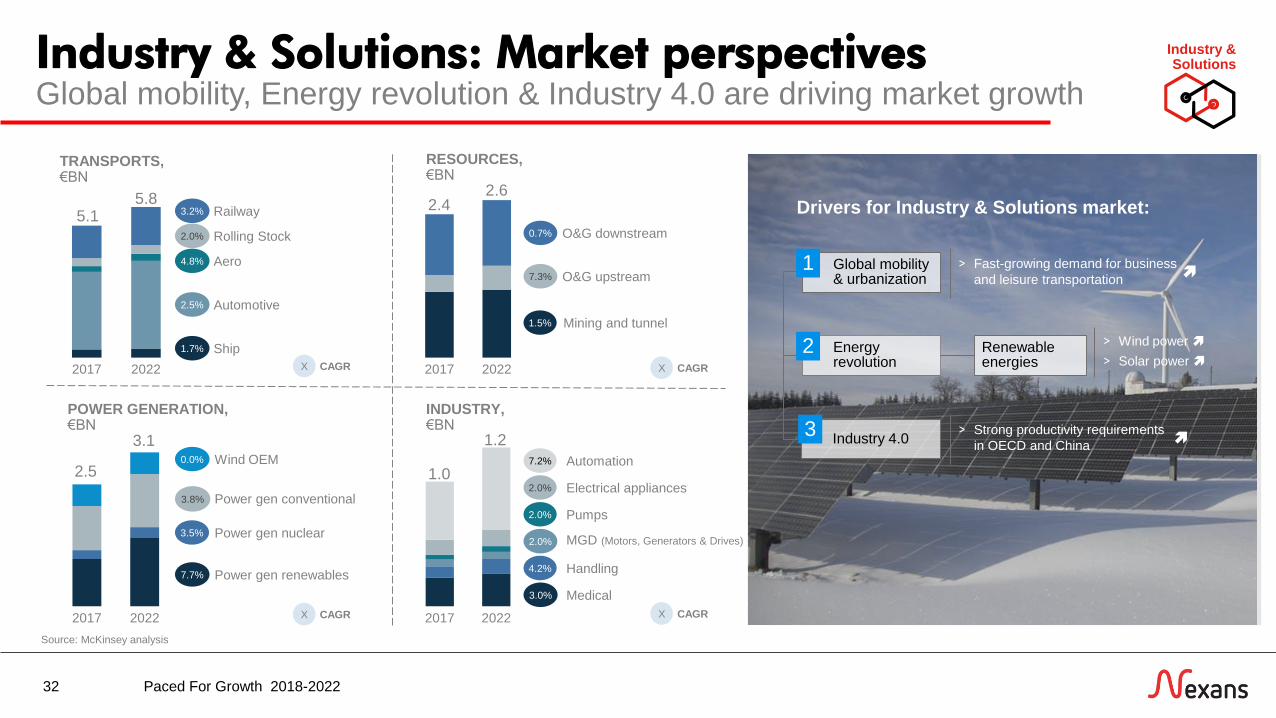
Industry & Solutions: Market perspectivesGlobal mobility, Energy revolution & Industry 4.0 are driving market growth
Industry &Solutions
Source: McKinsey analysis
32
Drivers for Industry & Solutions market:
> Fast-growing demand for business
and leisure transportation
Renewable energies
> Wind power
> Solar power
> Strong productivity requirements
in OECD and China
Global mobility & urbanization
1
Energy revolution
2
Industry 4.03
2017 2022
1.02.0%
2.0%
4.2%
2.0%
7.2% Automation
Electrical appliances
Pumps
MGD (Motors, Generators & Drives)
Handling
Medical3.0%
2017 2022
2.50.0%
3.5%
7.7%
3.8% Power gen conventional
Power gen nuclear
Power gen renewables
INDUSTRY, €BN
1.23.1Wind OEM
POWER GENERATION, €BN
RESOURCES, €BN
TRANSPORTS,€BN
2017 2022
5.12.0%
2.5%
1.7%
4.8%
3.2%5.8
Railway
Rolling Stock
Aero
Automotive
Ship
2017 2022
2.4
7.3%
1.5%
0.7%
2.6
O&G downstream
O&G upstream
Mining and tunnel
X CAGR
X CAGR
X CAGR
X CAGR
Paced For Growth 2018-2022
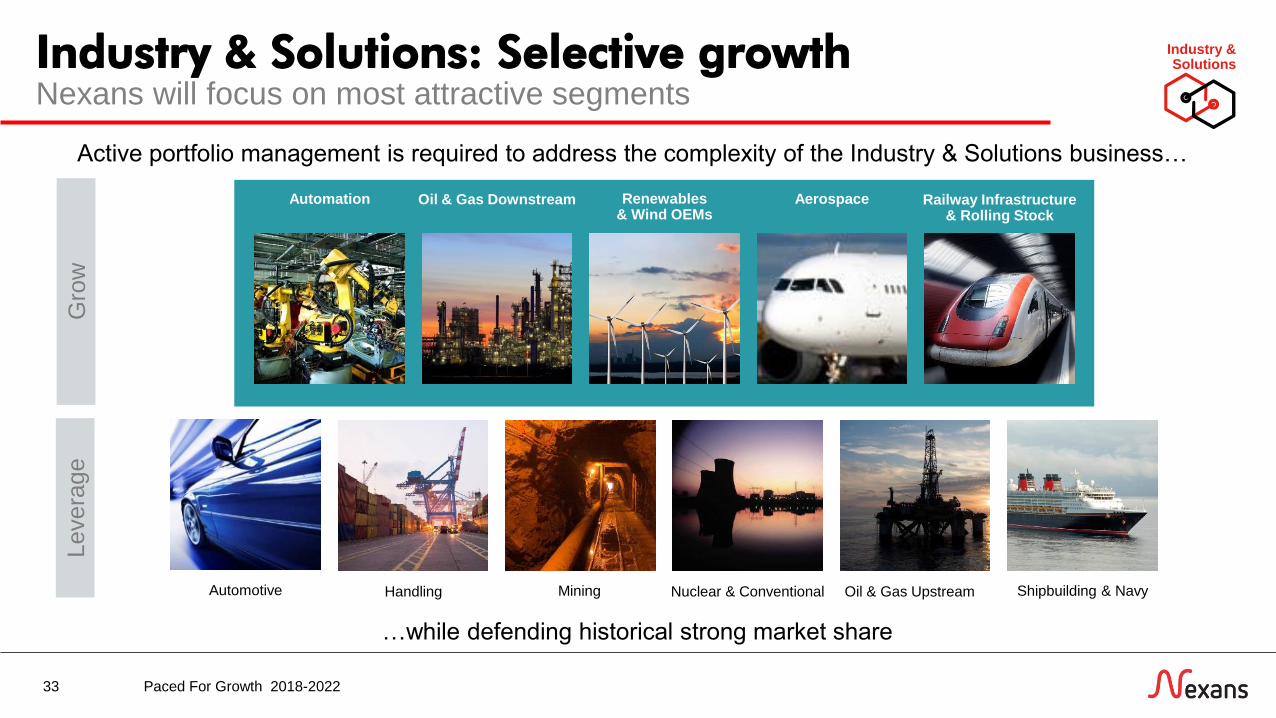
Nexans will focus on most attractive segments
33
Industry &SolutionsIndustry & Solutions: Selective growth
Active portfolio management is required to address the complexity of the Industry & Solutions business…
Handling Mining Nuclear & Conventional Oil & Gas Upstream Shipbuilding & Navy
Automation Oil & Gas Downstream Railway Infrastructure & Rolling Stock
Renewables& Wind OEMs
Aerospace
Gro
wLevera
ge
…while defending historical strong market share
Automotive
Paced For Growth 2018-2022
34
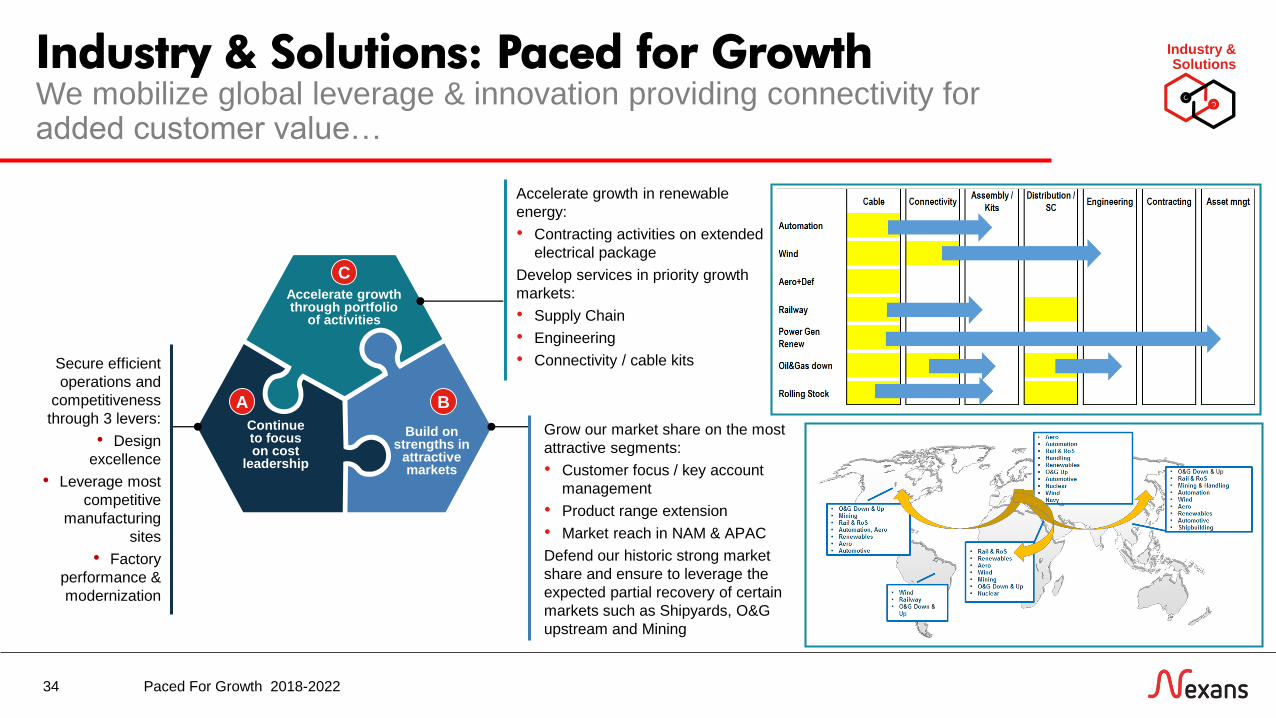
Industry &SolutionsIndustry & Solutions: Paced for Growth
We mobilize global leverage & innovation providing connectivity for added customer value…
Grow our market share on the most
attractive segments:
• Customer focus / key account
management
• Product range extension
• Market reach in NAM & APAC
Defend our historic strong market
share and ensure to leverage the
expected partial recovery of certain
markets such as Shipyards, O&G
upstream and Mining
Secure efficient
operations and
competitiveness
through 3 levers:
• Design
excellence
• Leverage most
competitive
manufacturing
sites
• Factory
performance &
modernization
Accelerate growth in renewable
energy:
• Contracting activities on extended
electrical package
Develop services in priority growth
markets:
• Supply Chain
• Engineering
• Connectivity / cable kits
Continue to focus on cost
leadership
Build on strengths in
attractive markets
Accelerate growth through portfolio
of activities
C
A B
Paced For Growth 2018-2022

Industry & SolutionsIndustry & Solutions: Key Financials
35
…and we smartly shift portfolio to grow most promising segments
Smart shift of portfolio to grow most promising and profitable
industrial market segments
Key Performance levers
0
Sa
les/C
E
RoS
ROCE2
Downcycle units
(O&G, Shipyard,
Mining)
Market leaders
A
Focus on Cost
leadership
B
Build on
strengths in
attractive
markets
C
Accelerate
growth through
portfolio of
activities
Price Cost
Squeeze
Impact +++ +++ ++ ---
1 Sales at constant metal price, constant perimeter and constant currencies
² 12 month OM on end of period Capital Employed, restated for Antitrust provision (excl. harnesses)3 OM before depreciation
Key Figures1
2017 Est.Ambition
2022
Sales (€BN) ~1.1 ~ 1.6
Organic growth (5 years CAGR) ~ 7.5 %
EBITDA3 / Sales ~ 8% ~ 9.5%
CAPEX 120% 120%
Paced For Growth 2018-2022
36
.
1 Building & Territories
2 High Voltage & Projects
3 Telecom & Data
4 Industry & Solutions
5 Beyond cables
Business ambitions
Paced For Growth 2018-2022
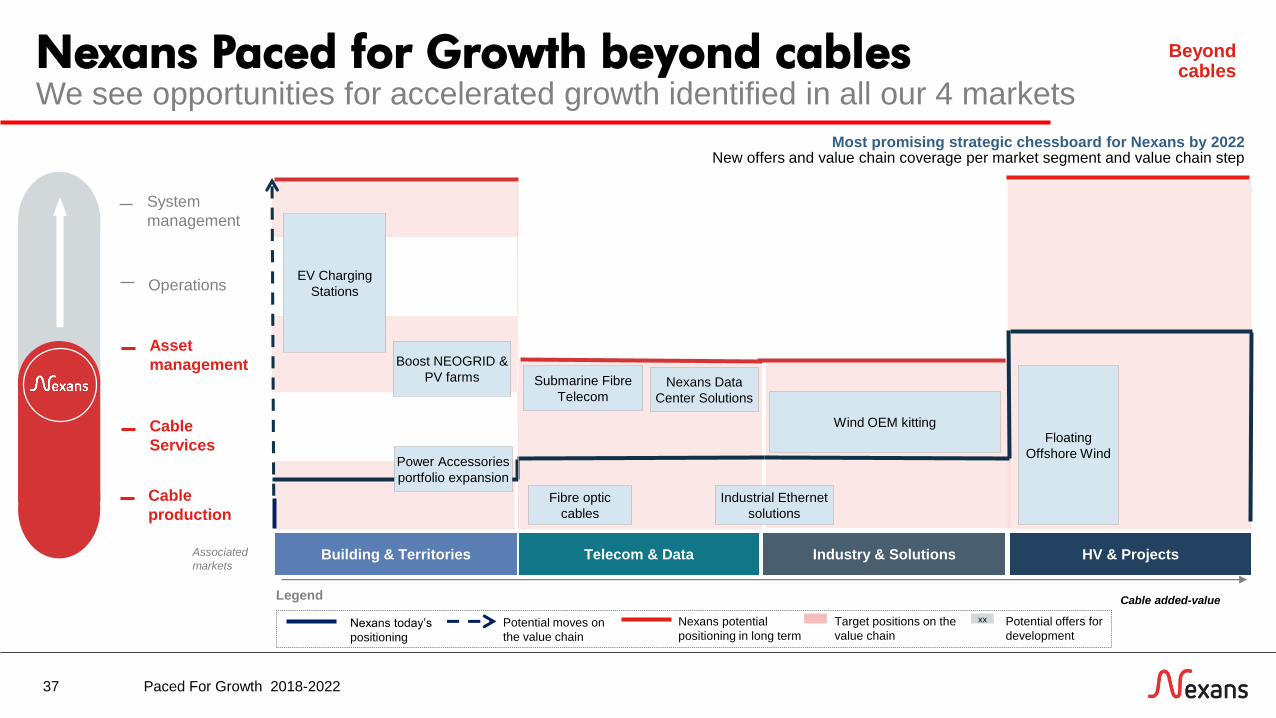
Cable added-value
Cable
production
Cable
Services
Asset
management
Operations
System
management
Nexans Paced for Growth beyond cables
37
We see opportunities for accelerated growth identified in all our 4 markets
Most promising strategic chessboard for Nexans by 2022New offers and value chain coverage per market segment and value chain step
Legend
Nexans today’s
positioning
Potential moves on
the value chain
Nexans potential
positioning in long term
Target positions on the
value chain
xx Potential offers for
development
Industry & SolutionsPower network utilitiesBuilding & Territories HV & ProjectsTelecom & DataAssociated
markets
Submarine Fibre
Telecom
Power Accessories
portfolio expansion
Industrial Ethernet
solutions
Nexans Data
Center Solutions
EV Charging
Stations
Boost NEOGRID &
PV farms
Floating
Offshore Wind
Fibre optic
cables
Wind OEM kitting
Beyond cables
Paced For Growth 2018-2022

Enablers & Actions
38
1 Digital, Innovation & Sales
2 Costs competitiveness &
Operational Efficiency
3 Organization & People
..
Paced For Growth 2018-2022

Innovation pipeline Paced for Growth
39
Our key asset to generate growth is our innovation pipeline…
High performance
operation at Low
temperature (- 65°C)
for Oil & Gas platforms
High mechanical
resistance
Supporting wind power generation from
deep offshore areas Cable dynamic designs for floating turbines off
the coasts (e.g. Hywind)
Ecodesign to decrease global warming
potentialEDRMAX by Nexans™ won 2 awards in December 2016:
> Ecoproduct for Sustainable Development
> [avniR] Ecodesign award
Improved safety with
Fire retardant cables
for buildings and tunnels
CPR European Regulation
compliance
(C)UL Certification
More distance and more power in grid
interconnectors, offshore wind parks and remote
O&G offshore platforms
HVDC submarine MI cables up to 600kV – 1.5GW
HVDC underground extruded cables – 320kV qualified
HVDC underground extruded cables ongoing
qualification 525kV
Electrical insulation
Tensile strength
Elongation
Abrasion resistance
Oil resistance
Fire reaction
High permittivity
Heat resistance
UV resistance
Core innovation: 70% of investments
To optimize core existing products for existing customers
Paced For Growth 2018-2022
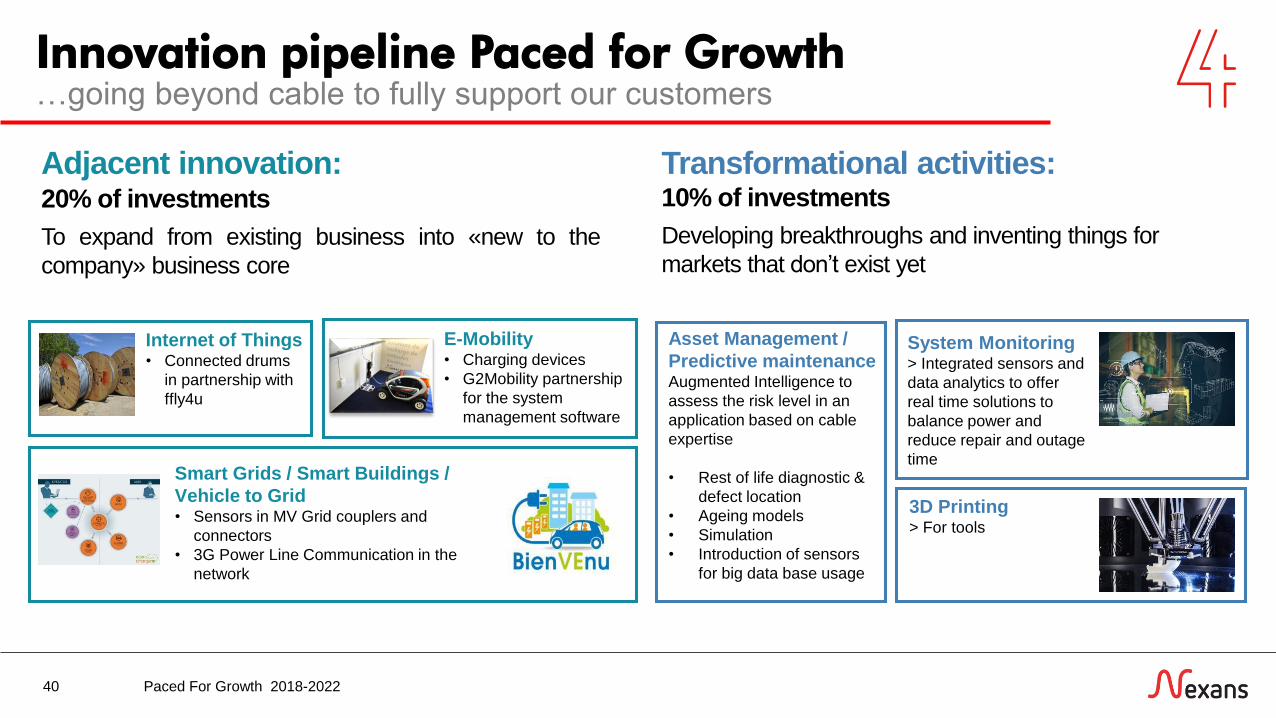
Innovation pipeline Paced for Growth
40
…going beyond cable to fully support our customers
Internet of Things• Connected drums
in partnership with
ffly4u
Smart Grids / Smart Buildings /
Vehicle to Grid• Sensors in MV Grid couplers and
connectors
• 3G Power Line Communication in the
network
E-Mobility • Charging devices
• G2Mobility partnership
for the system
management software
Adjacent innovation:20% of investments
To expand from existing business into «new to the
company» business core
Transformational activities: 10% of investments
Developing breakthroughs and inventing things for
markets that don’t exist yet
Asset Management /
Predictive maintenanceAugmented Intelligence to
assess the risk level in an
application based on cable
expertise
• Rest of life diagnostic &
defect location
• Ageing models
• Simulation
• Introduction of sensors
for big data base usage
System Monitoring> Integrated sensors and
data analytics to offer
real time solutions to
balance power and
reduce repair and outage
time
3D Printing> For tools
Paced For Growth 2018-2022
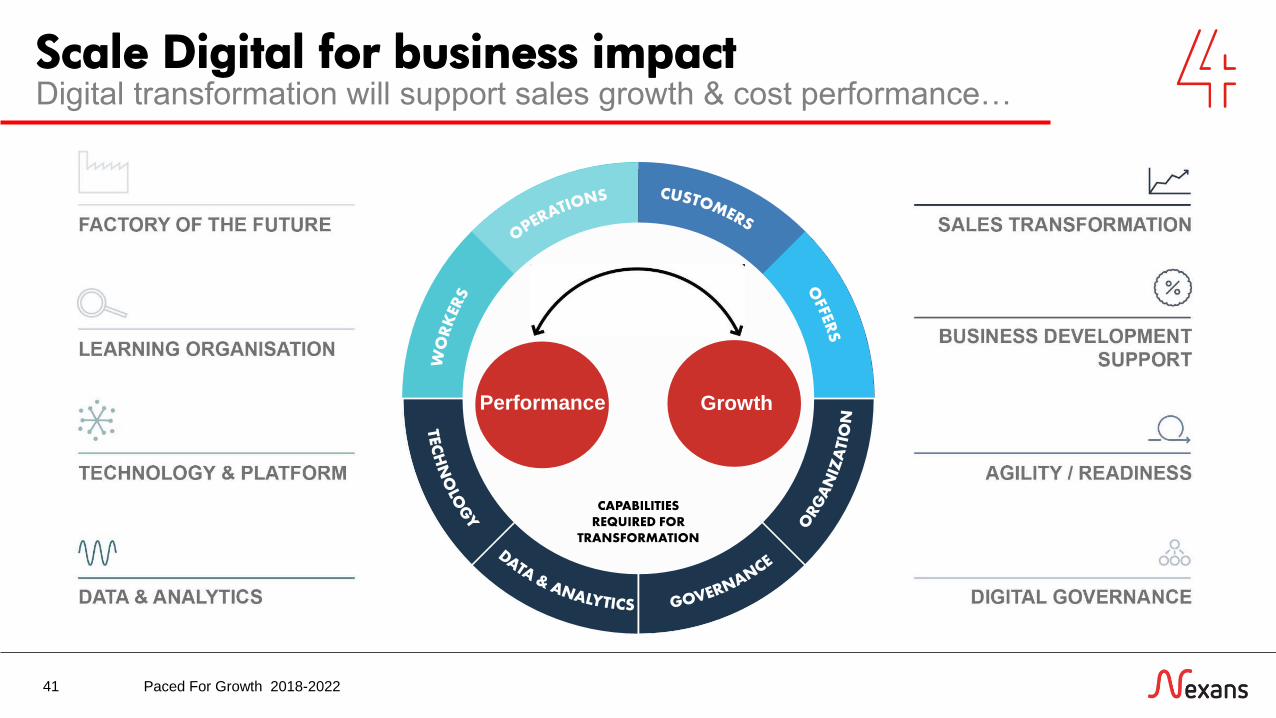
Scale Digital for business impact Digital transformation will support sales growth & cost performance…
41
GrowthPerformance GrowthPerformance
Paced For Growth 2018-2022
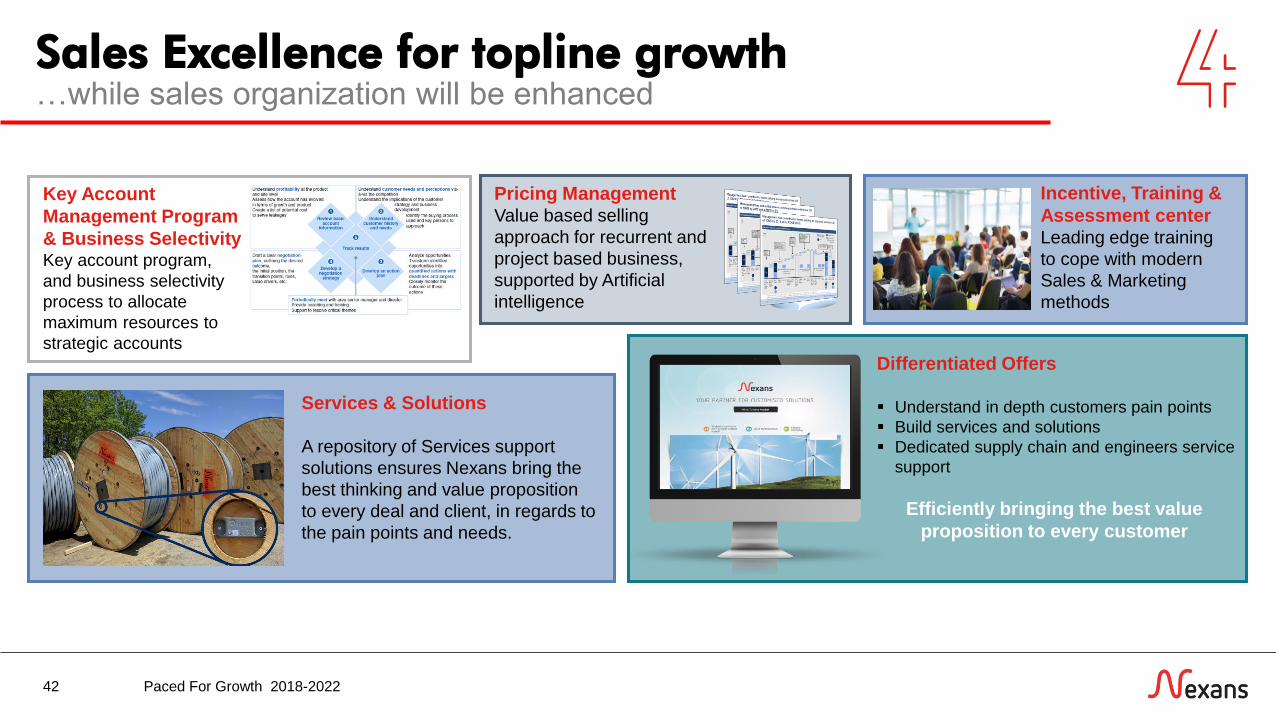
Sales Excellence for topline growth
42
…while sales organization will be enhanced
Incentive, Training &
Assessment centerLeading edge training
to cope with modern
Sales & Marketing
methods
Differentiated Offers
Understand in depth customers pain points
Build services and solutions
Dedicated supply chain and engineers service
support
Pricing ManagementValue based selling
approach for recurrent and
project based business,
supported by Artificial
intelligence
Services & Solutions
A repository of Services support
solutions ensures Nexans bring the
best thinking and value proposition
to every deal and client, in regards to
the pain points and needs.
Key Account
Management Program
& Business SelectivityKey account program,
and business selectivity
process to allocate
maximum resources to
strategic accounts
Efficiently bringing the best value
proposition to every customer
Paced For Growth 2018-2022
43
.Enablers & Actions
1 Digital, Innovation & Sales
2 Costs competitiveness &
Operational Efficiency
3 Organization & People
.
Paced For Growth 2018-2022
Our continuous cost consciousness will offset price cost squeeze…
44
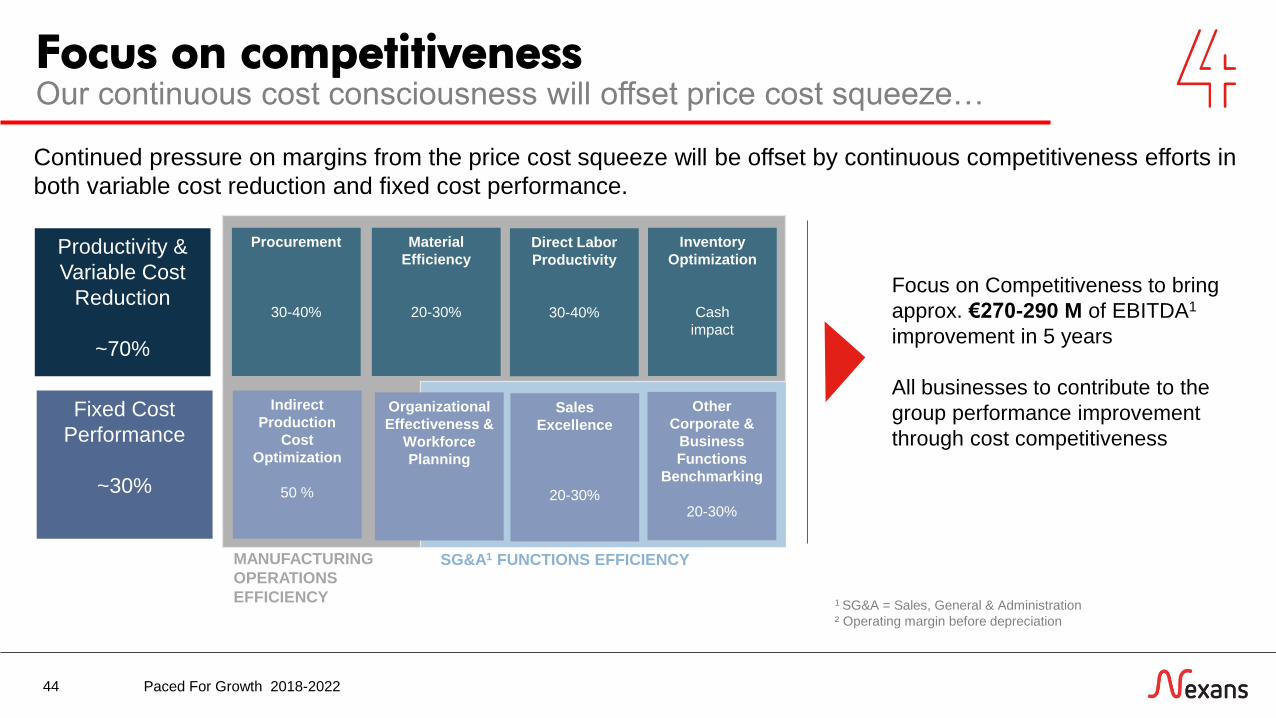
Focus on competitiveness
Continued pressure on margins from the price cost squeeze will be offset by continuous competitiveness efforts in
both variable cost reduction and fixed cost performance.
Productivity &
Variable Cost
Reduction
~70%
Fixed Cost
Performance
~30%
Procurement
30-40%
Material
Efficiency
20-30%
Direct Labor
Productivity
30-40%
Inventory
Optimization
Cash
impact
Indirect
Production
Cost
Optimization
50 %
Sales
Excellence
20-30%
Other
Corporate &
Business
Functions
Benchmarking
20-30%
MANUFACTURING
OPERATIONS
EFFICIENCY
SG&A1 FUNCTIONS EFFICIENCY
Focus on Competitiveness to bring
approx. €270-290 M of EBITDA1
improvement in 5 years
All businesses to contribute to the
group performance improvement
through cost competitiveness
1 SG&A = Sales, General & Administration
² Operating margin before depreciation
Organizational
Effectiveness &
Workforce
Planning
Paced For Growth 2018-2022

Manufacturing operations efficiency…transforming our assets will increase productivity…
NEXANS 2018-22
OPERATIONS
RELIABILITY
AGILE BUSINESS
MODEL
▪ Excellence in
Safety
▪ Predictive
Quality and
Maintenance
▪ Deliver value
through leading
factories
▪ Customer-driven
Demand
Management
▪ Highly motivated
workforce
▪ Learning
organization
through training
WORKFORCE
TRANSFORMATION
CUSTOMER CENTRIC
FOOTPRINT
▪ Drive rapid
innovation
▪ Secure from
external disruption
45
2017
PE
RF
OR
MA
NC
E
2018 2020 2022
FACTORYOF THE FUTURE
FOCUSED PROCESS & PRODUCT IMPROVEMENTS
STANDARD CORE INITIATIVES
Paced For Growth 2018-2022
46
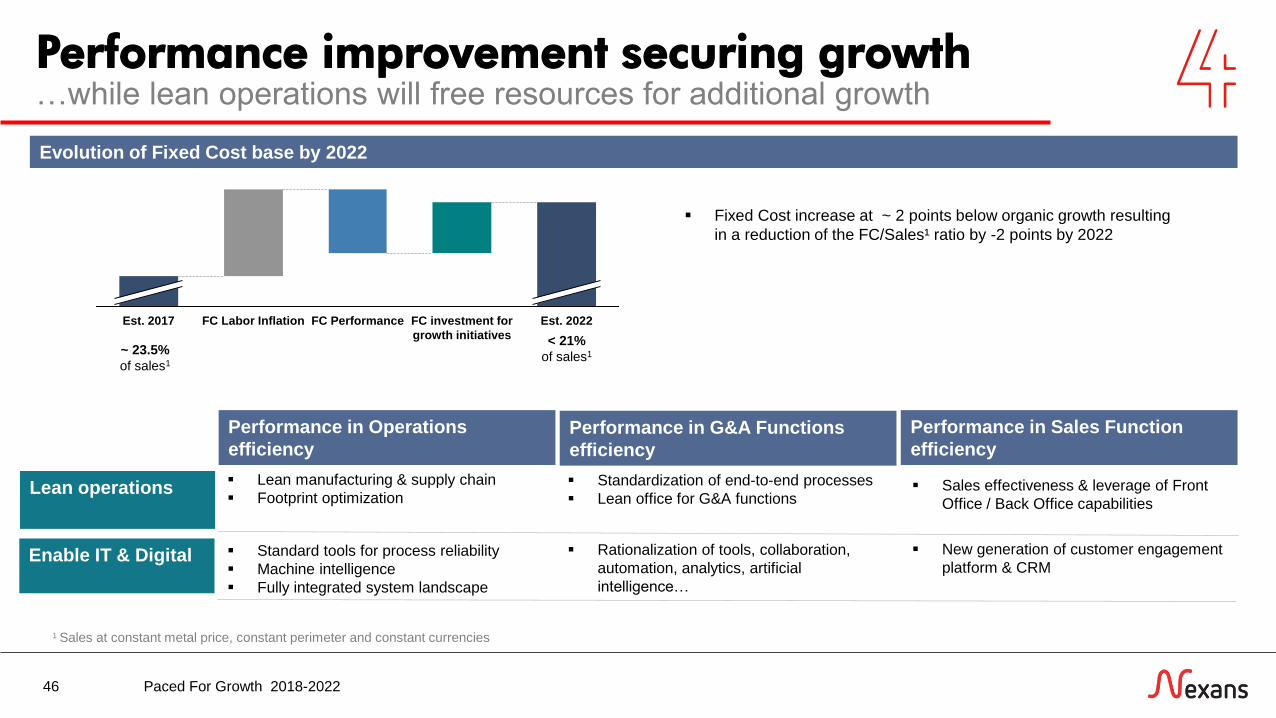
Performance improvement securing growth…while lean operations will free resources for additional growth
Est. 2022FC investment for
growth initiatives
FC PerformanceFC Labor InflationEst. 2017
Fixed Cost increase at ~ 2 points below organic growth resulting
in a reduction of the FC/Sales¹ ratio by -2 points by 2022
Evolution of Fixed Cost base by 2022
Performance in Operations
efficiencyPerformance in G&A Functions
efficiency
Lean manufacturing & supply chain
Footprint optimization
Standard tools for process reliability
Machine intelligence
Fully integrated system landscape
Performance in Sales Function
efficiency
Sales effectiveness & leverage of Front
Office / Back Office capabilities
New generation of customer engagement
platform & CRM
Lean operations
Enable IT & Digital
Standardization of end-to-end processes
Lean office for G&A functions
Rationalization of tools, collaboration,
automation, analytics, artificial
intelligence…
1 Sales at constant metal price, constant perimeter and constant currencies
~ 23.5%
of sales1
< 21%
of sales1
Paced For Growth 2018-2022
47
.Enablers & Actions
1 Digital, Innovation & Sales
2 Costs competitiveness &
Operational Efficiency
3 Organization & People
.
Paced For Growth 2018-2022
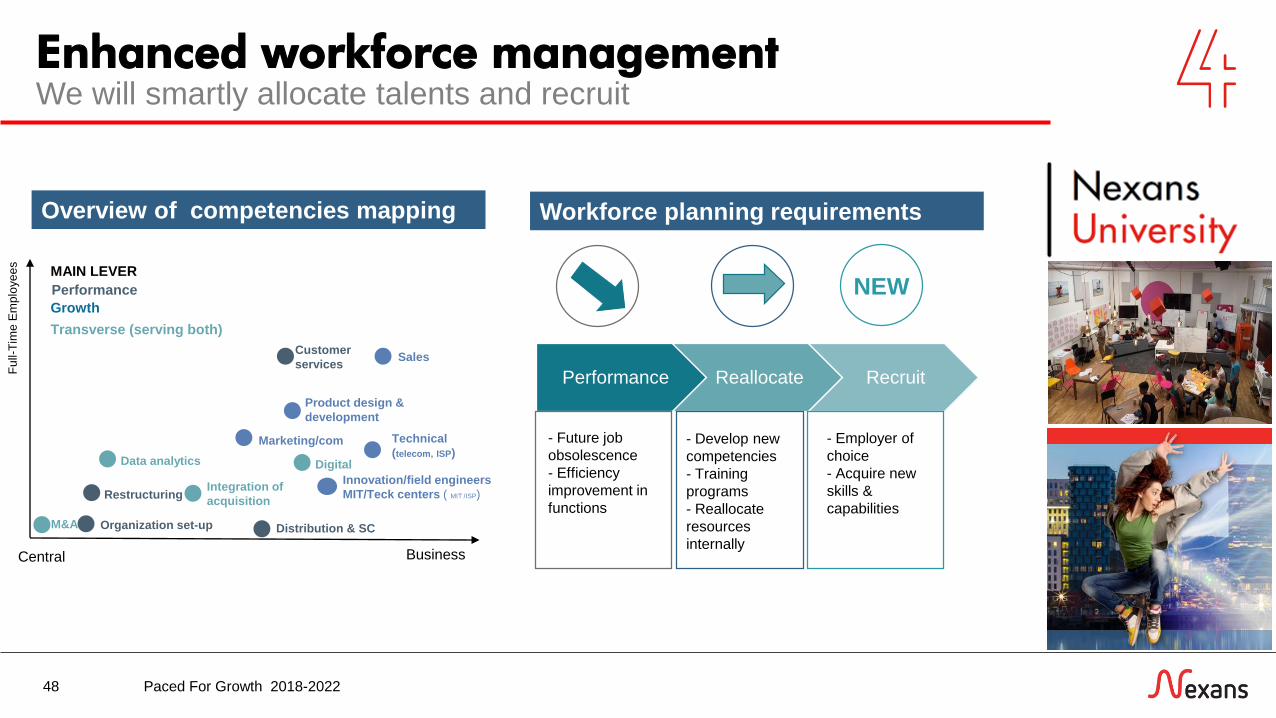
We will smartly allocate talents and recruit
48
Enhanced workforce management
Overview of competencies mapping
Performance Reallocate Recruit
NEW
- Future job
obsolescence
- Efficiency
improvement in
functions
- Develop new
competencies
- Training
programs
- Reallocate
resources
internally
- Employer of
choice
- Acquire new
skills &
capabilities
Workforce planning requirements
Central Business
Technical
(telecom, ISP)
M&A
Restructuring
Organization set-up
Marketing/com
Customer
servicesSales
Innovation/field engineers
MIT/Teck centers ( MIT /ISP)
Product design &
development
Integration of
acquisition
DigitalData analytics
Distribution & SC
Performance
Growth
MAIN LEVER
Transverse (serving both)
Fu
ll-T
ime
Em
plo
ye
es
Paced For Growth 2018-2022

Financials
Nexans 2018-224949 Paced For Growth 2018-2022

Aligned with market growth
Financials by Market
50
We will grow in HV, Telecom & Industry…
Organic Growth1 by segment
Building &
Territories
High
Voltage &
Projects
Telecom &
Data
Industry &
Solutions
Building
Utilities
Land High Voltage
Submarine High Voltage
Umbilicals
Operators
Special Telecom
LAN cables & systems
Transportation (incl. Harnesses)
Resources
Other speciatlies
Sub - segments CAGR 2018-19 2020-22
~ 2.5%
~ 8%
~ 10%
~ 7.5%
Group Organic Growth1 by 2022
Total Group 5% 3%
1 Sales at constant metal price, constant perimeter and constant currencies
6%
Acceleration in 2020-22 with commissioning of US plant and new cable
laying vessel operating at full speed
Robust growth across the cycle for the 3 sub-segments (LAN cables &
systems, telecom operators and special telecom subsea)
Acceleration in 2020-22 driven by completed shift of portfolio and recovery
of the O&G upstream and shipbuilding businesses
Paced For Growth 2018-2022
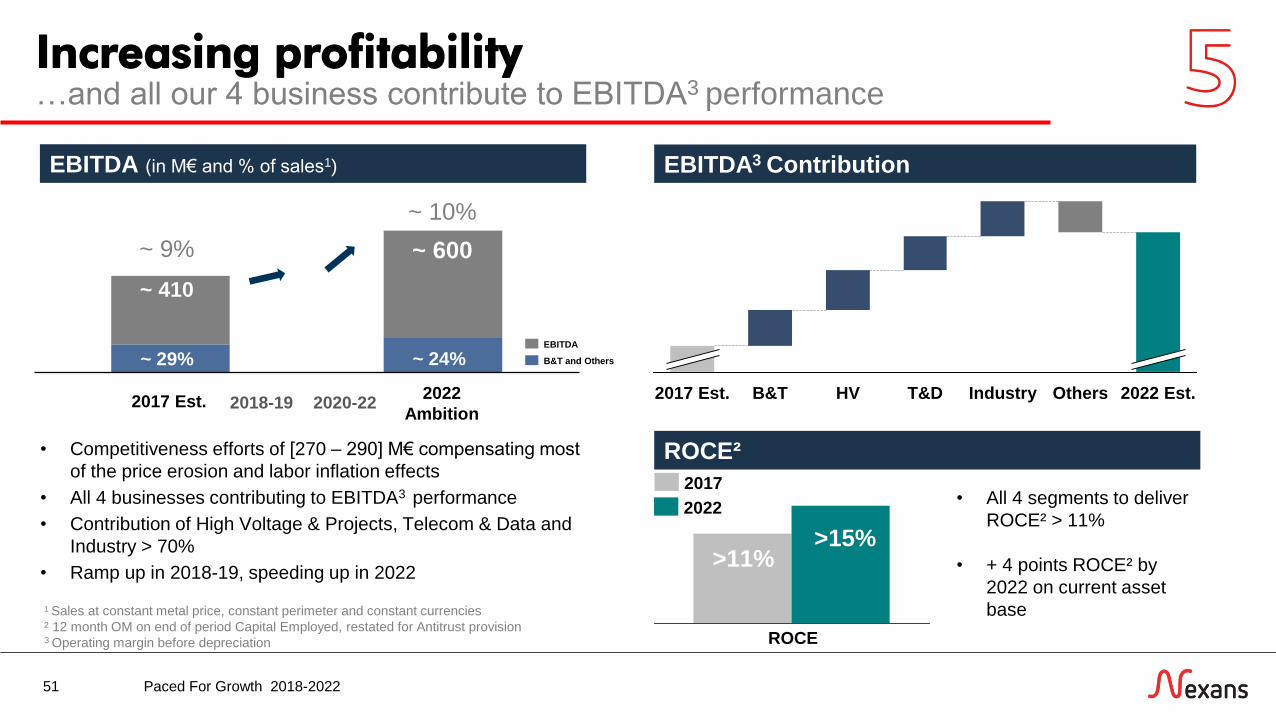
Increasing profitability
51
…and all our 4 business contribute to EBITDA3 performance
EBITDA (in M€ and % of sales1)
400 - 420580 - 620
ROCE²
2022
Ambition2017 Est.
~ 410
~ 600
ROCE
2022
2017
>11%>15%
• All 4 segments to deliver
ROCE² > 11%
• + 4 points ROCE² by
2022 on current asset
base
~ 9%
~ 10%
• Competitiveness efforts of [270 – 290] M€ compensating most
of the price erosion and labor inflation effects
• All 4 businesses contributing to EBITDA3 performance
• Contribution of High Voltage & Projects, Telecom & Data and
Industry > 70%
• Ramp up in 2018-19, speeding up in 2022
B&T and Others
EBITDA
1 Sales at constant metal price, constant perimeter and constant currencies
² 12 month OM on end of period Capital Employed, restated for Antitrust provision3 Operating margin before depreciation
~ 29% ~ 24%
EBITDA3 Contribution
Industry 2022 Est.B&T2017 Est. OthersT&DHV2018-19 2020-22
Paced For Growth 2018-2022
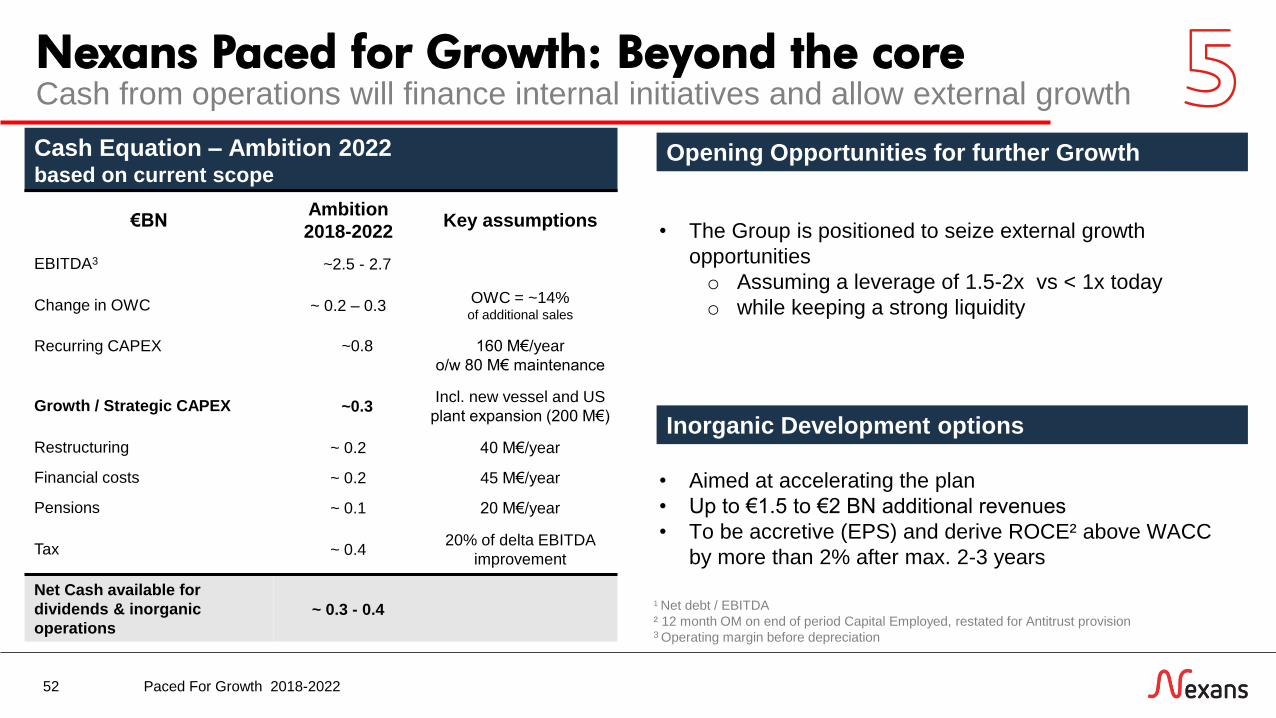
Nexans Paced for Growth: Beyond the core
52
Cash from operations will finance internal initiatives and allow external growth
Cash Equation – Ambition 2022based on current scope
• The Group is positioned to seize external growth
opportunities
o Assuming a leverage of 1.5-2x vs < 1x today
o while keeping a strong liquidity
Opening Opportunities for further Growth
€BNAmbition
2018-2022Key assumptions
EBITDA3 ~2.5 - 2.7
Change in OWC ~ 0.2 – 0.3OWC = ~14% of additional sales
Recurring CAPEX ~0.8 160 M€/year
o/w 80 M€ maintenance
Growth / Strategic CAPEX ~0.3Incl. new vessel and US
plant expansion (200 M€)
Restructuring ~ 0.2 40 M€/year
Financial costs ~ 0.2 45 M€/year
Pensions ~ 0.1 20 M€/year
Tax ~ 0.420% of delta EBITDA
improvement
Net Cash available for
dividends & inorganic
operations~ 0.3 - 0.4
1 Net debt / EBITDA
² 12 month OM on end of period Capital Employed, restated for Antitrust provision3 Operating margin before depreciation
• Aimed at accelerating the plan
• Up to €1.5 to €2 BN additional revenues
• To be accretive (EPS) and derive ROCE² above WACC
by more than 2% after max. 2-3 years
Inorganic Development options
Paced For Growth 2018-2022

Value for our Stakeholders
53
CSR is an integral part of our business strategy
CSR ranking 2014 2017
DC+
‘Prime’
D B
63/1002017:
72/100
PEOPLE
PRODUCTS
PLANET
PARTNERS
BRING INDIVIDUAL AND COLLECTIVE PERFORMANCE
TO OUR BUSINESS
Safety
Ensure health and safety at sites
Human capital
Build people who build business
CSR awareness
Empower our people on CSR
MANAGE THE ENVIRONMENTAL IMPACTS
Environmental management
Maintain a high level of environmental management
(hazardous waste, soil pollution, water)
Energy management
Develop production energy-efficency (reduction in consumption
and reduction of our product energy losses)
Climate strategy
Reduce climate impacts (GHG emissions for our activities and
for the product usage, resilience to extreme climate events)
EMBEDDING LEADERSHIP BASED
ON VALUES AND ETHICS
Business ethics
Maintain a compliant framework and fair business practices
Stakeholders
Maintain a sustainable stakeholder relationship
Nexans Foundation
Help underprivileged communities to access to energy
MANAGE IN A COMPETITIVE AND INNOVATIVE
SUSTAINABLE BUSINESS MODE
Energy transition: Engage with customers to contribute to a
more sustainable economy (energy transition, electric mobility,
smarter grids and renewable energy)
Innovation management: Guarantee an innovative collaboration
with stakeholders
Sustainable products: Increase resource-efficiency (materials
sourcing, recyclability, life cycle assessment and circular economy)
KPI Target 2022
SafetyWorkplace accident
frequency rate<1
Womenin management positions 25%
Environmental
certificationssites certified EHP and/or
ISO 14001
97%
OTIFincluding logistic and
plants data94%
Paced For Growth 2018-2022

Conclusion
54 Paced For Growth 2018-2022

Paced for Growth
55
By bringing energy and information to life, we are the critical link.
InnovationPeopleSustainable
growth
The ‘Paced for Growth’ strategic plan will allow us to go further in the innovationand differentiation of our activities in markets with high-potential on a globalscale.
Being a cable leader is the core of our activity but today we have the ability togo beyond that to become a critical link, the one capable of providing womenand men around the world with the energy and information they need.
Paced For Growth 2018-2022

Q&A
56 Paced For Growth 2018-2022
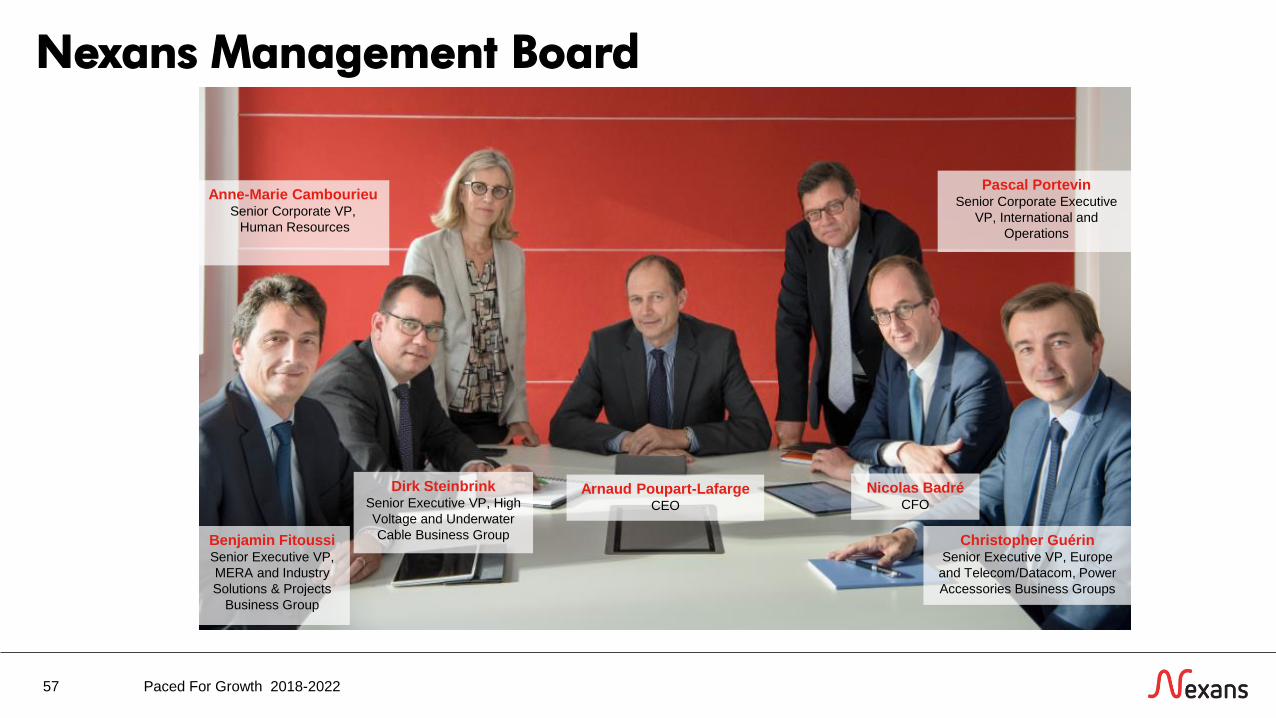
Nexans Management Board
57
Arnaud Poupart-LafargeCEO
Pascal PortevinSenior Corporate Executive
VP, International and
Operations
Anne-Marie CambourieuSenior Corporate VP,
Human Resources
Nicolas BadréCFO
Christopher GuérinSenior Executive VP, Europe
and Telecom/Datacom, Power
Accessories Business Groups
Benjamin FitoussiSenior Executive VP,
MERA and Industry
Solutions & Projects
Business Group
Dirk SteinbrinkSenior Executive VP, High
Voltage and Underwater
Cable Business Group
Paced For Growth 2018-2022
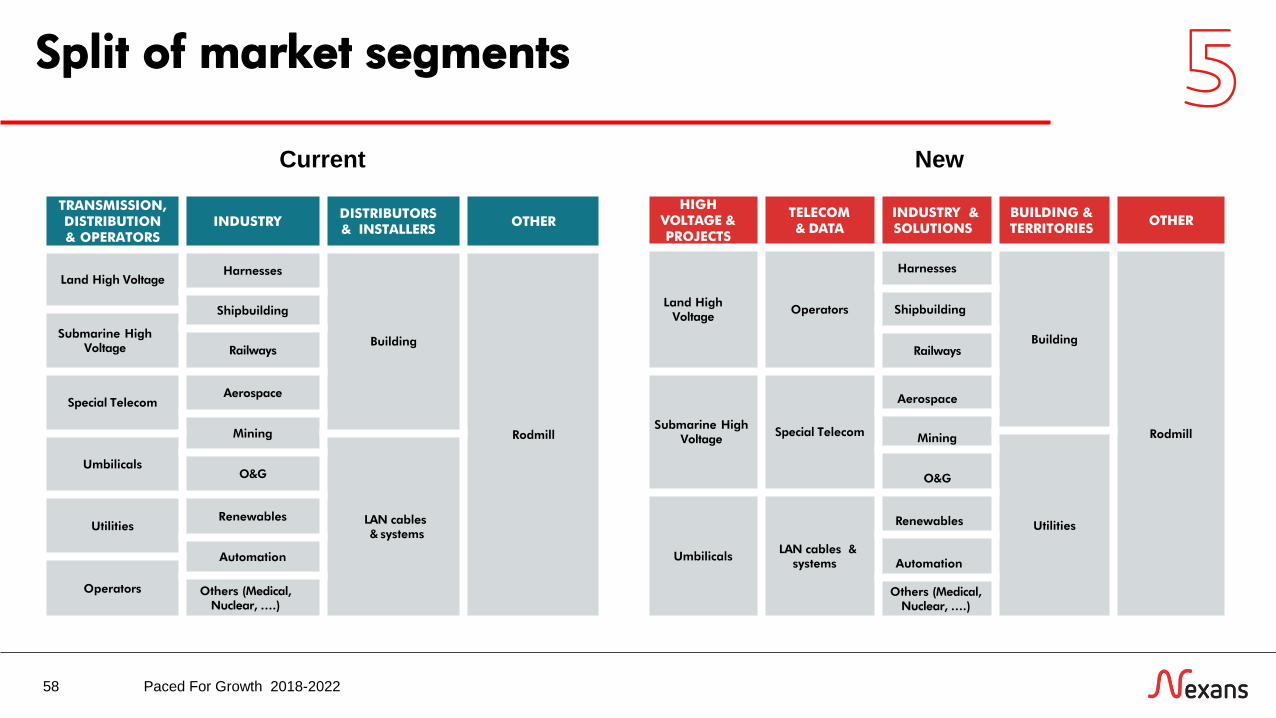
Split of market segments
58
Current New
TRANSMISSION,DISTRIBUTION& OPERATORS
INDUSTRYDISTRIBUTORS & INSTALLERS
OTHER
Land High VoltageHarnesses
Building
Rodmill
Shipbuilding
Submarine High Voltage Railways
Special TelecomAerospace
Mining
Umbilicals
LAN cables & systems
O&G
UtilitiesRenewables
Automation
Operators Others (Medical, Nuclear, ….)
HIGH VOLTAGE & PROJECTS
TELECOM & DATA
INDUSTRY & SOLUTIONS
BUILDING & TERRITORIES
OTHER
Land HighVoltage
Operators
Harnesses
Building
Rodmill
Shipbuilding
Railways
Submarine High Voltage
Special Telecom
Aerospace
Mining
Utilities
O&G
UmbilicalsLAN cables &
systems
Renewables
Automation
Others (Medical, Nuclear, ….)
Paced For Growth 2018-2022

NEXANS 2018-2259