interest rate risk management for the banking book: macro …old.efrag.org/files/macro hedge...
TRANSCRIPT

Interest Rate Risk Management for the Banking Book:
Macro Hedging
Giuseppe Loforese
Head of ALM - Intesa Sanpaolo
Chair of ALM – Hedge Accounting WG – EBF
Co-Chairman IRRBB WG - EBF
Overview
Models
Representing Hedging Activity
AGENDA IRRBB: Macro Hedging
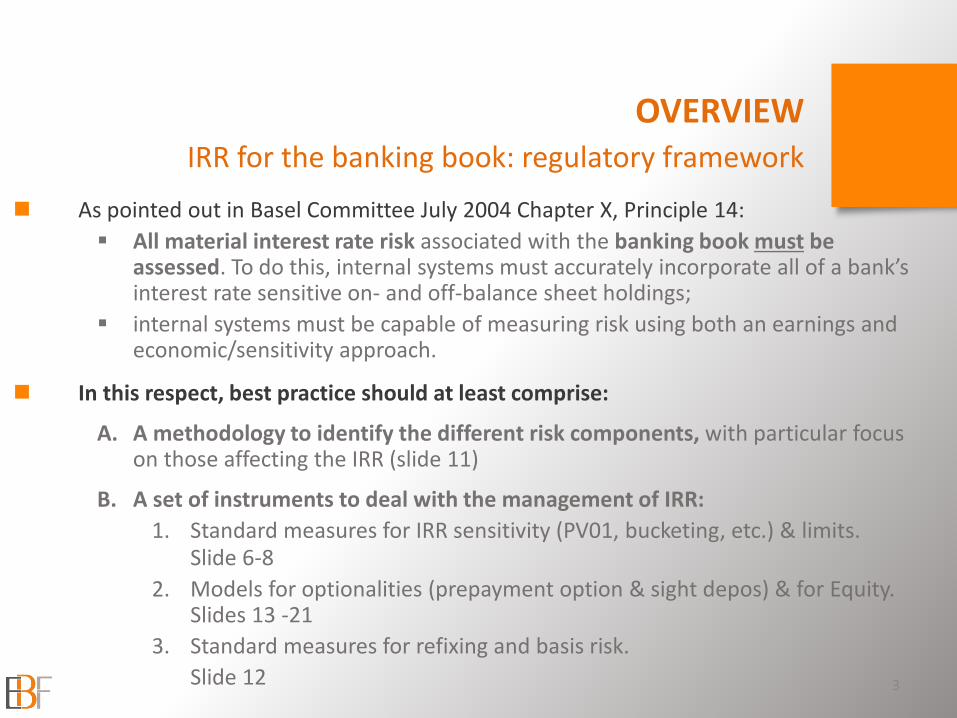
As pointed out in Basel Committee July 2004 Chapter X, Principle 14:
All material interest rate risk associated with the banking book must be assessed. To do this, internal systems must accurately incorporate all of a bank’s interest rate sensitive on- and off-balance sheet holdings;
internal systems must be capable of measuring risk using both an earnings and economic/sensitivity approach.
In this respect, best practice should at least comprise:
A. A methodology to identify the different risk components, with particular focus on those affecting the IRR (slide 11)
B. A set of instruments to deal with the management of IRR:
1. Standard measures for IRR sensitivity (PV01, bucketing, etc.) & limits. Slide 6-8
2. Models for optionalities (prepayment option & sight depos) & for Equity. Slides 13 -21
3. Standard measures for refixing and basis risk.
Slide 12 3
OVERVIEW IRR for the banking book: regulatory framework

Trading book vs Banking book: as for the management of interest rate risk, the trading book exposure is usually treated separately from the one arising from the banking book.
IRR management activity relates to the “pure” interest rate component of the larger Net Interest Margin (NIM), which includes both credit & liquidity spreads.
The main objective of IRR management of a bank with an “originate and hold” business model is to reduce the volatility of the “pure” interest margin and to produce a stable stream of “pure” interest income.
4
OVERVIEW trading vs banking book, objective of IRR management
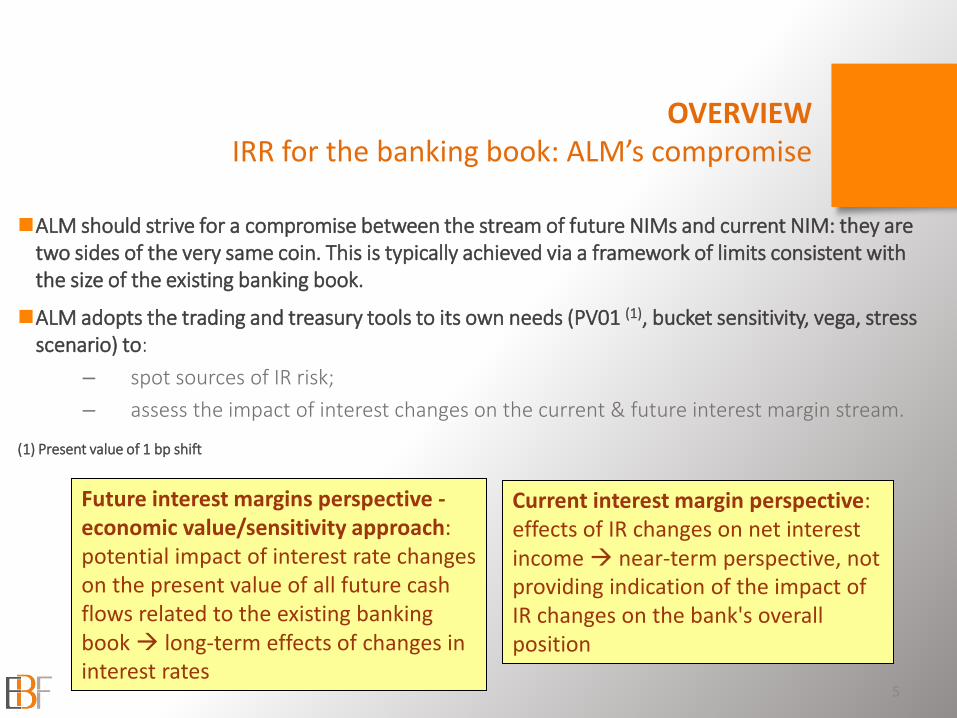
ALM should strive for a compromise between the stream of future NIMs and current NIM: they are two sides of the very same coin. This is typically achieved via a framework of limits consistent with the size of the existing banking book.
ALM adopts the trading and treasury tools to its own needs (PV01 (1), bucket sensitivity, vega, stress scenario) to:
– spot sources of IR risk;
– assess the impact of interest changes on the current & future interest margin stream. (1) Present value of 1 bp shift
5
Future interest margins perspective - economic value/sensitivity approach: potential impact of interest rate changes on the present value of all future cash flows related to the existing banking book long-term effects of changes in interest rates
Current interest margin perspective: effects of IR changes on net interest income near-term perspective, not providing indication of the impact of IR changes on the bank's overall position
OVERVIEW IRR for the banking book: ALM’s compromise
6
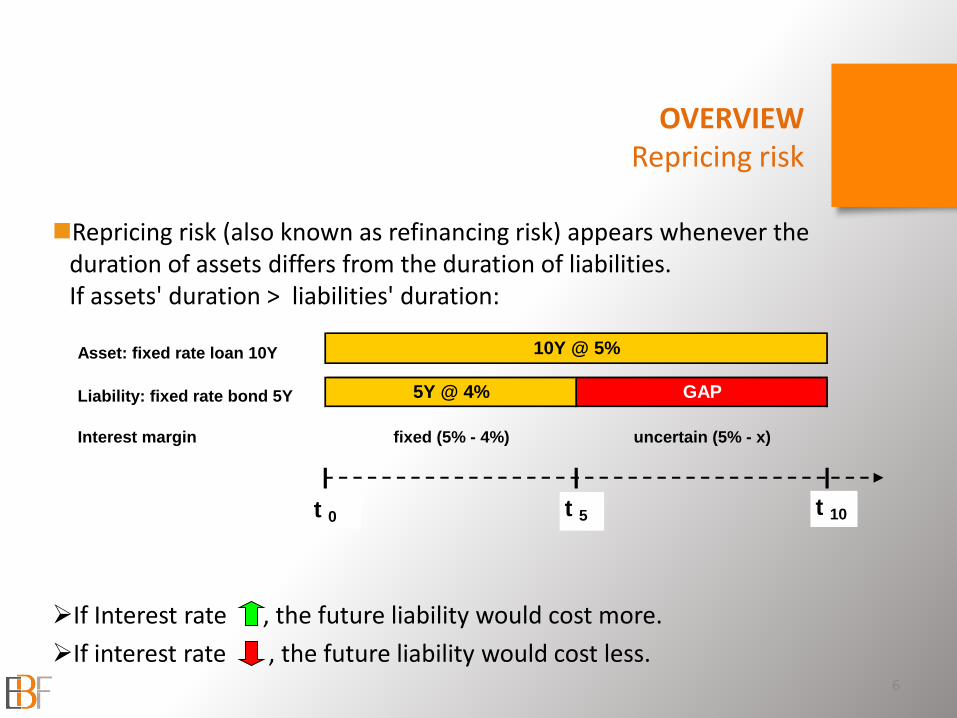
Repricing risk (also known as refinancing risk) appears whenever the duration of assets differs from the duration of liabilities. If assets' duration > liabilities' duration:
If Interest rate , the future liability would cost more.
If interest rate , the future liability would cost less.
OVERVIEW Repricing risk
Asset: fixed rate loan 10Y
Liability: fixed rate bond 5Y
Interest margin
10Y @ 5%
5Y @ 4% GAP
uncertain (5% - x)fixed (5% - 4%)
t 5 t 10t 0

7
A better understanding of IRR exposure could be assessed by bucketing cash flows and theirs sensitivities. Let’s assume the following banking book:
ASSETS
Fixed rate mortgages 15 €/bn 20y amort. 4.00%
LIABILITIES
Fixed rate liabilities 15 €/bn 10y bullet 3.50%
Interest rate swap 10 €/bn 10y bullet Rec 3.50% Pay EUR1M
Notional Maturity Rate
Notional Maturity Rate
Not prepayable
OVERVIEW Repricing risk

-15.00
-10.00
-5.00
-
5.00
10.00
15.00
0-1.5y 1.5-3y 3-5y 5-7y 7-10y 10-15y 15-20y
Fixed rate liabilities
Interest rate swap
Fixed rate mortgages
Net position
8
-15.0
-10.0
-5.0
-
5.0
10.0
15.0
1y 2y 3y 4y 5y 6y 7y 8y 9y 10y 11y 12y 13y 14y 15y 16y 17y 18y 19y 20y
Fixed rate liabilities
Interest rate swap (fixed leg)
Fixed rate mortgages
Net Cash Flows
Shift sensitivity (PV01 €/mln)
-15.00
-10.00
-5.00
-
5.00
10.00
15.00
0-1.5y 1.5-3y 3-5y 5-7y 7-10y 10-15y
Fixed rate mortgages
Fixed rate liabilities
Interest rate swap
Net position
Cash flows (€/bn)
-15.0
-10.0
-5.0
-
5.0
10.0
15.0
1y 2y 3y 4y 5y 6y 7y 8y 9y 10y 11y 12y 13y 14y 15y
Fixed rate mortgages
Fixed rate liabilities
Interest rate swap (fixed leg)
Net Cash Flows
Upper limit
Lower limit
OVERVIEW Repricing risk: bucket sensitivity & limits
-15.0
-10.0
-5.0
-
5.0
10.0
15.0
1y 2y 3y 4y 5y 6y 7y 8y 9y 10y 11y 12y 13y 14y 15y 16y 17y 18y 19y 20y
Fixed rate liabilities
Interest rate swap (fixed leg)
Fixed rate mortgages
Net Cash Flows

As mentioned, the Banking Book is what is not managed in the Trading Book
All single items belonging to a specific category (mortgages, bonds, sight depos, equity, etc.) flow undiscretionally into the banking book under management. With the exception of net equity, non-interest bearing items are excluded.
The resulting portfolio is tautologically an open portfolio/a sum of open portfolios managed as a single unit by the Treasury/ALM via an open portfolio of hedging instruments
9
OVERVIEW managing open portfolios
Mortgages
Loans
Bonds
CPs and CDs
Sight depos
Equity
USD
Mortgages
Loans
Bonds
CPs and CDs
Sight depos
Net Equity
Trading securities
Treasury ALM
banking book
under management &
hedging instruments
IRS
OIS
Swaption
Cap/Floor
Basis swap
Trading book
EUR

10
Bank’s treasury department gathers “pure” interest rate risk exposure stemming from the business units at the relevant benchmark rate (i.e. IRS or Euribor) via Transfer Price Process;
The treasury manages its net risk position by dealing with:
– the group’s investment bank and/or
– the internal trading desk and/or
– market counterparties
Investment
Bank/
Trading desk
Market
Business Unit
Business Unit
Business Unit Business
Unit Business Unit
Treasury ALM
OVERVIEW transfer pricing and internal deals

Floating rate loan
with cap @ 4%
Fixed Rate
Prepayable
Mortgage
Fixed Rate
Bond
(sub-libor:
bond's rate < IRS)
Subordinated
Bond
Basic example of IRR components’ segmentation
0.50%
3.00%3.00%
Euribor 3M
0.60%
Euribor 3M
1.00%
1.00%
3.00%
2.50%3.00%
Euribor 3M
0.60%
Euribor 3M
0.50%
Liquidity + Credit spread
Prep. Premium
Euribor 3M
Cap Premium
Euribor 1M
Base rate
1.00% 1.00%
-0.50%
3.00%
11
Euribor 3m
Liquidity + Credit Spread
Base rate: Fixed rate equivalent to
Euribor/Libor
Prepayment Premium: margin component
related to the cost of hedging the
prepayment risk
Cap Premium: margin component related
to the cost of hedging the IR cap
Assets Overall risk exposure Liabilities
All residual components: commercial margins, liquidity spread, etc.
Interest rate risk management
Optionality risk
Interest rate risk
OVERVIEW Segregation of risk components

12
Before the 2008 liquidity crisis, basis risk on the same currency was not an issue (i.e. Euribor 6m was quasi equivalent to Euribor 3m refinanced on forward rate for 3 months) and banks managed the refixing risk via OIS(2): It was sufficient to wait for the fixing day and enter into an OIS to hedge this risk perfectly.
As a consequence of the crisis, Euribor/Libor vs OIS rates started to diverge significantly
(2) Overnight Index Swap
OVERVIEW Refixing & basis risk
0.00%
1.00%
2.00%
3.00%
4.00%
5.00%
6.00%
2006 2007 2008 2009 2010 2011
Euribor 6m OIS 6M
Both repricing and basis mismatch requires now different hedging mechanics.
The cost of the basis is also a component to be included in the “interest risk management” and transfer price process. See slide 11.
Overview
Models
Representing Hedging Activity
13
AGENDA IRRBB: Macro Hedging

Any IRR measure is based on the various assets' and liabilities' cash flows.
In some cases, these cash flows are not fully determined. In these cases, one has to use expected cash flows, i.e. a model.
The three most important areas where this is true are loans with prepayment options, sight deposits, and non-financial assets and liabilities.
MODELS
14

In many countries, debtors have a contractual or legal right to prepay all or a portion of their fixed-rate mortgage.
If the prepaid loan has carried a relatively high interest rate, the bank incurs an economic loss. In many cases, the customer does not have to pay a prepayment penalty that (fully) compensates the bank for this loss.
In risk management, this prepayment right is considered an option. It has to be taken into account as, on average, it will shorten the loans' cash flow profile – and therefore, by implication, change the bank's IRR.
Prepayment risk is necessarily modelled at an aggregate, i.e. portfolio, level. A "law of large numbers" effect usually reduces the uncertainty sorrounding the question, To what extent will any one customer actually exercise his option?
15
MODELS Prepayment Risk
16
Cash flows of a 20-year amortizing loan
with and without prepayments
0
50
100
150
200
1 2 3 4 5 6 7 8 9 10 11 12 13 14 15 16 17 18 19 20
Years
mln
EU
R
CPR 0%
CPR 25%
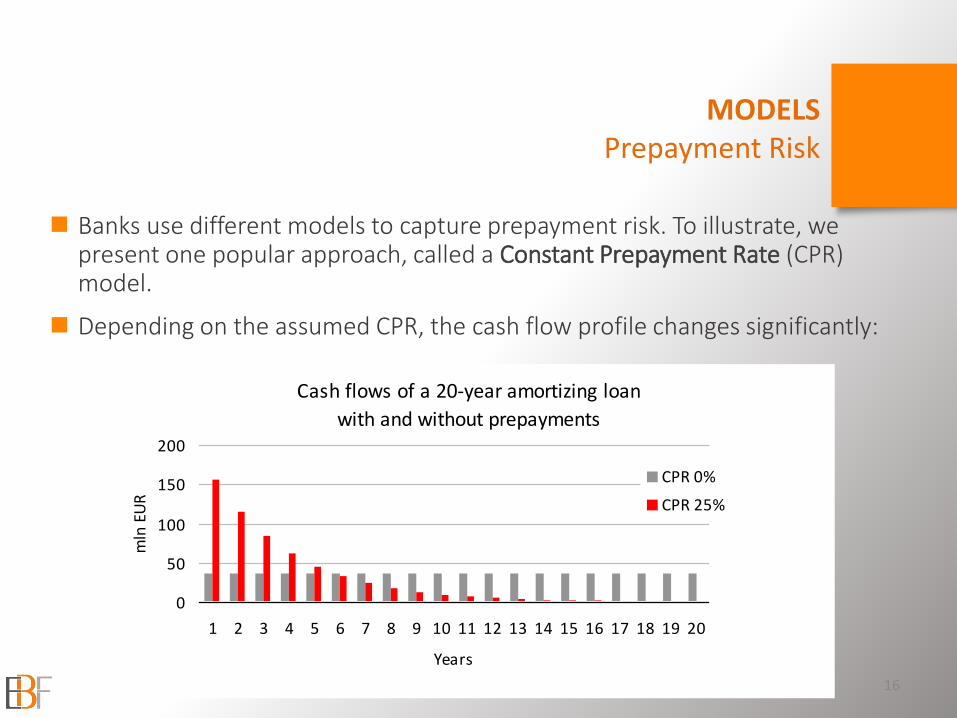
Banks use different models to capture prepayment risk. To illustrate, we present one popular approach, called a Constant Prepayment Rate (CPR) model.
Depending on the assumed CPR, the cash flow profile changes significantly:
MODELS Prepayment Risk

17
Core CPR
Max CPR
MODELS Prepayment Risk
One important input when calibrating such a CPR model are historical data of actual prepayment rates:
EXPECTED
AMORTIZATION
0
10
20
30
40
50
60
70
80
90
100
apr-
11
apr-
13
apr-
15
apr-
17
apr-
19
apr-
21
apr-
23
apr-
25
apr-
27
apr-
29
apr-
31
Mln
CONTRACTUAL DEBT DEBT CPR 3% DEBT CPR 15%
18
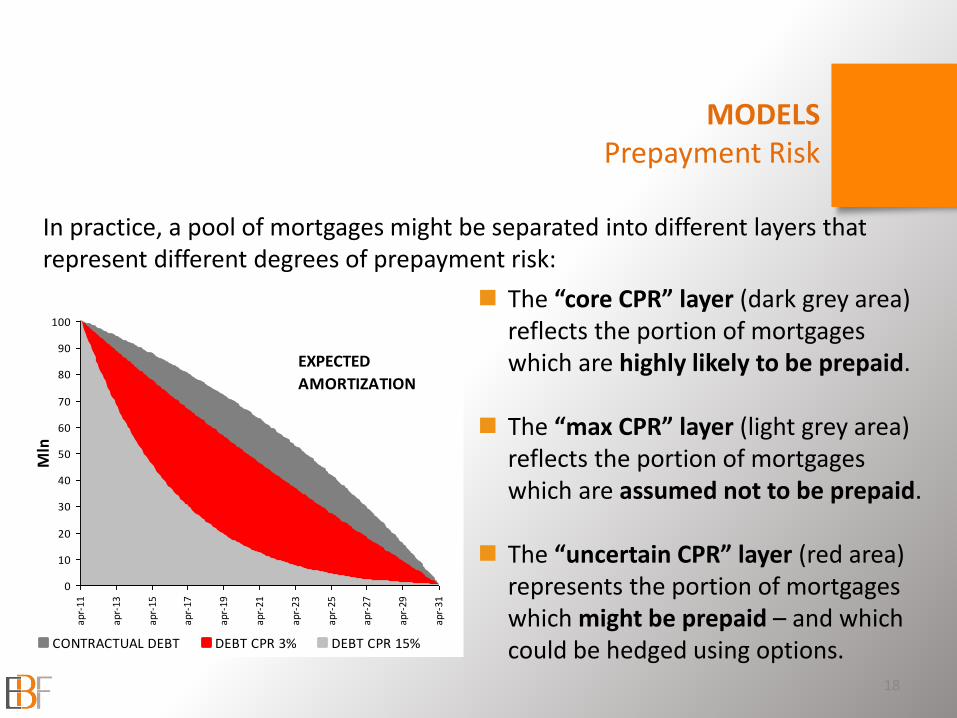
The “core CPR” layer (dark grey area) reflects the portion of mortgages which are highly likely to be prepaid.
The “max CPR” layer (light grey area) reflects the portion of mortgages which are assumed not to be prepaid.
The “uncertain CPR” layer (red area) represents the portion of mortgages which might be prepaid – and which could be hedged using options.
In practice, a pool of mortgages might be separated into different layers that represent different degrees of prepayment risk:
MODELS Prepayment Risk

19
From a contractual view point, sight deposits have an overnight maturity.
However, historical data show that, in aggregate, sight deposits are a relatively stable source of funding. Moreover, the average customer rate is rather sticky:
MODELS Sight Deposits
0
5
10
15
20
2005 2006 2007 2008 2009 2010
EUR
bn
0%
2%
4%
6%
8%
2005 2006 2007 2008 2009 2010
average customer rate1m Euribor10y average of 10y swap
20
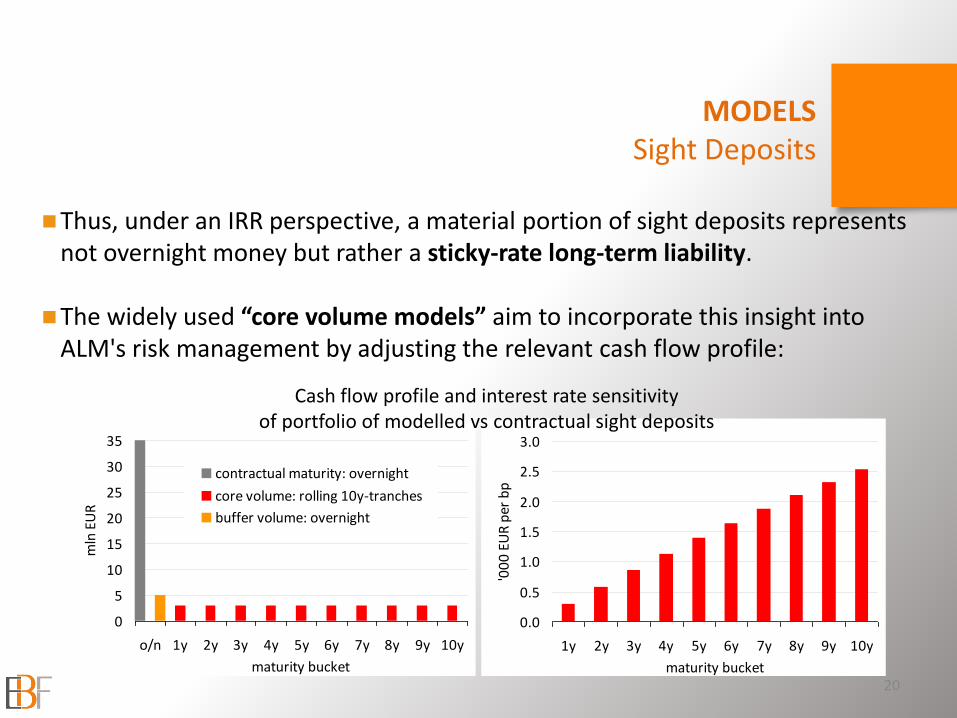
Thus, under an IRR perspective, a material portion of sight deposits represents not overnight money but rather a sticky-rate long-term liability.
The widely used “core volume models” aim to incorporate this insight into ALM's risk management by adjusting the relevant cash flow profile:
MODELS Sight Deposits
0
5
10
15
20
25
30
35
o/n 1y 2y 3y 4y 5y 6y 7y 8y 9y 10y
maturity bucket
mln
EU
R
contractual maturity: overnight
core volume: rolling 10y-tranches
buffer volume: overnight
0.0
0.5
1.0
1.5
2.0
2.5
3.0
1y 2y 3y 4y 5y 6y 7y 8y 9y 10y
maturity bucket
'00
0 E
UR
per
bp
Cash flow profile and interest rate sensitivity of portfolio of modelled vs contractual sight deposits

21
The third area where modelling is used in IRR are non-financial assets and liabilities. They are often modelled as "net equity" (i.e. equity less assets such as property or equipment plus liabilities such as pension reserves).
MODELS Non-Financial Assets and Liabilities
In a recent survey by PwC, 58% of the banks said they incorporated a target duration for their net equity/assets into the IRR management. The majority of them used a duration of between 1 and 5 years.
Many banks use a so-called replication model for this purpose (i.e. they model a bottom layer of their equity as a number of staggered fixed-rate tranches which are rolled over at regular intervals).
financial
assets
financial
liabilities
non-financial
assets
non-financial
liabilities
equity
net equity/
net assets
Overview
Models
Representing Hedging Activity
22
AGENDA IRRBB: Macro Hedging

Let’s consider the following simplified Balance Sheet:
The Bank has an interest risk exposure of EUR 100 at 10 year.
The Treasurer/ALM reduces the risk by hedging EUR 80 via derivatives
23
Hedging IRR
Loan EUR 100mln Funding EUR 100mln
Fixed rate 5% Floating rate Eur1M
Maturity: 10Y (bullet) Maturity: 10Y (bullet)
Balance SheetAssets Liabilities

The Bank hedges EUR 80mln of the Loan through IRS A (Pay 5% Rec Eur1M) accounted as a FVH derivative. Let’s assume interest rates falling, B/S and P/L will be as follows:
Loan EUR 100mln Funding EUR 100mln
Fixed rate 5% Floating rate Eur1M
Maturity: 10Y (bullet) Maturity: 10Y (bullet)
IRS A (Not. EUR 80mln)
Pay 5% Rec Eur1M
Maturity: 10Y (bullet)
Balance SheetAssets Liabilities
24
1. Hedging IRR through FVH derivatives
Negative FV = -10
as interest rates
have decreased
ΔFV (Hedged portion) =
+10
as interest rates have
decreased
Income Statement
Loan EUR 100mln 5
Funding EUR 100mln -100 x Eur1M
IRS A fixed leg -4
IRS A floating leg 80 x Eur1M
Interst income/expense 1 - 20 x Eur1M
Hedged Loan EUR 80mln 10
IRS A -10
FV adjustments 0

Loan EUR 100mln Funding EUR 100mln
Fixed rate 5% Floating rate Eur1M
Maturity: 10Y (bullet) Maturity: 10Y (bullet)
IRS B (Not. EUR 80mln)
Pay 5% Rec Eur1M
Maturity: 10Y (bullet)
CFH Valutation Reserve
EUR -10mln
AssetsBalance Sheet
Liabilities
The Bank hedges EUR 80mln of the Funding through IRS B (Pay 5% Rec Eur1M) accounted as a CFH derivative. Let’s assume interest rates falling, B/S and P/L will be as follows:
25
2. Hedging IRR through CFH derivatives
Negative FV = -10
as interest rates
have decreased
Income Statement
Loan EUR 100mln 5
Funding EUR 100mln -100 x Eur1M
IRS B fixed leg -4
IRS B floating leg 80 x Eur1M
Interst income/expense 1 - 20 x Eur1M

The Bank hedges EUR 40mln of the Loan through IRS A (Pay 5% Rec Eur1M) accounted as a CFH derivative and EUR 40mln of the Funding through IRS B (Pay 5% Rec Eur1M). Let’s assume interest rates falling, B/S and P/L will be as follows:
Loan EUR 100mln Funding EUR 100mln
Fixed rate 5% Floating rate Eur1M
Maturity: 10Y (bullet) Maturity: 10Y (bullet)
IRS A (Not. EUR 40mln)
Pay 5% Rec Eur1M
Maturity: 10Y (bullet)
IRS B (Not. EUR 40mln)
Pay 5% Rec Eur1M
Maturity: 10Y (bullet)
CFH Valutation Reserve
EUR -5mln
AssetsBalance Sheet
Liabilities
26
3. Hedging IRR a mix of FVH and CFH derivatives
Negative FV = -5
as interest rates
have decreased
ΔFV (Hedged
portion) = +5
as interest rates
have decreased
Income Statement
Loan EUR 100mln 5
Funding EUR 100mln -100 x Eur1M
IRS A fixed leg -2
IRS A floating leg 40 x Eur1M
IRS B fixed leg -2
IRS B floating leg 40 x Eur1M
Interst income/expense 1 - 20 x Eur1M
Hedged Loan EUR 40mln 5
IRS A -5
FV adjustments 0

Loan EUR 100mln Funding EUR 100mln
Fixed rate 5% Floating rate Eur1M
Maturity: 10Y (bullet) Maturity: 10Y (bullet)
IRS A (Not. EUR 80mln)
Pay 5% Rec Eur1M
Maturity: 10Y (bullet)
AssetsBalance Sheet
Liabilities
The Bank hedges EUR 80mln of the Loan through IRS A (Pay 5% Rec Eur1M) under Portfolio Revaluation Approach. Let’s assume interest rates falling, B/S and P/L will be as follows:
27
4. Hedging risk through derivatives under PRA
Negative FV = -10
as interest rates
have decreased
ΔFV (whole revaluation) =
+12,5
as interest rates
have decreased
Income Statement
Loan EUR 100mln 5
Funding EUR 100mln -100 x Eur1M
IRS A fixed leg -4
IRS A floating leg 80 x Eur1M
Interst income/expense 1 - 20 x Eur1M
Loan EUR 100mln 12.5
Funding EUR 100mln 0
IRS A -10
FV adjustments 2.5
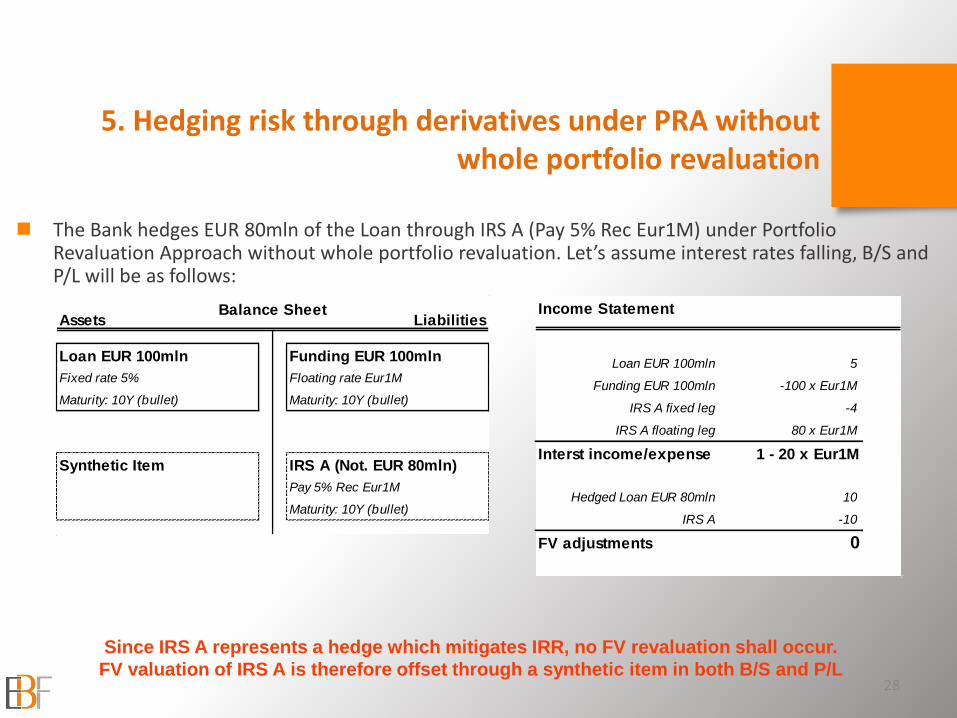
The Bank hedges EUR 80mln of the Loan through IRS A (Pay 5% Rec Eur1M) under Portfolio Revaluation Approach without whole portfolio revaluation. Let’s assume interest rates falling, B/S and P/L will be as follows:
Loan EUR 100mln Funding EUR 100mln
Fixed rate 5% Floating rate Eur1M
Maturity: 10Y (bullet) Maturity: 10Y (bullet)
Synthetic Item IRS A (Not. EUR 80mln)
Pay 5% Rec Eur1M
Maturity: 10Y (bullet)
AssetsBalance Sheet
Liabilities
28
5. Hedging risk through derivatives under PRA without whole portfolio revaluation
Since IRS A represents a hedge which mitigates IRR, no FV revaluation shall occur.
FV valuation of IRS A is therefore offset through a synthetic item in both B/S and P/L
Income Statement
Loan EUR 100mln 5
Funding EUR 100mln -100 x Eur1M
IRS A fixed leg -4
IRS A floating leg 80 x Eur1M
Interst income/expense 1 - 20 x Eur1M
Hedged Loan EUR 80mln 10
IRS A -10
FV adjustments 0