macro hedging detailed update june 2013 for amsterdam
TRANSCRIPT
The views expressed in this presentation are those of the presenter, not necessarily those of the IASB or IFRS Foundation. Official positions of the IASB on accounting matters are determined only after extensive due process and deliberation.
International Financial Reporting Standards
© 2013 IFRS Foundation | 30 Cannon Street | London EC4M 6XH | UK. www.ifrs.org
Accounting for Macro HedgingUpdate June 2013

Interaction with hedge accounting
2
‘Status quo’ pending completion of the project on accounting for macro hedging:
IFRS 9 HA model
IAS 39 HA model
‘macro FVH’
‘macro FVH’Scope-out
‘macro CFH’
‘macro CFH’
Accounting policy choice
Early application
No early application
2

International Financial Reporting Standards
Accounting for macro hedging:Project update
© 2013 IFRS Foundation. 30 Cannon Street | London EC4M 6XH | UK. www.ifrs.org

Project scope• Accounting for open portfolios or macro hedging
• Aim to develop an accounting solution so preparers can explain and users understand how businesses manage risk dynamically
• Considering an accounting solution for a variety of dynamic risk management activities. Not restricted to banks’ interest rate risk management, eg commodity and FX risk
4

International Financial Reporting Standards
Accounting for macro hedging:Portfolio revaluation approach
overview
© 2013 IFRS Foundation. 30 Cannon Street | London EC4M 6XH | UK. www.ifrs.org

What is macro hedging? 6
• Where risk management is undertaken on a dynamic basis for open portfolios:
– New exposures may be continuously added and existing exposures expire
– Exposures considered in contemplation of one another - the net risk position is managed
– Management is of risk from external exposures only– Given this, risk management is dynamic
• Another common factor is that calculation of risk managed exposures may include an element of estimation in terms of volume and/or timing.

Portfolio revaluation approach overview• The portfolio revaluation approach itself is simple
– complexity only arises when considering how and what should be revalued
• Exposures within the dynamically managed portfolio are revalued with respect to the managed risk
• No change to accounting for hedging instruments• Offset arises in profit or loss, to the extent of offsetting risk positions• Performance reflects transformed risk base• No requirement for specific linkage of exposures and hedging
instruments, consistent with risk management
7

Benefits of portfolio revaluation approach• Transparent representation of risk management activities
– Alignment between accounting and risk management view– Provides information on impact of risk management activity on
reported results– Information on residual risk positions
• Reduction in cumbersome patchwork hedge accounting solutions in financial statements
– Economic volatility is more accurately portrayed
• Operational relief from reduction in tracking and amortisations from frequent dedesignations and redesignations
• Greater opportunity to use data already used for risk management
8

Mechanics of the portfolio revaluation approach 9
Residual volatility
46
-50
25

Portfolio revaluation approach – balance sheet treatment
DR/(CR)
Balance sheet presentation
alternatives
Assets
Amortised
cost
Revaluation
adjustment Fair value
Line by
line
Gross
aggregate
Net
adjust
Retail Loans 1,000 11 1,011 1,000 1,000
Commercial Loans 750 30 780 750 750
Debt securities 500 (20) 480 500 500
Macro hedging revaluation 21
Derivatives 25 25 25 25
Liabilities
Deposits (400) 5 (395) (400) (400)
Issued debt securities (1,500) (40) (1,540) (1,500) (1,500)
Firm commitments (15) (15)
Macro hedging revaluation (50) (29)
(29) 25
P&L from risk management activities 4
10

Key aspects of the revaluation approach• Treat portfolio as unit of account, including behaviourisation
– Prepayable fixed rate loan portfolios
• Inclusion of exposures with ‘deemed’ interest rate risk – Equity model book– Core demand deposit replication portfolio
• Role of transfer pricing deals representing the transfer of risk to ALM for inclusion in dynamic risk management
– Benchmark rates only– Risks actually managed by ALM
• Gross treatment in P&L for internal derivatives• Portfolio revaluation adjustment is sum of revaluation
adjustment for individual exposures in portfolio
11

Overview of portfolio revaluation approach for typical bank 12
Fixed rate non prepayableinstruments
Firmcommitments
Floating rateinstruments
Hedginginstruments
Pipelinetransactions
Equity ModelBook
Core demanddeposits
Prepayablemortgages
Fair value
Revaluation of individual exposures by risk on
contractual basis
Revaluation of portfolio by risk on behaviourised basis
Non core demand deposits

Alternatives included within DP
• Scope– Holistic application wherever dynamic risk management is
undertaken (by risk)– Discrete sub-portfolios within dynamically managed portfolio– Mandatory v optional application
• Income statement presentation– Actual net interest rate approach – Stable net interest rate approach
• Statement of financial position presentation– Line by line gross up– Aggregate assets and liabilities– Net balance
13

More challenging risk managementconcepts also covered in DP
• Risk limits– As long as within the risk limit set by management, a hedge is
regarded as perfectly or automatically effective
• Bottom layer– For prepayable portfolios, assume all prepayment risk occurs
in top layer, until bottom layer is breached
• Proportional approach– Apply revaluation approach to hedged proportion of managed
portfolio, eg 80%
• Pipeline trades– Deemed fair value interest rate risk from publicly offered
financial instruments
14

International Financial Reporting Standards
Accounting for macro hedging:Application of portfolio revaluation
approach by banks for interest rate risk
© 2013 IFRS Foundation. 30 Cannon Street | London EC4M 6XH | UK. www.ifrs.org

What does dynamic risk management look like for banks? 16
• Risk management objective to transform net interest margin to have desired level of sensitivity to changes in market interest rates.
• For some (not all) banks the objective will be to stabilise net interest margin
• Usually achieved by balancing interest bearing assets and liabilities so timing and basis of future interest rate fixings, combined with derivatives, mitigate residual interest rate mismatches to desired amount
• Central asset and liability management (ALM) function often performs dynamic risk management for all banking book exposures using sensitivity or similar calculations to calculate residual risk positions

What the model should apply to• Which portfolios should the revaluation approach be applied
to?– Include all dynamically managed portfolios (likely to
mean whole banking book) or– Focused selection of discrete portfolios
• Optional or mandatory application• Key discussion is whether accounting for macro hedging
should reflect risk management in its entirety (holistic view) or only to the extent risk is actually hedged (minimisation of profit or loss volatility view)
• Core issue is the usefulness of the information provided
17

Scope alternatives
All banking book exposures
Dynamically managed banking book portfoliosUnmanaged or
static risk management
Dynamically managed banking book portfoliosUnmanaged or
static risk management
Sub portfolio
Sub portfolio
Sub portfolio
Sub portfolio
Dynamically managed banking book portfoliosUnmanaged or
static risk management
Apply revaluation approach
Do not apply revaluation approach
1
2
3
4
18

Eligibility of managed exposures 19
Exposures included within dynamic risk management
Eligible for inclusion within revalued portfolio
Recognised external assets and liabilities at amortised cost
Yes
External firm commitments - unrecognised contractual assets and liabilities
Yes
External pipeline transactions MaybeInternal exposures NoDeemed interest rate risk in non financial assets and liabilities
Maybe, depends on underlying exposure
Forecast external transactions NoRecognised external assets and liabilities at FVTPL No, possibly eligible
hedging instruments

Calculation of portfolio revaluation adjustment 20
• Portfolio revalued by aggregating the revaluation of allexposures in the portfolio for the managed risk
• Individual exposures revalued by calculating net present value (NPV) of cashflows included within dynamic risk management with respect to prevailing market interest rates. For example:
On 1 Jan 20XX a 5 year £100m loan paying 5% interest semi annually is given to a corporate. The interest rate risk transferred to ALM for management is the 5 year semi annual market interest rate, equal to 3%.
2% credit spread
coupon payable on the loan
3% market interest rate
market interest rate component included in dynamic risk management

Calculation of portfolio revaluation adjustment - Continued 21
1/1/20X3 30/6/20X3 31/12/20X3 30/6/20X4
Market interest rate * 3.0% 3.3% 3.6% 4.2%
NPV £100m £99m £98m £96m
Revaluation adjustment - £1m £2m £4m
30/6/X4 31/12/X4 30/6/X5 31/12/X5 30/6/X6 31/12/X6 30/6/X7 31/12/X7cash flows 1.5 1.5 1.5 1.5 1.5 1.5 101.5NPV £96
DCF based on 4.2% annualised market rate
* Assuming a flat yield curve

Actual net interest rate approach 22
Accrual for 6m libor deposit *
Accrual for 3% fixed rate loan
Clean present value of 3% fixed rate loan
Accrual for 3% fixed rate pay leg on swap
Accrual for 6m liborreceive leg on swap
Clean fair value of swap
Realised 3% cash flows on loan
Realised net cash flows on swap
Realised cash flows on deposit
Full present value of loan
Full fair value of swap
* Present value of deposit is zero as it refixes to market on valuation day
Interest revenue
Interest expense
Revaluation P&L
Net interest from risk management instruments
100 80
Unhedgedposition

Stable net interest rate approach 23
Accrual for 6m libor deposit *
Accrual for 3% fixed rate loan
Clean present value of 3% fixed rate loan
Accrual for 3% fixed rate pay leg on swap
Accrual for 6m liborreceive leg on swap
Clean fair value of swap
Realised 3% cash flows on loan
Realised net cash flows on swap
Realised cash flows on deposit
Full present value of loan
Full fair value of swap
* Present value of deposit is zero as it refixes to market on valuation day
Interest revenue
Revaluation P&L
100 80
Assumed realised and accrued 6m libor on loan
(to create stable NII)
Add
Interest expense
Take away
Unhedgedposition

Balance sheet presentation• Balance sheet presentation alternatives include:
– Line by line balance sheet gross up – exposures included within managed portfolio recognised at default carrying amount plusassociated revaluation adjustments
– Separate lines for aggregate adjustments to assets and liabilities – Single balance sheet line item for revaluation adjustment for managed assets, similar presentation for managed liabilities
– Single net balance sheet line item – net revaluation adjustments for all managed exposure recorded in single balance sheet line item
– Additional considerations required for unrecognised managed exposures
24

Portfolio as unit of account 25
• Where portfolios are managed on basis of behaviourised expected cash flows, treating the portfolio as unit of account best represents risk management in the financial statements
• Considering a prepayable mortgage portfolio:– Each borrower has an option to prepay their individual mortgage any time,
but a lender knows neither whether or when prepayment might occur for an individual mortgage.
– However, at a portfolio level, the lender can estimate the expected amount and timing of prepayments, based on past experience.
• Calculation of revaluation adjustment based on up to date estimates for outstanding mortgages in portfolio
– Reflects dynamic approach without need for tracking and amortisations– Where actual behaviour matches estimated behaviour no volatility if
perfectly hedged

Behaviourised portfolios
• Prepayable mortgage portfolio
26

Prepayment Risk in Demand Deposits
27
Core demand deposits
• At a portfolio level, the ‘sticky’ nature of demand deposits leads to existence of a stable portion in the amount outstanding.
• These core demand deposits are regarded as fixed rate deposits with longer maturities for risk management purposes.
• Strong homogeneous character as a portfolio, replacements in portfolio have same terms as other portfolio items in respect of maturity (on demand) and interest rates (zero or very low) and typically are insensitive to changes in market interest rates.
time
amountoutstanding
27

Core Demand Deposits - Simple Approach 28
on maturity new derivative to hedge new deemed fixed rate position will refix to prevailing market interest rate
10080 receive fixed derivative future derivative fixes at prevailing market rates 60 eg 1%4020
1 2 3 4 5 6 7 8 9 10 Periods(20)(40)(60) deemed 5 year pay fixed 0.1% future deemed fixed rate deposits likely (80) to fix at same interest rate(100)
on deemed maturity, deposit will refix, but as insensitive tomarket interest rates is likely to remain unchanged
3.9% net interest margin locked in for entire 5 year period future net interest margin sensitive to market ratesassumes all assets are floating rate (0.9% in above fact pattern)
assumes all assets are floating rate
eg 4%

Core Demand Deposits:Roll-over strategy / Replication Portfolio 29
1008060 5 Tranches of actual 5 year swaps fixed to prevail ing market rate when transacted40 Aggregate receive leg is roll ing 5 year average rate
201 2 3 4 5 6 7 8 9 10 Periods
(20)(40) deemed roll ing 5 year tranches l ikely to continue fix at same (60) 0.1% interest rate as insensitive to market interest rates(80)(100)
net interest margin sensitive to changes in 5 year rolling market rates
assumes all assets are floating rate
Receive fixed
swaps
Core deposits

Bottom layer and proportions 30
60 20
Jan X1 Feb X1 Mar X1
60
100
60
40
60
40 40 loans Jan X1 coupon 5 % loan Feb X1 coupon 4%swaps Jan X1 fixed coupon 5% loans Mar X1 coupon 3.5%
• Risk management objective for the above portfolio could be to hedge the bottom layer of 60 or 60% of whole portfolio
• Difficulties of identifying and quantifying the revaluation adjustment if hedging a proportion or a bottom layer of non homogeneous portfolio
• What if the proportion hedged changes. Eg to 70%• Which exposures make up bottom layer?

Role of internal transactions 31
Accounting Business Unit ALM Trading
Amortised cost
Fixed rate customer lending
Fixed rate internal lending
Amortised cost
Fixed rate internal funding
External floating rate funding
FVTPL Internal IRS Internal IRS
FVTPL External IRS
ALM hedging decision to transfer interest rate risk
to Trading desk
BU funding and interest rate risk
from external lending is transferred to ALM
Revaluation approach: Revaluation adjustment posted for exposures in managed
portfolio

Representation of managed risk
3% Market pricing index (eg
base rates)
2% Customer specific margin
2.9% Market funding index (eg 3m LIBOR
curve)
0.2% own external funding spread
1.4% Margin earned by Business Unit0.5% Internal funding spread
0.5% Margin earned by ALM
Business Unit makes a loan to a customer
Customer loan is internally funded by
ALM
1.9% Margin earned by Consolidated Bank
External pricing decision
Internal pricing decision
3.6% Transfer price5% Customer interest rate
• Internal lending (transfer pricing) transactions to quantify the cashflows that represent the managed risk in the external customer exposures
•Internal transfer pricing deals are not the managed exposures• If managing net interest margin the managed risk would be the market funding
index• Is the transfer pricing deal a good enough representation of the managed risk in
the external exposure?
32
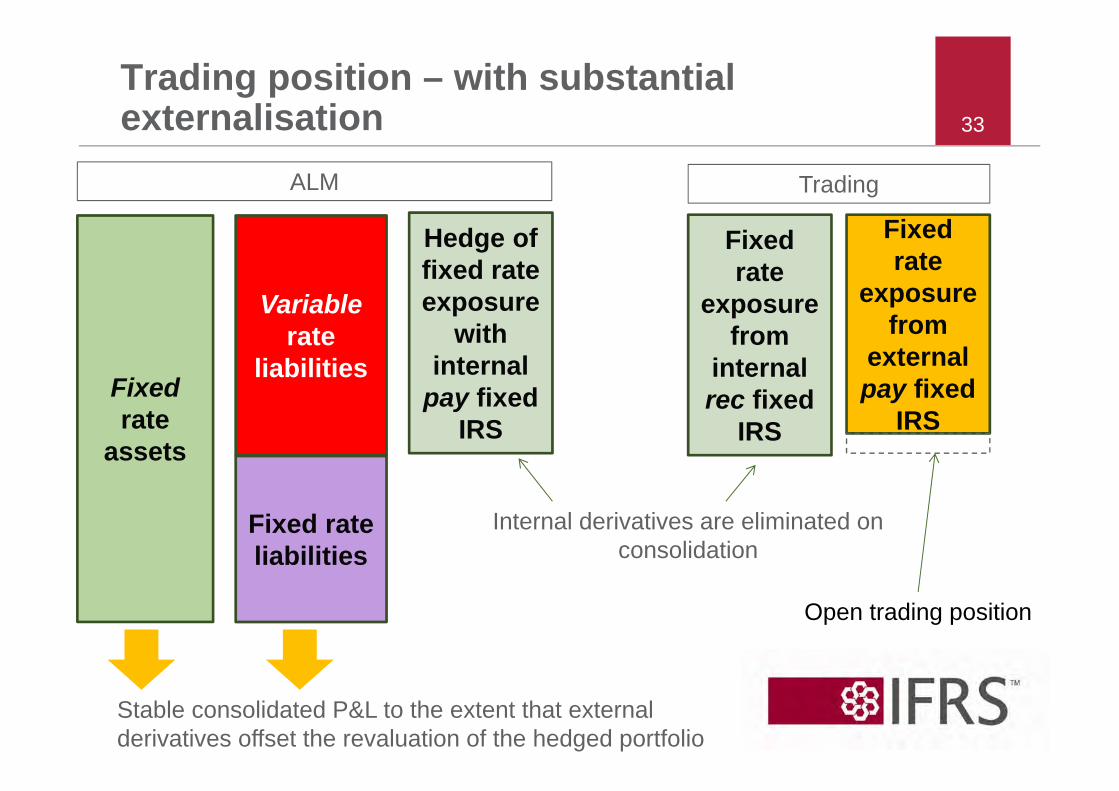
Trading position – with substantial externalisation
Fixedrate
assets
Variable rate
liabilities
Hedge of fixed rate exposure
with internal
pay fixed IRS
Fixed rate liabilities
33
ALM
Fixed rate
exposure from
internal rec fixed
IRS
Trading
Stable consolidated P&L to the extent that external derivatives offset the revaluation of the hedged portfolio
Internal derivatives are eliminated on consolidation
Fixed rate
exposure from
external pay fixed
IRS
Open trading position

Thank you 34
© 2012 IFRS Foundation. 30 Cannon Street | London EC4M 6XH | UK. www.ifrs.org

International Financial Reporting Standards
Accounting for macro hedging:Appendices
© 2013 IFRS Foundation. 30 Cannon Street | London EC4M 6XH | UK. www.ifrs.org
Deemed interest rate risk in non financial instruments 36
• Some banks disaggregate their return on equity into a base return and a residual return
• The base return is the return equity holders expect as compensation for providing investment
• The residual return is anything above that
• In order to ensure that banks can deliver that base return to equity holders, they may model that return and include it in their risk management activities - often called an Equity Model Book
• How might this risk management strategy be accommodated within an accounting solution for macro hedging?
• What are the implications if it is not?

Equity model book example – reduction in hedging activity
Fixedrate
assets
Variable rate
liabilities
Hedge of fixed rate exposure with payfixed IRS
EMB targeted fixed rate
return
37

Equity model book example – increase in hedging activity
Variablerate
assets
Variable rate
liabilities
Hedge of fixed rate exposure
with receive
fixed IRS
EMBtargeted fixed rate
return
38

Pipeline trades: conceptual basis?
• Pipeline trades: financial instruments that are publicly offered for a period of time at fixed rates. For example fixed rate mortgage or deposit rates advertised in branches
– Transactions are only anticipated, similar to a forecast transaction
– Deemed to have fair value interest rate risk as bank would feel obliged to honour the offer due to commercial pressures
• However, is there any conceptual basis for recognisingrevaluation of a pipeline trade as an asset or liability?
39

Risk limits 40
• The basic concept of incorporating risk limits into the revaluation approach is:As long as the amount of risk is within the risk limit set by management, a hedge is regarded as perfectly or automatically effective.
• Such an approach presents a moral hazard:The wider the risk limits are, the less revaluation volatility is recorded in profit or loss
• Operational difficulties if risk limits are breached• Usefulness of information

Impact of risk limits approach 41
Bank 2 revaluation volatility
Bank 1 revaluation volatility
0
5
10
15
20
25
Risk
Time
Risk position
Bank 1 risk limit
Bank 2 risk limit
Understanding resultant P&L volatility 42
• Intentionally unhedged positions
• Imperfections in hedging strategies• Hedging instrument selection• Actual behaviour ≠ expected behaviour
• Fair valuation inputs for hedging instruments