interactions between aqueous fluids and … · interactions between aqueous fluids and silicate...
TRANSCRIPT

ii
“thesis_report_old” — 2010/4/26 — 13:54 — page 2 — #1 ii
ii
ii
Institut für Erd- und Umweltwissenschaften− Mineralogie −
INTERACTIONS BETWEENAQUEOUS FLUIDS AND SILICATE MELTS
Equilibration, partitioning and
complexation of trace elements
kumulative Dissertationzur Erlangung des akademischen Grades
"doctor rerum naturalium"(Dr. rer. nat.)
in der Wissenschaftsdisziplin "Mineralogie"
eingereicht an derMathematisch-Naturwissenschaftlichen Fakultät
der Universität Potsdam
von
Dipl.-Min. Manuela Borchert
November 2009
Betreuer: Prof. R. Oberhänsli und Dr. Christian Schmidt
Projektleiter: Dr. Max Wilke

Published online at the Institutional Repository of the University of Potsdam: URL http://opus.kobv.de/ubp/volltexte/2010/4208/ URN urn:nbn:de:kobv:517-opus-42088 http://nbn-resolving.org/urn:nbn:de:kobv:517-opus-42088

ii
“thesis_report_old” — 2010/4/26 — 13:54 — page B — #3 ii
ii
ii
"But o dear, o dear, o deary,When the end comes sad and dreary!
’Tis is a dreadful thing to tellThat on Max and Moritz fell!
All they did this book rehearses,
Both in pictures and in verses."
from "Max and Moritz"A juvenile history in seven tricks
by Wilhelm Busch
B

ii
“thesis_report_old” — 2010/4/26 — 13:54 — page C — #4 ii
ii
ii

ii
“thesis_report_old” — 2010/4/26 — 13:54 — page D — #5 ii
ii
ii
Acknowledgements
Many people supported me during the last three years, and this work has greatly benefitedfrom their help. First of all, I would like to express my gratitude to Max Wilke and ChristianSchmidt, who initiated and supervised this project. Without their continuous guidance, help,and encouragement, the research presented here could not have been accomplished. Theirdoors were always open for me to discuss various aspects of my work. Both encouraged andsupported me to attend several scientific meetings, which allowed me to practice presentationof my results and to get insights into new developments and directions in my research area.All in all, I had a great time and I could not imagine a better supervisor team − thanks a lot,Max and Christian!
I would like to thank Karen Appel for her enormous support during the measurements atbeamline L, and the active interest in my work, which included all the patient answers to plentyof my technical questions, the fruitful discussions, and the various comments that helped toimprove the quality of the presented manuscripts.
Furthermore, I like to thank all actual and former members of the work group "Mineralo-gie" at the Institut für Erd- und Umweltwissenschaften (Universität Potsdam) for their support,encouragement, and the possibility to collect teaching skills. In particular, I like to mentionRoland Oberhänsli, Uwe Altenberger, Romain Bousquet, Andreas Möller, Patrick O´Brien, andBeate Mocek. I also like to express my gratitude to all members of the department 3.3 at theGeoForschungsZentrum Potsdam for their support and lively discussion of my results, and thepossibility to use all laboratories and analytical instruments.
I would also apply my gratitude to following people: Reiner Schulz for his technicalsupport during the performance of the quench experiments, Antje Musiol for teaching me theusage of the ICP-OES and for her help during other laboratory work, Oona Appelt for her kindsupport during the EMP analyses, Andrea Gottsche, who introduced me to Ion Chromatog-raphy and her friendly support during some other laboratory work, and Jean Cauzid, PieterGlatzel, Kristina Kvashnina, and the beamline staff at ID22 and ID26 for their technical supportduring the measurements at the ESRF.
Finally, many thanks to my friends (and colleges) Maik, Anke, Franzi, Gregor, Nic, Fiore,Basti, Tina, Hans-Peter, Mónica, Ati, Andre, Sylvie, Nadine, and Max for the plenty of funny"after work" activities, and for their support during the stressful last few weeks of this work.
Last but not least I am very grateful to my family for their continuous support, under-standing, and encouragement during the last years. Thanks so much mum, dad, Micha, Di-ana, Jenny, Hanelore, Udo, grandma, grandpa, and of course, Maik and my beloved "little" sonAdrian.
D

ii
“thesis_report_old” — 2010/4/26 — 13:54 — page E — #6 ii
ii
ii

ii
“thesis_report_old” — 2010/4/26 — 13:54 — page F — #7 ii
ii
ii
Zusammenfassung
Die Entstehung und Entwicklung von Graniten steht seit Jahrzehnten im Fokus vieler geologi-scher Studien, da sich die Erdkruste zu großen Teilen aus granitoiden Gesteinen zusammen-setzt. Von besonderer Bedeutung für die Bildung von granitischen Schmelzen ist neben derTemperatur, der Wassergehalt der Schmelze, da dieser Parameter die chemische Zusammen-setzung der Schmelze entscheidend verändern kann. Die Entmischung wässriger Fluide ausSchmelzen führt zur Neuverteilung von Elementen zwischen diesen Phasen. Bedingt durchdie geringere Dichte des wässrigen Fluids im Vergleich zur Schmelze und dem Nebenge-stein, beginnt dieses aus tieferen Erdschichten aufzusteigen. Damit verknüpft ist nicht nur eineräumliche Trennung von Schmelze und Fluid, sondern auch die Alterierung des Nebengestein.Dieser Prozess ist insbesondere bei der Bildung von magmatisch-hydrothermalen Lagerstät-ten und in späten Entwicklungsstadien magmatischer Komplexe wichtig. Für ein detailliertesVerständnis dieser Prozesse ist es notwendig, das Elementverhalten in solchen Systemenin Abhängigkeit von Parametern wie Temperatur, Druck und chemischer Zusammensetzungdes Systems experimentell zu untersuchen, und Elementverteilungskoeffizienten als Funkti-on dieser Variablen zu bestimmen. Für die Untersuchungen sind insbesondere Spurenele-mente geeignet, da diese im Gegensatz zu Hauptelementen nicht essentiell für die Stabilitätweiterer auftretender Phasen sind, aber sehr sensibel auf Änderungen intensiver Variablenreagieren können. Zudem werden bei geochemischen Mineral- und Gesteinsanalysen vieleSpurenelemente, Spurenelementverhältnisse, und Spurenelementisotope als petrogenetischeIndikatoren verwendet, d.h. diese Daten liefern Informationen darüber, wann und in welcherTiefe und bei welchen chemischen Bedingungen ein Gestein gebildet worden ist, und welcheweiteren Prozesse es auf dem Weg zur Erdoberfläche durchlaufen hat. Allerdings sind für vie-le Spurenelemente die Abhängigkeiten der Verteilung zwischen Fluiden und Schmelzen vonintensiven Variablen nicht, oder nur unzureichend experimentell untersucht worden. Zusätzlichdazu basiert die Mehrheit der experimentell gewonnenen Verteilungskoeffizienten und derenInterpretation, insbesondere hinsichtlich der Elementkomplexierung im Fluid, auf der Analysevon schnell abgekühlten Phasen. Bisher ist nicht geklärt, ob solche Analysen repräsentativsind für die Zusammensetzungen der Phasen bei hohen Drücken und Temperaturen.
Das Ziel dieser Studie war die Erarbeitung eines experimentellen Datensatzes zur Spu-renelementverteilung zwischen granitischen Schmelzen und wässrigen Fluiden in Abhängig-keit von der Schmelzzusammensetzung, der Salinität des Fluids, des Drucks und der Tem-peratur. Ein Hauptanliegen der Arbeit bestand in der Weiterentwicklung einer experimentellenMethode bei welcher der Spurenelementgehalt im Fluid in-situ, d.h. unter hohen Drücken undTemperaturen, und im Gleichgewicht mit einer silikatischen Schmelze bestimmt wird. Die sogewonnenen Daten können anschließend mit den Resultaten von Abkühlexperimenten vergli-chen werden, um diese und auch Literaturdaten kritisch zu bewerten. Die Daten aller unter-suchten Spurenelemente dieser Arbeit (Rb, Sr, Ba, La, Y und Yb) zeigen:
1. unter den untersuchten Bedingungen eine Präferenz für die Schmelze unabhängig vonder chemischen Zusammensetzung von Schmelze und Fluid, Druck oder Temperatur,
2. die Verwendung von chloridhaltigen Fluiden kann die Verteilungskoeffizienten um 1 bis2 Größenordnungen anheben und
F
ii
“thesis_report_old” — 2010/4/26 — 13:54 — page G — #8 ii
ii
ii
3. für die Verteilungskoeffizienten von Sr, Ba, La, Y und Yb eine starke Abhängigkeit vonder Schmelzzusammensetzung im chloridischen System.
Der Vergleich der Daten der verschiedenen Methoden zeigt, dass insbesondere für chloridfreieFluide große Diskrepanzen zwischen den in-situ Daten und Analysen von abgeschreckten Pro-ben bestehen. Dieses Ergebnis beweist eindeutig, dass beim Abschrecken der Proben Rück-reaktionen stattfinden, und dass Daten, welche auf Analysen abgeschreckter Fluide basieren,nur eingeschränkt verwendet werden sollten. Die Variation der Verteilungskoeffizienten von Sr,Ba, La, Yb, und Y als Funktion der Schmelzzusammensetzung ist entweder auf eine Änderungder Komplexierung im Fluid und/oder einen anderen veränderten Einbau dieser Elemente indie Schmelze zurückzuführen. Daher wurde im Rahmen dieser Arbeit erstmals versucht, dieElementkomplexierung in silikatischen Fluiden direkt bei hohen Temperaturen und Drückenzu bestimmen. Die Daten für Sr zeigen, dass abhängig von der Schmelzzusammensetzungunterschiedliche Komplexe stabil sein müssen.
G
ii
“thesis_report_old” — 2010/4/26 — 13:54 — page H — #9 ii
ii
ii
Abstract
The origin and evolution of granites has been widely studied because granitoid rocks constitutea major portion of the Earth´s crust. The formation of granitic magma is, besides temperaturemainly triggered by the water content of these rocks. The presence of water in magmas playsan important role due to the ability of aqueous fluids to change the chemical composition ofthe magma. The exsolution of aqueous fluids from melts is closely linked to a fractionationof elements between the two phases. Then, aqueous fluids migrate to shallower parts of theEarth´s crust because of it´s lower density compared to that of melts and adjacent rocks. Thisprocess separates fluids and melts, and furthermore, during the ascent, aqueous fluids canreact with the adjacent rocks and alter their chemical signature. This is particularly impor-tant during the formation of magmatic-hydrothermal ore deposits or in the late stages of theevolution of magmatic complexes. For a deeper insight to these processes, it is essential toimprove our knowledge on element behavior in such systems. In particular, trace elements areused for these studies and petrogenetic interpretations because, unlike major elements, theyare not essential for the stability of the phases involved and often reflect magmatic processeswith less ambiguity. However, for the majority of important trace elements, the dependence ofthe geochemical behavior on temperature, pressure, and in particular on the composition ofthe system are only incompletely or not at all experimentally studied. Former studies often fo-cus on the determination of fluid−melt partition coefficients (Df/m
X =cfluidX /cmelt
X ) of economicallyinteresting elements, e.g., Mo, Sn, Cu, and there are some partitioning data available for ele-ments that are also commonly used for petrological interpretations. At present, no systematicexperimental data on trace element behavior in fluid−melt systems as function of pressure,temperature, and chemical composition are available. Additionally, almost all existing data arebased on the analysis of quenched phases. This results in substantial uncertainties, particu-larly for the quenched aqueous fluid because trace element concentrations may change uponcooling.
The objective of this PhD thesis consisted in the study of fluid−melt partition coefficientsbetween aqueous solutions and granitic melts for different trace elements (Rb, Sr, Ba, La, Y,and Yb) as a function of temperature, pressure, salinity of the fluid, composition of the melt,and experimental and analytical approach. The latter included the refinement of an existingmethod to measure trace element concentrations in fluids equilibrated with silicate melts di-rectly at elevated pressures and temperatures using a hydrothermal diamond-anvil cell andsynchrotron radiation X-ray fluorescence microanalysis. The application of this in-situ methodenables to avoid the main source of error in data from quench experiments, i.e., trace elementconcentration in the fluid. A comparison of the in-situ results to data of conventional quenchexperiments allows a critical evaluation of quench data from this study and literature data.
In detail, starting materials consisted of a suite of trace element doped haplograniticglasses with ASI varying between 0.8 and 1.4 and H2O or a chloridic solution with m NaCl/KCl=1and different salinities (1.16 to 3.56 m (NaCl+KCl)). Experiments were performed at 750to 950◦C and 0.2 or 0.5 GPa using conventional quench devices (externally and internallyheated pressure vessels) with different quench rates, and at 750◦C and 0.2 to 1.4 GPa within-situ analysis of the trace element concentration in the fluids. The fluid−melt partitioning data
H

ii
“thesis_report_old” — 2010/4/26 — 13:54 — page I — #10 ii
ii
ii
of all studied trace elements show
1. a preference for the melt (Df/m < 1) at all studied conditions,
2. one to two orders of magnitude higher Df/m using chloridic solutions compared to exper-iments with H2O,
3. a clear dependence on the melt composition for fluid−melt partitioning of Sr, Ba, La, Y,and Yb in experiments using chloridic solutions,
4. quench rate−related differences of fluid−melt partition coefficients of Rb and Sr, and
5. distinctly higher fluid−melt partitioning data obtained from in-situ experiments than fromcomparable quench runs, particularly in the case of H2O as starting solution.
The data point to a preference of all studied trace elements for the melt even at fairly high salin-ities, which contrasts with other experimental studies, but is supported by data from studies ofnatural co-genetically trapped fluid and melt inclusions. The in-situ measurements of trace el-ement concentrations in the fluid verify that aqueous fluids will change their composition uponcooling, which is in particular important for Cl free systems. The distinct differences of thein-situ results to quench data of this study as well as to data from the literature signify the im-portance of a careful fluid sampling and analysis. Therefore, the direct measurement of traceelement contents in fluids equilibrated with silicate melts at elevated PT conditions representsan important development to obtain more reliable fluid−melt partition coefficients. For furtherimprovement, both the aqueous fluid and the silicate melt need to be analyzed in-situ becausepartitioning data that are based on the direct measurement of the trace element content in thefluid and analysis of a quenched melt are still not completely free of quench effects.
At present, all available data on element complexation in aqueous fluids in equilibriumwith silicate melts at high PT are indirectly derived from partitioning data, which involves inthese experiments assumptions on the species present in the fluid. However, the activitiesof chemical components in these partitioning experiments are not well constrained, which isrequired for the definition of exchange equilibria between melt and fluid species. For example,the melt-dependent variation of partition coefficient observed for Sr imply that this element cannot only be complexed by Cl− as suggested previously. The data indicate a more complicatedcomplexation of Sr in the aqueous fluid. To verify this hypothesis, the in-situ setup was alsoused to determine strontium complexation in fluids equilibrated with silicate melts at desired PTconditions by the application of X-ray absorption near edge structure (XANES) spectroscopy.First results show a strong effect of both fluid and melt composition on the resulting XANESspectra, which indicates different complexation environments for Sr.
I

ii
“thesis_report_old” — 2010/4/26 — 13:54 — page J — #11 ii
ii
ii
List of abbreviations
ASI alumina saturation index, ASI=Al2O3/(Na2O+K2O) in molescf
X concentration of element X in the fluidcm
X concentration of element X in the meltDf/m
X partition coefficient of element XEHPV externally heated pressure vesselEMPA electron microprobe analysisEXAFS extended X-ray absorption fine structureHDAC hydrothermal diamond-anvil cellIC Ion chromatographyICP-OES Inductively-couple plasma - optical emission spectrometryIHPV internally heated pressure vessellaser ablation ICP-MS laser ablation Inductively-couple plasma - mass spectrometryRQ rapid quenchSR-µXRF Synchrotron Radiation X-ray fluorescence microanalysisSQ slow quenchXAFS X-ray absorption fine structureXANES X-ray absorption near edge structure
J

ii
“thesis_report_old” — 2010/4/26 — 13:54 — page 1 — #12 ii
ii
ii
Contents
1 Introduction 8
2 Partitioning and equilibration of Rb and Sr between silicate melts and aqueousfluids 162.1 Introduction . . . . . . . . . . . . . . . . . . . . . . . . . . . . . . . . . . . . . . . 172.2 Experimental methods . . . . . . . . . . . . . . . . . . . . . . . . . . . . . . . . . 18
2.2.1 Starting Materials . . . . . . . . . . . . . . . . . . . . . . . . . . . . . . . 182.2.2 Hydrothermal diamond-anvil cell . . . . . . . . . . . . . . . . . . . . . . . 202.2.3 Sample preparation . . . . . . . . . . . . . . . . . . . . . . . . . . . . . . 202.2.4 HDAC experiments . . . . . . . . . . . . . . . . . . . . . . . . . . . . . . . 212.2.5 XRF spectra acquisition and calibration . . . . . . . . . . . . . . . . . . . 222.2.6 EMP analyses . . . . . . . . . . . . . . . . . . . . . . . . . . . . . . . . . 24
2.3 Results and Discussion . . . . . . . . . . . . . . . . . . . . . . . . . . . . . . . . 242.4 Conclusions . . . . . . . . . . . . . . . . . . . . . . . . . . . . . . . . . . . . . . . 28
3 Rb and Sr partitioning between haplogranitic melts and aqueous solutions 343.1 Introduction . . . . . . . . . . . . . . . . . . . . . . . . . . . . . . . . . . . . . . . 353.2 Experimental and analytical methods . . . . . . . . . . . . . . . . . . . . . . . . . 38
3.2.1 Starting materials and sample preparation . . . . . . . . . . . . . . . . . . 383.2.2 Quench experiments . . . . . . . . . . . . . . . . . . . . . . . . . . . . . . 393.2.3 In-situ experiments . . . . . . . . . . . . . . . . . . . . . . . . . . . . . . . 393.2.4 Analysis of run products . . . . . . . . . . . . . . . . . . . . . . . . . . . . 40
3.3 Results . . . . . . . . . . . . . . . . . . . . . . . . . . . . . . . . . . . . . . . . . 413.4 Discussion . . . . . . . . . . . . . . . . . . . . . . . . . . . . . . . . . . . . . . . 44
3.4.1 Quench effects . . . . . . . . . . . . . . . . . . . . . . . . . . . . . . . . . 443.4.2 Fluid−melt partitioning and complexation of Rb and Sr . . . . . . . . . . . 463.4.3 Modeling of the behavior of Rb and Sr during evolution of a granitic system 47
3.5 Conclusions . . . . . . . . . . . . . . . . . . . . . . . . . . . . . . . . . . . . . . . 48
4 Partitioning of Ba, La, Yb, and Y between haplogranitic melts and aqueous solu-tions 604.1 Introduction . . . . . . . . . . . . . . . . . . . . . . . . . . . . . . . . . . . . . . . 624.2 Experimental and analytical methods . . . . . . . . . . . . . . . . . . . . . . . . . 64
4.2.1 Starting materials and sample preparation . . . . . . . . . . . . . . . . . . 64
1

ii
“thesis_report_old” — 2010/4/26 — 13:54 — page 2 — #13 ii
ii
ii
CONTENTS
4.2.2 Quench experiments . . . . . . . . . . . . . . . . . . . . . . . . . . . . . . 654.2.3 In-situ experiments . . . . . . . . . . . . . . . . . . . . . . . . . . . . . . . 654.2.4 Analysis of run products . . . . . . . . . . . . . . . . . . . . . . . . . . . . 67
4.3 Results . . . . . . . . . . . . . . . . . . . . . . . . . . . . . . . . . . . . . . . . . 684.3.1 Quench experiments . . . . . . . . . . . . . . . . . . . . . . . . . . . . . . 684.3.2 HDAC experiments - evaluation of sensitivity . . . . . . . . . . . . . . . . 694.3.3 HDAC experiments - partitioning data . . . . . . . . . . . . . . . . . . . . 714.3.4 Comparison of quenched and HDAC runs . . . . . . . . . . . . . . . . . . 75
4.4 Discussion and conclusions . . . . . . . . . . . . . . . . . . . . . . . . . . . . . . 754.4.1 Fluid–melt partitioning . . . . . . . . . . . . . . . . . . . . . . . . . . . . . 754.4.2 In-situ XRF analyses using high excitation energies . . . . . . . . . . . . 81
5 Discussion and conclusions 92
6 Outlook 986.1 Further improvements of the in-situ method . . . . . . . . . . . . . . . . . . . . . 986.2 Strontium complexation in fluids equilibrated with silicate melts at high PT con-
ditions . . . . . . . . . . . . . . . . . . . . . . . . . . . . . . . . . . . . . . . . . . 99
References
Appendix
A Additional fluid−melt partitioning data - the system albite-quartz II
B Methods for fluid analyses in quenched experiments VIB.1 Inductively-coupled plasma - optical emission spectrometry . . . . . . . . . VIB.2 Ion Chromatography . . . . . . . . . . . . . . . . . . . . . . . . . . . . . . . . . VIII
C Curriculum Vitae X
2

ii
“thesis_report_old” — 2010/4/26 — 13:54 — page 3 — #14 ii
ii
ii
List of Figures
2.1 A - Schematic diagram showing the details of the modified Bassett-type hy-drothermal diamond anvil cell. B - Top view of the experimental setup at beam-line L, HASYLAB (DESY, HAMBURG) (after Schmidt and Rickers (2003), modi-fied). . . . . . . . . . . . . . . . . . . . . . . . . . . . . . . . . . . . . . . . . . . . 19
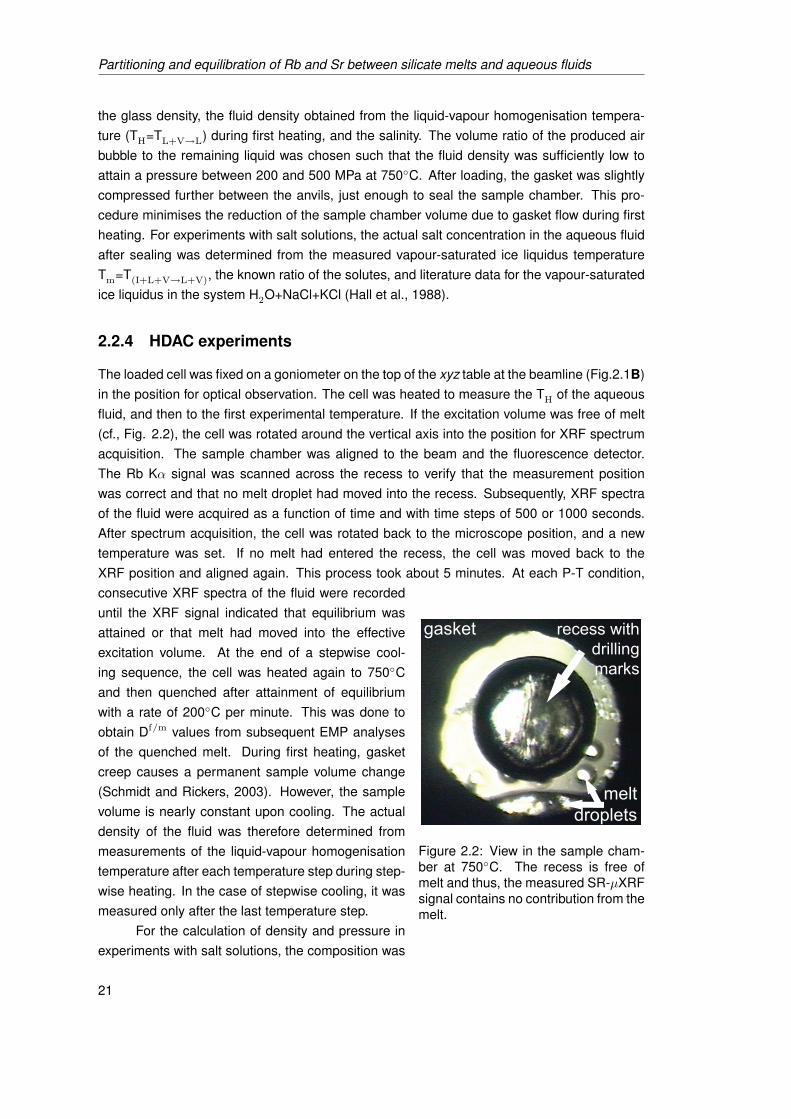
2.2 View in the sample chamber at 750◦C. The recess is free of melt and thus, themeasured SR-µXRF signal contains no contribution from the melt. . . . . . . . . 21
2.3 SR-µXRF spectra of a sample containing 2.84 m (NaCl+KCl) + 0.03 m HCl anda standard solution. . . . . . . . . . . . . . . . . . . . . . . . . . . . . . . . . . . 23
2.4 Concentration of trace elements Rb and Sr in the aqueous fluid vs. elapsed timeafter attainment of the experimental temperature Texp for various fluid composi-tions: A - 3.56 m (NaCl+KCl) + 0.04 m HCl, B - 2.84 m (NaCl+KCl) + 0.03 mHCl and, C H2O. The error bars represent 2σ errors. . . . . . . . . . . . . . . . . 26
2.5 Rb/Sr ratio in the fluid vs. pressure. The diagram shows a constant Rb/Sr ratio at750◦C for various compositions and low pressures. For H2O−melt experimentsat constant temperatures we see a strong pressure dependence of the Rb/Srratio in the fluid. . . . . . . . . . . . . . . . . . . . . . . . . . . . . . . . . . . . . . 27
2.6 Fluid−melt partition coefficients of Rb and Sr vs. initial salt concentration ofthe fluid [m (NaCl+KCl)] at 750◦C. For similar pressures an increase of initialsalt concentration corresponds to an increase of Df/m
Rb and Df/mSr . For H2O−melt
experiments, we observed a pressure dependence of the D values particularlyfor Rb (light grey symbols = experiment at 700 MPa). . . . . . . . . . . . . . . . . 28
3.1 Rubidium partition coefficient obtained for chloridic and non-chloridic fluids vs.melt composition expressed as ASI. PT conditions are as indicated by symbols.Errors (±1σ) are smaller than symbol size. RQ - rapid quench, SQ - slow quench. 42
3.2 Strontium partition coefficient obtained for chloridic and non-chloridic fluids vs.melt composition expressed as ASI. PT conditions are as indicated by symbols.Errors (±1σ) are smaller than symbol size. RQ - rapid quench, SQ - slow quench. 43
3.3 Rb/Sr ratio in the fluid vs. pressure determined in-situ at 750◦C for non-chloridic(Fig. 3.3.1 ) and chloridic fluids (Fig. 3.3.2). All starting glasses had the samemetaluminous composition. Error bars - ±1σ. . . . . . . . . . . . . . . . . . . . . 43
3

ii
“thesis_report_old” — 2010/4/26 — 13:54 — page 4 — #15 ii
ii
ii
LIST OF FIGURES
3.4 Partition coefficients of Rb and Sr at 750◦C from HDAC experiments as functionof pressure and salinity. Results for non-chloridic solutions are shown in Fig.3.4.1 and data for chloridic fluids are presented in Fig. 3.4.2. Error bars - ±1σ. . 44
3.5 Comparison of fluid−melt partitioning data for Rb and Sr from quench andHDAC experiments, and for chloridic and non-chloridic solutions. All data are fora temperature of 750◦C and metaluminous starting glass. Figure 3.5.1 showsthe data for Rb as a function of pressure and analogous for Sr in Fig. 3.5.2.Error bars - ±1σ. . . . . . . . . . . . . . . . . . . . . . . . . . . . . . . . . . . . . 45
3.6 Comparison of fluid−melt partition coefficients and Rb/Sr ratio in the fluid ob-tained in this study with literature data (Bai and Koster van Groos, 1999) forexperiments at 750◦C, 200 MPa, with metaluminous starting glasses. Figure3.6.1 shows the Rb/Sr ratio in the fluid as function of pressure for two salinityintervals, and Figs. 3.6.2 and 3.6.3 display the partition coefficients of Rb andSr for various salinities. Error bars - ±1σ. . . . . . . . . . . . . . . . . . . . . . . 48
3.7 Models for the Rb and Sr contents, and Rb/Sr ratio of the residual melt duringan isobaric crystallization path (200 MPa) assuming Rayleigh fractionation inFig. 3.7.1 and equilibrium crystallization in Fig. 3.7.2 using the peraluminousstarting composition (Ab38.92Or23.46Qz35.08+C2.53) with 3 wt.% total water. Solidlines based on fluid−melt partitioning data from this study, dashed lines - Df/m
from Bai and Koster van Groos (1999)). . . . . . . . . . . . . . . . . . . . . . . . 49
4.1 Barium partition coefficient at 750◦C and 200 MPa obtained from rapid and slowquenched experiments for chloridic and non-chloridic fluids vs. melt compositionexpressed as ASI. Errors (±1σ) are, in some cases, smaller than symbol size.RQ - rapid quench, IHPV - slow quench, (Pt) - Pt capsule, (Au) - Au capsule. . . 69
4.2 Partition coefficients from chloridic fluids of La, Yb and Y in the fluid vs. meltcomposition at 750◦C and 200 MPa (Fig. 4.2.1), and La partition coefficientobtained from quenched experiments for various PT conditions (Fig. 4.2.2).Error bars - ±1σ. . . . . . . . . . . . . . . . . . . . . . . . . . . . . . . . . . . . . 70
4.3 XRF spectra of a standard glasses SRM NIST612 and MPI DING ATHO-G. Bothspectra were collected with counting times of 500 seconds. . . . . . . . . . . . . 71
4.4 XRF spectra of a standard solution (A) and two samples using a chloridic solu-tion (B) or H2O (C) as starting fluid loaded in a HDAC. . . . . . . . . . . . . . . . 71
4.5 Minimum detection limits (MDL) determined for various elements from two stan-dard glasses (SRM NIST612 and MPI DING ATHO-G) and a standard solutionin HDAC2 and HDACG. The slightly different MDL´s from HDAC experimentsare due to different excitation volumes (different depths of recesses). . . . . . . . 72
4.6 Fluid−melt partition coefficient of Ba at 750◦C and the indicated pressure vs.initial Cl-molality of the fluid. Data from HDAC and quenched experiments areshown for peraluminous (Fig. 4.6.1) and metaluminous melt (Fig. 4.6.2). . . . . . 73
4.7 Fluid−melt partition coefficient of La at 750◦C and the indicated pressure vs.initial Cl-molality of the fluid. Data from HDAC and quenched experiments areshown for peraluminous (Fig. 4.7.1) and metaluminous melt (Fig. 4.7.2). . . . . . 73
4
ii
“thesis_report_old” — 2010/4/26 — 13:54 — page 5 — #16 ii
ii
ii
4.8 Yttrium fluid-melt partition coefficient at 750◦C and indicated pressures vs. initialCl-molality (Fig. 4.8.1) and at 750◦C and indicated fluid salinities vs. pressure(Fig. 4.8.2). Figures show data from HDAC and quenched experiments (thisstudy). For comparison, we also show the Y partition coefficient obtained usingF-rich starting material (Webster et al., 1989). . . . . . . . . . . . . . . . . . . . . 74
4.9 XRF intensity maps of fluorescence lines as indicated of sample chamber ofHDAC after experiment (E) indicating the formation of REE-bearing silicates. . . 74
6.1 Stronium XANES spectra of peralkaline and peraluminous starting glasses. . . . 1016.2 Strontium XANES spectra of peralkaline and peraluminous silicate fluids. . . . . 102
A.1 Comparison of partition coefficients of Na, Rb, and Sr from slow and rapidquenched experiments (Fig. A.1.1) and dependence of Df/m on the initial NaClconcentration in the fluid (Fig. A.1.2). . . . . . . . . . . . . . . . . . . . . . . . . . IV
A.2 The dependence of fluid−melt partition coefficients on the Df/mNa as a function of
melt composition are shown in Fig. A.2.1 for Rb and Fig. A.2.2 for Sr. . . . . . . V
5
ii
“thesis_report_old” — 2010/4/26 — 13:54 — page 6 — #17 ii
ii
ii
List of Tables
2.1 Summary of the experimental conditions, results of the in-situ SR-µXRF analy-ses of the aqueous fluids, and of the EMP analyses of the glasses, and calcu-lated partition coefficients (Dfluid/melt=cfluid/cmelt) at 750◦C. . . . . . . . . . . . . 24
3.1 Composition of starting glasses from EMP analyses and normative composi-tion based on the components albite, orthoclase, quartz, corundum and Na-metasilicate. . . . . . . . . . . . . . . . . . . . . . . . . . . . . . . . . . . . . . . 55
3.2 Data from experiments at 750◦C and 200 MPa using rapid quench autoclaves(RQ). For each run, the first line of the analyses refers to the quench glass andsecond line to the quenched fluid. . . . . . . . . . . . . . . . . . . . . . . . . . . 55
3.3 Data from experiments at 750◦C and 200 MPa using slow quench autoclaves(externally heated cold-sealed pressure vessels, SQ). For each run, the firstline of the analyses refers to the quench glass and second line to the quenchedfluid. . . . . . . . . . . . . . . . . . . . . . . . . . . . . . . . . . . . . . . . . . . . 56
3.4 Experimental conditions, starting materials and quench pH of the fluids for se-lected glass and fluid compositions . . . . . . . . . . . . . . . . . . . . . . . . . . 56
3.5 Data from experiments up to 950◦C and 850 MPa using internally heated cold-sealed pressure vessels (IHPV). For each run, the first line of the analysesrefers to the quench glass and second line to the quenched fluid. . . . . . . . . . 56
3.6 Experimentally determined fluid−melt partition coefficients of Na, K, Rb, Sr, Cl.and DK/DNa. . . . . . . . . . . . . . . . . . . . . . . . . . . . . . . . . . . . . . . 58
3.7 Experimental conditions and results of the HDAC experiments for chloridic flu-ids at 750◦C. Concentrations of Rb and Sr in the fluid were analyzed in-situusing SR-µXRF, the glasses were analyzed after quench using EMP. . . . . . . . 59
3.8 Experimental conditions and results of the HDAC experiments for non-chloridicfluids at 750◦C. Concentrations of Rb and Sr in the fluid were analyzed in-situusing SR-µXRF, the glasses were analyzed after quench using EMP. . . . . . . . 59
4.1 Composition of starting glasses from EMP analyses and normative composi-tion based on the components albite, orthoclase, quartz, corundum and Na-metasilicate. . . . . . . . . . . . . . . . . . . . . . . . . . . . . . . . . . . . . . . 87
6

ii
“thesis_report_old” — 2010/4/26 — 13:54 — page 7 — #18 ii
ii
ii
4.2 Data for Barium from experiments at 750◦C and 200 MPa using rapid quenchautoclaves (RQ) and internally heated pressure vessel (IHPV). For each run,the first line of the analyses refers to the quench glass and second line to thequenched fluid. . . . . . . . . . . . . . . . . . . . . . . . . . . . . . . . . . . . . . 87
4.3 Data for Lanthanum, Yttrium and Ytterbium from experiments from 750 to950◦C and 200 or 500 MPa using various quench apparatus. For each run,the first line of the analyses refers to the quench glass and second line to thequenched fluid. . . . . . . . . . . . . . . . . . . . . . . . . . . . . . . . . . . . . . 88
4.4 Experimentally determined fluid–melt partition coefficients of Na, K, Ba, Cl. andDK/DNa. . . . . . . . . . . . . . . . . . . . . . . . . . . . . . . . . . . . . . . . . 89
4.5 Experimentally determined fluid–melt partition coefficients of Na, K, La, Yb, Y,Cl. and DK/DNa. . . . . . . . . . . . . . . . . . . . . . . . . . . . . . . . . . . . . 89
4.6 Experimental conditions and results of the HDAC experiments fat 750◦C. Con-centrations of Ba, La and Y in the fluid were analysed in-situ using SR-µXRF,the glasses were analysed after quench using EMP. . . . . . . . . . . . . . . . . 90
A.1 Composition of AQ starting glasses from EMP analyses and normative composi-tion based on the components albite, quartz and corundum. TE - trace elementas indicated by sample name. . . . . . . . . . . . . . . . . . . . . . . . . . . . . . II
A.2 Analytical data and determined fluid−melt partition coefficients of Na, Rb, Sr,and Cl from experiments at 750◦C and 200 MPa. For each run, the first line ofthe analyses refers to the quenched glass and second line to the quenched fluid. III
B.1 ICP−OES instrumental conditions . . . . . . . . . . . . . . . . . . . . . . . . . . VIB.2 Emission lines (upper line, [nm]) and detection limits (lower line, [mg/l]) for ICP
analyses. . . . . . . . . . . . . . . . . . . . . . . . . . . . . . . . . . . . . . . . . VIIB.3 Operation conditions for determination of chloride by Ion Chromatography . . . . VIII

ii
“thesis_report_old” — 2010/4/26 — 13:54 — page 8 — #19 ii
ii
ii
Chapter 1
Introduction
Granites cover a great majority of igneous rocks in the Earth´s upper crust. Therefore, theorigin and evolution of granitic rocks has been widely studied in the last decades (e.g., Tuttleand Bowen, 1958, Holland, 1972, Whitney, 1988, Atherton, 1993). The formation of graniticmagmas is mainly a function of temperature and water content (Whitney, 1988). Therefore, thesolubility of water in granitic melts has been widely studied (e.g., Tuttle and Bowen, 1958, Burn-ham and Jahns, 1962, Holtz et al., 1992, 1995, 2000, Pailat et al., 1992, Pichavant et al., 1992,Yamashita, 1999, Behrens and Jantos, 2001). Evidence from volcanic and plutonic lithologiessuggests that water contents of 2 to 4 wt.% are present in most silicic magmas, and that atwater contents of ≥ 4 wt.% the magma would become water saturated at high pressures. Ex-solution of water from a fluid-saturated magma is a complex matter, but two main processescan be distinguished, (1) the saturation of initially volatile undersaturated magma by decom-pression, and (2) the volatile saturation of a stagnant, isobaric magma by cooling (e.g., Best,2003, Robb, 2005, Philpotts and Ague, 2009). The first process commonly occurs in shallowcrustal, volcanic environments because the magma exceeds water solubility during ascent.In the second process, the crystallization of anhydrous minerals, e.g., quartz, plagioclase, K-feldspar, result in an increased volatile content in the residual magma. When water saturationof the granitic melt exceeds, two liquid phases coexists: a silicate rich melt and an aqueousrich phase. The latter is, in this text, defined as an aqueous fluid. The exsolved aqueous phaseis likely to migrate due to lower density and viscosity compared to the silicate melt and the ad-jacent rock. The aqueous fluid attempts to re-equilibrate with all coexisting magmas and rocks.Therefore, elements that show a preference for the aqueous fluid can be separated and trans-ported from the magma extremely efficiently. This phenomenon is not only important for theformation of ore deposits, but also to understand how fluids affect magmatic processes, e.g.,efficiency of degassing of volcanic systems (Carroll and Holloway, 1994), and how interactionsbetween fluids and magmas may change the composition of the magma and/or crystallizingphases. Therefore, the determination of element partition coefficients between fluids and melts
Dfluid/meltX =cfluid
X /cmeltX ,
and the knowledge of their relation to intensive variables such as temperature, pressure, oxy-gen fugacity, bulk chemistry of the system, and the presence of additional volatile compo-nents (Cl, F, S) is important to understand and model element behavior during crystallization
8

ii
“thesis_report_old” — 2010/4/26 — 13:54 — page 9 — #20 ii
ii
ii
Introduction
and fractionation of natural systems, particularly during late stages of the magmatic evolution(Burnham, 1979).
So far, magmatic processes and phase relations are still to insufficiently known to un-derstood the major element variations in detail in suites of differentiated igneous rocks. Traceelement variations are helpful to unravel the petrogenetic evolution of rocks because, unlikemajor elements, they are not essential for the stability of the phases involved and often reflectmagmatic processes with less ambiguity because variations often are not linked to forma-tion of specific phases (e.g., Philpotts and Ague, 2009). If two or more phases coexist (e.g.,melt, mineral, liquid), a trace element under equilibrium conditions partitions itself between thephases. In the case of diluted concentrations, it can be expected that trace elements followHenry´s law (ai = Ki/Xi, where ai is the activity, Xi is the mole fraction, and Ki the Henry´s lawconstant of component i). Henry behavior of elements implies a strong simplification of mod-eling because the fractionation of elements between coexisting phases becomes independentof the their concentration up to a certain maximum level. During magma differentiation, sometrace elements, e.g., Ni, Cr, Co, Mg, and Fe, partition strongly into early crystallizing mineralswhich is described as compatible behavior. Incompatible trace elements are those that can-not substitute into the crystal structure of early forming minerals because of high ionic chargeand/or large ionic radius. Therefore, differentiated magmas are, among others, enriched in Ba,Rb, Sr, Zr, Cs, rare earth elements (REE), Hf, Th, Pb, and U. Ratios of two strongly incom-patible elements are useful to test for a cogenetic origin in suites of igneous rocks. Becausethey are independent of the fraction of liquid remaining and the phase properties, the ratioswill only change by assimilation of country rocks or mixing with magmas that have differentratios. Some trace elements are sensitive indicators of the degree of fractionation becausethey preferentially partition into a specific mineral. The magnitude of the effect produced bya mineral depends on its relative abundance and on the magnitude of the D value for a par-ticular element. For example, Ba2+, Sr2+, and Eu2+ easily substitute for Ca2+ in plagioclase.Rare earth elements are extremely useful trace elements in the study of igneous petrogenesisbecause of their high charge, relatively large ionic radius, and their similar geochemical behav-ior (Hanson, 1980). Furthermore, as their atomic weight increases, the ionic radius decreasewhich is known as lanthanide contraction. However, in granitoid melts, rare earth elementsdo not incorporate in major granite-forming minerals. Instead, they strongly fractionate intoaccessory phases, e.g., monazite, apatite, or sphene (e.g., Bea, 1996). The abundance of theREE´s in granitoid rocks is ≤ 100 ppm in the average upper continental crust, but increasewith increasing potassium content of the melt (Winter, 2001).
During the last three decades, numerous studies were performed to determine fluid−meltpartition coefficients of elements of economic or petrological interest. Most of the availabledata are based on experimental studies using quench apparatus, with synthetic or naturalmelts as starting materials, e.g., Cullers et al. (1973), Flynn and Burnham (1978), Candelaand Holland (1984), Urabe (1985), London et al. (1988), Webster et al. (1989), Keppler andWyllie (1990), Ayers and Eggler (1995), Bai and Koster van Groos (1999). Other studies ana-lyze synthetic or natural co-genetic fluid and melt inclusions using Laser ablation−inductivelycoupled plasma−mass spectrometry (LA-ICP-MS) analysis (e.g., Schäfer et al., 1999, Audé-tat and Pettke, 2003, Zajacz et al., 2008) or X-ray fluorescence microanalysis (Rickers et al.,
9

ii
“thesis_report_old” — 2010/4/26 — 13:54 — page 10 — #21 ii
ii
ii
Chapter 1
2006). An unisonous finding of these studies is that in systems with aqueous fluids dilutedin Cl−, the majority of elements show a preference for the melt, i.e., fluid−melt partition co-efficients are typically much smaller than one. The presence of complex−forming ligands inthe fluid, in particular Cl−, significantly enhances Df/m (e.g., Keppler and Wyllie, 1991, Bai andKoster van Groos, 1999, Zajacz et al., 2008). For example, Ayers and Eggler (1995) measuredpartition coefficients between a synthetic andesite melt and H2O, 1.5 and 3 m NaCl fluids at1.5−2.0 GPa and 1250◦C. They observed an increase of the partition coefficients of alkali el-ements from 0 to 1.5 m NaCl solution, but no further increase for a 3 m NaCl solution. Bai andKoster van Groos (1999) determined Df/m of various main and trace elements between vari-ous aqueous fluids (pure, chloridic, fluoridic, or carbonatic) and granitic melts at 750−800◦Cand 100−400 MPa. The results show that chloridic fluids significantly enhance the partitioncoefficients of Na, K, Rb, Sr, and Cu (Df/m>1 at salinities ≥ 3 m (Na,K)Cl ). In contrast, Al, Ge,Mo, W, La, and Ce strongly partition into the silicate melt. In the case of carbonatic fluids, onlyMo and Cu partition into the fluid. The latter result confirms the data of Webster et al. (1989)who also determined significantly smaller partition coefficients for various trace elements forH2O + CO2 fluids than for CO2−free aqueous solutions. Fluid−melt partitioning of economi-cally interesting trace elements, e.g., Cu, Mo, and W, between haplogranites and different Clbearing solutions were studied by Keppler and Wyllie (1991) for H2O-HCl solutions, and byCandela and Holland (1984) for aqueous (Na,K)Cl fluids at 750◦C and up to 200 MPa. Forcopper, both studies found an increase in the partition coefficient with increasing Cl concen-tration in the fluid (max. Df/m
Cu ≈ 100). In contrast, the observed partition coefficient of Mo washigh if water was the only volatile component present, but decreased strongly with increasingCl concentration (Keppler and Wyllie, 1991). This finding differs from the data by Candela andHolland (1984), who observed no correlation between Df/m
Mo and Cl concentration of the fluid. Apossible explanation can be the different fluid compositions, HCl and (Na,K)Cl solutions, usedin the studies. Schäfer et al. (1999) determined, among others, Mo and W partition coefficientsbetween a NaCl solution and a granitic melt at 850◦C and 200 MPa. Their data show a fivetimes higher partition coefficient for W than the data by Keppler and Wyllie (1991) and a similarbehavior of Mo. Schäfer et al. (1999) assume that a reason for this different behavior may bethe formation of hydroxyl complexes in the fluid that are not stable in the presence of highamounts of HCl but stabilized by the presence of NaCl.
Most of the elements show a qualitatively similar behavior if F− is present instead ofCl−. Keppler and Wyllie (1991) found increasing Df/m
U with increasing F− concentration in thefluid, but a decrease of the partition coefficient of Mo at the same conditions. However, thoriumshows a clear dependence on the F− content but a negligible correlation with the Cl− concen-tration while the opposite behavior is observed for Cu (Keppler and Wyllie, 1991). For the rareearth elements, a less significant fractionation into the F−bearing fluids was found than forfluids with a similar Cl− concentration (Flynn and Burnham, 1978). However, the data mightnot be comparable because the melt composition was severely affected by the HF solution.
In contrast to the effect of the fluid composition, the influence of melt composition ontrace element partitioning is, so far not very well investigated. Webster (1992a,b) and Metrichand Rutherford (1992) found a strong dependence of the Cl solubility in silicate melts on the al-kali/alumina ratio of the melt. Hence, the distribution of elements that form chloride complexes
10

ii
“thesis_report_old” — 2010/4/26 — 13:54 — page 11 — #22 ii
ii
ii
Introduction
in the fluid will among other variables depend on this ratio. Watson (1979) demonstrated thestrong influence of the composition of the silicate melt on the solubility of Zr in melts. Thedata show that zircon saturation is attained with less than 100 ppm Zr in peraluminous melts,whereas the Zr content may reach several wt.% in peralkaline compositions. This large differ-ence also reflected by much higher Df/m
Zr for peraluminous melts than for peralkaline silicateliquids. Flynn and Burnham (1978) studied the partitioning behavior of Ce, Eu, Gd and Yb be-tween an aqueous phase and water saturated silicate melts of different composition (SprucePine pegmatite and a jadeite-nepheline composition with 75 wt.% jadeite) at 800◦C and 125or 400 MPa. The data at constant Cl− concentration showed higher Df/m
REE for the Spruce Pinepegmatite melt than for the jadeite-nepheline composition. The authors suggested that thewater−saturated jadeite-nepheline melt is less polymerized than the water−saturated SprucePine pegmatite melt. This is because the jadeite-nepheline melt has a higher water contentand contains less tetrahedrally coordinated cations, e.g., silica. Therefore, the number of high-coordinated sites available for the substitution of REE is larger in the jadeite-nepheline meltcompared to the Spruce Pine pegmatite melt due to the higher water content (Flynn and Burn-ham, 1978, Ponader and Brown, 1989).
A further method to derive fluid−melt partition coefficients besides quenched experi-ments using hydrothermal autoclaves, is the analysis of fluid and melt inclusions. Schäfer et al.(1999), Hanley et al. (2005), and Simon et al. (2007) investigated synthetic quartz-hosted fluidand melt inclusions that were trapped at magmatic conditions. Audétat and Pettke (2003),Rickers et al. (2006), Zajacz et al. (2008), and Audétat et al. (2008) determined partition coeffi-cients based on analyses of natural co-existing fluid and melt inclusions. Partition coefficientsdetermined from synthetic and natural fluid and melt inclusions are also afflicted by specificuncertainties. In the case of natural samples, one has to verify that natural fluid and melt inclu-sions are co-genetically trapped. Furthermore, the bulk salinity of the aqueous fluid is unknownfor natural inclusions. The determination of the salinity of synthetic and natural fluid inclusionsis difficult because aqueous fluids unmix to vapor and brine upon cooling. For a precise de-termination of the salinity before unmixing, one needs to know the actual phase proportionsbecause the salinity is anywhere between the end points of the tie line. There might be alsochanges of the melt composition upon cooling (e.g., precipitation of quartz in quartz-hostedinclusions). However, the melt composition has a strong effect on fluid−melt partitioning oftrace elements as described in a previous paragraph. Further on, the application of the laserablation ICP-MS technique on the study of fluid and melt inclusions has two main sources oferror, (1) mixed analyses of inclusions and tiny precipitates at the inclusion walls, and (2) theseparation of the inclusion signal from that of the host mineral or matrix glass. The latter isminimized by using an internal standard that is also essential for the conversion of the deter-mined element ratios into absolute element concentrations Audétat and Pettke (2003). Zajaczet al. (2008) present a nearly complete comparison of experimentally obtained fluid−melt par-tition coefficients and calculated partitioning data using analyses of natural co-genetic fluid andmelt inclusions. The ranges of the partitioning data derived from experiments and natural dataoverlap, but partition coefficients derived from natural samples generally show less scattering.Zajacz et al. (2008) found good agreement between experimental data and analyses of fluidand melt inclusion for the elements Fe, Cu, Zn, Pb, Mo, W, Th, K and Rb. In contrast, the
11

ii
“thesis_report_old” — 2010/4/26 — 13:54 — page 12 — #23 ii
ii
ii
Chapter 1
results differ significantly for Li, Na, Sr, Sn, Zr, or Nb. For example, the data by Bai and Kostervan Groos (1999) suggest a preference of Sr for the fluid at high salinities, but available resultsfrom natural co-genetic fluid and melt inclusions in granites show partition coefficients that aredistinctly smaller than one even at high salinities (Audétat and Pettke, 2003, Rickers et al.,2006). In contrast, Zajacz et al. (2008) confirm the high Df/m
Sr presented by Bai and Koster vanGroos (1999), but also state that Sr concentration in silicate melt inclusions were always belowdetection limit and therefore, are associated with large errors.
At present, the literature does not provide a basis to develop an unifying picture becausemost of the experimental studies are not comparable to each other due to different elements ofinterest, variable PT conditions, and system compositions. Furthermore, the different behaviorof the elements in chloridic, fluoridic or pure aqueous solutions clearly points to a strong effectof complex formation in the fluid in equilibrium with silicate melt on the element distribution.
Comparison between different dataset´s are also difficult because systematic errors ofthe different experimental and analytical approaches are hard to quantify as no adequate ref-erence measurements are available. In all studies presented above, the data are based onthe analysis of quenched samples. Analyses of quenched phases, in particular of quenchedfluids, are associated with large intrinsic uncertainties due to (1) back reactions between fluidand melt, (2) the tendency of fluids to unmix or (3) precipitate solutes during cooling (Adamet al., 1997). Hence, the most difficult part of quenched experiments is to obtain a represen-tative sample of the fluid for analysis. Sampling of a quenched solution is complex and timeconsuming (e.g., Flynn and Burnham, 1978, Keppler and Wyllie, 1991). To avoid these diffi-culties of fluid sampling, some studies produced synthetic fluid inclusions, e.g., in quartz, atthe desired PT conditions (Hanley et al., 2005, Simon et al., 2007) or reconstructed the fluidcomposition via mass balance with modeling of undetermined parameters, e.g., H2O solubil-ity in the melt (e.g., Ayers and Eggler, 1995, Webster, 1992a,b). However, analysis of fluidinclusions is associated with other uncertainties as described previously, and recalculation ofthe fluid composition using mass balancing neglects other phases that might form during theexperiment. Mass balances makes use of literature data of, e.g., water solubility in the meltand solubility of melt components in the fluid. The dependencies of water solubility in silicatemelts on intensive variables is relatively well-known (e.g., Tuttle and Bowen, 1958, Burnhamand Jahns, 1962, Holtz et al., 1992, 1995, 2000, Pailat et al., 1992, Pichavant et al., 1992, Ya-mashita, 1999, Behrens and Jantos, 2001), but the solubility of melt components in aqueousfluids at elevated PT is almost unknown (Mysen and Armstrong, 2002). Approximations canbe made using data on SiO2 or NaAlSi3O8 solubility in water or chloridic fluids (e.g., Andersonand Burnham, 1965, Currie, 1968, Manning, 1994, Newton and Manning, 2000, Shmulovichet al., 2001).
A reliable determination of trace element concentrations in aqueous solutions can alsobe obtained by direct measurements in the fluid at elevated PT. These direct measurementsmake use of hydrothermal diamond-anvil cells (HDAC) and synchrotron radiation X-ray fluores-cence microanalysis (SR-µXRF) (e.g., Schmidt and Rickers, 2003, Sanchez-Valle et al., 2003,Schmidt et al., 2007, Manning et al., 2008). An important advantage of this method is theimproved reliability of low trace element contents, e.g., in Cl− free aqueous solutions becauseback reactions cannot alter the fluid composition. This is particularly important because here
12

ii
“thesis_report_old” — 2010/4/26 — 13:54 — page 13 — #24 ii
ii
ii
Introduction
the effect of back reactions on fluid−melt partition coefficients is larger compared to fluids withhigh chlorine contents. But, this technique is also limited because (1) elements with relativelylow Z cannot be analyzed or have a high detection limit, and secondly, this method is limited bythe interference of fluorescence lines of elements of interest with those from material outsidethe sample chamber. Elements that can be analyzed with confidence are for example Rb, Sr,Y, Zr, Nb, Mo, La using K fluorescence lines as well as U, Th (L fluorescence lines).
Furthermore, this experimental setup can also be used to obtain information on thecomplexation of elements in fluids at elevated temperatures and pressures using X-ray absorp-tion fine structure (XAFS) spectroscopic methods (i.e., X-ray absorption near edge structure[XANES] or extended X-ray absorption fine structure [EXAFS]). This may be extremely usefulbecause so far, the determination of the nature of the complexes in fluids at high PT and inequilibrium with silicate melts is still based on the correlation between partition coefficient andanion concentration in the fluid after quenching. For example, Flynn and Burnham (1978) con-cluded that the trivalent rare earths will form REECl3 complexes. Keppler and Wyllie (1991)found a linear increase of Df/m
U with the square of the fluoride concentration or with the thirdpower of Cl− content in the fluid. Bai and Koster van Groos (1999) suggested the formation ofSrCl2 complexes in the fluid due to the increase of the Sr partition coefficient with the squareof the (Na,K)Cl molality of the initial solution. For Rubidium, a linear increase of Df/m with m Clof the fluid was found by Webster et al. (1989), Bai and Koster van Groos (1999). That kind ofcorrelations require a defined exchange equilibrium reaction of the studied elements betweenthe phases as shown by e.g., Frank et al. (2003). However, these correlations might be wrongbecause the concentrations are wrong.
So far, XAFS was applied to study the formation, structure, and stability of rare-earthelement complexes (La, Nd, Eu, Gd, and Yb) in aqueous solutions under hydrothermal condi-tions (Mayanovic et al., 2007a,b, 2009a,b). One attempt has been made to gain informationon the complexation of Nb in hydrous silicate melt equilibrated with H2O or Na2CO3 aqueoussolution at elevated PT conditions (Mayanovic et al., 2007a). Up to now, no attempt has beenmade to study element complexation in fluids in equilibrium with silicate melt at magmatic con-ditions, but these data would elucidate whether information on the trace element complexationobtained from analyses of quenched fluids is plausible or not.
The major goal of this thesis is to obtain quantitative data on fluid−melt partitioning ofpetrological interesting elements, mainly Rb, Sr, Ba, La, Y, and Yb, and to understand howintensive variables, such as melt composition, fluid composition, pressure, and temperatureaffect the partition coefficients. So far, the effect of the melt composition on the fluid−meltpartitioning of the elements listed above is almost unknown. Therefore, we used a suite oftrace element doped haplogranitic glass compositions as starting material to cover a widerange of ASI (alumina saturation index of the melt) which can occur in natural granitoids. Here,we systematically varied the alkali to alumina ratio. Haplogranites were chosen because thephase relations in this system are very well studied (e.g., Tuttle and Bowen, 1958, Johannesand Holtz, 1996). In contrast, the effect of the fluid composition on fluid−melt partitioningof many elements is relatively well studied. Hence, we limited starting solutions to H2O andNaCl+KCl±HCl aqueous solutions with a m NaCl/KCl ratio of one. In the latter, the salinityranged from 1.16 to 3.6 m (NaCl+KCl) because the solute content of magmatic aqueous fluids
13

ii
“thesis_report_old” — 2010/4/26 — 13:54 — page 14 — #25 ii
ii
ii
Chapter 1
is quite variable, but dominated by alkali and alkaline earth metal cations and chlorine as majoranion (Roedder and Bodnar, 1997). Several experiments were performed with addition of HClto investigate the effect of the pH on trace element partitioning.
In the following paragraph, I will give a brief overview on the manuscripts presented inthe next chapters.
Of central importance within this project was the refinement of the technique to quan-tify trace element contents of the fluid phase directly at elevated PT-conditions for applica-tion to fluid−melt systems. To obtain this information, we used an analytical approach wherefluid analysis is achieved by synchrotron radiation X-ray fluorescence using a hydrothermaldiamond-anvil cell. This method is in detail described in chapter 2. The data presented heredemonstrate that this experimental approach can be used to determine the trace elementcontents in fluids equilibrated with silicate melts at elevated temperatures and pressures. Fur-thermore, it is shown that this technique can be used to obtain information on the equilibrationbehavior of trace elements in fluids at different temperatures and pressures steps. The directproof of back reactions of these elements between fluid and melt upon cooling cannot be ig-nored at least for Rb and Sr. Chapter 3 focusses on the main part of the thesis, and presentsan extensive Rubidium and Strontium fluid−melt partitioning data set. Fluid−melt partitioningof Rb and Sr was studied as function of temperature, pressure, and fluid and melt composi-tion using different experimental methods. The latter includes in-situ results and data obtainedfrom quenched experiments, in which the trace element concentration in the fluid is measuredby inductively coupled-plasma ? optical emission spectrometry and ion chromatography. Theeffect of different experimental techniques and the quench rates (slow vs. rapid) on fluid−meltpartitioning of trace elements due to variable trace element contents of the fluid is discussedhere, too. The partitioning behavior of Ba, La, Y, and Yb as function of melt and fluid compo-sition, pressure and temperature is discussed in chapter 4. The presented data also consistof in-situ as well as of quench results. In the case of Ba, all quenched experiments and anal-yses of the quenched phases were performed by Matthias Ebert as part of his diploma thesisbased on the quench method described in chapter 3. First results on the complexation of Srin various silicate solutions at elevated pressures and temperatures obtained using XANESspectroscopy and HDAC are presented as part of the outlook (Chapter 6). The first qualitativeresults provide an explanation of the observed dependence of strontium fluid−melt partitioncoefficients on the melt composition (ASI).
14

ii
“thesis_report_old” — 2010/4/26 — 13:54 — page 15 — #26 ii
ii
ii

ii
“thesis_report_old” — 2010/4/26 — 13:54 — page 16 — #27 ii
ii
ii
Chapter 2
Partitioning and equilibration ofRb and Sr between silicate meltsand aqueous fluids
published in:Chemical Geology 259, 39−47 (2009)
16
ii
“thesis_report_old” — 2010/4/26 — 13:54 — page 17 — #28 ii
ii
ii
Partitioning and equilibration of Rb and Sr between silicate melts and aqueous fluids
Partitioning and equilibration of Rb and Sr between silicatemelts and aqueous fluids
Manuela Borcherta,?, Max Wilkeb, Christian Schmidtb, Karen Rickersc
a Universität Potsdam, Karl-Liebknecht-Str.24, 14476 Potsdam-Golm, Germanyb Deutsches GeoForschungsZentrum (GFZ), Section 4.1, Telegrafenberg, 14473 Potsdam, Germanyc Hamburger Synchrotronstrahlungslabor at Deutsches Elektronensynchrotron, Notkestr. 85, 22607 Hamburg, Ger-
many
Abstract
Trace element concentrations in aqueous fluids in equilibrium with haplogranitic melt were determined in-situ at el-
evated P-T conditions using hydrothermal diamond-anvil cells and synchrotron-radiation XRF microanalyses. Time-
resolved analyses showed that the Rb and Sr concentrations in the fluids became constant in less than 2000 seconds
at all temperatures (500 to 780◦C). Although fluid-melt equilibration was very rapid, the change in the concentration of
both elements in the fluid with temperature was fairly small (a slight increase for Rb and a slight decrease for Sr). This
permitted partitioning data for Rb and Sr between haplogranitic melt and H2O or NaCl+KCl+HCl aqueous solutions at
750◦C and 200 to 700 MPa to be obtained from EMP analyses of the quenched melt and the in-situ SR-XRF analy-
ses of the equilibrated fluid. The resulting Df/mRb and Df/m
Sr were 0.01±0.002 and 0.006±0.001 for water as starting
fluid, and increased to 0.47±0.08 and 0.23±0.03 for 3.56 m (NaCl+KCl) + 0.04 m HCl at pressures of 224 to 360
MPa. In the experiments with H2O as starting fluid, the partition coefficients increased with pressure, i.e. Df/mRb from
0.01±0.002 to 0.22±0.02 and Df/mSr from 0.006±0.001 to 0.02±0.005 with a change in pressure from 360 to 700
MPa. At pressures to 360 MPa, the Rb/Sr ratio in the fluid was found to be independent of the initial salt concentration
(Rb/Sr = 1.45±0.6). This ratio increased to 7.89±1.95 at 700 MPa in experiments with chloride free fluids, which
indicates different changes in the Rb and Sr speciation with pressure.
Keywords: synchrotron-radiation X-ray fluorescence microanalysis, hydrothermal diamond-anvil cell, fluid-melt par-
tition coefficients, melt-fluid equilibration
? Corresponding author.
E-mail address:[email protected] (M.Borchert)
2.1 Introduction
Interactions between magmas and aqueous solutions play an important role in many geologi-cal processes, e.g., volcanic eruptions, the development of mid-ocean ridges, the formation ofmagmatic-hydrothermal ore deposits, and crustal metamorphic systems. Equilibria betweentwo or more fluids often result in strong fractionation particularly of trace elements (e.g., Hol-land, 1972, Rickers et al., 2006). Furthermore, many trace elements are used as petrogeneticindicators in igneous systems (cf., Best, 2003, Winter, 2001). This has prompted several exper-imental studies on element partitioning at fluid immiscibility conditions over the last 20 years.
17

ii
“thesis_report_old” — 2010/4/26 — 13:54 — page 18 — #29 ii
ii
ii
Chapter 2
The trace element partitioning between aqueous fluids and granitic melts was investigated byFlynn and Burnham (1978), London et al. (1988), Keppler and Wyllie (1991), Ayers and Eggler(1995), Adam et al. (1997) and Bai and Koster van Groos (1999). However, systematic studiesof fluid-melt partitioning are far from being complete, even for the petrogenetically importantlarge ion lithophile (LIL) elements Rb and Sr. Furthermore, the majority of the experimentallydetermined partitioning data is based on analyses of quenched samples. However, intrinsicuncertainties are associated with fluid-melt partitioning data from quench techniques, whichmake it problematic to obtain unambiguous data, particularly for the trace element concentra-tion in the fluid. The uncertainties are related to (i) the difficulty of isolating the fluid phase forsampling and analysis, (ii) fluid unmixing and (iii) precipitation of solids during quenching, andpossible back reactions between fluid and melt during cooling (Adam et al., 1997, Holtz et al.,1995, Behrens et al., 2001).
In this study, we therefore applied a technique to determine the trace element concen-tration in the fluid phase directly at elevated pressures and temperatures using a modifiedhydrothermal diamond-anvil cell (HDAC) and synchrotron-radiation X-ray fluorescence micro-analysis (SR-µXRF). The first goal of this study is to determine the Rb and Sr concentrationsin the fluid in-situ in equilibrium with a metaluminous melt at 750◦C and 200 MPa. The meltdroplets cannot be analysed in-situ with confidence due to coexcitation of the aqueous fluidaround the droplets. Even if the incident beam is focused, a portion of these X-rays will bescattered in the diamond anvil, and a contribution from coexcited fluid to the XRF signal istherefore inevitable if the measurements are done in forward scattering geometry, (e.g., Bu-reau et al., 2007). Such a contribution can be minimised if a recess in the diamond anvil is usedand the XRF signal is acquired at 90◦ to the beam (Schmidt and Rickers, 2003). However, inthis experimental setup, it is unlikely that a melt globule occupies the entire effective excitationvolume in the recess (cf., Fig.1 in Muñoz et al., 2005). In this study, electron microprobe (EMP)analyses were therefore performed on the quenched glass droplets after the run. The elementcontents of the glass and the in-situ data of the fluid were used to obtain partition coefficients.The second goal was to investigate the equilibration kinetics in order to estimate the effect onpartition coefficients. This was done by time resolved analysis of the trace element signal inthe fluid at several temperatures in stepwise heating and cooling experiments.
2.2 Experimental methods
2.2.1 Starting Materials
The starting materials for the experimental runs consisted of a synthetic haplogranitic met-aluminous glass and two aqueous fluids. The composition of the glass (Ab47Or22Qz31) cor-responds to the thermal minimum in the haplogranitic system at P = 500 MPa and aH2O = 1(Johannes and Holtz, 1996). The glass was prepared in two steps. Firstly, an initial glass wasproduced using powders of SiO2, Al2O3, Na2CO3 and K2CO3. The powders were mixed andstepwise heated to 1550◦C for decarbonisation (12 h). After quenching, the glass was crushedand melted again for 48 h at 1550◦C. Secondly, Rb and Sr were added as RbCl and SrCO3 tothe crushed initial glass. The glass was doped with relatively high concentrations of 2926±169
18

ii
“thesis_report_old” — 2010/4/26 — 13:54 — page 19 — #30 ii
ii
ii
Partitioning and equilibration of Rb and Sr between silicate melts and aqueous fluids
ppm Rb and 3065±181 ppm Sr (EMP analyses) to facilitate later in-situ SR-µXRF analyses ofthe aqueous fluids. The doped glass powder was melted at 1600◦C for 24 h, then quenched,crushed and melted again for 24 h at 1600◦C to achieve chemical homogeneity. Before load-ing into the sample chamber of a cell, the glass was cut in pieces with parallel faces. Thesepieces were ground and polished to a thickness of 60±20 µm.
The solutions, H2O and H2O + 0.5 m NaCl + 0.5 m KCl + 0.01 m HCl, were producedfrom distilled de-ionised water, analytical grade powders of NaCl and KCl. A small amount of30 vol.% hydrochloric acid was added.
HPGe detector
first ionisation
chamber
fluorescence X-rays
second ionisation
chamber
beam
stopsample
chamber
microsc
ope
and
CCD camera
cell position
for optical
observation
goniometer
x
y
cell position
for SR-XRF
measurements
Pb
xyztable
SBC
meltaqueous fluid(solvent and pressuremedium)
Rhenium gasket(inner diameter: 500 µm height: 125 µm)
XRF photonsto detector
diamond anvil
vapor bubble(present at lower T)
diamondanvil with recess (3)
F F
F F
1 - K-type thermocouple 2 - tungsten carbide seat with NiCr-heater wires3 - recess: 277 µm in diameter, 85 µm deep; provides a constant effective excitation volume
1
1
sync
hrot
ron
beam
2 2
2 2
A
B
Figure 2.1: A - Schematic diagram showing the details of the modified Bassett-type hydrother-mal diamond anvil cell. B - Top view of the experimental setup at beamline L, HASYLAB(DESY, HAMBURG) (after Schmidt and Rickers (2003), modified).
19
ii
“thesis_report_old” — 2010/4/26 — 13:54 — page 20 — #31 ii
ii
ii
Chapter 2
2.2.2 Hydrothermal diamond-anvil cell
We used two modified Bassett-type hydrothermal diamond-anvil cells as described by Bassettet al. (1993), Schmidt and Rickers (2003), and Schmidt et al. (2007). A schematic drawing ofthis cell type is shown in Fig.2.1A.
In each cell (HDAC 3 and HDAC G), the culet face of the diamond-anvil located on theside of the incident X-ray beam has a cylindrical recess of 85 µm in depth (HDAC G) or 72µm in depth (HDAC 3). The recess permits collection of the fluorescence signal at 90◦ to theincident beam and in the polarisation plane of the beam (Bassett et al., 2000, Schmidt andRickers, 2003). This configuration minimises the background in the spectra from elastic andCompton scattering and therefore provides an optimal signal to noise ratio. Furthermore, therecess ensures a well-defined effective excitation volume, because fluorescence X-rays gen-erated in other parts of the sample chamber are absorbed by the gasket before reaching thedetector. In both cells the path length of the fluorescence X-rays through the diamonds was460±50 µm. The sample volume was heated externally by NiCr coils around the tungsten car-bide seats supporting the anvils. K-type thermocouples attached to the diamonds were usedfor temperature measurement. The power input to the two resistive heaters was controlledwith Eurotherm®2408 or Eurotherm®2704 temperature controllers, which kept the tempera-ture within ±0.5◦C of the desired value. The actual temperature in the sample chamber wascalibrated using measurements of the melting point of sodium chloride (800.5◦C) and of thetriple point of H2O (0.1◦C) at atmospheric pressure. During heating, oxidation of the metallicparts was prevented by flushing the cell with 200 l/h N2 + 1% H2 gas.
2.2.3 Sample preparation
The sample chamber of the HDAC consists of the recess at the culet face and a cylindricalhole in the gasket separating the two anvils. Rhenium was selected as gasket material dueto its relatively inert behaviour in near neutral aqueous solutions at high temperatures and itsmechanical properties (Xiong and Wood, 2002). The Re gaskets had an initial thickness of125 µm and a hole diameter of 500 µm. The gasket was mounted on the culet face of thelower diamond anvil and then slightly compressed between the anvils to prevent uncontrolledleakage of the fluid during loading. Then, a glass chip of known dimensions was placed inthe sample chamber. The dimensions were chosen such that the glass amount was about 20to 25 wt.% of the desired bulk composition. This liquid-glass ratio was found to be optimal,because a larger proportion of glass increased the probability that both melt and fluid werepresent in the recess and thus in the effective excitation volume. A smaller proportion of glasscomplicated later chemical analyses of the quenched melt droplets due to their small size. Themass of the glass chip was obtained using a density of 2.4 g/cm3 and the volume calculatedfrom the measured dimensions of the glass piece because the mass of the glass chip wastoo small for accurate determination by weighing. The aqueous fluid was then transferred intothe sample chamber. Before the sample chamber was sealed, an air bubble was allowed togrow by controlled leaking of the liquid. The actual proportion of glass was calculated from thesample chamber volume, the volume of the glass piece calculated from the known dimensions,
20
ii
“thesis_report_old” — 2010/4/26 — 13:54 — page 21 — #32 ii
ii
ii
Partitioning and equilibration of Rb and Sr between silicate melts and aqueous fluids
the glass density, the fluid density obtained from the liquid-vapour homogenisation tempera-ture (TH=TL+V→L) during first heating, and the salinity. The volume ratio of the produced airbubble to the remaining liquid was chosen such that the fluid density was sufficiently low toattain a pressure between 200 and 500 MPa at 750◦C. After loading, the gasket was slightlycompressed further between the anvils, just enough to seal the sample chamber. This pro-cedure minimises the reduction of the sample chamber volume due to gasket flow during firstheating. For experiments with salt solutions, the actual salt concentration in the aqueous fluidafter sealing was determined from the measured vapour-saturated ice liquidus temperatureTm=T(I+L+V→L+V), the known ratio of the solutes, and literature data for the vapour-saturatedice liquidus in the system H2O+NaCl+KCl (Hall et al., 1988).
2.2.4 HDAC experiments
The loaded cell was fixed on a goniometer on the top of the xyz table at the beamline (Fig.2.1B)in the position for optical observation. The cell was heated to measure the TH of the aqueousfluid, and then to the first experimental temperature. If the excitation volume was free of melt(cf., Fig. 2.2), the cell was rotated around the vertical axis into the position for XRF spectrumacquisition. The sample chamber was aligned to the beam and the fluorescence detector.The Rb Kα signal was scanned across the recess to verify that the measurement positionwas correct and that no melt droplet had moved into the recess. Subsequently, XRF spectraof the fluid were acquired as a function of time and with time steps of 500 or 1000 seconds.After spectrum acquisition, the cell was rotated back to the microscope position, and a newtemperature was set. If no melt had entered the recess, the cell was moved back to theXRF position and aligned again. This process took about 5 minutes. At each P-T condition,
gasket
meltdroplets
recess withdrillingmarks
Figure 2.2: View in the sample cham-ber at 750◦C. The recess is free ofmelt and thus, the measured SR-µXRFsignal contains no contribution from themelt.
consecutive XRF spectra of the fluid were recordeduntil the XRF signal indicated that equilibrium wasattained or that melt had moved into the effectiveexcitation volume. At the end of a stepwise cool-ing sequence, the cell was heated again to 750◦Cand then quenched after attainment of equilibriumwith a rate of 200◦C per minute. This was done toobtain Df/m values from subsequent EMP analysesof the quenched melt. During first heating, gasketcreep causes a permanent sample volume change(Schmidt and Rickers, 2003). However, the samplevolume is nearly constant upon cooling. The actualdensity of the fluid was therefore determined frommeasurements of the liquid-vapour homogenisationtemperature after each temperature step during step-wise heating. In the case of stepwise cooling, it wasmeasured only after the last temperature step.
For the calculation of density and pressure inexperiments with salt solutions, the composition was
21

ii
“thesis_report_old” — 2010/4/26 — 13:54 — page 22 — #33 ii
ii
ii
Chapter 2
first simplified by setting wt.% NaCl + wt.% KCl = wt.% (NaCl+KCl). Similar approximations ofcomplex compositions are often used in studies of natural fluid inclusions to model isochoresbased on the system H2O+NaCl (Roedder, 1984, Bodnar, 2003). The density was calculatedusing correlations for the molar volume given by Driesner (2007) for NaCl+H2O solutions andthe equation of state (EOS) by Haar et al. (1984) for pure H2O based on the determined TH
and wt.% (NaCl+KCl). We used the EOS by Haar et al. (1984) because it is the referenceequation of state used by Driesner (2007) for the pure water system. The pressure at theexperimental temperature was calculated from the salinity expressed as wt.% (NaCl+KCl) andthe homogenisation temperature measured after the experiment. The calculations were basedon the slopes of the lines of constant TH given by Bodnar and Vityk (1994) for salt bearingcompositions, and the EOS by Haar et al. (1984) for experiments with H2O as initial fluid com-position. At the conditions of our study, the effect of dissolved silica on pressures based onisochores calculated from TH is insignificant (Shen et al., 1993). Furthermore, the solubilityof melts with high aluminum content in water is low (Mysen and Acton, 1999). Moreover, theiso-TH line slopes for H2O+NaCl (Bodnar and Vityk, 1994) are from experiments at SiO2 sat-uration. Additionally, the effect of an error in the density on the calculated pressure is muchsmaller at low densities (such as those in this study) than at high densities. For all thesereasons, the pressures calculated here should be sufficiently accurate.
2.2.5 XRF spectra acquisition and calibration
The experiments were performed at beamline L (HASYLAB) of DORIS III, a second-generationsynchrotron light source at DESY, Hamburg, Germany. A single-bounce capillary (SBC) wasused to focus the synchrotron beam. The capillary was developed and manufactured at Cor-nell University for the source characteristics of beamline L (Huang and Bilderback, 2006). TheSBC has a focal distance of 5 cm and focuses hard X-rays up to 40 keV into a spot of 11±1µm. A micro-beamstop was aligned at the beam entrance into the SBC to absorb the portionof beam that would pass the capillary without focusing. Utilisation of the SBC increases theflux density by a factor of 300, and therefore decreases the lower limit of detection for ele-ments with fluorescence energies between 12 and 20 keV to 1 to 5 ppm in HDAC experiments(Schmidt et al., 2007). In this study, the lower limit of detection of Rb was 1 to 2 ppm, as de-termined from SR-µXRF spectra of standard solutions loaded into HDAC 3 and HDAC G. Thelower limit of detection (mdl) was calculated from mdl=3c
√B/I, where c is the concentration, B
the background intensity and I the peak intensity (e.g., Haller and Knöchel, 1996).A synchrotron beam with a photon energy of 20.3±0.1 keV provided by a multilayer
wide bandpass monochromator was used for excitation. All XRF spectra were recorded usinga high purity Ge solid-state detector aligned in the polarisation plane of the incoming X-raysat 90◦ to the synchrotron beam. The spectra were collected with live counting times of 500 or1000 seconds.
Figure 2.3 shows two examples of obtained XRF spectra, one of a standard solutionand the other one of an aqueous fluid in equilibrium with melt at 750◦C. The integrated inten-sities of the fluorescence lines were obtained from fits of the spectra using PyMca, a graphicalinterface for multi-channel analyser spectra visualisation and analysis developed at the ESRF
22

ii
“thesis_report_old” — 2010/4/26 — 13:54 — page 23 — #34 ii
ii
ii
Partitioning and equilibration of Rb and Sr between silicate melts and aqueous fluids
100
101
102
103
104
inte
nsity
20181614121086energy [keV]
sample standard solution Rb K and Sr K lines
Re L lines(gasket material)
Compton andelastic scattering
Figure 2.3: SR-µXRF spectra of a sample containing 2.84 m (NaCl+KCl) + 0.03 m HCl and astandard solution.
(Solé et al., 2007). The integrated intensities were normalised to the intensity of the incidentbeam and then divided by the density of the fluid. The normalised integrated intensities werecalibrated using XRF spectra of standard solutions. The standard solutions had initial con-centrations of 250 and 995 ppm Rb (matrix 10 wt.% NaCl). Before the sample chamber issealed, a small portion of the H2O of the solution evaporates, which increases the NaCl andRb concentration. Therefore, the actual concentration of Rb in the standard solution after load-ing into the sample chamber was determined from the actual NaCl concentration calculatedfrom the measured vapour-saturated ice melting temperature, and the known NaCl/RbCl ratio(cRb
actual=cRbinitial · cNaCl
actual/cNaClinitial). For each cell, two XRF spectra were collected at temperatures
slightly above TH. The obtained integrated intensities of the Rb K fluorescence lines of thestandard solutions were normalised to the intensity of the incident beam and divided by thefluid density. The Sr concentration in the fluid was determined based on normalisation of theintegrated intensities of the Sr K fluorescence lines to the density of the fluid and the intensityof the incoming beam, the calibration for Rb from the standard solutions, and multiplicationwith a Rb/Sr correction factor. This factor corrects for different fluorescence cross-sectionsof Rb and Sr K fluorescence, and fluorescence transmission through the diamond. A Rb/Srcorrection factor of 0.844±0.006 was obtained for HDAC 3 from XRF spectra of a standard so-lution with equal concentrations of Rb and Sr (500 ppm each) loaded into the sample chamber.These spectra were collected using the same procedure as described above. The empiricalRb/Sr factor differs only by 2 % from the theoretical value calculated by multiplying the ratioof the fluorescence-cross sections (e.g., XRAYLIB, Brunetti et al., 2004) with the ratio of thetransmission of the K line fluorescence X-rays through 0.5 mm diamond. This small differenceis within the uncertainties of the databases (e.g., Brunetti et al., 2004). We also applied theempirical Rb/Sr correction factor to the spectra from experiments using HDAC G, because thedesign of both cells and the X-ray path length were very similar.
23
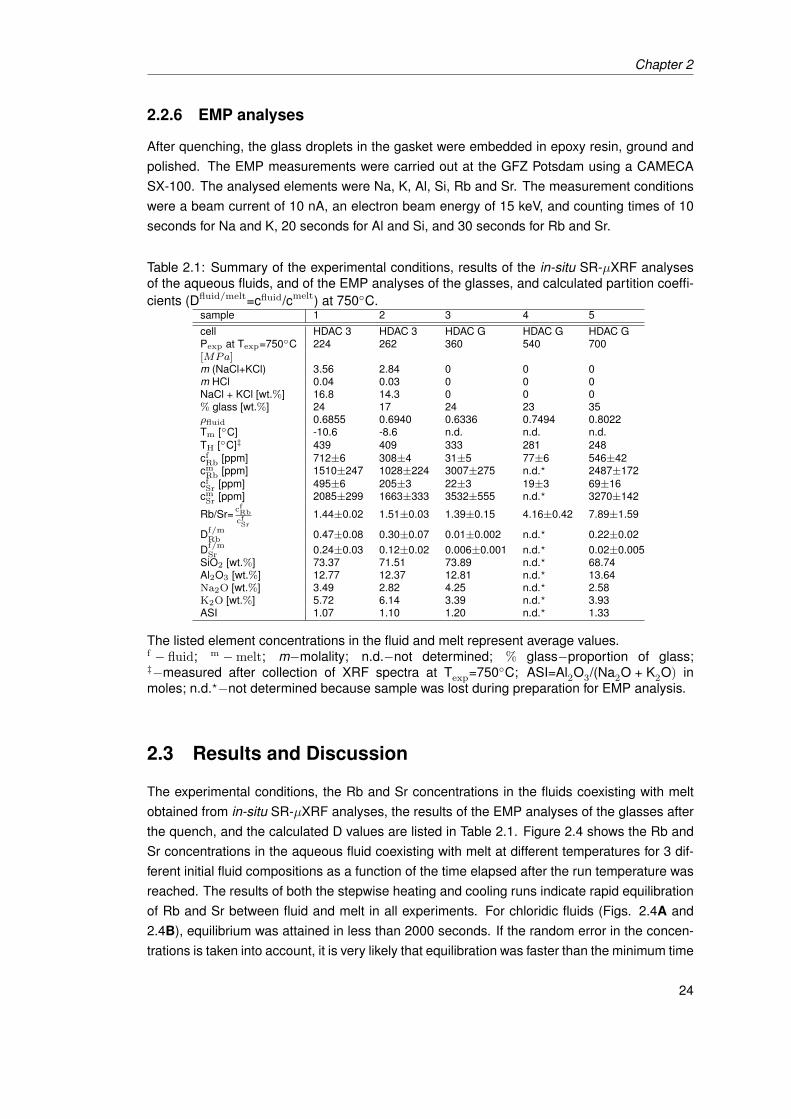
ii
“thesis_report_old” — 2010/4/26 — 13:54 — page 24 — #35 ii
ii
ii
Chapter 2
2.2.6 EMP analyses
After quenching, the glass droplets in the gasket were embedded in epoxy resin, ground andpolished. The EMP measurements were carried out at the GFZ Potsdam using a CAMECASX-100. The analysed elements were Na, K, Al, Si, Rb and Sr. The measurement conditionswere a beam current of 10 nA, an electron beam energy of 15 keV, and counting times of 10seconds for Na and K, 20 seconds for Al and Si, and 30 seconds for Rb and Sr.
Table 2.1: Summary of the experimental conditions, results of the in-situ SR-µXRF analysesof the aqueous fluids, and of the EMP analyses of the glasses, and calculated partition coeffi-cients (Dfluid/melt=cfluid/cmelt) at 750◦C.
sample 1 2 3 4 5cell HDAC 3 HDAC 3 HDAC G HDAC G HDAC GPexp at Texp=750◦C 224 262 360 540 700[MPa]m (NaCl+KCl) 3.56 2.84 0 0 0m HCl 0.04 0.03 0 0 0NaCl + KCl [wt.%] 16.8 14.3 0 0 0% glass [wt.%] 24 17 24 23 35ρfluid 0.6855 0.6940 0.6336 0.7494 0.8022Tm [◦C] -10.6 -8.6 n.d. n.d. n.d.TH [◦C]‡ 439 409 333 281 248cfRb [ppm] 712±6 308±4 31±5 77±6 546±42
cmRb [ppm] 1510±247 1028±224 3007±275 n.d.? 2487±172
cfSr [ppm] 495±6 205±3 22±3 19±3 69±16
cmSr [ppm] 2085±299 1663±333 3532±555 n.d.? 3270±142
Rb/Sr= cfRbcfSr
1.44±0.02 1.51±0.03 1.39±0.15 4.16±0.42 7.89±1.59
Df/mRb 0.47±0.08 0.30±0.07 0.01±0.002 n.d.? 0.22±0.02
Df/mSr 0.24±0.03 0.12±0.02 0.006±0.001 n.d.? 0.02±0.005
SiO2 [wt.%] 73.37 71.51 73.89 n.d.? 68.74Al2O3 [wt.%] 12.77 12.37 12.81 n.d.? 13.64Na2O [wt.%] 3.49 2.82 4.25 n.d.? 2.58K2O [wt.%] 5.72 6.14 3.39 n.d.? 3.93ASI 1.07 1.10 1.20 n.d.? 1.33
The listed element concentrations in the fluid and melt represent average values.f − fluid; m −melt; m−molality; n.d.−not determined; % glass−proportion of glass;‡−measured after collection of XRF spectra at Texp=750◦C; ASI=Al2O3/(Na2O + K2O) inmoles; n.d.?−not determined because sample was lost during preparation for EMP analysis.
2.3 Results and Discussion
The experimental conditions, the Rb and Sr concentrations in the fluids coexisting with meltobtained from in-situ SR-µXRF analyses, the results of the EMP analyses of the glasses afterthe quench, and the calculated D values are listed in Table 2.1. Figure 2.4 shows the Rb andSr concentrations in the aqueous fluid coexisting with melt at different temperatures for 3 dif-ferent initial fluid compositions as a function of the time elapsed after the run temperature wasreached. The results of both the stepwise heating and cooling runs indicate rapid equilibrationof Rb and Sr between fluid and melt in all experiments. For chloridic fluids (Figs. 2.4A and2.4B), equilibrium was attained in less than 2000 seconds. If the random error in the concen-trations is taken into account, it is very likely that equilibration was faster than the minimum time
24

ii
“thesis_report_old” — 2010/4/26 — 13:54 — page 25 — #36 ii
ii
ii
Partitioning and equilibration of Rb and Sr between silicate melts and aqueous fluids
required to complete acquisition of the first XRF spectrum (about 500 seconds). For chloride-free fluids (Fig. 2.4C), the time required to reach equilibrium at 750◦C was probably below3000 seconds, but this is difficult to constrain from the data due to the relatively large error inthe concentrations. We believe that the trace element concentrations in the fluids obtained inthis study represent equilibrium values. Our data show stable Rb and Sr concentrations overa relatively long time at Texp, e.g., over 9000 seconds in the experiment with H2O as startingfluid shown in Fig. 2.4C. Furthermore, the existence of a significant concentration gradient inthe aqueous phase in the recess at high temperatures is very unlikely because convection inthe sample chamber is substantial and diffusion is rapid. This is supported by a study on rutiledissolution in aqueous fluids using a HDAC (Audétat and Keppler, 2005), in which a diffusioncoefficient of 8.0 · 10−7m2s−1 at 800◦C and 2 GPa was calculated assuming a hydrated com-plex of Ti4+. This diffusion coefficient translated into a travel time of the complex of about 0.16seconds across the entire sample chamber of 500 µm in diameter. In analogy to silicate melts(Koepke and Behrens, 2001), Rb and Sr diffusion in aqueous fluids can be expected to beeven faster than the diffusion of this high-field strength element.
The Rb and Sr concentrations in the fluid can be directly compared for experiments withsimilar glass/fluid ratios and pressures (Tab. 2.1). The concentrations of both elements in-creased by an order of magnitude with addition of chloride to the starting fluid (from 0 to 3.56m (NaCl+KCl) + 0.04 m HCl) due to their affinity to form Cl complexes in aqueous solutions.
The temperature dependence of the Rb and Sr concentrations in chloridic fluids showsopposite trends along an isochore, i.e., slightly decreasing Rb contents and slightly increasingSr concentrations upon cooling. This is more pronounced for the experiment containing 3.56m (NaCl+KCl) + 0.04 m HCl in the starting fluid (Fig. 2.4A). The Rb concentration in the fluiddecreased by 17 % from 737±12 to 611±1 ppm upon cooling from 780 to 600◦C, whereasthe Sr content increased by 12 % from 473±8 to 531±10 ppm. The same trends were alsorecognisable, but less distinct, in the experiment with an initial salinity of 2.84 m (NaCl+KCl) +0.03 m HCl (Fig. 2.4B). In this experiment, there may also have been a small pressure effecton the Sr content in the fluid at 680◦C (232±8 ppm at 160 MPa and 212±8 ppm at 212 MPa),while the Rb concentration remained constant at 305±8 ppm.
In the experiment at 360 MPa with H2O as initial fluid (Fig 2.4C), XRF spectra werecollected only at 750◦C. The average concentrations were 31±5 ppm Rb and 22±3 ppm Sr.Due to the low concentrations, the error was too large to obtain concentration changes alongan isochore with confidence. At 750◦C, the Rb concentration in the fluid increased with pres-sure by a factor of about 2.5 from 31±5 ppm at 360 MPa to 77±6 ppm at 540 MPa for similarglass/fluid ratios. In contrast, the Sr concentration remained nearly constant (22±3 ppm at360 MPa and 19±3 ppm at 540 MPa). The increase in the Rb concentration may indicate thatthe pH of the aqueous fluid becomes more basic, which would suggest that Rb complexespredominantly with OH in the absence of ligands such as Cl. Such a change in pH could berelated to the enhanced water dissociation (Bandura and Lvov, 2006) and an enhanced water -melt reaction with pressure (e.g., Stalder et al., 2000). The latter may involve formation of alu-mosilicate complexes in the fluid, as suggested by e.g., Manning (2004) and Manning (2007)for high pressures. In contrast, the nearly constant Sr concentrations suggests a significantdifference in the complexation of Sr compared to that of Rb.
25

ii
“thesis_report_old” — 2010/4/26 — 13:54 — page 26 — #37 ii
ii
ii
Chapter 2
The difference in the pressure dependence of Rb and Sr becomes even more obvious
Figure 2.4: Concentration of trace elements Rb and Sr in the aqueous fluid vs. elapsed timeafter attainment of the experimental temperature Texp for various fluid compositions: A - 3.56m (NaCl+KCl) + 0.04 m HCl, B - 2.84 m (NaCl+KCl) + 0.03 m HCl and, C H2O. The error barsrepresent 2σ errors.
if the Rb/Sr ratio in the fluid is considered. Figure 2.5 shows the Rb/Sr ratio in the fluid asa function of pressure and initial fluid salinity. At pressures between 224 and 360 MPa, the
26
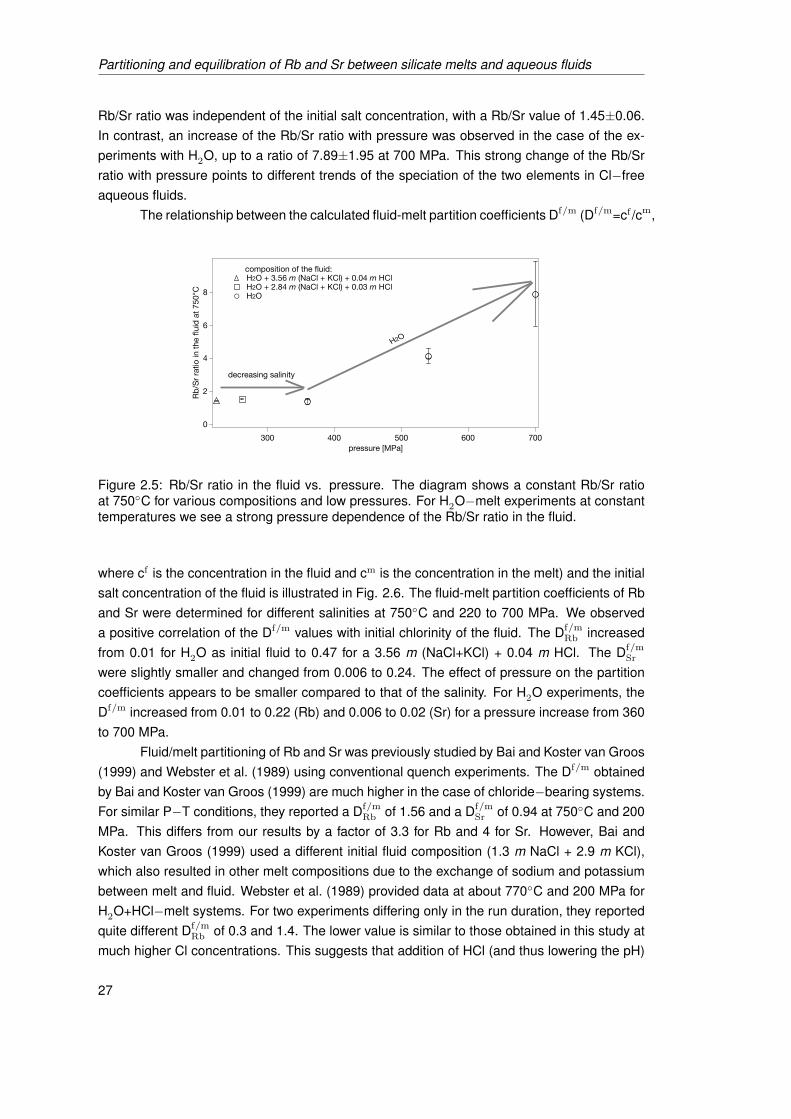
ii
“thesis_report_old” — 2010/4/26 — 13:54 — page 27 — #38 ii
ii
ii
Partitioning and equilibration of Rb and Sr between silicate melts and aqueous fluids
Rb/Sr ratio was independent of the initial salt concentration, with a Rb/Sr value of 1.45±0.06.In contrast, an increase of the Rb/Sr ratio with pressure was observed in the case of the ex-periments with H2O, up to a ratio of 7.89±1.95 at 700 MPa. This strong change of the Rb/Srratio with pressure points to different trends of the speciation of the two elements in Cl−freeaqueous fluids.
The relationship between the calculated fluid-melt partition coefficients Df/m (Df/m=cf /cm,
8
6
4
2
0
700600500400300pressure [MPa]
decreasing salinity
H2O
Figure 2.5: Rb/Sr ratio in the fluid vs. pressure. The diagram shows a constant Rb/Sr ratioat 750◦C for various compositions and low pressures. For H2O−melt experiments at constanttemperatures we see a strong pressure dependence of the Rb/Sr ratio in the fluid.
where cf is the concentration in the fluid and cm is the concentration in the melt) and the initialsalt concentration of the fluid is illustrated in Fig. 2.6. The fluid-melt partition coefficients of Rband Sr were determined for different salinities at 750◦C and 220 to 700 MPa. We observeda positive correlation of the Df/m values with initial chlorinity of the fluid. The Df/m
Rb increasedfrom 0.01 for H2O as initial fluid to 0.47 for a 3.56 m (NaCl+KCl) + 0.04 m HCl. The Df/m
Sr
were slightly smaller and changed from 0.006 to 0.24. The effect of pressure on the partitioncoefficients appears to be smaller compared to that of the salinity. For H2O experiments, theDf/m increased from 0.01 to 0.22 (Rb) and 0.006 to 0.02 (Sr) for a pressure increase from 360to 700 MPa.
Fluid/melt partitioning of Rb and Sr was previously studied by Bai and Koster van Groos(1999) and Webster et al. (1989) using conventional quench experiments. The Df/m obtainedby Bai and Koster van Groos (1999) are much higher in the case of chloride−bearing systems.For similar P−T conditions, they reported a Df/m
Rb of 1.56 and a Df/mSr of 0.94 at 750◦C and 200
MPa. This differs from our results by a factor of 3.3 for Rb and 4 for Sr. However, Bai andKoster van Groos (1999) used a different initial fluid composition (1.3 m NaCl + 2.9 m KCl),which also resulted in other melt compositions due to the exchange of sodium and potassiumbetween melt and fluid. Webster et al. (1989) provided data at about 770◦C and 200 MPa forH2O+HCl−melt systems. For two experiments differing only in the run duration, they reportedquite different Df/m
Rb of 0.3 and 1.4. The lower value is similar to those obtained in this study atmuch higher Cl concentrations. This suggests that addition of HCl (and thus lowering the pH)
27

ii
“thesis_report_old” — 2010/4/26 — 13:54 — page 28 — #39 ii
ii
ii
Chapter 2
6
80.01
2
4
6
80.1
2
4
Dflu
id/m
elt
3.53.02.52.01.51.00.50.0m (NaCl + KCl)
Rb Sr
262
MP
a
224
MP
a
360
MP
a70
0 M
Pa
Figure 2.6: Fluid−melt partition coefficients of Rb and Sr vs. initial salt concentration of thefluid [m (NaCl+KCl)] at 750◦C. For similar pressures an increase of initial salt concentrationcorresponds to an increase of Df/m
Rb and Df/mSr . For H2O−melt experiments, we observed a
pressure dependence of the D values particularly for Rb (light grey symbols = experiment at700 MPa).
causes a higher partitioning of Rb into the fluid than addition of NaCl+KCl. However, the largevariation in the results for the 2 runs reported by Webster et al. (1989) could also be related toexperimental difficulties in quench experiments (see introduction). For Sr, only one value wasobtained (Df/m
Sr = 0.1), which differs similarly from our results as those for Rb.Bai and Koster van Groos (1999) provided data from melt+H2O experiments at 750◦C and200 MPa. The reported partition coefficients of Rb (0.006) and Sr (0.002) are much lower thanthose at 360 MPa obtained in this study (Df/m
Rb = 0.01 and Df/mSr = 0.006 at 750◦C). The ex-
periments from both studies were at similar compositions but differed in pressure by 160 MPa,which can only in part explain the discrepancies in the Df/m.
2.4 Conclusions
The technique successfully applied in this study has two important advantages. The traceelement concentration in the fluid can be determined without the ambiguities associated withdata from quench techniques. Additionally, kinetic information can be obtained.
The drawbacks are, however, limited availability of beam time and a more difficult controlof the bulk composition and pressure, which complicates systematic studies.
The technique can be improved further by the following. (i) The experimental setup canbe modified for permanent optical observation of the sample chamber, which would allow tostudy the equilibration process at shorter timescales. This is because no time is lost to rotateand align the cell before acquisition of XRF spectra. Another advantage is permanent visualmonitoring of the effective excitation volume, e.g., for immediate recognition of the unwantedcase that melt droplets migrate into this volume. (ii) Use of a synchrotron radiation sourcewith higher intensity such as an undulator insertion device will improve the sensitivity and thusthe data at low concentrations. In addition, spectrum acquisition times can be reduced, which
28

ii
“thesis_report_old” — 2010/4/26 — 13:54 — page 29 — #40 ii
ii
ii
Partitioning and equilibration of Rb and Sr between silicate melts and aqueous fluids
results in a better temporal resolution in kinetic studies. (iii) The trace element concentrationin the glasses can be obtained more accurately using techniques with a higher sensitivity, e.g.,using laser-ablation inductively-coupled plasma mass spectrometry, especially if an appropri-ate element is used as an internal standard, such as Si known from the EMP analyses. (iv) Itmay be possible to modify the geometry of the anvils and the gasket in such a way that bothaqueous fluid and melt can be unambiguously analysed in situ in the same experiment at highPT.
The results of this study show, firstly, an increase of the concentrations of Rb and Sr inthe fluid by an order of magnitude with addition of chloride to the starting fluid (from 0 to 3.56m (NaCl+KCl) + 0.04 m HCl). Secondly, opposite trends were observed for the temperaturedependence of Rb and Sr in the fluid along an isochore. The Rb content in the fluid increasedbut the Sr concentration decreased with temperature. Thirdly, the Sr concentration in the fluiddisplayed a slightly negative correlation with pressure at constant temperature, while the Rbcontent did not change (see Fig. 2.4B). Furthermore, we observed differences in the pressuredependence of the Rb and Sr concentrations in the fluid in H2O + melt experiments. The Rb/Srratio in the fluid increased from 1.45±0.06 to 7.89±1.95 with an increase in pressure from 360to 700 MPa. The obtained partition coefficients of both elements are positively correlated withthe initial Cl concentration of the fluid. In the H2O+melt experiments, we found an increase ofthe D values with pressure, which was more pronounced for Rb.
The results of this study demonstrate that the equilibration between aqueous fluid andmelt is rapid and can therefore affect partition coefficients obtained in quench experiments.However, the observed concentration changes upon isochoric cooling were relatively small.Therefore, these changes can only account for a small portion of the differences between thefluid-melt partitioning data from quench techniques and those obtained in this study. Conse-quently, uncertainties in the fluid-melt partitioning data from quench techniques can mainly beattributed to the difficulty of obtaining a representative sample of the fluid. Usually, the fluidcomposition has to be reconstructed from the quenched products (fluid and quench precipi-tates). As already pointed out by Webster et al. (1989), this may be a major contribution to theerror in these experiments and thus explain the often wide spread in the results of runs at sim-ilar conditions. This becomes particularly obvious if data from different studies are compared.For example, Df/m reported by Bai and Koster van Groos (1999) at low HCl concentrations aresignificantly lower (up to a factor of 7.5 for Rb) than those obtained by Webster et al. (1989)at similar conditions. Part of this discrepancy can probably be attributed to the different exper-imental procedures used to obtain the partition coefficients, and the related systematic error.Therefore, the in-situ technique applied here can be helpful to obtain more reliable and con-sistent data on the trace element distribution between aqueous fluid and granitoid melts.
AcknowledgementsWe thank HASYLAB at the Deutsches Elektronen-Synchrotron (DESY) for granting beamtimeand O. Appelt for the benefit with EMP measurements at GFZ Potsdam. This study was sup-ported by the German Science Foundation (DFG, Wi 2000/3-1).
29
ii
“thesis_report_old” — 2010/4/26 — 13:54 — page 30 — #41 ii
ii
ii
Adam, J., Green, T. H., Sie, S. H., and Ryan, C. G. (1997). Trace element partitioning betweenaqueous fluids, silicate melts and minerals. Eur. J. Mineral., 9:569–584.
Audétat, A. and Keppler, H. (2005). Solubility of rutile in subduction zone fluids, as determinedby experiments in the hydrothermal diamond anvil cell. Earth and Planetary Science Letters,232:393–402.
Ayers, J. C. and Eggler, D. H. (1995). Partitioning of elements between silicate melt and H2O-NaCl fluids at 1.5 and 2.0 GPa pressure: Implications for mantle metasomatism. Geochimicaet Cosmochimica Acta, 59(20):4237–4246.
Bai, T. B. and Koster van Groos, A. F. (1999). The distribution of Na, K, Rb, Sr, Al, Ge, Cu,W, Mo, La, and Ce between granitic melts and coexisting aqueous fluids. Geochimica etCosmochimica Acta, 63(7/8):1117–1131.
Bandura, A. and Lvov, S. (2006). The ionization constant of water over a wide range of tem-peratures and densities. Journal of Physical and Chemical Reference Data, 35:15–30.
Bassett, W. A., Anderson, A. J., Mayanovic, R. A., and Chou, I.-M. (2000). Modified hydrother-mal diamond anvil cells for XAFS analyses of elements with low energy absorption edgesin aqueous solutions at sub- and supercritical conditions. Zeitschrift für Kristallographie,215:711–717.
Bassett, W. A., Shen, A. H., Bucknum, M., and Chou, I.-M. (1993). A new diamond anvil cell forhydrothermal studies to 2.5 GPa and from 190 to 1200◦C. Review of scientific instruments,64:2340–2345.
Behrens, H., Meyer, M., Holtz, F., Benne, D., and Nowak, M. (2001). The effect of alkali ionicradius, temperature, and pressure on the solubility of water in MAlSi3O8 melts (M = Li, Na,K, Rb). Chemical Geology, 174:275–289.
Best, M. G. (2003). Igneous and Metamorphic Petrology. Blackwell.
Bodnar, R. J. (2003). Fluid Inclusions: Analysis and Interpretation, volume 32, chapter Intro-duction to aqueous fluid systems., pages 81–99. Mineralogical Association of Canada.
Bodnar, R. J. and Vityk, M. O. (1994). Interpretation of microthermometric data for H2O-NaClfluid inclusions. Fluid Inclusions in Minerals: Methods and Applications, pages 117–130.Virginia Tech.
30
ii
“thesis_report_old” — 2010/4/26 — 13:54 — page 31 — #42 ii
ii
ii
Brunetti, A., del Rio, M. S., Golosio, B., Simionovici, A., and Somogyi, A. (2004). A library forX-ray-matter interaction cross sections for X-ray fluorescence applications. SpectrochimicaActa, 59:1725–1731.
Bureau, H., Ménez, B., Malavergne, V., Somogyi, A., Simionovici, A., Massare, D., Khodja,H., Daudin, L., Gallien, J.-P., Shaw, C., and Bonnin-Mosbah, M. (2007). In situ mappingof high-pressure fluids using hydrothermal diamond anvil cells. High Pressure Research,27(2):235–247.
Driesner, T. (2007). The system H2O-NaCl. Part II: Correlations for molar volume, enthalpy,and isobaric heat capacity from 0 to 1000◦C, 1 to 5000 bar, and 0 to 1 XNaCl. Geochimicaet Cosmochimica Acta, 71:4902–4919.
Flynn, R. T. and Burnham, C. W. (1978). An experimental determination of rare earth partitioncoefficients between a chloride containing vapor phase and silicate melts. Geochimica etCosmochimica Acta, 42:685–701.
Haar, L., Gallagher, J., and Kell, G. (1984). Steam tables:, chapter Thermodynamic and trans-port properties and computer programs for vapor and liquid states of water in SI units, page320. Hemisphere Pub. Corp., Washington, D.C.
Hall, D. L., Sterner, S. M., and Bodnar, R. J. (1988). Freezing Point depression of NaCl-KCl-H2O Solutions. Economic Geology, 83:197–202.
Haller, M. and Knöchel, A. (1996). X-ray fluorescence analysis using synchrotron radiation-(SRXRF). Journal of Trace Microprobe Technics, 14:461–488.
Holland, H. D. (1972). Granites, Solutions, and Base Metal Deposits. Economic Geology,67(3):281–301.
Holtz, F., Behrens, H., Dingwell, D. B., and Johannes, W. (1995). H2O solubility in haplo-granitic melts: Compositional, pressure, and temperature dependence. American Mineralo-gist, 80:94–108.
Huang, R. and Bilderback, D. H. (2006). Single-bounce monocapillaries for focusing syn-chrotron radiation: modeling, measurements and theoretical limits. Journal of SynchrotronRadiation, 13:74–84.
Johannes, W. and Holtz, F. (1996). Petrogenesis an Experimental Petrology of Granitic Rocks.Springer, Berlin.
Keppler, H. and Wyllie, P. J. (1991). Partitioning of Cu, Sn, Mo, W, U, and Th between meltand aqueous fluid in the systems haplogranite-H2O-HCl and haplogranite-H2O-HF. Contri-butions to Mineralogy and Petrology, 109:139–150.
Koepke, J. and Behrens, H. (2001). Trace element diffusion in andesitic melts: an applicationof synchrotron X-ray fluorescence analysis. Geochimica et Cosmochimica Acta, 65:1481–1489.
31
ii
“thesis_report_old” — 2010/4/26 — 13:54 — page 32 — #43 ii
ii
ii
Chapter 2
London, D., Hervig, R. L., and Morgan, G. B. (1988). Melt-vapor solubilities and elementalpartitioning in peraluminous granite-pegmatite systems: experimental results with Macusaniglass at MPa. Contributions to Mineralogy and Petrology, 99:360–373.
Manning, C. E. (2004). The chemistry of subduction-zone fluids. Earth and Planetary ScienceLetters, 223:1–16.
Manning, C. E. (2007). Solubility of corundum + kyanite in H2O at 700◦C and 10 kbar: evidencefor Al-Si complexing at high pressure and temperature. Geofluids, 7:258–269.
Muñoz, M., Bureau, H., Malavergne, V., Ménez, B., Wilke, M., Schmidt, C., Simionovici, A.,Somogyi, A., and Farges, F. (2005). In situ speciation of nickel in hydrous melts exposed toextreme conditions. Physica Scripta, 115:921–922.
Mysen, B. O. and Acton, M. (1999). Water in H2O-saturated magma-fluid systems: Solubilitybehavior in K2O-Al2O3-SiO2-H2O to 2.0 GPa and 1300◦C. Geochimica et CosmochimicaActa, 63:3799–3815.
Rickers, K., Thomas, R., and Heinrich, W. (2006). The behavior of trace elements duringthe chemical evolution of the H2O-, B-, and F-rich granite-pegmatite-hydrothermal systemat Ehrenfriedersdorf, Germany: a SXRF study of melt and fluid inclusions. Mineralium De-posita, 41:229–245.
Roedder, E. (1984). Reviews in Mineralogy 12: Fluid Inclusions. Mineralogical Society ofAmerica.
Schmidt, C. and Rickers, K. (2003). In-situ determination of mineral solubilities in fluids us-ing a hydrothermal diamond-anvil cell and SR-XRF: Solubility of AgCl in water. AmericanMineralogist, 88:288–292.
Schmidt, C., Rickers, K., Bilderback, D. H., and Huang, R. (2007). In situ synchrotron-radiationXRF study of REE phosphate dissolution in aqueous fluids to 800◦C. Lithos, 95:87–102.
Shen, A. H., Bassett, W. A., and Chou, I.-M. (1993). The alpha-beta quartz transition athigh temperatures and pressures in a diamond-anvil cell by laser interferometry. AmericanMineralogist, 78:694–698.
Solé, V. A., Papillon, E., Cotte, M., Walter, P., and Susini, J. (2007). A multiplatform codefor the analysis of energy-dispersive X-Ray fluorescence spectra. Spectrochimica Acta, B62:63–68.
Stalder, R., Ulmer, P., Thompson, A. B., and Günther, D. (2000). Experimental approach toconstrain second critical end points in fluid/silicate systems: Near-solidus fluids and melts inthe system albite-H2O. American Mineralogist, 85:68–77.
Webster, J. D., Holloway, J. R., and Hervig, R. L. (1989). Partitioning of Lithophile trace el-ements between H2O and H2O+CO2 fluids and topaz rhyolite melt. Economic Geology,84:116–134.
32

ii
“thesis_report_old” — 2010/4/26 — 13:54 — page 33 — #44 ii
ii
ii
Winter, J. D. (2001). An Introduction to Igneous and Metamorphic Petrology. Prentice Hall,New Jersey.
Xiong, Y. and Wood, S. (2002). Experimental determination of the hydrothermal solubilityof ReS2 and the Re-ReO2 buffer assemblage and transport of rhenium under supercriticalconditions. Geochemical Transactions, 3:1–10.
33
ii
“thesis_report_old” — 2010/4/26 — 13:54 — page 34 — #45 ii
ii
ii
Chapter 3
Rb and Sr partitioning betweenhaplogranitic melts and aqueoussolutions
accepted manuscript (Oct. 2009)DOI: 10.1016/j.gca.2009.10.033in pressGeochimica et Cosmochimica Acta
34

ii
“thesis_report_old” — 2010/4/26 — 13:54 — page 35 — #46 ii
ii
ii
Rb and Sr partitioning between haplogranitic melts and aqueous solutions
Partitioning and equilibration of Rb and Sr between silicatemelts and aqueous fluids
Manuela Borcherta,?, Max Wilkeb, Christian Schmidtb, Karen Rickersc
a Universität Potsdam, Karl-Liebknecht-Str.24, 14476 Potsdam-Golm, Germanyb Deutsches GeoForschungsZentrum (GFZ), Section 4.1, Telegrafenberg, 14473 Potsdam, Germanyc Hamburger Synchrotronstrahlungslabor at Deutsches Elektronensynchrotron, Notkestr. 85, 22607 Hamburg, Ger-
many
Abstract
Rubidium and strontium partitioning experiments between haplogranitic melts and aqueous fluids (starting composi-
tions water or 1.16 to 3.56 m (NaCl+KCl)±HCl) were conducted at 750 to 950◦C and 0.2 to 1.4 GPa to investigate the
effects of melt and fluid composition, pressure and temperature. In addition, we studied if the applied technique (rapid
and slow quench, and in-situ determination of trace element concentration in the fluid) has a bearing on the obtained
data. There is good agreement of the data from different techniques for chloridic solutions, whereas back reactions
between fluid and melt upon cooling have a significant effect on results from the experiments with water.
The Rb fluid−melt partition coefficient shows no recognizable dependence on melt composition and temper-
ature. For chloridic solutions, it is ∼ 0.4, independent of pressure. In experiments with water, it is one to two orders
of magnitude lower and increases with pressure. The strontium fluid−melt partition coefficient does not depend on
temperature. It increases slightly with pressure in Cl free experiments. In chloridic fluids, there is a sharp increase in
the Sr partition coefficient with the alumina saturation index (ASI) from 0.003 at an ASI of 0.8 to a maximum of 0.3 at
an ASI of 1.05. At higher ASI, it decreases slightly to 0.2 at an ASI of 1.6. It is one to two orders of magnitude higher
in chloridic fluids compared to those found in H2O experiments. The Rb/Sr ratio in non-chloridic solutions in equilib-
rium with metaluminous melts increases with pressure, whereas the Rb/Sr ratio in chloridic fluids is independent of
pressure and decreases with fluid salinity.
The obtained fluid−melt partition coefficients are in good agreement with data from natural co-genetic fluid
and melt inclusions. Numerical modeling shows that although the Rb/Sr ratio in the residual melt is particularly sensi-
tive to the degree of fractional crystallization, exsolution of a fluid phase and associated fluid−melt partitioning is not
a significant factor controlling Rb and Sr concentrations in the residual melt during crystallization of most granitoids.
Keywords: fluid−melt partition coefficients, Rubidium, Strontium, Rb/Sr ratio, quench experiments, HDAC, SR-µXRF
? Corresponding author.
E-mail address:[email protected] (M.Borchert)
3.1 Introduction
Fluid−melt interaction is common in igneous processes because ascent of magma to shal-lower levels of the lithosphere will usually result in saturation with respect to water and othervolatiles (Robb, 2005). Elements must then partition between the silicate melt, the crystallizingminerals and the exsolved magmatic volatiles. The equilibrium distribution of trace elements
35
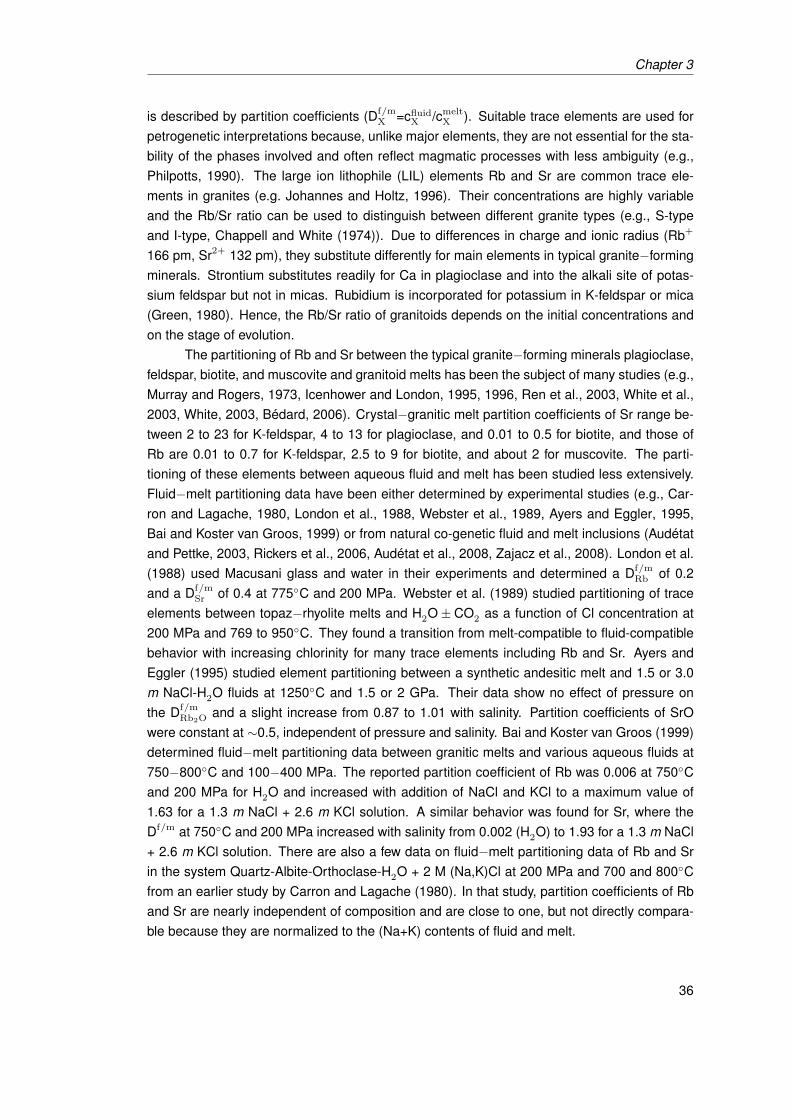
ii
“thesis_report_old” — 2010/4/26 — 13:54 — page 36 — #47 ii
ii
ii
Chapter 3
is described by partition coefficients (Df/mX =cfluid
X /cmeltX ). Suitable trace elements are used for
petrogenetic interpretations because, unlike major elements, they are not essential for the sta-bility of the phases involved and often reflect magmatic processes with less ambiguity (e.g.,Philpotts, 1990). The large ion lithophile (LIL) elements Rb and Sr are common trace ele-ments in granites (e.g. Johannes and Holtz, 1996). Their concentrations are highly variableand the Rb/Sr ratio can be used to distinguish between different granite types (e.g., S-typeand I-type, Chappell and White (1974)). Due to differences in charge and ionic radius (Rb+
166 pm, Sr2+ 132 pm), they substitute differently for main elements in typical granite−formingminerals. Strontium substitutes readily for Ca in plagioclase and into the alkali site of potas-sium feldspar but not in micas. Rubidium is incorporated for potassium in K-feldspar or mica(Green, 1980). Hence, the Rb/Sr ratio of granitoids depends on the initial concentrations andon the stage of evolution.
The partitioning of Rb and Sr between the typical granite−forming minerals plagioclase,feldspar, biotite, and muscovite and granitoid melts has been the subject of many studies (e.g.,Murray and Rogers, 1973, Icenhower and London, 1995, 1996, Ren et al., 2003, White et al.,2003, White, 2003, Bédard, 2006). Crystal−granitic melt partition coefficients of Sr range be-tween 2 to 23 for K-feldspar, 4 to 13 for plagioclase, and 0.01 to 0.5 for biotite, and those ofRb are 0.01 to 0.7 for K-feldspar, 2.5 to 9 for biotite, and about 2 for muscovite. The parti-tioning of these elements between aqueous fluid and melt has been studied less extensively.Fluid−melt partitioning data have been either determined by experimental studies (e.g., Car-ron and Lagache, 1980, London et al., 1988, Webster et al., 1989, Ayers and Eggler, 1995,Bai and Koster van Groos, 1999) or from natural co-genetic fluid and melt inclusions (Audétatand Pettke, 2003, Rickers et al., 2006, Audétat et al., 2008, Zajacz et al., 2008). London et al.(1988) used Macusani glass and water in their experiments and determined a Df/m
Rb of 0.2and a Df/m
Sr of 0.4 at 775◦C and 200 MPa. Webster et al. (1989) studied partitioning of traceelements between topaz−rhyolite melts and H2O± CO2 as a function of Cl concentration at200 MPa and 769 to 950◦C. They found a transition from melt-compatible to fluid-compatiblebehavior with increasing chlorinity for many trace elements including Rb and Sr. Ayers andEggler (1995) studied element partitioning between a synthetic andesitic melt and 1.5 or 3.0m NaCl-H2O fluids at 1250◦C and 1.5 or 2 GPa. Their data show no effect of pressure onthe Df/m
Rb2O and a slight increase from 0.87 to 1.01 with salinity. Partition coefficients of SrOwere constant at ∼0.5, independent of pressure and salinity. Bai and Koster van Groos (1999)determined fluid−melt partitioning data between granitic melts and various aqueous fluids at750−800◦C and 100−400 MPa. The reported partition coefficient of Rb was 0.006 at 750◦Cand 200 MPa for H2O and increased with addition of NaCl and KCl to a maximum value of1.63 for a 1.3 m NaCl + 2.6 m KCl solution. A similar behavior was found for Sr, where theDf/m at 750◦C and 200 MPa increased with salinity from 0.002 (H2O) to 1.93 for a 1.3 m NaCl+ 2.6 m KCl solution. There are also a few data on fluid−melt partitioning data of Rb and Srin the system Quartz-Albite-Orthoclase-H2O + 2 M (Na,K)Cl at 200 MPa and 700 and 800◦Cfrom an earlier study by Carron and Lagache (1980). In that study, partition coefficients of Rband Sr are nearly independent of composition and are close to one, but not directly compara-ble because they are normalized to the (Na+K) contents of fluid and melt.
36

ii
“thesis_report_old” — 2010/4/26 — 13:54 — page 37 — #48 ii
ii
ii
Rb and Sr partitioning between haplogranitic melts and aqueous solutions
Audétat and Pettke (2003) studied the magmatic-hydrothermal evolution of two barrengranites using coeval fluid and melt inclusions trapped at 700−720◦C and 110−120 MPa.The obtained fluid−melt partition coefficient of Rb was 0.2 ±0.1 at a fluid salinity of 4.9 wt.%NaClequiv. Rickers et al. (2006) investigated the behavior of trace elements during the chem-ical evolution of the H2O−, B−, and F−rich granite-pegmatite-hydrothermal system at theEhrenfriedersdorf tin deposit, Germany. They observed very high Rb values (5000 to 5400ppm) in melt inclusions trapped at ∼700◦C and ∼100 MPa, and Sr concentrations ≤ 17 ppm.co-genetic fluid inclusions with a salinity of 52 wt.% NaClequiv showed a Rb concentration of∼1000 ppm, with no detectable Sr. Their data yield a Df/m
Rb ≤ 0.2 at 700◦C. The usual inter-pretation of very high Rb values as reported by Rickers et al. (2006) is extreme fractionation,but the very high concentrations of fluxing components (F, B) should also contribute becausethey modify complexation in fluid and melt. Zajacz et al. (2008) analyzed co-existing silicatemelt and fluid inclusions entrapped in quartz crystals in volatile−saturated granitic systems.The reported Df/m
Rb scatter between 0.3 and 0.9 for low salinity fluids (up to 3 m Cl) and in-creases up to 3 for brines with 7 to 10.5 m Cl. It should be pointed out that these salinitiesrefer to the unmixed aqueous fluid and not to the bulk salinity of the system. The Df/m
Sr givenby Zajacz et al. (2008) have large errors, because the Sr concentrations were generally be-low the limit of detection in silicate melt inclusions. In summary, it is not clear if reported Rband Sr fluid−melt partition coefficients greater than one at high salinities are real or related toexperimental artifacts or to the inherent difficulties to derive partition coefficients from naturalinclusion assemblages. This points to the need for a systematic investigation of the Rb and Srpartitioning between fluid and melt.
In this experimental study, we determined partition coefficients of Rb and Sr betweenaqueous fluids and haplogranitic melts as a function of the following parameters:
1. Pressure and temperature. Temperature was varied between 750 and 950◦C and pres-sure mostly between 200 and 500 MPa, with some experiments up to 1 GPa. This wasdone to simulate the PT conditions of the continental crust, in which volatile-saturatedgranitic magmas commonly occur.
2. Composition of the aqueous fluid. We used H2O±(NaCl+KCl±HCl) as starting fluids.The salinity ranged from 0 to 3.6 m (NaCl+KCl) because the solute content of magmaticaqueous fluids is quite variable, but dominated by alkali and alkaline earth metal cationsand chlorine as major anion (Roedder and Bodnar, 1997). A number of experiments wasperformed with addition of HCl (0.01 to 0.04 m HCl) to investigate if a large difference inthe pH of the initial fluid and if a relatively small amount of excess Cl− have a significanteffect on Rb and Sr partitioning. Chlorine partitions strongly into the fluid phase (Webster,1997a,b) and is a highly effective complexing agent for many metals (e.g., Helgeson,1964, Burnham, 1967, Candela and Piccoli, 1995). Furthermore, some run series wereconducted with pure water as initial fluid. This was done to compare the partitioningbehavior in Cl−free systems and to better single out the potential effect of Rb and Srcomplexation with silicate melt components in the fluid, which may become significantdue to their substantial solubility at the PT conditions of the study (e.g., Anderson andBurnham, 1965, Manning, 2007).
37

ii
“thesis_report_old” — 2010/4/26 — 13:54 — page 38 — #49 ii
ii
ii
Chapter 3
3. Silicate melt composition. The alumina saturation index (ASI,Al2O3/(Na2O+K2O) in moles) of the starting glass melt varied between 0.78 and 1.38because the partitioning behavior of a given element is not only related to its speciationin the aqueous fluid but also to its incorporation in the melt. The latter may change dueto ASI-dependent differences in the melt structure.
An additional important goal was to study to what extent obtained partition coefficients areaffected by the selected experimental technique. Quench experiments are associated withlarge intrinsic uncertainties due to the tendency of fluids to unmix or precipitate solutes duringcooling (Adam et al., 1997). Hence, the most difficult part of quench experiments is to obtaina representative sample of the fluid for analysis. Sampling of a quenched solution is complexand time consuming (e.g., Flynn and Burnham, 1978, Keppler and Wyllie, 1991). Thus, thefluid composition is reconstructed in some studies via mass balance with modeling of unde-termined parameters (e.g., Ayers and Eggler, 1995, Webster, 1992a,b). Another technique isentrapment of coexisting melts and fluids in synthetic inclusions, and the subsequent analysisof their compositions after quenching using laser ablation ICP-MS (e.g., Hanley et al., 2005, Si-mon et al., 2007). Trace element concentrations in the fluid can be obtained directly at elevatedPT conditions using a hydrothermal diamond-anvil cell (HDAC) and synchrotron radiation X-rayfluorescence microanalysis (SR-µXRF) (e.g., Schmidt and Rickers, 2003, Sanchez-Valle et al.,2003, Schmidt et al., 2007, Manning et al., 2008, Borchert et al., 2009). Here, we compareresults from three experimental approaches, quench experiments with slow and rapid cooling,and analysis of the fluid in-situ and the melt after quench (HDAC).
Finally, we will show the implication of the presented data for studies of natural systems.The changes in the Rb and Sr concentrations in the melt during the crystallization and fluidexsolution of a haplogranite are modeled using crystal−melt and fluid−melt partitioning datafrom the literature and this study.
3.2 Experimental and analytical methods
3.2.1 Starting materials and sample preparation
The starting materials for the experimental runs consisted of a suite of synthetic haplograniticglasses with varying ASI from 0.8 to 1.4 (Tab. 3.1) and different aqueous fluids. Each glasscomposition was prepared in two steps. Firstly, an initial glass was produced using powders ofSiO2, Al2O3, Na2CO3 and K2CO3. The powders were mixed and stepwise heated to 1600◦Cfor decarbonatization (12 h). After quenching, the glass was crushed and melted again for48 h at 1600◦C. Secondly, Rb and Sr were added as RbCl and SrCO3 to the crushed initialglass. The glass was doped with relatively high concentrations (∼2500 to ∼3900 ppm Rb and∼2300 to ∼2900 ppm Sr). The doped glass powder was melted at 1600◦C for 24 h, thenquenched, crushed and melted again for 24 h at 1600◦C to achieve chemical homogeneity.The solutions, H2O, H2O + 1 m NaCl + 1 m KCl and H2O + 1 m NaCl + 1 m KCl + 0.02 m HCl,were produced from distilled de-ionized water and analytical grade powders of NaCl and KCl.In the HCl-bearing solution, the pH was adjusted to one whereas the other electrolyte solutionhad a pH of five.
38

ii
“thesis_report_old” — 2010/4/26 — 13:54 — page 39 — #50 ii
ii
ii
Rb and Sr partitioning between haplogranitic melts and aqueous solutions
Gold capsules (3.0 mm OD, 2.6 mm ID, 20 mm length) were loaded with approximatelyequal weight amounts of glass and fluid. The minimum weight of the fluid was 12 mg becausesmaller amounts complicated fluid sampling and analysis after the experiment. In most ex-periments, the weights of fluid and glass were 20 to 25 mg each. After loading, the capsuleswere crimped, welded shut under an electric arc while partly immersed in a bath of ice waterto avoid fluid loss, and weighed again. To check for leakage, the capsules were stored in afurnace at 120◦C for at least 30 minutes. Absence of leaks was assumed if the weight losswas less than 1 mg.
3.2.2 Quench experiments
Experiments at 750◦C and 200 MPa were conducted in externally heated cold-seal pressurevessels using H2O as pressure medium and for durations ranging from 120 to 288 hours. Twodifferent setups were used. Slow quench experiments were done in horizontal autoclaves.These runs were cooled isobarically with quench rates of ∼200◦C/min using a compressed airjet. Rapid quench experiments were performed in vertical autoclaves and were cooled from750◦C within a few seconds. Temperature was measured with external K-type thermocouplesand is considered to be accurate to ±2◦C. Thermal gradients along the capsules were lessthan 1◦C for horizontal autoclaves and 5◦C in experiments using the vertical setup. Pressurewas measured with strain gauges calibrated with a deadweight pressure gauge and was ac-curate to ±5 MPa.
Experiments at higher PT conditions, up to 950◦C and 500 MPa, were conducted usingan internally heated pressure vessel with argon pressure medium with durations from 24 to 144hours. The temperature was measured with S-type thermocouples and calibrated based onmeasurements of the melting points of NaCl at 843◦C/200 MPa and 904◦C/500 MPa (Akellaet al., 1969). The accuracy is about ±5◦C at 200 MPa and ±20◦C at 500 MPa. Thermalgradients along the capsules were ±10◦C. Pressure measurement was done with a straingauge and was accurate to ±7 MPa for experiments up to 500 MPa and to ± 20 MPa at higherpressures. During the experiment, pressure was controlled automatically within ±5 MPa usingthe hydraulic system of the intensifier and a programmable control unit. The samples werequenched isobarically with quench rates of 150−200◦C/min.
3.2.3 In-situ experiments
In-situ experiments were done using modified Bassett-type hydrothermal diamond-anvil cellsas described by Bassett et al. (1993), Schmidt et al. (2007) and Borchert et al. (2009). Ametaluminous glass composition (MetAlu†, Tab. 3.1) and H2O or 0.5 m NaCl + 0.5 m KCl +0.01 m HCl aqueous solution were used as starting materials. A detailed description of thehydrothermal diamond-anvil cells and the in-situ method is given by Borchert et al. (2009).
39

ii
“thesis_report_old” — 2010/4/26 — 13:54 — page 40 — #51 ii
ii
ii
Chapter 3
3.2.4 Analysis of run products
Quench experiments
After the experiments, the capsules were weighed to check for fluid loss during the run. Then,the capsules were placed in glass containers filled with 5 ml distilled de-ionized water andheated to ∼80◦C using a heating plate to dissolve water-soluble quench solids without affect-ing the glass composition. Subsequently, the capsule was opened under water to release theH2O soluble capsule content. Then, the diluted fluid was collected using a pipette and filteredto remove very small glass pieces. Distilled de-ionized water was added to the fluid until a vol-ume of 25 ml was attained. Capsule material, glass pieces and filters were stored in a furnaceat 120◦C for at least one hour. Then, capsule material and glass were weighed to determinethe actual fluid weight after quench by subtraction. No quench precipitates were found in thefiltered material, which contained only small quenched glass globules.
The glass pieces were embedded in epoxy resin, ground and polished. The electronmicroprobe (EMP) measurements on the glasses were carried out using a CAMECA SX-100and a two-condition analysis as suggested by Morgan VI and London (1996, 2005). The sili-cate glasses were analyzed with an electron beam energy of 15 keV, a beam current of 10 nA,and counting times of 10 s (Na, K), 20 s (Si, Al), and 30 s (Cl). Subsequently, Rb and Sr weremeasured with an electron beam energy of 15 keV, a beam current of 20 nA, and 30 s countingtime. The beam was defocused to a diameter of ∼10 µm to achieve insignificant migration ofNa and K during analysis as verified by test analyses. Replicate analyses were carried out onthe same sample (10 to 15 points per sample) to check for compositional homogeneity. Duringeach microprobe session, standards for each element were analyzed to determine accuracyand precision. Precision ranges from 0.5 to 2.5 % for Si, Al, K, Na, Rb and Sr and was up to10 % for Cl (1σ confidence level). Totals of the glass analyses ranged between 94 to 96 %indicating that Na-migration was small or insignificant because the difference to 100 % can beaccounted for by dissolved H2O.
The fluids were analyzed by inductively coupled plasma-atomic emission spectrometry(ICP-AES, Varian Vista MPX) for Na, K, Si, Al, Rb, and Sr. The Cl content in fluids from exper-iments with salt solutions was determined by ion-chromatography (IC, Dionex 100 or 120).
In a few additional runs, the quench pH of the fluid was obtained using various litmuspapers (pH-Fix Macherey-Nagel) on the escaping fluid after the capsule was pierced. In thesecases, no analyses of fluid and glass compositions were performed.
In-situ experiments
After quenching, the glass droplets were embedded together with the rhenium gasket in epoxyresin, ground and polished. The glass droplets were analyzed using EMP as described forthe quench experiments except that beam current was 10 nA for all elements and the electronbeam was defocused to a diameter of 5 to 10 µm depending on glass droplet size. For mostsamples, replicate analyses (3 to 10 points per sample) were possible. For two runs (samples5 and 7), the uncertainty of the analyses is higher because only one point per sample wasobtained. In addition, the measured Na and K concentrations for these samples are probably
40

ii
“thesis_report_old” — 2010/4/26 — 13:54 — page 41 — #52 ii
ii
ii
Rb and Sr partitioning between haplogranitic melts and aqueous solutions
too low. Precision ranges from 0.5 to 2.5 % for Si, Al, Rb and Sr, up to 5 % for Na and K, andup to 20 % for Cl (1σ confidence level).
The fluids were analyzed in-situ at 750◦C and various pressures using SR− µXRF. Theintegrated intensities of Rb and Sr K(α + β) fluorescence lines were obtained from fits of thespectra using PyMCA (Solé et al., 2007). These intensities were normalized to incident beamintensity, detector live time, and fluid density. Finally, SR-µXRF spectra of standard solutionsin the sample chamber of the HDAC were used for calibration. The method is described indetail by Borchert et al. (2009).
3.3 Results
The experimental conditions, the composition of glasses and fluids after quenching, and thequench pH for experiments at 750◦C/200 MPa are listed in Tables 3.2, 3.3, and 3.4. Conditionsand results for experiments at higher PT (to 950◦C and 500 MPa) are given in Table 3.5. Inall experiments, differences in the run duration had no effect on the data independent of thetechnique. Table 3.6 shows fluid−melt partition coefficients for Na, K, Rb, Sr and Cl obtainedfrom quench experiments. For the in-situ experiments, conditions, results of fluid and meltanalyses, and calculated fluid−melt partition coefficients of Rb and Sr are listed in Tab. 3.7 forchloridic and Tab. 3.8 for non-chloridic fluids.
The fluid−melt partition coefficients of Rb and Sr from quench experiments are shownin Figs. 3.1 and 3.2 as a function of the ASI after the run, for pressures of 200 and 500 MPa,and temperatures of 750, 850 and 950◦C. The ASI of the resulting glasses is generally shiftedto higher values compared to those of the starting glasses. This shift is more pronouncedat 500 MPa than at 200 MPa (Tabs. 3.2, 3.3, and 3.5). Rubidium partition coefficients (Fig.3.1) show no recognizable dependence on melt composition, pressure and temperature. Forchloridic solutions, Df/m
Rb scatters around 0.4. In the case of non-chloridic fluids, Rb partitioncoefficients are one to two orders of magnitude lower (Df/m
Rb = 0.002 to 0.09) and show a muchlarger scatter in the data. Strontium fluid−melt partition coefficients do, likewise, not dependon pressure and temperature in the investigated PT-range (Fig. 3.2). However, Df/m
Sr displaysa sharp increase with ASI from 0.003 at an ASI of 0.8 to a maximum of 0.3 at an ASI of 1.05.At higher ASI, Df/m
Sr decreases slightly to 0.2 at an ASI of 1.6. As for Rb, the Df/mSr for chloridic
fluids is one to two orders of magnitude higher compared to those using H2O as starting fluid.Only a few Sr partitioning data are available for non-chloridic fluids, because the Sr contentin the fluid was below detection limit in almost all experiments, except in a few slow quenchexperiments at 750◦C and 200 MPa.
The quench pH of the fluid shows large differences depending on initial glass and fluidcomposition (Tab. 3.4). For experiments with peralkaline starting glass, a basic quench pHwas found for all runs. The pH value varies from 8 in experiments with H2O to 9.5 in thosewith chloridic solutions. Runs with per- and metaluminous glass compositions resulted in nearneutral pH if water was used as starting fluid, but acidic pH in the quenched fluids if chloridicsolutions were used. Addition of HCl to the starting (NaCl+KCl) fluid does not have an effecton the quench pH although the difference in the pH of the starting fluid is large (pH 1 vs.
41
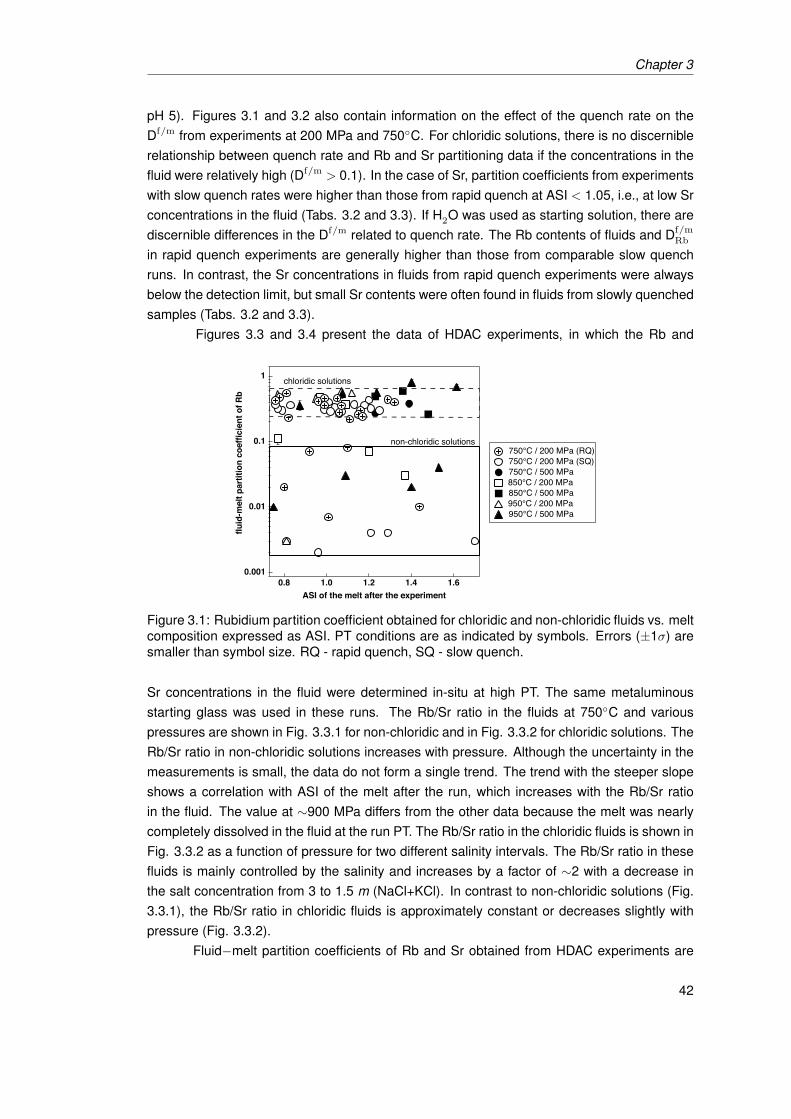
ii
“thesis_report_old” — 2010/4/26 — 13:54 — page 42 — #53 ii
ii
ii
Chapter 3
pH 5). Figures 3.1 and 3.2 also contain information on the effect of the quench rate on theDf/m from experiments at 200 MPa and 750◦C. For chloridic solutions, there is no discerniblerelationship between quench rate and Rb and Sr partitioning data if the concentrations in thefluid were relatively high (Df/m > 0.1). In the case of Sr, partition coefficients from experimentswith slow quench rates were higher than those from rapid quench at ASI < 1.05, i.e., at low Srconcentrations in the fluid (Tabs. 3.2 and 3.3). If H2O was used as starting solution, there arediscernible differences in the Df/m related to quench rate. The Rb contents of fluids and Df/m
Rb
in rapid quench experiments are generally higher than those from comparable slow quenchruns. In contrast, the Sr concentrations in fluids from rapid quench experiments were alwaysbelow the detection limit, but small Sr contents were often found in fluids from slowly quenchedsamples (Tabs. 3.2 and 3.3).
Figures 3.3 and 3.4 present the data of HDAC experiments, in which the Rb and
0.001
0.01
0.1
1
fluid
-mel
t par
titio
n co
effic
ient
of R
b
1.61.41.21.00.8ASI of the melt after the experiment
750°C / 200 MPa (RQ) 750°C / 200 MPa (SQ) 750°C / 500 MPa850°C / 200 MPa 850°C / 500 MPa950°C / 200 MPa 950°C / 500 MPa
chloridic solutions
non-chloridic solutions
Figure 3.1: Rubidium partition coefficient obtained for chloridic and non-chloridic fluids vs. meltcomposition expressed as ASI. PT conditions are as indicated by symbols. Errors (±1σ) aresmaller than symbol size. RQ - rapid quench, SQ - slow quench.
Sr concentrations in the fluid were determined in-situ at high PT. The same metaluminousstarting glass was used in these runs. The Rb/Sr ratio in the fluids at 750◦C and variouspressures are shown in Fig. 3.3.1 for non-chloridic and in Fig. 3.3.2 for chloridic solutions. TheRb/Sr ratio in non-chloridic solutions increases with pressure. Although the uncertainty in themeasurements is small, the data do not form a single trend. The trend with the steeper slopeshows a correlation with ASI of the melt after the run, which increases with the Rb/Sr ratioin the fluid. The value at ∼900 MPa differs from the other data because the melt was nearlycompletely dissolved in the fluid at the run PT. The Rb/Sr ratio in the chloridic fluids is shown inFig. 3.3.2 as a function of pressure for two different salinity intervals. The Rb/Sr ratio in thesefluids is mainly controlled by the salinity and increases by a factor of ∼2 with a decrease inthe salt concentration from 3 to 1.5 m (NaCl+KCl). In contrast to non-chloridic solutions (Fig.3.3.1), the Rb/Sr ratio in chloridic fluids is approximately constant or decreases slightly withpressure (Fig. 3.3.2).
Fluid−melt partition coefficients of Rb and Sr obtained from HDAC experiments are
42

ii
“thesis_report_old” — 2010/4/26 — 13:54 — page 43 — #54 ii
ii
ii
Rb and Sr partitioning between haplogranitic melts and aqueous solutions
0.001
2
4
68
0.01
2
4
68
0.1
2
4
68
1
fluid
-mel
t par
titio
n co
effic
ient
of S
r
1.61.41.21.00.8ASI of the melt after the experiment
750°C / 200 MPa (RQ) 750°C / 200 MPa (SQ) 750°C / 500 MPa 850°C / 200 MPa 850°C / 500 MPa 950°C / 200 MPa 950°C / 500 MPa
chloridic solutions
non-chloridic solutions
Figure 3.2: Strontium partition coefficient obtained for chloridic and non-chloridic fluids vs. meltcomposition expressed as ASI. PT conditions are as indicated by symbols. Errors (±1σ) aresmaller than symbol size. RQ - rapid quench, SQ - slow quench.
6
4
2
0
Rb/
Sr ra
tio o
f the
flui
d
140012001000800600400200Pexp at 750 °C [MPa]
3.3.1: non-chloridic solutions
6
4
2
0
Rb/
Sr ra
tio o
f the
flui
d
140012001000800600400200Pexp at 750 °C [MPa]
2.8 - 3.6 m (NaCl+KCl)
1.2 - 1.6 m (NaCl+KCl)
3.3.2: chloridic solutions
Figure 3.3: Rb/Sr ratio in the fluid vs. pressure determined in-situ at 750◦C for non-chloridic(Fig. 3.3.1 ) and chloridic fluids (Fig. 3.3.2). All starting glasses had the same metaluminouscomposition. Error bars - ±1σ.
presented as a function of pressure in Fig. 3.4.1 for non-chloridic solutions and in Fig. 3.4.2for chloridic fluids as function of salt concentration. The partition coefficients from experimentswith non-chloridic solutions increase with pressure, Df/m
Rb from ∼0.006 at ∼250 MPa to > 0.03at P > 900 MPa, but the Sr partition coefficient only from ∼0.004 at ∼250 MPa to ∼0.009at ∼900 MPa. For chloridic solutions, the fluid−melt partition coefficients of both elementsdepend on the salinity of the fluid (Fig. 3.4.2, Tabs. 3.7 and 3.8). Rubidium partition coefficientsincrease slightly and approximately linearly with salinity from ∼0.3 at ∼1.2 m (NaCl+KCl) to∼0.5 at ∼3.5 m (NaCl+KCl). An effect of pressure is not discernible for Rb but likely present
43

ii
“thesis_report_old” — 2010/4/26 — 13:54 — page 44 — #55 ii
ii
ii
Chapter 3
for Sr. At a fluid salinity of ∼3.5 m (NaCl+KCl), Df/mSr increases from 0.14 at 420 MPa to 0.57
at 1400 MPa. Still, Sr fluid−melt partitioning is mainly controlled by the salinity. The Df/mSr
values increase from 0.06 at 1.16 m (NaCl+KCl) to 0.24 at 3.56 m (NaCl+KCl) while pressuredecreases from 500 to 220 MPa.
Figure 3.5 shows a comparison of fluid−melt partition coefficients from quench and
4
56789
0.01
2
3
4
fluid
-mel
t par
titio
n co
effic
ient
s
800700600500400300P at T=750°C [MPa]
Rubidium Strontium
3.4.1: non-chloridic solutions
56789
0.1
2
3
4
567
fluid
-mel
t par
titio
n co
effic
ient
s
3.53.02.52.01.5m (NaCl + KCl)
Rubidium Strontium
200 MPa
1400 MPa
Marker size:
3.4.2: chloridic solutions
Figure 3.4: Partition coefficients of Rb and Sr at 750◦C from HDAC experiments as function ofpressure and salinity. Results for non-chloridic solutions are shown in Fig. 3.4.1 and data forchloridic fluids are presented in Fig. 3.4.2. Error bars - ±1σ.
from HDAC experiments with metaluminous starting glass and various fluid compositions at750◦C as a function of pressure. In quench experiments, the Rb and Sr concentrations in thefluid were determined after the run, but in HDAC experiments in-situ directly at the run PT.Partition coefficients of Rb (Fig. 3.5.1) and Sr (Fig. 3.5.2), and the Rb/Sr ratio in the fluid (Fig.3.6.1) obtained from experiments using chloridic solutions show good agreement betweenthe data from both techniques over the studied salinity range. However, there are obviousdifferences in the data for non-chloridic solutions. At similar conditions (750◦C/500 MPa),partitioning data from HDAC experiments are about three times higher than those from quenchruns for both elements (Rb 0.01 vs. 0.003 and Sr 0.004 vs. 0.0015). Furthermore, the HDACdata show increasing Df/m with pressure, whereas no effect of pressure is recognizable in thequench data. The possible cause of these differences is discussed below.
3.4 Discussion
3.4.1 Quench effects
In this study, we investigated to what extent obtained fluid−melt partition coefficients for Rb andSr are affected by the applied experimental technique. The comparison between rapidly andslowly quenched experiments shows clear differences for experiments with H2O as startingfluid. For comparable runs, rapidly quenched fluids contain up to 20 times more Rb and have
44
ii
“thesis_report_old” — 2010/4/26 — 13:54 — page 45 — #56 ii
ii
ii
Rb and Sr partitioning between haplogranitic melts and aqueous solutions
0.001
0.01
0.1
fluid
-mel
t par
titio
n co
effic
ient
of R
b
140012001000800600400200pressure [MPa]
quen
ch
HD
AC
chloridic solution non-chloridic fluids
chloridic solutionsquench & HDAC data
non-chloridic fluids
HDAC data
non-chloridic fluidsquench data
3.5.1: Rubidium
0.001
0.01
0.1
fluid
-mel
t par
titio
n co
effic
ient
of S
r
140012001000800600400200pressure [MPa]
quen
ch
HD
AC
chloridic solution non-chloridic fluids
chloridic solutions:quench and HDAC data
HDAC datanon-chloridic fluids:
quench data
salinity of the fluid:
>2.8 m (NaCl+KCl)
<1.56 m (NaCl+KCl)
3.5.2: Strontium
Figure 3.5: Comparison of fluid−melt partitioning data for Rb and Sr from quench and HDACexperiments, and for chloridic and non-chloridic solutions. All data are for a temperature of750◦C and metaluminous starting glass. Figure 3.5.1 shows the data for Rb as a function ofpressure and analogous for Sr in Fig. 3.5.2. Error bars - ±1σ.
lower Sr concentrations, which are below the limit of detection. For chloridic solutions andperalkaline melts, rapid−quench experiments yield, likewise, much lower Sr concentrations inthe fluid. This indicates a fast re-equilibration between melt and fluid during cooling. The effectof the back-reaction is more obvious at low concentrations in the fluid, whereas concentrationshifts due to re-equilibration remain within error at high trace element concentrations in thefluid. This confirms the results of the study by Borchert et al. (2009). Their in-situ data for fluidscoexisting with haplogranitic melts show a decreasing Rb content but a slightly increasing Srconcentration with decreasing temperature along an isochore. The data of our study clearlydemonstrate that, at similar PTx conditions, partition coefficients obtained with H2O as startingfluid are higher if the fluid was analyzed in-situ, compared to that from analyses after quench.This difference is very likely mainly caused by back reactions and not by water−insoluble Rband Sr−bearing quench phases. Such precipitates were not observed in the filtered materialor optically in the HDAC experiments. Furthermore, the fact that the Rb and Sr concentrationsin the quenched glasses showed no significant differences from the initial concentrations ofthe glasses before the run, if Rb and Sr contents in the aqueous fluids were small, is anotherargument against such quench phases (cp. Tabs. 3.1 and 3.2). In other words, Rb andSr contents in aqueous solutions in equilibrium with haplogranitic melt are not quenchable,but data from experiments with chloridic solution are less affected. Consequently, fluid−meltpartitioning data from quench experiments have to be used with caution particularly at lowtrace element contents in fluids.
45
ii
“thesis_report_old” — 2010/4/26 — 13:54 — page 46 — #57 ii
ii
ii
Chapter 3
3.4.2 Fluid−melt partitioning and complexation of Rb and Sr
This study is the first systematic investigation of Rb and Sr partitioning between aqueous fluidand haplogranitic melt as function of pressure, temperature, and fluid and melt composition.Between 750 and 950◦C and between 200 to 500 MPa, pressure and temperature effects onDf/m
Rb,Sr are small or indiscernible. This can be related to the fact that these PT conditions arewell below that of the critical curve for haplogranite−water (Bureau and Keppler, 1999). Thatis, they are located at the steep portions of the solvi, where compositions of the coexistingphases change little with P and T. The few experiments above 500 MPa show that the partitioncoefficients of Rb and Sr increase with pressure. This correlates with the increased solubilityof melt in the aqueous fluid, which results in a smaller chemical contrast between the phases,and indicates formation of significant amounts of complexes of Rb and Sr with melt compo-nents in the aqueous phase.
However, the effect of melt composition on the partition coefficients is very different forRb and Sr, which suggests that these element complex in a different manner with melt com-ponents. Fluid−melt partitioning of Rb was found to be independent of the ASI of the melt,whereas Df/m
Sr is strongly controlled by this parameter. Increasing alkalinity of the melt resultsin a sharp decrease of Df/m
Sr . This partitioning behavior of Sr is related to changes in the speci-ation in the aqueous fluid or changes in the incorporation of Sr in the melt, or both. Dissolutionof peralkaline melt will release Na+ and K+ into the aqueous fluid, which will decrease theactivity of Cl− and OH− and thus the concentration of Sr-Cl and Sr-OH complexes in the fluid.This is supported by the basic quench pH of the runs with peralkaline melt (Tab. 3.4). Becauseof increasing ion association with temperature, this points to the presence of significant quan-tities of NaOH0 and KOH0 complexes in the fluid at the run conditions. It is currently unknownto what extent the partitioning of Sr is affected by changes in the structural environment of Srin the melt. Kohn et al. (1990) found only small changes in the first coordination shell of Sr ina suite of glasses with different degrees of polymerization, and suggested that these changesshould not play a major role in Sr partitioning between crystals and melt.
The importance of the Cl− activity for the partitioning of Rb and Sr is emphasized bythe observation that the Df/m
Rb,Sr from experiments with chloridic solutions were generally muchhigher than in experiments with H2O as starting fluid. This is also indicated by the different be-havior of the Rb/Sr ratio in the fluid as a function of pressure for water or chloridic solutions asstarting fluids (Figs. 3.3.1 and 3.3.2). Only the HDAC results are shown in Fig. 3.3.1 becausethey are much more reliable than any quench data because of the back reaction upon coolingas discussed in a previous paragraph. For metaluminous starting glasses, the Rb/Sr ratio inthe non-chloridic fluid clearly increases with pressure. However, this increase must cease ateven higher pressures than that studied here because the Rb/Sr ratio must approach its initialvalue of ∼1 at the critical pressure. As Cl− is added to the system, this behavior changescompletely. The Rb/Sr ratio in chloridic fluids decreases somewhat with salinity and is, withinerror, independent of pressure. This implies that the partitioning of Rb and Sr at these condi-tions is controlled by complexation of Rb and Sr with Cl, whereas other complexes only play asubordinate role.
For all melt and fluid compositions studied here, partition coefficients of both elements
46

ii
“thesis_report_old” — 2010/4/26 — 13:54 — page 47 — #58 ii
ii
ii
Rb and Sr partitioning between haplogranitic melts and aqueous solutions
show a preference for the melt (Df/m < 1). This is distinctly different to the experimental dataof Bai and Koster van Groos (1999), which show a preference of Rb and Sr for the fluid at highsalt concentration. The results presented here are consistent with data from natural co-geneticfluid and melt inclusions (Audétat and Pettke, 2003, Rickers et al., 2006, most of the data re-ported by Zajacz et al., 2008), that also point to a preference of Rb and Sr for the melt. Bai andKoster van Groos (1999) inferred a linear relationship between Df/m
Rb and salinity (Fig. 3.6.2)but a quadratic correlation for Df/m
Sr (Fig. 3.6.3). The latter is not supported by our results. Afurther strong difference between the two studies is observed for the Rb/Sr ratio in the fluid.For a given salinity, the Rb/Sr ratio from the data by Bai and Koster van Groos (1999) is muchlower compared to our data, which covers both quench and HDAC experiments. The differ-ences between the data from both studies are probably due to artifacts from the fluid extractionprocedure for analyses after quenching.
3.4.3 Modeling of the behavior of Rb and Sr during evolution of a graniticsystem
Rubidium and Strontium concentrations in granitoids are important petrogenetic indicators. Inthe following, we will discuss the effect of fluid exsolution on the Rb and Sr concentrationsduring the evolution of a granitic melt. Figure 3.7.1 and 3.7.2 show models for the Rb andSr contents of the residual melt during an isobaric crystallization path using the peraluminousstarting composition (peralu1?) with 3 wt.% total water. Two models were applied, Rayleighfractionation (CL
Z/C0Z=F(Dbulk
Z −1)) and equilibrium crystallization(CL
Z/C0Z=1/[Dbulk
Z +F · (1-DbulkZ )]), where C0
Z and CLZ are the initial and actual concentrations of a
trace element Z in the primary magma, DbulkZ the bulk partition coefficient, and F the remaining
melt fraction. The crystallization sequence and the proportions of the phases were modeledusing MELTS (Ghiorso and Sack, 1995, Asimov and Ghiorso, 1998) starting from the liquidustemperature (∼885◦C) in increments of 1◦C. For each step of the crystallization, a bulk parti-tion coefficient of an element Z can be defined as:Dbulk
Z,(c+f)/m=Wc1· DZ,c1/m+Wc2
· DZ,c2/m+Wc3· DZ,c3/m+...+Wf · DZ,f/m
where c, f, and m refer to crystal(s), fluid and melt, and Wi corresponds to the weight fractionof the phase i exsolving from the crystallizing melt. We used the appropriate feldspar−meltpartition coefficients reported by White (2003) (Dfsp/m
Rb = 0.3, Dfsp/mSr = 5). For fluid−melt par-
titioning, we applied values for metaluminous melts, because the residual melt compositionmodeled by MELTS is metaluminous. We compared Df/m obtained in this study and by Baiand Koster van Groos (1999) for chloridic fluids, which differ in the preference for melt andfluid. The initial trace element contents were 110 ppm Rb and 350 ppm Sr, which is represen-tative for upper continental crust granitoids (Winter, 2001). First, feldspar crystallizes, whichis followed by quartz crystallization at 745◦C at a melt fraction of 0.68. Fluid saturation of themelt (∼6 wt.% at 750◦C / 200 MPa, Johannes and Holtz (1996)) is attained at 715◦C at a meltfraction of 0.56. For both Rayleigh fractionation and equilibrium crystallization, the Sr concen-tration decreases and Rb concentration and Rb/Sr ratio increase continuously in the residualmelt. However, the increase in the Rb/Sr ratio in the residual melt is much more pronouncedfor Rayleigh fractionation because Sr is more efficiently removed from the melt. Fluid−melt
47
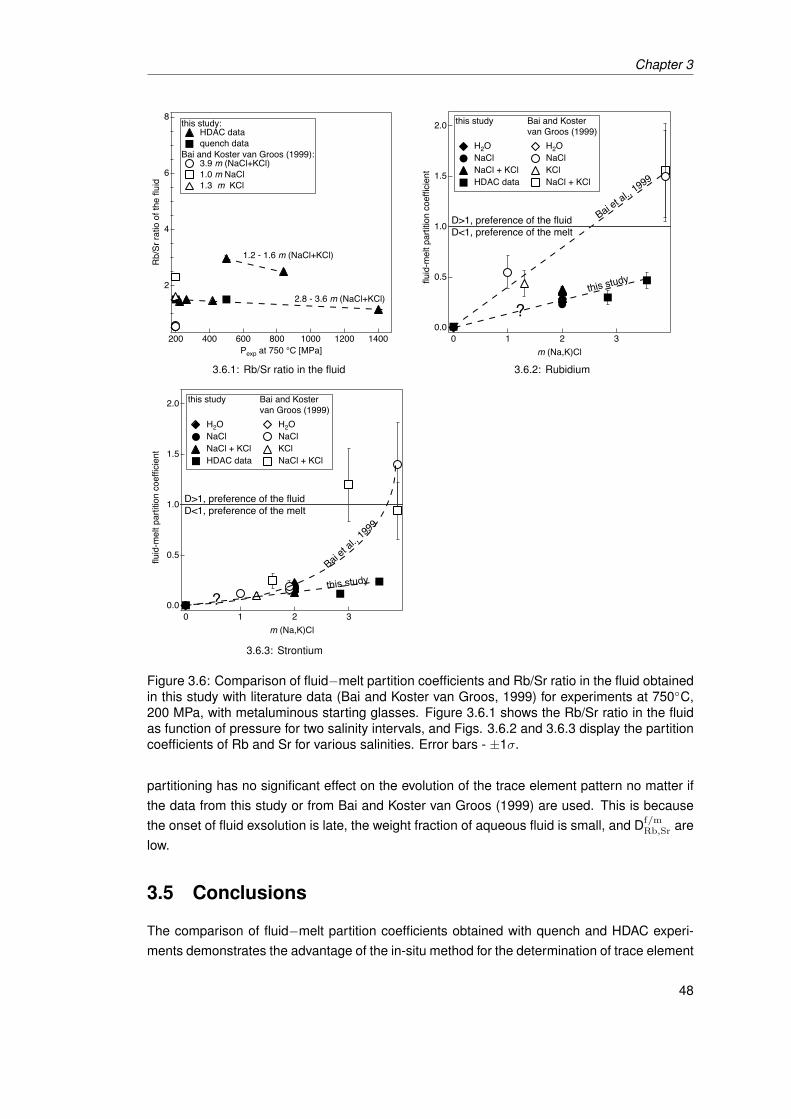
ii
“thesis_report_old” — 2010/4/26 — 13:54 — page 48 — #59 ii
ii
ii
Chapter 3
8
6
4
2
Rb/
Sr ra
tio o
f the
flui
d
140012001000800600400200Pexp at 750 °C [MPa]
2.8 - 3.6 m (NaCl+KCl)
1.2 - 1.6 m (NaCl+KCl)
this study: HDAC data quench data
Bai and Koster van Groos (1999): 3.9 m (NaCl+KCl) 1.0 m NaCl 1.3 m KCl
3.6.1: Rb/Sr ratio in the fluid
2.0
1.5
1.0
0.5
0.0
fluid
-mel
t par
titio
n co
effic
ient
3210m (Na,K)Cl
this study Bai and Kostervan Groos (1999)
H2O H2O NaCl NaCl NaCl + KCl KCl HDAC data NaCl + KCl
?
D>1, preference of the fluidD<1, preference of the melt
Bai et al., 1999
this study
3.6.2: Rubidium
2.0
1.5
1.0
0.5
0.0
fluid
-mel
t par
titio
n co
effic
ient
3210m (Na,K)Cl
this study Bai and Kostervan Groos (1999)
H2O H2O NaCl NaCl NaCl + KCl KCl HDAC data NaCl + KCl
D>1, preference of the fluidD<1, preference of the melt
this studyBai e
t al., 1
999
?
3.6.3: Strontium
Figure 3.6: Comparison of fluid−melt partition coefficients and Rb/Sr ratio in the fluid obtainedin this study with literature data (Bai and Koster van Groos, 1999) for experiments at 750◦C,200 MPa, with metaluminous starting glasses. Figure 3.6.1 shows the Rb/Sr ratio in the fluidas function of pressure for two salinity intervals, and Figs. 3.6.2 and 3.6.3 display the partitioncoefficients of Rb and Sr for various salinities. Error bars - ±1σ.
partitioning has no significant effect on the evolution of the trace element pattern no matter ifthe data from this study or from Bai and Koster van Groos (1999) are used. This is becausethe onset of fluid exsolution is late, the weight fraction of aqueous fluid is small, and Df/m
Rb,Sr arelow.
3.5 Conclusions
The comparison of fluid−melt partition coefficients obtained with quench and HDAC experi-ments demonstrates the advantage of the in-situ method for the determination of trace element
48

ii
“thesis_report_old” — 2010/4/26 — 13:54 — page 49 — #60 ii
ii
ii
Rb and Sr partitioning between haplogranitic melts and aqueous solutions
800
600
400
200
0
trace
ele
men
t con
tent
in th
e re
sidu
al m
elt [
ppm
]
1.0 0.8 0.6 0.4 0.2
melt fraction
1
10
100
1000
Rb/Sr ratio in the residual m
elt
fluid
sat
urat
ed m
elt
fluid
-und
ersa
tura
ted
mel
t
this studyBai et al. 1999
Rubidium
Strontium
Rb/Sr ratio
melt+fsp melt+fsp+qtz melt+fsp+qtz+fluid
743°C 715°CRayleighfractionation
3.7.1: Rayleigh fractionation
800
600
400
200
0
trace
ele
men
t con
tent
in th
e re
sidu
al m
elt [
ppm
]
1.0 0.8 0.6 0.4 0.2
melt fraction
3.5
3.0
2.5
2.0
1.5
1.0
0.5
Rb/Sr ratio in the residual m
elt
fluid
sat
urat
ed m
elt
fluid
-und
ersa
tura
ted
mel
t
this studyBai et al. 1999
Rubidium
Strontium
Rb/Sr ra
tio
melt+fsp melt+fsp+qtz melt+fsp+qtz+fluid
743°C 715°Cequilibriumcrystallization
3.7.2: Equilibrium crystallization
Figure 3.7: Models for the Rb and Sr contents, and Rb/Sr ratio of the residual melt dur-ing an isobaric crystallization path (200 MPa) assuming Rayleigh fractionation in Fig. 3.7.1and equilibrium crystallization in Fig. 3.7.2 using the peraluminous starting composition(Ab38.92Or23.46Qz35.08+C2.53) with 3 wt.% total water. Solid lines based on fluid−melt parti-tioning data from this study, dashed lines - Df/m from Bai and Koster van Groos (1999)).
concentrations in the fluid, especially in the case of non-chloridic solutions. The results of thisstudy are clear evidence that Rb and Sr contents in such fluids are not quenchable. The goodagreement between HDAC and quench data for chloridic fluids found in this study is likely dueto high trace element concentrations, which make the effect of back-reaction less significant.The distinct differences to other quench data (Bai and Koster van Groos, 1999) signify theimportance of a careful fluid sampling procedure. Hence, although more complex, an in-situmethod is more appropriate to study fluid−melt interactions. Currently, significant progresshas been made because the actual trace element concentrations in the aqueous fluid can nowbe determined directly high PT, but obtained fluid−melt partition coefficients are still not free ofquench effects. In-situ analysis of both fluid and melt is needed particularly for water−silicatesystems, and technical developments may solve this problem in the near future.
The fluid−melt partition coefficients of Rb and Sr are mainly controlled by the fluid com-position. They are one to two orders of magnitude higher in chloridic fluids compared to thosefound in experiments with water, which clearly shows that both elements complex with chlorineas stated before, e.g., by Helgeson (1964), Burnham (1967), Candela and Piccoli (1995) andBai and Koster van Groos (1999). In contrast to Rb, the behavior of Sr also depends on thealkalinity of the system. Our data suggest that the release of Na+ and K+ into the aqueousfluid in peralkaline systems changes the Sr speciation in the aqueous fluid. The exact natureof the Sr complexation in the fluid is not clear. Insight could be gained by spectroscopic inves-tigations, e.g., by X-ray absorption spectroscopy.
Based on our results, the fractionation of Rb and Sr between chloridic fluids and alu-minous melts is weaker than the fractionation between feldspars (or micas) and melts, andnearly independent of pressure and temperature at most conditions. Additionally, the weight
49

ii
“thesis_report_old” — 2010/4/26 — 13:54 — page 50 — #61 ii
ii
ii
Chapter 3
fraction of the exsolved aqueous fluid is small in natural granitoids. Therefore, the Rb/Sr ratioin granitic systems is primarily controlled by crystal−melt partitioning, and can thus be used,at least for non-alkaline granites, to gain information on its stage of evolution and particularlyon the degree of fractional crystallization. Extreme Rb/Sr ratios in the melt of more than 500and Rb concentrations of more than 5000 ppm as described by Rickers et al. (2006) are strongindication of a very high degree of fractional crystallization, perhaps coupled with re-meltingof already fractionated material. The results of our study also confirm that irregular Rb and Srpatterns can not be attributed to fluid-melt partitioning (London, 2005) because their partitioncoefficients vary systematically with fluid and melt composition and are relatively insensitive totemperature and pressure in a wide range.
A possible application is the study of melt inclusions. Particularly melt inclusions inquartz are useful because of the abundance of this mineral in acidic igneous rocks and it´sresistance to weathering. In sedimentology, the Rb/Sr ratio in such inclusions can provideinformation on the crustal evolution of the source area. This can also be a useful tool in thesearch of ore deposits closely related to differentiated granites (e.g., Sn and W) in areas withno outcrops. If co-genetic fluid and melt inclusions are present, the initial salinity of the systembefore unmixing may be roughly estimated from Rb partitioning, which is independent of ASI.Comparison of the experimental results to natural data is limited because only very few studiesreport Rb and Sr concentrations in co-genetic fluid and melt inclusions. These studies (Audé-tat and Pettke, 2003, Rickers et al., 2006, most of the data reported by Zajacz et al., 2008)show a preference of Rb and Sr for the melt and are also in good quantitative agreement withour data.
Acknowledgements
We thank HASYLAB at the Deutsches Elektronen-Synchrotron (DESY) for granting beamtime,R. Botcharnikov at Leibniz Universität Hannover for performing some of the quench experi-ments (IHPV), O. Appelt for the help with EMP measurements at Deutsches GeoForschungsZen-trum GFZ, A. Musiol for the introduction to ICP-OES analysis at Universität Potsdam, and A.Gottsche and G. Schettler for the introduction to IC analysis and performance of some of theanalysis at Deutsches GeoForschungsZentrum GFZ. We are grateful to Zoltan Zajacz, JohnC. White and David London for their constructive reviews, which helped us to improve themanuscript, and to Mike Toplis for his editorial work. This study was supported by the GermanScience Foundation (DFG, Wi 2000/3-1 and Wi 2000/3-2).
50

ii
“thesis_report_old” — 2010/4/26 — 13:54 — page 51 — #62 ii
ii
ii
Adam, J., Green, T. H., Sie, S. H., and Ryan, C. G. (1997). Trace element partitioning betweenaqueous fluids, silicate melts and minerals. Eur. J. Mineral., 9:569–584.
Akella, J., Vaidya, S. N., and Kennedy, G. C. (1969). Melting of Sodium Chloride at Pressuresto 65 kbar. Physical Review, 185(3):1135–1140.
Anderson, G. M. and Burnham, C. W. (1965). The solubility of quartz in supercritical water.American Journal of Science, 263:494–511.
Asimov, P. and Ghiorso, M. (1998). Algorithmic modifications extending MELTS to calculatesubsolidus phase relations. American Mineralogist, 83:1127–1131.
Audétat, A. and Pettke, T. (2003). The magmatic-hydrothermal evolution of two barren gran-ites: A melt and fluid inclusion study of the Rito del Medio and Canada Pinabete plutons innorthern New Mexico (USA). Geochimica et Cosmochimica Acta, 67(1):97–121.
Audétat, A., Pettke, T., Heinrich, C. A., and Bodnar, B. J. (2008). The Composition of Magmatic-Hydrothermal Fluids in Barren and Mineralized Intrusions. Economic Geology, 103(5):877–905.
Ayers, J. C. and Eggler, D. H. (1995). Partitioning of elements between silicate melt and H2O-NaCl fluids at 1.5 and 2.0 GPa pressure: Implications for mantle metasomatism. Geochimicaet Cosmochimica Acta, 59(20):4237–4246.
Bai, T. B. and Koster van Groos, A. F. (1999). The distribution of Na, K, Rb, Sr, Al, Ge, Cu,W, Mo, La, and Ce between granitic melts and coexisting aqueous fluids. Geochimica etCosmochimica Acta, 63(7/8):1117–1131.
Bassett, W. A., Shen, A. H., Bucknum, M., and Chou, I.-M. (1993). A new diamond anvil cell forhydrothermal studies to 2.5 GPa and from 190 to 1200◦C. Review of scientific instruments,64:2340–2345.
Bédard, J. H. (2006). Trace element partitioning in plagioclase feldspar. Geochimica et Cos-mochimica Acta, 70:3717–3742.
Borchert, M., Wilke, M., Schmidt, C., and Rickers, K. (2009). Partitioning and equilibration ofRb and Sr between silicate melts and aqueous fluids. Chemical Geology, 259:39–47.
Bureau, H. and Keppler, H. (1999). Complete miscibility between silicate melts and hydrousfluids in the upper mantle: experimental evidence and geochemical implications. Earth andPlanetary Science Letters, 165:187–196.
51

ii
“thesis_report_old” — 2010/4/26 — 13:54 — page 52 — #63 ii
ii
ii
Chapter 3
Burnham, C. W. (1967). Hydrothermal fluids at the magmatic stage. In: Geochemistry ofHydrothermal Ore Deposits, pages 34–67. John Wiley, New York.
Candela, P. A. and Piccoli, P. M. (1995). Model ore-metal partitioning from melts into vapor andvapor/brine mixtures. In: Magmas, Fluids, and Ore Deposits, volume 23, pages 101–127.Mineralogical Association of Canada Short Course.
Carron, J.-P. and Lagache, M. (1980). Étude expéimentale du fractionnement des élémentsRb, Cs, Sr et Ba entre feldspaths alcalins, solutions hydrothermales et liquides silicatés dansle systéme Q.Ab.Or.H2O à 2 kbar entre 700 to 800◦C. Bull. Mineral., 103:571–578.
Chappell, B. W. and White, A. J. R. (1974). Two contrasting granite types. Pac Geol, 8:173–174.
Flynn, R. T. and Burnham, C. W. (1978). An experimental determination of rare earth partitioncoefficients between a chloride containing vapor phase and silicate melts. Geochimica etCosmochimica Acta, 42:685–701.
Ghiorso, M. and Sack, R. (1995). Chemical mass transfer in magmatic processes. IV. A revisedand internally consistent thermodynamic model for the interpolation and extrapolation ofliquid-solid equilibria in magmatic systems at elevated temperatures and pressures. ContribMineralogy Petrology, 119:197–212.
Green, T. H. (1980). Island arc and continent-building magmatism - A review of petrogenicmodels based on experimental petrology and geochemistry. Tectonophysics, 63:367–385.
Hanley, J. J., Pettke, T., Mungall, J. E., and Spooner, E. T. C. (2005). The solubility of platinumand gold in NaCl brines at 1.5 kbar, 600 to 800◦C: A laser ablation ICP-MS pilot study ofsynthetic fluid inclusions. Geochimica et Cosmochimica Acta, 69(10):2593–2611.
Helgeson, H. (1964). Complexing and Hydrothermal Ore Deposition. Pergamon, New York.
Icenhower, J. and London, D. (1995). An experimental study of element partitioning amongbiotite, muscovite, and coexisting peraluminous silicic melt at 200 MPa (H2O). AmericanMineralogist, 80:1229–1251.
Icenhower, J. and London, D. (1996). Experimental partitioning of Rb, Cs, Sr, and Ba betweenalkali feldspar and peraluminous melt. American Mineralogist, 81:719–734.
Johannes, W. and Holtz, F. (1996). Petrogenesis an Experimental Petrology of Granitic Rocks.Springer, Berlin.
Keppler, H. and Wyllie, P. J. (1991). Partitioning of Cu, Sn, Mo, W, U, and Th between meltand aqueous fluid in the systems haplogranite-H2O-HCl and haplogranite-H2O-HF. Contri-butions to Mineralogy and Petrology, 109:139–150.
Kohn, S. C., Charnock, J. M., Henderson, C. M. B., and Greaves, G. N. (1990). The structuralenvironments of trace elements in dry and hydrous silicate glasses; a manganese and stron-tium K-edge X-ray absorption spectroscopic study. Contributions to Mineralogy Petrology,105:359–368.
52

ii
“thesis_report_old” — 2010/4/26 — 13:54 — page 53 — #64 ii
ii
ii
London, D. (2005). Geochemistry of alkali and alkaline earth elements in ore-forming granites,pegmatites, and rhyolites. In: Rare-element geochemistry of ore deposits, volume 17, pages17–43. Geological association of Canada Short Course Handbook.
London, D., Hervig, R. L., and Morgan, G. B. (1988). Melt-vapor solubilities and elementalpartitioning in peraluminous granite-pegmatite systems: experimental results with Macusaniglass at MPa. Contributions to Mineralogy and Petrology, 99:360–373.
Manning, C. E. (2007). Solubility of corundum + kyanite in H2O at 700◦C and 10 kbar: evidencefor Al-Si complexing at high pressure and temperature. Geofluids, 7:258–269.
Manning, C. E., Wilke, M., Schmidt, C., and Cauzid, J. (2008). Rutile solubility in albite-H2O and Na2Si3O7-H2O at high temperatures and pressures by in-situ synchrotron radiationmicro-XRF. Earth and Planetary Science Letters, 272:730–737.
Morgan VI, G. B. and London, D. (1996). Optimizing the electron microprobe analysis ofhydrous alkali aluminosilicate glasses. American Mineralogist, 81:1176–1185.
Morgan VI, G. B. and London, D. (2005). Effect of current density on the electron microprobeanalysis of alkali aluminosilicate glasses. American Mineralogist, 90:1131–1138.
Murray, M. M. and Rogers, J. W. (1973). Distribution of rubidium and strontium in the potassiumfeldspar of two granite batholiths. Geochemical Journal, 6:117–130.
Philpotts, A. R. (1990). Principles of igneous and metamorphic petrology. Prentice Hall, Lon-don.
Ren, M., Parker, D. F., and White, J. C. (2003). Partitioning of Sr, Ba, Rb, Y, and REE betweenplagioclase and peraluminous silicic magma. American Mineralogist, 88:1091–1103.
Rickers, K., Thomas, R., and Heinrich, W. (2006). The behavior of trace elements duringthe chemical evolution of the H2O-, B-, and F-rich granite-pegmatite-hydrothermal systemat Ehrenfriedersdorf, Germany: a SXRF study of melt and fluid inclusions. Mineralium De-posita, 41:229–245.
Robb, L. (2005). Introduction to ore-forming processes. Blackwell Publishing, Oxford.
Roedder, E. and Bodnar, R. J. (1997). Fluid inclusion studies of hydrothermal or deposits. In:Geochemistry of Hydrothermal Ore Deposits. John Wiley & Sons, New York.
Sanchez-Valle, C., Martinez, I., Daniel, I., Philippot, P., Bohic, S., and Simionovici, A. (2003).Dissolution of strontianite at high P-T conditions: An in-situ synchrotron X-ray fluorescencestudy. American Mineralogist, 88:978–985.
Schmidt, C. and Rickers, K. (2003). In-situ determination of mineral solubilities in fluids us-ing a hydrothermal diamond-anvil cell and SR-XRF: Solubility of AgCl in water. AmericanMineralogist, 88:288–292.
Schmidt, C., Rickers, K., Bilderback, D. H., and Huang, R. (2007). In situ synchrotron-radiationXRF study of REE phosphate dissolution in aqueous fluids to 800◦C. Lithos, 95:87–102.
53

ii
“thesis_report_old” — 2010/4/26 — 13:54 — page 54 — #65 ii
ii
ii
Chapter 3
Simon, A. C., Frank, M. R., Pettke, T., Candela, P. A., Piccoli, P. M., Heinrich, C. A., andGlascock, M. (2007). An evaluation of synthetic fluid inclusions for the purpose of trappingequilibrated, coexisting, immiscible fluid phases at magmatic conditions. American Mineral-ogist, 92:124–138.
Solé, V. A., Papillon, E., Cotte, M., Walter, P., and Susini, J. (2007). A multiplatform codefor the analysis of energy-dispersive X-Ray fluorescence spectra. Spectrochimica Acta, B62:63–68.
Webster, J. D. (1992a). Fluid-melt interactions involving Cl-rich granites: Experimental studyfrom 2 to 8 kbar. Geochimica et Cosmochimica Acta, 56:659–678.
Webster, J. D. (1992b). Water solubility and chlorine partitioning in Cl-rich granitic systems: Ef-fects of melt composition at 2 kbar and 800◦C. Geochimica et Cosmochimica Acta, 56:679–687.
Webster, J. D. (1997a). Chloride solubility in felsic melts and the role of chloride in magmaticdegassing. Journal of Petrology, 38:1793–1807.
Webster, J. D. (1997b). Exsolution of magmatic volatile phases from Cl-enriched mineralizinggranitic magmas and implications for ore metal transport. Geochimica et CosmochimicaActa, 61:1017–1029.
Webster, J. D., Holloway, J. R., and Hervig, R. L. (1989). Partitioning of Lithophile trace el-ements between H2O and H2O+CO2 fluids and topaz rhyolite melt. Economic Geology,84:116–134.
White, J. C. (2003). Trace-element partitioning between alkali feldspar and peralkalic quartztrachyte to rhyolite magma. Part II: Empirical equations for calculating trace-element partitioncoefficients of large-ion lithophile, high field-strength, and rare-earth elements. AmericanMineralogist, 88:330–337.
White, J. C., Holt, G. S., Parker, D. F., and Ren, M. (2003). Trace-element partitioning betweenalkali feldspar and peralkalic quartz trachyte to rhyolite magma. Part I: Systematics of trace-element partitioning. American Mineralogist, 88:316–329.
Winter, J. D. (2001). An Introduction to Igneous and Metamorphic Petrology. Prentice Hall,New Jersey.
Zajacz, Z., Halter, W. E., Pettke, T., and Guillong, M. (2008). Determination of fluid/melt parti-tion coefficients by LA-ICPMS analysis of co-existing fluid and silicate melt inclusions: Con-trols on element partitioning. Geochimica et Cosmochimica Acta, 72:2169–2197.
54

ii
“thesis_report_old” — 2010/4/26 — 13:54 — page 55 — #66 ii
ii
ii
Appendix
Table 3.1: Composition of starting glasses from EMP analyses and normative composition based on the components albite, ortho-clase, quartz, corundum and Na-metasilicate.
SiO2 Al2O3 Na2O K2O ASI Rb Sr normative - composition[wt.%] [wt.%] [wt.%] [wt.%] [ppm] [ppm]
PerAlu1? 75.83 14.17 4.53 3.91 1.21 3862±455 2628±443 Ab38.92Or23.46Qz35.08 + C2.53MetAlu1? 77.71 12.31 4.46 3.95 1.06 3853±488 2763±470 Ab38.33Or23.69Qz37.25 + C0.72PerAlk2? 78.75 12.56 5.41 3.64 0.98 2587±156 2742±178 Ab44.19Or21.42Qz34.05 + Ns0.33PerAlk1? 79.18 12.37 7.45 3.38 0.78 2483±259 2675±167 Ab43.73Or19.53Qz32.57 + Ns4.16PerAlu2† 72.98 16.86 4.87 3.86 1.38 2667±226 2322±257 Ab41.80Or23.16Qz30.30 + C4.73PerAlu1† 77.26 14.50 4.30 3.94 1.28 3081±155 2514±182 Ab36.37Or23.30Qz37.16 + C3.16MetAlu1† 78.68 12.67 4.04 3.85 1.17 2690±149 2821±182 Ab34.46Or22.93Qz40.74 + C1.87PerAlk2† 79.21 12.65 5.00 3.47 1.06 2548±229 2538±252 Ab42.13Or20.44Qz36.74 + C0.67PerAlk1† 78.80 12.27 7.24 3.31 0.79 2795±150 2840±178 Ab43.96Or19.23Qz32.99 + Ns3.81? - starting glass also doped with La and Yb† - starting glass also doped with La and YAb-albite, Or-orthoclase, Qz-quartz, C-corundum, Ns-Na2SiO3
Table 3.2: Data from experiments at 750◦C and 200 MPa using rapid quench autoclaves (RQ). For each run, the first line of theanalyses refers to the quench glass and second line to the quenched fluid.
experimental conditions analyses of run productsrun P T starting materials Na2O K2O SiO2 Al2O3 ASI Rb Sr Cl
[MPa] [◦C] [melt / fluid] [wt.%] [wt.%] [wt.%] [wt.%] [ppm] [ppm] [ppm]RQH1-1 200 750 PerAlu1? 4.20 3.67 72.23 13.14 1.21 2645±178 2368±238 bdl
H2O 0.19 0.05 bdl bdl bdl bdl naRQH1-4 200 750 PerAlk2? 4.80 3.33 72.44 11.65 1.01 2467±119 2423±152 bdl
H2O bdl 0.03 0.02 bdl 17±10 bdl naRQH1-3 200 750 PerAlk1? 6.45 3.09 71.28 11.10 0.80 2374±136 2454±176 bdl
H2O bdl 0.01 0.003 bdl 40±10 bdl naRQH2-0 200 750 PerAlu2† 4.13 3.64 70.58 15.46 1.44 2516±180 2315±191 bdl
H2O bdl 0.03 0.03 bdl 29±10 bdl naRQH2-2 200 750 MetAlu1† 4.02 3.73 72.47 11.66 1.10 2656±212 2697±246 bdl
H2O 0.04 0.05 bdl bdl 202±20 bdl naRQH2-4 200 750 PerAlk2† 5.27 3.45 72.56 11.42 0.92 2481±196 2895±215 bdl
H2O bdl 0.02 bdl bdl 163±15 bdl naRQH2-3 200 750 PerAlk1† 6.77 3.60 68.21 14.13 0.94 3801±159 2864±232 bdl
H2O bdl 0.02 bdl bdl bdl bdl naRQA1 200 750 PerAlu1? 3.59 5.02 72.43 13.12 1.16 1444±191 1506±172 1210±102
1H + 1S (pH 1) 1.98 1.87 0.01 0.002 432±43 291±29 40667±4070RQA2 200 750 MetAlu1? 3.24 4.95 73.73 11.37 1.06 1498±157 1649±220 704±83
1H + 1S (pH 1) 2.16 1.79 bdl bdl 402±40 297±30 41532±4150RQA3 200 750 PerAlk1? 5.60 4.57 69.78 11.07 0.78 1337±130 2370±175 2140±321
1H + 1S (pH 1) 3.12 2.31 0.03 0.003 628±21 bdl 65364±6536RQB0 200 750 PerAlu2† 3.97 5.00 68.81 15.42 1.29 1556±133 1813±197 1896±211
1H + 1S (pH 1) 2.71 2.51 0.001 bdl 684±8 352±4 54870±5487RQB1 200 750 PerAlu1† 3.62 5.09 73.04 13.22 1.15 1657±180 1372±203 1128±114
1H + 1S (pH 1) 1.81 1.69 0.06 0.002 435±44 279±28 38189±3820RQB2 200 750 MetAlu1† 3.50 5.00 75.00 11.84 1.06 1516±174 1730±189 871±91
1H + 1S (pH 1) 1.88 1.72 bdl bdl 417±42 388±39 37413±3741RQB4 200 750 PerAlk2† 4.07 4.52 72.79 11.48 0.99 1607±107 2577±210 1434±199
1H + 1S (pH 1) 2.55 1.98 bdl bdl 576±9 bdl 48295±4830RQB3 200 750 PerAlk1† 5.36 4.82 70.67 11.00 0.82 1747±146 2662±157 1697±248
1H + 1S (pH 1) 2.16 1.41 0.02 bdl 410±9 bdl 36123±3612RQC1 200 750 PerAlu1? 3.65 5.10 67.67 12.80 1.11 1711±299 13.16±278 986±201
1H + 1S 1.50 1.51 0.04 0.001 384±38 315±31 33070±3307RQC2 200 750 MetAlu1? 3.41 5.09 74.18 11.70 1.05 1565±167 1550±241 976±94
1H + 1S 3.72 2.70 0.03 0.002 727±73 523±52 63235±6324RQC4 200 750 PerAlk2? 3.94 4.71 73.95 11.44 0.99 1624±119 2363±163 1242±208
1H + 1S 3.20 2.42 0.06 0.02 740±150 bdl 64190±6419RQC3 200 750 PerAlk1? 5.85 4.45 70.32 10.93 0.76 1472±105 2521±157 2009±271
1H + 1S 3.09 2.14 0.04 bdl 616±19 bdl 57054±5705RQD0 200 750 PerAlu2† 3.77 4.74 68.44 15.01 1.32 1676±118 1490±153 1454±175
1H + 1S 2.63 2.29 0.007 bdl 668±21 257±3 56660±5670RQD1 200 750 PerAlu1† 3.51 5.00 72.59 13.09 1.17 1655±194 1459±221 986±133
1H + 1S 1.64 1.48 0.02 bdl 397±40 236±24 33500±3350RQD2 200 750 MetAlu1† 3.34 4.91 74.37 11.59 1.07 1522±203 1602±158 693±91
1H + 1S 2.21 2.00 0.1 0.001 527±53 375±38 42808±4281RQD4 200 750 PerAlk2† 4.22 4.62 73.83 11.52 0.96 1738±163 2607±397 1196±360
1H + 1S 3.36 2.57 0.001 0.004 718±37 8±1 49205±4921RQD3 200 750 PerAlk1† 5.27 4.69 70.99 11.09 0.81 1528±139 2640±180 1462±199
1H + 1S 4.44 3.26 0.04 bdl 844±22 bdl 79318±7932
na− not analyzedbdl− below detection limit1H− 1m NaCl, 1S− 1m KCl? − starting glass also doped with La and Yb† − starting glass also doped with La and YASI− Al2O3 /(Na2O+K2O) in moles
55

ii
“thesis_report_old” — 2010/4/26 — 13:54 — page 56 — #67 ii
ii
ii
Chapter 3
Table 3.3: Data from experiments at 750◦C and 200 MPa using slow quench autoclaves (externally heated cold-sealed pres-sure vessels, SQ). For each run, the first line of the analyses refers to the quench glass and second line to the quenched fluid.
experimental conditions analyses of run productsrun P T starting materials Na2O K2O SiO2 Al2O3 ASI Rb Sr Cl
[MPa] [◦C] [melt / fluid] [wt.%] [wt.%] [wt.%] [wt.%] [ppm] [ppm] [ppm]EHPVH1-1 200 750 PerAlu1? 2.43 3.60 74.09 13.45 1.70 2626±260 2234±220 na
H2O 0.21 0.07 bdl bdl 7±1 4±0.5 naEHPVH1-2 200 750 MetAlu1? 2.70 3.64 75.27 11.77 1.40 2444±240 2490±250 na
H2O 0.11 0.06 bdl bdl bdl 4±1 naEHPVH1-4 200 750 PerAlk2? 3.63 3.35 75.90 11.66 1.21 2374±240 2306±230 na
H2O 0.14 0.04 bdl bdl 10±1 2±0.5 naEHPVH1-3 200 750 PerAlk1? 6.49 3.19 74.25 11.24 0.80 2717±391 2729±402 na
H2O 0.18 0.06 bdl bdl bdl bdl naEHPVH2-1 200 750 PerAlu1† 3.88 3.68 73.57 13.36 1.29 3094±341 2602±335 na
H2O 0.05 0.04 bdl bdl 4±1 bdl naEHPVH2-2 200 750 MetAlu1† 3.85 3.70 75.49 11.76 1.14 2858±335 2621±407 na
H2O 0.08 0.06 bdl bdl bdl 3±0.5 naEHPVH2-4 200 750 PerAlk2† 4.99 3.49 75.22 11.50 0.96 2623±339 3019±417 na
H2O 0.13 0.05 bdl bdl 6±1 bdl naEHPVH2-3 200 750 PerAlk1† 6.33 3.14 73.67 11.20 0.81 2961±383 2839±377 na
H2O 0.19 0.04 bdl bdl 10±1 bdl naEHPVA1 200 750 PerAlu1? 3.55 4.80 71.38 13.26 1.20 1807±181 1872±294 na
1H + 1S (pH 1) 3.03 2.48 bdl bdl 779±3 524±9 naEHPVA2 200 750 MetAlu1? 3.42 4.91 73.43 11.63 1.06 1675±170 1825±266 na
1H + 1S (pH 1) 2.13 1.82 bdl bdl 490±3 325±2 naEHPVA4 200 750 PerAlk2? 3.58 4.79 73.10 11.56 1.04 1566±151 2476±208 na
1H + 1S (pH 1) 2.69 2.08 bdl bdl 519±6 80±1 naEHPVA3 200 750 PerAlk1? 5.48 4.61 70.89 11.03 0.79 1387±182 2454±220 na
1H + 1S (pH 1) 2.57 1.66 bdl bdl 418±5 28±1 naEHPVB1 200 750 PerAlu1† 3.37 5.06 71.42 13.02 1.18 1884±137 1706±203 na
1H + 1S (pH 1) 2.65 2.37 bdl bdl 678±6 377±9 naEHPVB2 200 750 MetAlu1† 3.34 5.03 73.83 11.73 1.07 1683±152 2002±163 na
1H + 1S (pH 1) 2.12 1.75 bdl bdl 493±8 409±5 naEHPVB4 200 750 PerAlk2† 3.97 4.77 73.44 11.63 0.99 1654±154 2686±150 na
1H + 1S (pH 1) 2.62 2.01 bdl bdl 511±12 105±1 naEHPVB3 200 750 PerAlk1† 5.50 4.76 71.85 10.94 0.77 1653±141 2587±180 na
1H + 1S (pH 1) 2.98 2.02 bdl bdl 530±16 15±1 naEHPVC1 200 750 PerAlu? 3.27 4.88 72.83 13.31 1.25 1706±140 1724±293 na
1H + 1S 2.32 1.92 bdl bdl 518±11 319±4 naEHPVC2 200 750 MetAlu1? 3.15 4.82 74.16 11.73 1.13 1670±173 2165±226 na
1H + 1S 2.52 2.30 bdl bdl 611±11 280±2 naEHPVC4 200 750 PerAlk2? 3.78 4.74 73.79 11.60 1.02 1529±210 2518±189 na
1H + 1S 2.32 1.69 bdl bdl 436±14 66±1 naEHPVC3 200 750 PerAlk1? 5.96 4.72 72.79 11.27 0.76 1622±302 2626±376 na
1H + 1S 3.24 2.18 bdl bdl 597±11 12±1 naEHPVD1 200 750 PerAlu1† 3.36 4.99 72.48 13.21 1.21 1886±227 1672±173 na
1H + 1S 2.20 1.95 bdl bdl 598±10 314±5 naEHPVD4 200 750 PerAlk2† 3.69 4.80 73.60 11.44 1.01 1537±190 2819±195 na
1H + 1S 3.22 2.63 bdl bdl 608±8 126±1 naEHPVD3 200 750 PerAlk1† 4.96 4.67 71.75 10.91 0.83 1635±169 2605±225 na
1H + 1S 3.06 2.17 bdl bdl 585±3 21±1 na
na− not analyzedbdl− below detection limit1H− 1m NaCl, 1S− 1m KCl? − starting glass also doped with La and Yb† − starting glass also doped with La and YASI− Al2O3 /(Na2O+K2O) in moles
Table 3.4: Experimental conditions, starting materials and quench pH of the fluids for selected glass and fluid compositions
experimental conditionsP T starting materials quench pH
MPa [◦C] glass fluid200 750 PerAlu2† 1H + 1S (pH 1) 1.7200 750 MetAlu1† 1H + 1S (pH 1) 3−4200 750 PerAlk1† 1H + 1S (pH 1) 9.5200 750 MetAlu1† 1H + 1S (pH 5) 2200 750 PerAlk1† 1H + 1S (pH 5) 9.5200 750 PerAlu2† H2O 7200 750 MetAlu1† H2O 6200 750 PerAlk1† H2O 7.5−7.9
† - starting glass also doped with La and Y1H - 1m NaCl, 1S - 1m KClpH-Fix 0-14 - reading accuracy±0.5 pH, steps of 1 pHpH-Fix 1.7-3.8; pH-Fix 3.6-6.1; pH-Fix 7.5-9.5 - reading accuracy±0.1 pH, steps of 0.3 pH
Table 3.5: Data from experiments up to 950◦C and 850 MPa using internally heated cold-sealed pressure vessels (IHPV). Foreach run, the first line of the analyses refers to the quench glass and second line to the quenched fluid.
experimental conditions analyses of run productsrun P T starting materials Na2O K2O SiO2 Al2O3 ASI Rb Sr Cl
[MPa] [◦C] [melt / fluid] [wt.%] [wt.%] [wt.%] [wt.%] [ppm] [ppm] [ppm]IHPV-G1‡ 500 750 PerAlu1? 3.23 3.24 71.03 14.36 1.63 2599±260 2471±240 bdl
H2O 0.26 0.19 na na 18±3 3±1 naIHPV-G2‡ 500 750 MetAlu1? 3.51 3.26 73.67 12.52 1.35 2707±270 2764±277 bdl
H2O 0.15 0.07 na na 7±1 bdl naIHPV-E1‡ 500 750 PerAlu1? 3.39 4.52 69.90 14.52 1.39 1767±214 2401±238 bdl
1H + 1S (pH 1) 2.79 2.19 na na 677±11 255±3 naIHPV-E2‡ 500 750 MetAlu1? 3.24 4.29 71.79 12.32 1.23 1868±174 2415±179 bdl
1H + 1S (pH 1) 2.25 1.58 na na 503±5 333±2 naIHPV-F1‡ 500 750 PerAlu1? 3.23 4.36 69.28 14.27 1.42 1820±181 2426±172 bdl
1H + 1S 1.75 1.37 na na 441±3 157±2 na
56

ii
“thesis_report_old” — 2010/4/26 — 13:54 — page 57 — #68 ii
ii
ii
Table 3.5 - continued from previous pageexperimental conditions analyses of run products
run P T starting materials Na2O K2O SiO2 Al2O3 ASI Rb Sr Cl[MPa] [◦C] [melt / fluid] [wt.%] [wt.%] [wt.%] [wt.%] [ppm] [ppm] [ppm]
IHPV-F2‡ 500 750 MetAlu1? 2.82 4.59 73.57 12.17 1.27 1499±150 2414±241 bdl1H + 1S 2.57 1.95 na na 531±10 170±2 na
IHPV-H1 200 850 PerAlu1? 3.59 3.70 72.56 13.56 1.37 2603±123 2551±104 bdlH2O 0.17 0.11 0.04 0.02 66±45 bdl na
IHPV-H1 200 850 PerAlu1? 3.59 3.70 72.56 13.56 1.37 2603±123 2551±104 bdlH2O 0.17 0.11 0.04 0.02 66±45 bdl na
IHPV-H2 200 850 MetAlu1? 3.57 3.66 74.68 11.83 1.20 2661±118 2625±166 bdlH2O 0.12 0.08 0.05 0.02 180±56 bdl na
IHPV-H4 200 850 PerAlk2? 4.51 3.41 74.21 11.58 1.04 2451±157 2452±111 bdlH2O 0.44 0.15 0.13 0.02 bdl bdl na
IHPV-H3 200 850 PerAlk1? 6.37 3.15 73.05 11.28 0.81 2309±106 2440±151 bdlH2O 0.18 0.07 0.21 0.02 bdl bdl na
IHPV-A1 200 850 PerAlu1? 3.70 4.86 72.05 13.34 1.18 1782±120 1784±136 1961±1911H + 1S (pH 1) 2.79 2.45 0.06 0.02 829±50 770±10 54088±5409
IHPV-A2 200 850 MetAlu1? 3.53 4.81 72.46 11.98 1.09 1689±112 1917±129 1407±2251H + 1S (pH 1) 2.31 2.23 0.01 bdl 626±16 424±7 48667±4867
IHPV-A4 200 850 PerAlk2? 4.22 4.66 71.79 11.61 0.97 1449±141 2358±198 1655±2511H + 1S (pH 1) 2.94 2.48 bdl bdl 687±26 40±1 56387±5639
IHPV-A3 200 850 PerAlk1? 5.79 4.49 70.67 11.07 0.77 1481±174 2493±159 2814±4021H + 1S (pH 1) 0.97 0.74 0.01 bdl 170±27 bdl 59564±5956
IHPV5 200 950 PerAlu1† 3.83 3.58 72.89 13.66 1.34 3040±174 2455±155 bdlH2O bdl bdl bdl bdl bdl bdl na
IHPV6 200 950 MetAlu1† 3.77 3.64 74.49 11.98 1.18 2712±112 2729±150 bdlH2O bdl bdl bdl bdl bdl bdl na
IHPV8 200 950 PerAlk2† 5.81 3.56 76.37 12.31 0.92 2668±192 2971±228 bdlH2O bdl bdl bdl bdl bdl bdl na
IHPV7 200 950 PerAlk1† 6.35 3.00 72.08 11.10 0.81 2698±139 2614±130 bdlH2O 0.04 0.02 0.02 bdl 7±1 bdl na
IHPV9 200 950 PerAlu1† 4.02 5.01 71.92 13.50 1.12 1835±155 1908±171 2492±3331H + 1S (pH 1) 3.00 2.89 bdl bdl 1003±12 571±4 59609±5961
IHPV10 200 950 MetAlu1† 3.68 4.58 72.33 11.81 1.07 1653±150 2015±139 2238±5461H + 1S (pH 1) 3.2 73.16 bdl bdl 965±26 640±5 60299±6030
IHPV12 200 950 PerAlk2† 4.43 4.58 70.66 11.66 0.95 1570±113 2577±209 2235±3491H + 1S (pH 1) 3.19 2.63 bdl bdl 706±12 40±1 46958±4696
IHPV11 200 950 PerAlk1† 5.72 4.72 71.47 11.17 0.77 1433±125 2657±124 3862±2331H + 1S (pH 1) 3.55 2.71 0.03 bdl 739±12 15±1 46774±4677
IHPV13 500 850 PerAlu2† 3.46 3.37 67.69 14.61 1.56 2460±110 2310±175 bdlH2O bdl bdl 0.01 bdl bdl bdl na
IHPV14 500 850 PerAlu1† 3.27 3.44 70.26 13.28 1.46 2868±133 2395±156 bdlH2O bdl bdl bdl bdl bdl bdl na
IHPV15 500 850 MetAlu1† 3.65 3.61 72.15 12.01 1.21 2649±112 2806±162 bdlH2O bdl bdl 0.03 bdl bdl bdl na
IHPV17 500 850 PerAlk2† 4.84 3.22 70.33 11.81 1.03 2405±152 2816±168 bdlH2O 0.06 0.01 0.04 bdl bdl bdl na
IHPV18 500 850 PerAlu2† 3.28 4.43 68.56 15.05 1.48 1544±105 1961±184 1204±5271H + 1S (pH 1) 1.64 1.48 0.004 0.003 395±12 128±1 32704±3270
IHPV19 500 850 PerAlu1† 3.12 4.37 69.70 13.42 1.36 1798±157 2013±128 710±2481H + 1S (pH 1) 3.45 3.22 0.003 0.004 1059±6 415±5 53393±5339
IHPV20 500 850 MetAlu1† 3.12 4.33 72.78 12.08 1.23 1369±103 1567±193 610±3371H + 1S (pH 1) 3.06 2.82 0.002 0.004 670±10 352±2 48129±4813
IHPV23 500 950 PerAlu2† 3.68 3.44 68.93 14.99 1.53 2395±145 2181±138 bdlH2O 0.10 0.07 0.03 0.02 88±25 bdl na
IHPV24 500 950 PerAlu1† 3.42 3.53 69.62 13.23 1.40 2784±155 2485±159 bdlH2O 0.16 0.09 0.30 0.02 52±18 bdl na
IHPV25 500 950 MetAlu1† 3.72 3.62 70.91 11.84 1.18 2594±152 2794±187 bdlH2O 0.18 0.07 0.06 0.02 bdl bdl na
IHPV27 500 950 PerAlk2† 4.33 3.30 71.22 11.62 1.09 2352±105 2878±145 bdlH2O 0.32 0.07 0.55 0.02 62±38 bdl na
IHPV26 500 950 PerAlk1? 6.97 3.09 70.34 11.16 0.75 2187±167 2629±152 bdlH2O 0.58 0.14 1.94 0.02 79±23 bdl na
IHPV28 500 950 PerAlu2† 2.92 4.46 68.40 15.56 1.61 1498±114 1879±135 1057±3991H + 1S (pH 1) 3.57 3.49 0.05 0.02 1023±4 335±1 57172±5717
IHPV29 500 950 PerAlu1† 2.89 4.43 70.94 13.40 1.40 1848±163 2203±135 931±2621H + 1S (pH 1) 3.95 4.08 0.04 0.02 1492±121 410±8 62716±6272
IHPV30 500 950 MetAlu1† 2.89 4.62 72.67 12.09 1.24 1495±134 2312±183 699±2511H + 1S (pH 1) 2.50 2.75 0.02 0.02 842±104 449±15 66494±6649
IHPV32 500 950 PerAlk2† 3.57 4.58 71.68 11.64 1.07 1422±159 2778±200 498±1391H + 1S (pH 1) 3.12 2.71 0.68 0.02 770±99 189±11 68731±6873
IHPV31 500 950 PerAlk1† 4.90 4.66 71.17 11.46 0.87 1608±159 2626±125 563±2591H + 1S (pH 1) 2.98 2.12 1.64 0.02 576±79 14±1 67177±6718
‡ − experiments done at Institut für Mineralogie, Leibniz Universität Hannovernd− not analyzedbdl− below detection limit1H− 1m NaCl, 1S− 1m KCl? − starting glass also doped with La and Yb† − starting glass also doped with La and YASI− Al2O3 /(Na2O+K2O) in moles
57

ii
“thesis_report_old” — 2010/4/26 — 13:54 — page 58 — #69 ii
ii
ii
Chapter 3
Table 3.6: Experimentally determined fluid−melt partition coefficients of Na, K, Rb, Sr, Cl. and DK /DNa .
experimental conditions Fluid−melt partition coefficientsrun P T ASI DNa DK DK /DNa DRb DSr DCl
[MPa] [◦C]RQH1-1? 200 750 1.21 0.05 0.01 0.02±0.002 nc nc ncRQH1-4? 200 750 1.01 nc 0.009 nc 0.007±0.004 nc ncRQH1-3? 200 750 0.80 nc 0.003 nc 0.02±0.004 nc ncRQH2-0? 200 750 1.44 nc 0.008 nc 0.01±0.004 nc ncRQH2-2? 200 750 1.10 0.01 0.01 1.34±0.3 0.08±0.01 nc ncRQH2-4? 200 750 0.92 nc 0.006 nc 0.07±0.008 nc ncRQH2-3? 200 750 0.94 nc 0.006 nc nc nc nc
RQA1 200 750 1.16 0.55 0.37 0.67±0.10 0.30±0.05 0.19±0.03 33.62±4.40RQA2 200 750 1.06 0.67 0.36 0.54±0.08 0.27±0.04 0.18±0.03 59.00±9.11RQA3 200 750 0.78 0.56 0.51 0.91±0.10 0.47±0.05 nc 30.55±5.51RQB0 200 750 1.29 0.68 0.50 0.73±0.15 0.44±0.04 0.19±0.02 28.94±4.32RQB1 200 750 1.15 0.50 0.33 0.67±0.11 0.26±0.04 0.20±0.04 33.86±4.82RQB2 200 750 1.06 0.54 0.34 0.64±0.09 0.28±0.04 0.22±0.03 42.97±6.22RQB4 200 750 0.99 0.63 0.44 0.70±0.15 0.36±0.02 nc 33.68±5.76RQB3 200 750 0.82 0.40 0.33 0.81±0.16 0.23±0.02 nc 21.28±3.77RQC1 200 750 1.11 0.41 0.30 0.71±0.11 0.22±0.05 0.24±0.06 33.55±7.61RQC2 200 750 1.05 1.09 0.53 0.49±0.07 0.46±0.07 0.34±0.06 64.79±9.02RQC4 200 750 0.99 0.81 0.51 0.63±0.03 0.46 nc 2.01RQC3 200 750 0.76 0.53 0.48 0.91±0.15 0.42±0.03 nc 28.39±4.76RQD0 200 750 1.32 0.70 0.48 0.69±0.05 0.40±0.03 0.17±0.02 38.96±6.10RQD1 200 750 1.17 0.47 0.30 0.63±0.09 0.24±0.04 0.16±0.03 33.99±5.71RQD2 200 750 1.07 0.66 0.41 0.62±0.09 0.35±0.06 0.23±0.03 61.81±10.24RQD4 200 750 0.96 0.79 0.56 0.70±0.11 0.41±0.04 0.003±0.0005 41.14±13.04RQD3 200 750 0.81 0.84 0.70 0.82±0.13 0.55±0.05 nc 54.24±9.15
EHPVH1-1? 200 750 1.70 0.09 0.02 0.23±0.003 0.003±0.0005 0.002±0.0003 ncEHPVH1-2? 200 750 1.40 0.04 0.02 0.39±0.01 nc 0.002±0.0004 ncEHPVH1-4? 200 750 1.21 0.04 0.01 0.30±0.01 0.004±0.0006 0.001±0.0002 ncEHPVH1-3? 200 750 0.80 0.03 0.02 0.67±0.07 nc nc ncEHPVH2-1? 200 750 1.29 0.01 0.01 0.86±0.09 0.004±0.0004 nc ncEHPVH2-2? 200 750 1.14 0.02 0.02 0.80±0.13 nc 0.001±0.0003 ncEHPVH2-4? 200 750 0.96 0.03 0.01 0.56±0.06 0.002±0.0005 nc ncEHPVH2-3? 200 750 0.81 0.03 0.01 0.41±0.06 0.003±0.0006 nc nc
EHPVA1 200 750 1.20 0.85 0.52 0.60±0.03 0.43±0.04 0.28±0.04 ncEHPVA2 200 750 1.06 0.62 0.37 0.60±0.03 0.29±0.03 0.18±0.03 ncEHPVA4 200 750 1.04 0.75 0.43 0.58±0.03 0.33±0.03 0.03±0.003 ncEHPVA3 200 750 0.79 0.47 0.36 0.77±0.04 0.30±0.04 0.01±0.001 ncEHPVB1 200 750 1.18 0.79 0.47 0.60±0.06 0.36±0.03 0.22±0.03 ncEHPVB2 200 750 1.07 0.63 0.35 0.55±0.05 0.29±0.03 0.20±0.02 ncEHPVB4 200 750 0.99 0.66 0.42 0.64±0.04 0.31±0.03 0.04±0.002 ncEHPVB3 200 750 0.77 0.54 0.42 0.78±0.06 0.32±0.03 0.01±0.0004 ncEHPVC1 200 750 1.25 0.71 0.39 0.55±0.03 0.30±0.03 0.19±0.03 ncEHPVC2 200 750 1.13 0.80 0.48 0.60±0.04 0.37±0.04 0.13±0.01 ncEHPVC4 200 750 1.02 0.61 0.36 0.58±0.03 0.29±0.04 0.03±0.002 ncEHPVC3 200 750 0.76 0.54 0.46 0.85±0.03 0.37±0.07 0.005±0.0007 ncEHPVD1 200 750 1.21 0.66 0.39 0.60±0.03 0.32±0.04 0.19±0.02 ncEHPVD4 200 750 1.01 0.87 0.55 0.63±0.03 0.40±0.05 0.04±0.003 ncEHPVD3 200 750 0.83 0.62 0.46 0.75±0.04 0.36±0.04 0.01±0.0007 nc
IHPV-G1‡,? 500 750 1.63 0.08 0.06 0.71±0.01 0.01±0.001 0.001±0.0001 ncIHPV-G2‡,? 500 750 1.35 0.04 0.02 0.51±0.01 0.003±0.0001 nc nc
IHPV-E1‡ 500 750 1.39 0.82 0.48 0.59±0.05 0.38±0.05 0.11±0.01 ncIHPV-E2‡ 500 750 1.23 0.69 0.37 0.53±0.04 0.27±0.03 0.14±0.01 ncIHPV-F1‡ 500 750 1.42 0.54 0.31 0.58±0.04 0.24±0.02 0.06±0.005 ncIHPV-F2‡ 500 750 1.27 0.91 0.43 0.47±0.01 0.35±0.01 0.07±0.0008 ncIHPV-H1? 200 850 1.37 0.05 0.03 0.60±0.08 0.03±0.02 nc ncIHPV-H2? 200 850 1.20 0.03 0.02 0.65±0.07 0.07±0.02 nc ncIHPV-H4? 200 850 1.04 0.10 0.04 0.45±0.02 nc nc ncIHPV-H3? 200 850 0.81 0.03 0.02 0.79±0.04 nc nc ncIHPV-A1 200 850 1.18 0.76 0.50 0.67±0.03 0.47±0.04 0.43±0.03 27.58±2.76IHPV-A2 200 850 1.09 0.66 0.46 0.71±0.04 0.37±0.03 0.22±0.02 34.59±5.52IHPV-A4 200 850 0.97 0.70 0.53 0.76±0.03 0.47±0.05 0.02±0.001 34.06±5.17IHPV-A3 200 850 0.77 0.17 0.16 0.98±0.04 0.11±0.02 nc 21.17±3.03IHPV5? 200 950 1.34 nc nc nc nc nc ncIHPV6? 200 950 1.18 nc nc nc nc nc ncIHPV8? 200 950 0.92 nc nc nc nc nc ncIHPV7? 200 950 0.81 0.01 0.01 0.92±0.06 0.003±0.0002 nc ncIHPV9 200 950 1.12 0.75 0.58 0.77±0.03 0.55±0.05 0.30±0.03 23.92±3.19
IHPV10 200 950 1.07 0.89 0.69 0.78±0.04 0.58±0.06 0.32±0.02 26.94±6.57IHPV12 200 950 0.95 0.72 0.57 0.80±0.04 0.45±0.03 0.02±0.001 21.01±3.28IHPV11 200 950 0.77 0.62 0.57 0.93±0.06 0.52±0.05 0.01±0.0003 12.11±6.06
IHPV13? 500 850 1.56 nc nc nc nc nc ncIHPV14? 500 850 1.46 nc nc nc nc nc ncIHPV15? 500 850 1.21 nc nc nc nc nc ncIHPV17? 500 850 1.03 0.01 0.002 0.15±0.03 nc nc ncIHPV18 500 850 1.48 0.50 0.33 0.67±0.05 0.26±0.02 0.07±0.01 27.17±11.90IHPV19 500 850 1.36 1.10 0.74 0.67±0.04 0.59±0.05 0.21±0.01 75.24±26.34IHPV20 500 850 1.23 0.98 0.65 0.66±0.04 0.49±0.04 0.22±0.03 78.95±43.58
IHPV23? 500 950 1.53 0.03 0.02 0.72±0.08 0.04±0.01 nc ncIHPV24? 500 950 1.40 0.05 0.03 0.57±0.05 0.02±0.01 nc ncIHPV25? 500 950 1.18 0.05 0.02 0.43±0.02 nc nc ncIHPV27? 500 950 1.09 0.07 0.02 0.30±0.04 0.03±0.02 nc ncIHPV26? 500 950 0.75 0.08 0.05 0.56±0.03 0.04±0.01 nc ncIHPV28 500 950 1.61 1.22 0.78 0.64±0.05 0.68±0.05 0.18±0.01 54.10±20.43IHPV29 500 950 1.40 1.36 0.92 0.67±0.06 0.81±0.10 0.19±0.01 67.40±18.96IHPV30 500 950 1.24 0.86 0.59 0.69±0.05 0.56±0.09 0.19±0.02 95.13±77.42IHPV32 500 950 1.07 0.87 0.59 0.68±0.10 0.54±0.09 0.07±0.01 138.08±38.59IHPV31 500 950 0.87 0.61 0.45 0.75±0.03 0.36±0.06 0.01±0.0003 119.28±54.96IHPVT1 850 750 1.09 2.30 1.54 0.67±0.09 1.04±0.19 0.62±0.11
nc− not calculated because element concentration in the fluid was below detection limit or was not analyzedASI - Al2O3 /(Na2O+K2O) in moles? - experiments using H2O as starting fluid‡ - experiments done at Institut für Mineralogie, Leibniz Universität Hannover
58

ii
“thesis_report_old” — 2010/4/26 — 13:54 — page 59 — #70 ii
ii
ii
Table 3.7: Experimental conditions and results of the HDAC experiments for chloridic fluids at 750◦C. Concentrations of Rb andSr in the fluid were analyzed in-situ using SR-µXRF, the glasses were analyzed after quench using EMP.
sample 1 2 3 4 5 6Cell HDAC3 HDAC3 HDAC3 HDAC3 HDAC3 HDACGPexp at Texp=750◦C [MPa] 224 262 500 840 420 1400m (NaCl+KCl), NaCl/KCl=1 3.56 2.84 1.56 1.16 3.45 3.41m HCl 0.04 0.03 0.02 0.01 0.04 0.04wt.% (NaCl+KCl) 16.8 14.3 8.4 6.5 16.8 16.6wt.% glass (initial) 24 27 22 16 12 17ρfluid [g/cm3 ] 0.6855 0.6940 0.7843 0.9073 0.8085 1.086Tm [◦C] -10.6 -8.6 -5.4 -4.0 -12.9 -12.7TH [◦C] 439 409 315 208 357 86
CfRb
[ppm] 712±6 308±4 482±6 334±5 383±3 586±4CmRb [ppm] 1510±247 1028±224 1223±199 1078±191 629±176 1251±233
CfSr
[ppm] 495±6 205±3 162±4 133±3 262±3 505±4CmSr [ppm] 2085±299 1663±333 2562±230 2019±385 1875±222 883±294
CfRb
/CfSr
1.44±0.02 1.51±0.03 2.97±0.09 2.51±0.07 1.46±0.02 1.16±0.02
Df/mRb 0.47±0.08 0.30±0.07 0.39±0.06 0.31±0.05 0.61±0.17 0.47±0.09
Df/mSr 0.24±0.03 0.12±0.02 0.06±0.01 0.07±0.01 0.14±0.02 0.57±0.19
wt.% SiO2 73.37 71.51 69.27 68.25 67.96 70.96wt.% Al2O3 12.77 12.37 14.31 14.49 14.24 13.64wt.% Na2O 3.49 2.82 2.52 2.22 3.31 2.47wt.% K2O 5.72 6.14 6.67 8.20 7.17 7.26ASI 1.07 1.10 1.26 1.16 1.08 1.14
m− molalityTm − freezing point depression determined by cryometryTH − Homogenization temperature measured after collection of XRF spectra at Texp=750◦Cf − fluid, m − meltASI− Al2O3 /(Na2O+K2O) in moles
Table 3.8: Experimental conditions and results of the HDAC experiments for non-chloridic fluids at 750◦C. Concentrations of Rband Sr in the fluid were analyzed in-situ using SR-µXRF, the glasses were analyzed after quench using EMP.
sample 1 2 3 4 5? 6 7?
Cell HDACG HDACG HDACG HDAC3 HDACG HDAC3 HDACGPexp at Texp=750◦C [MPa] 360 540 662 237 479 389 887wt.% glass (initial) 24 23 31 18 21 16ρfluid [g/cm3 ] 0.6336 0.7494 0.7989 0.53 0.7121 0.65 0.87TH [◦C] 333 281 252 363 301 325 194
CfRb
[ppm] 31±5 77±6 101±1 15±1 14±1 23±1 68±1CmRb [ppm] 3007±275 na 2818±285 2816±223 1479±154 2786±336 2092±164
CfSr
[ppm] 22±3 19±3 19±1 10±1 8±1 8±1 25±1CmSr [ppm] 3532±555 na 2750±213 2797±182 1897±179 2302±362 2906±189
CfRb
/CfSr
1.39±0.15 4.16±0.42 5.32±0.24 1.53±0.22 1.67±0.17 2.84±0.34 2.77±0.08
Df/mRb 0.01±0.002 nc 0.036±0.004 0.006±0.0005 0.01±0.001 0.008±0.001 0.033±0.003
Df/mSr 0.006±0.001 nc 0.007±0.0005 0.004±0.0006 0.004±0.0006 0.004±0.0007 0.009±0.0006
wt.% SiO2 73.89 na 70.76 72.60 79.32 71.17 72.41wt.% Al2O3 12.81 na 12.31 12.49 9.67 12.45 13.22wt.% Na2O 4.25 na 2.38 3.73 0.69 3.12 1.81wt.% K2O 3.39 na 3.62 3.42 1.97 3.67 3.62ASI 1.20 na 1.57 1.27 2.96 1.37 1.92? − only one glass analysisnd− not determined because sample was lost during preparation for EMP analysisnc− not calculatedTH − Homogenization temperature measured after collection of XRF spectra at Texp=750◦Cf − fluid, m − meltASI− Al2O3 /(Na2O+K2O) in moles
59

ii
“thesis_report_old” — 2010/4/26 — 13:54 — page 60 — #71 ii
ii
ii
Chapter 4
Partitioning of Ba, La, Yb and Ybetween haplogranitic melts andaqueous solutions: anexperimental study
revised manuscript
60

ii
“thesis_report_old” — 2010/4/26 — 13:54 — page 61 — #72 ii
ii
ii
Partitioning of Ba, La, Yb, and Y between haplogranitic melts and aqueous solutions
Partitioning of Ba, La, Yb and Y between haplogranitic meltsand aqueous solutions: an experimental study
Manuela Borcherta,?, Max Wilkeb, Christian Schmidtb, Jean Cauzidc, Rémi Tucouloud
a Universität Potsdam, Karl-Liebknecht-Str.24, 14476 Potsdam-Golm, Germanyb Deutsches GeoForschungsZentrum (GFZ), Section 4.1, Telegrafenberg, 14473 Potsdam, Germanyc Département Sciences de la Terre, et de l’Univers, G2R, Université Henri Poincaré, 54506 Vandœuvre-lès-Nancy,
Franced European Synchrotron Radiation Facility, Grenoble, France
Abstract
Barium, lanthanum, ytterbium, and yttrium partitioning experiments between fluid-saturated haplogranitic melts and
aqueous solutions were conducted at 750 to 950◦C and 0.2 to 1 GPa to investigate the effects of melt and fluid
composition, pressure, and temperature. Partition coefficients were determined using different experimental methods.
On one hand quenched experiments were performed, and on the other hand, trace element contents in the aqueous
fluid were determined directly using a hydrothermal diamond-anvil cell and synchrotron radiation X-ray fluorescence
microanalysis of K-lines. The latter required a high excitation energy of 50 keV due to the high energies necessary to
excite the K-lines of the studied elements. The data from these two techniques showed good agreement for chloridic
solutions, whereas quenching had a significant effect on results of the experiments with only water in the case of Ba. In
Cl-free experiments, lanthanum and yttrium, trace element contents were even below detection limit in the quenched
fluids, whereas small concentrations were detected in comparable in-situ experiments. This distinct difference is likely
due to back reactions between fluid and melt upon cooling.
The partitioning data of all elements show no dependence on the temperature and only small dependence
on pressure. In contrast, the partitioning are strongly influenced by the composition of the starting fluid and melt. For
chloridic fluids, there was a sharp increase in the Ba, La, Y and Yb partition coefficients with the alumina saturation
index (ASI). The Ba partition coefficient increased from 0.002 at an ASI of 0.8 to 0.55 at an ASI of 1.07. At higher ASI,
it decreased slightly to 0.2 at an ASI of ∼1.3. Likewise, it was one to two orders of magnitude higher in chloridic fluids
compared to those found in H2O experiments. Fluid-melt partition coefficients of La and Y increased from 0.002 at an
ASI of∼0.8 to∼0.1 at an ASI of 1.2. In the same ASI range, the Yb partition coefficient increased to a maximum value
of 0.02. Even at high salinities all elements fractionate into the melt. The compositional dependence of the partitioning
data imply that both melt composition and fluid composition have a strong influence on trace element behavior and
that complexation of Ba, REE and Y tin the fluid is not only controlled by the presence of Cl− in the fluid. Instead,
interaction of these elements with major melt components dissolved in the fluid is very likely.
Keywords: fluid–melt partition coefficients, Barium, REE, quenched experiments, HDAC, SR-µXRF
? Corresponding author. E-mail address:[email protected] (M.Borchert), present address: Hamburger Syn-
chrotronstrahlungslabor at Deutsches Elektronensynchrotron, Notkestr. 85, 20607 Hamburg, Germany
61

ii
“thesis_report_old” — 2010/4/26 — 13:54 — page 62 — #73 ii
ii
ii
Chapter 4
4.1 Introduction
Granitoid magmas contain substantial amounts of dissolved H2O. The solubility of water ingranitoid melts strongly decreases with decreasing pressure (Burnham and Jahns, 1962, Tut-tle and Bowen, 1958) and is dependent on melt composition (Behrens and Jantos, 2001). Atconstant pressure, water solubility increases with decreasing temperature (Yamashita, 1999).Influences of melt composition and temperature on water solubility in silicate melts are usuallyless pronounced than the effect of pressure. Thus, as granitoid melt rise to shallower depthand/or crystallize, they will become saturated in water, and consequently exsolution of aque-ous fluids will take place. The aqueous fluid is likely to migrate due to low density and viscosity,and will interact with melt, crystals, and subsequently also with the host rock. During these pro-cesses, elements partition between melt, volatile fluids, and crystals, which, for equilibrium andtrace elements, is described by partition coefficients (e.g., Df/m
X cfluidX /cmelt
X ). Trace elementsof geochemically different behavior are often used as petrogenetic indicators to study theseprocesses (e.g., Philpotts, 1990). Interpretation of trace element patterns, however, requiresknowledge of all relevant partition coefficients between melts, crystals, and aqueous fluids.Here, we studied trace elements that are important for petrogenetic investigations of granitoidrocks. Barium was chosen as a representative for the large ion lithophile elements (LILE),lanthanum and ytterbium to represent light and heavy rare earth elements (LREE, HREE), andyttrium as analogue for middle to heavy rare earth elements. Granitoid rocks contain up to500 ppm Ba (Johannes and Holtz, 1996). Barium substitutes for K in micas and potassiumfeldspar, and Ca in plagioclase. Its behavior is geochemically similar to that of Sr, but Sr doesnot partition into micas. The Ba/Sr ratio is larger in upper crust granitoids than in lower crustgranitoids, and the Ba/Sr ratio in different types of granites decreases with decreasing K2Oand increasing CaO content (Ba/Sr ratio: A-type>S-type>I-type>M-type>plagiogranite, Chap-pell and White (1974) and Winter (2001)).
The partitioning of Ba between the typical granite–forming minerals plagioclase, feldspar,and biotite and granitoid melts has been the subject of many studies. Crystal–granitic melt par-tition coefficients of Ba from natural samples range between 1 to 44 for K-feldspar (e.g., Ma-hood and Hildreth, 1983, Stix and Gorton, 1990, Bea et al., 1994), 1 to 20 for plagioclase (e.g.,Ewart and Griffin, 1994, Bea et al., 1994, Streck and Grunder, 1997), and 0.6 to 7 for biotite(e.g., Mahood and Hildreth, 1983, Bea et al., 1994). Other particularly useful trace elements inthe study of igneous petrogenesis are the rare earth elements (REE) because of their similargeochemical behavior. The combination of high charge and relatively large ionic radius makesthe REE highly incompatible in the most early crystallizing minerals (e.g., Best, 2003, Philpottsand Ague, 2009). With increasing atomic weight, the REE show a decrease of the ionic radius,which is known as the ’lanthanide contraction’. Their partition coefficients vary slightly, and thedegree of incompatibility increases with ionic radius. In granites, the rare earth elements arenot incorporated in typical rock forming minerals. Instead, they are incorporated in accessoryminerals such as allanite, xenotime, monazite, and titanite (Bea, 1996). The concentrations ofREE in different types of granites are low, generally less than 100 ppm, and decrease slightlywith decreasing K2O content (Winter, 2001). Partition coefficients of lanthanum, ytterbium, andyttrium between granitoid melts and the typical granite–forming minerals plagioclase, feldspar,
62

ii
“thesis_report_old” — 2010/4/26 — 13:54 — page 63 — #74 ii
ii
ii
Partitioning of Ba, La, Yb, and Y between haplogranitic melts and aqueous solutions
and biotite have been determined from phenocryst - whole rock data (e.g., Nash and Crecraft,1985, Stix and Gorton, 1990, Streck and Grunder, 1997, Ren et al., 2003, Bédard, 2006), fromhigh-silica rhyolitic glass–feldspar phenocryst pairs (Leeman and Phelps, 1981, Mahood andHildreth, 1983, Bea et al., 1994, Ewart and Griffin, 1994), or from experiments (Blundy et al.,1998, Bédard, 2006). For lanthanum, determined crystal–melt partition coefficients range be-tween 0.76 and 3.55 for biotite, 0.026 and 0.15 for K-feldspar, and are 0.07 to 0.17 in the caseof plagioclase. For yttrium, reported crystal–melt partition coefficients vary from 0.1 to 2.4 forbiotite, 0.015 to 0.5 for potassium feldspar, and 0.005 to 0.78 for plagioclase. The availablecrystal–melt partitioning data for ytterbium are 0.12 to 3 for biotite, 0.002 to 0.64 for potassiumfeldspar, and 0.012 to 0.82 for plagioclase. The large variability in these mineral–melt partitioncoefficients is thought to reflect differences in melt and crystal compositions as well as in tem-perature and pressure (e.g., Albarede, 1975, Green and Pearson, 1983, Blundy and Wood,1991, Ren et al., 2003).
Much less is known on fluid–melt partitioning of Ba, La, Yb, and Y. There are sporadicexperimental fluid–melt partitioning data for Ba, La, Y, and Yb (e.g., Webster et al., 1989, Baiand Koster van Groos, 1999, Reed et al., 2000, Bureau et al., 2003). In addition, two studiespresent data based on analyses of natural co-genetic fluid and melt inclusions (Audétat andPettke, 2003, Zajacz et al., 2008). Webster et al. (1989) studied partitioning of trace elementsbetween topaz–rhyolite melts and H2O±CO2 fluids as a function of Cl concentration at 200MPa and 769 to 950◦C. They found a transition from melt-compatible to fluid-compatible be-havior with increasing chlorinity from 0.16 to 6.13 m Cl for many trace elements including Baand Y. Bai and Koster van Groos (1999) determined fluid–melt partitioning of trace elementsbetween metaluminous melts and various aqueous fluids at 750–800◦C and 100–400 MPa.For H2O, the reported partition coefficient of La was 0.02 at 750◦C and 200 MPa. The Lapartition coefficient did not change significantly with addition of NaCl and KCl to the fluid, butincreased strongly with addition of HCl. Reed et al. (2000) studied partitioning of the rareearth elements between a peraluminous monzogranitic melt and a chloride-bearing aqueousphase as a function of chloride and major element concentrations at 800◦C and 200 MPa.Their results show linearly increasing partition coefficients of the REE with Cl concentrationin the fluid. Bureau et al. (2003) attempted to determine partition coefficients of barium andlead between silicate melts and aqueous fluids at high pressures and temperatures using hy-drothermal diamond-anvil cells and µPIXE (proton induced X-ray emission) mapping on thequenched glass globules. Although partition coefficients could not be obtained, the Ba contentof the melts was close to the initial content of the starting glass, which suggests a preferencefor the melt at high PT conditions.
Audétat and Pettke (2003) used an example from the field and studied the magmatic-hydrothermal evolution of two barren granites. Based on analyses of coeval fluid and meltinclusions trapped at 700–720◦C and 110–120 MPa, the fluid–melt partition coefficient of Ywas ≤ 0.006 at a fluid salinity of 4.9 wt.% NaClequiv.. Zajacz et al. (2008) likewise analyzednaturally occurring co-existing silicate melt and fluid inclusions trapped in quartz crystals at650 to 700◦C and 80 to 170 MPa. The uncertainty in the determined fluid–melt partition coef-ficient for Ba was large, because the concentration was very close to the limit of detection inboth melt and fluid inclusions. The reported fluid–melt partition coefficient of Ba was 0.49 at
63
ii
“thesis_report_old” — 2010/4/26 — 13:54 — page 64 — #75 ii
ii
ii
Chapter 4
a fluid salinity of 6.5 wt.%, and increased to 19 at a salinity of ∼34 wt.%. For lanthanum, thepartition coefficient decreased slightly from 0.31 to 0.1 with increasing fluid salinity from 6.5 to∼34 wt.%.
In summary, the present knowledge on fluid–melt partitioning of these elements is onlyfragmentary, and the data are inconsistent. For example, experimental studies suggest a pref-erence of the REE and particular yttrium for the fluid at high salinities, but available results fromnatural cogenetic fluid and melt inclusions in granites show Df/m distinctly smaller than one.Therefore, the question is still unanswered if exsolution of an aqueous fluid from a granitoidmelt can significantly change the Ba, La, Yb, and Yb signature of the residual melt.
Here, we experimentally investigated fluid–melt partition coefficients of Ba, La, Yb, andY as a function of silicate melt composition, salinity of the aqueous fluid, pressure and tem-perature. We used a suite of haplogranitic glasses with varying alumina saturation index (ASI,Al2O3/(Na2O+K2O) in moles) from peralkaline to peraluminous, and H2O±(NaCl+KCl±HCl)fluids as starting materials. The experiments were performed at temperatures between 750and 950◦C and pressures mostly between 200 and 500 MPa, with some experiments up to900 MPa.
The majority of the presented data is based on the analysis of quenched phases from ex-periments in high-pressure apparatuses. For Ba, La, and Y, the concentrations in the aqueousfluid were also determined directly at elevated PT conditions using a hydrothermal diamond-anvil cell (HDAC) and synchrotron radiation X-ray fluorescence microanalysis (SR-µXRF). Thisexperimental approach was described in detail by Borchert et al. (2009). In contrast to Rb andSr (Borchert et al., 2009, 2010), the analysis of K-lines of the elements studied here requiresa much higher excitation energy. In addition, a small spot size is of advantage to avoid mixedanalyses of fluid and melt. Both, a high excitation energy and a small beam size, were achievedin this study for the first time via application of a new Kirkpatrick-Baez mirror designed for en-ergies up to 65 keV. Therefore, the in-situ analyses of Ba, La, and Y in the aqueous fluids werealso used to evaluate the sensitivity of this setup for the analyzed elements, and to obtaininformation on the potential and further improvements of this experimental approach.
4.2 Experimental and analytical methods
4.2.1 Starting materials and sample preparation
The starting materials were suites of synthetic haplogranitic glasses with varying ASI from 0.8to 1.5 and H2O±(NaCl+KCl±HCl) fluids. For quenched experiments, three different glass se-ries were produced. The glasses were doped with the following trace elements: (I) Ba, (II) Laand Y, and (III) La and Yb. For experiments using the HDAC, metaluminous and peraluminousglasses doped with Ba, La, Y, Sm, and Y were synthesized. Each glass composition wasprepared in two steps. Firstly, an initial glass was produced using powders of SiO2, Al2O3,Na2CO3 and K2CO3. The powders were mixed and stepwise heated to 1600◦C for decarbon-atization (12 h). After quenching, the glass was crushed and melted again for 48 h at 1600◦C.Secondly, trace elements were added to the crushed initial glass. The doped glass powderwas melted at 1600◦C for 24 h, then quenched, crushed and melted again for 24 h at 1600◦C
64

ii
“thesis_report_old” — 2010/4/26 — 13:54 — page 65 — #76 ii
ii
ii
Partitioning of Ba, La, Yb, and Y between haplogranitic melts and aqueous solutions
to achieve chemical homogeneity. The compositions of the starting glasses are listed in Tab.4.1. The H2O±(NaCl+KCl±HCl) fluids were produced from distilled de-ionized water, analyti-cal grade powders of NaCl and KCl, and 30 vol.% hydrochloric acid. Their compositions wereH2O, H2O + 1 m NaCl + 1 m KCl, and H2O + 1 m NaCl + 1 m KCl + 0.02 m HCl (pH 1). Thestarting fluid compositions of the individual experiments are given in Tabs. 4.2, 4.3, and 4.6.
4.2.2 Quench experiments
Quench experiments were prepared and performed as described previously by Borchert et al.(2010). Gold capsules (3.0 mm OD, 2.6 mm ID, 20 mm length) and in some cases platinumcapsules (3.5 mm OD, 3.1 mm ID, 20 mm length) were loaded with approximately equal weightamounts of glass and fluid. The minimum weight of the fluid was 12 mg because smalleramounts complicated fluid sampling and analysis after the experiment. After loading, the cap-sules were crimped, welded shut under an electric arc while partly immersed in a bath of icewater to avoid fluid loss, and weighed again. To check for leakage, the capsules were stored ina furnace at 120◦C for at least 30 minutes. Absence of leaks was assumed if the weight losswas less than 1 mg. Experiments at 750◦C and 200 MPa were conducted in externally heatedcold-seal pressure vessels using H2O as pressure medium and for durations ranging from 120to 288 hours. Two different setups were used. Slow quenched experiments were done inhorizontal autoclaves. These runs were cooled isobarically with quench rates of ∼200◦C/minusing a compressed air jet. Rapid quenched experiments were performed in vertical auto-claves and were cooled from 750◦C within a few seconds. Temperature was measured withexternal K-type thermocouples and is considered to be accurate to ±2◦C. Thermal gradientsalong the capsules were less than 1◦C for horizontal autoclaves and 5◦C in experiments usingthe vertical setup. Pressure was measured with strain gauges calibrated with a deadweightpressure gauge and was accurate to ±5 MPa.
Experiments at higher PT conditions, up to 950◦C and 500 MPa, were conducted usingan internally heated argon pressure vessel with durations from 24 to 144 hours. The tem-perature was measured with S-type thermocouples and calibrated based on measurementsof the melting points of NaCl at 843◦C/200 MPa and 904◦C/500 MPa (Akella et al., 1969).The accuracy is about ±5◦C at 200 MPa and ±20◦C at 500 MPa. Thermal gradients alongthe capsules were ±10◦C. Pressure measurement was done with a strain gauge and wasaccurate to ±7 MPa for experiments up to 500 MPa and to ± 20 MPa at higher pressures.During the experiment, pressure was controlled automatically within ±5 MPa. The sampleswere quenched isobarically with quench rates of 150−200◦C/min.
4.2.3 In-situ experiments
The in-situ experiments were done at ID22, ESRF, Grenoble, France. In these experiments,the concentrations of Ba, La, and Y in the aqueous fluid in equilibrium with melt were deter-mined in situ using synchrotron radiation XRF microanalysis and modified Bassett-type HDACs(Bassett et al., 1993). In these cells, the culet face of the diamond anvil located on the sideof the incident X-ray beam has a cylindrical recess of ∼80 µm in depth. The recess permits
65
ii
“thesis_report_old” — 2010/4/26 — 13:54 — page 66 — #77 ii
ii
ii
Chapter 4
collection of the fluorescence signal at 90◦ to the incident beam and in the polarization plane ofthe beam (Bassett et al., 2000, Schmidt and Rickers, 2003). This configuration minimizes thebackground in the spectra from elastic and Compton scattering and therefore, provides an op-timal signal to noise ratio. Furthermore, the recess ensures a well-defined effective excitationvolume, because fluorescence X-rays generated in other portions of the sample chamber aremostly absorbed by the gasket before reaching the detector. Detailed descriptions of the cellsand the in-situ method are given by Schmidt and Rickers (2003), Schmidt et al. (2007) andBorchert et al. (2009). Here, starting materials consisted of a peraluminous or metaluminousglass chip of known dimensions and H2O or a 0.5 m NaCl + 0.5 m KCl + 0.01 m HCl aqueoussolution. The compositions of the starting glasses are listed in Tab. 4.1.
A glass chip of known dimensions and an aqueous solution in excess were loaded inthe sample chamber. Before the sample chamber was sealed, a vapor bubble was allowedto grow by controlled leaking of the liquid. For experiments with salt solutions, the actualsalt concentration in the fluid after sealing was determined from measurements of the vapor-saturated ice liquidus temperature, the known ratio of the solutes, and literature data for thevapor-saturated ice liquidus in the system H2O+NaCl+KCl (Hall et al., 1988). Then, the cellwas fixed on a goniometer on the top of the xyz table at the beamline. The cell was heatedto measure the homogenization temperature (TH=TL+V→L) of the aqueous fluid, and then tothe experimental temperature of ∼750◦C. During heating, the glass completely melted andequilibrated with the aqueous fluid. If the excitation volume was free of melt, the cell was set tothe position for XRF spectrum acquisition. After alignment of the sample chamber to the beamand the fluorescence detector, the Ba Kα signal was scanned across the recess to verify themeasurement position. Finally, after acquisition of XRF spectra of the fluid, the cell was cooleddown using cooling rates of 100◦C/min. The glass transition occurs at ∼360◦C (calculatedafter Hui et al. (2009)). Therefore, we approximately needed 4 minutes to pass through glasstransition. During cooling, the homogenization temperature was measured again. We usedthis homogenization temperature and the salinity to approximate the pressure at experimentaltemperature. These calculations were based on the slopes of the lines of constant TH given byBodnar and Vityk (1994) for salt salt-bearing compositions, and the EOS by Haar et al. (1984).
In this study, we attempted to analyze Ba, La, Sm and Eu via Kα emission. This re-quired an excitation energy of at least 50 keV due to the high electron binding energies (K1s), e.g., 46.834 keV for Sm and 48.519 keV for Eu. In our experiments, the excitation energywas set to 50 keV (the maximum energy presently commissioned for general users) usinga Si(311) double-crystal fixed-exit monochromator. The synchrotron beam was focused witha new Kirkpatrick-Baez (KB) mirror developed at the ESRF. This new X-ray optical device isbased on a multilayer structure and focuses hard X-rays up to 65 keV into a spot of a few µm.We achieved a spot size of 5x2 µm at 50 keV. The fluorescence spectra were acquired usinga Ge-detector. The advantage of this experimental setup is that K lines can be analyzed, forwhich there are less line overlaps in the XRF spectra, particularly in those from samples in aHDAC, and less absorption of the fluorescence photons along the path towards the detector incomparison to L lines.
66
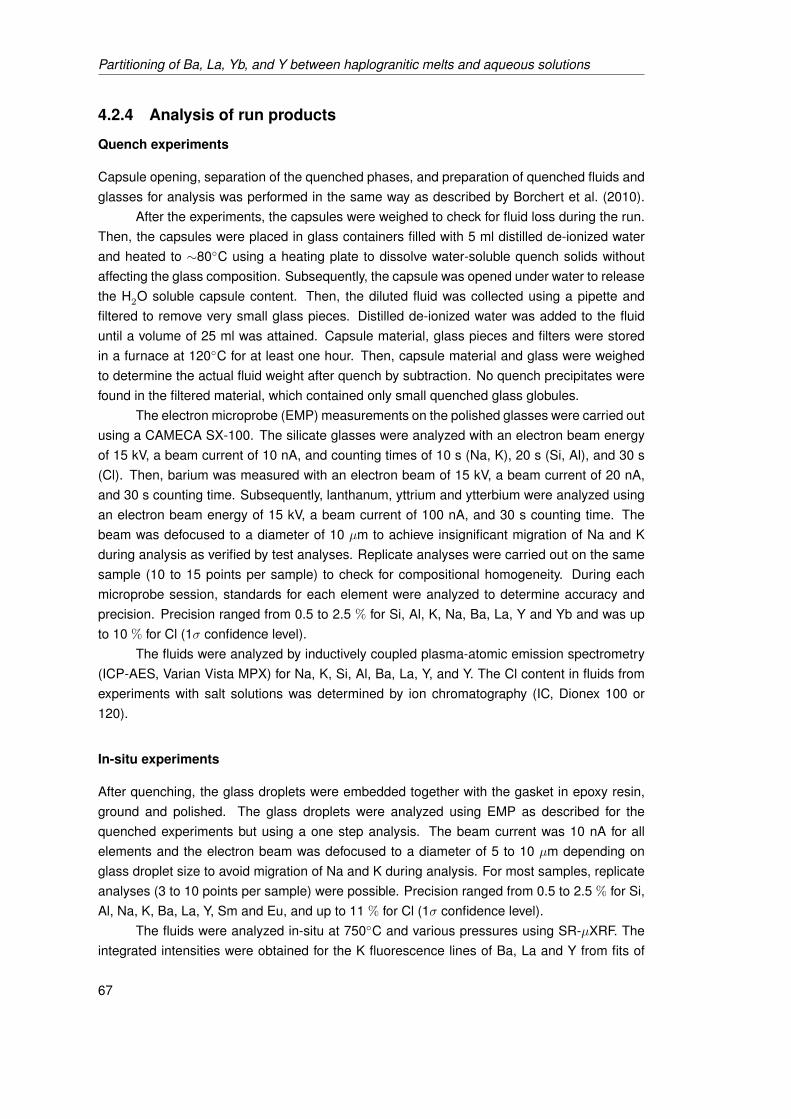
ii
“thesis_report_old” — 2010/4/26 — 13:54 — page 67 — #78 ii
ii
ii
Partitioning of Ba, La, Yb, and Y between haplogranitic melts and aqueous solutions
4.2.4 Analysis of run products
Quench experiments
Capsule opening, separation of the quenched phases, and preparation of quenched fluids andglasses for analysis was performed in the same way as described by Borchert et al. (2010).
After the experiments, the capsules were weighed to check for fluid loss during the run.Then, the capsules were placed in glass containers filled with 5 ml distilled de-ionized waterand heated to ∼80◦C using a heating plate to dissolve water-soluble quench solids withoutaffecting the glass composition. Subsequently, the capsule was opened under water to releasethe H2O soluble capsule content. Then, the diluted fluid was collected using a pipette andfiltered to remove very small glass pieces. Distilled de-ionized water was added to the fluiduntil a volume of 25 ml was attained. Capsule material, glass pieces and filters were storedin a furnace at 120◦C for at least one hour. Then, capsule material and glass were weighedto determine the actual fluid weight after quench by subtraction. No quench precipitates werefound in the filtered material, which contained only small quenched glass globules.
The electron microprobe (EMP) measurements on the polished glasses were carried outusing a CAMECA SX-100. The silicate glasses were analyzed with an electron beam energyof 15 kV, a beam current of 10 nA, and counting times of 10 s (Na, K), 20 s (Si, Al), and 30 s(Cl). Then, barium was measured with an electron beam of 15 kV, a beam current of 20 nA,and 30 s counting time. Subsequently, lanthanum, yttrium and ytterbium were analyzed usingan electron beam energy of 15 kV, a beam current of 100 nA, and 30 s counting time. Thebeam was defocused to a diameter of 10 µm to achieve insignificant migration of Na and Kduring analysis as verified by test analyses. Replicate analyses were carried out on the samesample (10 to 15 points per sample) to check for compositional homogeneity. During eachmicroprobe session, standards for each element were analyzed to determine accuracy andprecision. Precision ranged from 0.5 to 2.5 % for Si, Al, K, Na, Ba, La, Y and Yb and was upto 10 % for Cl (1σ confidence level).
The fluids were analyzed by inductively coupled plasma-atomic emission spectrometry(ICP-AES, Varian Vista MPX) for Na, K, Si, Al, Ba, La, Y, and Y. The Cl content in fluids fromexperiments with salt solutions was determined by ion chromatography (IC, Dionex 100 or120).
In-situ experiments
After quenching, the glass droplets were embedded together with the gasket in epoxy resin,ground and polished. The glass droplets were analyzed using EMP as described for thequenched experiments but using a one step analysis. The beam current was 10 nA for allelements and the electron beam was defocused to a diameter of 5 to 10 µm depending onglass droplet size to avoid migration of Na and K during analysis. For most samples, replicateanalyses (3 to 10 points per sample) were possible. Precision ranged from 0.5 to 2.5 % for Si,Al, Na, K, Ba, La, Y, Sm and Eu, and up to 11 % for Cl (1σ confidence level).
The fluids were analyzed in-situ at 750◦C and various pressures using SR-µXRF. Theintegrated intensities were obtained for the K fluorescence lines of Ba, La and Y from fits of
67

ii
“thesis_report_old” — 2010/4/26 — 13:54 — page 68 — #79 ii
ii
ii
Chapter 4
the spectra using PyMCA, a graphical interface for multi-channel analyzer spectra visualizationand analysis developed at the ESRF (Solé et al., 2007). No reliable quantification of Eu andSm was possible because the K-lines of these elements were strongly affected by the superim-posed inelastic scattering signal. The integrated intensities were normalized to the intensity ofthe incident beam and then divided by the density of the fluid. The normalized integrated inten-sities were calibrated using SR-µXRF spectra measured on standard solutions in the samplechamber of the HDAC. The standard solutions had initial concentrations of 250 ppm Ba and100 ppm each of La, Y, Eu, and Sm or 500 ppm Ba and 250 ppm each of La, Y, Eu, and Sm,both in in a matrix of ∼6.7 wt.% HNO3. Before the sample chamber is sealed, a small portionof the H2O of the solution evaporates, which increases the HNO3 and trace element concen-trations. Therefore, the actual concentrations of Ba, La, and Y in the standard solution afterloading into the sample chamber were calculated from the actual HNO3 concentration, whichwas determined from measurement of the vapor-saturated ice melting temperature (Wolf et al.,1981). Then, SR-µXRF spectra of the standard solutions were collected on the single-phasefluid. The obtained integrated intensities of the K fluorescence lines of Ba, La, and Y of thestandard solutions were likewise normalized to the intensity of the incident beam and dividedby the fluid density.
4.3 Results
4.3.1 Quench experiments
For barium, Tab. 4.2 lists the experimental conditions and the compositions of glasses andfluids after quenching for experiments at 750◦C and 200 MPa. For lanthanum, yttrium andytterbium, Tab. 4.3 summarizes the experimental conditions and results for experiments at750-950◦C and 200 or 500 MPa. Tables 4.4 and 4.5 show fluid–melt partition coefficients forNa, K, Ba, La, Y, Yb and Cl obtained from quenched experiments. Differences in the run dura-tion had no effect on the partitioning data.
The fluid–melt partition coefficient of Ba from quenched experiments at 750◦C and 200MPa is shown in Fig. 4.1 as a function of the ASI after the run, taking into account high-pressure device, quench method, used capsule material, and use of chloridic or non-chloridicsolutions. In experiments with chloridic solutions, the Df/m
Ba shows a sharp increase with ASIfrom 0.002 at an ASI of 0.8 to 0.55 at an ASI of 1.07. At higher ASI, the Ba partition coefficientdecreases slightly to 0.2 at an ASI of ∼1.3. In the case of non-chloridic fluids, the Df/m
Ba is oneto two orders of magnitude lower for ASI ≥ 1. For lower ASI values, partitioning data obtainedwith chloridic and non-chloridic solutions are similarly low. For non-chloridic solutions, an ap-parent dependence on the capsule material is observed in experiments using rapid quenchautoclaves (Fig. 4.1), with a difference in the Ba partition coefficient of one order of magni-tude. The reason for this difference remains unclear as we did not find any correlation withother parameters.
For La, Y, and Yb, fluid–melt partition coefficients from quenched experiments at 750◦Cand 200 MPa using chloridic fluids are shown in Fig. 4.2.1 as function of the ASI of the meltafter the run and for slow and rapid quench rates. The data show a sharp increase of partition
68
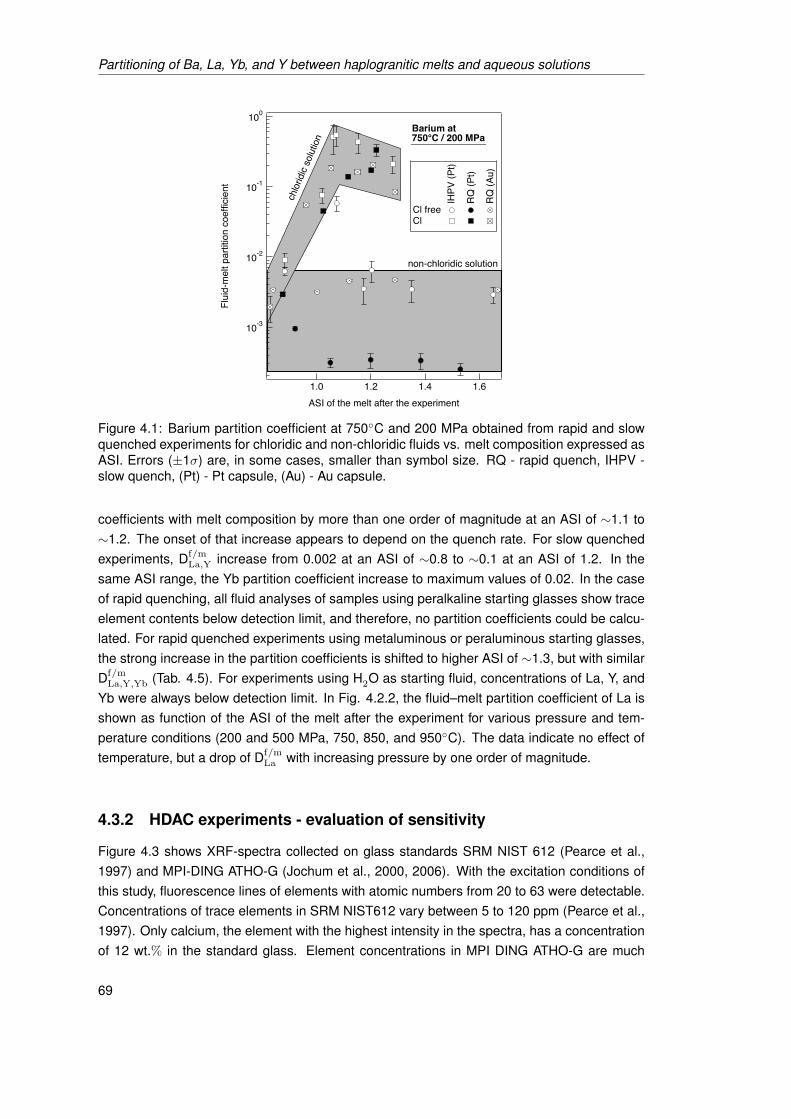
ii
“thesis_report_old” — 2010/4/26 — 13:54 — page 69 — #80 ii
ii
ii
Partitioning of Ba, La, Yb, and Y between haplogranitic melts and aqueous solutions
10-3
10-2
10-1
100
Flui
d-m
elt p
artit
ion
coef
ficie
nt
1.61.41.21.0ASI of the melt after the experiment
Barium at750°C / 200 MPa
non-chloridic solution
chlor
idic s
olutio
n
IHPV
(Pt)
RQ
(Pt)
RQ
(Au)
ClCl free
Figure 4.1: Barium partition coefficient at 750◦C and 200 MPa obtained from rapid and slowquenched experiments for chloridic and non-chloridic fluids vs. melt composition expressed asASI. Errors (±1σ) are, in some cases, smaller than symbol size. RQ - rapid quench, IHPV -slow quench, (Pt) - Pt capsule, (Au) - Au capsule.
coefficients with melt composition by more than one order of magnitude at an ASI of ∼1.1 to∼1.2. The onset of that increase appears to depend on the quench rate. For slow quenchedexperiments, Df/m
La,Y increase from 0.002 at an ASI of ∼0.8 to ∼0.1 at an ASI of 1.2. In thesame ASI range, the Yb partition coefficient increase to maximum values of 0.02. In the caseof rapid quenching, all fluid analyses of samples using peralkaline starting glasses show traceelement contents below detection limit, and therefore, no partition coefficients could be calcu-lated. For rapid quenched experiments using metaluminous or peraluminous starting glasses,the strong increase in the partition coefficients is shifted to higher ASI of ∼1.3, but with similarDf/m
La,Y,Yb (Tab. 4.5). For experiments using H2O as starting fluid, concentrations of La, Y, andYb were always below detection limit. In Fig. 4.2.2, the fluid–melt partition coefficient of La isshown as function of the ASI of the melt after the experiment for various pressure and tem-perature conditions (200 and 500 MPa, 750, 850, and 950◦C). The data indicate no effect oftemperature, but a drop of Df/m
La with increasing pressure by one order of magnitude.
4.3.2 HDAC experiments - evaluation of sensitivity
Figure 4.3 shows XRF-spectra collected on glass standards SRM NIST 612 (Pearce et al.,1997) and MPI-DING ATHO-G (Jochum et al., 2000, 2006). With the excitation conditions ofthis study, fluorescence lines of elements with atomic numbers from 20 to 63 were detectable.Concentrations of trace elements in SRM NIST612 vary between 5 to 120 ppm (Pearce et al.,1997). Only calcium, the element with the highest intensity in the spectra, has a concentrationof 12 wt.% in the standard glass. Element concentrations in MPI DING ATHO-G are much
69

ii
“thesis_report_old” — 2010/4/26 — 13:54 — page 70 — #81 ii
ii
ii
Chapter 4
10-3
10-2
10-1
100
Flui
d-m
elt p
artit
ion
coef
ficie
nts
1.31.21.11.00.90.8ASI of the melt after the experiment
SQ RQLaYbY
Lanthanum, Ytterbium, Yttriumat 750°C / 200 MPa
4.2.1: La, Yb, and Y at 750◦C/200 MPa
10-3
10-2
10-1
100
Flui
d-m
elt p
artit
ion
coef
ficie
nt
1.41.31.21.11.00.90.8ASI of the melt after the experiment
750°C / 200 MPa 750°C / 500 MPa 850°C / 200 MPa 850°C / 500 MPa 950°C / 200 MPa
Lanthanum at variousPT conditions
4.2.2: La at various PT conditions
Figure 4.2: Partition coefficients from chloridic fluids of La, Yb and Y in the fluid vs. meltcomposition at 750◦C and 200 MPa (Fig. 4.2.1), and La partition coefficient obtained fromquenched experiments for various PT conditions (Fig. 4.2.2). Error bars - ±1σ.
more variable (Jochum et al., 2000, 2006). The highest concentrations are those of Fe (3.27wt.% FeO), Zr (512 ppm), and Ba (547 ppm). The concentrations in the standard glass SRMNIST612 are 38 ppm Ba, 34 ppm La, 39 ppm Y, 36 ppm Sm, and 33 ppm Eu (Pearce et al.,1997). The MPI-DING ATHO-G standard glass contains 547 ppm Ba, 55.6 ppm La, 94.5 ppmY, 14.2 ppm Sm, and 2.76 ppm Eu (Jochum et al., 2006).
Figure 4.4 shows XRF spectra of HDAC experiments at high PT, and a spectrum of astandard solution loaded in a HDAC containing 630 ppm Ba and 315 ppm La, Eu, Sm andY each. These spectra show a very broad inelastic scattering peak between 35 and 50 keV.This signal mostly stems from Compton scattering of the incoming beam on the path throughthe diamond anvil. In the spectra of the standard solution and the experiment with chloridicfluid, the fluorescence lines of Ba, La and Y are clearly distinguishable from the background.However, Sm (at ∼40 keV) and Eu (at ∼41 keV) peaks are hardly visible due to the very strongcontribution by the inelastic scatter signal to the background in this energy region. In the caseof H2O as initial fluid, there is only a very small signal from Y, and the signals from Sm and Euare superimposed by the high background from inelastically scattered radiation. Due to theseconstraints on the sensitivity and further reasons as explained below, the fluids of the in-situHDAC experiments were only analyzed for Ba, La and Y.
In order to estimate the sensitivity of the experimental setup, a minimum detection limitMDL was calculated using the equation
MDL (x) = cx · 3 ·√
BxIx
,
where B is the background signal, I the intensity of the signal from element x, and c is theconcentration of x. The MDL were calculated for the two standard glasses (SRM NIST612
70

ii
“thesis_report_old” — 2010/4/26 — 13:54 — page 71 — #82 ii
ii
ii
Partitioning of Ba, La, Yb, and Y between haplogranitic melts and aqueous solutions
4000
3000
2000
1000
0
50403020100energy [keV]
320
240
160
80
0
coun
ts
Ca
Rb Sr
YZr Nb C
d
Mo
Ag
InSn
Sb TeI Xe
Cs
BaLa
Ce Pr
Nd
SmEu
Ag
Zr
Rb Sr Nb
Mo
Fe
BaLa C
e Pr Nd Sm
SRM NIST612
MPI DING ATHO-G
Figure 4.3: XRF spectra of a standard glasses SRM NIST612 and MPI DING ATHO-G. Bothspectra were collected with counting times of 500 seconds.
norm
aliz
ed in
tens
ity
5040302010energy [keV]
A - standard solution (630 ppm Ba, 315 ppm La, Y, Sm, Eu)B - melt + 26 wt.% NaCleq. (750°C/700 MPa, sample E)C - melt + H2O (750°C/500 MPa, sample D)
BaLa
YA
B
C
Figure 4.4: XRF spectra of a standard solution (A) and two samples using a chloridic solution(B) or H2O (C) as starting fluid loaded in a HDAC.
and MPI DING ATHO-G) and a standard solution measured in two hydrothermal diamond-anvil cells (Fig. 4.5). For the standard glasses, the minimum detection limits were ≤ 20 ppmfor elements with atomic numbers (Z) between 25 and 47, and ∼1 ppm for elements with48<Z<60. The minimum detection limits of the standard solution measured in the HDAC weregenerally higher, with values of ∼30 ppm for Y, ∼15 ppm for Ba and La.
4.3.3 HDAC experiments - partitioning data
For the in-situ experiments, Tab. 4.6 lists the experimental conditions, results of fluid and meltanalyses, and calculated fluid-melt partition coefficients of Ba, La and Y. Figures 4.6 and 4.7present the partition coefficients from HDAC experiments, in which the trace element con-centrations in the fluid were determined in-situ at high PT. For these experiments, we usedperaluminous and metaluminous starting glasses doped with Ba, La, Y, Sm and Eu (Tab. 4.1).As described in the previous paragraph, the SR-µXRF analyses were limited to elements withphoton energies ≤ 35 keV due to the high background from the inelastic scattering peak. Bar-ium partitioning data at 750◦C and various pressures are shown in Fig. 4.6.1 for experimentsusing peraluminous starting glass, and in Fig. 4.6.2 for metaluminous compositions, in both
71
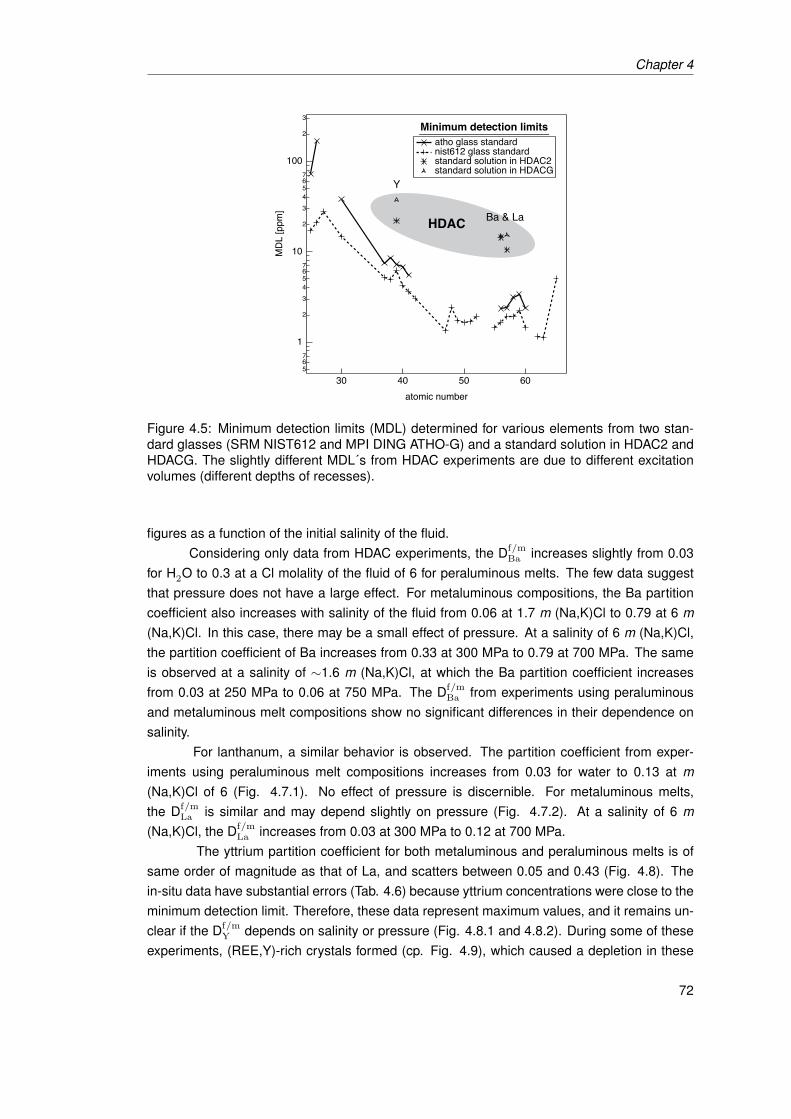
ii
“thesis_report_old” — 2010/4/26 — 13:54 — page 72 — #83 ii
ii
ii
Chapter 4
HDAC
Y
Ba & La
567
1
2
34567
10
2
34567
100
2
3
MDL
[ppm
]
60504030atomic number
atho glass standard nist612 glass standard standard solution in HDAC2 standard solution in HDACG
Minimum detection limits
Figure 4.5: Minimum detection limits (MDL) determined for various elements from two stan-dard glasses (SRM NIST612 and MPI DING ATHO-G) and a standard solution in HDAC2 andHDACG. The slightly different MDL´s from HDAC experiments are due to different excitationvolumes (different depths of recesses).
figures as a function of the initial salinity of the fluid.Considering only data from HDAC experiments, the Df/m
Ba increases slightly from 0.03for H2O to 0.3 at a Cl molality of the fluid of 6 for peraluminous melts. The few data suggestthat pressure does not have a large effect. For metaluminous compositions, the Ba partitioncoefficient also increases with salinity of the fluid from 0.06 at 1.7 m (Na,K)Cl to 0.79 at 6 m(Na,K)Cl. In this case, there may be a small effect of pressure. At a salinity of 6 m (Na,K)Cl,the partition coefficient of Ba increases from 0.33 at 300 MPa to 0.79 at 700 MPa. The sameis observed at a salinity of ∼1.6 m (Na,K)Cl, at which the Ba partition coefficient increasesfrom 0.03 at 250 MPa to 0.06 at 750 MPa. The Df/m
Ba from experiments using peraluminousand metaluminous melt compositions show no significant differences in their dependence onsalinity.
For lanthanum, a similar behavior is observed. The partition coefficient from exper-iments using peraluminous melt compositions increases from 0.03 for water to 0.13 at m(Na,K)Cl of 6 (Fig. 4.7.1). No effect of pressure is discernible. For metaluminous melts,the Df/m
La is similar and may depend slightly on pressure (Fig. 4.7.2). At a salinity of 6 m(Na,K)Cl, the Df/m
La increases from 0.03 at 300 MPa to 0.12 at 700 MPa.The yttrium partition coefficient for both metaluminous and peraluminous melts is of
same order of magnitude as that of La, and scatters between 0.05 and 0.43 (Fig. 4.8). Thein-situ data have substantial errors (Tab. 4.6) because yttrium concentrations were close to theminimum detection limit. Therefore, these data represent maximum values, and it remains un-clear if the Df/m
Y depends on salinity or pressure (Fig. 4.8.1 and 4.8.2). During some of theseexperiments, (REE,Y)-rich crystals formed (cp. Fig. 4.9), which caused a depletion in these
72

ii
“thesis_report_old” — 2010/4/26 — 13:54 — page 73 — #84 ii
ii
ii
Partitioning of Ba, La, Yb, and Y between haplogranitic melts and aqueous solutions
10-3
10-2
10-1
100
101flu
id-m
elt p
artit
ion
coef
ficie
nt
6543210initial m (Na,K)Cl in the fluid
HDAC data quench data (200 MPa)
numbers = P [MPa]
Bariumperaluminous melt
500
830
900
200
4.6.1: peraluminous melt
10-3
10-2
10-1
100
101
fluid
-mel
t par
titio
n co
effic
ient
6543210initial m (Na,K)Cl in the fluid
HDAC data quench data (200 MPa)
numbers = P [MPa]
250
750
700
300
Bariummetaluminous melt
4.6.2: metaluminous melt
Figure 4.6: Fluid−melt partition coefficient of Ba at 750◦C and the indicated pressure vs.initial Cl-molality of the fluid. Data from HDAC and quenched experiments are shown forperaluminous (Fig. 4.6.1) and metaluminous melt (Fig. 4.6.2).
10-2
10-1
100
101
fluid
-mel
t par
titio
n co
effic
ient
s
6543210initial m (Na,K)Cl in the fluid
HDACquench this study
Bai and Koster van Groos (1999)numbers = P [MPa]* - T=950°C
200
500
900
830
Lanthanumperaluminous melt
500*
200
200
200
4.7.1: peraluminous melt
10-2
10-1
100
101
Flui
d-m
elt p
artit
ion
coef
ficie
nt
6543210initial m (Na,K)Cl in the fluid
HDACquench(200 MPa)
this study Reed et al. (2000)
numbers = P [MPa]
Lanthanummetaluminous melt
750
300
700Ree
d et a
l. 200
0
this study
4.7.2: metaluminous melt
Figure 4.7: Fluid−melt partition coefficient of La at 750◦C and the indicated pressure vs.initial Cl-molality of the fluid. Data from HDAC and quenched experiments are shown forperaluminous (Fig. 4.7.1) and metaluminous melt (Fig. 4.7.2).
elements in the melt and the fluid. The formation of the (REE,Y)-rich crystals was observedin experiments A and E, which were characterized by a high fluid salinity of 6 m (Na,K)Cland high pressures of 830 and 750 MPa (Fig. 4.9). In these cases, repeated measurementsshowed that the Y concentration in the fluid first increased to a maximum of 114 ppm andsubsequently decreased to ∼30 ppm, which is close to detection limit. A similar behavior was
73

ii
“thesis_report_old” — 2010/4/26 — 13:54 — page 74 — #85 ii
ii
ii
Chapter 4
found for lanthanum. The La concentration increased during the experiment to a maximum of230 ppm, and then decreased to ∼30 ppm. The minimum detection limit of La is ∼15 ppm,and therefore obtained La contents in the fluids are somewhat more reliable than those foryttrium. Samarium and europium were not analyzed for the reason given in section 4.3.2.
0.01
0.1
1
10
100
fluid
-mel
t par
titio
n co
effic
ient
6543210initial m Cl in the fluid
Yttrium HDAC (metaluminous) HDAC (peraluminous) quench (peraluminous) Webster et al., 1989
symbol size = pressure [MPa] ( 200 , 900)
4.8.1: Y at 750◦C and various pressures vs. fluid salinity
0.01
0.1
1
10
100
fluid
-mel
t par
titio
n co
effic
ient
900800700600500400300200pressure [MPa]
Yttrium HDAC (metaluminous) HDAC (peraluminous) quench (peraluminous) Webster et al., 1989
symbol size = m Cl (fluid) ( 0.2, 6 )
4.8.2: Y at 750◦C and various fluid salinities vs. pressure
Figure 4.8: Yttrium fluid-melt partition coefficient at 750◦C and indicated pressures vs. initialCl-molality (Fig. 4.8.1) and at 750◦C and indicated fluid salinities vs. pressure (Fig. 4.8.2).Figures show data from HDAC and quenched experiments (this study). For comparison, wealso show the Y partition coefficient obtained using F-rich starting material (Webster et al.,1989).
Eu Kα La Kα
Sm KαY Kα
200 μm
Figure 4.9: XRF intensity maps of fluorescence lines as indicated of sample chamber of HDACafter experiment (E) indicating the formation of REE-bearing silicates.
74

ii
“thesis_report_old” — 2010/4/26 — 13:54 — page 75 — #86 ii
ii
ii
Partitioning of Ba, La, Yb, and Y between haplogranitic melts and aqueous solutions
4.3.4 Comparison of quenched and HDAC runs
For barium, fluid–melt partition coefficients from quench and HDAC experiments are in goodagreement for experiments with peraluminous melts and chloridic solutions (cp. Fig. 4.6.1). Ifwater was used as starting fluid, partitioning data from quenched experiments are one to twoorders of magnitude lower than comparable HDAC results. For metaluminous compositions,quenched experiments show up to one magnitude higher Df/m
Ba than comparable HDAC runswith similar fluid salinities and pressures (Fig. 4.6.2). No HDAC data for Cl free fluids could beobtained for these melt compositions. Altogether, the data for Ba from both techniques showqualitative agreement, i.e., melt compatible behavior (D< 1) for all melt and fluid compositions,even at high fluid salinities.
For lanthanum and yttrium, the concentrations in the quenched solutions after the runwere below detection limit in experiments using H2O as starting fluid. Therefore, no partitioncoefficients could be obtained that could be compared to HDAC data. For chloridic fluids, Lapartition coefficients from both techniques are in relatively good agreement and show a meltcompatible behavior at all studied fluid salinities. The observed maximum fluid–melt partitioncoefficient of La is associated with high salinities, high pressures, or both, and scatters around0.1. Results for metaluminous and peraluminous melts are similar for HDAC experiments, butquite different for quenched experiments. For yttrium, the HDAC data represent maximumpartition coefficients, and are also associated with a substantial error due to Y contents in thefluid that are close to detection limit. Therefore, it remains unclear if there is a quench effect.Nevertheless, HDAC and quenched data are roughly similar, and show always a preferencefor the melt.
4.4 Discussion and conclusions
4.4.1 Fluid–melt partitioning
This study presents the first systematic dataset for Ba, La, Yb, and Y partitioning betweenaqueous fluid and haplogranitic melt as function of temperature, pressure, fluid and melt com-position. Furthermore, we also present the first data for Ba, La, and Y that are based on thedirect determination of trace element contents in the fluid at elevated PT conditions.
In the following, we will compare the results of this study to literature and discuss pos-sible effects of composition and quenching on trace element partition coefficients. Then, wepresent some ideas about trace element complexation in chloridic and non-chloridic aqueousfluids. Finally, we will draw some possible conclusions for natural systems.
Comparison to other experimental data
Only a few experimental data are available on fluid-melt partitioning of Ba, La, and Y. Most ofthese studies report data from quenched experiments using hydrothermal autoclaves (Web-ster et al., 1989, Bai and Koster van Groos, 1999, Reed et al., 2000) except Bureau et al.(2003), who applied hydrothermal diamond-anvil cells and µPIXE mapping to determine fluid–melt partition coefficients. All these studies also use different analytical techniques (plasma
75

ii
“thesis_report_old” — 2010/4/26 — 13:54 — page 76 — #87 ii
ii
ii
Chapter 4
emission spectrometry, µPIXE, or instrumental neutron activation analysis) or apply mass bal-ance to recalculate the trace element contents in the fluid (Webster et al., 1989). Thus, acomparison of data is further complicated by the potentially different systematic errors of theexperimental and analytical procedures applied. Furthermore, all these studies use differentstarting material and slightly differing PT conditions, which also complicates comparison ofdata and their discussion.
Bureau et al. (2003) studied Ba partitioning between silicate melts and water or salinefluids. Their data suggests a preference of Ba for the silicate melt. An effect of fluid salin-ity was not detected. This is in contrast to Webster et al. (1989) who studied partitioning oftrace elements between fluorine-rich topaz–rhyolite melts and H2O±CO2 as a function of Clconcentration. They found a transition from melt-compatible to fluid-compatible behavior withincreasing chlorinity for Ba and also for Y. Bai and Koster van Groos (1999) studied elementpartitioning between metaluminous melts and various aqueous fluids and reported partitioncoefficient of La of 0.02 for H2O. The Df/m
La did not increase by addition of NaCl and KCl tothe fluid, but addition of HCl lead to a significant rise of La partition coefficient. Reed et al.(2000) used peraluminous monzogranitic melt and a chloride-bearing aqueous volatile phaseas starting materials. Their REE partitioning data linearly increase with Cl− concentration inthe fluid and showed a preference for the aqueous fluid at high salinities.
The Ba partitioning data of this study show a preference for the silicate melt at all stud-ied fluid salinities and therefore, confirms the suggestions of Bureau et al. (2003). However,the Df/m
Ba slightly increases with salinity of the fluid. In contrast to Webster et al. (1989), wedo not observe a change to fluid-compatible behavior. The lanthanum data of this study arepartly different to results by Reed et al. (2000), who found a preference of La and other rareearth elements for the fluid at high salinities (Fig. 4.7.2). At lower fluid salinities, the La parti-tion coefficients from this study and from Reed et al. (2000) are in relatively good agreement.The La data from Bai and Koster van Groos (1999) show no difference between H2O and(Na,K)Cl fluids. This is in contrast to the data of Reed et al. (2000) and also to the results ofthis study, which show increasing values with increasing salinity. Nevertheless, their Df/m
La of0.02 for H2O as starting fluid is in very good agreement with in-situ data of this study. TheYttrium partition coefficient determined by Webster et al. (1989) shows a preference for thefluid at most fluid salinities studied and found a strong dependence on fluid salinity. This isa distinct difference to the results of this study (Fig. 4.8) because the Df/m
Y is always smallerthan one even at high fluid salinities. The most probable explanation for distinctions of Y andalso Ba partition coefficients is the presence of up to 1.25 wt.% F in the starting material ofWebster et al. (1989), whereas our experiments were performed in a F-free system. Fluoris known to be fluid-compatible and is a suitable complexing agent for many trace elementsin hydrothermal solutions (e.g., Christiansen et al., 1984, Keppler and Wyllie, 1991, Bau andDulski, 1995, Williams-Jones et al., 2000). Moreover, Christiansen et al. (1984) suggest thatthe trace element evolution of rhyolitic magmas is sensitive to F/Cl in the melt. That is, withdifferentiation, F-dominated systems display increases in Al, Na, Rb, Li, Cs, Be, Ta, and Th,while Cl-dominated systems are usually peralkaline and are associated with enrichments ofe.g., LREE, Fe, Ti, Zn, Nb, and Zr. Althrough magmas with variable proportions of H2O, F, Cland CO2 exist, topaz rhyolites as the one Webster et al. (1989) used for their experiments, rep-
76
ii
“thesis_report_old” — 2010/4/26 — 13:54 — page 77 — #88 ii
ii
ii
Partitioning of Ba, La, Yb, and Y between haplogranitic melts and aqueous solutions
resent a fluorine-dominated end member (Christiansen et al., 1984). The differences betweenthe results of this study and the data by Bai and Koster van Groos (1999), Reed et al. (2000)and Bureau et al. (2003) are most probably related to slightly different system compositionand may also be caused by the usage of different experimental and analytical techniques asdescribed earlier in this paragraph.
Comparison to data of natural cogenetic fluid and melt inclusions
A comparison of the experimental results to natural data is very limited because only twostudies report Ba, La, and Y concentrations in cogenetic fluid and melt inclusions (Audétat andPettke, 2003, Zajacz et al., 2008). Zajacz et al. (2008) analyzed co-existing silicate melt andfluid inclusions, entrapped in quartz crystals for a series of elements including Ba and La. Thefluid–melt partition coefficient of Ba is 0.49 at a fluid salinity of 6.5 wt.%, and increases to 19 ata salinity of ∼34 wt.%. For Lanthanum, the partition coefficient slightly decreases from 0.31 to0.1 with increasing fluid salinity from 6.5 to ∼34 wt.%. Audétat and Pettke (2003) studied themagmatic-hydrothermal evolution of two barren granites using analyses of coeval fluid and meltinclusions trapped at 700–720◦C and 110–120 MPa. Here, the fluid–melt partition coefficientof Y is max. ∼0.006 at a fluid salinity of 4.9 wt.% NaClequiv.. All in all, these data show adistinct preference of Ba, La, and Y for the melt at salinities of at least up to 6.5 wt.%, which isin good quantitative agreement with the data of this study.
Effects of chemical composition
Any effect of the melt composition on the partitioning can be explained by i) changes in the in-corporation of the trace element in the melt or ii) changes in the complexation of trace elementin the fluid.i) Silicate melt.Flynn and Burnham (1978) and Ponader and Brown (1989) figured out that the incorporation ofrare earth elements in silicate melts strongly depends on the availability of highly-coordinatedsites, which increase as a function of the melt depolymerization. This hypothesis is in agree-ment with our data that show significantly higher fluid–melt partition coefficients of La, Yb, andalso Y for experiments using peraluminous melts (ASI ≥ 1) than for those with peralkalinemelts. The reason for that is the lower degree of polymerization of peralkaline melts comparedto peraluminous melts. That is, these melts offer a higher quantity of sites coordinated by non-bridging oxygen (NBO). Therefore, peralkaline melts can incorporate higher REE contents thanperaluminous melts. For barium, such studies are still missing. However, one can speculatethat the barium incorporation in silicate melts will also depend on the degree of polymerization.The reasons are the divalent character of Ba and it´s large ion radius of 149 pm that is similarto that of K+ (152 pm). This means, barium likely prefers also NBO to be incorporated in sili-cate melts, and therefore, Ba should preferentially be incorporated in peralkaline melts due thehigher quantity of NBO sites compared to peraluminous melts. This surmise is supported bythe Ba fluid–melt partition coefficient of this study that increases with ASI and thus increasingpolymerization of the melt. However, the strong correlation between partition coefficients of Ba,La, Yb, and Y and ASI of the melt was only found in the case of chloridic fluids. Therefore, one
77

ii
“thesis_report_old” — 2010/4/26 — 13:54 — page 78 — #89 ii
ii
ii
Chapter 4
has also to discuss the structural role of Cl− in different silicate melts. Stebbins and Du (2002)studied chloride ion sites in silicate and aluminosilicate glasses by 35Cl solid-state NMR. Theyfound similar 35Cl peak positions in Al-free and Al-containing alkali glasses and suggested thateven in the latter, most of the Cl− ions are coordinated only by the alkali cations. Websterand De Vivo (2002) found a strong influence of doubly charged alkaline-earth metals on Clsolubility in the melt. They suggested that Cl interacts with and removes these divalent ions,previously associated with network-forming Al, to form alkaline earth metal-chloride speciesin the melt. One can speculate that this reaction might be stronger in the case of peralkalinemelts due to the higher degree of depolymerization.ii) Aqueous fluid.Tracking down the effect of fluid composition is more complex, because apart from trace ele-ments also major components are exchanged between the silicate melt and the aqueous fluid.Alkali ions will fractionate stronger into the fluid than Al and Si. The degree of this exchangevaries with pressure on one hand side as the mutual solubility of melt and fluid increases. Onthe other hand, the effect of this exchange on the fluid composition will certainly vary with theASI of the starting melt. Consequently, the ASI of the resulting melts will shift. In the case ofH2O as starting solution, small amounts of sodium partition into the aqueous fluid and thus,the ASI of the melt is shifted to higher values. Part of the of alkalis might be exchanged withprotons from the fluid leading to a change of the pH of the solution. For runs with H2O only, thisexchange is relatively small as can be deduced from data of Borchert et al. (2010) who reportquench pH of 6 to 7.9 for experiments with H2O independent of the ASI. It should be kept inmind, that at high PT conditions, H2O is nearly completely associated (Tagirov et al., 1997),so that the measured pH does not equals the one at PT. Still, as shown below, the quench pHshows some systematic variation offering insight to the exchange equilibria between melt andfluid.
For chloridic fluids we observed a much more complicated behavior of the major com-pounds that can be directly related to the composition of the melt. Here, the ASI is shiftedto higher values in the case of peralkaline starting glasses, but decreases in the case of per-aluminous starting material (cp. Tab. 4.2 and 4.4). In experiments using initially peralkalinecompositions, on one side alkalis will strongly partition into the aqueous fluid, and on the otherside some of the Cl will be incorporated in the silicate melt. The incorporation of Cl in the meltis favored by the presence of divalent cations (Webster and De Vivo, 2002). For these fluids,the pH will increase because on the one hand alkalis strongly partition into the aqueous fluidwhich leads to a decrease of the activity of Cl− and on the other hand protons are incorporatedin the melt producing OH− in the fluid. The latter is consistent with a basic quench pH of 9.5in the case of peralkaline melts (Borchert et al., 2010). In the case of peraluminous melts, theASI is shifted to lower values. Here, alkalis partitions from the aqueous fluid into the silicatemelt, which is correlated with a release of protons and highly charged trace elements from themelt into the aqueous fluid. The release of protons can be deduced from the acidic quench pHof 2 for fluids equilibrated with peraluminous melts (Borchert et al., 2010). The highly chargedelements are only weakly bonded in peraluminous melts due to the lower amount of NBOcoordinated sites compared to peralkaline melts. The solubility of Cl in peraluminous meltsis somewhat lower than in the case of peralkaline melts. In addition, fractionation of alkalis
78

ii
“thesis_report_old” — 2010/4/26 — 13:54 — page 79 — #90 ii
ii
ii
Partitioning of Ba, La, Yb, and Y between haplogranitic melts and aqueous solutions
from the fluid into the melt increases the activity of Cl− in the fluid. Thus, highly charged traceelements can be complexed more efficiently by Cl in the aqueous fluid.
Quench effect
The comparison of partitioning data determined with in-situ analysis of trace element contentsin fluids at elevated PT conditions to those from quenched experiments proves that the ex-perimental fluids change their trace element signature upon cooling (’quench effect’). This isparticularly important if Df/m values are very different from one. This is highlighted by thefact, that the concentration of rare earth elements was always below detection limit in analysesof quenched fluids, whereas small REE contents were determined using the in-situ methodalthough the minimum detection limit for the latter method was higher. Thus, if analyses ofaqueous fluids are required for a certain experimental procedure, they should be performedin-situ. An alternative method is recalculation of the trace element contents in the aqueousfluid via mass balance (e.g., Ayers and Eggler, 1995, Webster et al., 1989, Webster, 1992a,b).The main advantage of in-situ analyses over mass balancing is the reliable determination oftrace element contents of the aqueous fluid also in the case of formation of trace element-bearing crystals during the run.
There are two different mechanisms that can account for a quench effect, precipitation ofphases during the quench and at room temperature and back reactions between aqueous fluidand silicate melt. The precipitation of new compounds from the aqueous fluid during coolingwas not observed in our in-situ experiments by microscopic observation. We also did not findprecipitated material in run products of conventionally quenched experiments. Surely, thesenegative results do not proof the complete absence of precipitation but reduce their probability.The data by Borchert et al. (2009) show a rapid equilibration of trace element contents betweenaqueous fluid and silicate melt, and thus, prove that back reactions between aqueous fluid andsilicate melt are feasible. The comparison of slowly and rapidly quenched data (conventionallyquenched experiments) show a strong effect of quenching on sodium and potassium in theresulting melt. Consequently, the ASI of rapidly quenched melts is slightly higher than that ofslowly cooled melts. This caused a shift in the onset of the increase of fluid-melt partition dataof La, Yb, and Y (see Fig. 4.2.1 and 4.2.2, Tab. 4.3 and 4.5). Based on these observations,we suggest that the observed quench effect is most likely due to back reactions between fluidand melt during cooling although it could not be proven by spatially resolved analyses on thequenched melts, most likely because any gradient potentially present is too small to be ana-lyzed with techniques used here.
It should be noted, fluid–melt partition coefficients from HDAC experiments are stillbased in part on analyses of quenched samples, and thus are not free of quench effects. Fur-ther improvements should be aimed at the in-situ determination of trace element contents inboth the fluid and the melt.
Complexation of trace elements in the fluid
Interestingly, the in-situ analyses show roughly the same La and Y concentrations in chloride-free and chloridic solutions (cp. Tab. 4.6). In contrast, in conventionally quenched experiments
79

ii
“thesis_report_old” — 2010/4/26 — 13:54 — page 80 — #91 ii
ii
ii
Chapter 4
trace element contents of these elements in Cl-free fluids were always below the detection limitwhereas this was not the case for chloridic solutions. This points to a strong effect of Cl− onthe quench process and suggests a stabilization of REE complexes in the fluid upon coolingin the presence of chlorine. Moreover, the very similar in-situ fluid–melt partition coefficientsof La and Y for Cl-free and Cl-bearing fluids point to a complexation of these elements withdissolved silicate melt components. In detail, these complexes may be somewhat different forfluids with or without chlorine. For barium, the in-situ partition coefficient increases with salinityof the fluid, and Df/m
Ba of chloridic fluids are 4 to 10 times higher than those the Cl-free fluid inthe case of peraluminous melts. That is, Ba likely complexes with both, Cl− and with dissolvedmelt components in fluids equilibrated with melts with an ASI ≥ 1. For peralkaline melt com-positions, we suggest a primal complexation with dissolved melt components because of thestrong decrease of the Ba partition coefficient with decreasing ASI of the melt at constant fluidsalinity.
Further implications
Comparison of the data of this study and recent results (Borchert et al., 2010) show a similardependence of Sr, Ba, La, Yb, and Y partitioning between aqueous fluids and haplograniticmelts on fluid salinity and on the melt composition. Therefore, we infer that fluid–melt parti-tioning of other divalent large ion lithophile elements (e.g., Pb) as well as of other lanthanideswill show a similar dependence on the melt composition. The data show that H2O ± (Na,K)Clfluids exsolving from peralkaline silicate melts do not have the ability to significantly changethe concentrations of Ba, La, Yb, and Y in the melt, even if the salinity of the fluid is high. Theobserved stronger enrichment of rare earth elements in peralkaline melts during exsolution ofan aqueous fluid is also found in nature (e.g., Hedenquist and Lowenstern, 1994, Kovalenkoet al., 1995, Williams-Jones et al., 2000, Tassinari et al., 2001). However, because the weightfraction of the exsolved aqueous fluids is small, this cannot be the main parameter control-ling the final trace element content of granitic rocks. Here, fractionation of trace elements intocrystalline phases will have a much larger effect. An enrichment of these elements in resid-ual granitic melts is mainly controlled by the fractionation of these elements into crystallizingphases and the abundance of these crystals. For example, Ba will fractionate into feldsparand mica during crystallization of granites (e.g., Winter, 2001) and therefore, will be depletedin the residual melt. In contrast to large ion lithophile elements, the REE do not fractionate intogranite forming minerals (except Eu2+). Thus, the exsolution of an aqueous fluid together withfractional crystallization of feldspars, quartz, and mica will result in an enrichment of the REEin the residual melt. Due to lower fluid–melt partition coefficients in peralkaline systems, it issuggested that this effect will be slightly stronger for melts with an ASI < 1. Our experimentsalso show that, for hydrothermal REE mineralizations derived from alkali granites, complex-ing of the REE must take place with other ligands than Cl− to explain the enrichment in thefluid phase. Such anions are probably F− and CO2−
3 (Ponader and Brown, 1989, Gieré, 1996,Williams-Jones et al., 2000).
80

ii
“thesis_report_old” — 2010/4/26 — 13:54 — page 81 — #92 ii
ii
ii
Partitioning of Ba, La, Yb, and Y between haplogranitic melts and aqueous solutions
4.4.2 In-situ XRF analyses using high excitation energies
Borchert et al. (2009, 2010) demonstrated that Rb and Sr concentrations in aqueous fluidsequilibrated with silicate melts at elevated temperatures and pressures can be determinedwith a very good reliability using a HDAC and SR-XRF microanalysis, particularly for Cl− freesystems. The experimental setup used in this study was similar to that used by Borchert et al.(2009, 2010), but with application of a much higher excitation energy (50 keV instead of 20keV) to evaluate if analysis of XRF K line of elements with Z > 40 is promising for diamondconfined samples. The utilization of a new Kirkpatrick-Baez (KB) mirror based on a multilayerstructure allowed measurements with spot sizes in the µm range and high excitation energies.At an excitation energy of 50 keV, the spectra showed a very broad background increase,which was related to Compton scattering from the incoming beam in the diamond anvil, whichprecluded analysis of small concentrations of elements with Z > 60. For the analysis of theseelements, the following two improvements are suggested:
• A shift to a higher excitation energy (∼65 keV). This should provide a better backgroundin the energy range of interest because the inelastic scatter peak will also shift to higherenergies. However, a shift to higher excitation energy will result in less flux and in lowerfluorescence cross sections for low Z elements (like Y), and thus, will decrease the sen-sitivity for these elements. The use of a pink beam may compensate these trade-offsbecause application of the full bandwidth of the undulator harmonics would increase theflux by a factor of ∼100.
• Realization of these experiments using a wavelength-dispersive spectrometer. Wavelength-dispersive analysis facilitates use of REE L lines because of the much better energyresolution compared to energy dispersive solid state detectors. For HDAC experiments,REE L lines can be better separated from each other and from K lines of the 3d-transitionmetals (e.g., excitation from gasket or thermocouple). That is, lower excitation energiescan be applied. Another advantage of utilization of a wavelength-dispersive spectrometeris the lower background. However, the disadvantages are lower fluorescence yields anda much stronger absorption of lower energy fluorescence lines along the path towardsthe detection.
Acknowledgements
We thank the European Synchrotron Radiation Facility (ESRF) for granting beamtime, M. Ebertfor performing the Barium quenched experiments and data evaluation of these experimentalruns, O. Appelt for the help with EMP measurements at Deutsches GeoForschungsZentrum,A. Musiol for the introduction to ICP-OES analysis at Universität Potsdam, and A. Gottsche forthe introduction to IC analysis and performance of some of the analysis at Deutsches Geo-ForschungsZentrum GFZ. The great help and support of K. Appel, L. Vincze, and S. Labouréare highly appreciated. We thank D. Dingwell for editorial handling, A. C. Simon for the con-structive review, and J. D. Webster for useful comments on this manuscript. This study wassupported by the German Science Foundation (DFG, Wi 2000/3-1 and Wi 2000/3-2).
81
ii
“thesis_report_old” — 2010/4/26 — 13:54 — page 82 — #93 ii
ii
ii
Akella, J., Vaidya, S. N., and Kennedy, G. C. (1969). Melting of Sodium Chloride at Pressuresto 65 kbar. Physical Review, 185(3):1135–1140.
Albarede, F. (1975). Some trace element relationships among liquid and solid phases inthe course of the fractional crystallization of magmas. Geochimica et Cosmochimica Acta,40:667–673.
Audétat, A. and Pettke, T. (2003). The magmatic-hydrothermal evolution of two barren gran-ites: A melt and fluid inclusion study of the Rito del Medio and Canada Pinabete plutons innorthern New Mexico (USA). Geochimica et Cosmochimica Acta, 67(1):97–121.
Ayers, J. C. and Eggler, D. H. (1995). Partitioning of elements between silicate melt and H2O-NaCl fluids at 1.5 and 2.0 GPa pressure: Implications for mantle metasomatism. Geochimicaet Cosmochimica Acta, 59(20):4237–4246.
Bai, T. B. and Koster van Groos, A. F. (1999). The distribution of Na, K, Rb, Sr, Al, Ge, Cu,W, Mo, La, and Ce between granitic melts and coexisting aqueous fluids. Geochimica etCosmochimica Acta, 63(7/8):1117–1131.
Bassett, W. A., Anderson, A. J., Mayanovic, R. A., and Chou, I.-M. (2000). Modified hydrother-mal diamond anvil cells for XAFS analyses of elements with low energy absorption edgesin aqueous solutions at sub- and supercritical conditions. Zeitschrift für Kristallographie,215:711–717.
Bassett, W. A., Shen, A. H., Bucknum, M., and Chou, I.-M. (1993). A new diamond anvil cell forhydrothermal studies to 2.5 GPa and from 190 to 1200◦C. Review of scientific instruments,64:2340–2345.
Bau, M. and Dulski, P. (1995). Comparative study of yttrium and rare-earth element behavioursin fluorine-rich hydrothermal fluids. Contributions to Mineralogy and Petrology, 119:213–223.
Bea, F. (1996). Residence of REE, Y, Th and U in Granites and Grustal Protoliths; Implicationsfor the Chemistry of Crustal Melts. Journal of Petrology, 37(3):521–552.
Bea, F., Pereira, M. D., and Stroh, A. (1994). Mineral/leucosome trace-element partitioning in aperaluminous migmatite (a laser ablation-ICP-MS study). Chemical Geology, 117:291–312.
Bédard, J. H. (2006). Trace element partitioning in plagioclase feldspar. Geochimica et Cos-mochimica Acta, 70:3717–3742.
82

ii
“thesis_report_old” — 2010/4/26 — 13:54 — page 83 — #94 ii
ii
ii
Behrens, H. and Jantos, N. (2001). The effect of anhydrous composition on water solubility ingranitic melts. American Mineralogist, 86:14–20.
Best, M. G. (2003). Igneous and Metamorphic Petrology. Blackwell.
Blundy, J., Robinson, J., and Wood, B. (1998). Heavy REE are compatible in clinopyroxene onthe spinel lhersolite solidus. Earth and Planetary Science Letters, 160:493–504.
Blundy, J. D. and Wood, B. J. (1991). Crystal-chemical controls on the partitioning of Sr andBa between plagioclase feldspar, silicate melts, and hydrothermal solutions. Geochimica etCosmochimica Acta, 55:193–209.
Bodnar, R. J. and Vityk, M. O. (1994). Interpretation of microthermometric data for H2O-NaClfluid inclusions. Fluid Inclusions in Minerals: Methods and Applications, pages 117–130.Virginia Tech.
Borchert, M., Wilke, M., Schmidt, C., and Rickers, K. (2009). Partitioning and equilibration ofRb and Sr between silicate melts and aqueous fluids. Chemical Geology, 259:39–47.
Borchert, M., Wilke, M., Schmidt, C., and Rickers, K. (2010). Rb and Sr partitioning betweenhaplogranitic melts and aqueous solutions. Geochimica et Cosmochimica Acta, 74:1057–1076.
Bureau, H., Ménez, B., Khodja, H., Daudin, L., Gallien, J.-P., Massare, D., Shaw, C., andMétrich, N. (2003). The partitioning of barium and lead between silicate melts and aqueousfluids at high pressures and temperatures. Nuclear Instruments and Methods in PhysicsResearch, 210:434–440.
Burnham, C. W. and Jahns, R. H. (1962). A method for determining the solubility of water insilicate melts. American Journal of Science, 260:721–745.
Chappell, B. W. and White, A. J. R. (1974). Two contrasting granite types. Pac Geol, 8:173–174.
Christiansen, E. H., Bikun, J. V., Sheridan, M. F., and Burt, D. M. (1984). Geochemical evolutionof topaz rhyolites from the Thomas Range and Spor Mountain, Utah. American Mineralogist,69:223–236.
Ewart, A. and Griffin, W. L. (1994). Application of Proton-Microprobe Data to Trace-ElementPartitioning in Volcanic-Rocks. Chemical Geology, 117:251–284.
Flynn, R. T. and Burnham, C. W. (1978). An experimental determination of rare earth partitioncoefficients between a chloride containing vapor phase and silicate melts. Geochimica etCosmochimica Acta, 42:685–701.
Gieré, R. (1996). Formation of rare earth minerals in hydrothermal systems. In: Rare earthminerals: Chemistry, origin and ore deposits, chapter 5, pages 105–150. Chapman & Hall.
Green, T. H. and Pearson, N. J. (1983). Effect of pressure on rare earth element partitioncoefficients in common magmas. Nature, 305:414–416.
83

ii
“thesis_report_old” — 2010/4/26 — 13:54 — page 84 — #95 ii
ii
ii
Chapter 4
Haar, L., Gallagher, J., and Kell, G. (1984). Steam tables:, chapter Thermodynamic and trans-port properties and computer programs for vapor and liquid states of water in SI units, page320. Hemisphere Pub. Corp., Washington, D.C.
Hall, D. L., Sterner, S. M., and Bodnar, R. J. (1988). Freezing Point depression of NaCl-KCl-H2O Solutions. Economic Geology, 83:197–202.
Hedenquist, J. W. and Lowenstern, J. B. (1994). The role of magmas in the formation ofhydrothermal ore deposits. Nature, 370:519–527.
Hui, H., Zhang, Y., Xu, Z., Del Gaudio, P., and Behrens, H. (2009). Pressure dependence ofviscosity of rhyolitic melts. Geochimica et Cosmochimica Acta, 73:3680–3693.
Jochum, K. P., Dingwell, D. B., Rocholl, A., Stoll, B., Hofmann, A. W., and many others (2000).The preparation and prelimnary characterisation of eight geological MPI-DING referenceglasses for in-situ microanalysis. Geostandards Newsletter, 24(1):87–133.
Jochum, K. P., Stoll, B., Herwig, K., Willbold, M., Hofmann, A. W., and many others (2006).MPI-DING reference glasses for in situ microanalysis: New reference values for elementconcentrations and isotope ratios. Geochemistry, Geophysics, Geosystems, 7(2):1–44.
Johannes, W. and Holtz, F. (1996). Petrogenesis an Experimental Petrology of Granitic Rocks.Springer, Berlin.
Keppler, H. and Wyllie, P. J. (1991). Partitioning of Cu, Sn, Mo, W, U, and Th between meltand aqueous fluid in the systems haplogranite-H2O-HCl and haplogranite-H2O-HF. Contri-butions to Mineralogy and Petrology, 109:139–150.
Kovalenko, V. I., Tsaryeva, G. M., Goreglyad, A. V., Yarmolyuk, V. V., Troitsky, V. A., Hervig,R. L., and Farmer, G. L. (1995). The peralkaline granite-related Khaldzan-Buregtey raremetal (Zr, Nb, REE) deposit, western Mongolia. Economic Geology, 90:530–547.
Leeman, W. and Phelps, D. (1981). Partitioning of rare earths and other trace elements be-tween sanidine and coexisting volcanic glass. Journal of Geophysical Research, 86:10193–10199.
Mahood, G. A. and Hildreth, E. W. (1983). Large partition coefficients for trace elements inhigh-silica rhyolites. Geochimica et Cosmochimica Acta, 47:11–30.
Nash, W. P. and Crecraft, H. R. (1985). Partition coefficients for trace elements in silicic mag-mas. Geochimica et Cosmochimica Acta, 49:2309–2322.
Pearce, J. G., Perkins, W. T., Westgate, J. A., Gorton, M. P., Jackson, S. E., Neal, C. R., andChenery, S. P. (1997). A compilation of new and published major and trace element data forNIST SRM 610 and NIST SRM 612 glass reference materials. Geostandards Newsletter,21(1):115–144.
Philpotts, A. R. (1990). Principles of igneous and metamorphic petrology. Prentice Hall, Lon-don.
84

ii
“thesis_report_old” — 2010/4/26 — 13:54 — page 85 — #96 ii
ii
ii
Philpotts, A. R. and Ague, J. J. (2009). Principles of igneous and metamorphic petrology.Cambridge University Press, 2nd edition.
Ponader, C. W. and Brown, C. E. (1989). Rare earth elements in silicate glass/melt systems: II.Interactions of La, Gd, and Yb with halogens. Geochimica et Cosmochimica Acta, 53:2905–2914.
Reed, M. J., Candela, P. A., and Piccoli, P. M. (2000). The distribution of rare earth elementsbetween monzogranitic melt and the aqueous volatile phase in experimental investigationsat 800◦C and 200 MPa. Contributions to Mineralogy and Petrology, 140:251–262.
Ren, M., Parker, D. F., and White, J. C. (2003). Partitioning of Sr, Ba, Rb, Y, and REE betweenplagioclase and peraluminous silicic magma. American Mineralogist, 88:1091–1103.
Schmidt, C. and Rickers, K. (2003). In-situ determination of mineral solubilities in fluids us-ing a hydrothermal diamond-anvil cell and SR-XRF: Solubility of AgCl in water. AmericanMineralogist, 88:288–292.
Schmidt, C., Rickers, K., Bilderback, D. H., and Huang, R. (2007). In situ synchrotron-radiationXRF study of REE phosphate dissolution in aqueous fluids to 800◦C. Lithos, 95:87–102.
Solé, V. A., Papillon, E., Cotte, M., Walter, P., and Susini, J. (2007). A multiplatform codefor the analysis of energy-dispersive X-Ray fluorescence spectra. Spectrochimica Acta, B62:63–68.
Stebbins, J. F. and Du, L.-S. (2002). Chloride ion sites in silicate and aluminosilicate glasses:A preliminary study by 35Cl solid-state NMR. American Mineralogist, 87:359–363.
Stix, J. and Gorton, M. P. (1990). Variations in trace element partition coefficients in sani-dine in the Cerro Toledo Rhyolite, Jemez Mountains, New Mexico - Effects of composition,temperature, and volatiles. Geochimica et Cosmochimica Acta, 54:2697–2708.
Streck, M. J. and Grunder, A. L. (1997). Compositional gradients and gaps in high-silicarhyolites of the Rattlesnake Tuff, Oregon. Journal of Petrology, 38(1):133–163.
Tagirov, B. R., Zotov, A. V., and Akinfiev, N. N. (1997). Experimental study of dissociation ofHCI from 350 to 500◦C and from 500 to 2500 bars: Thermodynamic properties of HCl◦(aq).Geochimica et Cosmochimica Acta, 61(20):4267–4280.
Tassinari, M. M. L., Kahn, H., and Ratti, G. (2001). Process mineralogy studies of CorregoDo Garimpo REE ore, Catalao-I alkaline complex, Goias, Brasil. Minerals Engineering,14(12):1609–1617.
Tuttle, O. F. and Bowen, N. L. (1958). Origin of granite in the light of experimental studies inthe system NaAlSi3O8−KAlSi3O8−SiO2−H2O. The Geological Society of America.
Webster, J. D. (1992a). Fluid-melt interactions involving Cl-rich granites: Experimental studyfrom 2 to 8 kbar. Geochimica et Cosmochimica Acta, 56:659–678.
85

ii
“thesis_report_old” — 2010/4/26 — 13:54 — page 86 — #97 ii
ii
ii
Chapter 4
Webster, J. D. (1992b). Water solubility and chlorine partitioning in Cl-rich granitic systems: Ef-fects of melt composition at 2 kbar and 800◦C. Geochimica et Cosmochimica Acta, 56:679–687.
Webster, J. D. and De Vivo, B. (2002). Experimental and modeled solubilities of chlorine inaluminosilicate melts, consequences of magma evolution, and implications for exsolution ofhydrous chloride melt at Mt. Somma-Vesuvius. American Mineralogist, 87:1046–1061.
Webster, J. D., Holloway, J. R., and Hervig, R. L. (1989). Partitioning of Lithophile trace el-ements between H2O and H2O+CO2 fluids and topaz rhyolite melt. Economic Geology,84:116–134.
Williams-Jones, A. E., Sampson, I. M., and Olivo, G. R. (2000). The genesis of hydrothermalfluorite-REE deposits in the Gallinas mountains, New Mexico. Economic Geology, 95:327–342.
Winter, J. D. (2001). An Introduction to Igneous and Metamorphic Petrology. Prentice Hall,New Jersey.
Wolf, A. V., Brown, M. G., and Prentiss, P. G. (1981). Concentrative properties of aqueous so-lutions: conversion tables. In: Weast, R.C. (Ed.), CRC Handbook of Chemisty and Physics,pages D198–D247. CRC Press.
Yamashita, S. (1999). Experimental study of the effect of temperature on water solubility innatural rhyolite melt to 100 MPa. Journal of Petrology, 40(10).
Zajacz, Z., Halter, W. E., Pettke, T., and Guillong, M. (2008). Determination of fluid/melt parti-tion coefficients by LA-ICPMS analysis of co-existing fluid and silicate melt inclusions: Con-trols on element partitioning. Geochimica et Cosmochimica Acta, 72:2169–2197.
86

ii
“thesis_report_old” — 2010/4/26 — 13:54 — page 87 — #98 ii
ii
ii
Appendix
Table 4.1: Composition of starting glasses from EMP analyses and normative composition based on the components albite, ortho-clase, quartz, corundum and Na-metasilicate.
SiO2 Al2O3 Na2O K2O ASI Ba La Y Yb normative - composition[wt.%] [wt.%] [wt.%] [wt.%] [ppm] [ppm] [ppm] [ppm]
quenched experiments - glasses doped with BaPerAlu2∗ 75.04 16.82 4.72 3.89 1.40 1739±74 Ab39.93Or22.98Qz32.70 + C4.85PerAlu1∗ 76.15 14.36 4.42 3.80 1.26 1995±121 Ab37.40Or22.45Qz35.89 + C2.98MetAlu1∗ 77.53 12.56 4.34 3.85 1.11 1957±90 Ab36.72Or22.75Qz37.55 + C1.25PerAlk2∗ 77.34 12.48 5.53 3.54 0.97 2138±84 Ab44.48Or20.92Qz32.95 + Ns0.54PerAlk1∗ 77.62 12.24 7.03 3.14 0.82 2067±84 Ab45.47Or18.55Qz32.73 + Ns3.26quenched experiments - glasses doped with La and YPerAlu2† 72.98 16.86 4.87 3.86 1.38 420±75 610±44 Ab41.80Or23.16Qz30.30 + C4.73PerAlu1† 77.26 14.50 4.30 3.94 1.28 1385±81 442±58 Ab36.37Or23.30Qz37.16 + C3.16MetAlu1† 78.68 12.67 4.04 3.85 1.17 1833±389 513±80 Ab34.46Or22.93Qz40.74 + C1.87PerAlk2† 79.21 12.65 5.00 3.47 1.06 993±81 413±63 Ab42.13Or20.44Qz36.74 + C0.67PerAlk1† 78.80 12.27 7.24 3.31 0.79 1182±85 907±98 Ab43.96Or19.23Qz32.99 + Ns3.81quenched experiments - glasses doped with La and YbPerAlu1? 75.83 14.17 4.53 3.91 1.21 1091±267 2050±276 Ab38.92Or23.46Qz35.08 + C2.53MetAlu1? 77.71 12.31 4.46 3.95 1.06 930±241 2002±253 Ab38.33Or23.69Qz37.25 + C0.72PerAlk2? 78.75 12.56 5.41 3.64 0.98 993±175 934±61 Ab44.19Or21.42Qz34.05 + Ns0.33PerAlk1? 79.18 12.37 7.45 3.38 0.78 1019±67 984±69 Ab43.73Or19.53Qz32.57 + Ns4.16
SiO2 Al2O3 Na2O K2O ASI Ba La Y Sm Eu normative - composition[wt.%] [wt.%] [wt.%] [wt.%] [ppm] [ppm] [ppm] [ppm] [ppm]
HDAC experiments - glasses doped with Ba, La, Y, Sm, and EuPerAlu2 72.89 18.44 5.17 3.5 1.50 1609±175 1681±136 1644±127 1526±196 1216±144 Ab43.74Or20.68Qz29.42 + C6.15MetAlu1 77.07 13.78 5.54 3.61 1.06 2247±215 792±130 1604±97 1636±150 1394±110 Ab46.87Or21.33Qz31.03 + C0.76Ab - albite, Or - orthoclase, Qz - quartz, C -corundum, Ns - Na2SiO3
Table 4.2: Data for Barium from experiments at 750◦C and 200 MPa using rapid quench autoclaves (RQ) and internally heatedpressure vessel (IHPV). For each run, the first line of the analyses refers to the quench glass and second line to the quenchedfluid.
experimental conditions analyses of run productsrun technique P T starting materials Na2O K2O SiO2 Al2O3 ASI Ba Cl
[MPa] [◦C] [melt / fluid] [wt.%] [wt.%] [wt.%] [wt.%] [ppm] [ppm]PerAlu2HB RQ 200 750 PerAlu2∗ 3.21 3.63 71.22 15.36 1.67 1960±99 bdl
H2O 0.01 0.03 0.44 bdl 7±1 naPerAlu1HB RQ 200 750 PerAlu1∗ 3.81 3.70 72.76 13.22 1.29 1891±102 bdl
H2O 0.03 0.05 0.58 bdl 9±1 naMetAlu1HB RQ 200 750 MetAlu1∗ 3.87 3.74 74.65 11.67 1.12 1792±71 bdl
H2O 0.04 0.05 0.58 bdl 8±1 naPerAlk2HB RQ 200 750 PerAlk2∗ 4.78 3.45 74.46 11.63 1.00 2008±37 bdl
H2O 0.06 0.04 0.48 bdl 6±1 naPerAlk1HB RQ 200 750 PerAlk1∗ 6.21 3.04 74.60 11.34 0.84 1954±80 bdl
H2O 0.07 0.05 0.54 bdl 7±1 naPerAlu2LB RQ 200 750 PerAlu2∗ 3.79 4.95 70.18 14.93 1.29 1642±81 1347±158
1H + 1S 1.41 1.39 0.02 bdl 138±1 25667±2567PerAlu1LB RQ 200 750 PerAlu1∗ 3.66 4.90 71.95 13.03 1.15 1376±70 1013±196
1H + 1S 2.28 2.07 0.17 bdl 222±1 55236±5524PerAluL3 EHPV 200 750 PerAlu1∗ 3.56 4.75 71.54 13.28 1.21 1457±86 1510±187
1H + 1S 2.78 2.61 bdl bdl 293±2 42908±4291MetAlu1LB RQ 200 750 MetAlu1∗ 3.44 4.89 73.26 11.51 1.05 1383±105 825±106
1H + 1S 2.56 2.40 0.16 bdl 254±1 47663±4766PerAlk2LB RQ 200 750 PerAlk2∗ 4.16 4.67 73.61 11.45 0.96 1885±61 1154±155
1H + 1S 2.95 2.52 0.02 bdl 104±1 51214±5121PerAlk1LB RQ 200 750 PerAlk1∗ 5.15 4.43 73.58 10.99 0.83 1919±77 1324±140
1H + 1S 3.00 2.24 0.37 bdl 37±1 47587±4759PerAlu2HP RQ 200 750 PerAlu2∗ 4.08 3.72 69.94 16.42 1.53 2055±128 bdl
H2O 0.04 0.02 0.32 bdl 1±0.1 naPerAlu1HP RQ 200 750 PerAlu1∗ 3.70 3.73 72.53 14.01 1.38 1929±96 bdl
H2O 0.02 0.01 0.04 bdl 1±0.2 naMetAlu1HP RQ 200 750 MetAlu1∗ 3.77 3.76 74.48 12.32 1.20 1765±112 bdl
H2O 0.04 0.01 0.03 bdl 1±0.1 naPerAlk2HP RQ 200 750 PerAlk2∗ 4.84 3.60 73.72 12.46 1.05 2108±162 bdl
H2O 0.04 0.02 0.01 bdl 1±0.1 naPerAlk1HP RQ 200 750 PerAlk1∗ 5.71 3.06 73.65 11.69 0.92 2045±104 bdl
H2O 0.19 0.12 0.21 bdl 2±0.1 naPerAlu2LPx RQ 200 750 PerAlu1∗ 3.99 5.18 70.27 14.84 1.22 568±102 1352±183
1H + 1S 2.18 2.01 0.04 bdl 189±1 42653±4265PerAlu1LP RQ 200 750 PerAlu1∗ 3.75 4.97 71.75 13.87 1.20 1570±119 695±190
1H + 1S 2.64 2.55 0.06 bdl 269±2 49472±4947MetAlu1LP RQ 200 750 MetAlu1∗ 3.49 4.83 73.10 12.25 1.12 1356±136 1921±234
1H + 1S 2.07 1.94 0.37 bdl 188±2 35687±3569PerAlk2LP RQ 200 750 PerAlk2∗ 4.18 4.71 72.91 12.26 1.02 1868±180 1224±150
1H + 1S 2.73 2.26 0.02 bdl 84±3 45388±4539PerAlk1LP RQ 200 750 PerAlk1∗ 5.14 4.53 72.39 11.68 0.87 1905±212 2044±196
1H + 1S 2.39 1.78 0.06 bdl 6±0.1 37389±3739PerAlu2HPi IHPV 200 750 PerAlu2∗ 3.38 3.69 70.36 15.78 1.65 586±141 bdl
H2O 0.04 0.02 0.05 bdl 2±0.1 naPerAlu1HPi IHPV 200 750 PerAlu1∗ 3.53 3.68 72.42 13.21 1.35 417±141 bdl
H2O 0.04 0.03 0.05 bdl 1±0.1 naMetAlu1HPi IHPV 200 750 MetAlu1∗ 3.45 3.73 73.99 11.67 1.20 463±151 bdl
H2O 0.04 0.01 0.07 bdl 3±0.1 naPerAlk2HPi IHPV 200 750 PerAlk2∗ 4.26 3.45 73.28 11.55 1.07 720±171 bdl
H2O 0.93 0.53 0.51 bdl 42±2 naPerAlk1HPi IHPV 200 750 PerAlk1∗ 5.64 3.10 73.37 11.14 0.88 703±83 bdl
H2O 0.14 0.04 0.15 bdl 4±0.1 naPerAlu2LPi IHPV 200 750 PerAlu2∗ 4.00 4.98 70.18 15.33 1.28 601±161 1165±141
1H + 1S 1.67 1.47 0.02 bdl 126±1 27761±2776PerAlu1LPi IHPV 200 750 PerAlu1∗ 3.73 4.89 72.51 13.18 1.15 400±127 995±130
1H + 1S 2.37 2.28 0.04 bdl 176±1 44388±4439MetAlu1LPi IHPV 200 750 MetAlu1∗ 3.49 4.86 74.39 11.67 1.06 336±146 796±125
1H + 1S 2.38 2.12 0.02 bdl 173±1 40393±4039
87

ii
“thesis_report_old” — 2010/4/26 — 13:54 — page 88 — #99 ii
ii
ii
Chapter 4
Table 4.2 – continued from previous pageexperimental conditions analyses of run products
run technique P T starting materials Na2O K2O SiO2 Al2O3 ASI Ba Cl[MPa] [◦C] [melt / fluid] [wt.%] [wt.%] [wt.%] [wt.%] [ppm] [ppm]
PerAlk2LPi IHPV 200 750 PerAlk2∗ 3.79 4.63 73.58 11.48 1.02 667±148 962±1211H + 1S 1.97 1.60 0.02 bdl 50±4 28225±2823
PerAlk1LPi IHPV 200 750 PerAlk1∗ 4.76 4.31 72.58 11.03 0.88 677±138 1314±1281H + 1S 1.98 1.29 0.03 bdl 6±1 23892±2389
MetAlu1HPi2 IHPV 200 750 MetAlu1∗ 3.44 4.00 74.73 11.73 1.17 412±162 bdlH2O 0.08 0.04 0.02 bdl 1±0.1 na
MetAlu1LPi2 IHPV 200 750 MetAlu1∗ 3.47 4.86 73.93 11.75 1.07 367±114 753±61H + 1S 2.85 2.68 0.02 bdl 200±2 51572±5157
∗ − initial glass composition as described in Tab.4.1na− not analysedbdl− below detection limit1H− 1m NaCl, 1S− 1m KClASI− Al2O3 /(Na2O+K2O) in moles
Table 4.3: Data for Lanthanum, Yttrium and Ytterbium from experiments from 750 to 950◦C and 200 or 500 MPa using variousquench apparatus. For each run, the first line of the analyses refers to the quench glass and second line to the quenched fluid.
experimental conditions analyses of run productsrun tech. P T starting materials Na2O K2O SiO2 Al2O3 ASI La Y Yb Cl
[MPa] [◦C] [melt / fluid] [wt.%] [wt.%] [wt.%] [wt.%] [ppm] [ppm] [ppm] [ppm]A1 EHPV 200 750 PerAlu1? 3.55 4.80 71.38 13.26 1.20 893±79 1180±189 na
1H + 1S (pH 1) 3.03 2.48 bdl bdl 113±1 26±1 naA2 EHPV 200 750 MetAlu1? 3.42 4.91 73.43 11.63 1.06 595±99 582±116 na
1H + 1S (pH 1) 2.13 1.82 bdl bdl 8±1 4±1 naA4 EHPV 200 750 PerAlk2? 3.58 4.79 73.10 11.56 1.04 987±75 1080±71 na
1H + 1S (pH 1) 2.69 2.08 bdl bdl 4±1 3±1 naA3 EHPV 200 750 PerAlk1? 5.48 4.61 70.89 11.03 0.79 973±82 964±68 na
1H + 1S (pH 1) 2.57 1.66 bdl bdl 4±1 3±1 naB1 EHPV 200 750 PerAlu1† 3.37 5.06 71.42 13.02 1.18 997±131 406±44 na
1H + 1S (pH 1) 2.65 2.37 bdl bdl 106±1 28±1 naB2 EHPV 200 750 MetAlu1† 3.34 5.03 73.83 11.73 1.07 354±65 27±31 na
1H + 1S (pH 1) 2.12 1.75 bdl bdl 9±1 3±1 naB4 EHPV 200 750 PerAlk2† 3.97 4.77 73.44 11.63 0.99 1023±64 614±58 na
1H + 1S (pH 1) 2.62 2.01 bdl bdl 1±1 1±1 naC1 EHPV 200 750 PerAlu? 3.27 4.88 72.83 13.31 1.25 817±105 1337±136 na
1H + 1S 2.32 1.92 bdl bdl 82±1 19±1 naC2 EHPV 200 750 MetAlu1? 3.15 4.82 74.16 11.73 1.13 467±76 834±61 na
1H + 1S 2.52 2.30 bdl bdl 2±1 bdl naC3 EHPV 200 750 PerAlk1? 5.96 4.72 72.79 11.27 0.76 1000±108 953±110 na
1H + 1S 3.24 2.18 bdl bdl 2±1 bdl naD1 EHPV 200 750 PerAlu1† 3.36 4.99 72.48 13.21 1.21 1152±79 550±55 na
1H + 1S 2.20 1.95 bdl bdl 82±1 21±1 naD3 EHPV 200 750 PerAlk1† 4.96 4.67 71.75 10.91 0.83 1117±65 726±75 na
1H + 1S 3.06 2.17 bdl bdl 1±1 1±1 naA1 RQ 200 750 PerAlu1? 3.59 5.02 72.43 13.12 1.16 829±176 1708±131 1210±102
1H + 1S (pH 1) 1.98 1.87 0.01 0.002 17±2 7±1 40667±4070A2 RQ 200 750 MetAlu1? 3.24 4.95 73.73 11.37 1.06 274±113 446±145 704±83
1H + 1S (pH 1) 2.16 1.79 bdl bdl bdl bdl 41532±4150A3 RQ 200 750 PerAlk1? 5.60 4.57 69.78 11.07 0.78 900±55 882±91 2140±321
1H + 1S (pH 1) 3.12 2.31 0.03 0.003 bdl bdl 65364±6536B0 RQ 200 750 PerAlu2† 3.97 5.00 68.81 15.42 1.29 805±62 544±18 1896±211
1H + 1S (pH 1) 2.71 2.51 0.001 bdl 106±1 38±1 54870±5487B1 RQ 200 750 PerAlu1† 3.62 5.09 73.04 13.22 1.15 748±170 447±54 1128±114
1H + 1S (pH 1) 1.81 1.69 0.06 0.002 11±1 3±1 38189±3820B2 RQ 200 750 MetAlu1† 3.50 5.00 75.00 11.84 1.06 279±123 bdl 871±91
1H + 1S (pH 1) 1.88 1.72 bdl bdl bdl bdl 37413±3741B4 RQ 200 750 PerAlk2† 4.07 4.52 72.79 11.48 0.99 1255±120 495±101 1434±199
1H + 1S (pH 1) 2.55 1.98 bdl bdl bdl bdl 48295±4830B3 RQ 200 750 PerAlk1† 5.36 4.82 70.67 11.00 0.82 1031±70 771±49 1697±248
1H + 1S (pH 1) 2.16 1.41 0.02 bdl bdl bdl 36123±3612C1 RQ 200 750 PerAlu1? 3.65 5.10 67.67 12.80 1.11 617±160 1530±161 986±201
1H + 1S 1.50 1.51 0.04 0.001 40±4 9±1 33070±3307C2 RQ 200 750 MetAlu1? 3.41 5.09 74.18 11.70 1.05 507±137 1226±273 976±94
1H + 1S 3.72 2.70 0.03 0.002 bdl bdl 63235±6324C4 RQ 200 750 PerAlk2? 3.94 4.71 73.95 11.44 0.99 1062±39 921±97 1242±208
1H + 1S 3.20 2.42 0.06 0.02 bdl bdl 64190±6419C3 RQ 200 750 PerAlk1? 5.85 4.45 70.32 10.93 0.76 946±71 978±63 2009±271
1H + 1S 3.09 2.14 0.04 bdl bdl bdl 57054±5705D0 RQ 200 750 PerAlu2† 3.77 4.74 68.44 15.01 1.32 695±44 582±40 1454±175
1H + 1S 2.63 2.29 0.007 bdl 88±2 33±1 56660±5670D1 RQ 200 750 PerAlu1† 3.51 5.00 72.59 13.09 1.17 622±101 364±64 986±133
1H + 1S 1.64 1.48 0.02 bdl 23±2 5±1 33500±3350D2 RQ 200 750 MetAlu1† 3.34 4.91 74.37 11.59 1.07 557±143 153±69 693±91
1H + 1S 2.21 2.00 0.1 0.001 bdl bdl 42808±4281D4 RQ 200 750 PerAlk2† 4.22 4.62 73.83 11.52 0.96 1054±79 559±99 1196±360
1H + 1S 3.36 2.57 0.001 0.004 bdl bdl 49205±4921D3 RQ 200 750 PerAlk1† 5.27 4.69 70.99 11.09 0.81 1077±70 730±35 1462±199
1H + 1S 4.44 3.26 0.04 bdl bdl bdl 79318±7932E1‡ IHPV 500 750 PerAlu1? 3.39 4.52 69.90 14.52 1.39 1127±70 634±74 bdl
1H + 1S (pH 1) 2.79 2.19 na na 20±1 5±1 naF1‡ IHPV 500 750 PerAlu1? 3.23 4.36 69.28 14.27 1.42 1086±84 688±163 bdl
1H + 1S 1.75 1.37 na na 10±1 3±1 naA1 IHPV 200 850 PerAlu1? 3.70 4.86 72.05 13.34 1.18 943±24 1240±79 1961±191
1H + 1S (pH 1) 2.79 2.45 0.06 0.02 104±2 38±1 54088±5409A2 IHPV 200 850 MetAlu1? 3.53 4.81 72.46 11.98 1.09 713±84 1168±110 1407±225
1H + 1S (pH 1) 2.31 2.23 0.01 bdl 5±1 bdl 48667±4867A4 IHPV 200 850 PerAlk2? 4.22 4.66 71.79 11.61 0.97 895±50 937±76 1655±251
1H + 1S (pH 1) 2.94 2.48 bdl bdl bdl bdl 56387±5639A3 IHPV 200 850 PerAlk1? 5.79 4.49 70.67 11.07 0.77 951±57 963±78 2814±402
1H + 1S (pH 1) 0.97 0.74 0.01 bdl bdl bdl 59564±5956V9 IHPV 200 950 PerAlu1† 4.02 5.01 71.92 13.50 1.12 1042±38 571±26 2492±333
1H + 1S (pH 1) 3.00 2.89 bdl bdl 96±1 22±1 59609±5961V10 IHPV 200 950 MetAlu1† 3.68 4.58 72.33 11.81 1.07 1003±36 612±58 2238±546
1H + 1S (pH 1) 3.2 73.16 bdl bdl 22±1 2±1 60299±6030
88

ii
“thesis_report_old” — 2010/4/26 — 13:54 — page 89 — #100 ii
ii
ii
Table 4.3 - continued from previous pageexperimental conditions analyses of run products
run tech. P T starting materials Na2O K2O SiO2 Al2O3 ASI La Y Yb Clp0.1cm [MPa] [◦C] [melt / fluid] [wt.%] [wt.%] [wt.%] [wt.%] [ppm] [ppm] [ppm] [ppm]V12 IHPV 200 950 PerAlk2† 4.43 4.58 70.66 11.66 0.95 1035±34 574±33 2235±349
1H + 1S (pH 1) 3.19 2.63 bdl bdl bdl bdl 46958±4696V11 IHPV 200 950 PerAlk1† 5.72 4.72 71.47 11.17 0.77 1075±46 812±36 3862±233
1H + 1S (pH 1) 3.55 2.71 0.03 bdl bdl bdl 46774±4677V19 IHPV 500 850 PerAlu1† 3.12 4.37 69.70 13.42 1.36 1046±37 560±24 710±248
1H + 1S (pH 1) 3.45 3.22 0.003 0.004 20±1 2±1 53393±5339V20 IHPV 500 850 MetAlu1† 3.12 4.33 72.78 12.08 1.23 735±46 400±54 610±337
1H + 1S (pH 1) 3.06 2.82 0.002 0.004 8±1 bdl 48129±4813
? /† − initial glass composition as described in Tab.4.1na− not analysedbdl− below detection limit1H− 1m NaCl, 1S− 1m KCl‡ − experiments done at Institut für Mineralogie, Leibniz Universität HannoverASI− Al2O3 /(Na2O+K2O) in moles
Table 4.4: Experimentally determined fluid–melt partition coefficients of Na, K, Ba, Cl. and DK/DNa .
experimental conditions Fluid−melt partition coefficientsrun P T ASI DNa DK DK/DNa DBa DCl
[MPa] [◦C]PerAlu2HB? 200 750 1.67 0.004 0.009 2.27 0.003±0.0002 ncPerAlu1HB? 200 750 1.29 0.008 0.01 1.62 0.005±0.0003 ncMetAlu1HB? 200 750 1.12 0.01 0.01 1.37 0.005±0.0002 ncPerAlk2HB? 200 750 1.00 0.01 0.01 0.83 0.003±0.0001 ncPerAlk1HB? 200 750 0.84 0.01 0.02 1.45 0.003±0.0001 ncPerAlu2LB 200 750 1.29 0.37 0.28 0.75 0.08±0.004 19±3PerAlu1LB 200 750 1.15 0.76 0.53 0.70 0.16±0.008 55±12PerAluL3 200 750 1.21 0.64 0.44 0.68 0.20±0.01 28±5
MetAlu1LB 200 750 1.05 0.75 0.49 0.66 0.18±0.01 58±9PerAlk2LB 200 750 0.96 0.71 0.54 0.76 0.06±0.002 44±7PerAlk1LB 200 750 0.83 0.58 0.51 0.87 0.002±0.001 36±5
PerAlu2HP? 200 750 1.53 0.01 0.004 0.39 0.0003±0.0001 ncPerAlu1HP? 200 750 1.38 0.004 0.001 0.37 0.0003±0.0001 ncMetAlu1HP? 200 750 1.20 0.01 0.003 0.27 0.0003±0.0001 ncPerAlk2HP? 200 750 1.05 0.01 0.005 0.61 0.0003±0.0001 ncPerAlk1HP? 200 750 0.92 0.03 0.04 1.14 0.001±0.0001 ncPerAlu2LPx 200 750 1.22 0.55 0.39 0.71 0.33±0.06 32±5PerAlu1LP 200 750 1.20 0.70 0.51 0.73 0.17±0.01 71±21MetAlu1LP 200 750 1.12 0.59 0.40 0.68 0.14±0.01 19±3PerAlk2LP 200 750 1.02 0.65 0.48 0.73 0.05±0.003 37±6PerAlk1LP 200 750 0.87 0.47 0.39 0.84 0.003±0.0001 18±3
PerAlu2HPi? 200 750 1.65 0.01 0.02 0.55 0.003±0.001 ncPerAlu1HPi? 200 750 1.35 0.01 0.03 0.59 0.003±0.001 ncMetAlu1HPi? 200 750 1.20 0.01 0.01 0.26 0.006±0.002 ncPerAlk2HPi? 200 750 1.07 0.22 0.53 0.69 0.06±0.01 ncPerAlk1HPi? 200 750 0.88 0.03 0.04 0.45 0.006±0.001 ncPerAlu2LPi 200 750 1.28 0.42 0.29 0.70 0.21±0.06 24±4PerAlu1LPi 200 750 1.15 0.64 0.47 0.73 0.44±0.14 45±7MetAlu1LPi 200 750 1.06 0.68 0.44 0.64 0.52±0.22 51±9PerAlk2LPi 200 750 1.02 0.52 0.35 0.67 0.08±0.02 29±5PerAlk1LPi 200 750 0.88 0.42 0.30 0.72 0.01±0.002 18±3
MetAlu1HPi2? 200 750 1.17 0.02 0.01 0.51 0.004±0.001 ncMetAlu1LPi2 200 750 1.07 0.82 0.55 0.67 0.55±0.17 68±7
nc− not calculated because element concentration in the fluid was below detection limit or was not analyzedASI − Al2O3/(Na2O + K2O) in moles? - experiments using H2O as starting fluid
Table 4.5: Experimentally determined fluid–melt partition coefficients of Na, K, La, Yb, Y, Cl. and DK/DNa .
experimental conditions Fluid−melt partition coefficientsrun technique P T ASI DNa DK DK/DNa DLa DY DYb DCl
[MPa] [◦C]A1 EHPV 200 750 1.20 0.85 0.52 0.60±0.03 0.13±0.01 0.02±0.003 ncA2 EHPV 200 750 1.06 0.62 0.37 0.60±0.03 0.013±0.002 0.006±0.001 ncA4 EHPV 200 750 1.04 0.75 0.43 0.58±0.03 0.004±0.001 0.003±0.0004 ncA3 EHPV 200 750 0.79 0.47 0.36 0.77±0.04 0.004±0.001 0.003±0.0008 ncB1 EHPV 200 750 1.18 0.79 0.47 0.60±0.06 0.11±0.01 0.07±0.007 ncB2 EHPV 200 750 1.07 0.63 0.35 0.55±0.05 0.026±0.005 0.10±0.10 ncB4 EHPV 200 750 0.99 0.66 0.42 0.64±0.04 0.0002±0.00002 0.002±0.0002 ncC1 EHPV 200 750 1.25 0.71 0.39 0.55±0.03 0.10±0.01 0.01±0.001 ncC2 EHPV 200 750 1.13 0.80 0.48 0.60±0.04 0.004±0.001 nc ncC3 EHPV 200 750 0.76 0.54 0.46 0.85±0.03 0.002±0.0003 nc ncD1 EHPV 200 750 1.21 0.66 0.39 0.60±0.03 0.07±0.005 0.04±0.004 ncD3 EHPV 200 750 0.83 0.62 0.46 0.75±0.04 0.001±0.0003 0.002±0.0007 ncA1 RQ 200 750 1.16 0.55 0.37 0.67±0.10 0.02±0.005 0.004±0.0005 34±4B0 RQ 200 750 1.29 0.68 0.50 0.73±0.15 0.13±0.01 0.07±0.003 29±4B1 RQ 200 750 1.15 0.50 0.33 0.67±0.11 0.015±0.004 0.006±0.001 34±5C1 RQ 200 750 1.11 0.41 0.30 0.71±0.11 0.06±0.02 0.06±0.001 34±8D0 RQ 200 750 1.32 0.70 0.48 0.69±0.05 0.13±0.01 0.06±0.004 39±6D1 RQ 200 750 1.17 0.47 0.30 0.63±0.09 0.04±0.007 0.01±0.003 34±6
E1‡ IHPV 500 750 1.39 0.82 0.48 0.59±0.05 0.017±0.001 nc ncF1‡ IHPV 500 750 1.42 0.54 0.31 0.58±0.04 0.01±0.001 nc ncA1 IHPV 200 850 1.18 0.76 0.50 0.67±0.03 0.13±0.006 nc 28±3A2 IHPV 200 850 1.09 0.66 0.46 0.71±0.04 0.007±0.001 nc 35±6V9 IHPV 200 950 1.12 0.75 0.58 0.77±0.03 0.09±0.003 nc 24±3
V10 IHPV 200 950 1.07 0.89 0.69 0.78±0.04 0.02±0.001 nc 27±7V19 IHPV 500 850 1.36 1.10 0.74 0.67±0.04 0.02±0.001 nc 75±26V20 IHPV 500 850 1.23 0.98 0.65 0.66±0.04 0.01±0.001 nc 79±44
nc−not calculated because element concentration in the fluid was below detection limit or was not analyzedASI − Al2O3/(Na2O + K2O) in moles?−experiments using H2O as starting fluid‡−experiments done at Institut für Mineralogie, Leibniz Universität Hannover
89

ii
“thesis_report_old” — 2010/4/26 — 13:54 — page 90 — #101 ii
ii
ii
Chapter 4
Table 4.6: Experimental conditions and results of the HDAC experiments fat 750◦C. Concentrations of Ba, La and Y in the fluidwere analysed in-situ using SR-µXRF, the glasses were analysed after quench using EMP.
sample A B C D E F G HCell HDACG HDAC2 HDAC2 HDACG HDACG HDAC2 HDACG HDAC2initial glass composition† PerAlu PerAlu MetAlu PerAlu MetAlu MetAlu PerAlu MetAluPexpatTexp =750◦C [MPa] 830 900 250 500 700 750 200 300m (NaCl + KCl) 6 4.1 1.5 0 6 1.7 2.4 6m HCl 0.06 0.04 0.01 0 0.06 0.01 0.02 0.06wt.% (NaCl + KCl) 26 19.3 8 0 26 9 12.1 26wt.% glass (initial) 23 25 28 29 29 35 30 33ρfluid [g/cm3 ] 1.06 0.991 0.621 0.712 0.985 0.903 0.588 0.848Tm [◦C] -0.3 -12.8 -4.4 − -3.1? -5.0 -7.05 13.2?
TH [◦C] 216 218 391 289 288 234 443 419cfBa [ppm] 292±42 313±4102 60±6 49±4 363±22 116±34 224±33 365±33cmBa [ppm] 963±156 1389±161 1940±98 1813±123 459±116 1883±304 1841±134 1091±134
cfLa [ppm] 62±9 50±6 bdl 17±13 52±9 22±6 41±10 19±6cmLa [ppm] 540±217 396±61 408±340 569±76 426±74 336±120 937±91 726±147
cfY [ppm] 30±30 25±25 22±22 20±20 39±30 25±25 33±30 22±22cmY [ppm] 320±23 59±39 bdl 188±23 bdl 100±19 706±78 246±108
Df/mBa 0.30±0.06 0.23±0.08 0.03±0.003 0.03±0.003 0.79±0.21 0.06±0.02 0.12±0.02 0.33±0.05
Df/mLa 0.11±0.05 0.13±0.02 nc 0.03±0.02 0.12±0.03 0.07±0.03 0.04±0.01 0.03±0.01
Df/mY 0.09±0.09 0.43±0.51 nc 0.11±0.11 nc 0.25±0.25 0.05±0.04 0.09±0.1
wt.% SiO2 63.58 61.99 70.60 67.16 67.58 68.88 63.44 70.06wt.% Al2O3 17.21 16.58 13.04 16.58 13.90 13.28 15.90 12.83wt.% Na2O 4.04 3.52 3.59 4.92 2.95 3.09 5.63 3.07wt.% K2O 8.37 8.29 6.72 4.00 7.56 7.01 7.78 7.49ASI 1.10 1.12 0.99 1.33 1.07 1.05 0.90 0.97
†−initial glass composition as described in Tab. 4.1m−molalityTm−freezing point depression determined by cryometryTH−Homogenisation temperature measured after collection of XRF spectra at Texp=750◦Cf − fluid,m − melt? − melting point of Hydrohalitebdl− below detection limitnc− not calculatedASI − Al2O3/(Na2O + K2O) in moles
90

ii
“thesis_report_old” — 2010/4/26 — 13:54 — page 91 — #102 ii
ii
ii

ii
“thesis_report_old” — 2010/4/26 — 13:54 — page 92 — #103 ii
ii
ii
Chapter 5
Discussion and conclusions
The goal of this thesis was the experimental investigation of the partitioning of petrogenetiallyimportant trace elements between aqueous fluids and silicate melts over a wide range of PTxconditions. This resulted in a comprehensive dataset of fluid−melt partition coefficients par-ticularly for Rb, Sr, and Ba, and in addition for La, Y, and Yb. An essential part of this thesiswas utilization of different experimental approaches to evaluate their applicability to fluid−meltpartitioning experiments. The presented partition coefficients are always based on analysesof both, fluid and melt. In all experiments, the composition of the melt was measured afterquenching using EMP analysis. In the case of quenched experiments, the fluid was analyzedafter quenching using ICP-OES and IC. In the in-situ approach, the trace element content ofthe fluid was determined directly at elevated PT conditions using SR-µXRF.
The results of this study on fluid−melt partitioning of Rb, Sr, Ba, La, Yb, and Y can besummarized in the following five points. (1) These trace elements show a preference for themelt (Df/m < 1) at all studied conditions. (2) The Df/m of these elements are up to two ordersof magnitude higher in experiments using chloridic solutions compared to experiments withH2O as starting solution. (3) For chloridic fluids, partition coefficients of Sr, Ba, La, Y, andYb show a clear dependence on the melt composition expressed as ASI. The Df/m of theseelements are distinctly lower for peralkaline melt than for peraluminous melts. (4) Partitioncoefficients obtained from quenched experiments display quench rate−related differences. (5)For H2O as starting solution, distinctly higher fluid−melt partitioning data were obtained in thecases of in-situ experiments compared to those from comparable quench runs. In the followingparagraphs, I will discuss the results of this thesis with regard to the effects of different exper-imental and analytical techniques, quench rates, pressure, temperature, salinity of the fluidand melt composition on fluid−melt partition coefficients. Then, I will compare the results toliterature data. This includes a short discussion of the differences in the light of experimentaldifficulties. Furthermore, I will discuss the consequences for the trace element signature ofgranitic melts and exsolved magmatic fluids.
1. Effect of experimental and analytical method (in-situ vs. quench):A major goal of this thesis consisted in the refinement an existing method to measuretrace element contents in an aqueous fluid equilibrated with silicate melt directly at ele-vated pressures and temperatures. The presented manuscripts show that this objective
92

ii
“thesis_report_old” — 2010/4/26 — 13:54 — page 93 — #104 ii
ii
ii
Discussion and conclusions
was successfully attained. An important advantage of the in-situ approach consists inthe direct observation of the kinetics of trace element equilibration between aqueousfluid and coexisting silicate melt. At present, no other experimental technique can pro-vide such data on trace element behavior in fluid−melt systems. The data presented inChapter 2 clearly demonstrate that the equilibration between aqueous fluid and melt israpid and can therefore affect partition coefficients obtained in quenched experiments.The comparison of partition coefficients obtained with different experimental and ana-lytical methods shows distinctly higher Df/m, particularly for non-chloridic solutions, ifin-situ analysis of the aqueous fluid was used. Back reactions between fluid and meltupon cooling were identified as one cause of these differences. In the case of Cl-bearingsolutions, partition coefficients from both methods are in fairly good agreement. This islikely due to the higher trace element concentrations which make the effect of back reac-tions less significant.
Nevertheless, the here determined "in-situ partition coefficients" are still not trulyin-situ because the melt had to be analyzed after quench. The equilibration experimentspresented in Chapter 2 clearly show that back reactions between aqueous fluids andsilicate melts occur. Rubidium concentrations in the aqueous fluid slightly decrease withdecreasing temperature and pressure, whereas Sr contents increase at the same time.Thus, obtained in-situ fluid−melt partition coefficients of Rb represent minimum values,and Df/m
Sr are maximum values. As stated in the previous paragraph, these partition co-efficients should be considerably closer to the true value and more reliable than mostpartition coefficients based only on analyses after quench. For chloridic fluids, one canreasonably assume that the "in-situ fluid−melt partition coefficients" are do not deviatemuch from the true value because the observed changes of trace element concentrationsin the aqueous fluid upon cooling were relatively small.
2. Quench rate−related differences:Quenched experiments were performed in hydrothermal autoclaves with rapid and slowquench rates. The results presented in Chapters 3 and 4 show that quench rates affectpartition coefficients of the studied trace elements. For experiments with H2O as startingfluid, the comparison between rapidly and slowly quenched experiments reveals distinctdifferences. For example, rapidly quenched fluids contain up to 20 times more Rb andhave Sr concentrations below the limit of detection compared to slowly quenched solu-tions. In the case of Cl-bearing fluids and peralkaline melts, rapid-quenched experimentsyield, likewise, much lower Sr concentrations in the fluid. The effect of the back reactionsis more obvious at low trace element concentrations in the fluid. For higher trace elementcontents in the fluid, concentration shifts due to re-equilibration remain within error. Allin all, these findings can be explained with fast re-equilibration between melt and fluidupon cooling and are thus consistent with the observations made for Rb and Sr usingthe in-situ approach.
3. Effects of temperature and pressure:Quenched experiments were performed at 750, 850, and 950◦C and 200 or 500 MPa.In this PT range, obtained fluid−melt partition coefficients of all studied trace elements
93

ii
“thesis_report_old” — 2010/4/26 — 13:54 — page 94 — #105 ii
ii
ii
Chapter 5
show only small or indiscernible variation. Therefore, it can be concluded that temper-ature and pressure have no strong effect on fluid−melt partitioning of the studied traceelements. This result is likely due the fact that these PT conditions are well below that ofthe critical curve for haplogranite-water. That is, they are located at the steep portions ofthe solvus, where compositions of the coexisting phases change little with P and T. Thisinterpretation is supported by in-situ experiments performed at 750◦C and pressures upto 1 GPa. In these experiments, fluid−melt partition coefficients increase slightly withpressure, at least in the case of Rb and Sr. This behavior correlates with the increasedsolubility of melt in the aqueous fluid, which results in a smaller chemical contrast be-tween the phases. This also suggests that trace elements form significant amounts ofcomplexes with melt components in the aqueous phase at higher pressures.
4. Effect of fluid composition:For all studied elements, fluid−melt partition coefficients obtained from experiments withCl-bearing solutions are one to two orders of magnitude higher than those at comparableconditions using H2O as starting fluid. The results of the in-situ experiments also indi-cate that partition coefficients, at least of Rb, Sr, Ba, and La, increase slightly with theinitial salinity of the aqueous fluid. This finding is confirmed by results of additionally per-formed experiments in the system albite-quartz (Appendix A). Here, fluid−melt partitioncoefficients of Rb and Sr increase slightly and linearly with initial salinity of the fluid tomaximum values of 0.4 at initial NaCl concentrations in the fluid of 3 or 4 m. Therefore,the data presented here underscore the key role of the Cl− activity for the partitioning ofmost trace elements between aqueous fluids and silicate melts. For the studies trace el-ements, one can reasonably assume that the presence of Cl− will result in the formationof significant amounts of chlorine complexes in the fluid. At higher salinities, however,the observed changes in the partitioning coefficients with Cl− concentration are oftensmaller than reported in the literature, i.e., the studied trace elements still preferred themelt.
5. Effect of melt composition:The results presented in Chapter 3 and 4 point to a strong effect of melt composition onfluid−melt partitioning of Sr, Ba, La, Yb, and Y. In experiments with chloridic solutions,partition coefficients of these elements show a distinct increase with the ASI of the melt.This dependence on melt composition is either related to changes in the speciation inthe aqueous fluid, or to changes in the incorporation of these elements in the melt, or toboth factors. Dissolution of peralkaline melt in aqueous fluids will result in an enhancedrelease of Na+ and K+ into the fluid compared to the release from peraluminous melts.Therefore, the activities of Cl− and OH− will decrease more strongly in fluids equilibratedwith peralkaline melts. Thus, less Cl− and OH− is available in these fluids to form com-plexes with Sr, Ba, La, Yb, and Y. This explanation is supported by the basic quench pHof the fluids in experiments with peralkaline melts reported in Chapter 3. Because of theincreasing ion association with temperature, the basic quench pH implies the presenceof significant quantities of NaOH0 and KOH0 complexes in the fluid at the run conditions.
94

ii
“thesis_report_old” — 2010/4/26 — 13:54 — page 95 — #106 ii
ii
ii
Discussion and conclusions
In conclusion, this thesis presents the first systematic dataset for Rb, Sr, Ba, La, Yb, and Ypartitioning between aqueous fluid and haplogranitic melt as function of fluid and melt compo-sition, temperature, and pressure. All investigated trace elements show a preference for themelt over the studied PTx range, independent of the experimental and analytical techniqueeven at high salinities. This finding differs from many other experimental studies, e.g., Websteret al. (1989), Bai and Koster van Groos (1999), Reed et al. (2000) who report a preference forthe fluid particularly at higher salinities. The deviations of the results of this thesis from thoseof other experimental studies are probably mostly related to different analytical methods, par-ticularly for the determination of the element content in the fluid. The sampling and analysis ofthe quenched fluid is the most difficult part because of large intrinsic uncertainties caused by,e.g., back reactions between fluid and melt, the tendency of fluid to unmix, or precipitation ofsolutes during cooling. Moreover, the fluid amount is small in these experiments. Therefore,a small contamination from tiny crystals or melt droplets due to incomplete separation beforeanalysis can result in much too high element concentrations in the aqueous fluid particularlyfor trace elements. The determination of trace elements contents in the fluid via mass bal-ance (Webster et al., 1989) is also associated with substantial errors, because this approachrequires modeling of undetermined parameters, e.g., H2O solubility in the silicate melt anddissolution of melt components in the aqueous fluid. In addition, this method requires a veryaccurate determination of trace element contents in the initial glass as well as in the quenchedmelt because otherwise, small trace element contents in the fluid cannot be calculated withoutsignificant errors. Finally, the mass balance method does not include additional phases thatmight form in the fluid during the experiment, but such phases can incorporate large amountsof the studied trace elements an will lead to an overestimation of partition coefficients.
The presented fluid−melt partition coefficients of Rb and Y are in good agreement withdata from natural cogenetic fluid and melt inclusions (e.g., Audétat and Pettke, 2003, Rickerset al., 2006, Zajacz et al., 2008, Audétat et al., 2008). For Sr, Ba, La, and Yb, data from naturalsamples are either not available or are associated with large errors due to concentrations inthe fluid that are close to or below the detection limit. A probable explanation for this is thatSr and Ba strongly partition into granite forming minerals, and that the rare earth elementsfractionate into accessory phases, e.g., monazite during progressive crystallization. Modelingof the behavior of Sr during the evolution of a granitic system shows that the fractionation ofstrontium between chloridic fluids and aluminous melts is weaker than the fractionation be-tween feldspars and melts (Chapter 3). That is, crystallization of Sr-bearing minerals will resultin a depletion of Sr in the residual melt. Barium and strontium are divalent large-ion lithophileelements, and thus, show a geochemically similar behavior also with regard to fluid−melt par-titioning (cp. Chapters 3 and 4). In contrast to Sr, barium also substitutes for potassium inmicas. Therefore, one can reasonably assume a similar or even stronger effect of progressivegranite crystallization on barium concentrations in the residual melt. In addition, the weightfraction of exsolved aqueous fluids is generally small in granites (2 to 3 wt.%). Therefore, theconcentration of divalent LILE in residual granitic melts is mainly controlled by the abundanceof and LILE incorporation into crystallizing phases. The obtained fluid−melt partition coeffi-cients of divalent LILE are strongly affected by the composition of the silicate melt. Aqueousfluids reacting with peralkaline silicate melts have little ability to alter divalent LILE concentra-
95
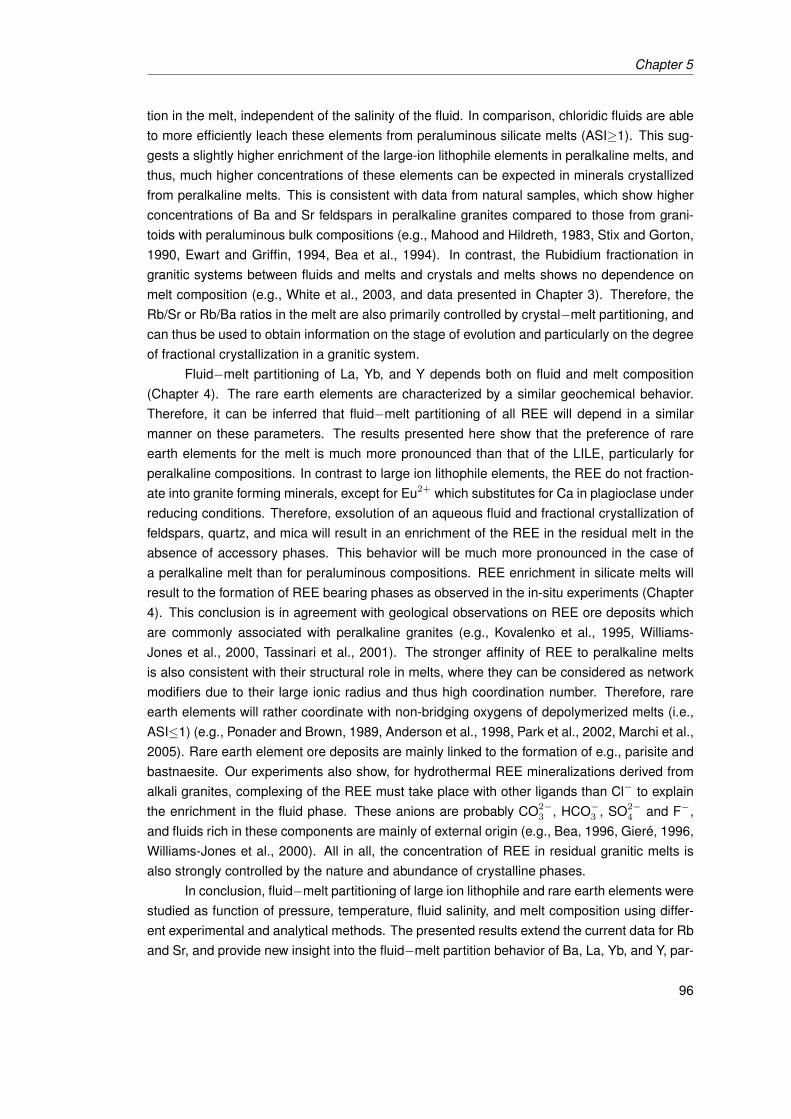
ii
“thesis_report_old” — 2010/4/26 — 13:54 — page 96 — #107 ii
ii
ii
Chapter 5
tion in the melt, independent of the salinity of the fluid. In comparison, chloridic fluids are ableto more efficiently leach these elements from peraluminous silicate melts (ASI≥1). This sug-gests a slightly higher enrichment of the large-ion lithophile elements in peralkaline melts, andthus, much higher concentrations of these elements can be expected in minerals crystallizedfrom peralkaline melts. This is consistent with data from natural samples, which show higherconcentrations of Ba and Sr feldspars in peralkaline granites compared to those from grani-toids with peraluminous bulk compositions (e.g., Mahood and Hildreth, 1983, Stix and Gorton,1990, Ewart and Griffin, 1994, Bea et al., 1994). In contrast, the Rubidium fractionation ingranitic systems between fluids and melts and crystals and melts shows no dependence onmelt composition (e.g., White et al., 2003, and data presented in Chapter 3). Therefore, theRb/Sr or Rb/Ba ratios in the melt are also primarily controlled by crystal−melt partitioning, andcan thus be used to obtain information on the stage of evolution and particularly on the degreeof fractional crystallization in a granitic system.
Fluid−melt partitioning of La, Yb, and Y depends both on fluid and melt composition(Chapter 4). The rare earth elements are characterized by a similar geochemical behavior.Therefore, it can be inferred that fluid−melt partitioning of all REE will depend in a similarmanner on these parameters. The results presented here show that the preference of rareearth elements for the melt is much more pronounced than that of the LILE, particularly forperalkaline compositions. In contrast to large ion lithophile elements, the REE do not fraction-ate into granite forming minerals, except for Eu2+ which substitutes for Ca in plagioclase underreducing conditions. Therefore, exsolution of an aqueous fluid and fractional crystallization offeldspars, quartz, and mica will result in an enrichment of the REE in the residual melt in theabsence of accessory phases. This behavior will be much more pronounced in the case ofa peralkaline melt than for peraluminous compositions. REE enrichment in silicate melts willresult to the formation of REE bearing phases as observed in the in-situ experiments (Chapter4). This conclusion is in agreement with geological observations on REE ore deposits whichare commonly associated with peralkaline granites (e.g., Kovalenko et al., 1995, Williams-Jones et al., 2000, Tassinari et al., 2001). The stronger affinity of REE to peralkaline meltsis also consistent with their structural role in melts, where they can be considered as networkmodifiers due to their large ionic radius and thus high coordination number. Therefore, rareearth elements will rather coordinate with non-bridging oxygens of depolymerized melts (i.e.,ASI≤1) (e.g., Ponader and Brown, 1989, Anderson et al., 1998, Park et al., 2002, Marchi et al.,2005). Rare earth element ore deposits are mainly linked to the formation of e.g., parisite andbastnaesite. Our experiments also show, for hydrothermal REE mineralizations derived fromalkali granites, complexing of the REE must take place with other ligands than Cl− to explainthe enrichment in the fluid phase. These anions are probably CO2−
3 , HCO−3 , SO2−4 and F−,
and fluids rich in these components are mainly of external origin (e.g., Bea, 1996, Gieré, 1996,Williams-Jones et al., 2000). All in all, the concentration of REE in residual granitic melts isalso strongly controlled by the nature and abundance of crystalline phases.
In conclusion, fluid−melt partitioning of large ion lithophile and rare earth elements werestudied as function of pressure, temperature, fluid salinity, and melt composition using differ-ent experimental and analytical methods. The presented results extend the current data for Rband Sr, and provide new insight into the fluid−melt partition behavior of Ba, La, Yb, and Y, par-
96

ii
“thesis_report_old” — 2010/4/26 — 13:54 — page 97 — #108 ii
ii
ii
Discussion and conclusions
ticularly the dependencies on PTx conditions. The ability to perform in-situ determinations oftrace element concentrations in aqueous fluids equilibrated with silicate melts is an importantimprovement in the study of fluid−melt interactions. The presented results of this thesis en-hance to knowledge on the role of fluids and their interaction with magma in the late stages ofthe evolution of magmatic complexes and also during the formation of magmatic-hydrothermalore deposits.
97

ii
“thesis_report_old” — 2010/4/26 — 13:54 — page 98 — #109 ii
ii
ii
Chapter 6
Outlook
The results of this thesis highlight the importance of an in-situ method to study fluid−melt sys-tems. In the following paragraphs will discuss further improvements of the in-situ technique.Firstly, I present some possibilities and their limitations to quantify trace element contents inaqueous fluids and silicate melts at elevated PT conditions. And secondly, I will show firstresults of an ongoing spectroscopic study on the complexation of Sr in the aqueous fluid equi-librated with silicate melts at high PT conditions.
6.1 Further improvements of the in-situ method
In-situ fluid−melt partition coefficients obtained in this study are based on the analysis oftrace element contents of the aqueous fluid at elevated PT conditions and of the quenchedmelt. As described before, back reactions occur between the coexisting aqueous fluid andthe silicate melt upon cooling. Although the observed changes of trace element contents inthe aqueous fluid are small, one need to determine the trace element concentrations at highpressures and temperatures in both phases to avoid quench effects. At present, the meltdroplets cannot be analyzed in-situ with confidence due to coexcitation of the aqueous fluidaround the droplets. Even if the incident beam is focused, a portion of these X-rays will bescattered in the diamond anvil, and a contribution from coexcited fluid to the XRF signal istherefore inevitable. Nevertheless, two improvements can be made to obtain completely in-situ fluid−melt partition coefficients.
1. At present, the bulk trace element concentration is not known in these experiments. Thatis due to the small amount of trace element doped glass used in in-situ experiments, andto small heterogeneities of the trace element concentrations of the initial glass. One candetermine the bulk trace element concentration in the system by XRF measurementsin a one phase silicate fluid. Therefore, the trace element doped glass should be com-pletely dissolved in the aqueous fluid at a temperature that is roughly 50◦C above theexperimental temperature. This requires smaller glass amounts than used in these ex-periments. After the collection of XRF spectra of the one phase fluid, the temperatureis shifted to the experimental temperature. Upon cooling, the one phase fluid unmix toaqueous fluid and silicate melt, and XRF spectra of the aqueous fluid can be taken. This
98
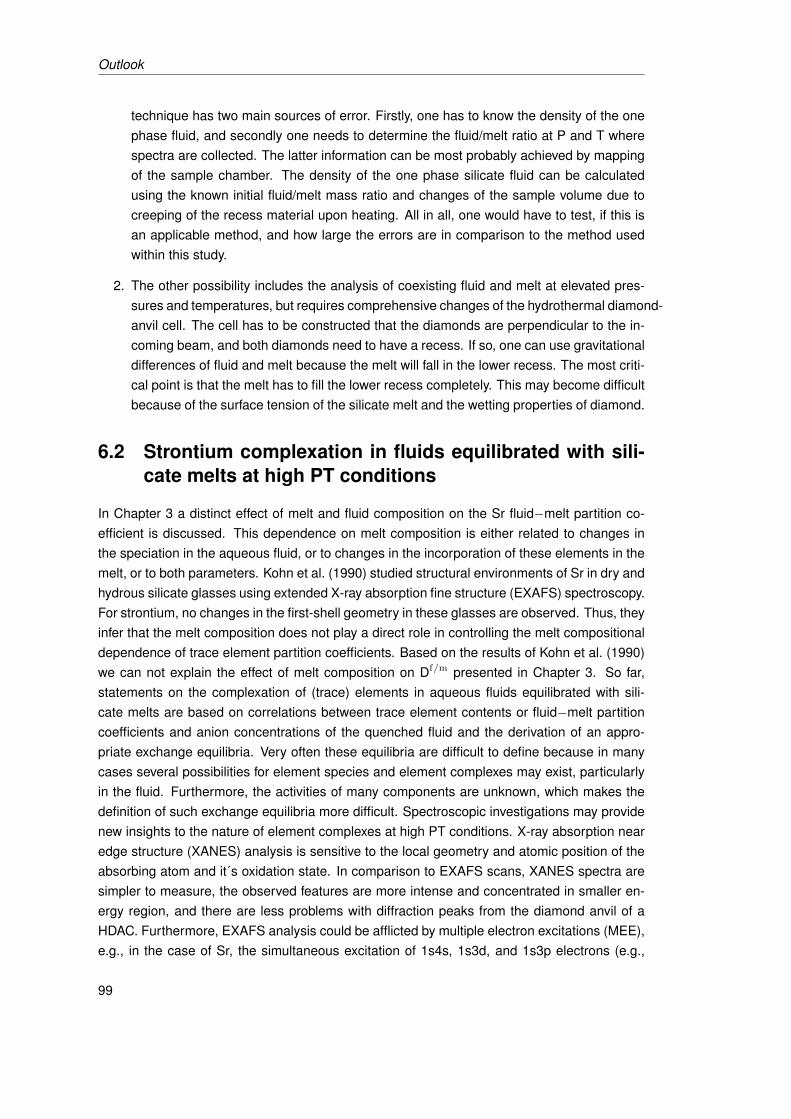
ii
“thesis_report_old” — 2010/4/26 — 13:54 — page 99 — #110 ii
ii
ii
Outlook
technique has two main sources of error. Firstly, one has to know the density of the onephase fluid, and secondly one needs to determine the fluid/melt ratio at P and T wherespectra are collected. The latter information can be most probably achieved by mappingof the sample chamber. The density of the one phase silicate fluid can be calculatedusing the known initial fluid/melt mass ratio and changes of the sample volume due tocreeping of the recess material upon heating. All in all, one would have to test, if this isan applicable method, and how large the errors are in comparison to the method usedwithin this study.
2. The other possibility includes the analysis of coexisting fluid and melt at elevated pres-sures and temperatures, but requires comprehensive changes of the hydrothermal diamond-anvil cell. The cell has to be constructed that the diamonds are perpendicular to the in-coming beam, and both diamonds need to have a recess. If so, one can use gravitationaldifferences of fluid and melt because the melt will fall in the lower recess. The most criti-cal point is that the melt has to fill the lower recess completely. This may become difficultbecause of the surface tension of the silicate melt and the wetting properties of diamond.
6.2 Strontium complexation in fluids equilibrated with sili-cate melts at high PT conditions
In Chapter 3 a distinct effect of melt and fluid composition on the Sr fluid−melt partition co-efficient is discussed. This dependence on melt composition is either related to changes inthe speciation in the aqueous fluid, or to changes in the incorporation of these elements in themelt, or to both parameters. Kohn et al. (1990) studied structural environments of Sr in dry andhydrous silicate glasses using extended X-ray absorption fine structure (EXAFS) spectroscopy.For strontium, no changes in the first-shell geometry in these glasses are observed. Thus, theyinfer that the melt composition does not play a direct role in controlling the melt compositionaldependence of trace element partition coefficients. Based on the results of Kohn et al. (1990)we can not explain the effect of melt composition on Df/m presented in Chapter 3. So far,statements on the complexation of (trace) elements in aqueous fluids equilibrated with sili-cate melts are based on correlations between trace element contents or fluid−melt partitioncoefficients and anion concentrations of the quenched fluid and the derivation of an appro-priate exchange equilibria. Very often these equilibria are difficult to define because in manycases several possibilities for element species and element complexes may exist, particularlyin the fluid. Furthermore, the activities of many components are unknown, which makes thedefinition of such exchange equilibria more difficult. Spectroscopic investigations may providenew insights to the nature of element complexes at high PT conditions. X-ray absorption nearedge structure (XANES) analysis is sensitive to the local geometry and atomic position of theabsorbing atom and it´s oxidation state. In comparison to EXAFS scans, XANES spectra aresimpler to measure, the observed features are more intense and concentrated in smaller en-ergy region, and there are less problems with diffraction peaks from the diamond anvil of aHDAC. Furthermore, EXAFS analysis could be afflicted by multiple electron excitations (MEE),e.g., in the case of Sr, the simultaneous excitation of 1s4s, 1s3d, and 1s3p electrons (e.g.,
99
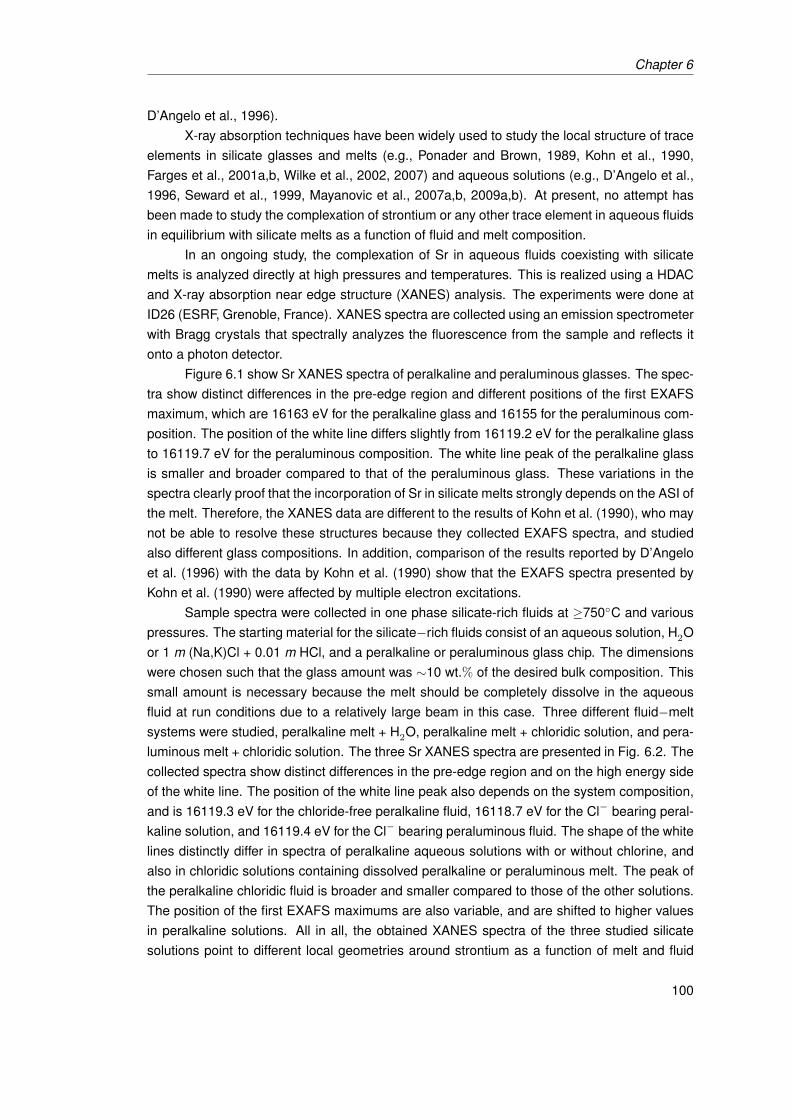
ii
“thesis_report_old” — 2010/4/26 — 13:54 — page 100 — #111 ii
ii
ii
Chapter 6
D’Angelo et al., 1996).X-ray absorption techniques have been widely used to study the local structure of trace
elements in silicate glasses and melts (e.g., Ponader and Brown, 1989, Kohn et al., 1990,Farges et al., 2001a,b, Wilke et al., 2002, 2007) and aqueous solutions (e.g., D’Angelo et al.,1996, Seward et al., 1999, Mayanovic et al., 2007a,b, 2009a,b). At present, no attempt hasbeen made to study the complexation of strontium or any other trace element in aqueous fluidsin equilibrium with silicate melts as a function of fluid and melt composition.
In an ongoing study, the complexation of Sr in aqueous fluids coexisting with silicatemelts is analyzed directly at high pressures and temperatures. This is realized using a HDACand X-ray absorption near edge structure (XANES) analysis. The experiments were done atID26 (ESRF, Grenoble, France). XANES spectra are collected using an emission spectrometerwith Bragg crystals that spectrally analyzes the fluorescence from the sample and reflects itonto a photon detector.
Figure 6.1 show Sr XANES spectra of peralkaline and peraluminous glasses. The spec-tra show distinct differences in the pre-edge region and different positions of the first EXAFSmaximum, which are 16163 eV for the peralkaline glass and 16155 for the peraluminous com-position. The position of the white line differs slightly from 16119.2 eV for the peralkaline glassto 16119.7 eV for the peraluminous composition. The white line peak of the peralkaline glassis smaller and broader compared to that of the peraluminous glass. These variations in thespectra clearly proof that the incorporation of Sr in silicate melts strongly depends on the ASI ofthe melt. Therefore, the XANES data are different to the results of Kohn et al. (1990), who maynot be able to resolve these structures because they collected EXAFS spectra, and studiedalso different glass compositions. In addition, comparison of the results reported by D’Angeloet al. (1996) with the data by Kohn et al. (1990) show that the EXAFS spectra presented byKohn et al. (1990) were affected by multiple electron excitations.
Sample spectra were collected in one phase silicate-rich fluids at ≥750◦C and variouspressures. The starting material for the silicate−rich fluids consist of an aqueous solution, H2Oor 1 m (Na,K)Cl + 0.01 m HCl, and a peralkaline or peraluminous glass chip. The dimensionswere chosen such that the glass amount was ∼10 wt.% of the desired bulk composition. Thissmall amount is necessary because the melt should be completely dissolve in the aqueousfluid at run conditions due to a relatively large beam in this case. Three different fluid−meltsystems were studied, peralkaline melt + H2O, peralkaline melt + chloridic solution, and pera-luminous melt + chloridic solution. The three Sr XANES spectra are presented in Fig. 6.2. Thecollected spectra show distinct differences in the pre-edge region and on the high energy sideof the white line. The position of the white line peak also depends on the system composition,and is 16119.3 eV for the chloride-free peralkaline fluid, 16118.7 eV for the Cl− bearing peral-kaline solution, and 16119.4 eV for the Cl− bearing peraluminous fluid. The shape of the whitelines distinctly differ in spectra of peralkaline aqueous solutions with or without chlorine, andalso in chloridic solutions containing dissolved peralkaline or peraluminous melt. The peak ofthe peralkaline chloridic fluid is broader and smaller compared to those of the other solutions.The position of the first EXAFS maximums are also variable, and are shifted to higher valuesin peralkaline solutions. All in all, the obtained XANES spectra of the three studied silicatesolutions point to different local geometries around strontium as a function of melt and fluid
100

ii
“thesis_report_old” — 2010/4/26 — 13:54 — page 101 — #112 ii
ii
ii
Outlook
norm
aliz
ed fl
uore
scen
ce
1618016160161401612016100energy [eV]
A - peraluminous
B - peralkaline
starting glasses
Figure 6.1: Stronium XANES spectra of peralkaline and peraluminous starting glasses.
composition. For chloridic silicate solutions, one can reasonably assume that more than oneSr complex will form dependent on melt composition because of distinct differences in XANESspectra of peralkaline and peraluminous chloridic solutions. The spectra of the peralkaline so-lution is very similar to that of the peralkaline glass, whereas the spectra of the peraluminoussolution does not look like that of the peraluminous glass. The peraluminous solution also donot resemble the spectra of a SrCl2 standard solution measured at 600◦C. This is in contra-diction to interpretations of quench data using metaluminous or mildly peraluminous startingglasses (Bai and Koster van Groos, 1999, Webster et al., 1989) who suggested that Sr willform mainly chlorine complexes in the fluid at high pressures and temperatures.
The data analysis of these spectra is still in progress. Quantitative information from thesample spectra will be obtained in two steps. Firstly, measured XANES spectra of crystallinereferences and standard solutions are simulated. Secondly, the spectra from the samplesare compared to these modeled reference spectra to gain information on the local geometryaround Sr.
101

ii
“thesis_report_old” — 2010/4/26 — 13:54 — page 102 — #113 ii
ii
ii
Chapter 6
norm
aliz
ed fl
uore
scen
ce
1618016160161401612016100energy [eV]
samples at 750°C
A - peralkaline - non-chloridic
B - peralkaline - chloridic
C - peraluminous - chloridic
Figure 6.2: Strontium XANES spectra of peralkaline and peraluminous silicate fluids.
102
ii
“thesis_report_old” — 2010/4/26 — 13:54 — page 103 — #114 ii
ii
ii
References
Adam, J., Green, T. H., Sie, S. H., and Ryan, C. G. (1997). Trace element partitioning betweenaqueous fluids, silicate melts and minerals. Eur. J. Mineral., 9:569–584.
Akella, J., Vaidya, S. N., and Kennedy, G. C. (1969). Melting of Sodium Chloride at Pressuresto 65 kbar. Physical Review, 185(3):1135–1140.
Albarede, F. (1975). Some trace element relationships among liquid and solid phases inthe course of the fractional crystallization of magmas. Geochimica et Cosmochimica Acta,40:667–673.
Anderson, G. M. and Burnham, C. W. (1965). The solubility of quartz in supercritical water.American Journal of Science, 263:494–511.
Anderson, R., Brennan, T., Mountjoy, G., Newport, R. J., and Saunders, G. A. (1998). An EX-AFS study of rare-earth phospate glasses in the vicinity of the metaphosphate composition.Journal of Non-Crystalline Solids, 232-234:286–292.
Asimov, P. and Ghiorso, M. (1998). Algorithmic modifications extending MELTS to calculatesubsolidus phase relations. American Mineralogist, 83:1127–1131.
Atherton, M. P. (1993). Granite magmatism. Journal of the Geological Society, 150:1009–1023.
Audétat, A. and Keppler, H. (2005). Solubility of rutile in subduction zone fluids, as determinedby experiments in the hydrothermal diamond anvil cell. Earth and Planetary Science Letters,232:393–402.
Audétat, A. and Pettke, T. (2003). The magmatic-hydrothermal evolution of two barren gran-ites: A melt and fluid inclusion study of the Rito del Medio and Canada Pinabete plutons innorthern New Mexico (USA). Geochimica et Cosmochimica Acta, 67(1):97–121.
Audétat, A., Pettke, T., Heinrich, C. A., and Bodnar, B. J. (2008). The Composition of Magmatic-Hydrothermal Fluids in Barren and Mineralized Intrusions. Economic Geology, 103(5):877–905.
Ayers, J. C. and Eggler, D. H. (1995). Partitioning of elements between silicate melt and H2O-NaCl fluids at 1.5 and 2.0 GPa pressure: Implications for mantle metasomatism. Geochimicaet Cosmochimica Acta, 59(20):4237–4246.
103

ii
“thesis_report_old” — 2010/4/26 — 13:54 — page 104 — #115 ii
ii
ii
Chapter 6
Bai, T. B. and Koster van Groos, A. F. (1999). The distribution of Na, K, Rb, Sr, Al, Ge, Cu,W, Mo, La, and Ce between granitic melts and coexisting aqueous fluids. Geochimica etCosmochimica Acta, 63(7/8):1117–1131.
Bandura, A. and Lvov, S. (2006). The ionization constant of water over a wide range of tem-peratures and densities. Journal of Physical and Chemical Reference Data, 35:15–30.
Bassett, W. A., Anderson, A. J., Mayanovic, R. A., and Chou, I.-M. (2000). Modified hydrother-mal diamond anvil cells for XAFS analyses of elements with low energy absorption edgesin aqueous solutions at sub- and supercritical conditions. Zeitschrift für Kristallographie,215:711–717.
Bassett, W. A., Shen, A. H., Bucknum, M., and Chou, I.-M. (1993). A new diamond anvil cell forhydrothermal studies to 2.5 GPa and from 190 to 1200◦C. Review of scientific instruments,64:2340–2345.
Bau, M. and Dulski, P. (1995). Comparative study of yttrium and rare-earth element behavioursin fluorine-rich hydrothermal fluids. Contributions to Mineralogy and Petrology, 119:213–223.
Bea, F. (1996). Residence of REE, Y, Th and U in Granites and Grustal Protoliths; Implicationsfor the Chemistry of Crustal Melts. Journal of Petrology, 37(3):521–552.
Bea, F., Pereira, M. D., and Stroh, A. (1994). Mineral/leucosome trace-element partitioning in aperaluminous migmatite (a laser ablation-ICP-MS study). Chemical Geology, 117:291–312.
Bédard, J. H. (2006). Trace element partitioning in plagioclase feldspar. Geochimica et Cos-mochimica Acta, 70:3717–3742.
Behrens, H. and Jantos, N. (2001). The effect of anhydrous composition on water solubility ingranitic melts. American Mineralogist, 86:14–20.
Best, M. G. (2003). Igneous and Metamorphic Petrology. Blackwell.
Blundy, J., Robinson, J., and Wood, B. (1998). Heavy REE are compatible in clinopyroxene onthe spinel lhersolite solidus. Earth and Planetary Science Letters, 160:493–504.
Blundy, J. D. and Wood, B. J. (1991). Crystal-chemical controls on the partitioning of Sr andBa between plagioclase feldspar, silicate melts, and hydrothermal solutions. Geochimica etCosmochimica Acta, 55:193–209.
Bodnar, R. J. (2003). Fluid Inclusions: Analysis and Interpretation, volume 32, chapter Intro-duction to aqueous fluid systems., pages 81–99. Mineralogical Association of Canada.
Bodnar, R. J. and Vityk, M. O. (1994). Interpretation of microthermometric data for H2O-NaClfluid inclusions. Fluid Inclusions in Minerals: Methods and Applications, pages 117–130.Virginia Tech.
Borchert, M., Wilke, M., Schmidt, C., and Rickers, K. (2009). Partitioning and equilibration ofRb and Sr between silicate melts and aqueous fluids. Chemical Geology, 259:39–47.
104

ii
“thesis_report_old” — 2010/4/26 — 13:54 — page 105 — #116 ii
ii
ii
REFERENCES
Borchert, M., Wilke, M., Schmidt, C., and Rickers, K. (2010). Rb and Sr partitioning betweenhaplogranitic melts and aqueous solutions. Geochimica et Cosmochimica Acta, 74:1057–1076.
Brunetti, A., del Rio, M. S., Golosio, B., Simionovici, A., and Somogyi, A. (2004). A library forX-ray-matter interaction cross sections for X-ray fluorescence applications. SpectrochimicaActa, 59:1725–1731.
Bureau, H. and Keppler, H. (1999). Complete miscibility between silicate melts and hydrousfluids in the upper mantle: experimental evidence and geochemical implications. Earth andPlanetary Science Letters, 165:187–196.
Bureau, H., Ménez, B., Khodja, H., Daudin, L., Gallien, J.-P., Massare, D., Shaw, C., andMétrich, N. (2003). The partitioning of barium and lead between silicate melts and aqueousfluids at high pressures and temperatures. Nuclear Instruments and Methods in PhysicsResearch, 210:434–440.
Bureau, H., Ménez, B., Malavergne, V., Somogyi, A., Simionovici, A., Massare, D., Khodja,H., Daudin, L., Gallien, J.-P., Shaw, C., and Bonnin-Mosbah, M. (2007). In situ mappingof high-pressure fluids using hydrothermal diamond anvil cells. High Pressure Research,27(2):235–247.
Burnham, C. W. (1967). Hydrothermal fluids at the magmatic stage. In: Geochemistry ofHydrothermal Ore Deposits, pages 34–67. John Wiley, New York.
Burnham, C. W. (1979). Magmas and hydrothermal fluids. In Barnes, H. L., editor, Geochem-istry of hydrothermal ore deposits., pages 71–136.
Burnham, C. W. and Jahns, R. H. (1962). A method for determining the solubility of water insilicate melts. American Journal of Science, 260:721–745.
Candela, P. A. and Holland, H. D. (1984). The partitioning of copper and molybdenum betweensilicate melts and aqueous fluids. Geochimica et Cosmochimica Acta, 48:373–380.
Candela, P. A. and Piccoli, P. M. (1995). Model ore-metal partitioning from melts into vapor andvapor/brine mixtures. In: Magmas, Fluids, and Ore Deposits, volume 23, pages 101–127.Mineralogical Association of Canada Short Course.
Carroll, M. R. and Holloway, J. R. (1994). Volatiles in magmas. Reviews in Mineralogy, vol-ume 30, page 517 p. Mineralogical Society of America.
Carron, J.-P. and Lagache, M. (1980). Étude expéimentale du fractionnement des élémentsRb, Cs, Sr et Ba entre feldspaths alcalins, solutions hydrothermales et liquides silicatés dansle systéme Q.Ab.Or.H2O à 2 kbar entre 700 to 800◦C. Bull. Mineral., 103:571–578.
Chappell, B. W. and White, A. J. R. (1974). Two contrasting granite types. Pac Geol, 8:173–174.
105
ii
“thesis_report_old” — 2010/4/26 — 13:54 — page 106 — #117 ii
ii
ii
Chapter 6
Christiansen, E. H., Bikun, J. V., Sheridan, M. F., and Burt, D. M. (1984). Geochemical evolutionof topaz rhyolites from the Thomas Range and Spor Mountain, Utah. American Mineralogist,69:223–236.
Cullers, R. L., Medaris, L. G., and Haskin, L. A. (1973). Experimental studies of the distributionof rare earths as trace elements among silicate minerals and liquids and water. Geochimicaet Cosmochimica Acta, 37:1499–1512.
Currie, K. L. (1968). On the solubility of albite in supercritical water in the range 400 to 600◦Cand 750 to 3500 bars. American Journal of Science, 266:321–341.
D’Angelo, P., Nolting, H.-F., and Pavel, N. V. (1996). Evidence for multielectron resonances atthe Sr K edge. Physical Review A, 53(2):798–805.
Driesner, T. (2007). The system H2O-NaCl. Part II: Correlations for molar volume, enthalpy,and isobaric heat capacity from 0 to 1000◦C, 1 to 5000 bar, and 0 to 1 XNaCl. Geochimicaet Cosmochimica Acta, 71:4902–4919.
Ewart, A. and Griffin, W. L. (1994). Application of Proton-Microprobe Data to Trace-ElementPartitioning in Volcanic-Rocks. Chemical Geology, 117:251–284.
Farges, F., Brown Jr, G. E., Petit, P.-E., and Munoz, M. (2001a). Transition elements in water-bearing silicate glasses/melts. Part I. A high-resolution and anharmonic analysis of Ni coor-dination environments in crystals, glasses, and melts. Geochimica et Cosmochimica Acta,65(10):1665–1678.
Farges, F., Munoz, M., Siewert, R., Malavergne, V., Brown Jr, G. E., Behrens, H., Nowak, M.,and Petit, P.-E. (2001b). Transition elements in water-bearing silicate glasses/melts. Part II.Ni in water-bearing glasses. Geochimica et Cosmochimica Acta, 65(10):1679–1693.
Flynn, R. T. and Burnham, C. W. (1978). An experimental determination of rare earth partitioncoefficients between a chloride containing vapor phase and silicate melts. Geochimica etCosmochimica Acta, 42:685–701.
Frank, M. R., Candela, P. A., and Piccoli, P. M. (2003). Alkali exchange equilibria between asilicate melt and coexisting magmatic volatile phase: An experimental study at 800◦C andMPa. Geochimica et Cosmochimica Acta, 67(7):1415–1427.
Ghiorso, M. and Sack, R. (1995). Chemical mass transfer in magmatic processes. IV. A revisedand internally consistent thermodynamic model for the interpolation and extrapolation ofliquid-solid equilibria in magmatic systems at elevated temperatures and pressures. ContribMineralogy Petrology, 119:197–212.
Gieré, R. (1996). Formation of rare earth minerals in hydrothermal systems. In: Rare earthminerals: Chemistry, origin and ore deposits, chapter 5, pages 105–150. Chapman & Hall.
Green, T. H. (1980). Island arc and continent-building magmatism - A review of petrogenicmodels based on experimental petrology and geochemistry. Tectonophysics, 63:367–385.
106

ii
“thesis_report_old” — 2010/4/26 — 13:54 — page 107 — #118 ii
ii
ii
REFERENCES
Green, T. H. and Pearson, N. J. (1983). Effect of pressure on rare earth element partitioncoefficients in common magmas. Nature, 305:414–416.
Haar, L., Gallagher, J., and Kell, G. (1984). Steam tables:, chapter Thermodynamic and trans-port properties and computer programs for vapor and liquid states of water in SI units, page320. Hemisphere Pub. Corp., Washington, D.C.
Hall, D. L., Sterner, S. M., and Bodnar, R. J. (1988). Freezing Point depression of NaCl-KCl-H2O Solutions. Economic Geology, 83:197–202.
Haller, M. and Knöchel, A. (1996). X-ray fluorescence analysis using synchrotron radiation-(SRXRF). Journal of Trace Microprobe Technics, 14:461–488.
Hanley, J. J., Pettke, T., Mungall, J. E., and Spooner, E. T. C. (2005). The solubility of platinumand gold in NaCl brines at 1.5 kbar, 600 to 800◦C: A laser ablation ICP-MS pilot study ofsynthetic fluid inclusions. Geochimica et Cosmochimica Acta, 69(10):2593–2611.
Hanson, G. N. (1980). Rare earth elements in petrogenetic studies of igneous systems. AnnualReviews Earth Planetary Sciences, 8:371–406.
Hedenquist, J. W. and Lowenstern, J. B. (1994). The role of magmas in the formation ofhydrothermal ore deposits. Nature, 370:519–527.
Helgeson, H. (1964). Complexing and Hydrothermal Ore Deposition. Pergamon, New York.
Holland, H. D. (1972). Granites, Solutions, and Base Metal Deposits. Economic Geology,67(3):281–301.
Holtz, F., Behrens, H., Dingwell, D. B., and Johannes, W. (1995). H2O solubility in haplo-granitic melts: Compositional, pressure, and temperature dependence. American Mineralo-gist, 80:94–108.
Holtz, F., Behrens, H., Dingwell, D. B., and Taylor, R. P. (1992). Water solubility in aluminosili-cate melts of haplogranite composition at 2 kbar. Chemical Geology, 96:289–302.
Holtz, F., Roux, J., Behrens, H., and Pichavant, M. (2000). Water solubility in silica and quart-zofeldspathic melts. American Journal of Science, 85:682–686.
Huang, R. and Bilderback, D. H. (2006). Single-bounce monocapillaries for focusing syn-chrotron radiation: modeling, measurements and theoretical limits. Journal of SynchrotronRadiation, 13:74–84.
Hui, H., Zhang, Y., Xu, Z., Del Gaudio, P., and Behrens, H. (2009). Pressure dependence ofviscosity of rhyolitic melts. Geochimica et Cosmochimica Acta, 73:3680–3693.
Icenhower, J. and London, D. (1995). An experimental study of element partitioning amongbiotite, muscovite, and coexisting peraluminous silicic melt at 200 MPa (H2O). AmericanMineralogist, 80:1229–1251.
107
ii
“thesis_report_old” — 2010/4/26 — 13:54 — page 108 — #119 ii
ii
ii
Chapter 6
Icenhower, J. and London, D. (1996). Experimental partitioning of Rb, Cs, Sr, and Ba betweenalkali feldspar and peraluminous melt. American Mineralogist, 81:719–734.
Jochum, K. P., Dingwell, D. B., Rocholl, A., Stoll, B., Hofmann, A. W., and many others (2000).The preparation and prelimnary characterisation of eight geological MPI-DING referenceglasses for in-situ microanalysis. Geostandards Newsletter, 24(1):87–133.
Jochum, K. P., Stoll, B., Herwig, K., Willbold, M., Hofmann, A. W., and many others (2006).MPI-DING reference glasses for in situ microanalysis: New reference values for elementconcentrations and isotope ratios. Geochemistry, Geophysics, Geosystems, 7(2):1–44.
Johannes, W. and Holtz, F. (1996). Petrogenesis an Experimental Petrology of Granitic Rocks.Springer, Berlin.
Keppler, H. and Wyllie, P. J. (1990). Role of fluids in transport and fractionation of uranium andthorium in magmatic processes. Nature, 348:531–533.
Keppler, H. and Wyllie, P. J. (1991). Partitioning of Cu, Sn, Mo, W, U, and Th between meltand aqueous fluid in the systems haplogranite-H2O-HCl and haplogranite-H2O-HF. Contri-butions to Mineralogy and Petrology, 109:139–150.
Koepke, J. and Behrens, H. (2001). Trace element diffusion in andesitic melts: an applicationof synchrotron X-ray fluorescence analysis. Geochimica et Cosmochimica Acta, 65:1481–1489.
Kohn, S. C., Charnock, J. M., Henderson, C. M. B., and Greaves, G. N. (1990). The structuralenvironments of trace elements in dry and hydrous silicate glasses; a manganese and stron-tium K-edge X-ray absorption spectroscopic study. Contributions to Mineralogy Petrology,105:359–368.
Kovalenko, V. I., Tsaryeva, G. M., Goreglyad, A. V., Yarmolyuk, V. V., Troitsky, V. A., Hervig,R. L., and Farmer, G. L. (1995). The peralkaline granite-related Khaldzan-Buregtey raremetal (Zr, Nb, REE) deposit, western Mongolia. Economic Geology, 90:530–547.
Leeman, W. and Phelps, D. (1981). Partitioning of rare earths and other trace elements be-tween sanidine and coexisting volcanic glass. Journal of Geophysical Research, 86:10193–10199.
London, D. (2005). Geochemistry of alkali and alkaline earth elements in ore-forming granites,pegmatites, and rhyolites. In: Rare-element geochemistry of ore deposits, volume 17, pages17–43. Geological association of Canada Short Course Handbook.
London, D., Hervig, R. L., and Morgan, G. B. (1988). Melt-vapor solubilities and elementalpartitioning in peraluminous granite-pegmatite systems: experimental results with Macusaniglass at MPa. Contributions to Mineralogy and Petrology, 99:360–373.
Mahood, G. A. and Hildreth, E. W. (1983). Large partition coefficients for trace elements inhigh-silica rhyolites. Geochimica et Cosmochimica Acta, 47:11–30.
108

ii
“thesis_report_old” — 2010/4/26 — 13:54 — page 109 — #120 ii
ii
ii
REFERENCES
Manning, C. E. (1994). The solubility of quartz in H2O in the lower crust and upper mantle.Geochimica et Cosmochimica Acta, 58:4831–4839.
Manning, C. E. (2004). The chemistry of subduction-zone fluids. Earth and Planetary ScienceLetters, 223:1–16.
Manning, C. E. (2007). Solubility of corundum + kyanite in H2O at 700◦C and 10 kbar: evidencefor Al-Si complexing at high pressure and temperature. Geofluids, 7:258–269.
Manning, C. E., Wilke, M., Schmidt, C., and Cauzid, J. (2008). Rutile solubility in albite-H2O and Na2Si3O7-H2O at high temperatures and pressures by in-situ synchrotron radiationmicro-XRF. Earth and Planetary Science Letters, 272:730–737.
Marchi, J., Morais, D. S., Schneider, J., Bressiani, J. C., and Bressiani, A. H. A. (2005). Charac-terization of rare earth aluminosilicate glasses. Journal of Non-Crystalline Solids, 351:863–868.
Mayanovic, R. A., Anderson, A. J., Bassett, W. A., and Chou, I.-M. (2007a). On the formationand structure of rare-earth element complexes in aqueous solutions under hydrothermalconditions with new data on gadolinium aqua and chloro complexes. Chemical Geology,239:266–283.
Mayanovic, R. A., Anderson, A. J., Bassett, W. A., and Chou, I.-M. (2007b). Synchrotron X-ray spectroscopy of Eu/HNO3 aqueous solutions at high temperatures and pressures andNb-bearing silicate melt phases coexisting with hydrothermal fluids using a modified hy-drothermal diamond anvil cell and rail assembly. Review of scientific instruments, 78:1–9.
Mayanovic, R. A., Anderson, A. J., Bassett, W. A., and Chou, I.-M. (2009a). Steric hindranceand the enhanced stability of light rare-earth elements in hydrothermal fluids. AmericanMineralogist, 94:1487–1490.
Mayanovic, R. A., Anderson, A. J., Bassett, W. A., and Chou, I.-M. (2009b). The struc-ture and stability of aqueous rare-earth elements in hydrothermal fluids: New results onneodymium(III) aqua and chloroaqua complexes in aqueous solutions to 500◦C and 520MPa. Chemical Geology, 259:30–38.
Metrich, N. and Rutherford, M. J. (1992). Experimental study of chlorine behavior in hydroussilicic melts. Geochimica et Cosmochimica Acta, 56:607–616.
Morgan VI, G. B. and London, D. (1996). Optimizing the electron microprobe analysis ofhydrous alkali aluminosilicate glasses. American Mineralogist, 81:1176–1185.
Morgan VI, G. B. and London, D. (2005). Effect of current density on the electron microprobeanalysis of alkali aluminosilicate glasses. American Mineralogist, 90:1131–1138.
Muñoz, M., Bureau, H., Malavergne, V., Ménez, B., Wilke, M., Schmidt, C., Simionovici, A.,Somogyi, A., and Farges, F. (2005). In situ speciation of nickel in hydrous melts exposed toextreme conditions. Physica Scripta, 115:921–922.
109

ii
“thesis_report_old” — 2010/4/26 — 13:54 — page 110 — #121 ii
ii
ii
Chapter 6
Murray, M. M. and Rogers, J. W. (1973). Distribution of rubidium and strontium in the potassiumfeldspar of two granite batholiths. Geochemical Journal, 6:117–130.
Mysen, B. O. and Acton, M. (1999). Water in H2O-saturated magma-fluid systems: Solubilitybehavior in K2O-Al2O3-SiO2-H2O to 2.0 GPa and 1300◦C. Geochimica et CosmochimicaActa, 63:3799–3815.
Mysen, B. O. and Armstrong, L. (2002). Solubility behavior of alkali aluminosilicate compo-nents in aqueous fluids and silicate melts at high pressure and temperature. Geochimica etCosmochimica Acta, 66(12):2287–2297.
Nash, W. P. and Crecraft, H. R. (1985). Partition coefficients for trace elements in silicic mag-mas. Geochimica et Cosmochimica Acta, 49:2309–2322.
Newton, R. C. and Manning, C. E. (2000). Quartz solubility in H2O-NaCl and H2O-CO2 solu-tions at deep crust-upper mantle pressures and temperatures: 2-15 kbar and 500-900◦C.Geochimica et Cosmochimica Acta, 64(17):2993–3005.
Pailat, O., Elphick, S. C., and Brown, W. L. (1992). The solubility of water in NaAlSi3O8 melts:a re-examination of Ab-H2O phase relationships and critical behaviour at high pressures.Contributions to Mineralogy Petrology, 112:490–500.
Park, B., Li, H., and Corrales, L. R. (2002). Molecular dynamics simulation of La2O3-Na2O-SiO2 glasses. I. The structural role of La3+ cations. Journal of Non-Crystalline Solids,297:220–238.
Pearce, J. G., Perkins, W. T., Westgate, J. A., Gorton, M. P., Jackson, S. E., Neal, C. R., andChenery, S. P. (1997). A compilation of new and published major and trace element data forNIST SRM 610 and NIST SRM 612 glass reference materials. Geostandards Newsletter,21(1):115–144.
Philpotts, A. R. (1990). Principles of igneous and metamorphic petrology. Prentice Hall, Lon-don.
Philpotts, A. R. and Ague, J. J. (2009). Principles of igneous and metamorphic petrology.Cambridge University Press, 2nd edition.
Pichavant, M., Holtz, F., and McMillan, P. F. (1992). Phase relations and compositional depen-dence of H2O solubility in quartz-feldspar melts. Chemical Geology, 96:303–319.
Ponader, C. W. and Brown, C. E. (1989). Rare earth elements in silicate glass/melt systems: II.Interactions of La, Gd, and Yb with halogens. Geochimica et Cosmochimica Acta, 53:2905–2914.
Reed, M. J., Candela, P. A., and Piccoli, P. M. (2000). The distribution of rare earth elementsbetween monzogranitic melt and the aqueous volatile phase in experimental investigationsat 800◦C and 200 MPa. Contributions to Mineralogy and Petrology, 140:251–262.
110

ii
“thesis_report_old” — 2010/4/26 — 13:54 — page 111 — #122 ii
ii
ii
REFERENCES
Ren, M., Parker, D. F., and White, J. C. (2003). Partitioning of Sr, Ba, Rb, Y, and REE betweenplagioclase and peraluminous silicic magma. American Mineralogist, 88:1091–1103.
Rickers, K., Thomas, R., and Heinrich, W. (2006). The behavior of trace elements duringthe chemical evolution of the H2O-, B-, and F-rich granite-pegmatite-hydrothermal systemat Ehrenfriedersdorf, Germany: a SXRF study of melt and fluid inclusions. Mineralium De-posita, 41:229–245.
Robb, L. (2005). Introduction to ore-forming processes. Blackwell Publishing, Oxford.
Roedder, E. (1984). Reviews in Mineralogy 12: Fluid Inclusions. Mineralogical Society ofAmerica.
Roedder, E. and Bodnar, R. J. (1997). Fluid inclusion studies of hydrothermal or deposits. In:Geochemistry of Hydrothermal Ore Deposits. John Wiley & Sons, New York.
Sanchez-Valle, C., Martinez, I., Daniel, I., Philippot, P., Bohic, S., and Simionovici, A. (2003).Dissolution of strontianite at high P-T conditions: An in-situ synchrotron X-ray fluorescencestudy. American Mineralogist, 88:978–985.
Schäfer, B., Frischknecht, R., Günther, D., and Dingwell, D. B. (1999). Determination of trace-element partitioning between fluid and melt using LA-ICP-MS analysis of synthetic fluid in-clusions in glass. European Journal of Mineralogy, 11:415–426.
Schmidt, C. and Rickers, K. (2003). In-situ determination of mineral solubilities in fluids us-ing a hydrothermal diamond-anvil cell and SR-XRF: Solubility of AgCl in water. AmericanMineralogist, 88:288–292.
Schmidt, C., Rickers, K., Bilderback, D. H., and Huang, R. (2007). In situ synchrotron-radiationXRF study of REE phosphate dissolution in aqueous fluids to 800◦C. Lithos, 95:87–102.
Seward, T. M., Henderson, C. M. B., Charnock, J. M., and Driesner, T. (1999). An EXAFSstudy of solvation and ion pairing in aqueous strontium solutions to 300◦C. Geochimica etCosmochimica Acta, 63(16):2409–2418.
Shen, A. H., Bassett, W. A., and Chou, I.-M. (1993). The alpha-beta quartz transition athigh temperatures and pressures in a diamond-anvil cell by laser interferometry. AmericanMineralogist, 78:694–698.
Shmulovich, K., Graham, C., and Yardley, B. (2001). Quartz, albite and diopside solubilities inH2O-NaCl and H2O-CO2 fluids at 0.5-0.9 GPa. Contrib Mineralogy Petrology, 141:95–108.
Simon, A. C., Frank, M. R., Pettke, T., Candela, P. A., Piccoli, P. M., Heinrich, C. A., andGlascock, M. (2007). An evaluation of synthetic fluid inclusions for the purpose of trappingequilibrated, coexisting, immiscible fluid phases at magmatic conditions. American Mineral-ogist, 92:124–138.
Small, H., Stevens, T. S., and Bauman, W. C. (1975). Novel ion exchange chromatographicmethod using conductimetric detection. Analytical Chemistry, 47:1801–1809.
111

ii
“thesis_report_old” — 2010/4/26 — 13:54 — page 112 — #123 ii
ii
ii
Chapter 6
Solé, V. A., Papillon, E., Cotte, M., Walter, P., and Susini, J. (2007). A multiplatform codefor the analysis of energy-dispersive X-Ray fluorescence spectra. Spectrochimica Acta, B62:63–68.
Stalder, R., Ulmer, P., Thompson, A. B., and Günther, D. (2000). Experimental approach toconstrain second critical end points in fluid/silicate systems: Near-solidus fluids and melts inthe system albite-H2O. American Mineralogist, 85:68–77.
Stebbins, J. F. and Du, L.-S. (2002). Chloride ion sites in silicate and aluminosilicate glasses:A preliminary study by 35Cl solid-state NMR. American Mineralogist, 87:359–363.
Stix, J. and Gorton, M. P. (1990). Variations in trace element partition coefficients in sani-dine in the Cerro Toledo Rhyolite, Jemez Mountains, New Mexico - Effects of composition,temperature, and volatiles. Geochimica et Cosmochimica Acta, 54:2697–2708.
Streck, M. J. and Grunder, A. L. (1997). Compositional gradients and gaps in high-silicarhyolites of the Rattlesnake Tuff, Oregon. Journal of Petrology, 38(1):133–163.
Tagirov, B. R., Zotov, A. V., and Akinfiev, N. N. (1997). Experimental study of dissociation ofHCI from 350 to 500◦C and from 500 to 2500 bars: Thermodynamic properties of HCl◦(aq).Geochimica et Cosmochimica Acta, 61(20):4267–4280.
Tassinari, M. M. L., Kahn, H., and Ratti, G. (2001). Process mineralogy studies of CorregoDo Garimpo REE ore, Catalao-I alkaline complex, Goias, Brasil. Minerals Engineering,14(12):1609–1617.
Tuttle, O. F. and Bowen, N. L. (1958). Origin of granite in the light of experimental studies inthe system NaAlSi3O8−KAlSi3O8−SiO2−H2O. The Geological Society of America.
Urabe, T. (1985). Aluminous granite as a source magma of hydrothermal ore deposits: anexperimental study. Economic Geology, 80(1):148–157.
Watson, E. B. (1979). Zircon saturation in felsic liquids: Experimental results and applicationsto trace element geochemistry. Contributions to Mineralogy and Petrology, 70:407–419.
Webster, J. D. (1992a). Fluid-melt interactions involving Cl-rich granites: Experimental studyfrom 2 to 8 kbar. Geochimica et Cosmochimica Acta, 56:659–678.
Webster, J. D. (1992b). Water solubility and chlorine partitioning in Cl-rich granitic systems: Ef-fects of melt composition at 2 kbar and 800◦C. Geochimica et Cosmochimica Acta, 56:679–687.
Webster, J. D. (1997a). Chloride solubility in felsic melts and the role of chloride in magmaticdegassing. Journal of Petrology, 38:1793–1807.
Webster, J. D. (1997b). Exsolution of magmatic volatile phases from Cl-enriched mineralizinggranitic magmas and implications for ore metal transport. Geochimica et CosmochimicaActa, 61:1017–1029.
112

ii
“thesis_report_old” — 2010/4/26 — 13:54 — page 113 — #124 ii
ii
ii
REFERENCES
Webster, J. D. and De Vivo, B. (2002). Experimental and modeled solubilities of chlorine inaluminosilicate melts, consequences of magma evolution, and implications for exsolution ofhydrous chloride melt at Mt. Somma-Vesuvius. American Mineralogist, 87:1046–1061.
Webster, J. D., Holloway, J. R., and Hervig, R. L. (1989). Partitioning of Lithophile trace el-ements between H2O and H2O+CO2 fluids and topaz rhyolite melt. Economic Geology,84:116–134.
White, J. C. (2003). Trace-element partitioning between alkali feldspar and peralkalic quartztrachyte to rhyolite magma. Part II: Empirical equations for calculating trace-element partitioncoefficients of large-ion lithophile, high field-strength, and rare-earth elements. AmericanMineralogist, 88:330–337.
White, J. C., Holt, G. S., Parker, D. F., and Ren, M. (2003). Trace-element partitioning betweenalkali feldspar and peralkalic quartz trachyte to rhyolite magma. Part I: Systematics of trace-element partitioning. American Mineralogist, 88:316–329.
Whitney, J. A. (1988). The origin of granite: The role and source of water in the evolution ofgranitic magmas. The geological Society of America Bulletin, 100:1886–1897.
Wilke, M., Behrens, H., Burkhard, D. J. M., and Rossano, S. (2002). The oxidation state of ironin silicic melt at 500 MPa water pressure. Chemical Geology, 189:55–67.
Wilke, M., Farges, F., Partzsch, G. M., Schmidt, C., and Behrens, H. (2007). Speciation ofFe in silicate glasses and melts by in-situ XANES spectroscopy. American Mineralogist,92:44–56.
Williams-Jones, A. E., Sampson, I. M., and Olivo, G. R. (2000). The genesis of hydrothermalfluorite-REE deposits in the Gallinas mountains, New Mexico. Economic Geology, 95:327–342.
Winter, J. D. (2001). An Introduction to Igneous and Metamorphic Petrology. Prentice Hall,New Jersey.
Wolf, A. V., Brown, M. G., and Prentiss, P. G. (1981). Concentrative properties of aqueous so-lutions: conversion tables. In: Weast, R.C. (Ed.), CRC Handbook of Chemisty and Physics,pages D198–D247. CRC Press.
Xiong, Y. and Wood, S. (2002). Experimental determination of the hydrothermal solubilityof ReS2 and the Re-ReO2 buffer assemblage and transport of rhenium under supercriticalconditions. Geochemical Transactions, 3:1–10.
Yamashita, S. (1999). Experimental study of the effect of temperature on water solubility innatural rhyolite melt to 100 MPa. Journal of Petrology, 40(10).
Zajacz, Z., Halter, W. E., Pettke, T., and Guillong, M. (2008). Determination of fluid/melt parti-tion coefficients by LA-ICPMS analysis of co-existing fluid and silicate melt inclusions: Con-trols on element partitioning. Geochimica et Cosmochimica Acta, 72:2169–2197.
113

ii
“thesis_report_old” — 2010/4/26 — 13:54 — page II — #125 ii
ii
ii
Appendix A
Additional fluid−melt partitioningdata - the system albite-quartz
Fluid−melt partition coefficients of Rb and Sr were also determined between the end membercomposition albite-quartz (AQ) and various NaCl-bearing solutions at 750◦C and 200 MPa.These experiments were performed to test if the behavior of Rb and Sr vary significantly, ifthe system is reduced by one component (in this case K) which means a reduction in thedegree of freedom as determined by the Gibb´s phase rule F = 2 + C - Φ, where C are numberof components and Φ refers to the number of present phases. Furthermore, these additionalexperiments are used to evaluate the effect of Cl− concentration on Rb and Sr partitioningwhich was not studied in detail in the system albite-orthoclase-quartz. Therefore, we choosetwo starting compositions, AQ1 starting glass is more enriched in the albite component, whileAQ2 is more SiO2 rich (cp. Tab. A.1). The starting AQ glasses were doped with ∼2500ppm Rb or Sr. A detailed description of the glass preparation can be found in Chapter 2.2.1.The solutions were produced from distilled de-ionized water and analytical grade powders ofNaCl. The molality of the aqueous fluids varied from 1 to 4 m NaCl. Rapid or slow quenchedexperiments were conducted in externally heated cold-seal pressure vessels using H2O aspressure medium, and for a duration of 120 hours. A detailed description of the preparationof starting materials and samples, and experimental setup can be found in chapters 3.2.1 and3.2.2.
Table A.1: Composition of AQ starting glasses from EMP analysesand normative composition based on the components albite, quartz andcorundum. TE - trace element as indicated by sample name.
SiO2 Al2O3 Na2O ASI TE normative composition[wt.%] [wt.%] [wt.%] [ppm]
AQ1_Rb 76.98 15.36 7.66 1.22 2609±203 Ab64.81Qz32.42 + C2.76
AQ1_Sr 77.38 15.19 7.43 1.24 2517±256 Ab62.86Qz34.16 + C2.97
AQ2_Rb 82.04 12.03 5.93 1.23 3070±329 Ab50.16Qz47.53 + C2.28
AQ2_Sr 82.18 11.90 5.91 1.23 2899±329 Ab49.98Qz47.81 + C2.2
II
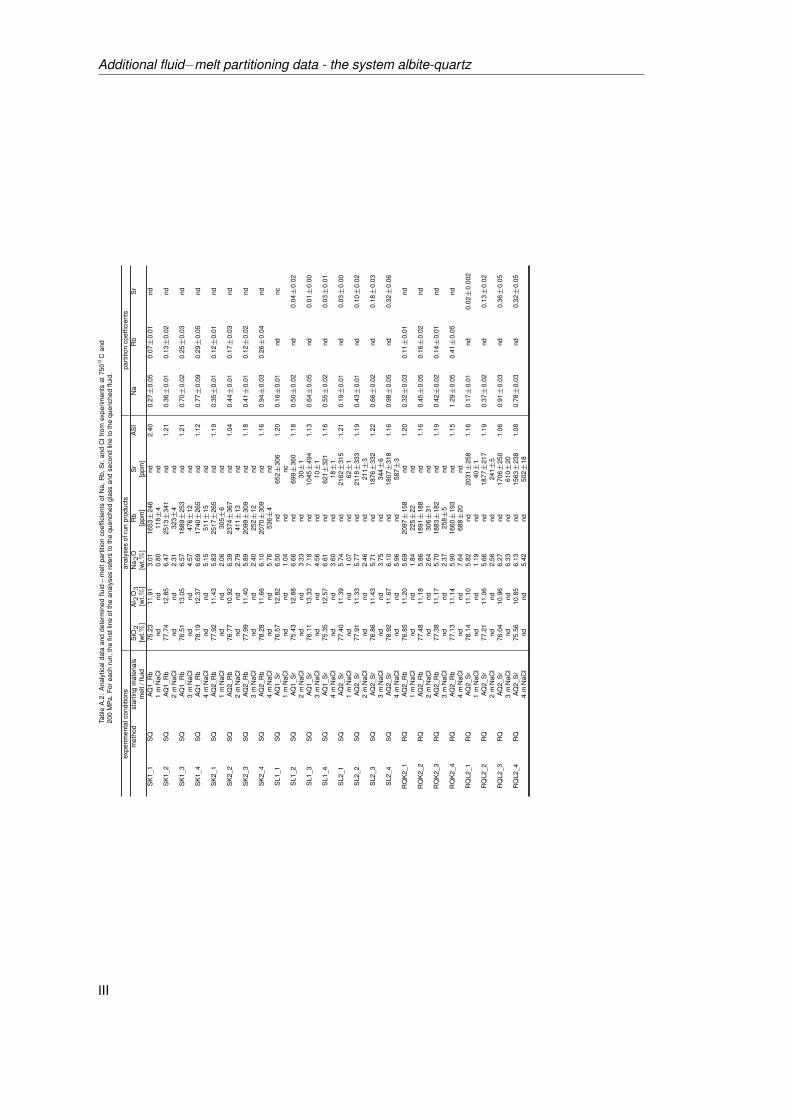
ii
“thesis_report_old” — 2010/4/26 — 13:54 — page III — #126 ii
ii
ii
Additional fluid−melt partitioning data - the system albite-quartz
Tab l
eA
.2:
Ana
lytic
alda
taan
dde
term
ined
fluid−
mel
tpar
titio
nco
effic
ient
sof
Na,
Rb,
Sr,
and
Clf
rom
expe
rimen
tsat
750◦
Can
d20
0M
Pa.
Fore
ach
run,
the
first
line
ofth
ean
alys
esre
fers
toth
equ
ench
edgl
ass
and
seco
ndlin
eto
the
quen
ched
fluid
.
expe
r imen
talc
ondi
tions
anal
yses
ofru
npr
oduc
tspa
rtiti
onco
effic
ient
sm
etho
dst
artin
gm
ater
ials
SiO
2A
l 2O3
Na 2
OR
bS
rA
SI
Na
Rb
Sr
mel
t /flu
id[w
t.%]
[wt. %
][w
t.%]
[ppm
][p
pm]
SK
1_1
SQ
AQ
1_R
b75
.23
11.9
13.
0116
53±
246
nd2.
400.
27±
0.05
0.07±
0.01
nd1
mN
aCl
ndnd
0.80
118±
4nd
SK
1_2
SQ
AQ
1_R
b77
.74
12.8
56.
4725
13±
341
nd1.
210.
36±
0.01
0.13±
0.02
nd2
mN
aCl
ndnd
2.31
323±
4nd
SK
1_3
SQ
AQ
1_R
b76
.51
13.0
56.
5718
89±
253
nd1.
210.
70±
0.02
0.25±
0.03
nd3
mN
aCl
ndnd
4.57
476±
12nd
SK
1_4
SQ
AQ
1_R
b78
.19
12.3
76.
6917
40±
265
nd1.
120.
77±
0.09
0.29±
0.05
nd4
mN
aCl
ndnd
5.15
511±
15nd
SK
2_1
SQ
AQ
2_R
b77
.92
11.4
35.
8325
17±
265
nd1.
190.
35±
0.01
0.12±
0.01
nd1
mN
aCl
ndnd
2.06
305±
6nd
SK
2_2
SQ
AQ
2_R
b76
.77
10.9
26.
3923
74±
367
nd1.
040.
44±
0.01
0.17±
0.03
nd2
mN
aCl
ndnd
2.79
411±
13nd
SK
2_3
SQ
AQ
2_R
b77
.99
11.4
05.
8920
99±
309
nd1.
180.
41±
0.01
0.12±
0.02
nd3
mN
aCl
ndnd
2.40
252±
12nd
SK
2_4
SQ
AQ
2_R
b78
.28
11.6
66.
1020
70±
309
nd1.
160.
94±
0.03
0.26±
0.04
nd4
mN
aCl
ndnd
5.76
536±
4nd
SL1
_1S
QA
Q1_
Sr
76.5
712
.82
6.50
nd65
2±30
61.
200.
16±
0.01
ndnc
1m
NaC
lnd
nd1.
04nd
ncS
L1_2
SQ
AQ
1_S
r75
.43
12.8
86.
66nd
699±
360
1.18
0.50±
0.02
nd0.
04±
0.02
2m
NaC
lnd
nd3.
33nd
30±
1S
L1_3
SQ
AQ
1_S
r76
.11
13.3
37.
18nd
1045±
494
1.13
0.64±
0.05
nd0.
01±
0.00
3m
NaC
lnd
nd4.
56nd
10±
1S
L1_4
SQ
AQ
1_S
r75
.35
12.5
76.
61nd
621±
321
1.16
0.55±
0.02
nd0.
03±
0.01
4m
NaC
lnd
nd3.
60nd
18±
1S
L2_1
SQ
AQ
2_S
r77
.40
11.3
95.
74nd
2162±
315
1.21
0.19±
0.01
nd0.
03±
0.00
1m
NaC
lnd
nd1.
07nd
62±
1S
L2_2
SQ
AQ
2_S
r77
.91
11.3
35.
77nd
2118±
333
1.19
0.43±
0.01
nd0.
10±
0.02
2m
NaC
lnd
nd2.
46nd
211±
3S
L2_3
SQ
AQ
2_S
r76
.86
11.4
35.
71nd
1876±
332
1.22
0.66±
0.02
nd0.
18±
0.03
3m
NaC
lnd
nd3.
75nd
344±
6S
L2_4
SQ
AQ
2_S
r78
.92
11.6
76.
10nd
1807±
318
1.16
0.98±
0.05
nd0.
32±
0.06
4m
NaC
lnd
nd5.
96nd
587±
3R
QK
2_1
RQ
AQ
2_R
b76
.85
11.2
05.
6920
97±
158
nd1.
200.
32±
0.03
0.11±
0.01
nd1
mN
aCl
ndnd
1.84
225±
22nd
RQ
K2_
2R
QA
Q2_
Rb
77.4
811
.18
5.86
1891±
188
nd1.
160.
45±
0.05
0.16±
0.02
nd2
mN
aCl
ndnd
2.64
306±
31nd
RQ
K2_
3R
QA
Q2_
Rb
77.3
811
.17
5.70
1883±
182
nd1.
190.
42±
0.02
0.14±
0.01
nd3
mN
aCl
ndnd
2.37
258±
5nd
RQ
K2_
4R
QA
Q2_
Rb
77.1
311
.14
5.90
1660±
193
nd1.
151.
29±
0.05
0.41±
0.05
nd4
mN
aCl
ndnd
7.64
688±
20nd
RQ
L2_1
RQ
AQ
2_S
r78
.14
11.1
05.
82nd
2031±
258
1.16
0.17±
0.01
nd0.
02±
0.00
21
mN
aCl
ndnd
1.19
nd40±
1R
QL2
_2R
QA
Q2_
Sr
77.2
111
.06
5.66
nd18
77±
217
1.19
0.37±
0.02
nd0.
13±
0.02
2m
NaC
lnd
nd2.
56nd
241±
5R
QL2
_3R
QA
Q2_
Sr
76.0
410
.96
6.27
nd17
06±
250
1.06
0.91±
0.03
nd0.
36±
0.05
3m
NaC
lnd
nd6.
33nd
610±
20R
QL2
_4R
QA
Q2_
Sr
75.5
610
.85
6.13
nd15
63±
238
1.08
0.78±
0.03
nd0.
32±
0.05
4m
NaC
lnd
nd5.
42nd
502±
18
III
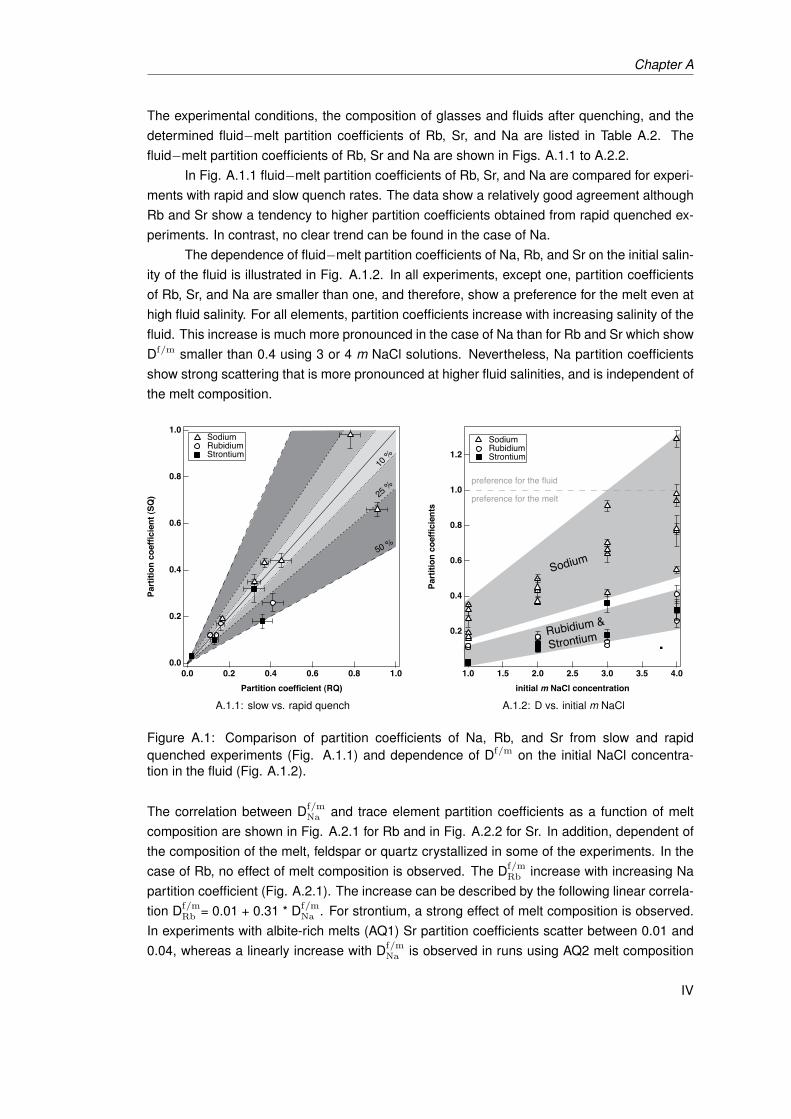
ii
“thesis_report_old” — 2010/4/26 — 13:54 — page IV — #127 ii
ii
ii
Chapter A
The experimental conditions, the composition of glasses and fluids after quenching, and thedetermined fluid−melt partition coefficients of Rb, Sr, and Na are listed in Table A.2. Thefluid−melt partition coefficients of Rb, Sr and Na are shown in Figs. A.1.1 to A.2.2.
In Fig. A.1.1 fluid−melt partition coefficients of Rb, Sr, and Na are compared for experi-ments with rapid and slow quench rates. The data show a relatively good agreement althoughRb and Sr show a tendency to higher partition coefficients obtained from rapid quenched ex-periments. In contrast, no clear trend can be found in the case of Na.
The dependence of fluid−melt partition coefficients of Na, Rb, and Sr on the initial salin-ity of the fluid is illustrated in Fig. A.1.2. In all experiments, except one, partition coefficientsof Rb, Sr, and Na are smaller than one, and therefore, show a preference for the melt even athigh fluid salinity. For all elements, partition coefficients increase with increasing salinity of thefluid. This increase is much more pronounced in the case of Na than for Rb and Sr which showDf/m smaller than 0.4 using 3 or 4 m NaCl solutions. Nevertheless, Na partition coefficientsshow strong scattering that is more pronounced at higher fluid salinities, and is independent ofthe melt composition.
10 %
25 %
50 %
1.0
0.8
0.6
0.4
0.2
0.0
Part
ition
coe
ffici
ent (
SQ)
1.00.80.60.40.20.0Partition coefficient (RQ)
Sodium Rubidium Strontium
A.1.1: slow vs. rapid quench
Sodium
Rubidium &
Strontium
preference for the fluid
preference for the melt
1.2
1.0
0.8
0.6
0.4
0.2
Part
ition
coe
ffici
ents
4.03.53.02.52.01.51.0initial m NaCl concentration
Sodium Rubidium Strontium
A.1.2: D vs. initial m NaCl
Figure A.1: Comparison of partition coefficients of Na, Rb, and Sr from slow and rapidquenched experiments (Fig. A.1.1) and dependence of Df/m on the initial NaCl concentra-tion in the fluid (Fig. A.1.2).
The correlation between Df/mNa and trace element partition coefficients as a function of melt
composition are shown in Fig. A.2.1 for Rb and in Fig. A.2.2 for Sr. In addition, dependent ofthe composition of the melt, feldspar or quartz crystallized in some of the experiments. In thecase of Rb, no effect of melt composition is observed. The Df/m
Rb increase with increasing Napartition coefficient (Fig. A.2.1). The increase can be described by the following linear correla-tion Df/m
Rb = 0.01 + 0.31 * Df/mNa . For strontium, a strong effect of melt composition is observed.
In experiments with albite-rich melts (AQ1) Sr partition coefficients scatter between 0.01 and0.04, whereas a linearly increase with Df/m
Na is observed in runs using AQ2 melt composition
IV
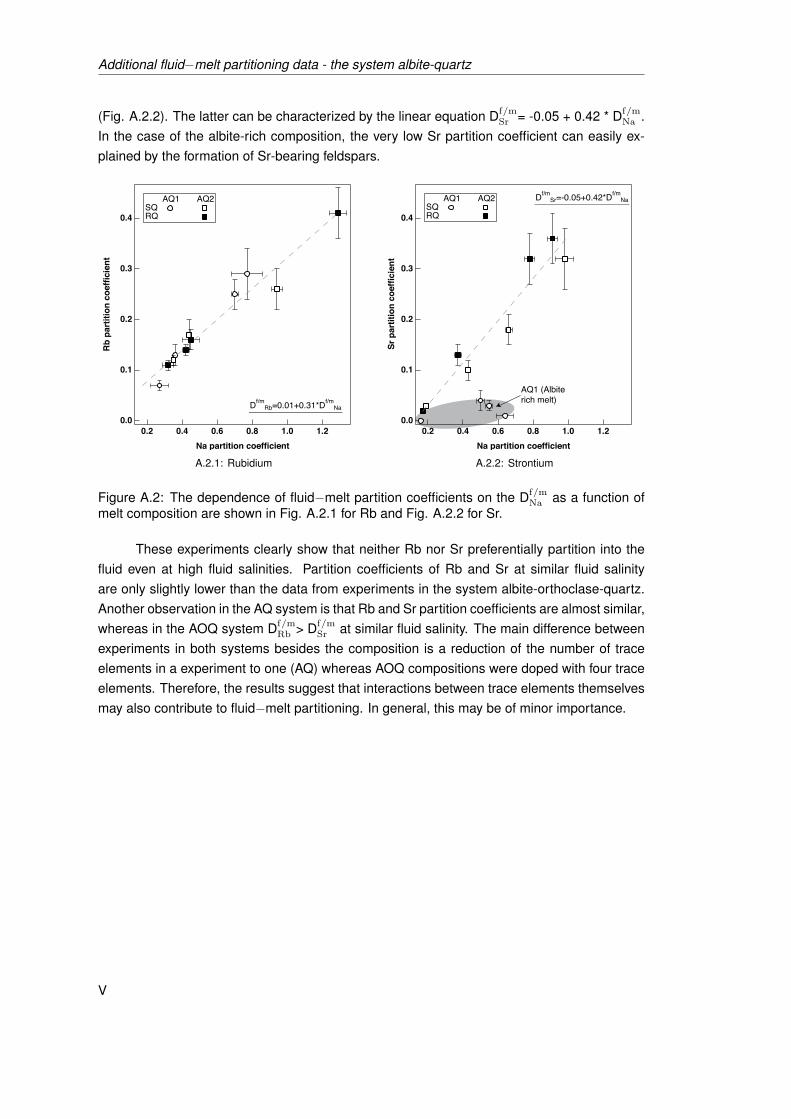
ii
“thesis_report_old” — 2010/4/26 — 13:54 — page V — #128 ii
ii
ii
Additional fluid−melt partitioning data - the system albite-quartz
(Fig. A.2.2). The latter can be characterized by the linear equation Df/mSr = -0.05 + 0.42 * Df/m
Na .In the case of the albite-rich composition, the very low Sr partition coefficient can easily ex-plained by the formation of Sr-bearing feldspars.
0.4
0.3
0.2
0.1
0.0
Rb
part
ition
coe
ffici
ent
1.21.00.80.60.40.2Na partition coefficient
AQ1 AQ2SQRQ
Df/mRb=0.01+0.31*Df/m
Na
A.2.1: Rubidium
AQ1 (Albiterich melt)
0.4
0.3
0.2
0.1
0.0
Sr p
artit
ion
coef
ficie
nt
1.21.00.80.60.40.2Na partition coefficient
AQ1 AQ2SQRQ
Df/mSr=-0.05+0.42*Df/m
Na
A.2.2: Strontium
Figure A.2: The dependence of fluid−melt partition coefficients on the Df/mNa as a function of
melt composition are shown in Fig. A.2.1 for Rb and Fig. A.2.2 for Sr.
These experiments clearly show that neither Rb nor Sr preferentially partition into thefluid even at high fluid salinities. Partition coefficients of Rb and Sr at similar fluid salinityare only slightly lower than the data from experiments in the system albite-orthoclase-quartz.Another observation in the AQ system is that Rb and Sr partition coefficients are almost similar,whereas in the AOQ system Df/m
Rb > Df/mSr at similar fluid salinity. The main difference between
experiments in both systems besides the composition is a reduction of the number of traceelements in a experiment to one (AQ) whereas AOQ compositions were doped with four traceelements. Therefore, the results suggest that interactions between trace elements themselvesmay also contribute to fluid−melt partitioning. In general, this may be of minor importance.
V

ii
“thesis_report_old” — 2010/4/26 — 13:54 — page VI — #129 ii
ii
ii
Appendix B
Methods for fluid analyses inquenched experiments
Inductively-coupled plasma−optical emission spectrometry and Ion Chromatography are usedto determine the element concentrations in fluids from quenched experiments. Due to therelatively high fluid amount that is needed for the analyses, measurements are carried out inH2O−diluted samples. The results are recalculated to the weight of the undiluted fluid. This isdone by subtracting the weight of capsule material and quenched glass from the weight of theunopened capsule after the run.
B.1 Inductively-coupled plasma - optical emission spectrom-etry
The measurements were performed with a simultaneous inductively−coupled plasma− opticalemission spectrometry (ICP−OES, Varian Vista-MPX, Institut für Geowissenschaften, Univer-sität Potsdam) coupled to a V-groove nebulizer and equipped with a charge coupled device(CCD). The ICP conditions are shown in Tab. B.1.
Table B.1: ICP−OES instrumental conditions
Plasma ArgonRF generator power [kW] 1.2Plasma gas flow rate [L min−1] 15.0Auxiliary gas flow rate [L min−1] 1.5Nebulizer flow rate [L min−1] 0.75View high [mm] 10Replicates 3Sample uptake [s] 30Rinse time [s] 10Pump rate [rpm] 15
The fluids are analyzed for Na, K, Si, Al, Rb, Sr, La, Yb and Y. The calibration for each elementwas performed using a blank and two standard solutions. Standard solution one (two) contains
VI

ii
“thesis_report_old” — 2010/4/26 — 13:54 — page VII — #130 ii
ii
ii
Methods for fluid analyses in quenched experiments
10 (25) mg/l Na and K, 2.5 (10) mg/l Si and Al, 1.25 (2.5) mg/l Rb and Sr, and 0.5 (1) mg/lLa, Y and Yb. Argon was used as internal standard. For each element an emission line waschosen, preferably the most intensive one and undisturbed by emission lines of other elements(Tab. B.2). The detection limit (dl, B.2) of each element was determined experimentally usingreplicate measurements of a standard solution that contains 0.1 mg/l of each element, andcalculated using
dlX = cX · 3 ·√B/Inet
where cX is the concentration of element X in the standard solution, B is the mean value ofthe background signal, and Inet is the mean signal from the net intensity.
Each sample was measured three times, and the mean value is used for determinationof element concentrations.
Table B.2: Emission lines (upper line, [nm]) and detection limits (lower line, [mg/l]) for ICPanalyses.
Na K Si Al Rb588.995 766.491 288.158 396.152 780.026
0.02 0.23 0.05 0.06 0.14Sr Ba La Y Yb
407.771 455.403 408.671 360.074 328.9370.0004 0.002 0.01 0.01 0.004
VII

ii
“thesis_report_old” — 2010/4/26 — 13:54 — page VIII — #131 ii
ii
ii
Chapter B
B.2 Ion Chromatography
Ion chromatography (IC, DIONEX DX 100 or 120, Helmholtz-Zentrum Potsdam Deutsches Ge-oForschungsZentrum) is used to determine the anion concentrations, e.g., fluoride, chloride,nitrate, and sulfate in aqueous solutions. The anions are separated based on their differentialaffinity for a low capacity, strongly basic anion exchange resin (Small et al., 1975). Here, wedetermine the concentration of SrCl− in fluids from experiments using chloridic starting so-lutions. The operating conditions are listed in Tab. B.3. The calibration is accomplished byfive standard solutions containing 20 to 100 mg/l SrCl−. The calibration curve is determinedfrom the peak area acquired for each different calibration level using a linear interpolation. Thecorrelation coefficient (R2) has a value of 0.995. The concentration of SrCl− in the sample isdetermined using
xCl = (K1 · areaCl) + K0
where xCl is the concentration of SrCl− in the sample, areaCl is the area of SrCl− in thesample, and K1 and K0 are the slope and the y−axis intercept of the chlorine calibration curve.
Table B.3: Operation conditions for determination of chloride by Ion Chromatography
Guard column AG9HCAnalytical column AS9HCSuppresser ASRS 300 Anion self-regenerating suppresserEluent 9 mM Na2CO3 sodium carbonateFlow rate 1.0 ml/min (eluent)Detector cell DS4 Detection stabilizerSample loop 50 µlSampler AS50 Automated sampler
VIII

ii
“thesis_report_old” — 2010/4/26 — 13:54 — page IX — #132 ii
ii
ii

ii
“thesis_report_old” — 2010/4/26 — 13:54 — page X — #133 ii
ii
ii
Appendix C
Curriculum Vitae
Manuela Borchert
Universität PotsdamInstitut für GeowissenschaftenKarl-Liebknecht-Str. 24; Haus 2714476 Potsdam-GolmGermanyDate of Birth: April 13, 1979Citizenship: german
Phone: +49 (0)331 977 5787Fax: +49 (0)331 977 5700Email: [email protected]
Education
since 10/2006: Ph.D. student, Universität Potsdam
Supervisors: Prof. R. Oberhänsli (Uni. Potsdam) and Dr. Christian Schmidt (GFZPotsdam)
Project leader: Dr. Max Wilke (GFZ Potsdam)
Project: Interactions between aqueous fluids and silicate melts (DFG projects Wi2000/3-1, Wi2000/3-2)
09/2006: Diploma in mineralogy, Universität Potsdam
Supervisors: Dr. Max Wilke, Dr. Christian Schmidt
diploma thesis: "Spurenelementverteilung zwischen silikatischen Schmelzen undwässrigem Fluid − eine experimentelle Studie"
10/1999 − 09/2006: Studies of mineralogy, Universität Potsdam,
04/2000 - 03/2001: academic leave of absence (pregnancy)
10/1998 − 09/1999: Studies of mathematics, Universität Potsdam,
X

ii
“thesis_report_old” — 2010/4/26 — 13:54 — page XI — #134 ii
ii
ii
Curriculum Vitae
Scholarships
DAAD Fachkursstipendium für Doktoranden (HERCULES Specialized Course on Syn-chrotron Radiation and Neutron Techniques in Environmental Sciences (ESRF, 18 to 24May 2008))
Fields of Interest
Experimental Mineralogy, Petrology and Geochemistry
(Trace) element partitioning between melts, fluids and minerals
HP/HT techniques
Synchrotron Radiation (SR) applications in earth sciences
Academic Experience
Universität Potsdam, Institut für Geowissenschaften
field mapping course, Spain, March 2008
research assistant (exercises & tutorials)
supervision of a diploma thesis
Research
Manuscripts in preparation
Borchert, M.; Wilke, M.; Schmidt, C.; Kvashnina, K.: Strontium complexation in silicatefluids at high PT: insights from XANES spectroscopy.
Borchert, M.; Wilke, M.; Schmidt, C.; Cauzid, J.; R. Tucoulou: Partitioning of Ba, La, Yband Y between haplogranitic melts and aqueous solutions: an experimental study.
Publications
Borchert, M.; Wilke, M.; Schmidt, C.; Rickers, K. (in press): Rb and Sr partitioning be-tween haplogranitic melts and aqueous solutions, Geochimica et Cosmochimica Acta(doi:10.1016/j.gca.2009.10.033).
Borchert, M.; Wilke, M.; Schmidt, C.; Rickers, K. (2009): Partitioning and equilibrationof Rb and Sr between silicate melts and aqueous fluids, Chemical Geology 259, 39-47(doi:10.1016/j.chemgeo.2008.10.019)
XI

ii
“thesis_report_old” — 2010/4/26 — 13:54 — page XII — #135 ii
ii
ii
Chapter C
Borchert, M.; Wilke, M.; Schmidt, C.; Rickers, K. (2008): Partitioning of Rb and Sr be-tween haplogranitic melts and aqueous fluids, Geochimica et Cosmochimica Acta, 72,12, Suppl. 1, A97.
Borchert, M.; Schmidt, C.; Wilke, M.; Rickers-Appel, K. (2007): In-situ study of Rb equili-bration between silicate melts and aqueous fluids, HASYLAB Annual Report, 1593-1594.
Borchert, M.; Wilke, M.; Schmidt, C.; Rickers-Appel, K.; Koepke, J. (2007): Partitioningof Rb and Sr between haplogranitic melts and aqueous fluids: Information from in situexperiments using SR-XRF, Geochimica et Cosmochimica Acta, 71, 15, Suppl. 1, A109.
Conference Presentations
Schmidt, C.; Wilke, M.; Borchert, M.; Rickers,K. (2009): Determination of fluid densitiesin hydrothermal diamond-anvil cell experiments using SR-XRF intensities, XX ECROFImeeting, Granada (Sep, 23-25) - Poster.
Borchert, M.; Wilke, M.; Schmidt, C.; Rickers,K.; Kvashnina, K. (2009): Partitioning of Rband Sr between silicate melts and aqueous fluids: effect of fluid and melt composition,XX ECROFI meeting, Granada (Sep, 23-25) - Poster.
Ebert, M.; Borchert, M.; Wilke, M. (2009): Partitioning of Barium and Lead betweenaqueous fluids and haplogranitic melts at 750 C and 200 MPa, DMG conference, Halle(Sep, 14-16) - Poster – Posterpreis DMG 2009 –.
Borchert, M.; Wilke, M.; Schmidt, C.; Kvashnina, K. (2009): Partitioning of Rb and Srbetween silicate melts and aqueous fluids: insights from Sr complexation analysis byXANES, DMG conference, Halle (Sep, 14-16) - Poster.
Borchert, M.; Wilke, M.; Schmidt, C.; Rickers, K. (2009): Rubidium and Strontium parti-tioning between haplogranitic melts and aqueous solutions, DMG Sektionstreffen Petrologie-Petrophysik, Mainz (May, 15-16) - Talk.
Borchert, M.; Wilke, M.; Schmidt, C.; Rickers, K. (2008): Fluid-melt partitioning of Rband Sr: Classical quench vs. in-situ experiments, DMG conference, Berlin (Sep, 14-17)- Talk.
Borchert, M.; Wilke, M.; Schmidt, C.; Rickers, K. (2008): Effect of melt composition onthe partitioning of Rb and Sr between haplogranitic melts and aqueous solutions at 750C and 200 to 500 MPa, EMPG XII Conference, Innsbruck (Sep, 08-11) - Talk.
Borchert, M.; Wilke, M.; Schmidt, C.; Rickers, K. (2008): Partitioning of Rb and Sr be-tween silicate melts and aqueous fluids, Goldschmidt Conference, Vancouver (July, 14-18) - Poster.
Borchert, M.; Wilke, M.; Schmidt, C.; Rickers, K. (2008): Partitioning and equilibration ofRb and Sr between silicate melts and aqueous fluids, DMG Sektionstreffen Petrologie-Petrophysik, Tübingen (May, 30-31) - Talk.
XII

ii
“thesis_report_old” — 2010/4/26 — 13:54 — page XIII — #136 ii
ii
ii
Curriculum Vitae
Borchert, M.; Wilke, M.; Schmidt, C.; Rickers, K. (2008): Partitioning and equilibrationof Rb and Sr between silicate melts and aqueous fluids, Hercules Specialized Courses(HSC8) on Synchrotron Radiation and Neutrons Techniques in Environmental Sciencesat ESRF, Grenoble (May, 19-23) - Poster.
Borchert, M.; Wilke, M.; Schmidt, C.; Rickers-Appel, K.; Koepke, J. (2007): Partitioningof Rb and Sr between haplogranitic melts and aqueous fluids: Information from in situexperiments using SR-XRF, Goldschmidt Conference, Cologne (Aug. 19- 24) - Poster.
Borchert, M.; Wilke, M.; Schmidt, C.; Rickers, K. (2007): Bestimmung von Verteilungsko-effizienten zwischen haplogranitischen Schmelzen und wässrigen Fluiden - vorläufigeErgebnisse, DMG Sektionstreffen Petrologie-Petrophysik, Kiel (June, 09-10) - Talk.
Borchert M., Wilke M., Schmidt C. (2006) Experimental study on the trace element parti-tioning between haplogranitic melts and chloridic aqueous fluid. DMG Conference (Sep.25-27) - Talk.
XIII
ii
“thesis_report_old” — 2010/4/26 — 13:54 — page XIV — #137 ii
ii
ii
Erklärung der Selbstständigkeit
Hiermit versichere ich, die vorliegende Arbeit selbstständig verfasst und keine anderen als dieangegebenen Quellen und Hilfsmittel benutzt sowie die Zitate deutlich kenntlich gemacht zuhaben.
Potsdam, 26. April 2010
Manuela Borchert
XIV