basin analysis and aqueous chemistry of fluids in the
TRANSCRIPT
Graduate Theses, Dissertations, and Problem Reports
2010
Basin analysis and aqueous chemistry of fluids in the Oriskany Basin analysis and aqueous chemistry of fluids in the Oriskany
Sandstone, Appalachian Basin, USA Sandstone, Appalachian Basin, USA
Jamie C. Skeen West Virginia University
Follow this and additional works at: https://researchrepository.wvu.edu/etd
Recommended Citation Recommended Citation Skeen, Jamie C., "Basin analysis and aqueous chemistry of fluids in the Oriskany Sandstone, Appalachian Basin, USA" (2010). Graduate Theses, Dissertations, and Problem Reports. 2978. https://researchrepository.wvu.edu/etd/2978
This Thesis is protected by copyright and/or related rights. It has been brought to you by the The Research Repository @ WVU with permission from the rights-holder(s). You are free to use this Thesis in any way that is permitted by the copyright and related rights legislation that applies to your use. For other uses you must obtain permission from the rights-holder(s) directly, unless additional rights are indicated by a Creative Commons license in the record and/ or on the work itself. This Thesis has been accepted for inclusion in WVU Graduate Theses, Dissertations, and Problem Reports collection by an authorized administrator of The Research Repository @ WVU. For more information, please contact [email protected].

Basin Analysis and Aqueous Chemistry of Fluids in the
Oriskany Sandstone, Appalachian Basin, USA.
by
Jamie C. Skeen
Thesis submitted to the Eberly College of Arts and Sciences at West Virginia University in partial
fulfillment of the requirements for the degree of
Master of Science in Geology
Approved by
Timothy Carr, Ph.D., Committee Chairperson Joseph Donovan, Ph.D. Dorothy Vesper, Ph.D.
Department of Geology & Geography
Morgantown, West Virginia
2010
Keywords: CO2 sequestration; Appalachian basin; Oriskany Sandstone

ABSTRACT
Basin Analysis and Aqueous Chemistry of Fluids in the Oriskany Sandstone, Appalachian Basin,
USA.
Jamie C Skeen
The Oriskany Sandstone of the Appalachian basin is a widely distributed saline aquifer
which has produced large quantities of hydrocarbons. Currently the Oriskany is host to
numerous gas storage fields and is a potential target for large-scale geologic storage of CO2.
Published and unpublished data of rock characteristics, pressure, temperature, and formation
water geochemistry, along with new brine samples were integrated within a geographical
information system to better understand the regional-scale hydrogeological regime and its
relation to geologic CO2 sequestration potential. The up-dip flow of the Oriskany Sandstone
formation waters is generally controlled by outcrops at high elevation to the east and at low
elevation to the west, and opposed by increased salinity-induced buoyancy forces down-dip. The
flow pattern is substantiated by the salinity distributions, with relatively lower salinity at
recharge to the east and west due to mixing with fresh meteoric water and higher salinity at
depth. The Oriskany is generally underpressured, which would aid in sequestering CO2 by
lowering injection and displacement pressures. The geothermal gradient for the Appalachain
basin, approximately 20°C/km, is lower than what is expected for cratonic rocks. This could
lower the potential for and relative speed of CO2 migration. Large variations in brine
geochemistry, temperature, and pressure will have a major influence on potential for long-term
entrapment of CO2 in the Oriskany Sandstone.
iii
ACKNOWLEDGEMENTS
I would like to extend my sincere thanks to Dr. Tim Carr, my advisor for this project, for
his expertise, support, and patience throughout this study.
I would like to thank Southeast Regional Carbon Sequestration Partnership (SECARB)
and Marshall Miller and Associates, Inc. for funding this thesis. I would like to thank those who
provided data and samples: Gregory Wrightstone of Texas Keystone, Jason Stewart of
Dominion Exploration & Production, Mark Gredell of Spectra Energy, Kerima Haddad and
Kristi Jacobs formerly of Chesapeake Energy, Richard Silber, Joe Hileman, and Bob Gilmore of
NiSource, Babatunde Ojo of DCNR—Bureau of Topographic and Geologic Survey, Jeff Jahn of
US Silica Company, Ron Riley of the Ohio Division of Geological Survey and Eb Warner. I
would also like to the West Virginia Stat GIS Technical Center for scanning maps and providing
other data that was used in the making of geologic maps.
I would like to thank my parents, James and Helene Uphold for their support and
encouragement. Thanks to all of my friends, especially Angela Lilly and Megan Ganak, for
believing in me and being there when I needed a sympathetic ear. Most importantly of all I
want to thank my husband, Joe, for his love, patience and support through this ordeal.

iv
TABLE OF CONTENTS
ACKNOWLEDGEMENTS ...................................................................................................................................... iii
LIST OF FIGURES ....................................................................................................................................................vi
LIST OF TABLES ................................................................................................................................................... viii
1 INTRODUCTION .............................................................................................................................................. 1
1.1 BACKGROUND INFORMATION................................................................................................................... 3
1.2 GEOLOGIC SETTING AND REGIONAL STRATIGRAPHY .......................................................................... 8
1.3 PREVIOUS INVESTIGATIONS .................................................................................................................... 12
1.4 OBJECTIVES ................................................................................................................................................ 13
1.4.1 BASIN FRAMEWORK ...................................................................................................................... 13
1.4.2 ROCK PROPERTIES .......................................................................................................................... 14
1.4.3 FLOW AND CHEMISTRY OF FORMATION WATER ................................................................... 14
2 BASIN FRAMEWORK ................................................................................................................................... 15
2.1 METHODOLOGY ......................................................................................................................................... 15
2.2 RESULTS ....................................................................................................................................................... 15
2.2.1 STRUCTURE CONTOUR .................................................................................................................. 15
2.2.2 DEPTH ................................................................................................................................................ 17
2.2.3 ISOPACH ............................................................................................................................................ 20
3 ROCK PROPERTIES ..................................................................................................................................... 22
3.1 METHODOLOGY ......................................................................................................................................... 22
3.2 RESULTS ....................................................................................................................................................... 22
4 FLOW VARIABLES AND CHEMISTRY OF FORMATION WATER ................................................... 25
v
4.1 METHODOLOGY ......................................................................................................................................... 25
4.1.1 TEMPERATURE ................................................................................................................................ 25
4.1.2 PRESSURE.......................................................................................................................................... 27
4.1.3 TOTAL DISSOLVED SOLIDS (TDS) ............................................................................................... 29
4.1.4 GROSS FLUID FLOW ....................................................................................................................... 30
4.2 RESULTS ....................................................................................................................................................... 31
4.2.1 TEMPERATURE ................................................................................................................................ 31
4.2.2 PRESSURE.......................................................................................................................................... 33
4.2.3 TOTAL DISSOLVED SOLIDS (TDS) ............................................................................................... 35
4.2.4 GROSS FLUID FLOW ....................................................................................................................... 38
5 ANALYSIS OF RESULTS .............................................................................................................................. 41
5.1 BASIN FRAMEWORK ................................................................................................................................... 41
5.2 ROCK PROPERTIES .................................................................................................................................... 41
5.3 FLOW VARIABLES AND CHEMISTRY OF FORMATION WATER ............................................................ 41
6 INTERPRETATION ....................................................................................................................................... 43
7 CONCLUSIONS .............................................................................................................................................. 52
8 REFERENCES CITED ................................................................................................................................... 54
9 TABLES ............................................................................................................................................................ 63
APPENDIX I .............................................................................................................................................................. 67
APPENDIX II ............................................................................................................................................................ 70
APPENDIX III ........................................................................................................................................................... 80
APPENDIX IV ......................................................................................................................................................... 102

vi
LIST OF FIGURES
Figure 1-1. Approximate time frame for physical and chemical trapping mechanisms ................ 5
Figure 1-2. At depths greater than 800 meters, injected CO2 is a supercritical fluid .................... 7
Figure 1-3. Study area within the Appalachian basin .................................................................... 9
Figure 1-4. Stratigraphic column of Lower Devonian. ................................................................ 11
Figure 2-1. Structure on the top of the Oriskany Sandstone. ....................................................... 16
Figure 2-2. Depth to top of Oriskany Sandstone. ........................................................................ 18
Figure 2-3. Oriskany Sandstone potential sequestration area ...................................................... 19
Figure 2-3. Oriskany Sandstone thickness estimate .................................................................... 21
Figure 3-1. Oriskany Sandstone porosity map ............................................................................. 24
Figure 4-1. Oriskany Sandstone formation temperature (°C) plotted against depth (m).. ........... 26
Figure 4-2. Oriskany Sandstone formation pressure (kPa) plotted against depth (m). ................ 28
Figure 4-3. Oriskany Sandstone formation temperature (°C) at top of structure......................... 32
Figure 4-4. Oriskany Sandstone formation pressure (kPa) at top of structure ............................ 34
Figure 4-5. Oriskany Sandstone TDS (mg/L) map.. .................................................................... 36
Figure 4-6. Oriskany Sandstone Ca/Mg concentration ratio map ................................................ 37
Figure 4-7. Oriskany Sandstone formation water density map.................................................... 39

vii
Figure 4-8. Oriskany Sandstone equivalent hydraulic head ........................................................ 40
Figure 6-1. Oriskany Sandstone estimated pore volume map ..................................................... 45
Figure 6-2. Oriskany Sandstone total storage capacity estimate low efficiency factor. ............... 46
Figure 6-3. Oriskany Sandstone total storage capacity estimate high efficiency factor. ............. 47
Figure 6-4. Oriskany Sandstone solubility storage capacity estimate low efficiency factor.. ..... 50
Figure 6-5. Oriskany Sandstone solubility storage capacity estimate high efficiency factor. ..... 51

viii
LIST OF TABLES
Table 1. Oriskany Sandstone porosity data.................................................................................. 63
Table 2. Criteria for culling formation water analyses ................................................................ 64
Table 3. Polynomial fit correlating formation temperature to density of CO2–saturated brine ... 65
Table 4. Polynomial fit correlating temperature to formation CO2 concentration ...................... 66
1
1 INTRODUCTION
The increasing level of greenhouse gases (GHGs) in the atmosphere is a growing concern as
a contributing factor to global climate change. Atmospheric levels of CO2 have risen
significantly from preindustrial levels of 280 parts per million (ppm) to present levels of 384
ppm. Evidence suggests the observed rise in atmospheric CO2 levels is the result of expanded
use of fossil fuels (Tans, 2008). The United States contributes approximately 20% of the world‘s
GHG emissions, most of which is due to the combustion of fossil fuels (5.6 billion metric tons of
CO2 per year; EIA, 2009). Of this amount, 3.8 billion metric tons is from stationary sources,
such as power plants, ethanol plants, cement plants, etc. Predictions of increased global fossil
energy use during this century imply a continued increase in carbon emissions, and rising CO2
levels in the atmosphere unless a major change is made in how carbon is managed (EIA, 2009).
Carbon capture and storage in deep geologic formations is one of several carbon
management options being studied for reducing anthropogenic CO2 (Bachu, 2008; Dilmore et al.,
2008). This type of carbon management, referred to as geologic storage, involves injecting CO2
into depleted or near-depleted oil and gas reservoirs, deep coal beds, or deep saline aquifers
(USDOE, 1999; Birkholzer and Tsang, 2007; Dilmore et al., 2008). Geological storage
technology could be immediately applicable due to the knowledge and experience gained in
industries, such as oil and gas exploration and production, natural gas storage, and deep liquid
waste and acid gas disposal (Bachu, 2008).
It has been established that the flow of formation waters in sedimentary basins plays an
important role in the generation, migration, and accumulation of hydrocarbons (Bachu, 1995b;
Anfort et al., 2001; Carr et al., 2005). Also, a better understanding of these regional-scale

2
hydrogeological systems provides a basis to evaluate the potential for long-term containment of
CO2 storage in geologic structures (Carr et al., 2005). Specific technical issues influencing deep
CO2 storage include reservoir pore volume, injectivity, and containment mechanisms. Spatial-
variability in brine chemistry, mineralogy, pressure, temperature, porosity, formation extent, and
reservoir characteristics is poorly understood (Cook and Benson, 2005; Czernichowski-Lauriol et
al., 2006; Bachu et al., 2007; Dilmore et al., 2008). Consequently, storage capacity and potential
storage containment time need to be better established on both regional and site-specific scales.
The ideal saline aquifer for geologic storage of CO2 is comprised of porous rock saturated
with brine at sufficient depth to maintain CO2 in a supercritical condition. It must be capped by
one or more regionally extensive impermeable rock formations that enable trapping of injected
CO2 over long periods of time. In addition, areas of converging fluid flow can aid in long-term
lateral containment of injected CO2 (Bachu et al., 2007; Bachu, 2008). A saline aquifer assessed
for storage is defined as a porous and permeable body of rock containing water with total
dissolved solids (TDS) greater than 10,000 ppm, which can store large volumes of CO2. A saline
aquifer can include more than one named regionally-extensive geologic formation or be defined
as only part of a formation (Bachu et al., 2007).
The storage capacity for CO2 is a geological resource whose availability can be expressed
using the resources and reserves concept just as other energy or mineral commodities such as oil
and gas, copper, or gold are classified (CSLF, 2005; Bachu et al., 2007). A resource is a
commodity whose quantities are estimated to exist at a given time and can be currently or
potentially extracted, it can be either in-place or inferred. A reserve is a commodity whose
quantities are known to exist and be economically recoverable with current technologies and
economic conditions (Frailey et al., 2006; Bachu et al., 2007). This paper attempts to provide

3
improved geospatial data to better evaluate the Oriskany Sandstone as a regional geologic
storage resource and to influence future site screening. Site specific evaluations are beyond the
scope of this effort and will require additional geologic, geophysical, cultural, and economic
data.
More accurate estimates of porosity, salinity, and flow potential of formation water could
allow a better estimation of CO2 storage capacity, as well as indicating possible migration
directions, and information on hydrocarbon accumulation (Bachu, 1995b; Anfort et al., 2001;
Carr et al., 2005). With the use of both new and existing data, this study has analyzed the
Oriskany Sandstone throughout the study area within the Appalachian basin in terms of the
parameters that influence storage resource volume, injectivity, and long-term containment. The
often significant differences (i.e. depth, thickness, salinity, pressure, temperature, and porosity)
that exist across the extent of the Oriskany Sandstone have been taken into account. This study
has estimated the salinity, large scale potential flow of the formation water, and basin-scale
storage resource volume of the Oriskany Sandstone.
1.1 BACKGROUND INFORMATION
The concept of separating CO2 from flue gases and storing it away from the atmosphere
emerged in the late 1970‘s, and research and development into CO2 storage began in the early
1990‘s (Cook and Benson, 2005). Carbon capture and storage has become a promising option
for reducing CO2 emissions in the past decade (Benson, 2005). Three main forms of CO2 storage
have been identified: surface mineral carbonation, in oceans, and in deep geological media
(IPCC, 2005). Of these three options, only deep geological storage could be immediately
applied due to knowledge and experience gained in the oil and gas and deep liquid disposal
4
industries (Bachu, 2008). Deep geological storage has a large estimated capacity, although
unevenly distributed worldwide, and has the potential retention time of centuries to millions of
years (IPCC, 2005; Bachu et al., 2007).
Storage of CO2 within geological media is possible through a combination of physical
and chemical trapping, know as hydrodynamic trapping, that operate over different time frames
(IPCC, 2005; Bachu et al., 2007) (Figure 1-1). Physical trapping is when CO2 is immobilized as
a free gas or supercritical fluid (Bachu, 2008). Two types of physical trapping exist: (1) static
trapping in stratigraphic and structural traps, much like natural gas is trapped under a low-
permeability cap rock in gas reservoirs; and (2) residual-gas trapping as a residual, not-wetting
phase in the pore spaces of the rock. Chemical trapping occurs when CO2 dissolves in
subsurface fluid, which is referred to as solubility or ionic trapping. The dissolved CO2 can then
react directly or indirectly with the rock matrix or formation waters and form carbonate minerals,
this process is known as mineral trapping (Benson, 2005; Bachu et al., 2007). Static trapping is
the most important mechanism during and immediately after CO2 injection (Benson, 2005).
Residual-gas, solubility and mineral trapping mechanisms operate over a longer time scale, but
play a vital role in increasing the safety and security of CO2 storage after injection has ceased
(Bachu, 2008). The volume and efficiency of long-term trapping of CO2 within geologic media
is strongly influenced by the temperature, pressure, and geochemistry of the fluid and rock
matrix.
Sedimentary basins are the most probable location for geological CO2 storage. The
deposits here are typically up to many thousands of meters thick and consist of alternating layers
of sandstone and shale. Permeable and porous layers, typically sandstone or limestone, are
candidates for storage reservoirs, with porosity needed for storage capacity and higher

5
Figure 1-1. Approximate time frame for various physical and chemical trapping mechanisms
involved in CO2 sequestration. Source:
http://www.co2crc.com.au/images/geopics/trappingsecurity.jpg

6
permeability allowing CO2 injection. Overlying shale or evaporite layers of low permeability are
potential seal zones to prevent CO2 escape to the surface (Benson, 2005; Bachu, 2008). Within
sedimentary basins three categories of geological media are considered as potential storage sites
for CO2 (Bachu et al., 2007): (1) oil and gas reservoirs; (2) deep coal seams; and (3) deep saline
aquifers.
Deep saline aquifers, as defined by Bachu et al. (2007), contain water of total dissolved
solids (TDS) greater than 10,000 mg/L and are present in most sedimentary basins worldwide.
The deep saline aquifers have the largest potential storage resource capacity of all geologic
media considered as suitable storage sites, and are an immediately-available prospect for
geological CO2 storage (Cook and Benson, 2005; Bachu et al., 2007; Bachu, 2008). However,
less is typically known about deep saline aquifers because they lack sufficient subsurface data,
causing uncertainty regarding its suitability for CO2 sequestration (USDOE, 2007). The storage
capacity of such aquifers and the potential storage containment time need to be established on
regional as well as site-specific scales.
Specific-technical issues influencing deep CO2 storage include trapping mechanisms, as
well as spatial-variability in brine chemistry, mineralogy, pressure, temperature, porosity,
permeability, formation extent, and reservoir characteristics (Cook and Benson, 2005;
Czernichowski-Lauriol et al., 2006; Bachu et al., 2007; Dilmore et al., 2008). Potential saline
aquifers must meet four basic criteria for CO2 sequestration. (1) The temperature and pressure
conditions must be adequate to keep the injected CO2 in the dense supercritical or liquid phase
(at the critical point for CO2 the temperature Tc is 31.1°C and Pc is 7.83 megapascals, or MPa an
approximate depth of 800 meters; Figure 1-2). (2) The aquifer must have adequate permeability
and porosity for injectivity. (3) An adequate seal must be present to provide vertical containment

7
Figure 1-2. At depths greater than 800 meters, injected CO2 is a supercritical fluid. Source:
http://www.wvcarb.org/cc-overview.php

8
and limit flow of CO2 to the surface. (4) The TDS should be more than 10,000 mg/L, the
approximate upper limit of potable drinking water (Bachu et al., 2007; USDOE, 2007; Bachu,
2008).
1.2 GEOLOGIC SETTING AND REGIONAL STRATIGRAPHY
The Appalachian basin (Figure 1-3) is approximately 500 kilometers (km) wide and
1,000 km long and encompasses a broad area between the Canadian Shield to the north, the
Allegheny front to the east and the Cincinnati arch to the west (UTBEG, 2008). It represents
part of an ancient foreland basin in the eastern United States that contains complex geology
formed by a series of continental plate collisions. This deformation resulted in the formation of
the Appalachian Mountains and large areas of stretched, faulted, and deformed ridges and
valleys (USGS, 2008; UTBEG, 2008). The elongate, asymmetrical northeast-southwest trending
central axis of the Appalachian basin is underlain by a succession of strata greater than 3,000
meters thick (UTBEG, 2008). Overlying a major interregional unconformity in the Appalachian
basin is the Oriskany Sandstone, a widespread gas reservoir and saline aquifer (Deicchio, et al.,
1984).
The Oriskany Sandstone of the Appalachian basin represents the Deerpark stage of the
Early Devonian (Diecchio, 1985). The Oriskany Sandstone was named by Vanuxem (1839) for
its type locality in Oriskany Falls, Oneida County, New York. At this location, the Oriskany is a
white, fossiliferous quartz arenite (Opritza, 1996; Patchen and Harper, 1996). Most of the
studies done on the formation before 1930 were for purposes of clarifying the stratigraphic and
paleontological relationships of Lower Devonian and Upper Silurian rocks (for example, see
9
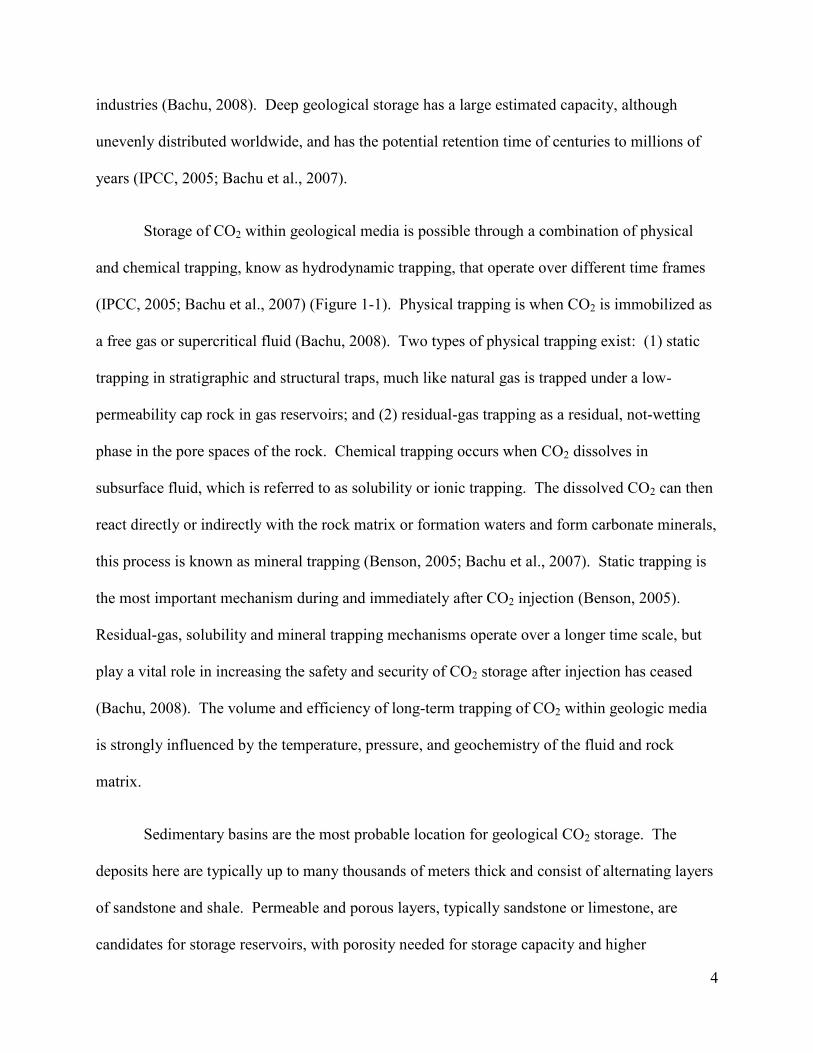
Figure 1-3. Study area within the Appalachian basin that includes the states of Maryland, New York, Ohio, Pennsylvania, and West Virginia. Green dashed lines indicate the Appalachian basin structural/geomorphic provinces of Diecchio (1985). Red lines indicate faults within the Oriskany Sandstone (MRCSP, 2008). Orange lines depict area of known Oriskany outcrop (MRCSP, 2008). Yellow hatched polygons indicate areas of ―no-sand‖ (Diecchio, 1985). Small gray circles are oil and gas wells with data. Large blue circles indicate wells with brine data.

10
Swartz, 1913). However, since 1930, the Oriskany has become one of the most important
formations for gas exploration and gas storage in the Appalachian basin. As a result, the
Oriskany has been the subject of numerous studies related to structure, stratigraphy, petrology,
petrophysics, and other topics (Diecchio et al., 1984; Deicchio, 1985).
The Oriskany is typically a fossiliferous quartzarenite cemented with locally-variable
amounts of quartz or calcite. It can be traced continuously through New York, Pennsylvania,
Ohio, Maryland, West Virginia, Virginia, and Kentucky (Diecchio, 1985; Bruner and Smosna,
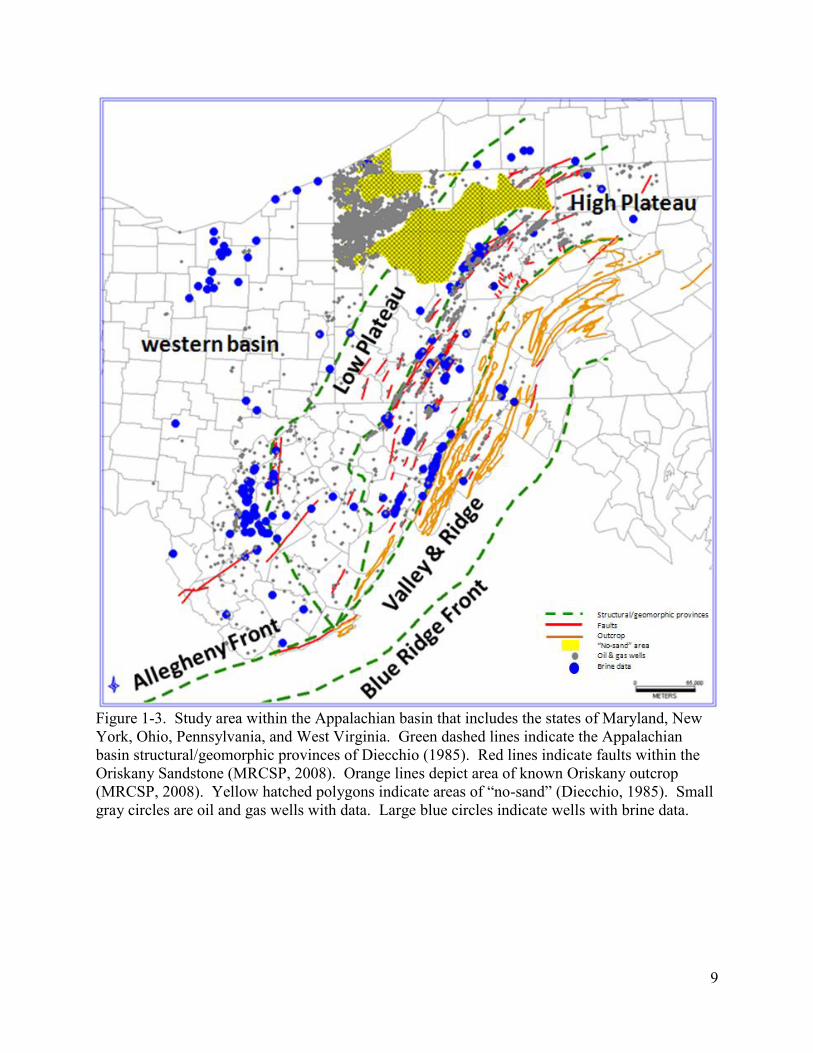
2008). The Oriskany typically unconformably overlies strata of the Helderberg Limestone or
equivalents, and is overlain by Onondaga Limestone, Huntersville Chert, or Needmore Shale
(Figure 1-4), which vary from limestone to chert to shale and are locally sandy (Diecchio, 1985).
Since the Oriskany is a major deep gas producer within the basin, data such as pressure,
temperature, porosity, permeability, and brine composition are available (Diecchio et al., 1984).
The data indicate that there exists intergranular and fracture porosity within the Oriskany, and
overlying thick low-permeability zones within the Appalachian basin provide the potential for
vertical containment (Diecchio, et al., 1984; Gupta et al., 2005).
The Oriskany commonly has been considered to be overpressured because of initial open
flow pressures in some areas of the basin as high as 31,026 kiloPascal (kPa) (Wickstrom et al.,
2005). However, pressure/depth ratios range from 5.13 to 16.70 kPa/m, averaging 9.92 kPa/m,
which is close to the normal hydrostatic pressure gradient for freshwater. Russell (1972)
suggested that, on average, the Oriskany is not an overpressured reservoir, and that
overpressuring is more common in areas of intense deformation. Patchen and Harper (1996),
however, indicate that the more highly deformed areas, such as south-central Pennsylvania,
western Maryland, and eastern West Virginia, tend to have abnormally underpressured
11
Figure 1-4. Stratigraphic column of Lower Devonian of Maryland, Ohio, Pennsylvania, and
West Virginia. Based on stratigraphic column of Pennsylvania Geological and Economic
Survey.

12
reservoirs. Pressure-depth rations in this area range from 5.78 to 11.25 with an average of 8.84.
In contrast, pressure-depth ratios in the ―less deformed‖ areas of western Pennsylvania and
south-central New York range from 5.13 to 16.70, averaging 10.33. The relationship of degree
of deformation to pressure gradient is not readily apparent but might be due, at least in part, to
the ability of the reservoir to maintain fluids following intense fracturing. Brines in the Oriskany
Sandstone have been reported to have very variable salinity values, often ranging into the
200,000 to 350,000 ppm range, and a wealth of varied chemistries (Kelley et al., 1973). The
highest values are for chloride, followed by sodium and calcium. Smaller but significant
concentrations of magnesium and bromide also commonly occur.
1.3 PREVIOUS INVESTIGATIONS
The Oriskany Sandstone has been analyzed recently by the USDOE to determine its CO2
sequestration reservoir potential (Soong et al., 2004a, 2004b; Dilmore et al., 2008). These
studies of the solubility and displacement volumes for CO2 sequestration potential were based
upon brine samples taken from a single well in Indiana County, Pennsylvania and samples from
a single well were assumed to be representative of Oriskany Formation brine chemistry basin
wide (Dilmore et al., 2008). Due to varying depth, thickness, porosity, temperature, pressure,
and brine composition, additional analyses over a more extensive area are needed in order to
properly characterize the Oriskany saline aquifer. Each of these variables independently has the
potential to affect the volume and long-term retention of CO2 that could be injected and/or
stored.
At standard atmospheric conditions CO2 is a stable gas that is slightly denser than air.
For temperatures greater than 31.1 °C and pressures greater than 7.38 MPa, CO2 is a supercritical

13
fluid. In its supercritical state, CO2 has the high-density characteristics of a liquid yet behaves
like a gas by filling all the available volume (Bachu and Stewart, 2002; Bachu 2008). In order
for the injected CO2 to remain in a supercritical phase, the Oriskany Sandstone must be 800
meters or greater in depth. Maintaining this supercritical phase is important because the injected
CO2 occupies several orders of magnitude less volume than in its gaseous phase. These deep
depths will also reduce the relative buoyancy of the CO2 and help to insure an adequate thickness
of confining layers is present above the Oriskany to act as an impermeable seal.
Estimating the porosity and thickness of the Oriskany will provide a means to calculate
the reservoir‘s potential volume that can be used to store CO2 when the depth criterion is taken
into consideration. The average porosity value controls the maximum possible space that the
sequestered CO2 can occupy. The brine composition of the aqueous fluids within this porosity is
critical for determining the volume of CO2 trapped through dissolution into the formation water
and precipitated as mineral components. The solubility of CO2 in the formation water decreases
with increasing water salinity (Brennan and Burruss, 2006).
1.4 OBJECTIVES
1.4.1 BASIN FRAMEWORK
The geology, stratigraphy, and geometry of the Oriskany were described to assist in
approximating the flow regime and volume estimation. Well data was processed using a
subsurface geologic information system (PetraTM ), to generate structure contour maps, isopach
maps, and grids for calculating CO2 storage volume.
14
1.4.2 ROCK PROPERTIES
The porosity of basin rocks is a hydraulic property that has control on the subsurface
fluid flow (Bachu and Undershultz, 1992). Core- and well-scale porosity were used to estimate
the basin (regional) scale porosity of the Oriskany. The well-scale porosity is the vertical
arithmetic average of the core-scale values weighted by the thickness of the uniter sampled. The
basin (regional) scale estimates were obtained from the large-scale spatially averaged well-scale
porosity.
1.4.3 FLOW AND CHEMISTRY OF FORMATION WATER
Knowledge of sedimentary basin geology, lithology, and hydrostratigraphy is important
in understanding the flow of formation waters (Bachu and Undershultz, 1995; Bachu, 1997).
Fluid flow is driven by fluid pressure gradients, which may be influenced to greater or lesser
degrees by compaction, topographic variations in water column height, pressure loss to flow, and
spatial variations in temperature, pressure, elevation, density, and fluid composition (Bachu,
1995a). Spatial variations in temperature, pressure, density, and TDS concentrations were
mapped across the basin. All data used in this study is available on the West Virginia GIS
Technical Center website http://wvgis.wvu.edu.
15
2 BASIN FRAMEWORK
2.1 METHODOLOGY
The geology, stratigraphy, and geometry of the Appalachian basin have been described to
assist in approximating the potential flow regime. Latitude, longitude, elevation, and depth to
formation data was obtained from drilling records available from the Maryland, Ohio,
Pennsylvania, and West Virginia Geological Surveys, as well as participating oil and gas
companies. The elevation and depth values were expressed relative to sea level. The data was
processed and the resulting grids and maps were checked for internal consistency. The
processed data was used to generate a structure contour map, a depth map and an isopach map
using the minimum curvature gridding parameters. Using a minimum depth of 800 meters the
potential sequestration area within which CO2 would be supercritical in the Oriskany was
determined. The produced grids were used to estimate the basin volume needed to calculate
potential CO2 storage volume.
2.2 RESULTS
2.2.1 STRUCTURE CONTOUR
The Oriskany Sandstone forms dips toward the center of the Appalachian basin along a
northeast-southwest trend (Figure 2-1). At the center of the study area, it reaches a maximum
depth ≤ 2,000 meters mean sea level (MSL). It shallows towards outcrop areas to the east (along
the Allegheny Front and Eastern Overthrust Belt) and west (Cincinnati Arch). The area within
the known outcrop belt could not be accurately represented with the limited data and therefore
was not contoured.

16
Figure 2-1. Structure on the top of the Oriskany Sandstone. Contour interval is 100 meters.
17
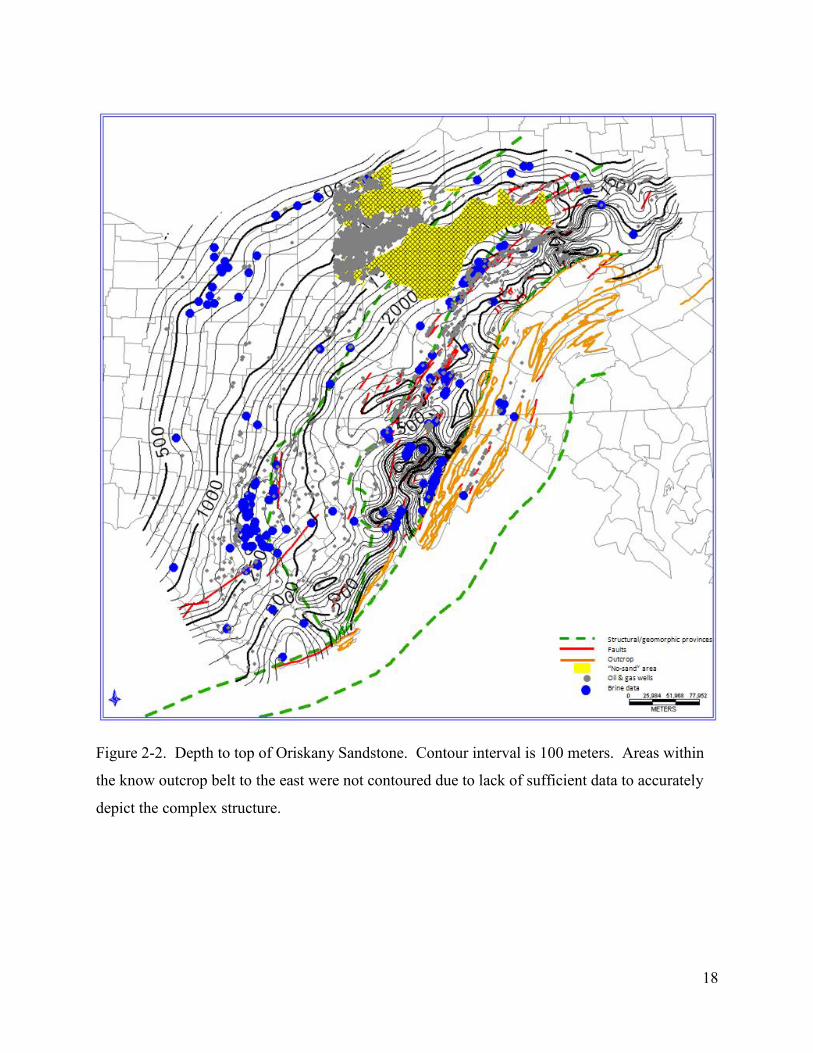
2.2.2 DEPTH
A map of depth to the Oriskany was constructed to map areas suitable for supercritical
CO2 injection. The Oriskany reaches maximum depths of over 2,500 meters the center of the
Appalachian basin (Figure 2-2). Potential CO2 sequestration area was mapped along the 800
meter depth contour (Figure 2-3). The area was not mapped into locations were depth data were
lacking. The delineated area is 139,000 km2 (± 1,000 km2).
18
Figure 2-2. Depth to top of Oriskany Sandstone. Contour interval is 100 meters. Areas within
the know outcrop belt to the east were not contoured due to lack of sufficient data to accurately
depict the complex structure.

19
Figure 2-3. Oriskany Sandstone potential sequestration area. The purple line indicates the study
area that meets the depth greater than 800 meters criteria for supercritical CO2 storage and avoids
areas of known outcrop belts.

20
2.2.3 ISOPACH
The thickness of the Oriskany varies across the Appalachian basin from zero to a thickness ≥
75 meters (Figure 2-3). In the ―no-sand area‖ in the northern Appalachian basin, the Oriskany is
thin or absent due to erosion or non-deposition (Diecchio, 1985). The Oriskany is typically
thickest in the High Plateau and Eastern Overthrust Belt regions, but thins and pinches out to the
west, northwest and south, where it is generally ≤ 10 meters thick.

21
Figure 2-3. Oriskany Sandstone thickness estimate. The average thickness is 16 meters.
Contour interval is 1 meter. ―No-sand areas‖ are indicated by yellow cross-hatched.

22
3 ROCK PROPERTIES
3.1 METHODOLOGY
Previously-analyzed core data were used to estimate the porosity of the Oriskany. The
data were largely restricted to areas of existing oil and gas wells, requiring extrapolated across
data gaps to map the study area. The core scale porosity measurements were scaled up to well
scale and then to basin scale using the method described by Bachu and Underschultz (1992,
1993). The method states that the formation-scale porosity index (Φ) of the unit is the arithmetic
average of the core-scale values weighted by the thickness of the unit. Since reported core
porosity data represent volume-averaged values corresponding to the physical size of the sample
(i.e., core plug), it does not reflect larger scale secondary porosity elements such as vugs and
fractures (Bachu and Undershultz, 1992). The value was then be used to estimate the potential
CO2 storage volume.
3.2 RESULTS
Porosity estimates were collected from published studies, as well as from producing or
potential oil and gas wells (Headlee and Joseph, 1945; Herald, et al., 1962; Harper and Patchen,
1996; New York Geological Survey; and Texas Keystone; Table 1). These data consisted of 19
porosity values, for counties and individual oil and gas fields. These porosity values were
assigned to the wells located within the counties or fields resulting in a total of 894 well values.
Using the method of Bachu and Undershultz (1992, 1993) a mean porosity of 8.08% was
estimated and a map was interpolated using the minimum curvature method with PetraTM (Figure

23
3-1). The Low Plateau and High Plateau of the central Appalachian basin contain the area with
the lowest porosity values.

24
Figure 3-1. Oriskany Sandstone porosity map. Contour interval is 0.2 porosity units.

25
4 FLOW VARIABLES AND CHEMISTRY OF FORMATION WATER
4.1 METHODOLOGY
4.1.1 TEMPERATURE
Bottom-hole temperatures (BHTs) are recorded during logging of the borehole and
commonly are not at equilibrium with formation temperature and require correction.
Temperatures from shallow boreholes are generally too high, and temperatures from deep
boreholes are too low (Appendix I). One method to correct for these erroneous BHTs is to plot
the values versus depth, with the mean surface temperature (12° C for the Appalachian basin)
providing an intercept (Forster et al., 1999). Figure 4-1 shows a plot of Oriskany bottom-hole
temperature versus depth for 57 wells. By comparing the regression equation between the
uncorrected and corrected intercepts a correction factor can be generated.

26
Figure 4-1. Oriskany Sandstone formation temperature (°C) plotted against depth (m). Data
from 57 wells provided in Appendix I.
y = 0.021x + 10.49R² = 0.797
y = 0.019x + 12R² = 0.864
0
10
20
30
40
50
60
70
80
90
0 500 1000 1500 2000 2500 3000 3500
Tem
pe
ratu
re (°
C)
Depth (meters)
Oriskany Sandstone Formation Temperature
Original BHTs Corrected BHTs Linear (Original BHTs) Linear (Corrected BHTs)

27
4.1.2 PRESSURE
Under hydrostatic conditions, pressure increases with depth at the rate of 9.74 kPa/m for
freshwater and approximately 10.71 kPa/m for brine with 145,000 mg/L TDS. Recorded
pressure, like temperature, is related to both depth and burial history (Carr et al., 2005).
Measured pressure values may be influenced by drawdown from nearby wells, but these data
were still retained because local production is thought to have little influence on regional-scale
pressure features (Bachu and Undershultz, 1995). Final shut-in pressure versus depth for 225
wells in the Oriskany is shown in Figure 4-2 (Appendix II). The hydrostatic gradient for fresh
water and brine are plotted over these data to test hypotheses that the Oriskany is either
overpressured or underpressured (Figure 4-2).

28
Figure 4-2. Oriskany Sandstone formation pressure (kPa) plotted against depth (m). Red
squares indicate the idealized pressure gradient for fresh groundwater (TDS <10,000 mg/L).
Green triangles indicate the idealized pressure gradient for brine (TDS=145,000 mg/L). Data
from 225 wells provided in Appendix II.
0
5000
10000
15000
20000
25000
30000
35000
0 500 1000 1500 2000 2500 3000 3500
Pre
ssu
re (
kPa)
Depth (meters)
Oriskany Sandstone Formation Pressure
Oriskany Pressure Fresh Groundwater Brine
29
4.1.3 TOTAL DISSOLVED SOLIDS (TDS)
Existing brine geochemical data was gathered from published and unpublished state and
federal geological surveys, as well as local oil and gas companies. The data were checked for
quality assurance based on the method described by Hitchon and Brulotte (1994) (Table 2). An
additional ten brine samples were collected from existing oil and gas wells distributed
throughout the Appalachian basin, with an attempt made to collect new sample sites in areas of
data gaps (Appendix III). The location of these brine samples depended on the participation and
cooperation of local oil and gas companies. The brine samples were collected according to
United States Geological Survey (USGS) standards in 500 mL high-density polyethylene bottles
that were labeled with well location, sampled formation, depth, and date (USGS, 2006).
The samples were shipped to and analyzed at the Geochemical Testing Laboratory
located in Somerset Pennsylvania. Analytes included: Alkalinity, TDS, and concentrations of
calcium (Ca), sodium (Na), magnesium (Mg), potassium (K), chloride (Cl), and sulfate (SO4).
Alkalinity (CaCO3) concentration, which includes carbonate (CO3) and bicarbonate (HCO3),
were determined by the titrimetric method according to the Association of Official Analytic
Chemists (AOAC) standards with a detection limit of 2 ppm CaCO3. Total dissolved solids
(TDS) concentrations were measured using the American Society of Testing and Materials
(ASTM) gravimetric method with a detection limit of 0.8 mg/L. The Environmental Protection
Agency (EPA) Method 300.0 of ion chromatography was used to measure the Cl and SO4
content with a detection limit of 0.03 ppm (O‘Dell et al., 1993). The concentration of the cations
Ca, Mg, K, and Na were calculated using inductively coupled plasma mass spectroscopy (ICP-
MS) with detection limits of 50, 1.0, 30, and 5 µg/L, respectively.

30
4.1.4 GROSS FLUID FLOW
Darcy‘s law describes fluid flow in a porous medium. When it is written in terms of
hydraulic head rather than pressure, it shows that the flow of formation water is driven by
hydraulic gradients, density differences, and variations in temperature and chemical
concentrations (Bachu, 1995b). For sedimentary basin-scale flow systems, temperature and
chemical concentration differences are generally thought to be unimportant by comparison with
hydraulic- (topographic) and buoyancy-driving mechanisms (Bachu, 1995a, 1995b). Buoyancy,
due to density differences, can potentially play an important role by opposing and retarding the
flow of formation waters driven by hydraulic-head gradients (Bachu, 1995b).
In order to analyze the flow pattern, the formation pressures were used to calculate
equivalent freshwater hydraulic head, Ho:
H = (p/ρog) + z (Formula 1)
where p is formation pressure, ρo = 1000 kg/m3 (density of freshwater), g is the gravitational
constant 9.80665 m/s2, and z is elevation relative to sea level (Bachu and Undershultz, 1993,
1995; Anfort et al., 2001). Formation waters in sedimentary basins become less dense as
temperature increases, but denser as salinity increases. Therefore, density variations have the
potential in introduce error in freshwater hydraulic head estimates (Bachu and Undershultz,
1993, 1995). An indication of the magnitude of this introduced error is given by the
dimensionless driving force ratio (DFR) defined (Davies, 1987; Bachu, 1995) as:
DFR = (Δρ|∆E|) / (ρ|∆Ho|h) (Formula 2)
31
where |∆E| is the magnitude of the aquifer slope, |ΔHo|h is the magnitude of the horizontal
component of the freshwater hydraulic-head gradient, Δρ is the difference between formation-
water and freshwater densities. If the DFR value is greater than 0.5, neglecting buoyancy effects
will introduce significant errors in flow analysis using an equivalent head concept (Davies,
1987). However, according to Aufont, et al., (2001), the presence and direction of flow will be
correct but the magnitude will be less than indicated. This is due to hydraulic gradients and
buoyancy acting in opposite directions along dip. The values for Ho thus calculated were mapped
with Petra using the minimum curvature parameters and the resulting gradients were used to
estimate the flow direction and strength.
4.2 RESULTS
4.2.1 TEMPERATURE
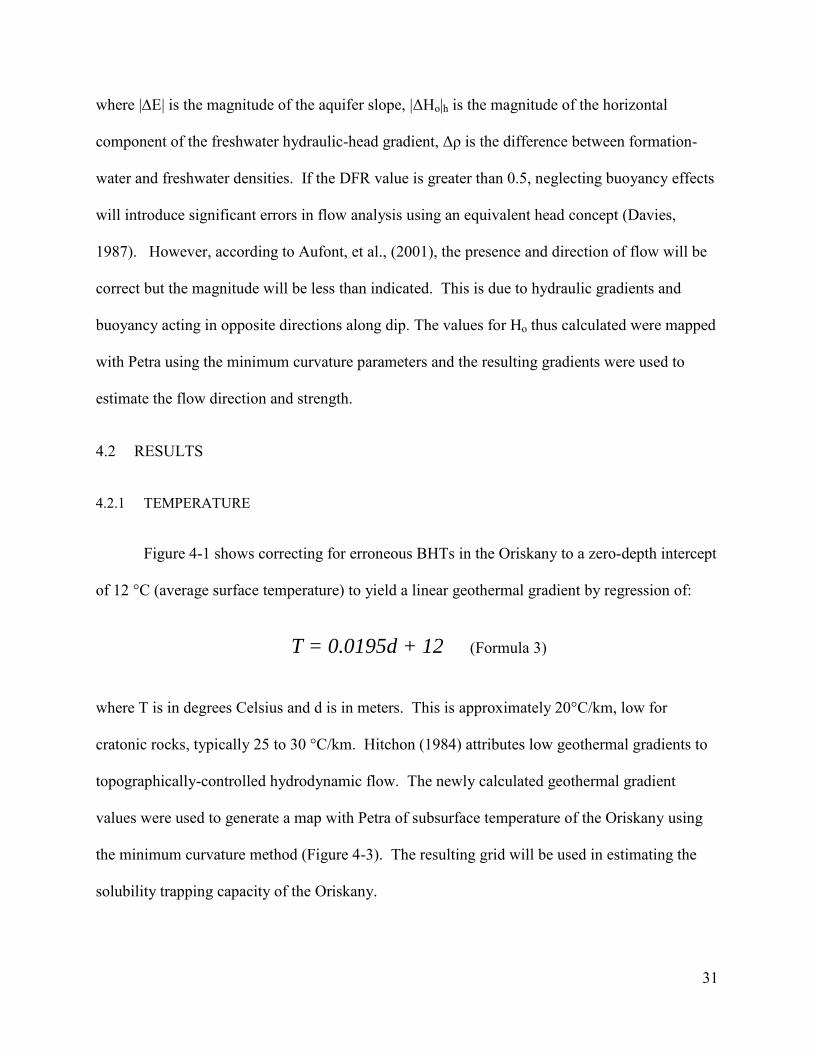
Figure 4-1 shows correcting for erroneous BHTs in the Oriskany to a zero-depth intercept
of 12 °C (average surface temperature) to yield a linear geothermal gradient by regression of:
T = 0.0195d + 12 (Formula 3)
where T is in degrees Celsius and d is in meters. This is approximately 20°C/km, low for
cratonic rocks, typically 25 to 30 °C/km. Hitchon (1984) attributes low geothermal gradients to
topographically-controlled hydrodynamic flow. The newly calculated geothermal gradient
values were used to generate a map with Petra of subsurface temperature of the Oriskany using
the minimum curvature method (Figure 4-3). The resulting grid will be used in estimating the
solubility trapping capacity of the Oriskany.
32
Figure 4-3. Oriskany Sandstone formation temperature (°C) using the newly calculated gradient.
Contour interval is 2° C.
33
4.2.2 PRESSURE
Final shut-in pressure recorded from gas wells of the Oriskany (based on n = 225 wells)
is significantly below the expected hydrostatic gradient for fresh groundwater. Pressure plotted
against depth indicates that the Oriskany is underpressured (Figure 4-4). This underpressure
below hydrostatic for either fresh or average-salinity water (lines on Figure 4-2) may be due to
drawdown from nearby wells and/or lack of sufficient shut-in time to reach pressure equilibrium.
However, a few cases (< 5%) of overpressure were observed but the Oriskany reservoirs at a
regional scale appear to be underpressured. Abnormally low reservoir pressures can be caused
by gaseous diffusion and gas shrinkage in reservoirs that have been uplifted or otherwise cooled
(Russell, 1972; Belitz and Bredehoeft, 1988; Bachu and Undershultz, 1995). The High Plateau
of the central Appalachian basin is the area with the highest pressure values.

34
Figure 4-4. Oriskany Sandstone formation pressure (kPa) at top of structure using the newly
calculated pressure gradient. Contour interval is 1 kPa.

35
4.2.3 TOTAL DISSOLVED SOLIDS (TDS)
Oriskany brine geochemical data were compiled from published and unpublished sources
(Stout, et al., 1932; Price, et al., 1937; Hoskins, 1947; Poth, 1962; Kelley, et al., 1973; Woll,
1978; Dresel, 1985; Lloyd and Reid, 1990; Chesapeake Energy; and NatCarb). Additional brine
samples were collected from ten existing oil and gas wells and storage fields distributed
throughout the Appalachian basin. Across the extent study area, the TDS ranges from fresh
(TDS < 10,000 mg/L) to brine (TDS > 300,000 mg/L) (Figure 4-5). The brines are concentrated
in the structural lows at the center of the basin, while the relatively low TDS concentrations are
associated with the outcrop areas to the east and the west.
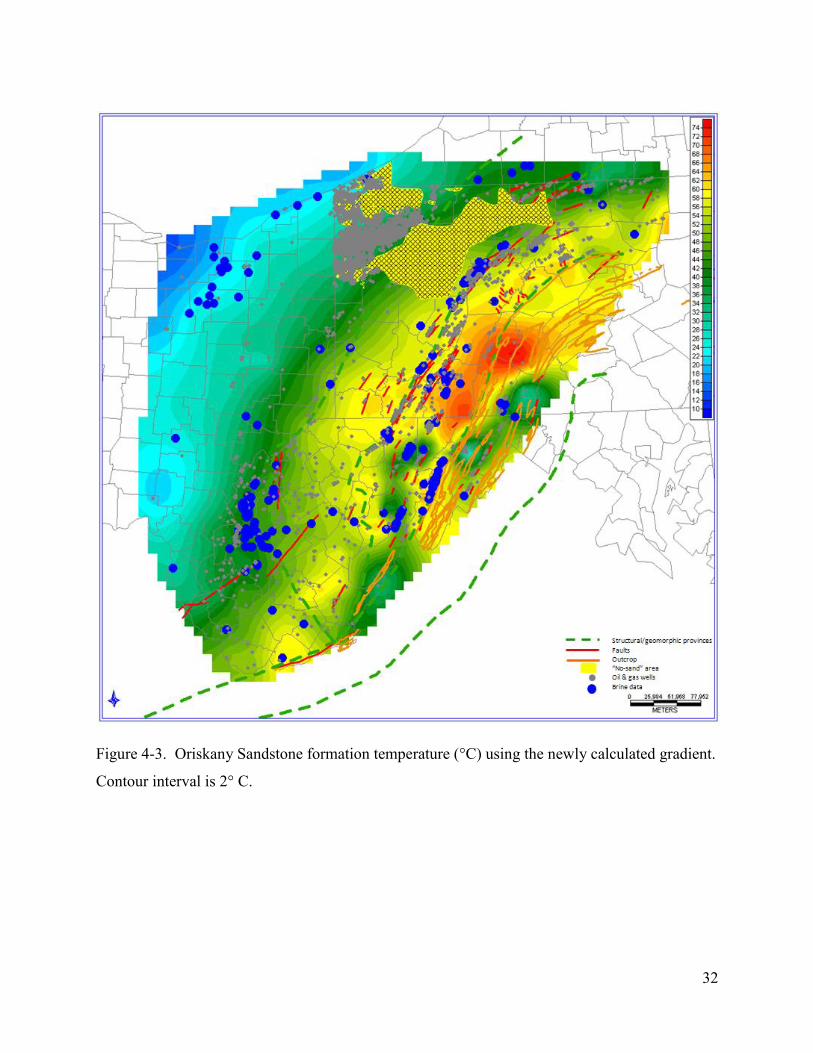
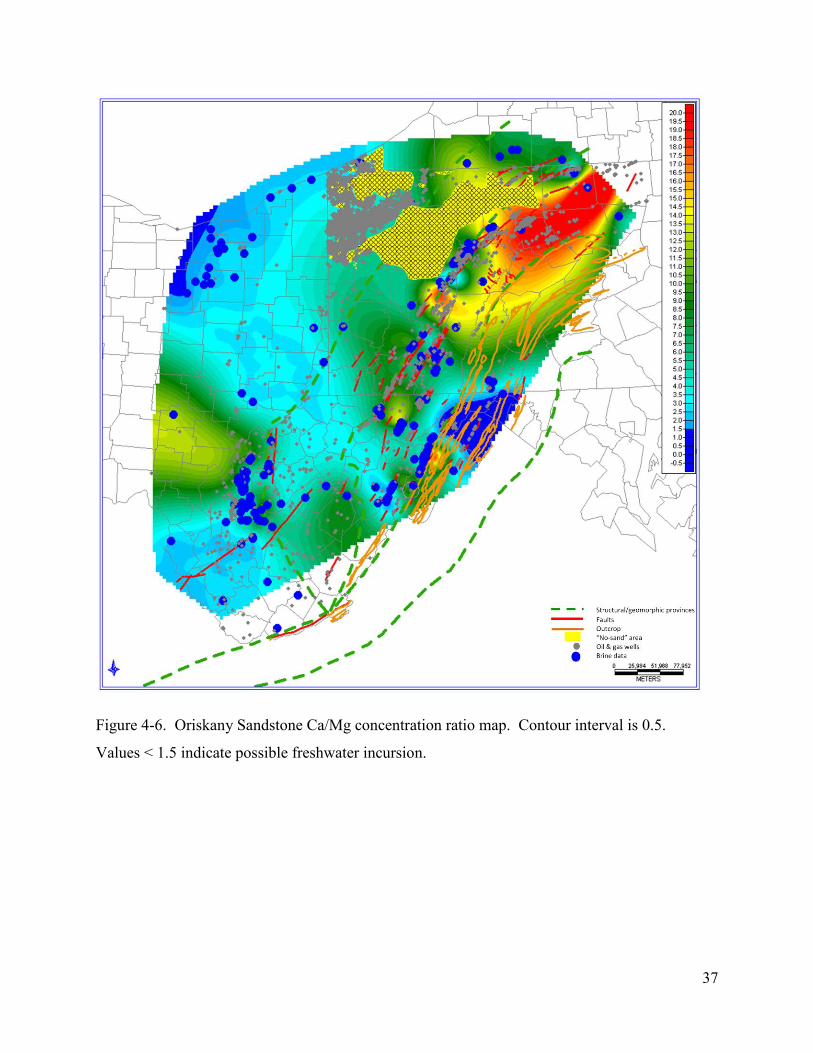
Recharge of meteoric waters into saline brines can dilute salinity and enhance
methanogensis (Martini et al., 1998; McIntosh et al., 2002). Thermogenic gas, on the other hand,
is generated by the thermal degradation of organic material at depth and is typically associated
with saline brines (McIntosh and Martini, 2005). Formation waters associated with microbial
gas generally have low Ca/Mg ratios (<1.5) as a result of calcite precipitation induced by
microbial methanogenesis (Martin et al., 1998). Low Ca/Mg ratios can also be used to infer
freshwater incursion. The ratio of calcium concentration to magnesium concentration for the
Oriskany across the Appalachian basin is generally less than ten, and even lower (<5) in the
recharge and outcrop areas to the east and west (Figure 4-6). The ratio is as high as 30 in the
northeast area of the basin.

36
Figure 4-5. Oriskany Sandstone TDS (mg/L) map. Contour interval is 5,000 mg/L.
37
Figure 4-6. Oriskany Sandstone Ca/Mg concentration ratio map. Contour interval is 0.5.
Values < 1.5 indicate possible freshwater incursion.
38
4.2.4 GROSS FLUID FLOW
Formation pressure was used to calculate equivalent freshwater hydraulic head Ho
(Formula 1). Use of freshwater hydraulic heads in the flow analysis of variable-density
formation waters may introduce significant errors, depending on the interaction between the
potential and buoyancy forces driving the flow (Bachu and Undershultz, 1993, 1995). Density
values were calculated from salinity, temperature, and pressure using the relationships published
by Gill (1982)(Appendix IV; Figure 4-7). Across the extent of the Oriskany the density ranges
from approximately fresh water (1,030 kg/m3) to a density of 1,300 kg/m3. The formation water
with the highest density is concentrated in the Oriskany structural lows at the center of the basin.
The formation water with the lowest density is associated with the outcrop area to the east and
the subcrop or pinch-out area to the west.
An indication of the significance of this introduced error is given by the dimensionless
driving force ratio (DFR) (Formula 2). If the DFR value is greater than 0.5, neglecting buoyancy
effects will introduce significant errors in flow analysis (Davies, 1987). Within the Oriskany the
values were generally much less than 0.5, with the exception of two areas located in south-
central Pennsylvania. Hydraulic heads (Figure 4-8) range from over 1,000 m in the deeper part
of the basin to less than 250 m at the potential recharge area to east and the potential discharge
area to the west.

39
Figure 4-7. Oriskany Sandstone formation water density map. Contour interval is 10 kg/m3.

40
Figure 4-8. Oriskany Sandstone equivalent hydraulic head contours with areas indicated in black
in which DFR values exceed 0.5. Contour interval is 500 meters.

41
5 ANALYSIS OF RESULTS
5.1 BASIN FRAMEWORK
The Oriskany dips toward the center of the basin, a trend that is consistent with the
preserved northeast-southwest central axis. The Oriskany shallows toward the outcrop area to
the east along the Allegheny Front and Eastern Overthrust Belt and toward the Cincinnati Arch
toward the west. The Oriskany is typically thickest, over 75 meters, in the Eastern Overthrust
Belt and the High Plateau and thins, to a thickness less than 10 meters, toward the northwest,
west, and south. Using the depth and isopach data the volume estimate of approximately 2,188
km3 will be used to calculate a total Oriskany CO2 storage capacity
5.2 ROCK PROPERTIES
The average 8.08% porosity value calculated for this study is consistent with the value
calculated by Dilmore and others (2008) for the USDOE. This value indicates that the Oriskany
has the potential to provide adequate porosity for the injection of supercritical CO2 (Bachu, et al.,
2007). The areas of the Appalachian basin that had the lowest estimated porosity values were
the areas of greatest depth (>2,000 m MSL).
5.3 FLOW VARIABLES AND CHEMISTRY OF FORMATION WATER
The temperature data was corrected for erroneous BHTs that are often encountered during
drilling, and are therefore directly related to depth. There was no indication that any temperature
anomalies existed in the Oriskany before processing. The geothermal gradient for the Oriskany
Sandstone (~20°C) is lower than that expected for cratonic rocks (25-30°C) (Hitchon, 1984).
The pressure values indicate that the Oriskany is underpressured. This underpressuring is an
42
indication of the integrity and longevity of the overlying confining layer which will serve as a
vertical seal for sequestered CO2 (Puckette and Al-Shaieb, 2003). There is some indication that
drawdown from nearby wells and insufficient shut-in time may have an effect on some wells
within the Oriskany study area. The High Plateau of the central Appalachian basin is the area
with the highest pressure values, which is consistent with the suggestion of Russell (1972) that
correlates high pressure values not only with depth but also deformation.
The TDS concentrations of the Oriskany formation fluids range from freshwater to dense
brine. The brine samples were characterized by large differences between the reported TDS
concentrations from neighboring wells within the same gas field. The cause of these differences
may be related to areal, vertical, and temporal variability, errors introduced from sampling
procedures, or to varying methods of chemical analysis (Jorgensen, et al., 1993). The dense
brines were concentrated in the Oriskany structural lows in the center of the basin and to the
north. The relatively lower TDS concentrations are at the outcrop area to the east and the
subcrop area to the west. This trend would seem to indicate that any mixing of formation water
with meteoric water occurs only along the outcrop and subcrop margins or along fault traces.
The low Ca/Mg ratios along the outcrop and subcrop margins can also be used to infer
freshwater incursion (Martin et al., 1998). The distribution of freshwater hydraulic head shows
the expected trends of northwestward and southeastward flow from the basin center toward the
western subcrop area and the eastern outcrop area and further substantiates the previous
assumption.

43
6 INTERPRETATION
The Oriskany Sandstone of the Appalachian basin is a widely distributed saline aquifer
which has produced large quantities of hydrocarbons and is used extensively for storage of
natural gas. Oriskany gas storage fields have the capability to store/deliver more natural gas than
storage fields in any other formations within the northern Appalachian basin (American Gas
Association, 2001). At least 32 gas storage fields are found within the Oriskany, with a
combined storage capacity approaching 1 trillion cubic feet (TCF). Many of these storage fields
have been in operation since the 1950‘s attesting to the ability of these fields and seals to
maintain long-term containment (AGA, 2001). This indicates that at the local level the Oriskany
has the necessary volume, porosity, and containment characteristics for geologic storage of CO2
(Cook and Benson, 2005; Czernichowski-Lauriol et al., 2006; Bachu et al., 2007; Dilmore et al.,
2008).
Using published and unpublished data of rock characteristics, pressure, temperature, and
formation water geochemistry along with new brine samples were used to map the regional-scale
hydrogeological regime and its relation to the migration of hydrocarbons and geologic CO2
sequestration potential. Basin-scale fluid flow of the Oriskany formation waters is generally
controlled by salinity differences and by differences in structural elevation. The flow pattern is
substantiated by the salinity distributions and water geochemistry, with relatively lower salinity
at recharge to the east and discharge to the west due to mixing with fresh meteoric water and
higher salinity between the recharge and discharge zones. The basin-scale flow pattern is also
substantiated by the distribution of oil and gas fields that occur in the central Appalachian basin;
the major productive gas fields occur at the boundary between lower salinity and are typically

44
absent in areas of higher salinity. It is believed that hydrocarbon distribution is influenced by
basinal variations in buoyancy and entrainment by the formation water flow (Hitchon, 1984).
Long-term lateral containment of large-scale CO2 injection appears to be associated in the
Oriskany with convergent flow located in the eastern Appalachian basin. Storage capacity for
the Oriskany saline formation is estimated by the equation:
Gco2 = AhgфtotρE (Formula 4)
GCO2 is the estimate of total saline formation storage capacity in kilograms, A is the area of basin
greater than 800 meters in depth, hg is the average thickness of formation at depths greater than
800 meters, ϕtot is the average formation-scale porosity for thickness hg (8.08%), ρ is the density
of CO2 at pressure and temperature that represents storage conditions for saline formation
averaged over hg (800 kg/m3 at P = 18.01 MPa and T = 43.29 °C), and E is the storage efficiency
factor that reflects a fraction of total pore volume filled by CO2 (USDOE estimations of E are a
low of 0.01 and a high of 0.04).
Oriskany isopach and porosity grids were generated using Petra‘s minimum curvature
method and a 10,000 by 10,000 meter grid size. These grids were then used to perform a grid-to-
grid calculation to estimate the available volume within the potential CO2 sequestration area
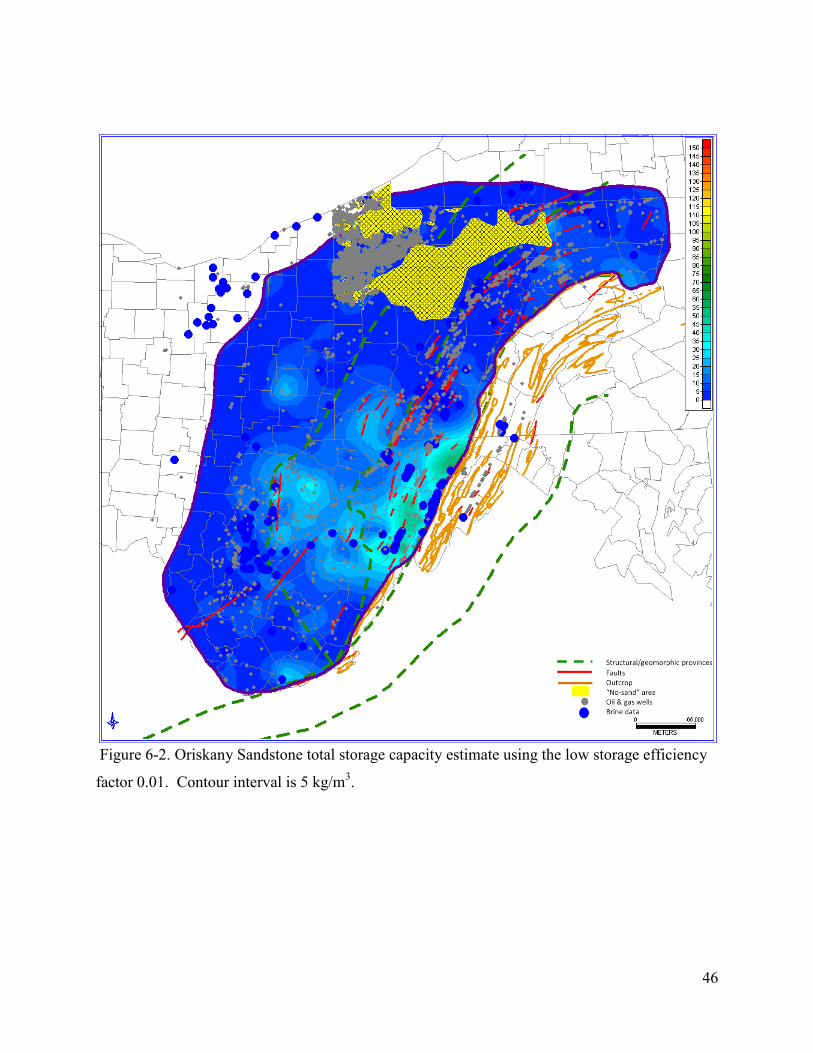
(Figure 6-1). Grid-to-grid calculations were then performed using the constants for density of
supercritical CO2 (800 kg/m3) and the storage efficiency factors (0.01 and 0.04) (Figures 6-2 and
6-3). The result is a storage resource estimate of 1.246 to 4.983 gigatonnes of CO2.

45
Figure 6-1. Oriskany Sandstone estimated pore volume map. Contour interval is 0.2 km3 per
100 km3.
46
Figure 6-2. Oriskany Sandstone total storage capacity estimate using the low storage efficiency
factor 0.01. Contour interval is 5 kg/m3.

47
Figure 6-3. Oriskany Sandstone total storage capacity estimate using the high storage efficiency
factor of 0.04. Contour interval is 5 kg/m3

48
Using the method described by Dilmore et al. (2008) the solubility trapping capacity of
the Oriskany saline formation can be estimated by the following equation:
CO2 = υEфδmCO2M (Formula 5)
CO2 is the estimate of total mass of CO2 in grams that can be trapped, υ is the total volume of the
formation in km3, E is the storage efficiency factor, ф is the estimated mean porosity, δ is the
density of CO2 saturated brine in kg/km3, mCO2 is the concentration of CO2 dissolved in the
brine in mol/kg, and M is the molar mass of CO2 in g/mol (44.01g/mol).
The previous grid-to grid calculation for estimated pore volume within the potential CO2
sequestration area was used with a value of 155.75 km3. A grid was generated for the density of
CO2 saturated brine (δ) using the polynomial fit (Table 3) determined by Dilmore et al. (2008) to
correlate temperature, pressure, and brine chemistry. A concentration of CO2 dissolved in brine
grid was also generated using the polynomial fit (Table 4) to correlate temperature to the
formation CO2 concentration using the parameters described above. Grid-to-grid calculations
were performed to estimate the potential dissolved CO2 storage capacity at the low and high
storage efficiency factors (0.01 and 0.04) (Figures 6-4 and 6-5). The result is a solubility storage
capacity estimate of 0.04 to 0.17 gigatonnes of CO2.
At a regional scale, the Oriskany Sandstone appears to have the characteristics to be
considered a geologic storage resource for storage of CO2 supercritical fluids (Cook and Benson,
2005; Czernichowski-Lauriol et al., 2006; Bachu et al., 2007; Dilmore et al., 2008). However,
site selection will require thorough evaluation of the formation. Such target sites include zones

49
of high porosity and high permeability in areas of convergent hydrogeologic flow due to
differences in salinity.

50
Figure 6-4. Oriskany Sandstone solubility storage capacity estimate using the Dilmore et al.,
(2008) method and the low storage efficiency factor of 0.01. Contour interval is 0.25 kg/m3.

51
Figure 6-5. Oriskany Sandstone solubility storage capacity estimate using the Dilmore et al.,
(2008) method and the high storage efficiency factor of 0.04. Contour interval is 0.25 kg/m3.

52
7 CONCLUSIONS
1. The geothermal gradient for the Appalachian basin, approximately 20°C/km, is lower
than what is expected for cratonic rocks away from tectonic plate boundaries, 25-
30°C/km, and would be considered a cold basin. In terms of CO2 sequestration, cold
basins are better than warm basins because the depth that CO2 reaches supercritical
conditions is shallower and therefore the CO2 is less buoyant which lowers the potential
for and the relative speed of CO2 migration (Bachu, 2002). Hitchon, 1984, attributes low
geothermal gradients to hydrodynamic flow.
2. The Oriskany of the Appalachian basin is generally underpressured with a pressure
gradient of 6.8 kPa/m compared to a hydrostatic gradient of 9.74 kPa/m for freshwater
and approximately 10.71 kPa/m for brine. This underpressuring would aid in
sequestering CO2 by lowering injection and displacement pressures and is an indication
of the integrity and longevity of the overlying confining layers and weak lateral
migration, which will serve as a vertical seal. These seals have prevented the Oriskany
from equalizing with the hydrostatic environment and could help prevent the vertical and
lateral migration of CO2 (Puckette and Al-Shaieb, 2003).
3. The salinity of the Oriskany fluids varies widely across the Appalachian basin. The TDS
ranges from freshwater (TDS < 10,000 mg/L) to dense brine (TDS > 300,000 mg/L).
The relatively lower TDS concentrations are associated with the outcrop area to the east
and indicate dilution by and mixing with fresh meteoric water. A high TDS
concentration will decrease the solubility of CO2. Variations in brine geochemistry and
physical parameters strongly affect residual, solubility, and mineral trapping. Injected

53
CO2 is soluble in brine and forms carbonic acid, which dissociates into bicarbonate and
carbonate ions thereby lowering the pH. The Oriskany brine contains cations such as
calcium, magnesium, and to a lesser extent iron, that can interact with the carbonate ions
to form minerals such as calcite, dolomite, siderite and magnesite. The precipitation of
these minerals occurs more favorably in a more basic pH (Soong et al., 2004). Reactions
of CO2 charged saline fluids with minerals likely found in sandstone such as the Oriskany
results in an increase in pH and therefore a greater capacity for the fluid to sequester
dissolved CO2 (Allen et al., 2005).
4. Divergent flow patterns, based on hydraulic head estimates, are associated with the
outcrop belt to the east and the area from the ―no-sand area‖ southeast through the
northern panhandle of West Virginia. These areas indicated also correspond to areas that
historically have had low or no oil and gas production. Convergent flow patterns, based
on hydraulic head estimates, are located within the High Plateau region, extending from
New York toward the Allegheny Front. This area is associated with hydrocarbon
production and has the potential for improved containment of injected CO2.
54
8 REFERENCES CITED
Allen, D.E., Strazisar, B.R., Soong, Y., and Hedges, S.W., 2005, Modeling carbon dioxide sequestration in saline
aquifers: Significance of elevated pressures and salinities: Fuel Processing Technology, v. 86, p. 1569-
1580.
American Gas Association, 2001, Underground storage of natural gas in the United States and Canada: p. 80-86.
Anfont, S.J., Bachu, S., and Bentley, L.R., 2001, Regional-scale hydrogeology of the Upper Devonian-Lower
Cretaceous sedimentary succession, south-central Alberta basin, Canada: The American Association of
Petroleum Geologists, v. 85, p. 637-660.
Bachu, S., 1995a, Flow of variable-density formation water in deep sloping aquifers: review of methods of
representation with case studies: Journal of Hydrology, v. 164, p. 19-38.
Bachu, S., 1995b, Synthesis and model of formation-water flow, Alberta basin, Canada: The American Association
of Petroleum Geologists, v. 79, p. 1159-1178.
Bachu, S., 1997, Flow of formation waters, aquifer characteristics, and their relation to hydrocarbon accumulations,
Northern Alberta Basin: The American Association of Petroleum Geologists, v. 81, p. 712-733.
Bachu, S., 2002, Sequestration of CO2 in geological media in response to climate change: road map for site selection
using the transform of the geological space into the CO2 phase space: Energy Conversion & Management,
v. 43, p. 87-102.
Bachu, S., 2008, CO2 storage in geological media: role, means, status and barriers to development: Progress in
Energy and Combustion Science, v. 34, p. 254-273.
Bachu, S., Bonijoly, D., Bradshaw, J., Burruss, R., Holloway, S., Christensen, N.P., and Mathiassen, O.D., 2007,
CO2 storage capacity estimation: methodology and gaps: International Journal of Greenhouse Gas Control,
v. 1, p. 430-433.

55
Bachu, S., Sauveplane, C.M., Lytviak, A.T., and Hitchon, B., 1987, Analysis of fluid and heat regimes in
sedimentary basins: techniques for use with large data bases: The American Association of Petroleum
Geologists, v. 71, p. 822-843.
Bachu, S., and Stewart, S., 2002, Geological sequestration of anthropogenic carbon dioxide in the Western Canada
Sedimentary Basin: suitability analysis: Journal of Canadian Petroleum Technology, v. 41, p. 32-40.
Bachu, S., and Undershultz, J.R., 1992, Regional-scale porosity and permeability variations, Peace River Arch area,
Alberta, Canada: The American Association of Petroleum Geologists, v. 76, p. 547-562.
Bachu, S., and Undershultz, J.R., 1993, Hydrogeology of formation waters, Northeastern Alberta basin: The
American Association of Petroleum Geologists, v. 77, p. 1745-1768.
Bachu, S., and Undershultz, J.R., 1995, Large-scale underpressuring in the Mississippian-Cretaceous succession,
Southwestern Alberta basin: The American Association of Petroleum Geologists, v. 79, p. 989-1004.
Benson, S.M., 2005, Overview of geologic storage of CO2, in Proceedings, International Conference on Greenhouse
Gas Control Technologies, 7th, Vancouver, September 2004, Volume 1: Amsterdam: Elsevier, p. 665-672.
Birkholzer, J., and Tsang, C., 2007, Introduction to the special issue on site characterization for geological storage of
CO2: Environmental Geology, v. 54, p. 1579-1581.
Brennan, S.T., and Burruss, R.C., 2006, Specific storage volumes: a useful tool for CO2 storage capacity
assessment: Natural Resources Research, v. 15, p. 165-181.
Bruner, K., and Smosna, D., 2008, A trip through the Paleozoic of the Central Appalachian basin with emphasis on
the Oriskany Sandstone, Middle Devonian shales, and Tuscarora Sandstone: Dominion Exploration and
Production, INC.
Carr, T.R., Merriam, D.F., and Bartley, J.D., 2005, Use of relational databases to evaluate regional petroleum
accumulation, groundwater flow, and CO2 sequestration in Kansas: The American Association of
Petroleum Geologists Bulletin, v. 89, p 1607-1627.
56
Cook, P.J., and Benson, S.M., 2005, Overview and current issues in geological storage of carbon dioxide, in
Proceedings, International Conference on Greenhouse Gas Control Technologies, 7th, Vancouver,
September 2004, Volume 1: Amsterdam: Elsevier, p. 15-20.
CSLF, 2005: A taskforce for review and development of standards with regards to CO2 storage capacity
measurement, CSLF-T-2005-09, p 1-25. http://www.cslforum.org/publications/documents/PhaseIReport
StorageCapacityMeasurementTaskForce.pdf
Czernichowski-Lauriol, I., Rochelle, C., Gaus, I., Azaroul, M., Pearch, J., and Durst, P., 2006, Advances in the
Geological Storage of Carbon Dioxide International Approaches to Reduce Anthropogenic Greenhouse Gas
Emissions: Nato Science Series: IV: Earth and Environmental Sciences, 65. Springer E-Books. Dordrecht:
Springer, p. 157-174.
Davies, P.B., 1987, Modeling areal, variable density, ground-water flow using equivalent head-analysis of
potentially significant errors, in Proceedings, National Water Well Association-International Ground Water
Modeling Center: Solving ground water problems with models, Denver, February 1987, Volume 1: Dublin,
Ohio: National Water Well Association, p. 888-903.
Diecchio, R.J., 1985, Regional controls of gas accumulation in Oriskany sandstone, Central Appalachian basin: The
American Association of Petroleum Geologists Bulletin, v. 69, p. 722-732.
Diecchio, R.J., Jones, S.E., and Dennison, J.M., 1984, Oriskany sandstone: regional stratigraphic relationships and
production trends. Morgantown: West Virginia Geological and Economic Survey.
Dilmore, R.M., Allen, D.E., McCarthy Jones, J.R., Hedges, S.W., and Soong, Y., 2008, Sequestration of dissolved
CO2 in the Oriskany Formation: Environmental Science and Technology, v. 42, p. 2760-2766.
Dresel, P.E., 1985, The geochemistry of oilfield brines in western Pennsylvania, thesis (M.S.), Pennsylvania State
University.

57
EIA (Energy Information Agency, US Department of Energy), 2009, Annual Energy Outlook 2009 with Projections
to 2030, Report #:DOE/EIA-0383(2009), p. 230. http://www.eia.doe.gov/oiaf/aeo/pdf/0383(2009).pdf
(accessed November 9, 2009).
Forester, A., Merriam, D.F., and Watney, W.L., 1999, Problems and potential of industrial temperature data from a
cratonic basin environment, in A. Forester and D.F. Merriam, eds., Geothermics in basin analysis: New
York, Plenum Press, p. 35-59.
Frailey, S.M., Finley, R.J., and Hickman, T.S., 2006, CO2 sequestration;: storage capacity guideline needed: Oil &
Gas Journal, v. 104, p. 44-49.
Gill, A.E., 1982, Atmosphere-Ocean Dynamics: New York: Academic Press.
Gupta, N., Jagucki, P., Sminchak, J., Meggyesy, D., Spane, F., Ramakrishnan, T.S., and Boyd, A., Determining
carbon sequestration injection potential at a site-specific location within the Ohio River Valley region, in
Proceedings, International Conference on Greenhouse Gas Control Technologies, 7th, Vancouver,
September 2004, Volume 1: Amsterdam: Elsevier, p. 511-519.
Harper, J.A., and Patchen, D.G., 1996, Play Dos: the Lower Devonian Oriskany Sandstone structural play, in Roen,
J.B., and Walker, B.J., (Eds.), The atlas of major Appalachian gas plays: West Virginia Geological and
Economic Survey Publication, v. 25, p. 109-117
Headlee, A.J.W., and Joseph, J.S., 1945, Permeability, porosity, and water content of natural gas reservoirs,
Kanawha-Jackson and Campbells Creek Oriskany fields: West Virginia Geological and Economic Survey
Publications, Bulletin No. 8, p. 16.
Heald, M.T., Thomson, A., and Wilcox, F.B., 1962, Origin of interstitial porosity in the Oriskany Sandstone of
Kanawha County, West Virginia, Journal of Sedimentary Research, v. 32, p. 291-298.
Hitchon, B., 1984, Geothermal gradients, hydrodynamics, and hydrocarbon occurrences, Alberta, Canada: The
American Association of Petroleum Geologists, v. 68, p. 713-743.

58
Hitchon, B., 1996, Rapid evaluation of the hydrochemistry of a sedimentary basin using only ‗standard‘ formation
water analyses: example from the Canadian portion of the Williston Basin: Applied Geochemistry, v. 11, p.
789-795.
Hitchon, B., and Brulotte, M., 1994, Culling criteria for ―standard‖ formation water analyses: Applied
Geochemistry, v. 9, p. 637-645.
Hoskins, H.A., 1947, Analysis of West Virginia Brines: West Virginia Geologic and Economic Survey Publication,
Reports of Investigation RI-1, p. 22.
IPCC-Intergovernmental Panel on Climate Change, 1995, Climate change 1995: The science of climate change:
Houghton, J.T., Meira Filho, L.G., Collander, B.A., Harris, N., Kattenberg, A., Maskell, K., (Eds.):
Cambridge University Press: Cambridge, U.K., 1996.
IPCC-Intergovernmental Panel on Climate Change, 2005, Special report on carbon dioxide capture and storage:
Metz, B., Davidson, O., de Coninck, H.C., Loos, M., Meyer, L.A., (Eds.), Cambridge University Press,
Cambridge, UK and New York, chapter 5, p. 195-276.
Jorgensen, D.G., Helgesen, J.O., and Imes, J.L., 1993, Regional aquifers in Kansas, Nebraska, and parts of
Arkansas, Colorado, Missouri, New Mexico, Oklahoma, South Dakota, Texas, and Wyoming;
geohydrologic framework: U.S. Geological Survey Professional Paper, Report: p 1414-B, p. 72.
Kelley, D., DeBor, D., Malanchak, J., and Anderson, D., 1973, Tully and deeper formations, brine analysis of
Pennsylvania: Pennsylvania Geological Survey, 4th ser., Open-file Report OF 73-03.
Lloyd, O.B., and Reid, M.S., 1990, Evaluation of liquid waste-storage potential based on porosity distribution in the
Paleozoic rocks in central and southern parts of the Appalachian Basin: U.S. Geological Survey
professional paper: p 81.
Martini, A.M., Walter, L.M., Budai, J.M., Ku, T.C.W., Kaiser, C.J., and Schoell, M., 1998, Genetic and temporal
relations between formation waters and biogenic methane: Upper Devonian Antrim Shale, Michigan Basin,
USA: Geochimica et Cosmochimica Acta, v. 62, p. 1699-1720.

59
McIntosh, J.C., and Martini, A.M., 2005, Hydrogeochemical indicators for microbial methane in fractured organic-
rich Shales: Case study of the Antrim, New Albany, and Ohio shales, in Bishop, M.G., (eds.), Gas in low
permeability reservoirs of the Rocky Mountain Region: Rocky Mountain Association of Geologists
Publication, p. 1-13.
McIntosh, J.C., Walter, L.M., and Martini, A.M., 2002, Pleistocene recharge to midcontinent basins: effects on
salinity structure and microbial gas generation; Geochimica et Cosmochimica Acta, v. 66, p. 1681-1700.
O‘Dell, J.W., Pfaff, J.D., and Budde, W.L., 1993, Methods for the determination of inorganic substances in
environmental samples: Environmental Monitoring Systems Laboratory, Office of Research and
Development, U.S. Environmental Protection Agency, EPA Method 300:
http://www.epa.gov/nerlcwww/methmans.html#Inorg.%20Non-metals (accessed August 24, 2008).
Opritza, S.T., 1996, Play Dop: the Lower Devonian Oriskany Sandstone updip permeability pinchout, in Roen, J.B.,
and Walker, B.J., (eds.), The atlas of major Appalachian gas plays: West Virginia Geological and
Economic Survey Publication, v. 25, p. 126-129.
Patchen, D.G., and Harper, J.A., 1996, Play Doc: the Lower Devonian Oriskany Sandstone combination traps play,
in Roen, J.B., and Walker, B.J., (Eds.), The atlas of major Appalachian gas plays: West Virginia Geological
and Economic Survey Publication, v. 25, p. 118-125.
Pennsylvania Geological Survey, Subsurface rock correlation chart, Oriskany Sandstone,
http://www.dcnr.state.pa.us/topogeo/drc/tabledev.aspx (accessed August 24, 2008).
Poth, C.W., 1962, The occurrence of brine in western Pennsylvania: Department of Internal Affairs, Harrisburg,
Bulletin M 47, p. 53.
Price, P.H., Hare, C.E., McCue, J.B., and Hoskins, H.A., 1937, Salt brines of West Virginia: West Virginia
Geological and Economic Survey Publication, v. 8, p. 203.

60
Puckette, J., and Al-Shaieb, 2003, Naturally underpressured reservoirs: applying the compartment concept to the
safe disposal of liquid waste: The American Association of Petroleum Geologists, AAPG Southwest
Section Meeting, Fort Worth, TX, March 2003.
Radtke, D.B., Davis, J.V., and Wilde, F.D., Rounds, S.A., August 2005, Specific Electrical Conductance (version
1.2): U.S. Geological Survey Techniques of Water-Resources Investigations, book 9, chap. A6, section 6.3:
http://pubs.water.usgs.gov/twri9A6/ (accessed August 16, 2008).
Russell, W.L., 1972, Pressure-depth relations in Appalachian region: The American Association of Petroleum
Geologists, v. 56, p. 528-536.
Soong, Y., Allen, D.E., McCarthy-Jones, J.R., Harrison, D.K., Hedges, S.H., Baltrus, J.P., and Zhu, C., 2004a,
Preliminary experimental results of CO2 sequestration with brine: in Proceedings of the Eleventh
International Symposium on Water-Rock Interaction, Saratoga Springs: New York, p. 597-600.
Soong, Y., Goodman, A.L., McCarthy-Jones, J.R., and Baltrus, J.P., 2004b, Experimental and simulation studies on
mineral trapping of CO2 with brine: Energy Conversion and Management, v. 45, p. 1845-1859.
Stout, W., Lamborn, R.E., and Schaaf, D., 1932, Brines of Ohio (A preliminary report): Geological Society of Ohio,
Fourth Series, Bulletin 37.
Swartz, C.K., 1913, The Lower Devonian deposits of Maryland: Correlation of the Lower Devonian: Maryland
Geological Survey, Lower Devonian, p. 96-123.
Tans, P., 2008, Trends in atmospheric carbon dioxide—Mauna Loa: United States Department of Commerce:
http://www.esrl.noaa.gov/gmd/ccgg/trends/ (accessed November 09, 2009).
USDOE, 1999, Carbon Sequestration Research and Development: United States Department of Energy, Office of
Science, Office of Fossil Energy, December 1999:
www.fossil.energy.gov/programs/sequestration/publications/1999_rdreport/front_feb.pdf (accessed July 11,
2008).

61
USDOE, 2007, Carbon Sequestration Atlas of the United States and Canada: United States Department of Energy,
Office of Fossil Energy National Energy Technology Laboratory Report, March 2007:
http://www.netl.doe.gov/technologies/carbon_seq/refshelf/atlas/ATLAS.pdf (accessed April 24, 2008).
USDOE, 2008, Methodology for development of geologic storage estimates for carbon dioxide: United States
Department of Energy, National Energy Technology Laboratory, Carbon Sequestration Program, August
2008:
http://fossil.energy.gov/programs/sequestration/publications/Project_Reports/carbonstorage_method08.pdf
(accessed October 30, 2008).
U.S. Geological Survey, September 2006, Collection of water samples (ver. 2.0): U.S. Geological Survey
Techniques of Water-Resources Investigations, book 9, chap. A4: http://pubs.water.usgs.gov/twri9A4/
(accessed August 16, 2008).
UTBEG, Bureau of Economic Geology, the University of Texas at Austin, Research Environmental Quality,
http://www.beg.utexas.edu/environqlty/co2seq/research.htm, (accessed August 25, 2008).
Vanuxem, L., 1839, Third annual report of the Geological Survey of the third district: New York Geological Survey,
Annual Report 1839, p. 273.
Wickstrom, L. H., Venteris, E.R., Harper, J.A., McDonald, J., Slucher, E.R., Carter, K.M., Greb, S.F., Wells, J.G.,
Harrison, W.B., Nuttall, B.C., Riley, R.A., Drahovzal, J.A., Rupp, J.A., Avary, K.L., Lanham, S., Barnes,
D.A., Gupta, N., baranoski, M.A., Radhakkrishnan, P., Solis, M.P., Baum, G.R., Powers, D., Hohn, M.E.,
Parris, M.P., McCoy, K., Grammer, G.M., Pool, S., Luckhardt, C., and Kish, P., 2005, Characterization of
geologic sequestration opportunities in the MRCSP region: Phase I task report, October 2003-September
2005: DOE No. DE-PS26-05NT42255, p. 152.
Wilde, F.D., Busenburg, E., and Radtke, D.B., January 2006, pH (version 1.3): U.S. Geological Survey Techniques
of Water-Resources Investigations, book 9, chap. A6, section 6.4: http://pubs.water.usgs.gov/twri9A6/
(accessed August 16, 2008).

62
Woll, R.S., 1978, Maryland ground-water information: chemical quality data: Maryland Geological Survey
Publication: Water Resources Basic-Data Report No. 10, p. 102.
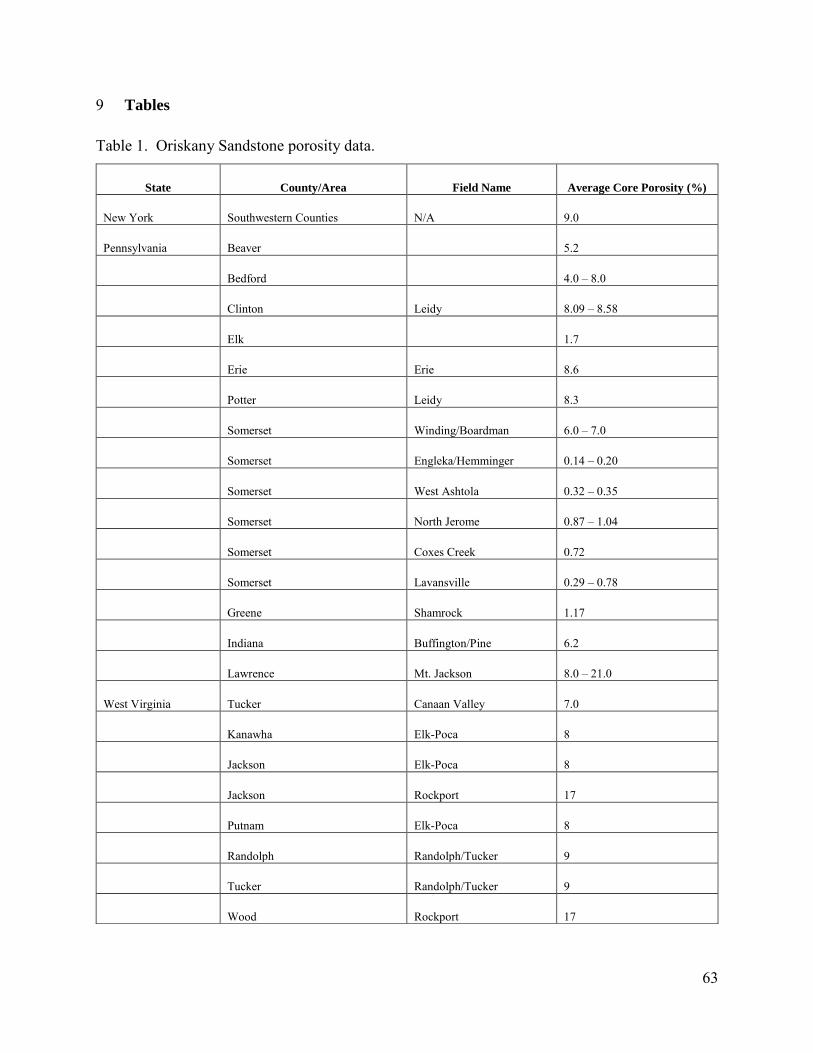
63
9 Tables
Table 1. Oriskany Sandstone porosity data.
State County/Area Field Name Average Core Porosity (%)
New York Southwestern Counties N/A 9.0
Pennsylvania Beaver 5.2
Bedford 4.0 – 8.0
Clinton Leidy 8.09 – 8.58
Elk 1.7
Erie Erie 8.6
Potter Leidy 8.3
Somerset Winding/Boardman 6.0 – 7.0
Somerset Engleka/Hemminger 0.14 – 0.20
Somerset West Ashtola 0.32 – 0.35
Somerset North Jerome 0.87 – 1.04
Somerset Coxes Creek 0.72
Somerset Lavansville 0.29 – 0.78
Greene Shamrock 1.17
Indiana Buffington/Pine 6.2
Lawrence Mt. Jackson 8.0 – 21.0
West Virginia Tucker Canaan Valley 7.0
Kanawha Elk-Poca 8
Jackson Elk-Poca 8
Jackson Rockport 17
Putnam Elk-Poca 8
Randolph Randolph/Tucker 9
Tucker Randolph/Tucker 9
Wood Rockport 17

64
Table 2. Criteria for culling formation water analyses based on chemical analysis (Hitchon and
Brulotte, 1994).
Criteria for Rejection Possible Causes
Any Ca, Mg, Cl, or SO4
with missing or zero values
Incomplete analysis; insufficient sample; very low content, thus difficultly in
determination
Mg ≥ Ca Signifies loss of CO2 and precipitation of CaCO3 before analysis; very low Ca+Mg,
thus difficulty in determination; incorrect entry of Ca+Mg as equivalent Ca as
separate Ca and Mg values
OH reported Wash from cement job; poor analysis
CO3 reported Contamination from drilling mud; poor sampling of separator or treater
Na (calculated) is negative Poor analysis
Density < 1.0 Poor determination; organic matter contamination
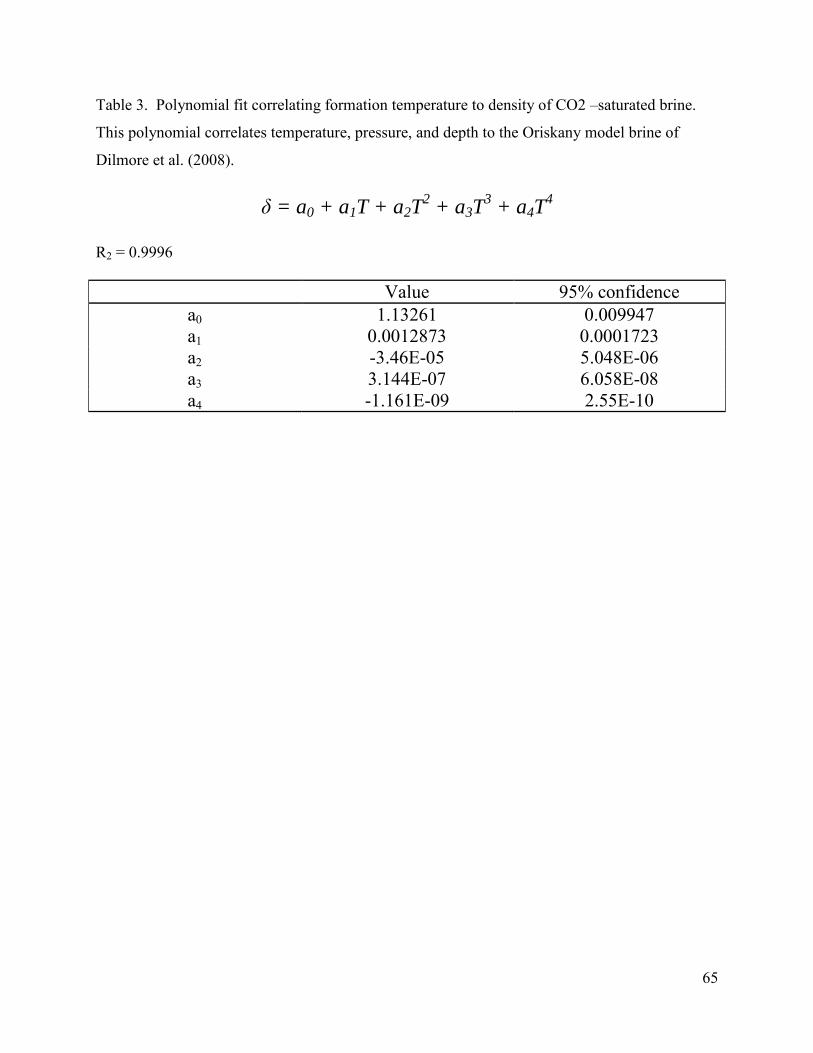
65
Table 3. Polynomial fit correlating formation temperature to density of CO2 –saturated brine.
This polynomial correlates temperature, pressure, and depth to the Oriskany model brine of
Dilmore et al. (2008).
δ = a0 + a1T + a2T2 + a3T
3 + a4T
4
R2 = 0.9996
Value 95% confidence a0 1.13261 0.009947 a1 0.0012873 0.0001723 a2 -3.46E-05 5.048E-06 a3 3.144E-07 6.058E-08 a4 -1.161E-09 2.55E-10

66
Table 4. Polynomial fit correlating temperature to formation CO2 concentration. This
polynomial correlates temperature, pressure, and depth to Oriskany CO2 concentration (Dilmore
et al., 2008).
mCO2 = a0 + a1T + a2T2 + a3T
3 + a4T
4 + a5T
5 + a6T
6 + a7T
7 + a8T
8
R2 = 09991
Value 95% confidence a0 -4.874733 1.094567 a1 0.5667273 0.2017776 a2 -0.0223232 0.015391 a3 0.0003551 0.0006366 a4 6.069E-07 1.568E-05 a5 -1.045E-07 2.364E-07 a6 1.537E-09 2.14E-09 a7 -9.701E-12 1.068E-11 a8 2.346E-14 2.254E-14

67
Appendix I
Oriskany Sandstone Formation Temperature Data

68
Oriskany Sandstone formation temperature data.
API Number Source Formation Latitude Longitude GL Elevation (m) Depth to Top of Formation (m) Temperature (°C)
3109713796 C Oriskany
423 741 24.4
3100723083 C Oriskany
433 741 24.0
3110112960 C Oriskany
404 911 27.8
3102322818 C Oriskany
509 822 27.8
3700920061 C Oriskany
396 1289 28.3
3110112923 C Oriskany
552 1110 30.0
3100313684 C Oriskany
555 960 32.8
3110112972 C Oriskany
587 1271 35.6
3100311762 C Oriskany
612 1361 36.3
3110110036 C Oriskany
616 1403 36.7
Chesapeake-1 C Oriskany
878 2821 36.0
3408100651 C Oriskany
360 1517 40.6
4707500020 C Oriskany 38.60889 -79.64920 1088 1783 42.2
3110113578 C Oriskany
699 1497 43.3
3700900024 C Oriskany
359 1611 43.3
3100915731 C Oriskany
529 1234 45.0
3711702007 C Oriskany
489 1566 45.0
4707500023 C Oriskany 38.53760 -79.67849 1027 1573 46.1
4703901018 C Helderberg 38.25858 -81.63494 244 1599 46.1
Chesapeake-2 C Oriskany
740 1740 46.7
3700920059 C Oriskany
470 1975 48.3
3408100412 C Oriskany
360 1748 48.9
4707500050 C Oriskany 38.61832 -79.64532 1145 1872 50.0
Chesapeake-3 C Oriskany 731 1869 50.0
4709702415 C Oriskany 38.83397 -80.32758 371 2431 55.0
4706101316 C Huntersville 39.57071 -79.85469 474 2373 55.6
3706300694 C Huntersville
471 2390 58.9
3705120506 C Huntersville
765 2363 59.4
4702300012 C Oriskany 39.08072 -79.26823 815 2632 60.6
4702300021 C Oriskany 39.07782 -79.25428 611 2643 60.6
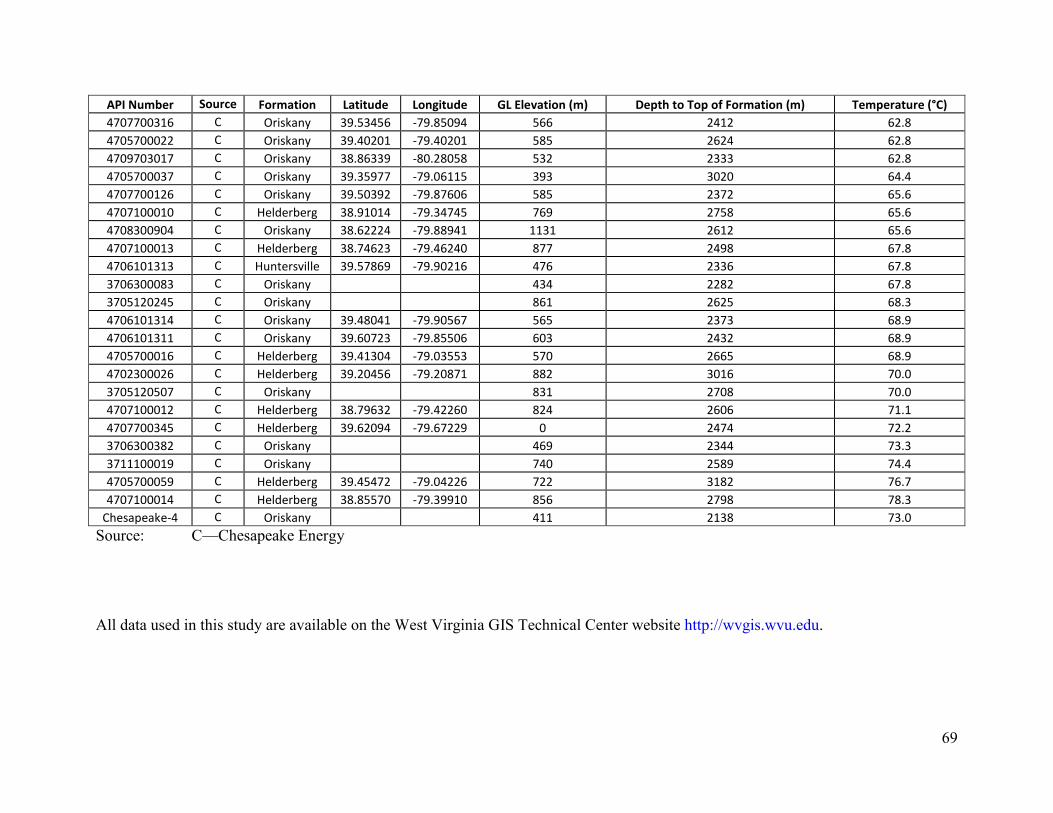
69
API Number Source Formation Latitude Longitude GL Elevation (m) Depth to Top of Formation (m) Temperature (°C)
4707700316 C Oriskany 39.53456 -79.85094 566 2412 62.8
4705700022 C Oriskany 39.40201 -79.40201 585 2624 62.8
4709703017 C Oriskany 38.86339 -80.28058 532 2333 62.8
4705700037 C Oriskany 39.35977 -79.06115 393 3020 64.4
4707700126 C Oriskany 39.50392 -79.87606 585 2372 65.6
4707100010 C Helderberg 38.91014 -79.34745 769 2758 65.6
4708300904 C Oriskany 38.62224 -79.88941 1131 2612 65.6
4707100013 C Helderberg 38.74623 -79.46240 877 2498 67.8
4706101313 C Huntersville 39.57869 -79.90216 476 2336 67.8
3706300083 C Oriskany
434 2282 67.8
3705120245 C Oriskany
861 2625 68.3
4706101314 C Oriskany 39.48041 -79.90567 565 2373 68.9
4706101311 C Oriskany 39.60723 -79.85506 603 2432 68.9
4705700016 C Helderberg 39.41304 -79.03553 570 2665 68.9
4702300026 C Helderberg 39.20456 -79.20871 882 3016 70.0
3705120507 C Oriskany
831 2708 70.0
4707100012 C Helderberg 38.79632 -79.42260 824 2606 71.1
4707700345 C Helderberg 39.62094 -79.67229 0 2474 72.2
3706300382 C Oriskany
469 2344 73.3
3711100019 C Oriskany
740 2589 74.4
4705700059 C Helderberg 39.45472 -79.04226 722 3182 76.7
4707100014 C Helderberg 38.85570 -79.39910 856 2798 78.3
Chesapeake-4 C Oriskany
411 2138 73.0
Source: C—Chesapeake Energy
All data used in this study are available on the West Virginia GIS Technical Center website http://wvgis.wvu.edu.

70
Appendix II
Oriskany Sandstone Formation Pressure Data
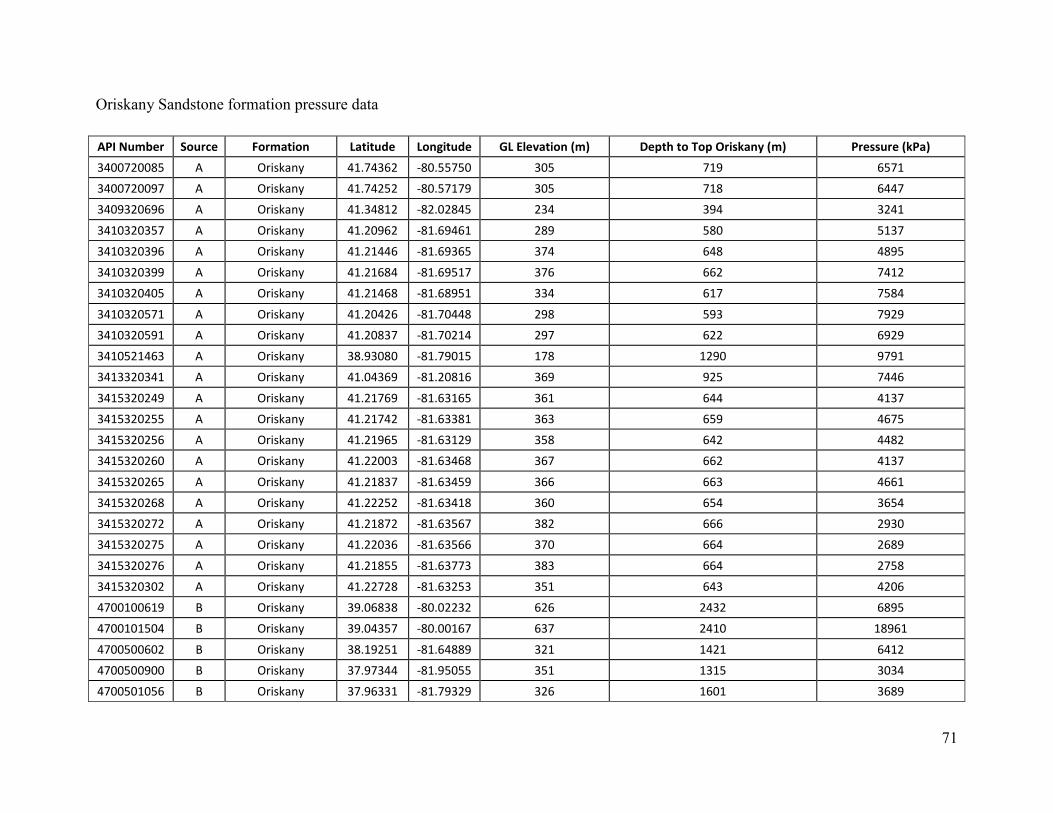
71
Oriskany Sandstone formation pressure data
API Number Source Formation Latitude Longitude GL Elevation (m) Depth to Top Oriskany (m) Pressure (kPa)
3400720085 A Oriskany 41.74362 -80.55750 305 719 6571
3400720097 A Oriskany 41.74252 -80.57179 305 718 6447
3409320696 A Oriskany 41.34812 -82.02845 234 394 3241
3410320357 A Oriskany 41.20962 -81.69461 289 580 5137
3410320396 A Oriskany 41.21446 -81.69365 374 648 4895
3410320399 A Oriskany 41.21684 -81.69517 376 662 7412
3410320405 A Oriskany 41.21468 -81.68951 334 617 7584
3410320571 A Oriskany 41.20426 -81.70448 298 593 7929
3410320591 A Oriskany 41.20837 -81.70214 297 622 6929
3410521463 A Oriskany 38.93080 -81.79015 178 1290 9791
3413320341 A Oriskany 41.04369 -81.20816 369 925 7446
3415320249 A Oriskany 41.21769 -81.63165 361 644 4137
3415320255 A Oriskany 41.21742 -81.63381 363 659 4675
3415320256 A Oriskany 41.21965 -81.63129 358 642 4482
3415320260 A Oriskany 41.22003 -81.63468 367 662 4137
3415320265 A Oriskany 41.21837 -81.63459 366 663 4661
3415320268 A Oriskany 41.22252 -81.63418 360 654 3654
3415320272 A Oriskany 41.21872 -81.63567 382 666 2930
3415320275 A Oriskany 41.22036 -81.63566 370 664 2689
3415320276 A Oriskany 41.21855 -81.63773 383 664 2758
3415320302 A Oriskany 41.22728 -81.63253 351 643 4206
4700100619 B Oriskany 39.06838 -80.02232 626 2432 6895
4700101504 B Oriskany 39.04357 -80.00167 637 2410 18961
4700500602 B Oriskany 38.19251 -81.64889 321 1421 6412
4700500900 B Oriskany 37.97344 -81.95055 351 1315 3034
4700501056 B Oriskany 37.96331 -81.79329 326 1601 3689

72
API Number Source Formation Latitude Longitude GL Elevation (m) Depth to Top Oriskany (m) Pressure (kPa)
4700702305 B Oriskany 38.75408 -80.63760 336 2160 9653
4701501915 B Oriskany 38.57948 -81.01992 267 1870 4426
4701702556 B Oriskany 39.33029 -80.77613 243 2100 14824
4702103376 B Oriskany 38.96374 -80.81037 287 2052 16892
4702104270 B Oriskany 38.94324 -80.82175 265 1985 9997
4702104374 B Oriskany 38.91667 -80.98674 238 1883 12928
4702104886 B Oriskany 38.96807 -80.89654 220 1899 16616
4702104892 B Oriskany 38.97533 -80.84726 241 1940 10411
4702105055 B Oriskany 38.97170 -80.82360 346 2044 11549
4702105355 B Oriskany 39.03789 -80.81083 350 2115 10515
4702300007 C Oriskany 39.95471 -79.32992 825 2563 20684
4702300008 C Oriskany 39.12748 -79.24653 796 2448 22063
4702300009 C Oriskany 39.96604 -79.32082 834 2508 17554
4702300013 C Oriskany 39.09597 -79.27809 904 2650 20133
4702300015 C Oriskany 39.05692 -79.27511 765 2423 17554
4702300017 C Oriskany 39.02178 -79.29464 868 2582 19650
4702300022 B Oriskany 39.16420 -79.22622 818 2576 13169
4702300023 V Oriskany 39.10715 -79.26953 829 2557 14548
4702300024 B Oriskany 39.06998 -79.27604 841 2586 8963
4702300030 V Oriskany 39.28557 -79.15300 814 2833 23856
4702300033 B Oriskany 39.10337 -79.26153 665 2381 9997
4702700003 B Oriskany 39.31606 -78.63784 409 1708 14479
4702700004 B Oriskany 39.30024 -78.65259 367 1465 14134
4702700008 B Oriskany 39.30997 -78.64493 390 1609 13652
4702700009 B Oriskany 39.29400 -78.65203 381 1551 13927
4702700010 B Oriskany 39.29487 -78.64829 363 1695 12755
4702700013 B Oriskany 39.44803 -78.54971 277 1569 11170
4702700015 B Oriskany 39.38111 -78.59530 300 1630 13748
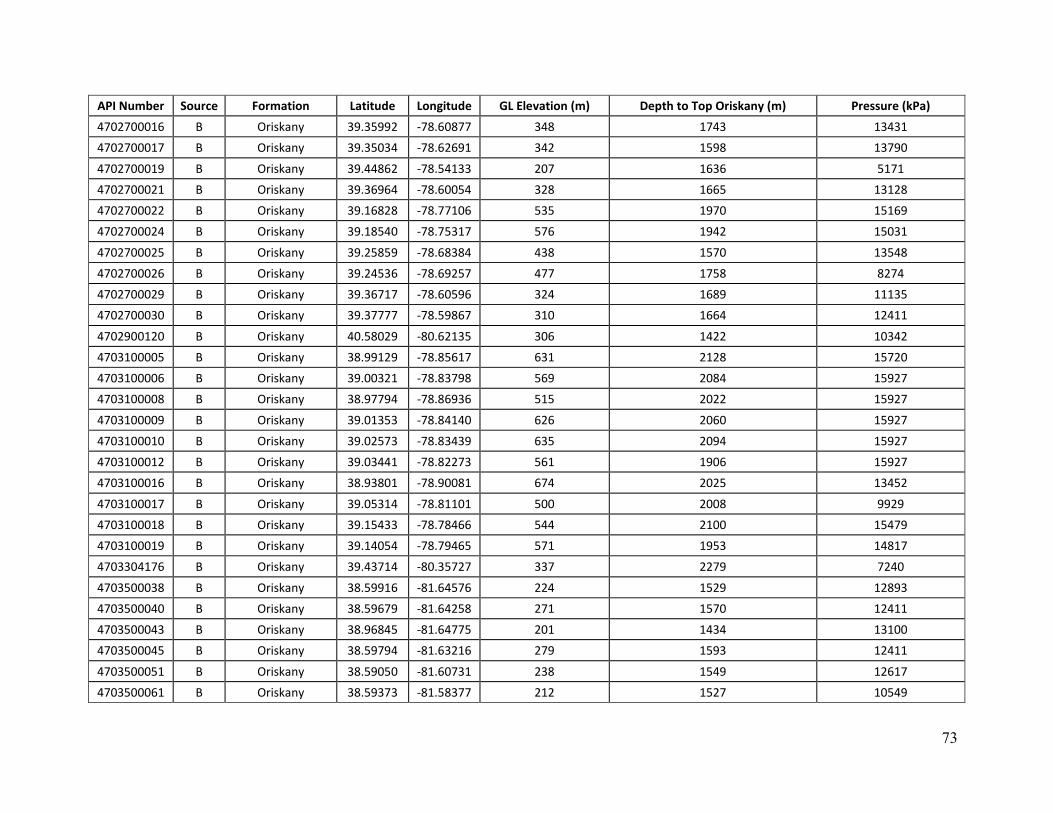
73
API Number Source Formation Latitude Longitude GL Elevation (m) Depth to Top Oriskany (m) Pressure (kPa)
4702700016 B Oriskany 39.35992 -78.60877 348 1743 13431
4702700017 B Oriskany 39.35034 -78.62691 342 1598 13790
4702700019 B Oriskany 39.44862 -78.54133 207 1636 5171
4702700021 B Oriskany 39.36964 -78.60054 328 1665 13128
4702700022 B Oriskany 39.16828 -78.77106 535 1970 15169
4702700024 B Oriskany 39.18540 -78.75317 576 1942 15031
4702700025 B Oriskany 39.25859 -78.68384 438 1570 13548
4702700026 B Oriskany 39.24536 -78.69257 477 1758 8274
4702700029 B Oriskany 39.36717 -78.60596 324 1689 11135
4702700030 B Oriskany 39.37777 -78.59867 310 1664 12411
4702900120 B Oriskany 40.58029 -80.62135 306 1422 10342
4703100005 B Oriskany 38.99129 -78.85617 631 2128 15720
4703100006 B Oriskany 39.00321 -78.83798 569 2084 15927
4703100008 B Oriskany 38.97794 -78.86936 515 2022 15927
4703100009 B Oriskany 39.01353 -78.84140 626 2060 15927
4703100010 B Oriskany 39.02573 -78.83439 635 2094 15927
4703100012 B Oriskany 39.03441 -78.82273 561 1906 15927
4703100016 B Oriskany 38.93801 -78.90081 674 2025 13452
4703100017 B Oriskany 39.05314 -78.81101 500 2008 9929
4703100018 B Oriskany 39.15433 -78.78466 544 2100 15479
4703100019 B Oriskany 39.14054 -78.79465 571 1953 14817
4703304176 B Oriskany 39.43714 -80.35727 337 2279 7240
4703500038 B Oriskany 38.59916 -81.64576 224 1529 12893
4703500040 B Oriskany 38.59679 -81.64258 271 1570 12411
4703500043 B Oriskany 38.96845 -81.64775 201 1434 13100
4703500045 B Oriskany 38.59794 -81.63216 279 1593 12411
4703500051 B Oriskany 38.59050 -81.60731 238 1549 12617
4703500061 B Oriskany 38.59373 -81.58377 212 1527 10549
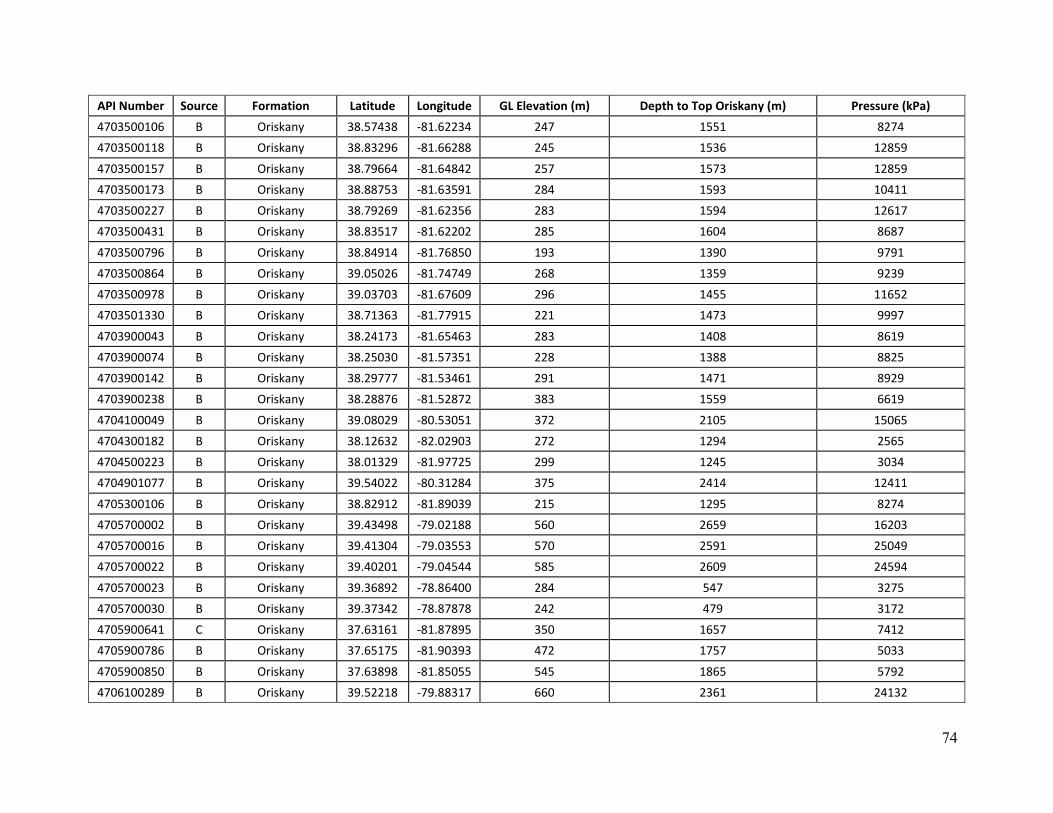
74
API Number Source Formation Latitude Longitude GL Elevation (m) Depth to Top Oriskany (m) Pressure (kPa)
4703500106 B Oriskany 38.57438 -81.62234 247 1551 8274
4703500118 B Oriskany 38.83296 -81.66288 245 1536 12859
4703500157 B Oriskany 38.79664 -81.64842 257 1573 12859
4703500173 B Oriskany 38.88753 -81.63591 284 1593 10411
4703500227 B Oriskany 38.79269 -81.62356 283 1594 12617
4703500431 B Oriskany 38.83517 -81.62202 285 1604 8687
4703500796 B Oriskany 38.84914 -81.76850 193 1390 9791
4703500864 B Oriskany 39.05026 -81.74749 268 1359 9239
4703500978 B Oriskany 39.03703 -81.67609 296 1455 11652
4703501330 B Oriskany 38.71363 -81.77915 221 1473 9997
4703900043 B Oriskany 38.24173 -81.65463 283 1408 8619
4703900074 B Oriskany 38.25030 -81.57351 228 1388 8825
4703900142 B Oriskany 38.29777 -81.53461 291 1471 8929
4703900238 B Oriskany 38.28876 -81.52872 383 1559 6619
4704100049 B Oriskany 39.08029 -80.53051 372 2105 15065
4704300182 B Oriskany 38.12632 -82.02903 272 1294 2565
4704500223 B Oriskany 38.01329 -81.97725 299 1245 3034
4704901077 B Oriskany 39.54022 -80.31284 375 2414 12411
4705300106 B Oriskany 38.82912 -81.89039 215 1295 8274
4705700002 B Oriskany 39.43498 -79.02188 560 2659 16203
4705700016 B Oriskany 39.41304 -79.03553 570 2591 25049
4705700022 B Oriskany 39.40201 -79.04544 585 2609 24594
4705700023 B Oriskany 39.36892 -78.86400 284 547 3275
4705700030 B Oriskany 39.37342 -78.87878 242 479 3172
4705900641 C Oriskany 37.63161 -81.87895 350 1657 7412
4705900786 B Oriskany 37.65175 -81.90393 472 1757 5033
4705900850 B Oriskany 37.63898 -81.85055 545 1865 5792
4706100289 B Oriskany 39.52218 -79.88317 660 2361 24132

75
API Number Source Formation Latitude Longitude GL Elevation (m) Depth to Top Oriskany (m) Pressure (kPa)
4706100335 B Oriskany 39.56205 -79.85628 668 2489 21029
4706100568 B Oriskany 39.61146 -79.84536 634 2443 24132
4706100599 B Oriskany 39.46408 -79.90737 571 2355 22408
4706101057 B Oriskany 39.69063 -79.78303 637 2366 21719
4706101078 B Oriskany 39.52454 -79.92791 511 2326 20340
4706101246 B Oriskany 39.55068 -79.91704 465 2290 16375
4706101282 B Oriskany 39.58872 -79.87474 599 2480 11032
4706101368 B Oriskany 39.47054 -79.95332 521 2335 18961
4706101373 B Oriskany 39.59786 -79.86275 436 2193 21029
4706101395 B Oriskany 39.62094 -79.84195 597 2356 24132
4706500003 B Oriskany 39.58553 -78.43412 168 1438 13790
4706500004 B Oriskany 39.58524 -78.43787 169 1362 13672
4707100013 B Oriskany 38.74623 -79.46240 877 2323 13100
4707100016 B Oriskany 38.66464 -79.54145 1113 2467 15741
4707301314 B Oriskany 39.44440 -81.08932 280 1829 14183
4707500004 B Oriskany 38.65302 -79.76943 982 1729 12728
4707500010 B Oriskany 38.70238 -79.74812 1067 1805 13686
4707500024 B Oriskany 38.51307 -79.69530 1173 1739 11307
4707500049 B Oriskany 38.53252 -79.69068 1024 1814 7998
4707500050 C Oriskany 38.61832 -79.64532 1139 1792 8791
4707700005 B Oriskany 39.43231 -79.56575 608 1850 15996
4707700010 B Oriskany 39.42047 -79.57452 579 1576 14755
4707700013 C Oriskany 39.43387 -79.57246 656 1649 12928
4707700017 B Oriskany 39.41231 -79.58019 613 1551 12907
4707700020 C Oriskany 39.40810 -79.58169 669 1600 10315
4707700025 B Oriskany 39.42672 -79.57357 703 1703 10342
4707700028 B Oriskany 39.41481 -79.57501 639 1598 10480
4707700061 B Oriskany 39.26999 -79.49884 776 1500 12928
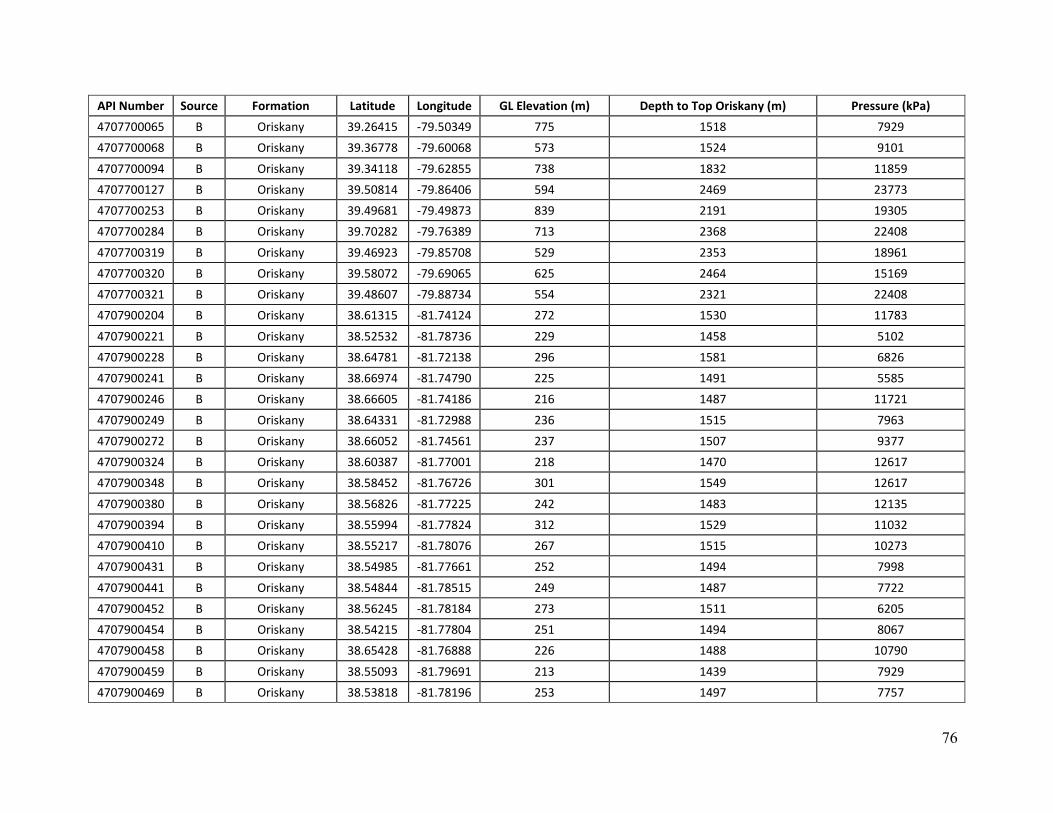
76
API Number Source Formation Latitude Longitude GL Elevation (m) Depth to Top Oriskany (m) Pressure (kPa)
4707700065 B Oriskany 39.26415 -79.50349 775 1518 7929
4707700068 B Oriskany 39.36778 -79.60068 573 1524 9101
4707700094 B Oriskany 39.34118 -79.62855 738 1832 11859
4707700127 B Oriskany 39.50814 -79.86406 594 2469 23773
4707700253 B Oriskany 39.49681 -79.49873 839 2191 19305
4707700284 B Oriskany 39.70282 -79.76389 713 2368 22408
4707700319 B Oriskany 39.46923 -79.85708 529 2353 18961
4707700320 B Oriskany 39.58072 -79.69065 625 2464 15169
4707700321 B Oriskany 39.48607 -79.88734 554 2321 22408
4707900204 B Oriskany 38.61315 -81.74124 272 1530 11783
4707900221 B Oriskany 38.52532 -81.78736 229 1458 5102
4707900228 B Oriskany 38.64781 -81.72138 296 1581 6826
4707900241 B Oriskany 38.66974 -81.74790 225 1491 5585
4707900246 B Oriskany 38.66605 -81.74186 216 1487 11721
4707900249 B Oriskany 38.64331 -81.72988 236 1515 7963
4707900272 B Oriskany 38.66052 -81.74561 237 1507 9377
4707900324 B Oriskany 38.60387 -81.77001 218 1470 12617
4707900348 B Oriskany 38.58452 -81.76726 301 1549 12617
4707900380 B Oriskany 38.56826 -81.77225 242 1483 12135
4707900394 B Oriskany 38.55994 -81.77824 312 1529 11032
4707900410 B Oriskany 38.55217 -81.78076 267 1515 10273
4707900431 B Oriskany 38.54985 -81.77661 252 1494 7998
4707900441 B Oriskany 38.54844 -81.78515 249 1487 7722
4707900452 B Oriskany 38.56245 -81.78184 273 1511 6205
4707900454 B Oriskany 38.54215 -81.77804 251 1494 8067
4707900458 B Oriskany 38.65428 -81.76888 226 1488 10790
4707900459 B Oriskany 38.55093 -81.79691 213 1439 7929
4707900469 B Oriskany 38.53818 -81.78196 253 1497 7757
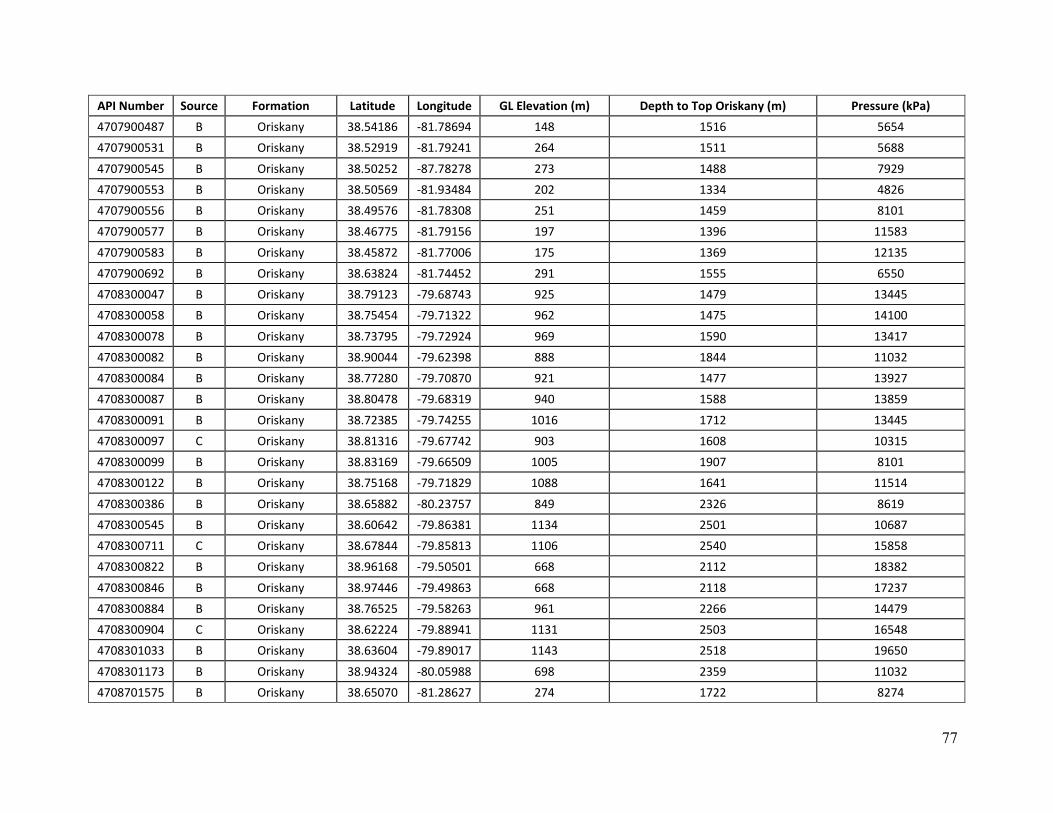
77
API Number Source Formation Latitude Longitude GL Elevation (m) Depth to Top Oriskany (m) Pressure (kPa)
4707900487 B Oriskany 38.54186 -81.78694 148 1516 5654
4707900531 B Oriskany 38.52919 -81.79241 264 1511 5688
4707900545 B Oriskany 38.50252 -87.78278 273 1488 7929
4707900553 B Oriskany 38.50569 -81.93484 202 1334 4826
4707900556 B Oriskany 38.49576 -81.78308 251 1459 8101
4707900577 B Oriskany 38.46775 -81.79156 197 1396 11583
4707900583 B Oriskany 38.45872 -81.77006 175 1369 12135
4707900692 B Oriskany 38.63824 -81.74452 291 1555 6550
4708300047 B Oriskany 38.79123 -79.68743 925 1479 13445
4708300058 B Oriskany 38.75454 -79.71322 962 1475 14100
4708300078 B Oriskany 38.73795 -79.72924 969 1590 13417
4708300082 B Oriskany 38.90044 -79.62398 888 1844 11032
4708300084 B Oriskany 38.77280 -79.70870 921 1477 13927
4708300087 B Oriskany 38.80478 -79.68319 940 1588 13859
4708300091 B Oriskany 38.72385 -79.74255 1016 1712 13445
4708300097 C Oriskany 38.81316 -79.67742 903 1608 10315
4708300099 B Oriskany 38.83169 -79.66509 1005 1907 8101
4708300122 B Oriskany 38.75168 -79.71829 1088 1641 11514
4708300386 B Oriskany 38.65882 -80.23757 849 2326 8619
4708300545 B Oriskany 38.60642 -79.86381 1134 2501 10687
4708300711 C Oriskany 38.67844 -79.85813 1106 2540 15858
4708300822 B Oriskany 38.96168 -79.50501 668 2112 18382
4708300846 B Oriskany 38.97446 -79.49863 668 2118 17237
4708300884 B Oriskany 38.76525 -79.58263 961 2266 14479
4708300904 C Oriskany 38.62224 -79.88941 1131 2503 16548
4708301033 B Oriskany 38.63604 -79.89017 1143 2518 19650
4708301173 B Oriskany 38.94324 -80.05988 698 2359 11032
4708701575 B Oriskany 38.65070 -81.28627 274 1722 8274

78
API Number Source Formation Latitude Longitude GL Elevation (m) Depth to Top Oriskany (m) Pressure (kPa)
4708703853 B Oriskany 38.78615 -81.30650 277 1784 7240
4708703856 B Oriskany 38.78020 -81.31020 317 1819 6895
4708704031 B Oriskany 38.69498 -81.25259 317 1795 6895
4708704050 B Oriskany 38.74623 -81.23350 280 1795 6895
4709300001 B Oriskany 39.08044 -79.39784 1020 2429 22063
4709300002 C Oriskany 39.06310 -79.40547 1019 2515 20684
4709300003 B Oriskany 39.09771 -79.38746 1005 2455 15720
4709300022 B Oriskany 39.23074 -79.75269 552 1347 13341
4709300027 B Oriskany 39.23737 -79.74728 506 1305 11032
4709300030 B Oriskany 39.24594 -79.74150 587 1412 10983
4709300050 B Oriskany 39.04542 -79.43951 986 2531 7584
4709300054 B Oriskany 39.02351 -79.44327 1000 2505 16203
4709500976 B Oriskany 39.50016 -81.08138 191 1710 14348
4709702777 B Oriskany 38.82956 -80.39057 500 2252 7584
4709703022 B Oriskany 38.84249 -80.32837 539 2204 16892
4710300645 B Oriskany 39.67814 -80.82395 411 2091 13790
4710700169 B Oriskany 39.33246 -81.47625 205 1439 7584
4710700288 B Oriskany 39.04734 -81.55841 311 1629 12928
4710700320 B Oriskany 39.08393 -81.54036 261 1529 7446
4710700375 B Oriskany 39.21430 -81.70654 269 1326 10756
4710700384 B Oriskany 39.20893 -81.69928 259 1329 10756
4710700385 B Oriskany 39.20108 -81.72343 213 1257 11549
4710700386 B Oriskany 39.19788 -81.72976 189 1230 11549
4710700387 B Oriskany 39.21168 -81.69182 214 1293 11170
4710700391 B Oriskany 39.20442 -81.69667 235 1312 11170
4710700392 B Oriskany 39.19730 -81.71132 190 1250 11445
4710700395 B Oriskany 39.19077 -81.70412 200 1269 10894
4710700611 B Oriskany 39.19812 -81.42551 235 1595 9308

79
API Number Source Formation Latitude Longitude GL Elevation (m) Depth to Top Oriskany (m) Pressure (kPa)
4710701053 B Oriskany 39.26830 -81.65673 194 1275 10342
4710701303 B Oriskany 39.14461 -81.54390 195 1451 8274
4710701309 B Oriskany 39.24811 -81.60812 205 1331 5171
Source: A—Ohio Stat Division of Natural Resources website http://www.dnr.state.oh.us B—West Virginia Geologic and Economic Survey website http://www.wvgs.wvnet.edu C—Chesapeake Energy
All data used in this study are available on the West Virginia GIS Technical Center website http://wvgis.wvu.edu.

80
Appendix III
Oriskany Sandstone Geochemical Data
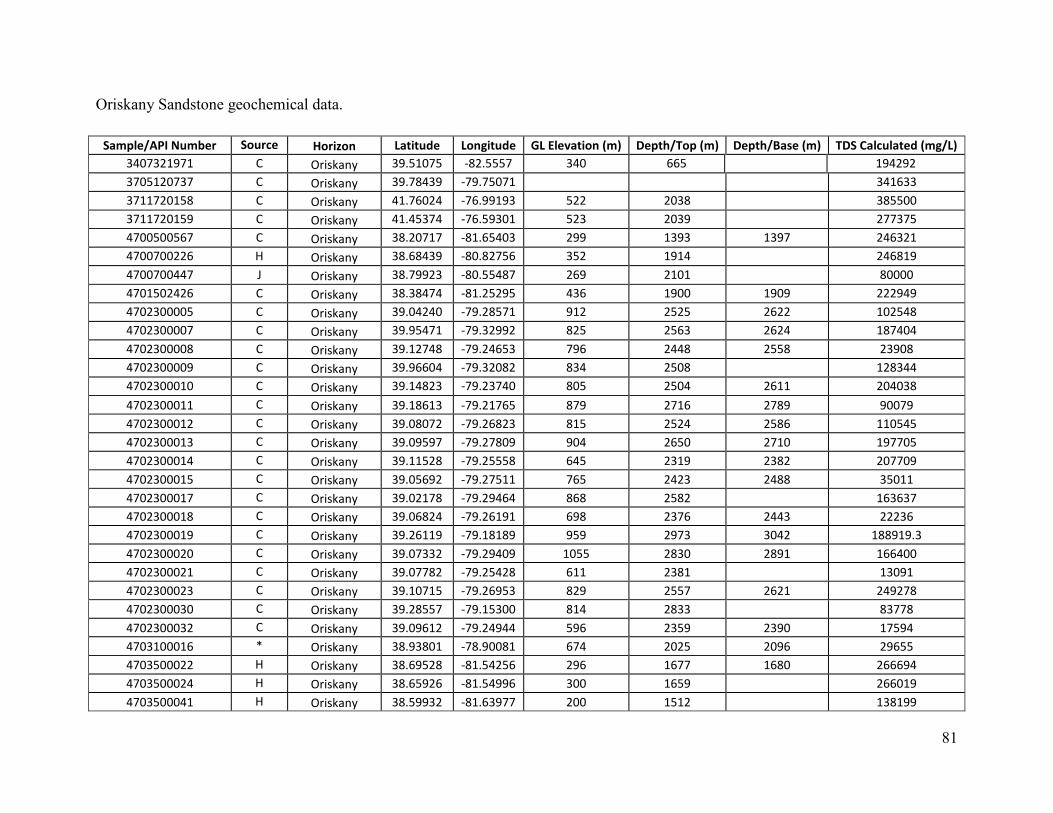
81
Oriskany Sandstone geochemical data.
Sample/API Number Source Horizon Latitude Longitude GL Elevation (m) Depth/Top (m) Depth/Base (m) TDS Calculated (mg/L)
3407321971 C Oriskany 39.51075 -82.5557 340 665 194292
3705120737 C Oriskany 39.78439 -79.75071 341633
3711720158 C Oriskany 41.76024 -76.99193 522 2038 385500
3711720159 C Oriskany 41.45374 -76.59301 523 2039 277375
4700500567 C Oriskany 38.20717 -81.65403 299 1393 1397 246321
4700700226 H Oriskany 38.68439 -80.82756 352 1914 246819
4700700447 J Oriskany 38.79923 -80.55487 269 2101 80000
4701502426 C Oriskany 38.38474 -81.25295 436 1900 1909 222949
4702300005 C Oriskany 39.04240 -79.28571 912 2525 2622 102548
4702300007 C Oriskany 39.95471 -79.32992 825 2563 2624 187404
4702300008 C Oriskany 39.12748 -79.24653 796 2448 2558 23908
4702300009 C Oriskany 39.96604 -79.32082 834 2508 128344
4702300010 C Oriskany 39.14823 -79.23740 805 2504 2611 204038
4702300011 C Oriskany 39.18613 -79.21765 879 2716 2789 90079
4702300012 C Oriskany 39.08072 -79.26823 815 2524 2586 110545
4702300013 C Oriskany 39.09597 -79.27809 904 2650 2710 197705
4702300014 C Oriskany 39.11528 -79.25558 645 2319 2382 207709
4702300015 C Oriskany 39.05692 -79.27511 765 2423 2488 35011
4702300017 C Oriskany 39.02178 -79.29464 868 2582
163637
4702300018 C Oriskany 39.06824 -79.26191 698 2376 2443 22236
4702300019 C Oriskany 39.26119 -79.18189 959 2973 3042 188919.3
4702300020 C Oriskany 39.07332 -79.29409 1055 2830 2891 166400
4702300021 C Oriskany 39.07782 -79.25428 611 2381
13091
4702300023 C Oriskany 39.10715 -79.26953 829 2557 2621 249278
4702300030 C Oriskany 39.28557 -79.15300 814 2833
83778
4702300032 C Oriskany 39.09612 -79.24944 596 2359 2390 17594
4703100016 * Oriskany 38.93801 -78.90081 674 2025 2096 29655
4703500022 H Oriskany 38.69528 -81.54256 296 1677 1680 266694
4703500024 H Oriskany 38.65926 -81.54996 300 1659
266019
4703500041 H Oriskany 38.59932 -81.63977 200 1512
138199

82
Sample/API Number Source Horizon Latitude Longitude GL Elevation (m) Depth/Top (m) Depth/Base (m) TDS Calculated (mg/L)
4703500053 H Oriskany 38.57157 -81.59830 254 1555
259914
4703500077 H Oriskany 38.57535 -81.64983 288 1609
268146
4703500094 C Oriskany 38.60634 -81.65371 213 1509
338377
4703500103 H Oriskany 38.94282 -81.58816 204 1546
264713
4703500104 C Oriskany 38.60925 -81.62882 276 1586
92342
4703500112 H Oriskany 38.95341 -81.62567 211 1523
262276
4703500198 H Oriskany 38.86180 -81.61973 211 1644
275968
4703500223 H Oriskany 38.82898 -81.61559 195 1532
175678
4703500224 H Oriskany 38.61543 -81.58049 208 1543
239231
4703500225 C Oriskany 38.61878 -81.64038 234 1536
315133
4703500272 C Oriskany 38.74753 -81.63530 256 1579
270117
4703500273 C Oriskany 38.74394 -81.64003 269 1589
278947
4703500308 H Oriskany 38.91959 -81.60821 235 1579
239793
4703500312 H Oriskany 38.79386 -81.61874 213 1549
267695
4703500332 H Oriskany 38.86413 -81.59392 213 1597
241390
4703500337 H Oriskany 38.91623 -81.61323 285 1628
226768
4703500381 H Oriskany 38.63067 -81.64995 248 1561
264309
4703500398 H Oriskany 38.78094 -81.62115 273 1610
267683
4703500413 C Oriskany 38.77699 -81.62970 303 1625
178745
4703500419 C Oriskany 38.76065 -81.64656 190 1503 1519 342271
4703500441 H Oriskany 38.75161 -81.62059 253 1590
270323
4703500486 C Oriskany 38.8843 -81.6815 201 1481 1498 55722
4703500512 C Oriskany 38.83755 -81.6789 208 1502
217147
4703500531 C Oriskany 38.85337 -81.6947 225 1504
148323
4703500911 C Oriskany 38.88024 -81.6954 223 1498
99380
4703502408 C Oriskany 38.8239 -81.6811 225 1512
202822
4703502464 C Oriskany 38.84409 -81.6985 184 1462 1472 82199
4703900222 I Oriskany 38.27818 -81.50221 345 1550 1551 238989
4703900226 I Oriskany 38.43875 -81.35657 382 1761
262164
4703900269 I Oriskany 38.26830 -81.50828 405 1600
233580
4703900321 H Oriskany 38.44919 -81.57264 280 1523
271551
4703900458 H Oriskany 38.44615 -81.58850 305 1561
264280

83
Sample/API Number Source Horizon Latitude Longitude GL Elevation (m) Depth/Top (m) Depth/Base (m) TDS Calculated (mg/L)
4703900513 H Oriskany 38.45065 -81.59200 315 1569
266696
4703900696 H Oriskany 38.52934 -81.66645 261 1539
253625
4703900754 H Oriskany 38.47315 -81.44838 223 1589
273093
4703900771 C Oriskany 38.56897 -81.64680 232 1537 1551 347133
4703900926 H Oriskany 38.45166 -81.65561 217 1478
259923
4703901352 C Oriskany 38.52411 -81.4859 260 1581 1594 51230
4703901533 C Oriskany 38.44865 -81.4375 307 1654
92283
4703905269 C Oriskany 38.442513 -81.403 368 1706 1718 129349
4705300260 C Oriskany 38.77570 -82.07207 211
216847
4705500014 C Oriskany 37.35613 -81.18628 794 2385 2432 77000
4705700022 C Oriskany 39.40201 -79.04544 585 2609
222
4705900641 C Oriskany 37.63161 -81.87895 350 1657 1661 48245
4706100337 * Oriskany 39.58848 -79.83815 608 2471
279860
4706100347 * Oriskany 39.56573 -79.88614 626 2446 2463 271200
4706900038 C Oriskany 40.05866 -80.58205 396 2060 2087 216847
4707100010 C Oriskany 38.91014 -79.34745 769 2594 2665 185867
4707100012 C Oriskany 38.79632 -79.42260 824 2458 2552 76479
4707500011 C Oriskany 38.67495 -79.75759 1052 1750 1809 28441
4707500014 C Oriskany 38.63024 -79.78072 984 1815 1870 195659
4707500025 * Oriskany 38.68381 -79.75481 1048 1771 1832 282995
4707500026 C Oriskany 38.66391 -79.7635 1072 1794 1863 21691
4707500033 * Oriskany 38.65999 -79.7655 1014 1740 1800 37090
4707500034 C Oriskany 38.66769 -79.76184 1063 1806
42737
4707700013 C Oriskany 39.43387 -79.57246 656 1649 1699 89348
4707700021 C Oriskany 39.41043 -79.57720 685
122512
4707700025 * Oriskany 39.42672 -79.57357 703
176969
4707700058 C Oriskany 39.40331 -79.59137 536 1419 1451 259414
4707700090 H Oriskany 39.35337 -79.60835 784 1835 1875
4707700141 C Oriskany 39.38034 -79.58653 610 1609 1649 30887
4707700143 C Oriskany 39.36482 -79.60156 680 1651 1690 313023
4707700155 C Oriskany 39.38197 -79.58294 610 1603 1644 198626
4707700156 C Oriskany 39.37754 -79.59483 631 1568 1608 340920

84
Sample/API Number Source Horizon Latitude Longitude GL Elevation (m) Depth/Top (m) Depth/Base (m) TDS Calculated (mg/L)
4707700158 C Oriskany 39.36237 -79.59397 775 1810 1851 130370
4707700162 * Oriskany 39.35409 -79.62037 617 1611 1650 324460
4707700164 C Oriskany 39.33534 -79.62316 794 1953 1993 202318
4707700166 C Oriskany 39.42145 -79.54762 815 2010 2046 255943
4707700186 * Oriskany 39.51110 -79.83121 540 2368 2391 292200
4707700316 C Oriskany 39.53456 -79.85094 566 2358 2393 255943
4707900031 C Oriskany 38.42908 -81.85005 180 1321 1322 114035
4707900204 H Oriskany 38.61311 -81.74124 272 1547
266039
4708100289 C Oriskany 37.828689 -81.31032 548 2000 2004 75000
4708300002 H Oriskany 38.78442 -79.91600 619 1135 1153 107840
4708300096 C Oriskany 38.75422 -79.723 990 1572
3622
4708300097 C Oriskany 38.81316 -79.67742 903 1608
97453
4708300118 C Oriskany 38.78203 -79.69855 987 1516 1576 136876
4708300124 C Oriskany 38.74918 -79.7216 1061 1624 1698 1836
4708300126 C Oriskany 38.79111 -79.69454 985 1601 1664 185113
4708300612 C Oriskany 38.75186 -80.11867 945
225130
4708300904 C Oriskany 38.62224 -79.88941 1131 2503 2559 191039
4708700239 I Oriskany 38.61978 -81.14033 314 1822
222755
4708700413 H Oriskany 38.55924 -81.39392 309 1676
275327
4708700429 H Oriskany 38.60787 -81.51940 207 1544
272738
4708701200 J Oriskany 38.60874 -81.31771 279 1682
37000
4708900005 C Oriskany 37.69236 -80.95206 553 2128 2134 38000
4709300002 C Oriskany 39.06310 -79.40547 1019 2515 2554 230964
4709702852 C Oriskany 38.69745 -80.28997 812 2370 2436 253721
4709900393 H Oriskany 38.23142 -82.55329 231 928
121699
4710500068 I Oriskany 38.99318 -81.30763 254 1494 1495 274294
4710500091 H Oriskany 39.02368 -81.30413 265 1488
4710500171 H Oriskany 38.91115 -81.36267 246 1724
255999
4710500531 J Oriskany 38.95428 -81.29141 320 1807 1818 294197
4710700306 C Oriskany 39.05808 -81.5502 329 1640
222516
4710700336 C Oriskany 39.07782 -81.5357 300 1598
226438
4710700346 C Oriskany 39.07985 -81.53311 290 1586
235513

85
Sample/API Number Source Horizon Latitude Longitude GL Elevation (m) Depth/Top (m) Depth/Base (m) TDS Calculated (mg/L)
4710700351 J Oriskany 39.25698 -81.27240 324 1323
190000
ED-82-37 F Oriskany 39.97139 -79.09139 646 2694 2727 101000
ED-82-38 F Oriskany 39.94111 -79.11944 570 2676 2695 230000
ED-82-39 F Oriskany 39.93361 -79.11056 642 2697 2729 302000
ED-82-40 F Oriskany 40.04167 -78.91667 718 2604 2627 343000
Maryland_GARCO_G41 M Oriskany 39.65722 -79.325 603 2128 2166 305380
Maryland_WASCO_AC2 M Oriskany 39.70416 -78.22916 189 42 43 113
Maryland-153 * Oriskany 39.665 -79.2361 893 2588 2632 130960
NewYork_1 L Oriskany 42.05 -78.62
1246 1252 254534
NewYork_2 L Oriskany 42.11 -78.17
1430 1436 306509
NewYork_3 L Oriskany 42.17 -78.00
1169 1170 321261
NewYork_4 L Oriskany 42.17 -77.92
1169 1181 318570
NewYork_5 L Oriskany 42.052 -77.32
1250
262609
OHIO_12 G Oriskany 40.85057 -82.08988 357 652
252900
OHIO_18 G Oriskany 41.31122 -82.09506
384 399 177900
OHIO_21 G Oriskany 40.40286 -80.71155 357 1568 1577 316100
OHIO_243 G Oriskany 40.91527 -81.76897 290 693
231090
OHIO_244 G Oriskany 41.76928 -81.28762
457
295700
OHIO_25 G Oriskany 41.20770 -81.91132
547
273500
OHIO_2545 G Oriskany 39.74174 -81.65590
1162 1167 292700
OHIO_287 G Oriskany 41.32416 -81.53710 347 753
197550
OHIO_29 G Oriskany 40.74705 -82.40302 347 611
165600
OHIO_3 G Oriskany 40.92303 -82.14164 337 608 613 251200
OHIO_31 G Oriskany 41.26723 -81.95789 255 463 469 256100
OHIO_32 G Oriskany 41.15853 -81.64475 318 650 652 246750
OHIO_34 G Oriskany 41.16371 -81.99154 270 530
257700
OHIO_3477 G Oriskany 39.65279 -81.51805
1311 1318 285000
OHIO_36 G Oriskany 41.01102 -82.11317 332 555
224800
OHIO_37 G Oriskany 40.83763 -82.17269
604
246800
OHIO_38 G Oriskany 40.86868 -82.28915
515
133700
OHIO_57 G Oriskany 41.40439 -82.09609 191 337
168750
OHIO_58 G Oriskany 41.19994 -82.01069 282 475
241900
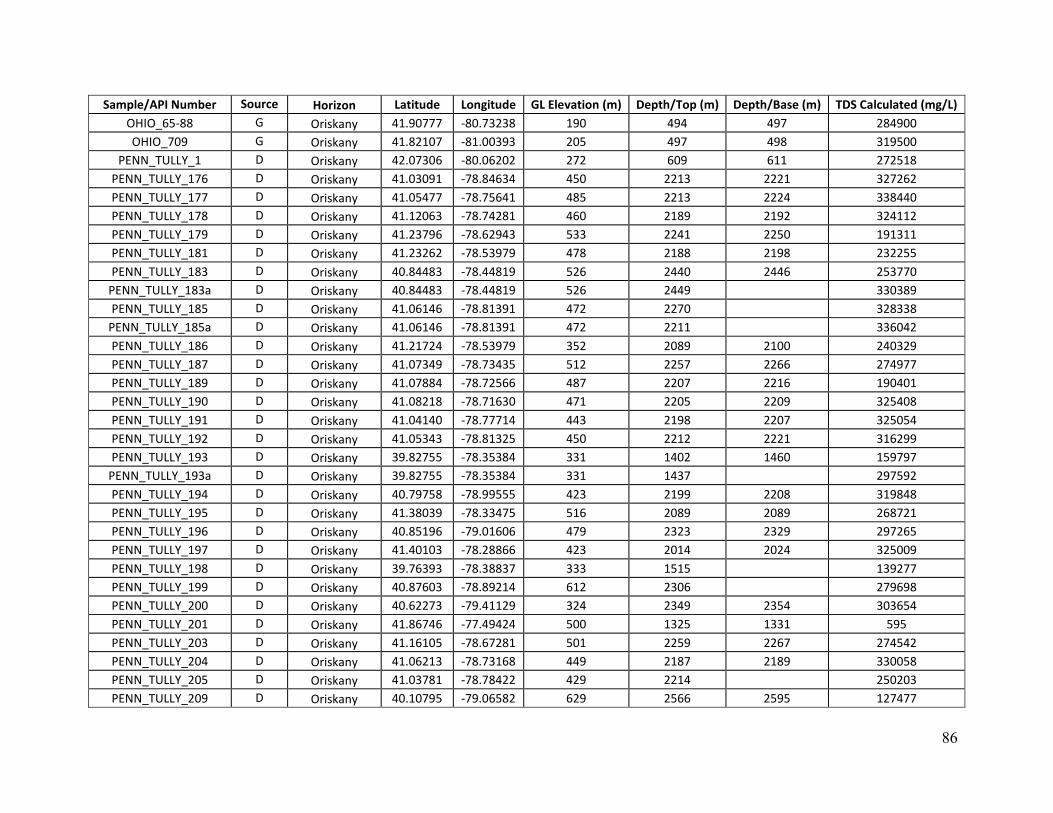
86
Sample/API Number Source Horizon Latitude Longitude GL Elevation (m) Depth/Top (m) Depth/Base (m) TDS Calculated (mg/L)
OHIO_65-88 G Oriskany 41.90777 -80.73238 190 494 497 284900
OHIO_709 G Oriskany 41.82107 -81.00393 205 497 498 319500
PENN_TULLY_1 D Oriskany 42.07306 -80.06202 272 609 611 272518
PENN_TULLY_176 D Oriskany 41.03091 -78.84634 450 2213 2221 327262
PENN_TULLY_177 D Oriskany 41.05477 -78.75641 485 2213 2224 338440
PENN_TULLY_178 D Oriskany 41.12063 -78.74281 460 2189 2192 324112
PENN_TULLY_179 D Oriskany 41.23796 -78.62943 533 2241 2250 191311
PENN_TULLY_181 D Oriskany 41.23262 -78.53979 478 2188 2198 232255
PENN_TULLY_183 D Oriskany 40.84483 -78.44819 526 2440 2446 253770
PENN_TULLY_183a D Oriskany 40.84483 -78.44819 526 2449
330389
PENN_TULLY_185 D Oriskany 41.06146 -78.81391 472 2270
328338
PENN_TULLY_185a D Oriskany 41.06146 -78.81391 472 2211
336042
PENN_TULLY_186 D Oriskany 41.21724 -78.53979 352 2089 2100 240329
PENN_TULLY_187 D Oriskany 41.07349 -78.73435 512 2257 2266 274977
PENN_TULLY_189 D Oriskany 41.07884 -78.72566 487 2207 2216 190401
PENN_TULLY_190 D Oriskany 41.08218 -78.71630 471 2205 2209 325408
PENN_TULLY_191 D Oriskany 41.04140 -78.77714 443 2198 2207 325054
PENN_TULLY_192 D Oriskany 41.05343 -78.81325 450 2212 2221 316299
PENN_TULLY_193 D Oriskany 39.82755 -78.35384 331 1402 1460 159797
PENN_TULLY_193a D Oriskany 39.82755 -78.35384 331 1437
297592
PENN_TULLY_194 D Oriskany 40.79758 -78.99555 423 2199 2208 319848
PENN_TULLY_195 D Oriskany 41.38039 -78.33475 516 2089 2089 268721
PENN_TULLY_196 D Oriskany 40.85196 -79.01606 479 2323 2329 297265
PENN_TULLY_197 D Oriskany 41.40103 -78.28866 423 2014 2024 325009
PENN_TULLY_198 D Oriskany 39.76393 -78.38837 333 1515
139277
PENN_TULLY_199 D Oriskany 40.87603 -78.89214 612 2306
279698
PENN_TULLY_200 D Oriskany 40.62273 -79.41129 324 2349 2354 303654
PENN_TULLY_201 D Oriskany 41.86746 -77.49424 500 1325 1331 595
PENN_TULLY_203 D Oriskany 41.16105 -78.67281 501 2259 2267 274542
PENN_TULLY_204 D Oriskany 41.06213 -78.73168 449 2187 2189 330058
PENN_TULLY_205 D Oriskany 41.03781 -78.78422 429 2214
250203
PENN_TULLY_209 D Oriskany 40.10795 -79.06582 629 2566 2595 127477

87
Sample/API Number Source Horizon Latitude Longitude GL Elevation (m) Depth/Top (m) Depth/Base (m) TDS Calculated (mg/L)
PENN_TULLY_210 D Oriskany 40.09538 -79.29357 666 2236
315328
PENN_TULLY_211 D Oriskany 40.09686 -79.07691 647 2594 2606 154357
PENN_TULLY_212 D Oriskany 40.10647 -79.28839 747 2383 2392 308131
PENN_TULLY_213 D Oriskany 40.11756 -79.05325 637 2341 2634 172401
PENN_TULLY_214 D Oriskany 40.12865 -79.04215 621 2615 2637 250199
PENN_TULLY_215 D Oriskany 40.06506 -79.09540 628 2579 2609 281474
PENN_TULLY_216 D Oriskany 40.09168 -79.11018 621 2601 2629 220885
PENN_TULLY_217 D Oriskany 40.16341 -79.14050 753 2477 2479 414614
PENN_TULLY_217a D Oriskany 40.16341 -79.14050 753 2455 2479 124060
PENN_TULLY_220a D Oriskany 40.00221 -79.33054 843 2470 2501 122695
PENN_TULLY_224 D Oriskany 41.35134 -80.19413 404 1219 1233 330382
PENN_TULLY_225 D Oriskany 40.32857 -79.26270 824 2298 2312 277677
PENN_TULLY_227 D Oriskany 40.22254 -79.38544 640 2539
317284
PENN_TULLY_227a D Oriskany 40.22254 -79.38544 640 2539
321308
PENN_TULLY_229 D Oriskany 40.38876 -78.82247 650 2697 2728 312823
PENN_TULLY_3 D Oriskany 41.91240 -77.17413 482 1315
276234
PENN_TULLY_4 D Oriskany 41.67769 -79.39847 500 1321 1326 309560
PENN_TULLY_45 D Oriskany 40.17965 -79.43499 540 2236 2266 272298
PENN_TULLY_5 D Oriskany 41.45388 -80.36174 302 977 981 332297
PENN_TULLY_52 D Oriskany 41.36045 -77.91030 309 1841
345000
PENN_TULLY_56 D Oriskany 41.91516 -77.16770 482 1315
278048
PENN_TULLY_59 D Oriskany 40.41272 -80.31738 320 1908 1925 264835
PENN_TULLY_68 D Oriskany 41.06012 -78.72298 456 2215 2222 248511
PENN_TULLY_69 D Oriskany 41.14331 -78.61464 502 2296
274763
PENN_TULLY_78 D Oriskany 40.20258 -79.40985 573 2258
302000
PENN_WEST_1101 E Oriskany 41.17930 -78.60232 495 2246
312000
PENN_WEST_1102 E Oriskany 41.07578 -78.71878 456 2215 2222 279000
PENN_WEST_1103 E Oriskany 41.16474 -78.61849 502 2295 2301 311000
PENN_WEST_1203 E Oriskany 42.07863 -80.08718 272 609
256000
Sample/API Number pH Li (mg/L) Na (mg/L) K (mg/L) Mg (mg/L) Ca (mg/L) Sr (mg/L) Ba (mg/L) Mn (mg/L) Fe (mg/L)
3407321971
3705120737 5.4
86544 3500 3280 33684
5625

88
Sample/API Number pH Li (mg/L) Na (mg/L) K (mg/L) Mg (mg/L) Ca (mg/L) Sr (mg/L) Ba (mg/L) Mn (mg/L) Fe (mg/L)
3711720158 3
112486
729 34085
1875
250
3711720159 4.2
31068 0 5224 63558
1025
4700500567
61720 4400 4350 22750
1300
4700700226
69620 2350 2300 19270
880
144
4700700447
4701502426 2
14223
5711 59259
0
2200
4702300005 4.7
30690 0 1166 6567
1125
4702300007 5.4
56822 1 1094 12613
2375
130
4702300008 5.6
7578 0 67 1532
80
70
4702300009 5.7
38969 1 1385 8328
462
130
4702300010 5.6
60261 1 1312 15215
2250
80
4702300011 6
27880 1 753 5846
0
200
4702300012 4
21868
608 18819
0
2500
4702300013 4.4
57097 3900 4009 9824
1375
4702300014 4.8
59219 1 972 18218
1800
40
4702300015 6.9
11144 0 85 1982
550
60
4702300017 6.3
48042
1434 11411
2750
100
4702300018 7.1
7018 1 292 1101
125
100
4702300019 4
58583.3 0 1215 12431
440
4702300020 6.3
51985 2 729 10811
875
160
4702300021 6.3
4258 1 49 701
83
25
4702300023 4.9
75916 1 1822 16040
3000
4702300030 6.3
23754 6000 656 3368
0
4702300032 6.2
2295
109 4070
0
4703100016
1390 65 35 265
4703500022
74332 3116 1976 22970
580
50
4703500024
74320 3750 2492 20359 1082 2170
12
4703500041
37200 1900 1350 10450
500
880
4703500053
69450 2900 3800 21900
2000
25
4703500077
71650 5100 2500 23500
1160
120
4703500094 6
99068
2673 27368
0
4703500103
70000 5300 3000 23100
1025
108
4703500104 6.8
29159
948 5213
0
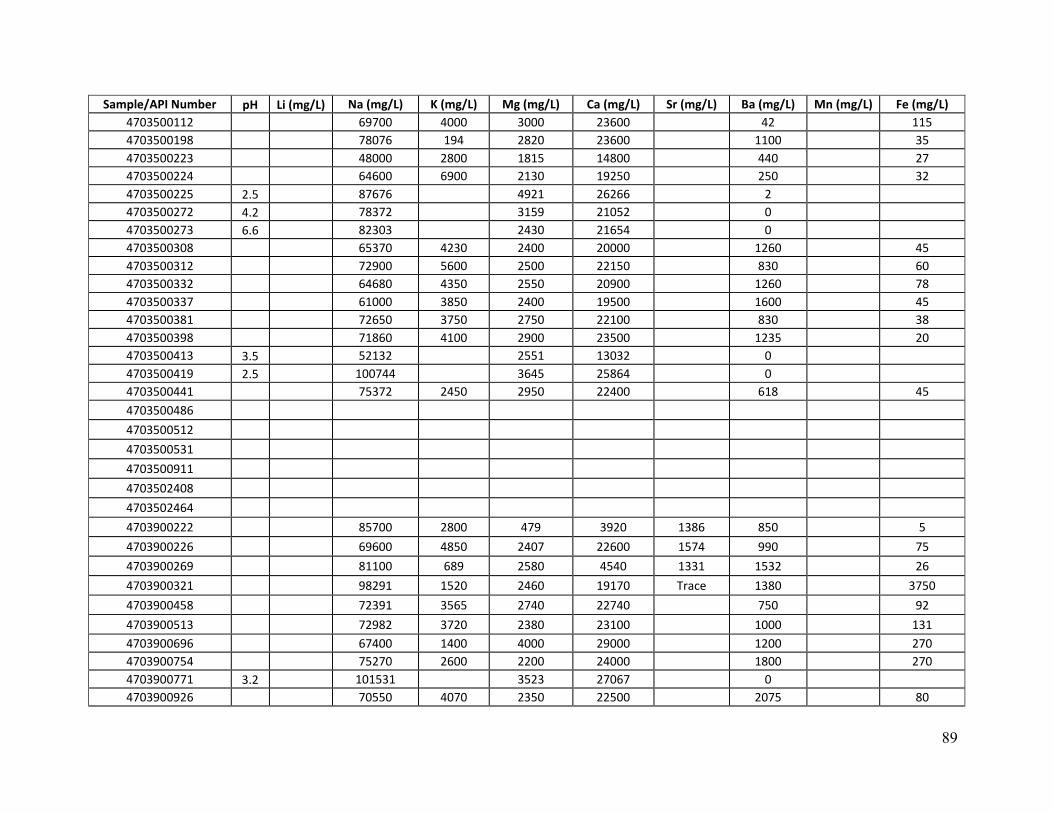
89
Sample/API Number pH Li (mg/L) Na (mg/L) K (mg/L) Mg (mg/L) Ca (mg/L) Sr (mg/L) Ba (mg/L) Mn (mg/L) Fe (mg/L)
4703500112
69700 4000 3000 23600
42
115
4703500198
78076 194 2820 23600
1100
35
4703500223
48000 2800 1815 14800
440
27
4703500224
64600 6900 2130 19250
250
32
4703500225 2.5
87676
4921 26266
2
4703500272 4.2
78372
3159 21052
0
4703500273 6.6
82303
2430 21654
0
4703500308
65370 4230 2400 20000
1260
45
4703500312
72900 5600 2500 22150
830
60
4703500332
64680 4350 2550 20900
1260
78
4703500337
61000 3850 2400 19500
1600
45
4703500381
72650 3750 2750 22100
830
38
4703500398
71860 4100 2900 23500
1235
20
4703500413 3.5
52132
2551 13032
0
4703500419 2.5
100744
3645 25864
0
4703500441
75372 2450 2950 22400
618
45
4703500486
4703500512
4703500531
4703500911
4703502408
4703502464
4703900222
85700 2800 479 3920 1386 850
5
4703900226
69600 4850 2407 22600 1574 990
75
4703900269
81100 689 2580 4540 1331 1532
26
4703900321
98291 1520 2460 19170 Trace 1380
3750
4703900458
72391 3565 2740 22740
750
92
4703900513
72982 3720 2380 23100
1000
131
4703900696
67400 1400 4000 29000
1200
270
4703900754
75270 2600 2200 24000
1800
270
4703900771 3.2
101531
3523 27067
0
4703900926
70550 4070 2350 22500
2075
80

90
Sample/API Number pH Li (mg/L) Na (mg/L) K (mg/L) Mg (mg/L) Ca (mg/L) Sr (mg/L) Ba (mg/L) Mn (mg/L) Fe (mg/L)
4703901352
4703901533
4703905269
4705300260 9.4
51428
4374 24825
4705500014
4705700022 5
53
10 16
3
15
4705900641 4.9
13901 0 790 3509
45
4706100337
52200 2700 1860 24100
4706100347
50000 2820 1880 23500
4706900038 9.4
51428
4374 24825
0
4707100010 5.4
51189 0 1312 15616
4750
850
4707100012 7.4
24598 1 267 4364
500
4707500011
3839
486 6006
110
4707500014
48387
9720 12412
4707500025
83943
2430 21622
0
4707500026
4707500033
4707500034
4386
2673 7608
0
4707700013
25167
243 8809
4
4707700021
40850
486 6006
0
4707700025
8100 246 283 2340
4707700058
78996
2430 17618
0
4707700090 4.4
101316
1556 20532
4707700141
3395
1701 5606
0
4707700143
97473
2430 20020
4707700155
65338
1118 10170
4707700156
108470
2430 20020
0
4707700158
40204
632 9209
0
4707700162
102000
2430 20020
0
4707700164
60320
1701 15215
0
4707700166 6.4
69218
1701 24424
3600
4707700186
50200 3470 2530 33000
4707700316 6.4
69218
1701 24424
3600

91
Sample/API Number pH Li (mg/L) Na (mg/L) K (mg/L) Mg (mg/L) Ca (mg/L) Sr (mg/L) Ba (mg/L) Mn (mg/L) Fe (mg/L)
4707900031
31655 700 1730 8600
1650
4707900204
68280 3400 3220 26140
1700
18
4708100289
4708300002
34000 4500 940 3200
167
6.7
4708300096
4708300097
26905
729 9209
610
4708300118
28803
4617 16416
0
4708300124
4708300126
48755
1701 19620
0
4708300612
62682
3159 19219
0
4708300904 6
43516
3499 24024
75
4708700239
62000
2550 17600
1000
4708700413
76330 4490 1372 24260
100
24.5
4708700429
73850 4550 3200 22500
2500
84
4708701200
4708900005
4709300002 4.2
66631 1 2065 18018
2250
4709702852 3
66053
2066 27227
1375
4709900393
35340 830 1975 8060
6.3
4710500068
68100 3400 4110 27200 889 1550
115
4710500091
80000
3200 2500
1280
4710500171
59450 4040 3770 29530
1000
4710500531 5.9
75727
4100 29160
4710700306
4710700336
4710700346
1562 31120
4
4710700351
ED-82-37 5.63 105 24400 978 797 8930 4400 1510 6.2 458
ED-82-38 6.14 277 61300 2580 1580 17600 8930 3890 5.6 240
ED-82-39 5.65 315 79900 3180 2050 23800 13100 4370 5.7 207
ED-82-40 5.53 315 83300 3890 2390 28400 12800 3680 5.8 225
Maryland_GARCO_G41 3
4980 74400
Maryland_WASCO_AC2 7
29 77
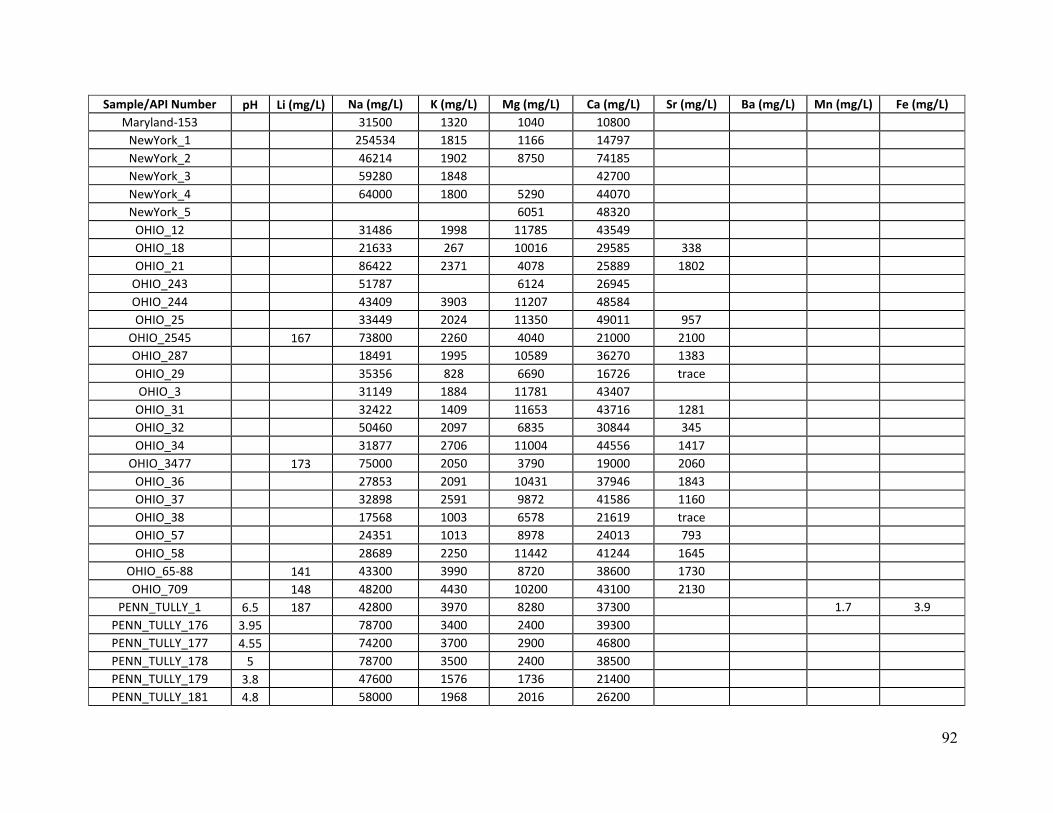
92
Sample/API Number pH Li (mg/L) Na (mg/L) K (mg/L) Mg (mg/L) Ca (mg/L) Sr (mg/L) Ba (mg/L) Mn (mg/L) Fe (mg/L)
Maryland-153
31500 1320 1040 10800
NewYork_1
254534 1815 1166 14797
NewYork_2
46214 1902 8750 74185
NewYork_3
59280 1848
42700
NewYork_4
64000 1800 5290 44070
NewYork_5
6051 48320
OHIO_12
31486 1998 11785 43549
OHIO_18
21633 267 10016 29585 338
OHIO_21
86422 2371 4078 25889 1802
OHIO_243
51787
6124 26945
OHIO_244
43409 3903 11207 48584
OHIO_25
33449 2024 11350 49011 957
OHIO_2545
167 73800 2260 4040 21000 2100
OHIO_287
18491 1995 10589 36270 1383
OHIO_29
35356 828 6690 16726 trace
OHIO_3
31149 1884 11781 43407
OHIO_31
32422 1409 11653 43716 1281
OHIO_32
50460 2097 6835 30844 345
OHIO_34
31877 2706 11004 44556 1417
OHIO_3477
173 75000 2050 3790 19000 2060
OHIO_36
27853 2091 10431 37946 1843
OHIO_37
32898 2591 9872 41586 1160
OHIO_38
17568 1003 6578 21619 trace
OHIO_57
24351 1013 8978 24013 793
OHIO_58
28689 2250 11442 41244 1645
OHIO_65-88
141 43300 3990 8720 38600 1730
OHIO_709
148 48200 4430 10200 43100 2130
PENN_TULLY_1 6.5 187 42800 3970 8280 37300
1.7 3.9
PENN_TULLY_176 3.95
78700 3400 2400 39300
PENN_TULLY_177 4.55
74200 3700 2900 46800
PENN_TULLY_178 5
78700 3500 2400 38500
PENN_TULLY_179 3.8
47600 1576 1736 21400
PENN_TULLY_181 4.8
58000 1968 2016 26200

93
Sample/API Number pH Li (mg/L) Na (mg/L) K (mg/L) Mg (mg/L) Ca (mg/L) Sr (mg/L) Ba (mg/L) Mn (mg/L) Fe (mg/L)
PENN_TULLY_183 2.8
54000 1920 520 38597
1830
PENN_TULLY_183a 4.5
70000 2360 2182 48031
2070
PENN_TULLY_185 4.85
73400 3440 3040 44000
PENN_TULLY_185a 4.9
76000 3440 3040 44400
PENN_TULLY_186 3.55
19000 2500 2500 36000
PENN_TULLY_187 3.15
65300 2900 2400 33400
PENN_TULLY_189 4.9
43600 1704 1856 24400
112
PENN_TULLY_190 5.8
55700 4900 3500 57400
PENN_TULLY_191 3.03
74200 3300 2800 42500
PENN_TULLY_192 2.9
55700 4900 3650 54100
PENN_TULLY_193 6.1
47600 584 1240 10319
1871
PENN_TULLY_193a 4.3
91000 1160 2267 18409
226
PENN_TULLY_194 4.2
71660 2320 1493 45169
820
PENN_TULLY_195 3.6
60000 1760 1252 36058
2838
PENN_TULLY_196 4.4
66000 2504 3360 38987
640
316
PENN_TULLY_197 4.1
85000 1600 1944 41438
389
PENN_TULLY_198 6.5
45600 576 1075 5920
921
PENN_TULLY_199 3.9
69600 2304 5019 4967
294
PENN_TULLY_200 5.8
104070 2072 1250 13413
379
PENN_TULLY_201 8.1
195 6 29
PENN_TULLY_203 3.7
93000 1040 971 11193
220
PENN_TULLY_204 3.5
74400 3344 3840 42000
16.5
PENN_TULLY_205 5.1
64000 2000 8000 36000
PENN_TULLY_209 5.15
34200 940 1020 12400
PENN_TULLY_210 3.1
92000 2560 2000 24400
PENN_TULLY_211 3.2
47400 1360 1296 13200
PENN_TULLY_212 2.4
94400 2440 1760 20000
PENN_TULLY_213 4.95
43000 1500 1600 19200
PENN_TULLY_214 4.2
66000 2400 1920 25000
PENN_TULLY_215 3.65
76000 2460 1760 26800
PENN_TULLY_216 3.55
57000 2040 1020 24600
PENN_TULLY_217 3.2
15520 34 1640 5880
PENN_TULLY_217a 3.9
34000 1160 1000 10408

94
Sample/API Number pH Li (mg/L) Na (mg/L) K (mg/L) Mg (mg/L) Ca (mg/L) Sr (mg/L) Ba (mg/L) Mn (mg/L) Fe (mg/L)
PENN_TULLY_220a 7.4
47400 176 60 598
PENN_TULLY_224 5.7
53400 4320 7006 55728
9
PENN_TULLY_225 3.4
73000 2160 2968 25108
2553
274
PENN_TULLY_227 4.4
81000 2960 2134 35438
196
PENN_TULLY_227a 3.7
82200 2960 2087 35096
196
PENN_TULLY_229 5.7
80000 3080 1672 34405
106
PENN_TULLY_3
47400 1276 5790 47300
65
PENN_TULLY_4
57967 3360 4966 49774
124
PENN_TULLY_45 3.03 219 66100 2190 2350 31600 304
0.72 286
PENN_TULLY_5
56176
7806 56004
144
PENN_TULLY_52
PENN_TULLY_56
47400 1276 5790 47200
71.2
PENN_TULLY_59
64550 5160 2480 25190 3550
160
PENN_TULLY_68 2.65
55000 2780 1250 34700
PENN_TULLY_69 3.2
56200 3260 3700 38400
PENN_TULLY_78
PENN_WEST_1101 2.35
57100 3260 3510 35900
PENN_WEST_1102 2.65
55000 2780 1250 34700
PENN_WEST_1103 3.2
56200 3260 3700 38400
PENN_WEST_1203 6.5 187 42800 3970 8280 37300
1.7 3.9
Sample/API Number HCO3 (mg/L) CO3(mg/L) SO4 (mg/L) F (mg/L) Cl (mg/L) Br (mg/L) I (mg/L) SiO2(mg/L)
3407321971 3705120737
0
209000 3711720158
325
236000
3711720159
0
176500 4700500567
151000
4700700226 105
117
151000 880 18 4700700447
4701502426
6
143750 4702300005
0
63000
4702300007
0
114500 4702300008
1
14650
4702300009
0
79200

95
Sample/API Number HCO3 (mg/L) CO3(mg/L) SO4 (mg/L) F (mg/L) Cl (mg/L) Br (mg/L) I (mg/L) SiO2(mg/L)
4702300010
0
125000 4702300011
0
55600
4702300012
1250
68000 4702300013
0
121500
4702300014
0
127500 4702300015
0
21250
4702300017
0
100000 4702300018
0
13700
4702300019
0
116250 4702300020
0
102000
4702300021
0
8000 4702300023
0
152500
4702300030
0
50000 4702300032
120
11000
4703100016
27900 4703500022
154
163500 580 16
4703500024 3
111
161300 2170 23 4703500041
110
85800 500 8
4703500053
79
159000 2000 0.8 4703500077 31
76
164000 1160 9
4703500094
18
209250 4703500103 90
86
162000 1025 4
4703500104
22
57000 4703500112 118
83
161600 42 18
4703500198 35
41
170000 1100 20 4703500223 15
69
107270 440 4
4703500224
52
146000 250 17 4703500225
18
196250
4703500272
34
167500 4703500273
60
172500
4703500308
65
146400 1260 23 4703500312 77
58
163500 830 20
4703500332
49
147500 1260 23

96
Sample/API Number HCO3 (mg/L) CO3(mg/L) SO4 (mg/L) F (mg/L) Cl (mg/L) Br (mg/L) I (mg/L) SiO2(mg/L)
4703500337
62
138300 1600 11 4703500381
89
162100 830 2
4703500398
60
164000 1235 8 4703500413
30
111000
4703500419
18
212000 4703500441 5
72
166400 618 11
4703500486 4703500512 4703500531 4703500911 4703502408 4703502464 4703900222 133
113
143600 850 3.4
4703900226 100
68
159900 990 Trace 4703900269 266
62
141400 1532 34
4703900321 120
46
144800 1380 14 4703900458
77
161900 750 25
4703900513
62
163300 1000 21 4703900696 80
75
150200 1200 Trace
4703900754 140
93
166700 1800 20 4703900771
12
215000
4703900926 140
45
158100 2075 13 4703901352
4703901533 4703905269 4705300260
220
136000 4705500014
4705700022
0
140 4705900641
0
30000
4706100337
0
199000 4706100347
0
193000
4706900038
220
136000 4707100010
0
113000

97
Sample/API Number HCO3 (mg/L) CO3(mg/L) SO4 (mg/L) F (mg/L) Cl (mg/L) Br (mg/L) I (mg/L) SiO2(mg/L)
4707100012
0
46750 4707500011
0
18000
4707500014
0
125000 4707500025
18
175000
4707500026 4707500033 4707500034
70
28000 4707700013
125
55000
4707700021
170
75000 4707700025
16600
4707700058
370
160000 4707700090 0
635
197915
4707700141
185
20000 4707700143
100
193000
4707700155
122000 4707700156
40
210000
4707700158
325
80000 4707700162
78
200000
4707700164
82
125000 4707700166
0
157000
4707700186
0
203000 4707700316
0
157000
4707900031
69700 4707900204 23
53
163200 1700 5
4708100289 4708300002 122
900
64000 167 5.7
4708300096 4708300097
0
60000 4708300118
40
87000
4708300124 4708300126
37
115000 4708300612
70
140000
4708300904
120000
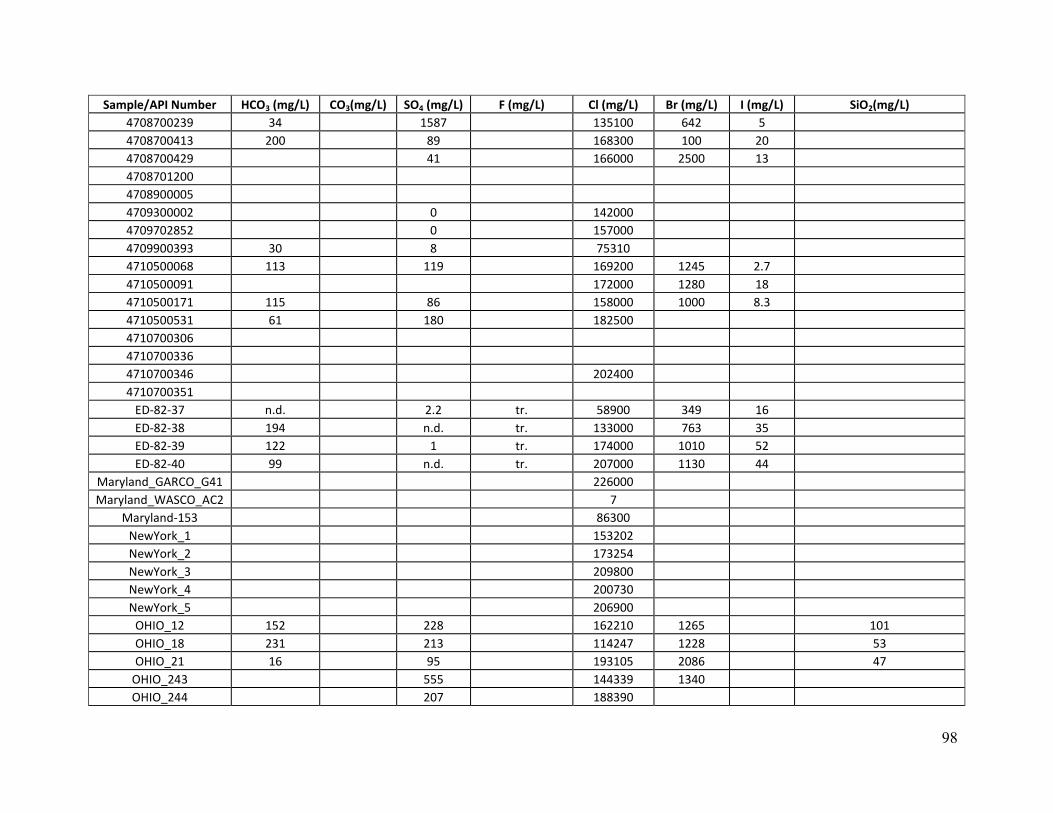
98
Sample/API Number HCO3 (mg/L) CO3(mg/L) SO4 (mg/L) F (mg/L) Cl (mg/L) Br (mg/L) I (mg/L) SiO2(mg/L)
4708700239 34
1587
135100 642 5 4708700413 200
89
168300 100 20
4708700429
41
166000 2500 13 4708701200
4708900005 4709300002
0
142000 4709702852
0
157000
4709900393 30
8
75310 4710500068 113
119
169200 1245 2.7
4710500091
172000 1280 18 4710500171 115
86
158000 1000 8.3
4710500531 61
180
182500 4710700306
4710700336 4710700346
202400 4710700351
ED-82-37 n.d.
2.2 tr. 58900 349 16 ED-82-38 194
n.d. tr. 133000 763 35
ED-82-39 122
1 tr. 174000 1010 52 ED-82-40 99
n.d. tr. 207000 1130 44
Maryland_GARCO_G41
226000 Maryland_WASCO_AC2
7
Maryland-153
86300 NewYork_1
153202
NewYork_2
173254 NewYork_3
209800
NewYork_4
200730 NewYork_5
206900
OHIO_12 152
228
162210 1265
101
OHIO_18 231
213
114247 1228
53
OHIO_21 16
95
193105 2086
47
OHIO_243
555
144339 1340 OHIO_244
207
188390
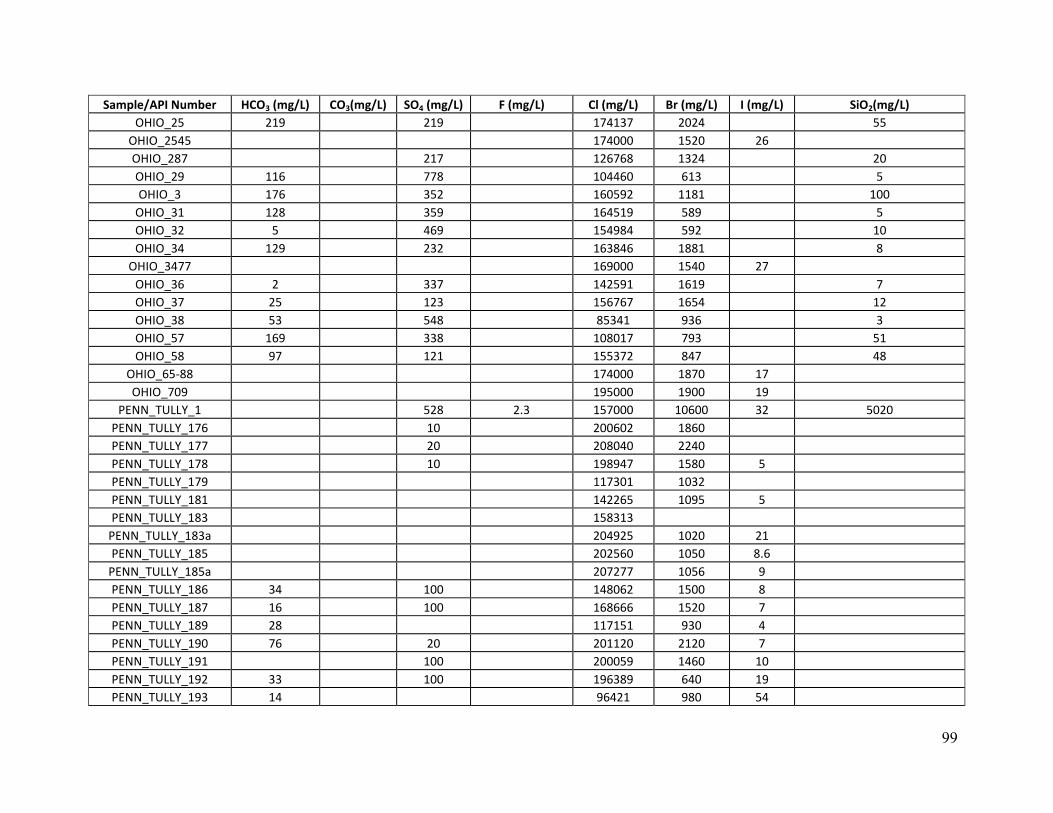
99
Sample/API Number HCO3 (mg/L) CO3(mg/L) SO4 (mg/L) F (mg/L) Cl (mg/L) Br (mg/L) I (mg/L) SiO2(mg/L)
OHIO_25 219
219
174137 2024
55
OHIO_2545
174000 1520 26 OHIO_287
217
126768 1324
20
OHIO_29 116
778
104460 613
5
OHIO_3 176
352
160592 1181
100
OHIO_31 128
359
164519 589
5
OHIO_32 5
469
154984 592
10
OHIO_34 129
232
163846 1881
8
OHIO_3477
169000 1540 27 OHIO_36 2
337
142591 1619
7
OHIO_37 25
123
156767 1654
12
OHIO_38 53
548
85341 936
3
OHIO_57 169
338
108017 793
51
OHIO_58 97
121
155372 847
48
OHIO_65-88
174000 1870 17 OHIO_709
195000 1900 19
PENN_TULLY_1
528 2.3 157000 10600 32 5020
PENN_TULLY_176
10
200602 1860 PENN_TULLY_177
20
208040 2240
PENN_TULLY_178
10
198947 1580 5 PENN_TULLY_179
117301 1032
PENN_TULLY_181
142265 1095 5 PENN_TULLY_183
158313
PENN_TULLY_183a
204925 1020 21 PENN_TULLY_185
202560 1050 8.6
PENN_TULLY_185a
207277 1056 9 PENN_TULLY_186 34
100
148062 1500 8
PENN_TULLY_187 16
100
168666 1520 7 PENN_TULLY_189 28
117151 930 4
PENN_TULLY_190 76
20
201120 2120 7 PENN_TULLY_191
100
200059 1460 10
PENN_TULLY_192 33
100
196389 640 19 PENN_TULLY_193 14
96421 980 54

100
Sample/API Number HCO3 (mg/L) CO3(mg/L) SO4 (mg/L) F (mg/L) Cl (mg/L) Br (mg/L) I (mg/L) SiO2(mg/L)
PENN_TULLY_193a
179028 4050 105 PENN_TULLY_194
197701 1440 10
PENN_TULLY_195
166674 690 PENN_TULLY_196
183185 850 12
PENN_TULLY_197
193986 780 PENN_TULLY_198
84476 960 45
PENN_TULLY_199
196249 1500 13 PENN_TULLY_200 19
160
190528 1260 18
PENN_TULLY_201 173
289 PENN_TULLY_203
166847 810
PENN_TULLY_204
202181 1740 11 PENN_TULLY_205 10
1
134000
PENN_TULLY_209
20
78479 32 PENN_TULLY_210
192880 672 36
PENN_TULLY_211
101226 525 PENN_TULLY_212
187479 1260 32
PENN_TULLY_213
106185 276 PENN_TULLY_214
153452 732 25
PENN_TULLY_215
172490 900 44 PENN_TULLY_216
136101 330 4
PENN_TULLY_217
391540 PENN_TULLY_217a
76636 384
PENN_TULLY_220a 329
231
74027 200 PENN_TULLY_224
205023 660 16
PENN_TULLY_225
168779 1100 22 PENN_TULLY_227
194171 1020 30
PENN_TULLY_227a
197627 780 40 PENN_TULLY_229
190808 2760 40
PENN_TULLY_3
2
172500 70 1 PENN_TULLY_4
194
198790
PENN_TULLY_45
21 166000 1060 13 23
PENN_TULLY_5
166
208078 PENN_TULLY_52
212700

101
Sample/API Number HCO3 (mg/L) CO3(mg/L) SO4 (mg/L) F (mg/L) Cl (mg/L) Br (mg/L) I (mg/L) SiO2(mg/L)
PENN_TULLY_56
2
172300 580 PENN_TULLY_59
50
161800 700
PENN_TULLY_68
154000 1260 56 PENN_TULLY_69
170000 1400 23
PENN_TULLY_78
185000 PENN_WEST_1101
169000 1440 8.6
PENN_WEST_1102
154000 1260 5.6 PENN_WEST_1103
170000 1400 23
PENN_WEST_1203 176
528 2.3 161000 1770 32 Source: A—Ohio Stat Division of Natural Resources website http://www.dnr.state.oh.us
B—West Virginia Geologic and Economic Survey website http://www.wvgs.wvnet.edu C—Chesapeake Energy D—Kelley, D.R., et al., 1973 E—Poth, C.W., 1962 F—Dresel, P.E., 1985 G—Stout, W., et al., 1932 H—Hoskins, H.A., 1947 I—Price, P.H., et al., 1937 J—Lloyd O.B. and Reid, M.S., 1990 K—NiSource Incorporated. L—NatCarb website http://www.natcarb.org M—Woll, R.S., 1978 *--New study data
All data used in this study are available on the West Virginia GIS Technical Center website http://wvgis.wvu.edu.

102
Appendix IV
Oriskany Sandstone Density Data.

103
Oriskany Sandstone density data.
Sample/API Number Horizon Latitude Longitude GL Elevation (m) Depth/Top (m) TDS Calculated (mg/L) Density (kg/m3)
3711720158 Oriskany 41.76024 -76.99193 522 2038 385500 1308.0
3711720159 Oriskany 41.45374 -76.59301 523 2039 277375 1207.5
4700700226 Oriskany 38.68439 -80.82756 352 1914 246819 1182.8
4700700447 Oriskany 38.79923 -80.55487 269 2101 80000 1045.6
4701502426 Oriskany 38.38474 -81.25295 436 1900 222949 1162.3
4702300005 Oriskany 39.04240 -79.28571 912 2525 102548 1058.5
4702300007 Oriskany 38.95471 -79.32992 825 2563 187404 1124.5
4702300008 Oriskany 39.12748 -79.24653 796 2448 23908 1000.7
4702300009 Oriskany 38.96604 -79.32082 834 2508 128344 1078.3
4702300010 Oriskany 38.14823 -79.23740 805 2504 204038 1138.7
4702300011 Oriskany 39.18613 -79.21765 879 2716 90079 1046.9
4702300012 Oriskany 39.08072 -79.26823 815 2524 110545 1064.6
4702300013 Oriskany 39.09597 -79.27809 904 2650 197705 1131.6
4702300014 Oriskany 39.11528 -79.25558 645 2319 207709 1144.3
4702300015 Oriskany 39.05692 -79.27511 765 2423 35011 1009.3
4702300017 Oriskany 39.02178 -79.29464 868 2582 163637 1105.4
4702300018 Oriskany 39.06824 -79.26191 698 2376 22236 1000.5
4702300019 Oriskany 39.26119 -79.18189 959 2973 188919.3 1121.0
4702300020 Oriskany 39.07332 -79.29409 1055 2830 166400 1104.7
4702300021 Oriskany 39.07782 -79.25428 611 2381 13091 993.8
4702300023 Oriskany 39.10715 -79.26953 829 2557 249278 1175.9
4702300030 Oriskany 39.28557 -79.15300 814 2833 83778 1041.2
4702300032 Oriskany 39.09612 -79.24944 596 2359 17594 998.5
4703500022 Oriskany 38.69528 -81.54256 296 1677 266694 1203.0
4703500024 Oriskany 38.65926 -81.54996 300 1659 266019 1203.1
4703500041 Oriskany 38.59932 -81.63977 200 1512 138199 1096.9
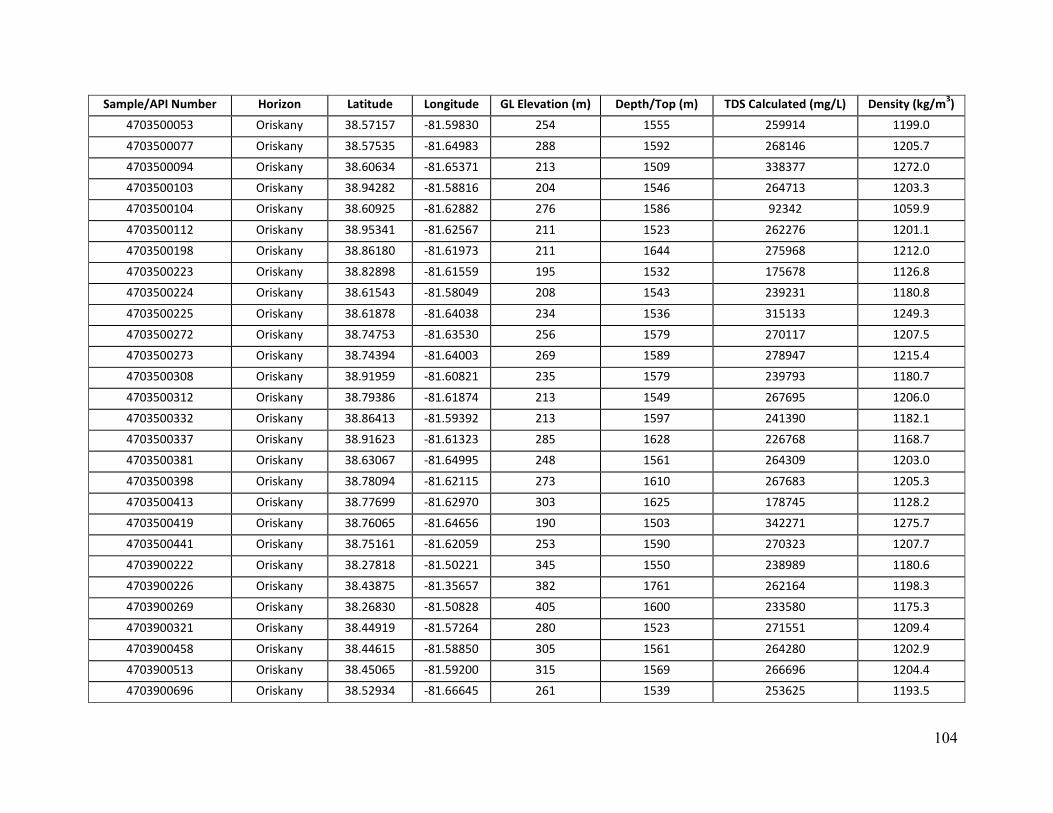
104
Sample/API Number Horizon Latitude Longitude GL Elevation (m) Depth/Top (m) TDS Calculated (mg/L) Density (kg/m3)
4703500053 Oriskany 38.57157 -81.59830 254 1555 259914 1199.0
4703500077 Oriskany 38.57535 -81.64983 288 1592 268146 1205.7
4703500094 Oriskany 38.60634 -81.65371 213 1509 338377 1272.0
4703500103 Oriskany 38.94282 -81.58816 204 1546 264713 1203.3
4703500104 Oriskany 38.60925 -81.62882 276 1586 92342 1059.9
4703500112 Oriskany 38.95341 -81.62567 211 1523 262276 1201.1
4703500198 Oriskany 38.86180 -81.61973 211 1644 275968 1212.0
4703500223 Oriskany 38.82898 -81.61559 195 1532 175678 1126.8
4703500224 Oriskany 38.61543 -81.58049 208 1543 239231 1180.8
4703500225 Oriskany 38.61878 -81.64038 234 1536 315133 1249.3
4703500272 Oriskany 38.74753 -81.63530 256 1579 270117 1207.5
4703500273 Oriskany 38.74394 -81.64003 269 1589 278947 1215.4
4703500308 Oriskany 38.91959 -81.60821 235 1579 239793 1180.7
4703500312 Oriskany 38.79386 -81.61874 213 1549 267695 1206.0
4703500332 Oriskany 38.86413 -81.59392 213 1597 241390 1182.1
4703500337 Oriskany 38.91623 -81.61323 285 1628 226768 1168.7
4703500381 Oriskany 38.63067 -81.64995 248 1561 264309 1203.0
4703500398 Oriskany 38.78094 -81.62115 273 1610 267683 1205.3
4703500413 Oriskany 38.77699 -81.62970 303 1625 178745 1128.2
4703500419 Oriskany 38.76065 -81.64656 190 1503 342271 1275.7
4703500441 Oriskany 38.75161 -81.62059 253 1590 270323 1207.7
4703900222 Oriskany 38.27818 -81.50221 345 1550 238989 1180.6
4703900226 Oriskany 38.43875 -81.35657 382 1761 262164 1198.3
4703900269 Oriskany 38.26830 -81.50828 405 1600 233580 1175.3
4703900321 Oriskany 38.44919 -81.57264 280 1523 271551 1209.4
4703900458 Oriskany 38.44615 -81.58850 305 1561 264280 1202.9
4703900513 Oriskany 38.45065 -81.59200 315 1569 266696 1204.4
4703900696 Oriskany 38.52934 -81.66645 261 1539 253625 1193.5

105
Sample/API Number Horizon Latitude Longitude GL Elevation (m) Depth/Top (m) TDS Calculated (mg/L) Density (kg/m3)
4703900754 Oriskany 38.47315 -81.44838 223 1589 273093 1210.1
4703900771 Oriskany 38.56897 -81.64680 232 1537 347133 1279.5
4703900926 Oriskany 38.45166 -81.65561 217 1478 259923 1199.7
4705700022 Oriskany 39.40201 -79.04544 585 2609 222 981.8
4705900641 Oriskany 37.63161 -81.87895 350 1657 48245 1026.1
4706100337 Oriskany 39.58848 -79.83815 608 2471 279860 1203.8
4706100347 Oriskany 39.56573 -79.88614 626 2446 271200 1196.2
4706900038 Oriskany 40.05866 -80.58205 396 2060 216847 1155.1
4707100010 Oriskany 38.91014 -79.34745 769 2594 185867 1122.6
4707100012 Oriskany 38.79632 -79.42260 824 2458 76479 1039.4
4707500011 Oriskany 38.67495 -79.75759 1052 1750 28441 1010.6
4707500014 Oriskany 38.63024 -79.78072 984 1815 195659 1140.5
4707500025 Oriskany 38.68381 -79.75481 1048 1771 282995 1216.2
4707500034 Oriskany 38.66769 -79.76184 1063 1806 56058 1030.6
4707700013 Oriskany 39.43387 -79.57246 656 1649 89348 1057.1
4707700021 Oriskany 39.41043 -79.57720 685 1630 122512 1082.9
4707700058 Oriskany 39.40331 -79.59137 536 1419 259414 1199.9
4707700090 Oriskany 39.35337 -79.60835 784 1835 321954 1242.7
4707700141 Oriskany 39.38034 -79.58653 610 1609 30887 1013.7
4707700143 Oriskany 39.36482 -79.60156 680 1651 313023 1245.9
4707700155 Oriskany 39.38197 -79.58294 610 1603 198626 1245.9
4707700156 Oriskany 39.37754 -79.59483 631 1568 340920 1272.8
4707700158 Oriskany 39.36237 -79.59397 775 1810 130370 1087.5
4707700162 Oriskany 39.35409 -79.62037 617 1611 324460 1257.3
4707700164 Oriskany 39.33534 -79.62316 794 1953 202318 1144.2
4707700166 Oriskany 39.42145 -79.54762 815 2010 255943 1189.4
4707700186 Oriskany 39.51110 -79.83121 540 2368 292200 1216.2
4707700316 Oriskany 39.53456 -79.85094 566 2358 255943 1184.4
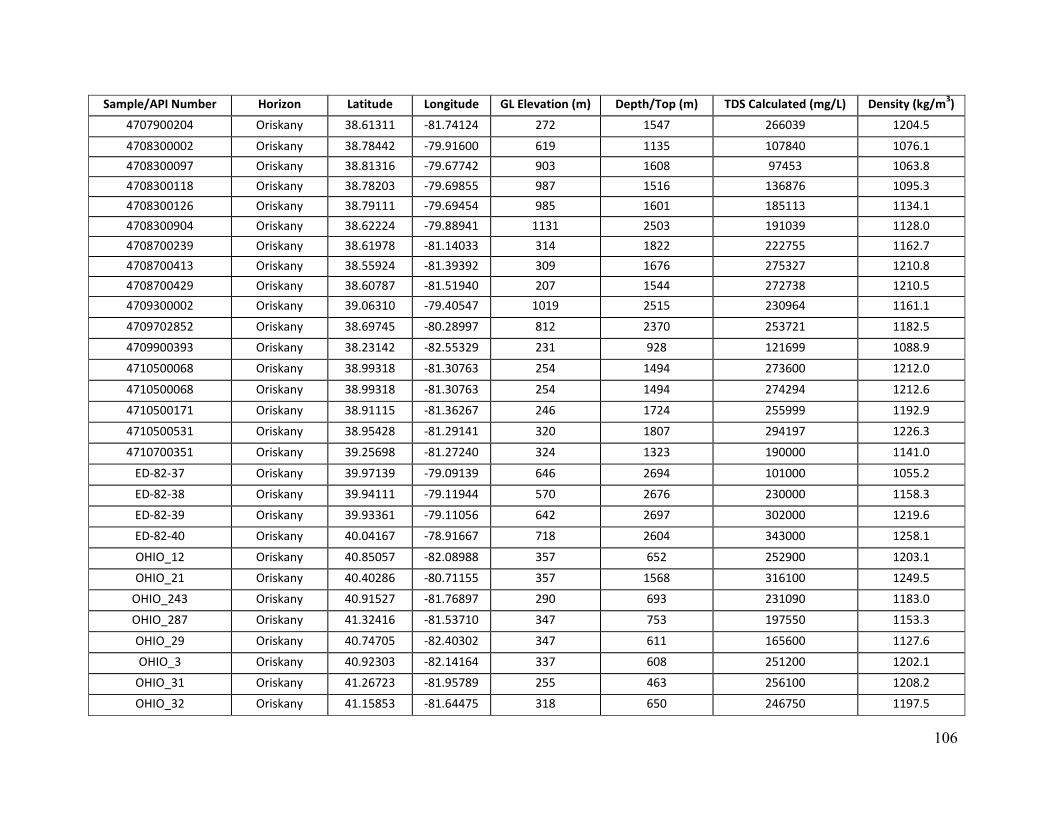
106
Sample/API Number Horizon Latitude Longitude GL Elevation (m) Depth/Top (m) TDS Calculated (mg/L) Density (kg/m3)
4707900204 Oriskany 38.61311 -81.74124 272 1547 266039 1204.5
4708300002 Oriskany 38.78442 -79.91600 619 1135 107840 1076.1
4708300097 Oriskany 38.81316 -79.67742 903 1608 97453 1063.8
4708300118 Oriskany 38.78203 -79.69855 987 1516 136876 1095.3
4708300126 Oriskany 38.79111 -79.69454 985 1601 185113 1134.1
4708300904 Oriskany 38.62224 -79.88941 1131 2503 191039 1128.0
4708700239 Oriskany 38.61978 -81.14033 314 1822 222755 1162.7
4708700413 Oriskany 38.55924 -81.39392 309 1676 275327 1210.8
4708700429 Oriskany 38.60787 -81.51940 207 1544 272738 1210.5
4709300002 Oriskany 39.06310 -79.40547 1019 2515 230964 1161.1
4709702852 Oriskany 38.69745 -80.28997 812 2370 253721 1182.5
4709900393 Oriskany 38.23142 -82.55329 231 928 121699 1088.9
4710500068 Oriskany 38.99318 -81.30763 254 1494 273600 1212.0
4710500068 Oriskany 38.99318 -81.30763 254 1494 274294 1212.6
4710500171 Oriskany 38.91115 -81.36267 246 1724 255999 1192.9
4710500531 Oriskany 38.95428 -81.29141 320 1807 294197 1226.3
4710700351 Oriskany 39.25698 -81.27240 324 1323 190000 1141.0
ED-82-37 Oriskany 39.97139 -79.09139 646 2694 101000 1055.2
ED-82-38 Oriskany 39.94111 -79.11944 570 2676 230000 1158.3
ED-82-39 Oriskany 39.93361 -79.11056 642 2697 302000 1219.6
ED-82-40 Oriskany 40.04167 -78.91667 718 2604 343000 1258.1
OHIO_12 Oriskany 40.85057 -82.08988 357 652 252900 1203.1
OHIO_21 Oriskany 40.40286 -80.71155 357 1568 316100 1249.5
OHIO_243 Oriskany 40.91527 -81.76897 290 693 231090 1183.0
OHIO_287 Oriskany 41.32416 -81.53710 347 753 197550 1153.3
OHIO_29 Oriskany 40.74705 -82.40302 347 611 165600 1127.6
OHIO_3 Oriskany 40.92303 -82.14164 337 608 251200 1202.1
OHIO_31 Oriskany 41.26723 -81.95789 255 463 256100 1208.2
OHIO_32 Oriskany 41.15853 -81.64475 318 650 246750 1197.5

107
Sample/API Number Horizon Latitude Longitude GL Elevation (m) Depth/Top (m) TDS Calculated (mg/L) Density (kg/m3)
OHIO_34 Oriskany 41.16371 -81.99154 270 530 257700 1209.1
OHIO_36 Oriskany 41.01102 -82.11317 332 555 224800 1179.0
OHIO_57 Oriskany 41.40439 -82.09609 191 337 168750 1132.4
OHIO_58 Oriskany 41.19994 -82.01069 282 475 241900 1195.3
OHIO_65-88 Oriskany 41.90777 -80.73238 190 494 284900 1234.1
OHIO_709 Oriskany 41.82107 -81.00393 205 497 319500 1266.8
PENN_TULLY_1 Oriskany 42.07306 -80.06202 272 609 272518 1221.5
PENN_TULLY_176 Oriskany 41.03091 -78.84634 450 2213 327262 1250.3
PENN_TULLY_177 Oriskany 41.05477 -78.75641 485 2213 338440 1260.6
PENN_TULLY_178 Oriskany 41.12063 -78.74281 460 2189 324112 1247.4
PENN_TULLY_179 Oriskany 41.23796 -78.62943 533 2241 191311 1131.4
PENN_TULLY_181 Oriskany 41.23262 -78.53979 478 2188 232255 1166.2
PENN_TULLY_183 Oriskany 40.84483 -78.44819 526 2440 253770 1181.2
PENN_TULLY_183a Oriskany 40.84483 -78.44819 526 2449 330389 1249.0
PENN_TULLY_185 Oriskany 41.06146 -78.81391 472 2270 328338 1250.5
PENN_TULLY_185a Oriskany 41.06146 -78.81391 472 2211 336042 1258.4
PENN_TULLY_186 Oriskany 41.21724 -78.53979 352 2089 240329 1174.5
PENN_TULLY_187 Oriskany 41.07349 -78.73435 512 2257 274977 1202.5
PENN_TULLY_189 Oriskany 41.07884 -78.72566 487 2207 190401 1131.2
PENN_TULLY_190 Oriskany 41.08218 -78.71630 471 2205 325408 1248.6
PENN_TULLY_191 Oriskany 41.04140 -78.77714 443 2198 325054 1248.3
PENN_TULLY_192 Oriskany 41.05343 -78.81325 450 2212 316299 1240.2
PENN_TULLY_193 Oriskany 39.82755 -78.35384 331 1402 159797 1115.4
PENN_TULLY_193a Oriskany 39.82755 -78.35384 331 1437 297592 1234.5
PENN_TULLY_194 Oriskany 40.79758 -78.99555 423 2199 319848 1243.5
PENN_TULLY_195 Oriskany 41.38039 -78.33475 516 2089 268721 1199.1
PENN_TULLY_196 Oriskany 40.85196 -79.01606 479 2323 297265 1221.5
PENN_TULLY_197 Oriskany 41.40103 -78.28866 423 2014 325009 1251.5

108
Sample/API Number Horizon Latitude Longitude GL Elevation (m) Depth/Top (m) TDS Calculated (mg/L) Density (kg/m3)
PENN_TULLY_198 Oriskany 39.76393 -78.38837 333 1515 139277 1097.2
PENN_TULLY_199 Oriskany 40.87603 -78.89214 612 2306 279698 1205.9
PENN_TULLY_200 Oriskany 40.62273 -79.41129 324 2349 303654 1226.4
PENN_TULLY_203 Oriskany 41.16105 -78.67281 501 2259 274542 1202.1
PENN_TULLY_204 Oriskany 41.06213 -78.73168 449 2187 330058 1252.9
PENN_TULLY_205 Oriskany 41.03781 -78.78422 429 2214 250203 1181.6
PENN_TULLY_209 Oriskany 40.10795 -79.06582 629 2566 127477 1077.0
PENN_TULLY_210 Oriskany 40.09538 -79.29357 666 2236 315328 1238.6
PENN_TULLY_211 Oriskany 40.09686 -79.07691 647 2594 154357 1097.5
PENN_TULLY_212 Oriskany 40.10647 -79.28839 747 2383 308131 1230.4
PENN_TULLY_213 Oriskany 40.11756 -79.05325 637 2341 172401 1114.7
PENN_TULLY_214 Oriskany 40.12865 -79.04215 621 2615 250199 1176.0
PENN_TULLY_215 Oriskany 40.06506 -79.09540 628 2579 281474 1203.7
PENN_TULLY_216 Oriskany 40.09168 -79.11018 621 2601 220885 1151.4
PENN_TULLY_217 Oriskany 40.16341 -79.14050 753 2477 414614 1328.6
PENN_TULLY_217a Oriskany 40.16341 -79.14050 753 2455 124060 1075.5
PENN_TULLY_220a Oriskany 40.00221 -79.33054 843 2470 122695 1074.4
PENN_TULLY_224 Oriskany 41.35134 -80.19413 404 1219 330382 1268.1
PENN_TULLY_225 Oriskany 40.32857 -79.26270 824 2298 277677 1204.1
PENN_TULLY_227 Oriskany 40.22254 -79.38544 640 2539 317284 1235.5
PENN_TULLY_227a Oriskany 40.22254 -79.38544 640 2539 321308 1239.1
PENN_TULLY_229 Oriskany 40.38876 -78.82247 650 2697 312823 1229.2
PENN_TULLY_3 Oriskany 41.91240 -77.17413 482 1315 276234 1216.4
PENN_TULLY_4 Oriskany 41.67769 -79.39847 500 1321 309560 1247.0
PENN_TULLY_45 Oriskany 40.17965 -79.43499 540 2236 272298 1200.1
PENN_TULLY_5 Oriskany 41.45388 -80.36174 302 977 332297 1273.4
PENN_TULLY_52 Oriskany 41.36045 -77.91030 309 1841 345000 1272.7
PENN_TULLY_56 Oriskany 41.91516 -77.16770 482 1315 278048 1218.0

109
Sample/API Number Horizon Latitude Longitude GL Elevation (m) Depth/Top (m) TDS Calculated (mg/L) Density (kg/m3)
PENN_TULLY_59 Oriskany 40.41272 -80.31738 320 1908 264835 1198.6
PENN_TULLY_68 Oriskany 41.06012 -78.72298 456 2215 248511 1180.1
PENN_TULLY_69 Oriskany 41.14331 -78.61464 502 2296 274763 1201.5
PENN_TULLY_78 Oriskany 40.20258 -79.40985 573 2258 302000 1226.5
PENN_WEST_1101 Oriskany 41.17930 -78.60232 495 2246 312000 1235.5
PENN_WEST_1102 Oriskany 41.07578 -78.71878 456 2215 279000 1206.7
PENN_WEST_1103 Oriskany 41.16474 -78.61849 502 2295 311000 1233.8
PENN_WEST_1203 Oriskany 42.07863 -80.08718 272 609 256000 1206.4
4703905269 Oriskany 38.44251 -81.40303 368 1706 129349 1087.7
4703901533 Oriskany 38.44865 -81.43750 307 1654 92283 1059.4
4707500026 Oriskany 38.66391 -79.76351 1072 1794 21691 1005.2
4707500033 Oriskany 38.65999 -79.76554 1014 1740 37090 1017.0
4708300124 Oriskany 38.74918 -79.72155 1061 1624 1836 992.0
4708300096 Oriskany 38.75422 -79.72298 990 1572 3622 993.7
4703901352 Oriskany 38.52411 -81.48586 260 1581 51230 1028.8
4703500486 Oriskany 38.88430 -81.68152 201 1481 55722 1033.0
4703500911 Oriskany 38.88024 -81.69545 223 1498 99380 1066.3
4703500531 Oriskany 38.85337 -81.69466 225 1504 148323 1105.0
4703500512 Oriskany 38.83755 -81.67890 208 1502 217147 1162.2
4703502408 Oriskany 38.82390 -81.68112 225 1512 202822 1150.1
4703502464 Oriskany 38.84409 -81.69855 184 1462 82199 1053.0
4710700336 Oriskany 39.07782 -81.53571 300 1598 226438 1169.1
4710700306 Oriskany 39.05808 -81.55022 329 1640 222516 1165.1
3407321971 Oriskany 39.51075 -82.55570 340 665 194292 1151.4