aluminum speciation in aqueous fluids at deep crustal ...manning/pdfs/mkm14.pdf · aluminum...
TRANSCRIPT

Available online at www.sciencedirect.com
www.elsevier.com/locate/gca
ScienceDirect
Geochimica et Cosmochimica Acta 133 (2014) 128–141
Aluminum speciation in aqueous fluids at deep crustalpressure and temperature
Mainak Mookherjee a,⇑, Hans Keppler b, Craig E. Manning c
a Department of Earth and Atmospheric Sciences, Cornell University, Ithaca, NY 14853, USAb Bayerisches Geoinstitut, Universitat Bayreuth, 95440 Bayreuth, Germany
c Department of Earth and Space Sciences, University of California Los Angeles, Los Angeles, CA 90095-1567, USA
Received 10 September 2013; accepted in revised form 6 February 2014; Available online 1 March 2014
Abstract
We investigated aluminum speciation in aqueous fluids in equilibrium with corundum using in situ Raman spectroscopy inhydrothermal diamond anvil cells to 20 kbar and 1000 �C. We have studied aluminum species in (a) pure H2O, (b) 5.3 m KOHsolution, and (c) 1 m KOH solution. In order to better understand the spectral features of the aqueous fluids, we used ab initio
simulations based on density functional theory to calculate and predict the energetics and vibrational spectra for variousaluminum species that are likely to be present in aqueous solutions. The Raman spectra of pure water in equilibrium withAl2O3 are devoid of any characteristic spectral features. In contrast, aqueous fluids with 5.3 m and 1 m KOH solution in equi-librium with Al2O3 show a sharp band at �620 cm�1 which could be attributed to the ½AlðOHÞ4�
1� species. The band grows inintensity with temperature along an isochore. A shoulder on the high-frequency side of this band may be due to a hydrated,charge neutral Al(OH)3�H2O species. In the limited pressure, temperature and density explored in the present study, we do notfind any evidence for the polymerization of the ½AlðOHÞ4�
1� species to dimers [(OH)2-Al-(OH)2-Al(OH)2] or [(OH)3-Al-O-Al(OH)3]2�. This is likely due to the relatively low concentration of Al in the solutions and does not rule out significant poly-merization at higher pressures and temperatures. Upon cooling of Al-bearing solutions to room temperatures, Raman bandsindicating the precipitation of diaspore (AlOOH) were observed in some experiments. The Raman spectra of the KOH solu-tions (with or without dissolved alumina) showed a sharp OH stretching band at �3614 cm�1 and an in-plane OH bendingvibration at �1068 cm�1, likely related to an OH� ion with the oxygen atom attached to a water molecule by hydrogen bond-ing. A weak feature at �935 cm�1 may be related to the out-of-plane bending vibration of the same species or to an OHspecies with a different environment.� 2014 Elsevier Ltd. All rights reserved.
1. INTRODUCTION
Alumina is the second most abundant oxide in mostcrustal rocks, but its behavior in crustal metamorphic fluidshas long been uncertain. While SiO2 is quite soluble in H2Oat metamorphic conditions (e.g., Wasserburg, 1958; Ander-son and Burnham, 1967; Manning, 1994; Zotov and
http://dx.doi.org/10.1016/j.gca.2014.02.016
0016-7037/� 2014 Elsevier Ltd. All rights reserved.
⇑ Corresponding author. Tel.: +1 617 417 8755.E-mail address: [email protected] (M. Mookherjee).
Keppler, 2002; Newton and Manning, 2002, 2003), Al2O3
is dramatically less so (Ragnarsdottir and Walther, 1985;Walther, 1997; Tropper and Manning, 2007). This makesit difficult to explain the common occurrence of quartz withaluminous minerals such as Al2SiO5 polymorphs in meta-morphic veins (e.g., Kerrick, 1990). One possible explana-tion is the amphoteric nature of alumina, which leads toenhanced Al solubility in acidic and alkaline solutions(Barns et al., 1963; Azaroual et al., 1996; Wohlers andManning, 2009). Another possible explanation is Alcomplexing with other components of the fluid such as salts

M. Mookherjee et al. / Geochimica et Cosmochimica Acta 133 (2014) 128–141 129
(Anderson and Burnham, 1967, 1983; Korzhinskiy, 1987;Sanjuan and Michard, 1987; Pascal and Anderson, 1989;Pokrovskii and Helgeson, 1995, 1997; Azaroual et al.,1996; Diakonov et al., 1996; Tagirov and Schott, 2001;Walther, 2001; Newton and Manning, 2006) or silica (Pok-rovskii et al., 1996; Salvi et al., 1998; Manning, 2007).
One limitation preventing better understanding of theaqueous geochemistry of aluminum at high pressures andtemperatures is fundamental uncertainty about the stabili-ties of various possible species. For example, it is debatedwhether the dominant aluminate species in alkaline solu-tions is ½AlðOHÞ4�
1�, NaAl(OH)4, or KAl(OH)4 (e.g.,Anderson, 1995; Azaroual et al., 1996; Tagirov and Schott,2001). In addition, it is unknown whether dissolved alu-mina can exist at metamorphic conditions as polymeric spe-cies. While the polymerization of silica observed at lowpressure and temperature (e.g., Iler, 1979) has now been in-ferred to occur in metamorphic conditions as well (Zotovand Keppler, 2000, 2002; Newton and Manning, 2002),the analogous search for the large, polymerized aqueousaluminum hydroxide clusters common at surficial condi-tions (e.g., Casey, 2005; Casey and Rustad, 2007) has notbeen conducted.
To gain insight into aluminum species identities andpossible polymerization at high pressure and temperatureconditions, we conducted in situ Raman spectroscopy onaluminum-bearing solutions in hydrothermal diamond an-vil cells. We carried out distinct sets of experiments by vary-ing the chemistry and density of the aqueous fluids. Theresults provide new constraints on the stabilities of alumi-nate species at high temperature and pressure.
2. METHODS
2.1. Hydrothermal diamond anvil cell
Experiments were carried out with an externally heatedBassett-type diamond anvil cell (Bassett et al., 1993a,b;
Table 1Experimental conditions, chemical composition of fluids in equilibrium wand cooling, and maximum temperature explored in each experiments.
Exp name # Chemical System Cell used Heating
TH (�C)
H Pure H2O HDAC-2 45.0KH5 5.3 m KOH HDAC-2 40.0ALH-I Al2O3 + pure H2O HDAC-3 –ALH-II Al2O3 + pure H2O HDAC-3 –ALKH5-I* Al2O3 + 5.3 m KOH HDAC-3 237.0ALKH5-II Al2O3 + 5.3 m KOH HDAC-3 166.5ALKH5-III* Al2O3 + 5.3 m KOH HDAC-3 –ALKH5-IV* Al2O3 + 5.3 m KOH HDAC-3 –ALKH1-I* Al2O3 + 1 m KOH HDAC-2 –ALKH1-II* Al2O3 + 1 m KOH HDAC-2 –ALKH1-III* Al2O3 + 1 m KOH HDAC-2 –ALKH1-IV Al2O3 + 1 m KOH HDAC-3 25.0
q are equivalent densities for pure water as determined from the observsolutions are higher.* Data were not collected during cooling path, either due to leak, gaske§ Initial density is based on ruby fluorescence at ambient condition.1 Trouble with heater and thermocouple wires.
Bassett, 2003). The cell consisted of two low-fluorescencetype I diamonds of 0.21 carat with 1 mm culet faces cut par-allel to (100). Corrosion resistant iridium gaskets (Zotov andKeppler, 2000, 2002) with 250 lm initial thickness and400 lm hole were used to contain the sample. Rhenium gas-kets were avoided, since at high pressures and temperaturestraces of rhenium dissolve into the fluid causing strong fluo-rescence (Zotov and Keppler, 2002). The cell was heated bycoils of molybdenum wire around the tungsten carbide seatssupporting the diamonds. Temperature was measured withtwo K-type thermocouples attached to the diamonds. Thepower of the upper and the lower heaters were controlledseparately. This allowed the temperature of each diamondto be kept constant to ±5 �C during the heating and coolingcycles. A temperature calibration was carried out by visualobservation of the melting point of NaCl inside the diamondcell. During operation, the cell was flushed with an argon(98%)–hydrogen (2%) mixture to prevent the oxidation ofthe diamonds and the molybdenum heaters. The maximumtemperatures in the present set of experiments were limitedto 1000 �C (Table 1).
The sample chamber was loaded with 1–2 pieces of syn-thetic corundum of high purity. The pressure was deter-mined from the observed homogenization temperature(TH) of the vapour bubble together with the equation ofstate of water (Saul and Wagner, 1989). The pressure deter-mination is based on the assumption that the sample cham-ber behaves as an isochoric system and that the equation ofstate of the fluid is similar to that of pure water (Bassettet al., 1993b). While the latter assumption is certainly validfor the Al2O3–H2O system, systematic deviations from theequation of state are possible for the KOH solutions anduncertainties in estimated pressures may reach 10–20%.Moreover, in the KOH-bearing systems, alumina solubilityat high temperature is so large that precipitation of AlOOHmay occur upon cooling (see below). This precluded re-peated pressure–temperature cycling of the cell before theRaman measurement, so that significant deformation of
ith corundum crystal, homogenization temperatures upon heating
Cooling Tmax (�C)
q (g/cm3) TH (�C) q (g/cm3)
0.99 177.0 0.89 809.00.99 370.0 0.45 812.71.09§ – 1.09§ 718.41.08§ 300.0 0.71 1000.00.79 – – 801.50.90 230.0 0.83 811.91.01 – – 800.31.00§ – – 614.8�1 – – –1.24§ – 1.24§ 200.01.24§ – – 772.11.00 250.0 0.79 714.4
ed homogenization temperatures; the actual densities of the KOH
t collapse, or dissolution of crystal.

130 M. Mookherjee et al. / Geochimica et Cosmochimica Acta 133 (2014) 128–141
the cell may have occurred during heating, as indicated bymajor changes in homogenization temperature after theexperiment. In such cases, measurements were carried outduring the cooling path and it was assumed that the cellhad remained isochoric during cooling (i.e., all deformationhad happened during heating). For the experiments withinitial fluid density >1 g/cm3, i.e., without a vapor bubbleat room temperature conditions, the initial density is deter-mined by comparing the shifts in the fluorescence spectra ofa ruby chip at ambient condition and the piece of corun-dum within the HDAC. The initial density is calculatedby converting the Dm to pressure based on existing calibra-tion on variation of ruby fluorescence under compression(Mao et al., 1986). The estimated error in the determinationof the pressure is of the order of ±1.0 kbar (Wei et al., 2011)
Table 2Energetics and main vibrational modes for aluminum species in aqueoubasis set. All the calculations were done in the gas phase.
Species Energy (a.u.) Frequency (activity) [cm�1 (
0–399 400–499 5
(OH)1� �75.80H2O �76.43H2O-OH1� �152.29 197.1 (1.3)
286.8 (8.3)55
Al-monomers
Al3+-6H2O �700.82 347.8 (0.6) 446.2 (4.9) 555
Al(OH)3 �470.10 215.9 (1.1)217.6 (1.1)
Al(OH)3�H2O �546.57 209.1 (1.3) 428.1 (0.8)
[Al(OH)4]1� �546.05 355.3 (1.0) 5
K[Al(OH)4] �1145.96 244.7 (1.1) 5
Al-dimers
[(OH)3-Al-O-Al(OH)3]2� �1015.55 232.7 (1.2) 5237.0 (1.1) 5368.9 (2.6)
[(OH)2-Al-(OH)2-Al(OH)2] �940.29 88.94 (1.5) 411.5 (2.8)185.2 (1.1)348.9 (1.4)
Al-trimer
[{-(OH)2-Al-O-}3] �1408.49 114.5 (1.2) 5223.1 (1.6) 5244.4(3.7) 5291.4 (1.6) 5308.3 (2.0) 5352.0 (1.8)373.6 (9.5)382.2 (3.6)389.9 (10.4)
and the resulting error in the estimation of the fluid densityis of the order of ±0.3 g/cm3.
2.2. In-situ Raman spectroscopy
Raman spectra were collected with a Horiba Jobin-Yvon Labram HR 800 UV spectrometer using the 514 nmline of an argon laser at 2 Watt output power for excitation.The spectrometer was equipped with a 1800 gr/mm gratingand a Peltier-cooled CCD detector. Measurements weremade in backscattering geometry with an Olympus micro-scope using an objective SLMP LAN N 50 � (numericalaperture = 0.35) in conjunction with confocal optics. In or-der to obtain a reasonable signal to noise ratio, the measur-ing times were relatively long (2 accumulations of 60 s per
s solutions calculated using density functional theory with B3YLP
A4/AMU)]
00–599 600–699 700–799 800–899 900–1099
05.5 (4.6)90.1 (4.3)
1028.1 (28.1)
38.9 (2.5)43.3 (2.5)43.7 (2.5)
621.6 (5.6) 923.5 (1.7)690.4 (12.0) 923.7 (1.6)604.4 (5.8) 710.6 (2.7) 861.6 (0.9)635.8 (1.2) 867.6 (1.2)658.2 (5.5)687.6 (2.2)
86.1 (11.8) 684.9 (2.3)690.6 (1.1)690.7 (1.1)
91.0 (10.3) 757.1 (1.4)770.3 (1.2)
00.7 (15.6) 626.1 (1.7) 932.2 (2.1)72.8 (2.9) 640.1 (1.9) 953.4 (1.2)
660.0 (1.0)671.6 (1.8)679.4 (2.1)601.3 (1.4) 821.3 (8.7)633.4 (9.2) 871.7 (3.4)649.6 (2.7)
04.2 (5.1) 612.8 (1.6) 814.1 (6.0)35.4 (1.7) 628.9 (1.9) 830.5 (8.4)43.8 (1.3) 647.2 (4.0) 833.8 (3.9)66.5 (3.3) 651.3 (3.6) 839.6 (4.1)77.7 (2.4) 844.3 (10.6)
882.6 (3.1)888.1 (2.5)

M. Mookherjee et al. / Geochimica et Cosmochimica Acta 133 (2014) 128–141 131
spectral window). A confocal aperture of 300 lm was usedto limit the sampling volume; spectral resolution was2.5 cm�1.
The blackbody contribution measured at high tempera-tures of 800 �C is only few percent of the Raman signalfrom the solution and is nearly independent of frequencyover the spectral window of the present study. Hence, nocorrection for the black body radiation was made.
The Horiba Jobin-Yvon Labram HR Raman spectrom-eter has confocal microscopy capabilities; however, thespectra collected often contained minor contributions fromdiamond fluorescence. This is because the signal collectedfrom the volume of aqueous fluid travels through the upperdiamond. We selected diamonds with minimum fluores-cence. In order to remove minor features related to dia-mond fluorescence, we corrected the spectra of thesolution by subtracting the spectrum of the upper diamondmeasured at the same temperature.
2.3. Ab initio simulations
In order to gain insights into the various aluminate spe-cies, the geometry optimizations of the species were per-formed with the Becke’s three-parameter combination ofHartee-Fock and gradient-corrected density functional ex-change combined with the non local correlational func-tional of Lee-Yang-Parr (B3LYP) (Lee et al., 1988;Becke, 1993). The B3LYP hybrid functional has been quitereliable in optimizing the geometry and prediction of vibra-tional spectrum of the alumino-silicate species (Gale et al.,1998; Tossell, 1999; Mibe et al., 2008). All the calculationswere performed using the 6-31G**(d, p), a triple split va-lence basis sets with polarized p and d orbitals and diffusefunctions (**) (Hehre et al., 1986) as implemented in
Fig. 1. Raman spectra for aluminum species in aqueous fluids calculattrimers, and H2O–OH1� interactions. Also shown are the optimized geoAl(OH)3�H2O, (iv) ½AlðOHÞ4�
1�, (v) K[Al(OH)4], (vi) [(OH)3-Al-O-Al-(Oand (ix) H2O–OH1�.
Gaussian 09 (Frisch et al., 2009). We considered severalspecies including
(a) Monomers – (i) AlðH2OÞ3þ6 , where Al3+ is surroundedby six water molecule in octahedral configuration, (ii)Al(OH)3 with a planar trigonal configuration; (iii)Al(OH)3�H2O with a distorted tetrahedral arrange-ment and overall neutral charge, (iv) ½AlðOHÞ4�
1�
with the Al3+ ion in the center of a tetrahedronformed by OH� ions, and (v) K[Al(OH)4], where apotassium ion is attached to the tetrahedral½AlðOHÞ4�
1� unit, thus rendering it charge neutral.(b) Dimers and trimers – (vi) [(OH)3-Al-O-Al(OH)3]2�
with alumina tetrahedral units sharing a bridgingoxygen atom and (vii) [(OH)2-Al-(OH)2-Al-(OH)2]with edge-sharing alumina tetrahedral units withtwo fully protonated bridging oxygen atoms; (viii)alumina tetrahedral units forming a cyclic trimer[{-Al(OH)2-O-}3], (ix) interaction between H2Omolecules and excess OH1� arising due to additionof KOH into the aqueous solution (Table 2, Fig. 1).
All calculations for energetics and vibrational frequencywere done in the gas-phase and as a result, the theoreticallypredicted vibrational frequencies for the gas-phase mole-cule are often lower than the experimentally observed fre-quencies (Pople et al., 1993). Hence, for the individualaluminate species, the theoretically predicted vibrationalfrequencies need to be multiplied with a scaling factor of1.04 as noted in previous studies on alumino-silicate clus-ters (Mibe et al., 2008). Hence for instance, our predictedvibrational frequency for K[Al(OH)4] will be 615 cm�1,i.e., 1.04 � 591 cm�1 (Table 2).
ed using density functional theory, (a) monomers and (b) dimers,metries of the aluminum species (i) Al3+–6H2O, (ii) Al(OH)3, (iii)H)3]2�, (vii) [(OH)2-Al-(OH)2-Al-(OH)2], (viii) [{-(OH)2-Al-O-}3],

Fig. 2. Raman spectra of pure H2O and 5.3 m KOH aqueous solution as measured along an isochore: (a) The 100–1200 cm�1 region for thepure water is devoid of any vibrational features, (b) the 2800–4000 cm�1 region for the pure water is characterized by three distinct bands at3256 cm�1, 3452 cm�1, and 3606 cm�1. In addition, there are features at � 2913 cm�1 due to methane produced by interaction of the diamondand water at high temperatures, (c) the 100–1200 cm�1 region for the 5.3 m KOH solution contains a feature at �1068 cm�1 due to the d(OH)mode, and (d) the 2800–4000 cm�1 region for the 5.3 m KOH solution contains intramolecular water bands at 3348, 3542, and 3564 cm�1 anda sharp feature at 3614 cm�1 probably related to the stretching vibration of the dissolved OH1� ion.
132 M. Mookherjee et al. / Geochimica et Cosmochimica Acta 133 (2014) 128–141

Fig. 3. Deconvolution of the 2700 to 4000 cm�1 region of the Raman spectrum of pure H2O (a, b) and of 5.3 m KOH solution (c, d). Thereare three panels, top indicates the residual (pink dots), the middle panel indicates the data (pink crosses), the fit (black line), and the baseline(dashed line) and the lower panel shows the deconvoluted peaks. The bands for pure water occur at (a) 3255 cm�1, 3452 cm�1, and 3606 cm�1
at 42 �C, 0 kbar, and the bands shift to (b) 3266 cm�1, 3517 cm�1, and 3545 cm�1 at 696 �C, 8.6 kbar. We also observe the band at 2914 cm�1
due to methane produced by the interaction of diamond and pure water upon heating. The band may persist even when the hydrothermaldiamond anvil cell is cooled. The spectral region of 2800–4000 cm�1 for the 5.3 m KOH aqueous solution, consists of distinct bands at (c)3023 cm�1, 3304 cm�1, 3497 cm�1, and 3613 cm�1 at 34.5 �C, 0 kbar; upon heating along an isochore (d), the bands shift to 3348 cm�1,3542 cm�1, 3564 cm�1, and 3625 cm�1 at 812.7 �C, 2.2 kbar system. (For interpretation of the references to color in this figure legend, thereader is referred to the web version of this article.)
M. Mookherjee et al. / Geochimica et Cosmochimica Acta 133 (2014) 128–141 133
3. RESULTS
3.1. Blank experiments
Reference Raman spectra of Al-free systems were col-lected for (i) pure water and (ii) 5.3 m KOH solution. Ithas been noted that the rhenium gaskets used for hydro-
thermal diamond anvil cell experiment often reacts withthe aqueous fluids (Chellappa et al., 2009). However, wehave used iridium gaskets to avoid strong fluorescence(Zotov and Keppler, 2002) and we do not observe featuresin the Raman spectra that could be attributed to the forma-tion of iridium oxides. Hence, there is no evidence ofreaction of the iridium gasket with the aqueous fluid

(b)(a)
20 μm
ρExp name: ALH-I
Inte
nsity
[a.u
.]
ρExp name: ALH-I
Inte
nsity
[a.u
.]
Fig. 4. Raman spectra of pure H2O in equilibrium with solid corundum as a function of temperature along an isochore with a density of1.09 g/cm3. (a) shows the spectral region between 100 and 1200 cm�1 and (b) shows the spectral region between 2800 and 4000 cm�1. The insetshows the gasket and the sample chamber. Within the sample chamber, there is a piece of corundum and vapor bubble is absent. The pressureand the density of the isochore was determined using the shift between the ruby fluorescence at ambient condition and the fluorescence fromthe corundum piece within the hydrothermal diamond anvil cell. The band owing to the aluminate monomeric species- ½AlðOHÞ4�
1� stretchingmode at �620 cm�1 is absent. Also, there is no evidence for dimers and trimer- [(OH)3-Al-O-Al-(OH)3]2�, [(OH)2-Al-(OH)2-Al-(OH)2], and[{-(OH)2-Al-O-}3]. The spectra between 2700 and 4000 cm�1 shows the bands due to intramolecular H2O. Spectra measured during heatingare shown in red, those measured during cooling in blue. Note that the band due to methane (CH4) at 2915 cm�1 (Chou and Anderson, 2009)is present in Raman spectra collected at both heating and cooling cycle. This is because the cell underwent several cycles of heating and coolingprior to the Raman measurements. (For interpretation of the references to color in this figure legend, the reader is referred to the web versionof this article.)
134 M. Mookherjee et al. / Geochimica et Cosmochimica Acta 133 (2014) 128–141
(Fig. 2). In the blank experiment with pure water, we do seeevidence for the interaction of diamond and aqueous fluidsat higher temperature with the formation of a band at2913 cm�1 (Fig. 2b). This is likely related to the presenceof methane (CH4), as documented by bands at 2918 cm�1
(Chou and Anderson, 2009). The band at 2913 cm�1 is typ-ically observed in the Raman Spectra collected during thecooling (Fig. 2b). However, this band could also be seenfor the Raman spectra collected during the heating paths,if the cell was subjected to repeated heating and coolingprior to the Raman measurements.
The spectral region between 2700 and 4000 cm�1 of purewater near ambient conditions is dominated by the vibra-tions related to H2O and consisted of three distinct bandsat 3256 cm�1 (2m2, overtone of bending mode), 3452 cm�1
(m1, symmetric stretch) and 3606 cm�1 (m3, asymmetricstretch) (Fig. 3). These three bands are very similar to thebands previously reported for pure water- 3225 cm�1,3450 cm�1, and 3630 cm�1 (Walrafen, 1964). At a tempera-ture of �696 �C and 8.6 kbar, these bands shift to 3265,3518, and 3544 cm�1, respectively. For the 5.3 m KOH aque-ous solution near ambient conditions, the spectral region
between the wavenumber 2700 and 4000 cm�1 is character-ized by three distinct bands, which occur at 3023 cm�1,3304 cm�1, and 3497 cm�1. At high temperatures of�813 �C, 2.2 kbar, these bands shift to 3348, 3542, and3564 cm�1 respectively (Fig. 3). In addition, a sharp featureat 3614 cm�1 is also observed for the 5.3 m KOH solution. Itis likely due to the excess hydroxyl groups from the dissolvedKOH. It could be attributed to a free or “quasifree” (OH�)group i.e., a proton that is not hydrogen bonded (Busing andHornig, 1961). This band is also attributed to the H–O� � �H–O–H interactions, i.e., H2O2
1� ions (Walrafen and Douglas,2006). The oxygen of the hydroxyl group is hydrogenbonded to the other water molecules but the proton attachedto the hydroxyl could remains isolated and therefore has ahigh stretching frequencies as explained from theoreticalstudies (Hermansson et al., 2011).
In the region 100–1200 cm�1, the “pure water” blankexperiment is devoid of any vibrational bands. In 5.3 mKOH blank experiment, a vibrational band is identified at1068 cm�1 (full width at half maximum, FWHM � 6 cm�1).This is likely related to the in-plane deformation of hydroxylgroup attached to a water molecule, which causes the sharp
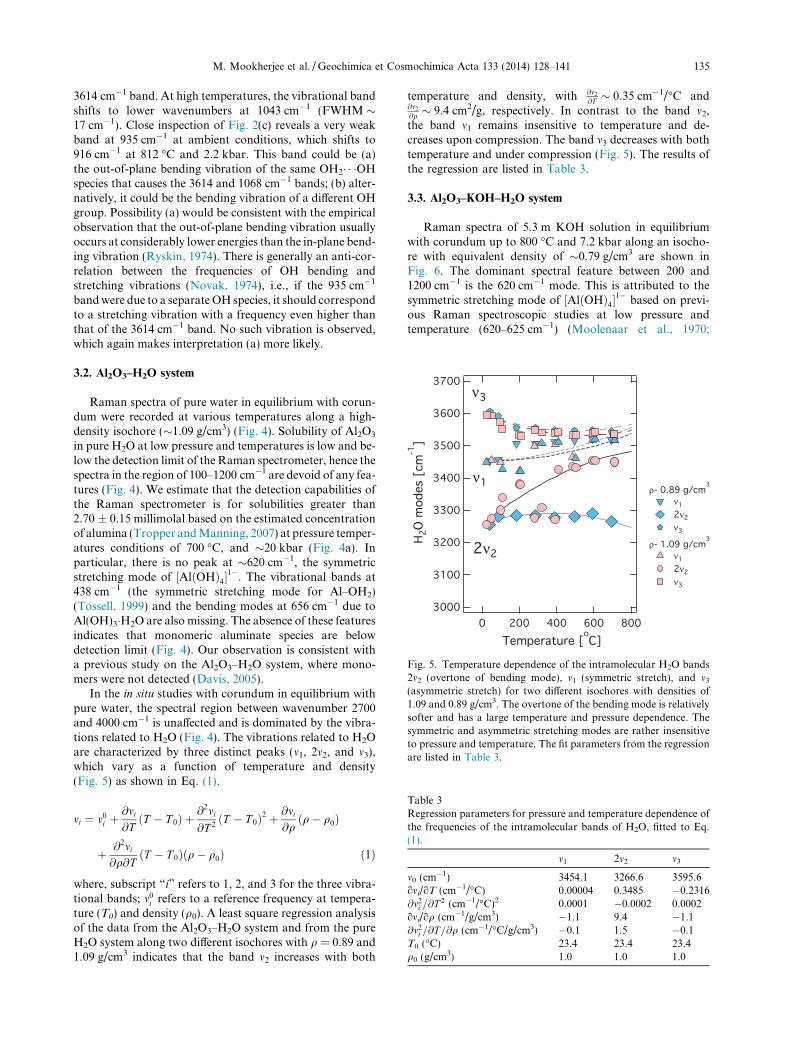
Fig. 5. Temperature dependence of the intramolecular H2O bands2m2 (overtone of bending mode), m1 (symmetric stretch), and m3
(asymmetric stretch) for two different isochores with densities of1.09 and 0.89 g/cm3. The overtone of the bending mode is relativelysofter and has a large temperature and pressure dependence. Thesymmetric and asymmetric stretching modes are rather insensitiveto pressure and temperature. The fit parameters from the regressionare listed in Table 3.
Table 3Regression parameters for pressure and temperature dependence ofthe frequencies of the intramolecular bands of H2O, fitted to Eq.(1).
m1 2m2 m3
m0 (cm�1) 3454.1 3266.6 3595.6omi/oT (cm�1/�C) 0.00004 0.3485 �0.2316@m2
i =@T 2 (cm�1/�C)2 0.0001 �0.0002 0.0002omi/oq (cm�1/g/cm3) �1.1 9.4 �1.1@m2
i =@T=@q (cm�1/�C/g/cm3) �0.1 1.5 �0.1T0 (�C) 23.4 23.4 23.4q0 (g/cm3) 1.0 1.0 1.0
M. Mookherjee et al. / Geochimica et Cosmochimica Acta 133 (2014) 128–141 135
3614 cm�1 band. At high temperatures, the vibrational bandshifts to lower wavenumbers at 1043 cm�1 (FWHM �17 cm�1). Close inspection of Fig. 2(c) reveals a very weakband at 935 cm�1 at ambient conditions, which shifts to916 cm�1 at 812 �C and 2.2 kbar. This band could be (a)the out-of-plane bending vibration of the same OH2� � �OHspecies that causes the 3614 and 1068 cm�1 bands; (b) alter-natively, it could be the bending vibration of a different OHgroup. Possibility (a) would be consistent with the empiricalobservation that the out-of-plane bending vibration usuallyoccurs at considerably lower energies than the in-plane bend-ing vibration (Ryskin, 1974). There is generally an anti-cor-relation between the frequencies of OH bending andstretching vibrations (Novak, 1974), i.e., if the 935 cm�1
band were due to a separate OH species, it should correspondto a stretching vibration with a frequency even higher thanthat of the 3614 cm�1 band. No such vibration is observed,which again makes interpretation (a) more likely.
3.2. Al2O3–H2O system
Raman spectra of pure water in equilibrium with corun-dum were recorded at various temperatures along a high-density isochore (�1.09 g/cm3) (Fig. 4). Solubility of Al2O3
in pure H2O at low pressure and temperatures is low and be-low the detection limit of the Raman spectrometer, hence thespectra in the region of 100–1200 cm�1 are devoid of any fea-tures (Fig. 4). We estimate that the detection capabilities ofthe Raman spectrometer is for solubilities greater than2.70 ± 0.15 millimolal based on the estimated concentrationof alumina (Tropper and Manning, 2007) at pressure temper-atures conditions of 700 �C, and �20 kbar (Fig. 4a). Inparticular, there is no peak at �620 cm�1, the symmetricstretching mode of ½AlðOHÞ4�
1�. The vibrational bands at438 cm�1 (the symmetric stretching mode for Al–OH2)(Tossell, 1999) and the bending modes at 656 cm�1 due toAl(OH)3�H2O are also missing. The absence of these featuresindicates that monomeric aluminate species are belowdetection limit (Fig. 4). Our observation is consistent witha previous study on the Al2O3–H2O system, where mono-mers were not detected (Davis, 2005).
In the in situ studies with corundum in equilibrium withpure water, the spectral region between wavenumber 2700and 4000 cm�1 is unaffected and is dominated by the vibra-tions related to H2O (Fig. 4). The vibrations related to H2Oare characterized by three distinct peaks (m1, 2m2, and m3),which vary as a function of temperature and density(Fig. 5) as shown in Eq. (1).
mi ¼ m0i þ
@mi
@TðT � T 0Þ þ
@2mi
@T 2ðT � T 0Þ2 þ
@mi
@qðq� q0Þ
þ @2mi
@q@TðT � T 0Þðq� q0Þ ð1Þ
where, subscript “i” refers to 1, 2, and 3 for the three vibra-tional bands; m0
i refers to a reference frequency at tempera-ture (T0) and density (q0). A least square regression analysisof the data from the Al2O3–H2O system and from the pureH2O system along two different isochores with q = 0.89 and1.09 g/cm3 indicates that the band m2 increases with both
temperature and density, with @m2
@T � 0.35 cm�1/�C and@m2
@q � 9.4 cm2/g, respectively. In contrast to the band m2,the band m1 remains insensitive to temperature and de-creases upon compression. The band m3 decreases with bothtemperature and under compression (Fig. 5). The results ofthe regression are listed in Table 3.
3.3. Al2O3–KOH–H2O system
Raman spectra of 5.3 m KOH solution in equilibriumwith corundum up to 800 �C and 7.2 kbar along an isocho-re with equivalent density of �0.79 g/cm3 are shown inFig. 6. The dominant spectral feature between 200 and1200 cm�1 is the 620 cm�1 mode. This is attributed to thesymmetric stretching mode of ½AlðOHÞ4�
1� based on previ-ous Raman spectroscopic studies at low pressure andtemperature (620–625 cm�1) (Moolenaar et al., 1970;

Fig. 6. Raman spectra of 5.3 m KOH fluid in equilibrium with a corundum crystal along an isochore with a nominal density of 0.79 g/cm3. (a)The spectral region from 100 to 1200 cm�1 exhibits the main band at �620 cm�1 attributed to the monomer, ½AlðOHÞ4�
1�, also seen is theband at �1068 cm�1 due to the deformation mode d(OH) from the KOH solution. There is no evidence of polymerized aluminate species. Theweak feature near 500 cm�1 is due to diamond fluorescence, which was not completely removed by the background correction. (b) Thespectral region from 2800 to 4000 cm�1, characterizes the intramolecular H2O bands. Inset shows gasket, sample chamber, corundum crystaland 5.3 m KOH aqueous fluid with a vapor bubble. The spectra were collected along a heating path and are shown in red color. Note the bandat 2918 cm�1 due to methane (CH4) (Chou and Anderson, 2009) is absent since the Raman spectra were collected during the first cycle.Repeated pressure–temperature cycling of the cell prior to the Raman measurement were avoided. (For interpretation of the references tocolor in this figure legend, the reader is referred to the web version of this article.)
136 M. Mookherjee et al. / Geochimica et Cosmochimica Acta 133 (2014) 128–141
Watling, 1998; Sipos et al., 2006), as well as our quantummechanical simulations and previous theoretical studies(Fig. 2; Table 2). The ½AlðOHÞ4�
1� stretching mode appearsfirst at 319 �C and 0.95 kbar respectively and shifts gradu-ally to 618 cm�1 upon heating to 800 �C. The integral inten-sity of the ½AlðOHÞ4�
1� stretching mode also increases withtemperature (Fig. 6) due to enhanced alumina solubility inthe KOH solution. In the pressure and temperature rangeexplored in the present study (Table 1), we do not findany evidence for polymerization or formation of higher or-der aluminate species such as dimers -[(OH)3-Al-O-Al(OH)3]2� and [(OH)2-Al-(OH)2-Al(OH)2] or trimers. Thisis very different from silica, which readily polymerizes atthese conditions (Zotov and Keppler, 2002). In experimentswith corundum in equilibrium with 1 m KOH solutionalong a cooling isochore of 0.79 g/cm3, the major featureremains the ½AlðOHÞ4�
1� stretching mode, however, uponcooling the solution is likely supersaturated with the dis-solved alumina and the stretching mode remains observableuntil room temperature. Additional features appear at high-er wavenumbers that are likely related to the deformationmodes of OH due to KOH.
According to our ab initio simulation (Fig. 1, Table 2), itis difficult to tell whether the ½AlðOHÞ4�
1� ion is isolated insolution or whether it forms an ion pair with K+, as there isonly a very slight difference (�5 cm�1) in the predicted fre-quency of the main peak for ½AlðOHÞ4�
1� and K[Al(OH)4].The evolution of peak position and peak width with tem-perature along an isochore is continuous, without any obvi-ous indication of ion pairing or dissociation.
The spectral region between 2700 and 4000 cm�1 is dom-inated by the hydroxyl (OH) stretching vibrations related toH2O. In the solution with 5.3 m KOH solution the high fre-quency stretching vibration of the “quasifree” (OH�) groupis more intense (Fig. 6) compared to the 1 m KOH solution(Fig. 7).
In an experiment along a high-density isochore (equiva-lent density of 1.0 g/cm3), with corundum and 5.3 m KOHsolution, we noticed that in addition to the stretching modeat 620 cm�1, a broad shoulder appeared at 670 cm�1 andshifted as a function of temperature with a stronger temper-ature dependence (Fig. 8). This could be related to the for-mation of a neutral Al(OH)3�H2O species (compare Fig. 1)However, the additional band is unlikely to be related to a

Fig. 7. Raman spectra of 1 m KOH fluid in equilibrium with a corundum crystal measured along a cooling path for an isochore with nominaldensity of 0.79 g/cm3. (a) The spectral region from 100 to 1200 cm�1 shows the main band at �620 cm�1 attributed to the monomer,[Al(OH)4]1�; also seen are the bands at �970 cm�1 and 1068 cm�1 due to the deformation mode d(OH) from the KOH solution. There is noevidence for polymerized aluminate species. Upon cooling, the [Al(OH)4]1� stretching mode is also seen at room temperature, indicating thatthe solution is super-saturated. Also observed are features developing at �800 cm�1 which are likely due to the precipitation of a thin film ofdiaspore (AlOOH) in the cooler parts of the sample chamber. (b) The spectral region 2800 and 4000 cm�1 shows the intramolecular H2Obands.
Fig. 8. (a) Raman spectra of 5.3 m KOH fluid in equilibrium with a corundum crystal along an isochore with nominal density of about. 1.0 g/cm3. The spectral region of 400–900 cm�1 is deconvolved into two distinct bands (m1 and m2). There are three panels in (b) and (c), top indicatesthe residual (pink dots), the middle panel indicates the data (pink crosses), the fit (black line), and the baseline (dashed line) and the lowerpanel shows the deconvoluted peaks. The bands occur at (b) 623 cm�1 (m1) and 682 cm�1 (m2) at 340 �C, 5.9 kbar, and the bands shift to (c)617 cm�1 and 652 cm�1 at 614.8 �C, 11.7 kbar. The band at 623 cm�1 is related to the stretching mode of the monomer, [Al(OH)4]1�. Theband at higher frequency could be due to Al(OH)3�H2O (d) The temperature-induced shift of the monomer peak (m1) and the peak due toAl(OH)3�H2O (m2) are �0.03 and �0.11 cm�1/�C respectively. The temperature dependence of the integral intensity of the monomer,[Al(OH)4]1� (A1) and Al(OH)3�H2O (A2) are also shown. (For interpretation of the references to color in this figure legend, the reader isreferred to the web version of this article.)
M. Mookherjee et al. / Geochimica et Cosmochimica Acta 133 (2014) 128–141 137
higher order polymer since it co-exists with the monomer at300 �C. An alternative possibility could be that at higherfluid density the K[Al(OH)4] species starts to dissociate intoK+ and ½AlðOHÞ4�
1�, as this may also produce an
additional band on the high-frequency side of the mainRaman peak (Fig. 1). This interpretation, however, it notconsistent with observations from studies at room temper-ature (e.g., Watling, 1998; Sipos et al., 2006), where the high
1
2
1
22
1
1205
cm
-110
73 c
m-1
797
cm-1
675
cm-1
338
cm-1
454
cm-1
506
cm-1
before heating, room temperature
after heating and cooling, room temperature10 x
50 x20 μm
20 μm
10 x20 μm
precipitates
diaspore (RRUF database)
Inte
nsity
[a.u
.] Intensity [a.u.]
(a)
(d)
(b)
(c)
(e) (f)
627
cm-1
ρ
ρ
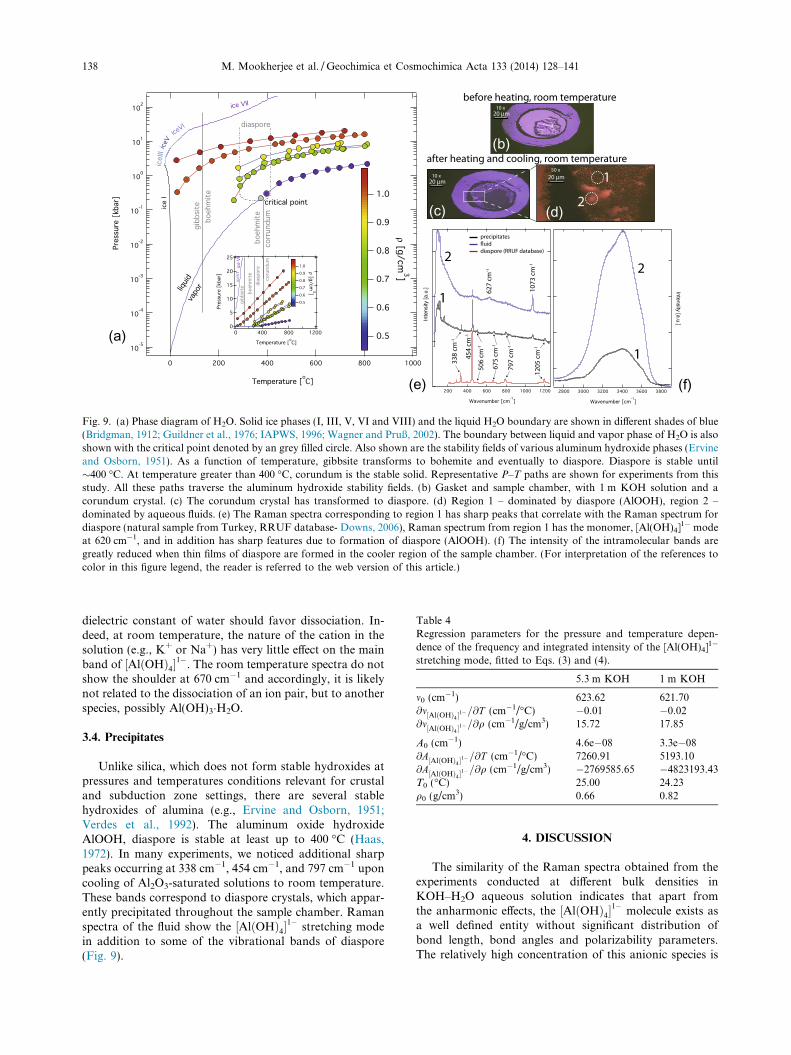
Fig. 9. (a) Phase diagram of H2O. Solid ice phases (I, III, V, VI and VIII) and the liquid H2O boundary are shown in different shades of blue(Bridgman, 1912; Guildner et al., 1976; IAPWS, 1996; Wagner and Pruß, 2002). The boundary between liquid and vapor phase of H2O is alsoshown with the critical point denoted by an grey filled circle. Also shown are the stability fields of various aluminum hydroxide phases (Ervineand Osborn, 1951). As a function of temperature, gibbsite transforms to bohemite and eventually to diaspore. Diaspore is stable until�400 �C. At temperature greater than 400 �C, corundum is the stable solid. Representative P–T paths are shown for experiments from thisstudy. All these paths traverse the aluminum hydroxide stability fields. (b) Gasket and sample chamber, with 1 m KOH solution and acorundum crystal. (c) The corundum crystal has transformed to diaspore. (d) Region 1 – dominated by diaspore (AlOOH), region 2 –dominated by aqueous fluids. (e) The Raman spectra corresponding to region 1 has sharp peaks that correlate with the Raman spectrum fordiaspore (natural sample from Turkey, RRUF database- Downs, 2006), Raman spectrum from region 1 has the monomer, [Al(OH)4]1� modeat 620 cm�1, and in addition has sharp features due to formation of diaspore (AlOOH). (f) The intensity of the intramolecular bands aregreatly reduced when thin films of diaspore are formed in the cooler region of the sample chamber. (For interpretation of the references tocolor in this figure legend, the reader is referred to the web version of this article.)
Table 4Regression parameters for the pressure and temperature depen-dence of the frequency and integrated intensity of the [Al(OH)4]1�
stretching mode, fitted to Eqs. (3) and (4).
5.3 m KOH 1 m KOH
m0 (cm�1) 623.62 621.70@m½AlðOHÞ4 �
1�=@T (cm�1/�C) �0.01 �0.02@m½AlðOHÞ4 �
1�=@q (cm�1/g/cm3) 15.72 17.85
A0 (cm�1) 4.6e�08 3.3e�08@A½AlðOHÞ4�
1�=@T (cm�1/�C) 7260.91 5193.10@A½AlðOHÞ4�
1�=@q (cm�1/g/cm3) �2769585.65 �4823193.43T0 (�C) 25.00 24.23q0 (g/cm3) 0.66 0.82
138 M. Mookherjee et al. / Geochimica et Cosmochimica Acta 133 (2014) 128–141
dielectric constant of water should favor dissociation. In-deed, at room temperature, the nature of the cation in thesolution (e.g., K+ or Na+) has very little effect on the mainband of ½AlðOHÞ4�
1�. The room temperature spectra do notshow the shoulder at 670 cm�1 and accordingly, it is likelynot related to the dissociation of an ion pair, but to anotherspecies, possibly Al(OH)3�H2O.
3.4. Precipitates
Unlike silica, which does not form stable hydroxides atpressures and temperatures conditions relevant for crustaland subduction zone settings, there are several stablehydroxides of alumina (e.g., Ervine and Osborn, 1951;Verdes et al., 1992). The aluminum oxide hydroxideAlOOH, diaspore is stable at least up to 400 �C (Haas,1972). In many experiments, we noticed additional sharppeaks occurring at 338 cm�1, 454 cm�1, and 797 cm�1 uponcooling of Al2O3-saturated solutions to room temperature.These bands correspond to diaspore crystals, which appar-ently precipitated throughout the sample chamber. Ramanspectra of the fluid show the ½AlðOHÞ4�
1� stretching modein addition to some of the vibrational bands of diaspore(Fig. 9).
4. DISCUSSION
The similarity of the Raman spectra obtained from theexperiments conducted at different bulk densities inKOH–H2O aqueous solution indicates that apart fromthe anharmonic effects, the ½AlðOHÞ4�
1� molecule exists asa well defined entity without significant distribution ofbond length, bond angles and polarizability parameters.The relatively high concentration of this anionic species is

M. Mookherjee et al. / Geochimica et Cosmochimica Acta 133 (2014) 128–141 139
consistent with the alkaline conditions (Wohlers and Man-ning, 2009). In experiments with high fluid density, we haveobserved bands that might be attributed to Al(OH)3�H2O.
The concentration of ½AlðOHÞ4�1� in KOH–H2O solu-
tions should be directly proportional to the integral inten-sity of the �620 cm�1 band. The integral intensities werecalculated for the monomer peak at �620 cm�1 and werecorrected for thermal effects by the thermal population fac-tor, R (Zotov and Keppler, 2002)
R ¼ m 1� exp � hcmkBT
� �� �ð2Þ
where, m is the frequency, h is the Planck’s constant, c is thespeed of light, kB is the Boltzman constant and T is theabsolute temperature in Kelvin.
In the in situ studies with corundum in equilibrium with5.3 m KOH and 1 m KOH solutions, the variation of thefrequency and integral intensity of the ½AlðOHÞ4�
1� stretch-ing band can be described by the equations
m½AlðOHÞ4 �1� ¼ m0 þ
@m½AlðOHÞ4 �1�
@TðT � T 0Þ þ
@m½AlðOHÞ4 �1�
@qðq� q0Þ
ð3Þ
and,
A½AlðOHÞ4 �1� ¼ A0þ
@A½AlðOHÞ4 �1�
@TðT � T 0Þþ
@A½AlðOHÞ4 �1�
@qðq�q0Þ
ð4Þ
The thermally corrected integral intensities were con-verted to concentrations (mol/kg of H2O) units using the re-ported alumina solubility in 1 m KOH solution ascalibration point (Wohlers and Manning, 2009). We cali-brate the intensity of the monomer as
C½AlðOHÞ4 �1� ¼ k½AlðOHÞ4 �
1� � A½AlðOHÞ4 �1� ð5Þ
νν
(a)
(c)
Fig. 10. Dependence of frequency and intensity of the [Al(OH)4]1� stretchsolution and (c, d) 1 m KOH solution. The integral intensities were cordeviation of the data for the 1.25 g/cm3 isochore from the initial trendconcentration in 1 m KOH in equilibrium with corundum as a function oequilibria.
where, the concentration of the monomer, C½AlðOHÞ4 �1� is
from the solution experiments (Wohlers and Manning,2009), the intensity of the monomer, A½AlðOHÞ4 �
1� is derived
from the in situ experiments and the integral intensity ofthe 620 cm�1 bands (Fig. 10) and k½AlðOHÞ4 �
1� contains the
scattering cross section at various instrument parameters.We used k½AlðOHÞ4 �
1� and the intensity of the monomer for
a range of isochores and with varying temperatures topredict the monomer concentrations, which should beequivalent to bulk alumina solubilities in these alkalinesolutions. Results are shown in Fig. 10 (see Table 4 forthe regression parameters).
5. CONCLUSION
This study demonstrates that in situ Raman Spectros-copy in externally heated diamond anvil-cells allows identi-fication of the major aluminate species dissolved in alkalineaqueous solution with 5.3 m and 1 m KOH solution inequilibrium with corundum. The dominant species is themonomer ½AlðOHÞ4�
1� species at all temperatures greaterthan �300 �C. Within the temperature, pressure, and den-sity explored in the present study, there is no evidence forpolymerization via formation of e.g., [(OH)2-Al-(OH)2-Al(OH)2] dimer species. In pure H2O, the monomer speciesis beyond the detection limit of the Raman spectrometer asthe solubility of corundum is very low. Our data thereforeshow that for typical crustal P, T conditions, thermody-namic models of alumina in aqueous solutions may safelyignore polymerization effects, in particular when the bulkalumina solubilities are low. This does not, however, ruleout the potential importance of polymeric species at deepermantle with P (>20 kbar), T (>1000 �C) conditions wherehigher bulk alumina solubilities may enhancepolymerization.
4 x10⁶
5 x10⁶
3 x10⁶
2 x10⁶
1 x10⁶
4 x10⁶
5 x10⁶
3 x10⁶
2 x10⁶
1 x10⁶
(d)
(b)
(e)
ing mode on temperature and density for (a, b) 5.3 m KOH aqueousrected with the thermal population factor (Eq. (2), see text). The
are likely due to a leak of the sample chamber (e) Variation of Alf temperature and density. Data below 400 �C represent metastable
140 M. Mookherjee et al. / Geochimica et Cosmochimica Acta 133 (2014) 128–141
ACKNOWLEDGEMENTS
MM acknowledges the support staff- Sven Linhardt, StefanUbelhack, Hubert Schulze, Heinz Fischer, and Gertrud Gollnerat Bayerisches Geoinstitut, Bayreuth, Germany for their supportduring the experiments. MM acknowledges the research discus-sions with Prof. William Bassett. MM acknowledges computing re-sources (request # EAR130015) from the Extreme Science andEngineering Discovery Environment (XSEDE), which is supportedby National Science Foundation grant number OCI-1053575. MMis currently supported by US NSF EAR 1250477. CEM was sup-ported by a Humboldt Fellowship and US NSF EAR 1049901.Authors thank constructive reviews from Dr. I-Ming Chou, twoanonymous reviewers, and associate editor.
REFERENCES
Anderson G. M. (1995) Is there alkali–aluminum complexing athigh temperatures and pressures? Geochim. Cosmochim. Acta
59, 2155–2161.Anderson G. M. and Burnham C. W. (1967) Reactions of quartz
and corundum with aqueous chloride and hydroxide solutionsat high temperatures and pressures. Am. J. Sci. 265, 12–27.
Anderson G. M. and Burnham C. W. (1983) Feldspar solubilityand the transport of aluminum under metamorphic conditions.Am. J. Sci. 283-A, 283–297.
Azaroual M., Pascal M. L. and Roux J. (1996) Corundumsolubility and aluminum speciation in KOH aqueous solutionsat 400 �C from 0.5 to 2.0 kbar. Geochim. Cosmochim. Acta 60,4601–4614.
Barns R. L., Shields R. M. and Laudise R. A. (1963) Solubility ofcorundum in basic hydrothermal solvents. J. Phys. Chem. 67,835.
Bassett W. A. (2003) High pressure–temperature aqueous systemsin the hydrothermal diamond anvil cell (HDAC). Eur. J.
Mineral. 15, 773–780.Bassett W. A., Shen A. H., Bucknum M. and Chou I. M. (1993a) A
new diamond-anvil cell for hydrothermal studies to 2.5 GPaand from �190 �C to 1200 �C. Rev. Sci. Inst. 64, 2340–2345.
Bassett W. A., Shen A. H., Bucknum M. and Chou I. M. (1993b)Hydrothermal studies in a new diamond anvil cell up to 10 GPaand from �190 �C to 1200 �C. Pure Appl. Geophys. 141, 487–495.
Becke A. D. (1993) Density-functional thermochemistry. III. Therole of exact exchange. J. Chem. Phys. 98, 5648–5652.
Bridgman P. W. (1912) Water, in the liquid and five solid forms,under pressure. Proc. Am. Acad. Arts Sci. 47, 439–558.
Busing W. R. and Hornig D. F. (1961) The effect of dissolved KBr,KOH, or HCl on the Raman spectrum of water. J. Chem. Phys.
65, 284–292.Casey W. H. (2005) Large aqueous aluminum hydroxide molecules.
Chem. Rev. 106, 1–16.Casey W. H. and Rustad J. R. (2007) Reaction dynamics,
molecular clusters, and aqueous geochemistry. Annu. Rev.
Earth Planet. Sci. 35, 21–46.Chellappa R. S., Somayazulu M. and Hemley R. J. (2009)
Rhenium reactivity in H2O–O2 supercritical mixtures at highpressures. High Press. Res. 29, 792–799.
Chou I.-M. and Anderson A. J. (2009) Diamond dissolution andthe production of methane and other carbon-bearing species inhydrothermal diamond-anvil cells. Geochim. Cosmochim. Acta
73, 6360–6366.Davis M. K. (2005). Fluid rock interactions in silicate and
aluminosilicate systems at elevated pressure and temperature.
Doctoral dissertation, Retrieved from ProQuest Dissertationsand Theses, Univ. Michigan, AAT3186610.
Diakonov I., Pokrovski G., Schott J., Castet S. and Gout R. (1996)An experimental and computational study of sodium–alumi-num complexing in crustal fluids. Geochim. Cosmochim. Acta
60, 197–211.Downs R. T. (2006). The RRUF Project: an integrated study of the
chemistry, crystallography, Raman and infrared spectroscopyof minerals. Program. Abstracts. 19th General Meeting of theInt. Min. Assoc., Kobe, Japan, O 03-13.
Ervine G. and Osborn E. F. (1951) The system Al2O3–H2O. J.
Geol. 59, 381–394.Frisch M.J., et al. (2009). Gaussian 09, Revision, A. 1. Gaussian
Inc., Wallingford, CT.Gale J. D., Rohl A. L., Walting H. R. and Parkinson G. M. (1998)
Theoretical investigation of the nature of aluminum-containingspecies present in alkaline solution. J. Phys. Chem. B. 102,10372–10382.
Guildner L. A., Johnson D. P. and Jones F. E. (1976) Vaporpressure of water at its triple point. J. Res. Natl. Bur. Stand.
80A, 505–521.Haas H. (1972) Diaspore–corundum equilibrium determined by
epitaxis of diaspora on corundum. Am. Mineral. 57, 1375–1385.Hehre W., Radom L., Schleyer P. V. R. and Pople J. A. (1986) Ab
Initio Molecular Orbital Theory. Wiley, New York.Hermansson K., Bopp P. A., Spangberg D., Pejov L., Bako I. and
Mitev P. D. (2011) The vibrating hydroxide ion in water. Chem.
Phys. Lett. 514, 1–15.IAPWS (1996). IAPWS Release on the IAPWS formulation 1995
for the thermodynamic properties of ordinary water substancefor general and scientific use. Available at: <http://www.iapws.org>.
Iler R. K. (1979) The Chemistry of Silica: Solubility, Polymerization,
Colloid and Surface Properties and Biochemistry of Silica. JohnWiley and Sons, New York, ISBN: 978-0-471-02404-0, p. 896.
Kerrick D. M. (1990) The Al2SiO5 polymorphs. Rev. Mineral. 22,406.
Korzhinskiy M. A. (1987) The solubility of corundum in an HClfluid and forms taken by Al. Geochem. Int. 24, 105–110.
Lee C., Yang W. and Parr R. G. (1988) Development of the Colle-Salvetti correlation-energy formula into a functional of theelectron density. Phys. Rev. B. 37, 785–789.
Manning C. E. (1994) The solubility of quartz in the lower crustand upper mantle. Geochim. Cosmochim. Acta 58, 4831–4839.
Manning C. E. (2007) Solubility of corundum + kyanite in H2O at700 �C, 10 kbar: evidence for Al–Si complexing at high pressureand temperature. Geofluids 7, 258–269.
Mao H. K., Xu J. and Bell P. M. (1986) Calibration of the rubypressure gauge to 800 kbar under quasi-hydrostatic conditions.J. Geophys. Res. 91, 4673–4676.
Mibe K., Chou I.-M. and Bassett W. A. (2008) In situ Ramanspectroscopic investigation of the structure of subduction-zonefluids. J. Geophys. Res. 113, B04208.
Moolenaar R. J., Evans J. C. and McKeever L. D. (1970) Thestructure of aluminate ion I solutions at high pH. J. Phys.
Chem. 74, 3629–3636.Newton R. C. and Manning C. E. (2002) Solubility of silica in
equilibrium with enstatite, forsterite, and H2O at deep crust/upper mantle pressures and temperatures and an activity-concentration model for polymerization of aqueous silica.Geochim. Cosmochim. Acta 66, 4165–4176.
Newton R. C. and Manning C. E. (2003) Activity coefficient andpolymerization of aqueous silica at 800 �C, 12 kbar, fromsolubility measurements on SiO2-buffering mineral assemblages.Contrib. Mineral. Pet. 146, 135–143.
M. Mookherjee et al. / Geochimica et Cosmochimica Acta 133 (2014) 128–141 141
Newton R. C. and Manning C. E. (2006) Solubilities of corundum,wollastonite and quartz in H2O–NaCl solutions at 800 �C and10 kbar: interaction of simple minerals with brines at high pressureand temperature. Geochim. Cosmochim. Acta 70, 5571–5582.
Novak A. (1974) Hydrogen bonding in solids. Correlation ofspectroscopic and crystallographic data. Struct. Bond. 18, 177–216.
Pascal M. L. and Anderson G. M. (1989) Speciation of Al, Si, andK in supercritical solutions: experimental study and interpre-tation. Geochim. Cosmochim. Acta 53, 1843–1855.
Pokrovskii G. S., Schott J., Harrichoury J. C. and Sergeyev A. S.(1996) The stability of aluminum silicate complexes in acidicsolutions from 25–150 �C. Geochim. Cosmochim. Acta 60, 2495–2501.
Pokrovskii V. A. and Helgeson H. C. (1995) Thermodynamicproperties of aqueous species and the solubilities of minerals athigh pressures and temperatures: the system Al2O3–H2O–NaCl.Am. J. Sci. 295, 1255–1342.
Pokrovskii V. A. and Helgeson H. C. (1997) Thermodynamicproperties of aqueous species and the solubilities of minerals athigh pressures and temperatures: the system Al2O3–H2O–KOH.Chem. Geol. 137, 221–242.
Pople J. A., Scott A. P., Wong M. W. and Radom L. (1993) Scalingfactors for obtaining fundamental vibrational frequencies andzero-point energies from HF/6-31G* and MP2/6-31G* har-monic frequencies. Israel J. Chem. 33, 345–350.
Ragnarsdottir K. V. and Walther J. V. (1985) Experimentaldetermination of corundum solubilities in pure water between400–700 �C and 1–3 Kbar. Geochim. Cosmochim. Acta 49,2109–2115.
Ryskin Y. A. (1974) The vibrations of protons in minerals:hydroxyl, water and ammonium. In The infrared spectra of
minerals (ed. V. C. Farmer). Mineralogical Society, London,pp. 137–181.
Sanjuan B. and Michard G. (1987) Aluminum hydroxide solubilityin aqueous solutions containing fluoride ions at 50 �C. Geochim.
Cosmochim. Acta 51, 1823–1831.Salvi S., Pokrovski G. S. and Shott J. (1998) Experimental
investigation of aluminum-silica aqueous complexing at300 �C. Chem. Geol. 151, 51–67.
Saul A. and Wagner W. (1989) A fundamental equation for watercovering the range from the melting line to 1273 K at pressuresup to 25000 MPa. J. Phys. Chem. Ref. Data 18, 1537–1559.
Sipos P., May P. M. and Hefter G. (2006) Quantitative determi-nation of an aluminate dimer in concentrated alkaline alumi-nate solutions by Raman spectroscopy. Dalton Trans. 2006,368–375.
Tagirov B. and Schott J. (2001) Aluminum speciation in crustalfluids revisited. Geochim. Cosmochim. Acta 65, 3965–3992.
Tossell J. A. (1999) Theoretical studies on aluminate and sodiumaluminate species in models for aqueous solution: Al(OH)3,Al(OH)4
�, and NaAl(OH)4. Am. Mineral. 84, 1641–1649.Tropper P. and Manning C. E. (2007) The solubility of corundum
in H2O at high pressure and temperature and its implicationsfor Al mobility in the deep crust and upper mantle. Chem. Geol.
240, 54–60.Verdes G., Gout R. and Castet S. (1992) Thermodynmic properties
of the aluminate ion and of bayerite, boehmite, diaspora andgibbsite. Eur. J. Mineral. 4, 767–792.
Wagner W. and Pruß A. (2002) The IAPWS formulation 1995 forthe thermodynamic properties of ordinary water substance forgeneral and scientific use. J. Phys. Chem. Ref. Data 31, 387–535.
Walrafen G. E. (1964) Raman spectral studies of water structure. J.
Chem. Phys. 40, 3249–3256.Walrafen G. E. and Douglas R. T. W. (2006) Raman spectra from
very concentrated aqueous NaOH and from wet and dry, solid,and anhydrous molten. LiOH, NaOH, and KOH. J. Chem.
Phys. 124, 114504.Walther J. V. (1997) Experimental determination and interpreta-
tion of the solubility of corundum in H2O between 350 and600 �C from 0.5 to 2.2 kbar. Geochim. Cosmochim. Acta 61,4955–4964.
Walther J. V. (2001) Experimental determination and analysis of thesolubility of corundum in 0.1 and 0.5 m NaCl solutions between400 and 600 �C. Geochim. Cosmochim. Acta 65, 2843–2851.
Watling H. (1998) Spectroscopy of concentrated sodium aluminatesolutions. Appl. Spectrosc. 52, 250–258.
Wasserburg G. J. (1958) The solubility of Quartz in supercriticalwater as a function of pressure. J. Geol. 66, 559–578.
Wei Q., Dubovinskaia N. and Dubrovinsky L. (2011) Ruby andSm: YAG fluorescence pressure gauges up to 120 GPa and1700 K. J. App. Phys. 110, 043513.
Wohlers A. and Manning C. E. (2009) Solubility of corundum inaqueous KOH solutions at 700 �C and 1 GPa. Chem. Geol. 262,310–317.
Zotov N. and Keppler H. (2000) In-situ Raman spectra ofdissolved silica species in aqueous fluids to 900 �C and 14 kbar.Am. Mineral. 85, 600–603.
Zotov N. and Keppler H. (2002) Silica speciation in aqueous fluidsat high pressures and high temperatures. Chem. Geol. 184, 71–82.
Associate editor: Bjorn Jamtveit