integrating transit with congestion pricing · of tsp. 10 . miami upa hypothesis ... unemployment...
TRANSCRIPT

Integrating Transit with Congestion Pricing: A Review of the Miami and Minneapolis UPAs
FHWA Webinar Series October 27, 2011

URBAN PARTNERSHIP AGREEMENT PROGRAM
• $1 Billion congestion relief program
• Additional $300 Million for the Congestion Reduction Demonstration Program
• USDOT sought applications that used the 4T’s: • Tolling • Transit • Telecommuting • Technology
• Awards made to…
2

URBAN PARTNERSHIP AGREEMENT PROGRAM
San Francisco (UPA)
Seattle (UPA)
Atlanta (CRD)
Los Angeles (CRD)
Miami (UPA)
Minneapolis (UPA)
3

Miami UPA (I-95)
HOV to HOT conversion
3 Phases Phase 1A - Dec. 2008 Phase 1B - Jan. 2010 Phase 2 - mid 2014
2 HOT lanes per direction
Separated by plastic poles
Dynamic pricing
Registered 3+ carpools free
4

Phase 1 Transit Improvements
2 new routes • Pines Blvd. Express • Dade-Broward Express
Golden Glades P&R • 500 new spaces
Transit Signal Priority • Pines Blvd. • Broward Blvd.
Pines Express
Dade-Broward Express (Broward Blvd. & Sheridan St.)
Golden Glades P&R
TSP
TSP
Original Route 95X
5

Minnesota UPA (I-35W) HOV to HOT + new HOT lanes
Fully opened Nov. 2010
1 HOT lane per direction (except PDSL segment)
Stripe separation
Dynamic pricing
Multiple entry/exit points
2+ carpools free Open to all traffic in off-peak (except PDSL segment)
PDSL
6

Minnesota UPA (I-35W)
Transit Improvements Added bus service 6 new or expanded park-n-
rides 1 transit bypass lane Contra-flow bus only lanes ITS technology
Apple Valley BRT Station
MARQ2 Bus Lanes Downtown Minneapolis 7

Transit Hypotheses & Question
1.The UPA project will enhance transit performance on the UPA corridors
2.The UPA project will increase ridership and facilitate a mode shift to transit
3.Transit mode shift/increased ridership will contribute to congestion mitigation
4.What was the contribution of each UPA project element to increased ridership and/or mode shift to transit?
8
Miami UPA Transit Results (2008 – 2010 Data)
9

Miami UPA Hypothesis 1 Results Average travel times in Express
Lanes improved from 25 to 8 minutes.
Average travel speeds went from 18 to 57 mph.
Scheduled travel times reduced by 10 minutes (northbound) and 7 minutes (southbound).
On-time performance improved from 76% to 81%.
A.M. bus travel times on Pines Blvd. reduced by 12% because of TSP.
10

Miami UPA Hypothesis 2 Results
Average weekday ridership increased 57%.
x Boardings per revenue mile dropped 14%.
x Average vehicle occupancy dropped from 2.20 to 1.36 (a.m.) dropped from 1.95 to 1.46. (p.m.)
x Transit mode share dropped from 19% to 16% (a.m.) dropped from 15% to 14% (p.m.)
11

Unemployment Rate in Miami-Dade
Unemployment Rate in Miami-Dade County Source: U.S. Department of Labor
4.9% Jan-08
11.4% Apr-10
12

Unemployment v. MDT Ridership
Ridership is for all MDT MetroBus
13
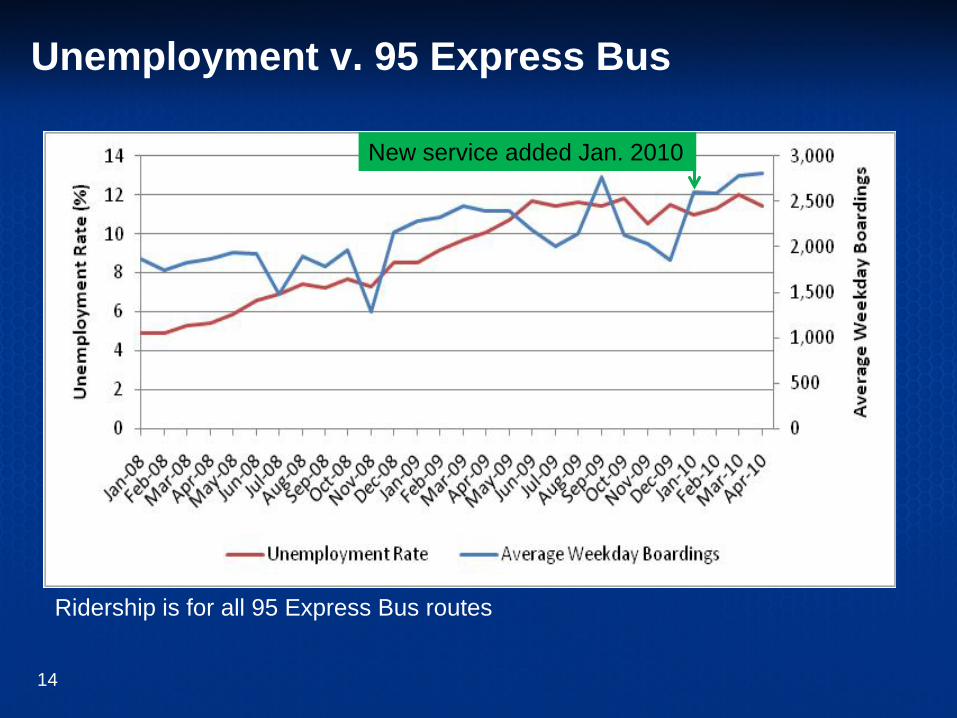
Unemployment v. 95 Express Bus
Ridership is for all 95 Express Bus routes
New service added Jan. 2010
14
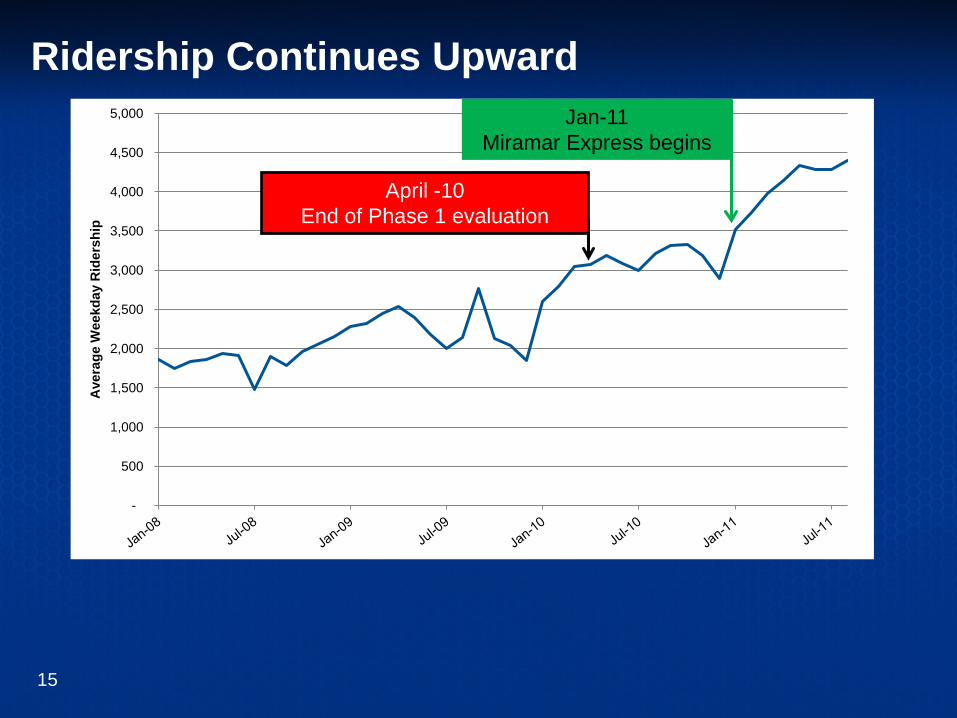
Ridership Continues Upward
15
-
500
1,000
1,500
2,000
2,500
3,000
3,500
4,000
4,500
5,000 A
vera
ge W
eekd
ay R
ider
ship
Jan-11 Miramar Express begins
April -10 End of Phase 1 evaluation

Miami UPA Hypothesis 3 Results
Total person throughput for the Express Lanes increased 42%.
Person throughput from transit increased while person throughput from HOVs decreased.
16

Miami UPA Hypothesis 4 Results
53% of new 95 Express Bus riders said the Express Lanes influenced their decision to use transit.
38% of new 95 Express Bus riders used to drive alone.
34% switched from Tri-Rail and/or MetroRail.
86% have access to vehicle always or most of the time. 17
Minnesota UPA Transit Results (2009 – 2011 Data)
18
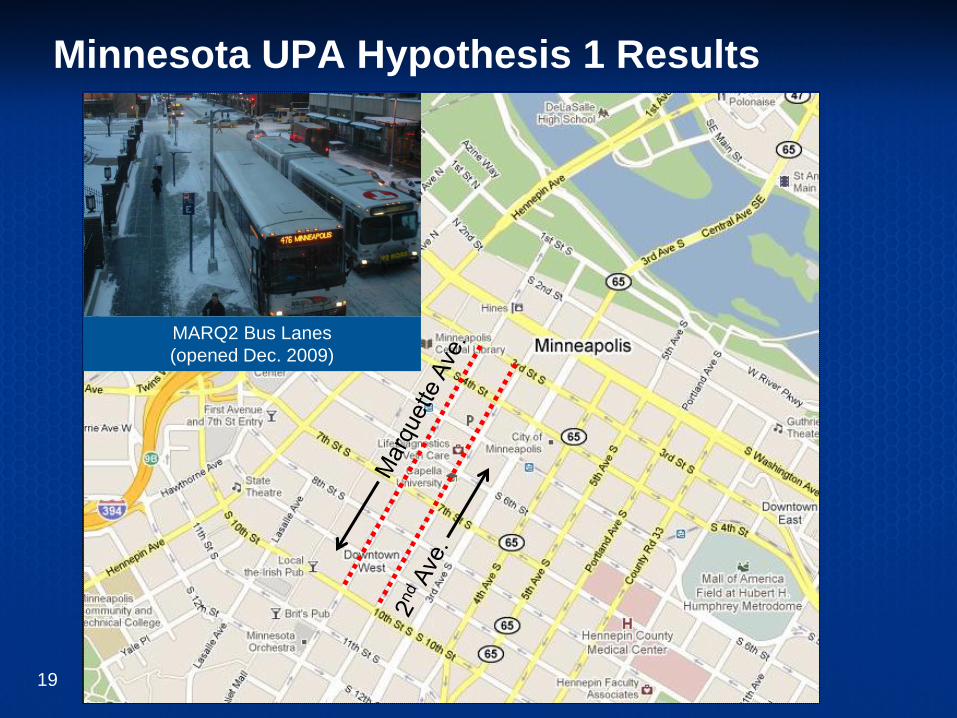
Minnesota UPA Hypothesis 1 Results
MARQ2 Bus Lanes (opened Dec. 2009)
19
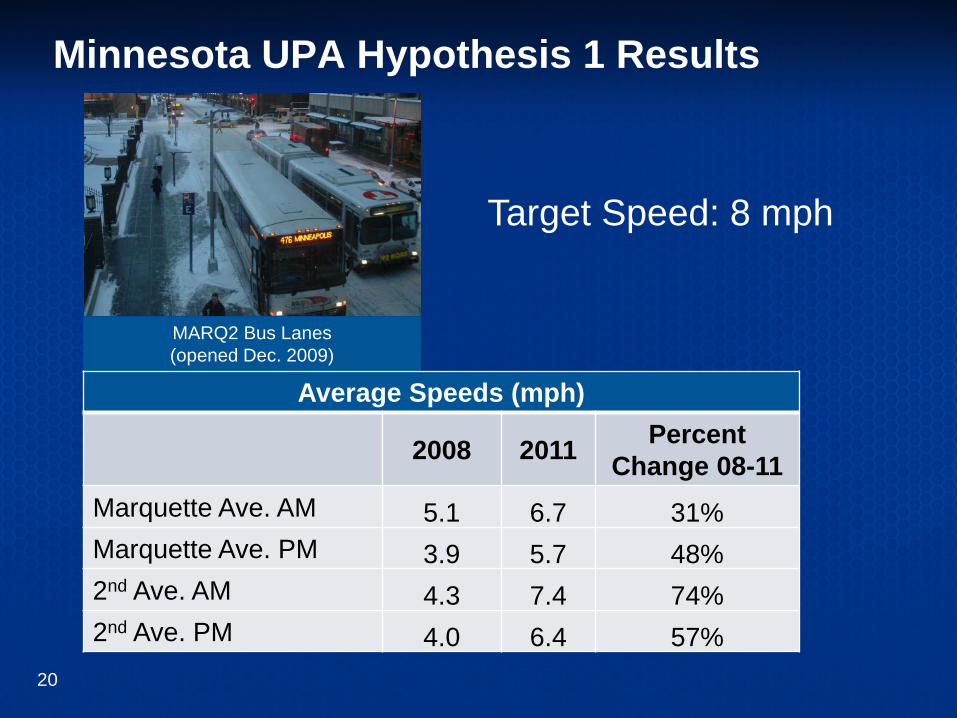
Minnesota UPA Hypothesis 1 Results
MARQ2 Bus Lanes (opened Dec. 2009)
Average Speeds (mph)
2008 2011 Percent Change 08-11
Marquette Ave. AM 5.1 6.7 31% Marquette Ave. PM 3.9 5.7 48% 2nd Ave. AM 4.3 7.4 74% 2nd Ave. PM 4.0 6.4 57%
Target Speed: 8 mph
20

Minnesota UPA Hypothesis 1 Results
Priced Dynamic Shoulder Lanes opened in Sept. 2009
PDSL
Travel Speeds (mph) Apr. 2009 Apr. 2011
41 mph 35 mph
Note: PDSL is northbound only
21

Minnesota UPA Hypothesis 1 Results HOT Lanes Southern Segment
opened in Sept. 2009
Southern Segment
Travel Speeds (mph) Apr. 2009 Apr. 2011
Northbound 61 mph 52 mph
Southbound 52 mph 52 mph
22

Minnesota UPA Hypothesis 1 Results HOT Lanes Middle Segment
opened in Nov. 2010
Middle Segment
Travel Speeds (mph) Apr. 2009 Apr. 2011
Northbound 28 mph 57 mph
Southbound 47 mph 57 mph
23

Minnesota UPA Hypothesis 1 Results
24
65.0%
70.0%
75.0%
80.0%
85.0%
90.0%
95.0%
I-35W South On-Time Performance
89.0%
PDSL & Southern Segment Opens
Sept. 2009
Middle Segment Opens Nov. 2010
Crosstown Commons Construction May 2007 to Nov. 2010
90.5%

Minnesota UPA Hypothesis 2 Results
Average Weekday Ridership by Corridor
I-35W North 7.0%
I-35W South 9.0%
I-394 2.4%
I-94N 4.5%
Percentages are between March 2009 and March 2011
25
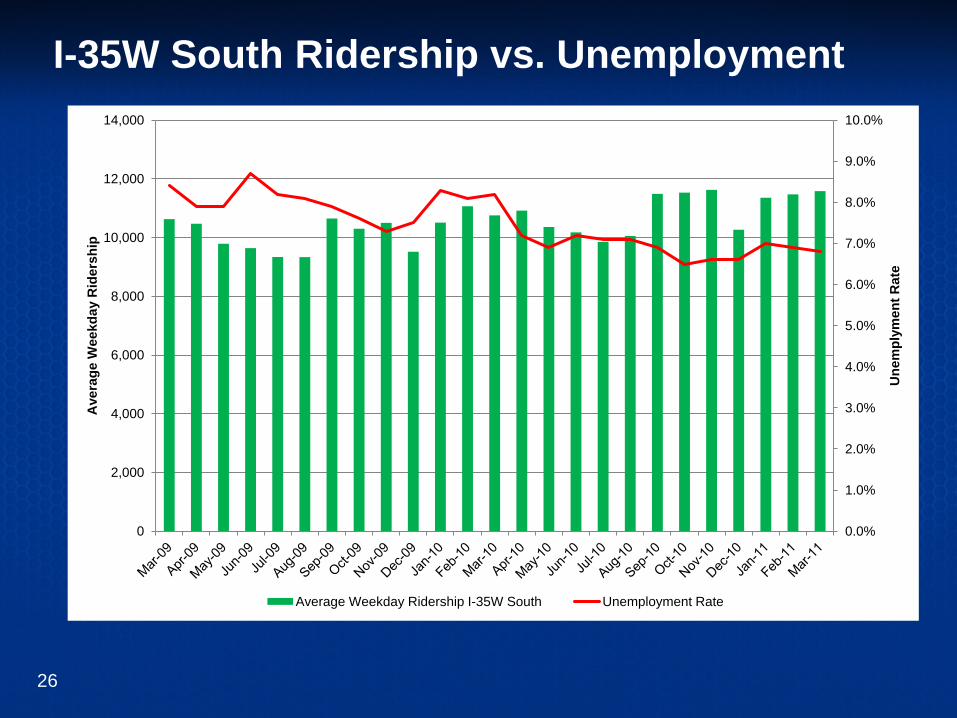
I-35W South Ridership vs. Unemployment
26
0.0%
1.0%
2.0%
3.0%
4.0%
5.0%
6.0%
7.0%
8.0%
9.0%
10.0%
0
2,000
4,000
6,000
8,000
10,000
12,000
14,000
Une
mpl
ymen
t Rat
e
Ave
rage
Wee
kday
Rid
ersh
ip
Average Weekday Ridership I-35W South Unemployment Rate

I-35W South Ridership vs. Cost per Gallon
27
$-
$0.50
$1.00
$1.50
$2.00
$2.50
$3.00
$3.50
$4.00
0
2,000
4,000
6,000
8,000
10,000
12,000
14,000
Cot
s pe
r Gal
lon
Ave
rage
Wee
kday
Rid
ersh
ip
Average Weekday Ridership I-35W South Cost per Gallon
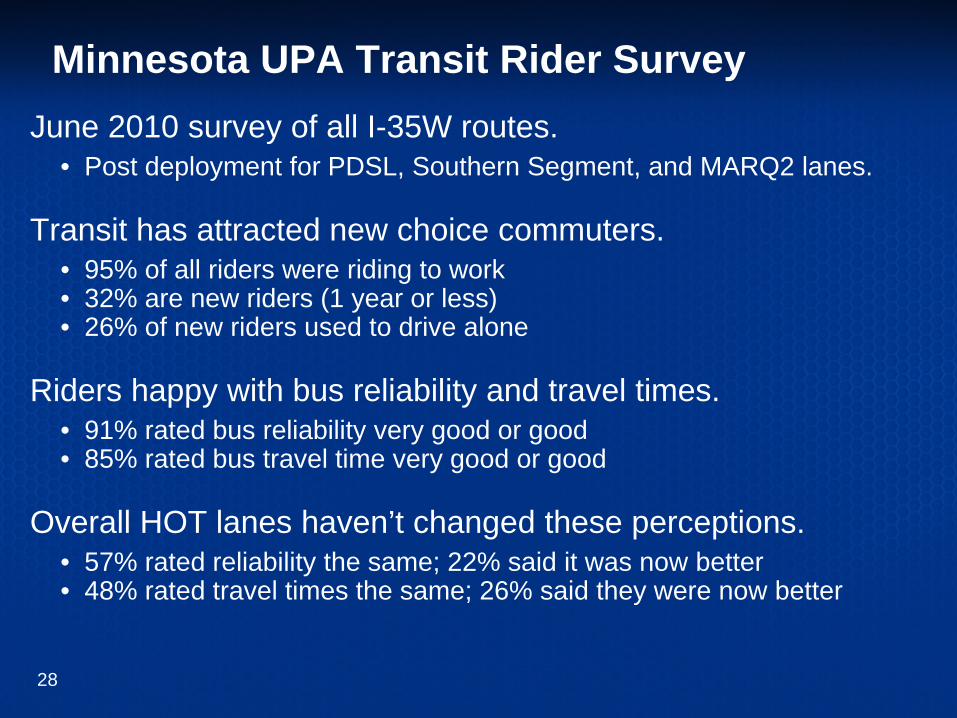
Minnesota UPA Transit Rider Survey June 2010 survey of all I-35W routes.
• Post deployment for PDSL, Southern Segment, and MARQ2 lanes.
Transit has attracted new choice commuters. • 95% of all riders were riding to work • 32% are new riders (1 year or less) • 26% of new riders used to drive alone
Riders happy with bus reliability and travel times. • 91% rated bus reliability very good or good • 85% rated bus travel time very good or good
Overall HOT lanes haven’t changed these perceptions. • 57% rated reliability the same; 22% said it was now better • 48% rated travel times the same; 26% said they were now better
28

Minnesota UPA Transit Rider Survey
Bus Arrival Time Signs • 86% have seen them • 8% were influenced by them
Bus arrival time sign on MARQ2
MARQ2 Bus Lanes Downtown Minneapolis
Impact of MARQ2 lanes • 55% said service speed better • 46% said service reliability better
29

I-35W Express Bus Rider Demographics
Category I-35W Riders All Metro Riders Aged 35 to 64 66% 48% Caucasian 86% 62% African-American 4% 23%
Gender Male Female Male Female 38% 62% 59% 41%
Household income > $60K 69% 27% Household income < $20K 3% 32% Access to at least 1 car 94% 56%
30

Comments / Questions?
Contact: Brian Pessaro, AICP Senior Research Associate Center for Urban Transportation Research University of South Florida (813) 974-5113 [email protected]
31

Twin Cities Managed Lanes and the Transit Advantage
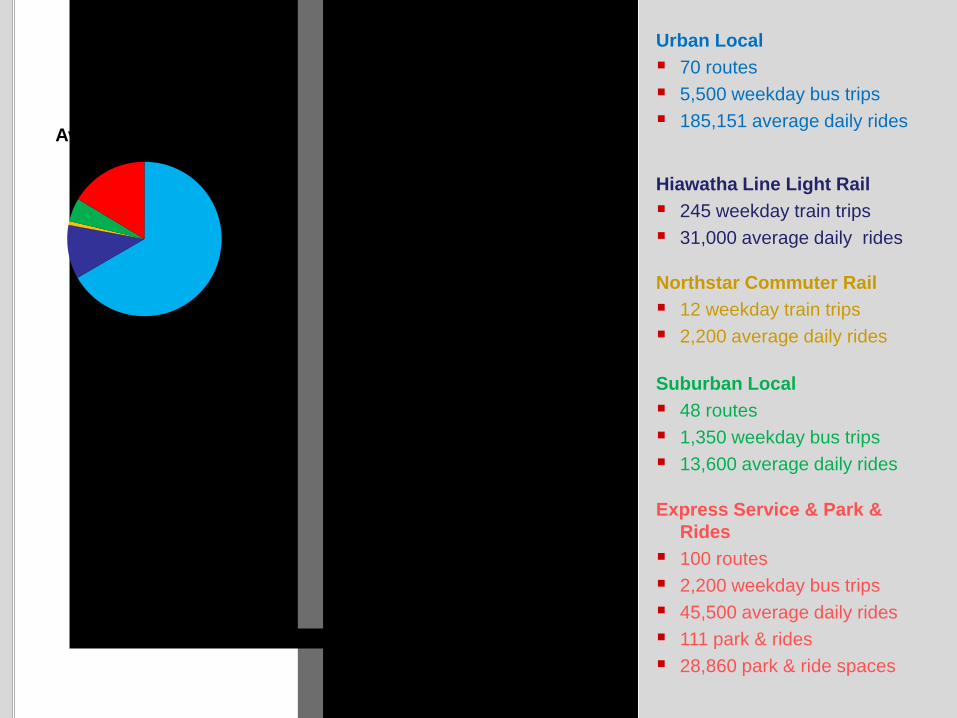
Regional Totals 217 transit routes
Hiawatha LRT Northstar CRT
8,600 weekday transit trips 277,900 average daily rides
Urban Local 70 routes 5,500 weekday bus trips 185,151 average daily rides
Hiawatha Line Light Rail 245 weekday train trips 31,000 average daily rides
Northstar Commuter Rail 12 weekday train trips 2,200 average daily rides
Suburban Local 48 routes 1,350 weekday bus trips 13,600 average daily rides
Express Service & Park & Rides
100 routes 2,200 weekday bus trips 45,500 average daily rides 111 park & rides 28,860 park & ride spaces
Average Daily Rides
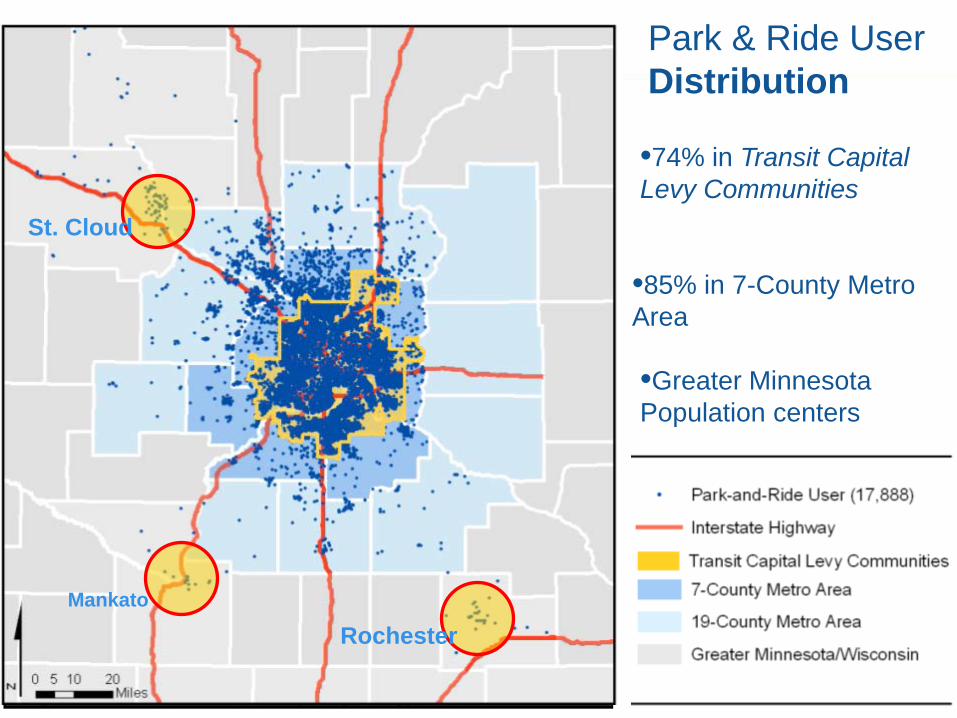
User Distribution
St. Cloud
Mankato
Rochester
Park & Ride User Distribution
•74% in Transit Capital Levy Communities
•85% in 7-County Metro Area
•Greater Minnesota Population centers

Trip purpose

Transit Market Factors • Auto ownership • Employment Density • Fuel cost • Parking availability and cost • Compete with auto travel time
and reliability • Congestion on streets and highways • Transit advantages

Employment Count
6
Employment Density
• 140,000 Jobs • Limited parking available • $8/day average parking
• 45,000 Jobs • Parking available • $3/day average parking

Express Service to Downtown Minneapolis
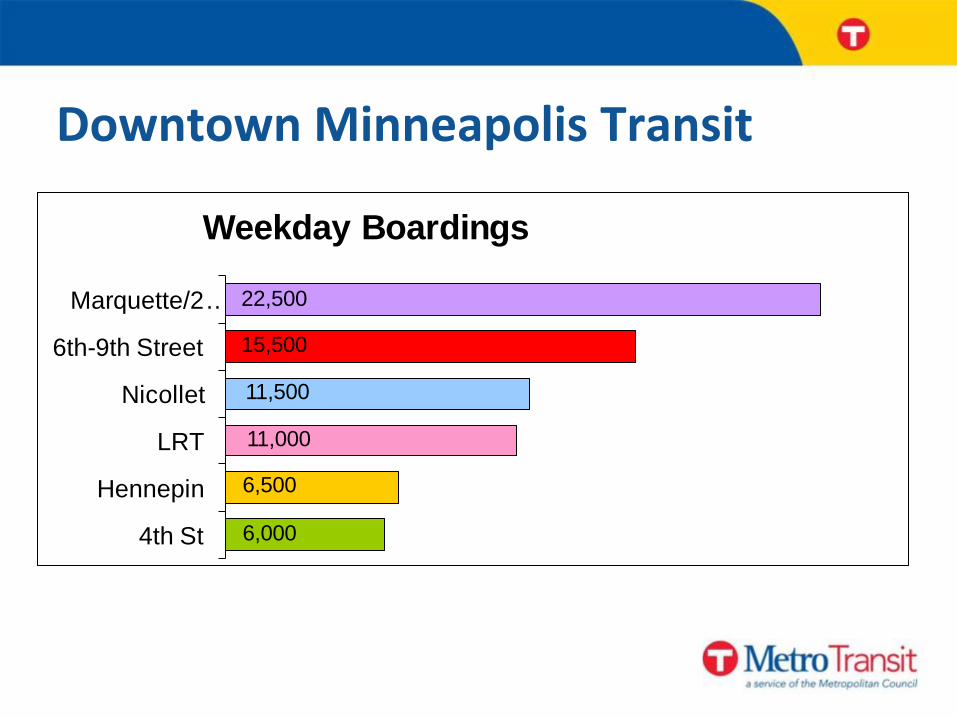
Downtown Minneapolis Transit
22,500
15,500
11,500
11,000
6,500
6,000
Marquette/2…
6th-9th Street
Nicollet
LRT
Hennepin
4th St
Weekday Boardings

• Time and Speed
• Reliability
• Convenience
Transit vs. SOV

• Nearly 300 miles Bus only Shoulder lanes • Up to 15 mph faster than adjacent traffic • Max speed of 35mph
• More than 2,200 daily bus trips

Managed Lanes: The Next Generation – Can We Improve Performance
Urban Partnership Agreement Tolling, Transit, Telecommuting & Technology
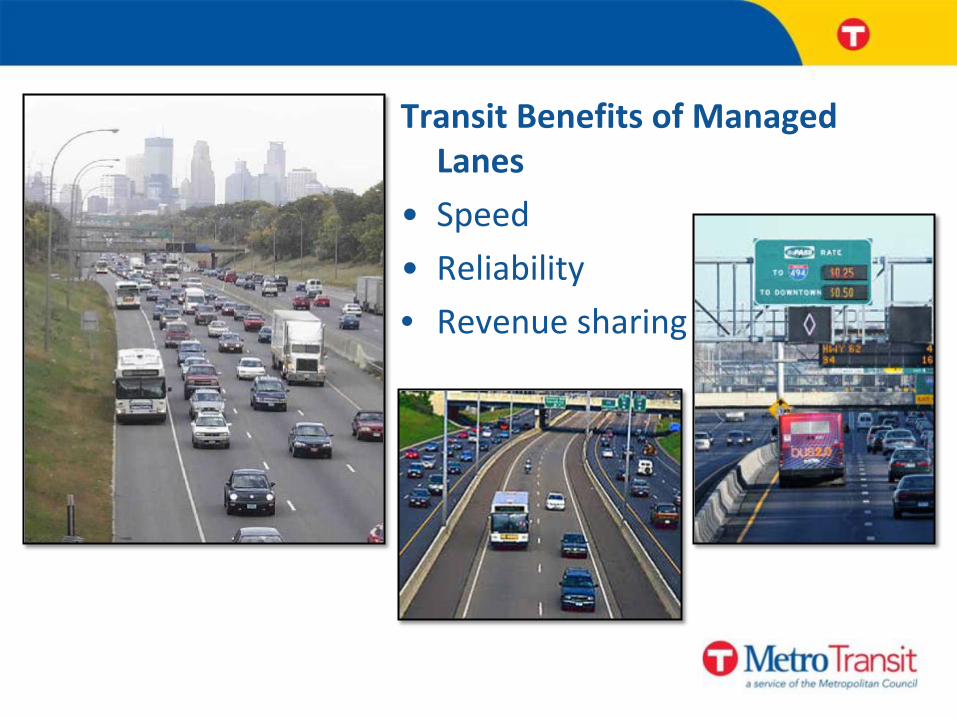
Transit Benefits of Managed Lanes
• Speed • Reliability • Revenue sharing

13
Downtown Minneapolis
Dynamic Shoulder
New HOT Lane
HOV to HOT Lane
NB HOT Extension
I-35W BRT Overview • Express service
– Fast, direct to downtown – Park & ride facilities
• MnPass express lanes • High quality stations • “Station-to-Station”
service – Fast, frequent, all stops, both
directions, all day – Unique vehicles
• Integrated Network
Lake Street
46th Street
66th Street
American Blvd/82nd
98th Street
Burnsville
Lakeville Kenrick
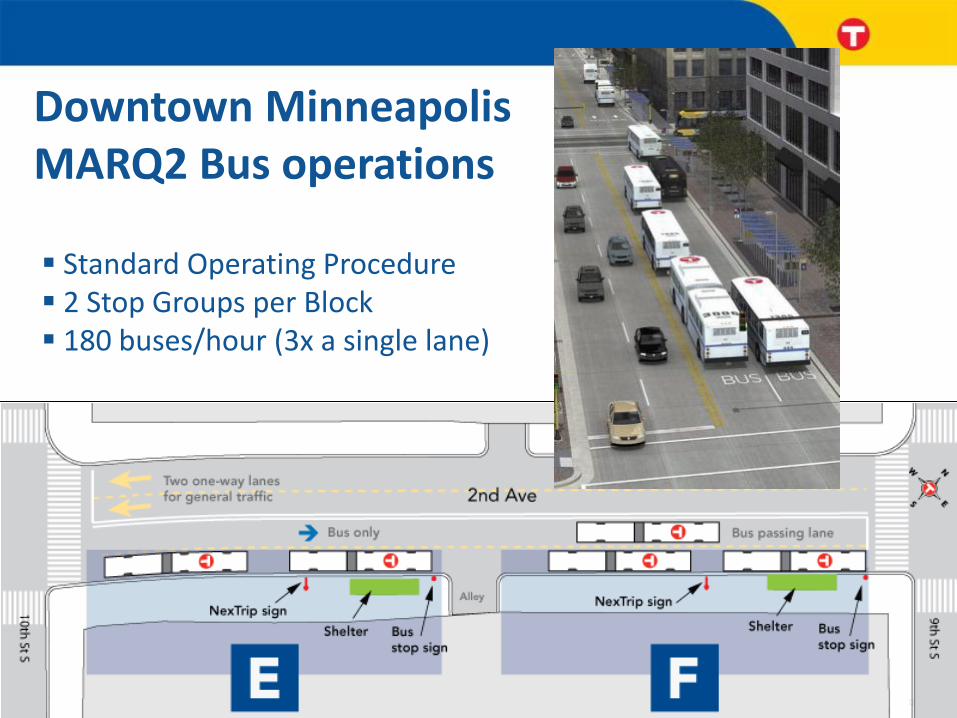
Downtown Minneapolis MARQ2 Bus operations
Standard Operating Procedure 2 Stop Groups per Block 180 buses/hour (3x a single lane)
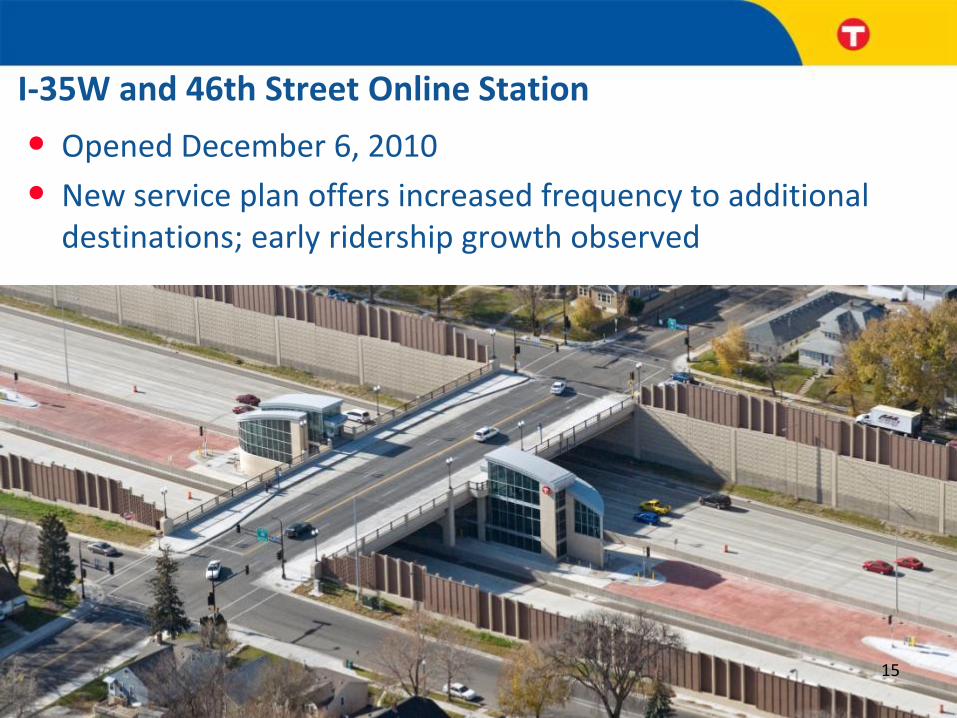
I-35W and 46th Street Online Station • Opened December 6, 2010 • New service plan offers increased frequency to additional
destinations; early ridership growth observed
15
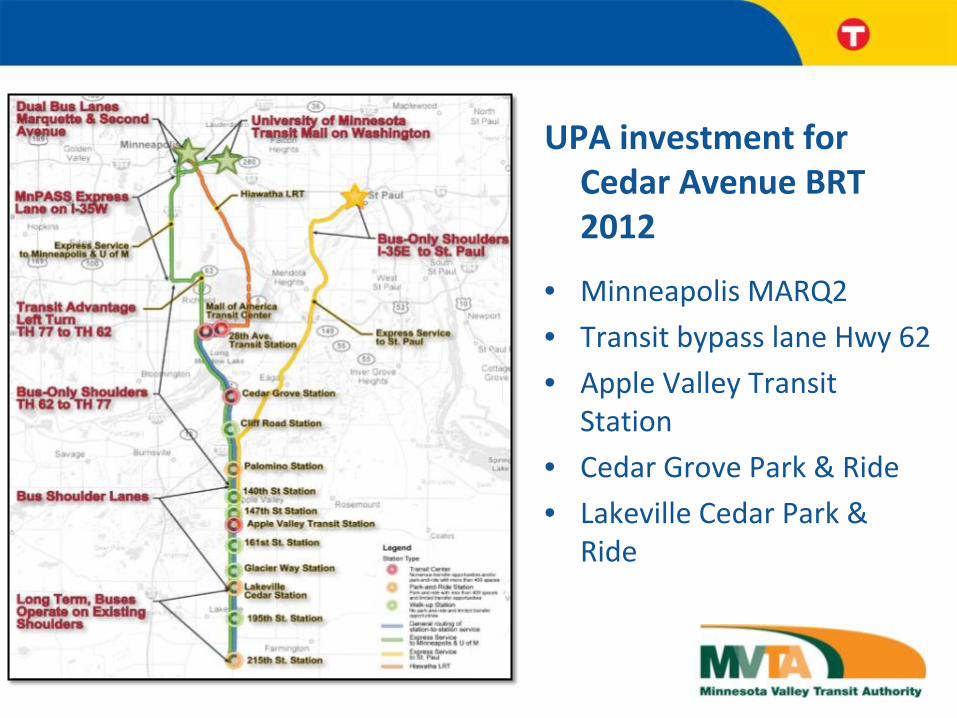
UPA investment for Cedar Avenue BRT 2012
• Minneapolis MARQ2 • Transit bypass lane Hwy 62 • Apple Valley Transit
Station • Cedar Grove Park & Ride • Lakeville Cedar Park &
Ride
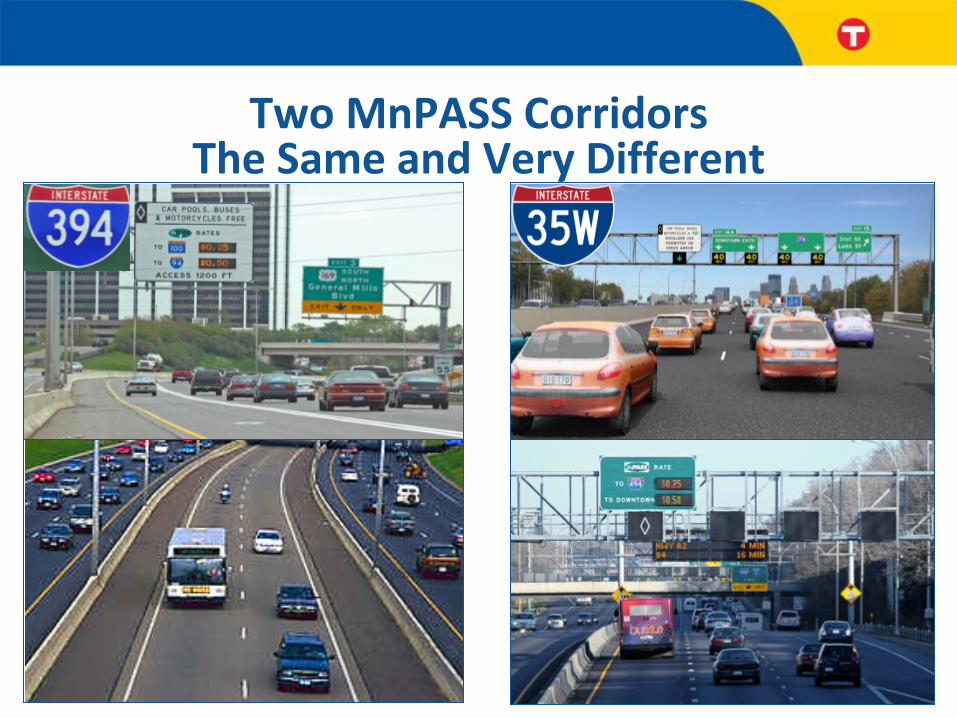
Two MnPASS Corridors The Same and Very Different

Similarities • Brand • Pricing Algorithms • Toll Infrastructure • Hours of Tolling • Carpools and Buses Free • Customer Geography • Customer Utilization • Performance
Differences • Road Design • Access Design
– I-394: 75% Closed Access – I-35W: 75% Open Access
• Active Traffic Management • Signing • Start-up Staging • Performance
I-394 & 35W MnPASS Corridors
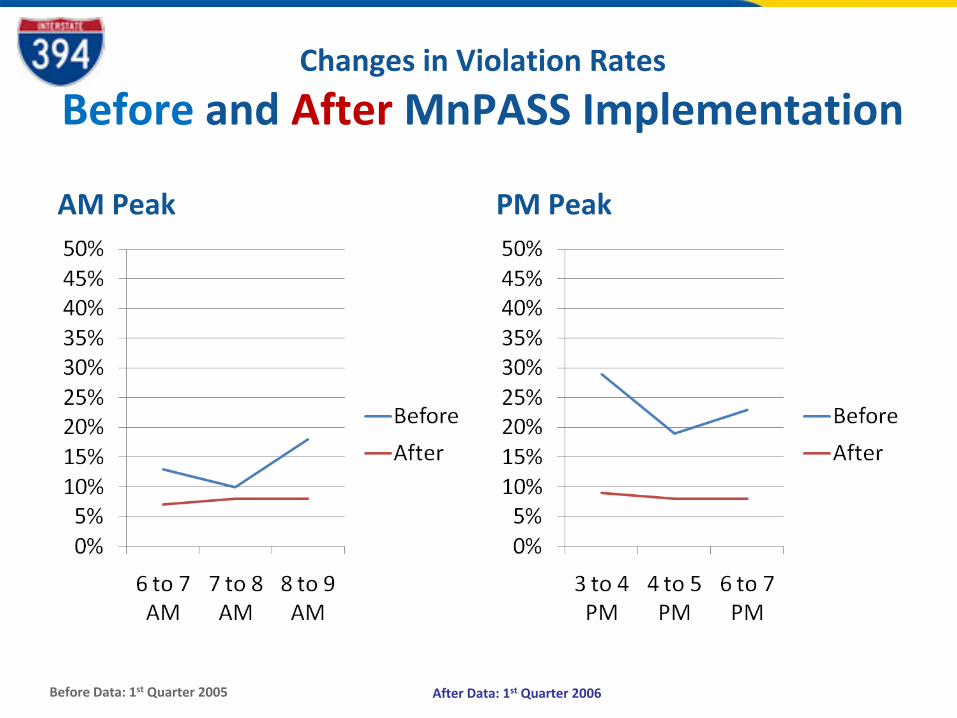
Changes in Violation Rates
Before and After MnPASS Implementation
AM Peak PM Peak
Before Data: 1st Quarter 2005 After Data: 1st Quarter 2006

AM Peak PM Peak
Before Data: 1st Quarter 2009 After Data: 1st Quarter 2010
Changes in Violation Rates: Before and After MnPASS Implementation

MnPASS Users Satisfied with Congestion Pricing • 91% overall satisfaction
• 95% satisfaction with all electronic tolling
• 85% satisfaction with traffic speed in lane
• 76% satisfaction with dynamic pricing
• 66% satisfaction with safety of merging
Data from Survey of 500 MnPASS account holders in 2009

MnPASS Customers Distribution Trips per Account

MNPASS Revenue from I-35W
$0
$10,000
$20,000
$30,000
$40,000
$50,000
$60,000
$70,000
$80,000
$90,000
$100,000
Oct
ober
-09
Nov
embe
r-09
Dece
mbe
r-09
Janu
ary-
10
Febr
uary
-10
Mar
ch-1
0
April
-10
May
-10
June
-10
July
-10
Augu
st-1
0
Sept
embe
r-10
Oct
ober
-10
Nov
embe
r-10
Dece
mbe
r-10
Janu
ary-
11
Febr
uary
-11
Mar
ch-1
1
April
-11
May
-11
June
-11
Oct 2009-June 2011

Comparison of Two Managed Facilities
• 4,800 Active Transponders • 190,000 Trips • $161,000 in Gross Toll Revenue • Average of 40 Trips per
Transponder • Average Toll of $0.85
• 9,000 Active Transponders • 400,000 Trips • $291,000 in Gross Revenue • Average of 44 Trips per
Transponder • Average Toll of $0.73
Bottom line: similar patterns for users on frequency of use, revenue per user, trip lengths, and market areas in the two start-up periods …but slower growth in customer base/revenue on 35W due to phased implementation
First Six Full Months for each MnPASS Facility

MNPASS Customer Origins
I- 394 I-35W
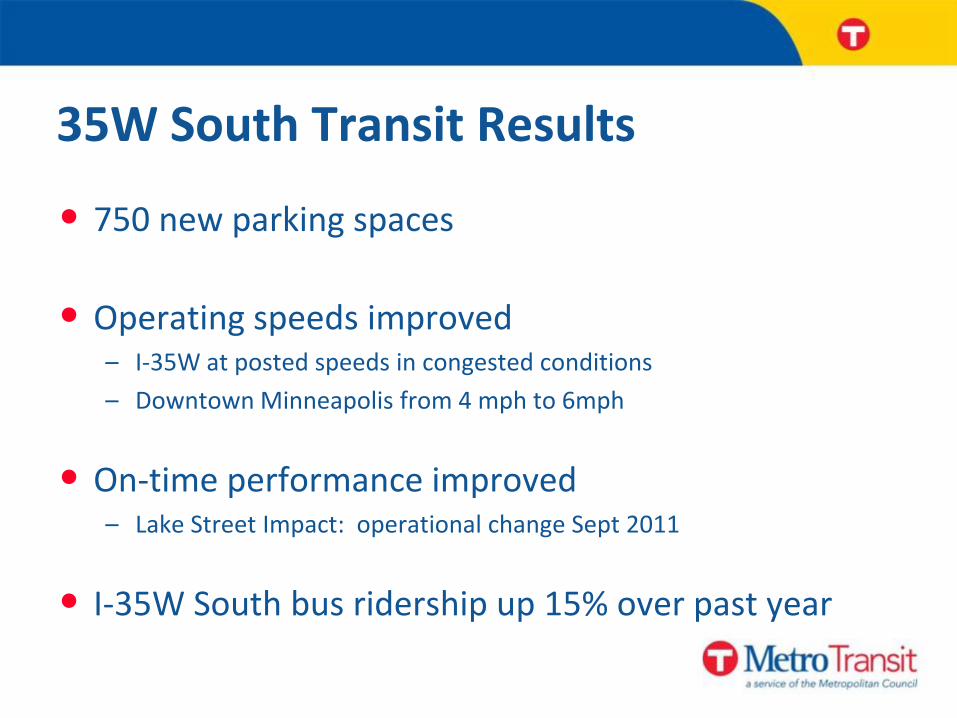
• 750 new parking spaces
• Operating speeds improved – I-35W at posted speeds in congested conditions – Downtown Minneapolis from 4 mph to 6mph
• On-time performance improved – Lake Street Impact: operational change Sept 2011
• I-35W South bus ridership up 15% over past year
35W South Transit Results

Transit Customer Origins

5 Years of MnPASS
• Congestion Pricing Works…in providing congestion free choices to users
• Customers like MnPASS • MnPASS enables transit service improvements,
transit ridership increases • Technology can be used to substantially reduce
roadway capital costs

5 Years of MnPASS
• Revenue (in the Minnesota design): 1. Policies on who pays and who is free (carpools free?) 2. Pricing objective: congestion vs. revenue (different revenue
outcomes for each) 3. Congestion levels – the more congestion a user can avoid the
more they will pay to avoid it 4. Minimum prices – pricing for congestion may result in the price
being set below what users are willing to pay 5. Marketing /Customers Service levels – the system must be
treated like a product. On-going investment in customer service and marketing are required to recruit /retain customers and grow revenue
6. Network effects: revenue increases faster than operating costs as the system expands

NEXT!
1. TH 36: I-35W to I-694
2. I-94: TH 101 to I-494
3. I-35E: I-94 to CR E
4. I-35W: Minneapolis to Blaine
5. I-494: TH 212 to I-94
6. TH 169: TH 101 to I-94
7. TH 77: 141st Street to TH 62
8. I-94: Downtown Minneapolis to Downtown Saint Paul
9. I-394: TH 100 to I-94
10. I-494: TH 212 to MSP Airport
11.TH 212/TH 62: TH 5 to TH 77
12. I-94: Downtown Saint Paul to I-694
13.TH 280: I-94 to I-35W


1
San Diego’s Managed Lanes and Bus Rapid Transit
Integrating Transit with Congestion Pricing and Increasing Congestion Pricing Acceptance

Overview I-15 Express Lanes Project
2
2012
2009
2011

3
In the Beginning - I-15 Express Lanes
Enabling Legislation states: “… remaining revenue shall be used in the I-15 corridor exclusively for (A) the improvement of transit service, including, but not limited to, support for transit operations ... “

I-15 Express Lanes Successes
4
Provides travel choices
Transit, carpooling, FasTrak
Increased use of HOV Lanes Up to 20,000 Avg. Daily Vehicles (~75% HOV, 25% FasTrak users)
FasTrak revenue used to fund I-15 transit service
Generated over $7 million for transit in first decade

Managed Lanes: A Regional Framework
Goals:
• Increase operating efficiency of freeway system versus new freeways
• Increase travel choices – ridesharing, transit, value pricing
• Provide time competitive travel times for car/vanpools and transit
• Extend FasTrak, including funding for BRT services
5

Main Lanes
Managed Lanes
Direct Access Ramps
Access Road
BRT Station
Park- and-Ride
I-15 Express Lanes Design

I-15 Express Lanes Design
7
Barrier Movement
Access Design 3+1 Configuration

I-15 Express Bus Ridership (Peak Period)
8
Route # FY11 FY10 FY09 FY08
Route 810 146,763 128,714 114,387 97,869
Route 820 46,892 50,864 51,200 45,274
Route 850 46,224 47,025 62,866 65,362
Route 860 38,699 43,164 61,844 59,643
Route 880 (March-June, FY09) 17,504 29,936 2,209 N/A
PREMIUM EXPRESS TOTAL 296,082 299,703 292,506 268,148
Route 210 74,866 85,834 88,121 75,947
CORRIDOR TOTAL 370,948 385,537 380,627 344,095

What is BRT?
9
• Premium service
• Trolley/Coaster like experience
• Serves:
• Commuters
• Visitors/Tourists
• Residents
• Shoppers
• High frequency
• All day service
• Premium Fares

BRT Route and Station Plan
10
• Expected to start 2013
• 35 mile long corridor
• 5 freeway BRT stations with DARs
• Service includes:
• All-stop, all day trunk
• Peak period limited stop commuter expresses
Link to I-15 Corridor Express Lanes Project: Bus Rapid Transit Future Service Map: http://www.keepsandiegomoving.com/Libraries/I15-Corridor-doc/I-15_BRT.sflb.ashx

Region’s Future
11
Expanding the Express Lanes concept:
• Improve mobility, move more people
• Relieve congestion
• Enhance transit service
Questions
• I-15 Value Pricing Program: Chris Burke – Program Manager (619) 699-1934 [email protected]
• I-15 Bus Rapid Transit: Barrow Emerson - Senior Regional Planner (619) 699-1961 [email protected]
12