integrated ceos european data server guidelines for...
TRANSCRIPT

ICEDS: Guidelines for Implementing an OGC Web Coverage & Web Map Server Reference: ESYS-RPT-2005487-02, Issue: 30 March 2006, Version 3.
1
Integrated CEOS European Data Server (ICEDS):
Guidelines for Implementing an OGC
Web Coverage & Web Map Server to Serve Global-Scale,
Full-Resolution SRTM and Landsat Data

ICEDS: Guidelines for Implementing an OGC Web Coverage & Web Map Server Reference: ESYS-RPT-2005487-02, Issue: 30 March 2006, Version 3.
2

ICEDS: Guidelines for Implementing an OGC Web Coverage & Web Map Server Reference: ESYS-RPT-2005487-02, Issue: 30 March 2006, Version 3.
3
1 Executive Summary The Integrated CEOS European Data Server (ICEDS) provides on-line access to a global SRTM Digital Elevation Model (DEM) together with Landsat satellite imagery for Africa and Europe and other information layers; all made available through Open Geospatial Consortium (OGC) compliant Web Map Servers (WMS) and Web Coverage Servers (WCS). The work has been carried out by ESYS plc and the Dept. Geomatic Engineering at University College London under funding by the BNSC International Co-operation Programme 2. The project is in support of the activities of the CEOS Working Group on Information Systems and Services (WGISS). Following trial implementations (using software from Cadcorp, Ionic and Deegree) the final implementation uses the University of Minnesota Web Map Server (UMMS) with a client developed from Ionic’s RedSpider software. Some extensions to the functionality in Ionic’s client are explained. This document provides guidelines to assist other data provider organisations set up similar OGC compliant servers and serve, over the Internet, similar continental-scale full-resolution SRTM and Landsat data. SRTM data can be downloaded via ftp at no charge from the USGS and GLCF, however it is not a straightforward matter to process the data further. This document explains how to process tiles of SRTM data to produce hill-shaded RGB images which can then be served with a WMS. It also shows how to host the SRTM data with a WCS in order to serve subsets of the data in 16-bit GeoTIFF format. A similar procedure for processing Landsat data in order to serve band-composite mosaic images with a WMS and single-band, unstretched mosaics with WCS is also provided. The example used here is the processing of a Landsat 5 image mosaic of Africa and Europe, made available to ICEDS by the Cartographic Applications Group at JPL. These data will probably not be available to other data providers but the techniques described can be adapted for other similar datasets. An RGB global mosaic of Landsat 7 data is already available via an OGC WMS at http://onearth.jpl.nasa.gov/. This is cascaded through ICEDS as an additional available map layer.
ICEDS: Guidelines for Implementing an OGC Web Coverage & Web Map Server Reference: ESYS-RPT-2005487-02, Issue: 30 March 2006, Version 3.
4
2 Contents 1 Executive Summary.............................................................................................. 3 2 Contents ............................................................................................................... 4
3 List of Abbreviations ............................................................................................. 6 4 Introduction........................................................................................................... 7
5 MapServer cookbook............................................................................................ 9 5.1 System........................................................................................................... 9
5.2 Installing MapServer ...................................................................................... 9 5.3 Installing MapServer using FWTools............................................................ 10
5.4 Installing MapServer from source ................................................................ 11 5.4.1 Unpacking downloaded tarballs............................................................. 14
5.4.2 GD, LibCURL, LibWWW........................................................................ 14 5.4.3 PROJ 4.4.9, PDFLib Lite 6.0.1 .............................................................. 14
5.4.4 GEOS 2.2.3, JASPER 1.701.0 .............................................................. 15 5.4.5 GDAL 1.3.2............................................................................................ 16
5.4.6 MapServer 4.8.3.................................................................................... 16 5.5 Testing & CGI set-up.................................................................................... 16
6 Data processing.................................................................................................. 18 6.1 SRTM........................................................................................................... 19
6.1.1 Data retrieval ......................................................................................... 20 6.1.2 WMS data preparation........................................................................... 20
6.1.3 WCS data preparation ........................................................................... 24 6.2 SRTM30 and GTOPO30.............................................................................. 25
6.2.1 Data copy .............................................................................................. 25 6.2.2 Hill-shading............................................................................................ 25
6.2.3 Pyramiding............................................................................................. 26 6.2.4 Overviews.............................................................................................. 26
6.3 Landsat mosaics .......................................................................................... 28 6.3.1 Data copy .............................................................................................. 29
6.3.2 GRID conversion ................................................................................... 29 6.3.3 Resampling............................................................................................ 29 6.3.4 Image composition ................................................................................ 30
6.3.5 Overviews.............................................................................................. 30 6.4 MODIS Blue Marble ..................................................................................... 31
ICEDS: Guidelines for Implementing an OGC Web Coverage & Web Map Server Reference: ESYS-RPT-2005487-02, Issue: 30 March 2006, Version 3.
5
6.5 DMSP Night-time Lights............................................................................... 32 6.5.1 Data copy .............................................................................................. 32
6.5.2 GRID conversion ................................................................................... 32 6.5.3 Tiling...................................................................................................... 33
7 Configuring MapServer....................................................................................... 34 7.1 WMS MapFile .............................................................................................. 35
7.2 WCS MapFile............................................................................................... 39 7.3 Testing the service....................................................................................... 42
8 Web Portal Implementation ................................................................................ 45 8.1 5.1 Description of current portal ................................................................... 45
8.2 Data download ............................................................................................. 49 8.3 Layer effects ................................................................................................ 50
8.4 Layer styles.................................................................................................. 51 8.5 Temporal Selection ...................................................................................... 52
8.6 Gazetteer ..................................................................................................... 53 8.7 Connection from other OGC clients ............................................................. 55
8.8 Google Earth................................................................................................ 55 8.9 Image formats .............................................................................................. 57
9 Conclusions ........................................................................................................ 58 Appendix A. ICEDS Team Members ..................................................................... 59
Appendix B. Other Servers and Processing Methods............................................ 60 Appendix C. MapServer 4.4.1 cookbook ............................................................... 62
9.1.1 GD 2.0.28 .............................................................................................. 64 9.1.2 LibCURL 7.10.7, LibWWW 5.2.8 and PROJ.4 4.4.8.............................. 65
9.1.3 GDAL..................................................................................................... 66 9.1.4 MapServer............................................................................................. 66
Appendix D. SRTM water masking using GSHHS................................................. 69 D.1. Masking the coastal tiles ............................................................................ 71
Appendix E. SRTM v1 “Island” tiles list.................................................................. 74

ICEDS: Guidelines for Implementing an OGC Web Coverage & Web Map Server Reference: ESYS-RPT-2005487-02, Issue: 30 March 2006, Version 3.
6
3 List of Abbreviations CEOS Committee on Earth Observation Satellites CGI Common Gateway Interface CLASP CEOS Landsat and SRTM Project DEM Digital Elevation Model DMSP Defense Meteorological Satellite Program ESA European Space Agency GAF Geographic Application Framework GIF Graphics Interchange Format GFS Global Forecast System GSHHS Global Self-consistent Hierarchical High-resolution
Shoreline GLCF Global Land Cover Facility HTML Hypertext Markup Language HTTP Hypertext Transport Protocol ICEDS Integrated CEOS European Data Server ICP International Co-operation Programme JPEG Joint Photographic Experts Group JPL Jet Propulsion Laboratory MODIS Moderate Resolution Imaging Spectroradiometer NASA National Aeronautics and Space Administration NCEP National Centres for Environmental Prediction NOAA National Oceanic and Atmospheric Administration OGC Open Geospatial Consortium PNG Portable Network Graphics RAM Random Access Memory RAID Redundant Array of Independent Disks RPM Red Hat package manager SRTM Shuttle Radar Topography Mission TIFF Tagged Image File Format TM Thematic Mapper UMMS University of Minnesota MapServer URL Uniform Resource Locator USGS United States Geological Survey WCS Web Coverage Service WGISS Working Group on Information Systems and Services WFS Web Feature Service WMS Web Map Service WWW World-Wide Web

ICEDS: Guidelines for Implementing an OGC Web Coverage & Web Map Server Reference: ESYS-RPT-2005487-02, Issue: 30 March 2006, Version 3.
7
4 Introduction ESYS plc and the Dept. Geomatic Engineering at University College London (UCL) have been funded by the British National Space Centre (BNSC) to develop a web map service to serve geographic data derived from remote sensing datasets. Funding was provided as part of the BNSC International Co-operation Programme 2 (ICP-2). Particular aims of the project were to:
1. use Open Geospatial Consortium1 (OGC) technologies for map and data serving;
2. serve datasets for Europe and Africa, particularly Landsat TM and Shuttle Radar Topography Mission (SRTM) digital elevation model (DEM) data (since extended globally);
3. provide a website giving access to the served data; 4. provide software scripts, etc., and a document reporting the data processing
and software set-up methods developed during the project. The project name is ICEDS – the Integrated CEOS European Data Server. ICEDS was inspired in particular by the Committee on Earth Observing Satellites (CEOS) CEOS Landsat and SRTM Project (CLASP) proposal (now part of the EO Data Portal Task Team). An express intention of ICEDS (aim 4 in the list above) was therefore that the solution developed by ESYS and UCL should be redistributable, for example, to other CEOS members. This was taken to mean not only software scripts but also the methods developed by the project team to prepare the data and set up the server. In order to be compatible with aim 4, it was also felt that the use of Open Source, or at least “free-of-cost” software for the Web GIS serving was an essential component. After an initial survey of the Web GIS packages available at the time2, the ICEDS team decided to use the Deegree package, a free software initiative founded by the GIS and Remote Sensing unit of the Department of Geography, University of Bonn3, and lat/lon4. However the Red Spider web mapping software suite was also provided by IONIC Software – this is a commercial web mapping package but was provided pro bono by IONIC for this project and has been used in parallel to investigate the possibilities and limitations opened up by using a commercial package. Towards the end of the first phase of project development5, the map server software was changed and in the final form ICEDS is using the University of Minnesota MapServer6 package to serve the Landsat mosaics and SRTM DEM data through both WMS and WCS protocols. This switch was made because the UMMS package had matured to provide a more stable, fully featured and flexible package than Deegree, especially in its WCS capabilitites and its ability to serve GeoTIFF
1 Previously named the OpenGIS Consortium.
2 February/March 2004
3 http://www.giub.uni-bonn.de/gisfe
4 http://www.lat-lon.de/
5 September 2004
6 http://mapserver.gis.umn.edu/

ICEDS: Guidelines for Implementing an OGC Web Coverage & Web Map Server Reference: ESYS-RPT-2005487-02, Issue: 30 March 2006, Version 3.
8
formatted datasets. (This is a rapidly developing area, so readers would be advised to make their own requirements analysis of available packages. These guidelines reflect our experience at the time of the project). In developing the scope of the project with BNSC, and their representative at QinetiQ, it was noted that a number of servers had become or were due to be available serving geographic maps through the OGC Web Map Server (WMS) technology, for example, the JPL OnEarth7 service. A WMS is designed to serve rendered maps as opposed to data. An objective within aim 1 of ICEDS (above) was therefore to look not only at WMS serving but to develop a Web Coverage Service (WCS), capable of serving extracts of coverages (here, 2D geographic raster data, such as 8-bit images or 16-bit DEMs) either for download or for application in a further processing chain. This document forms part of aim 4, and documents the methods used to prepare data for ICEDS and how the server components were set up to serve the data and maps. The report principally forms a ‘cookbook’, describing how a similar service can be set up using the UMMS package. It also describes the use of various utility scripts, developed during the project and available from the ICEDS website, which can be used to facilitate the data preparation. Also discussed as appendices are the ICEDS Web GIS solutions developed with IONIC’s commercial software as far as this solution was explored during the project. The report does not aim to describe in depth the OGC web services. In the first instance, readers are directed towards the OGC web pages and the particular service implementation specifications8. The ICEDS service itself, the supporting scripts and copies of this document can be found at http://iceds.ge.ucl.ac.uk.
7 http://onearth.jpl.nasa.gov
8 Web Map Service spec.: http://www.opengeospatial.org/docs/01-068r3.pdf
Web Coverage Service spec.: http://www.opengeospatial.org/docs/03-065r6.pdf

ICEDS: Guidelines for Implementing an OGC Web Coverage & Web Map Server Reference: ESYS-RPT-2005487-02, Issue: 30 March 2006, Version 3.
9
5 MapServer cookbook During the first phase of the project, several prototypes of ICEDS were assembled. The first two demonstration servers were based on Cadcorp’s9 "SisIsapi.dll" simple Web Map Server and IONIC’s RedSpider Web10 software, both commercial packages. The last two generations of the prototype were implemented using open-source software: the third was built using the Deegree11 map server and the fourth using the University of Minnesota MapServer12. The ICEDS team settled on the UMMS as the final server software due to its stability and more complete support of WMS and WCS and easier configuration than compared with the versions of Deegree at the time of development (September 2004). UMMS has recently been adopted by the Open Source Geospatial (OSGeo) Foundation13. This chapter demonstrates how to build a WMS/WCS using MapServer. While some of the sections, particularly those relating to the Landsat image mosaics, are relatively specific to particular datasets used in the ICEDS project, it is hoped that these sections will still be instructive in showing the general methodologies and considerations in preparing a map server. This version of the cookbook relates to ICEDS after a system upgrade carried out in June 2006 and presents two alternatives for installing MapServer. A third option is presented in Appendix C – this last is the original configuration of ICEDS.
5.1 System
ICEDS is hosted on a dual Athlon MP 2400+ Intel PC system with 2Gb of RAM. The machine is configured as a RAID server with 1.7TB of disk storage. The web and map software services are therefore collocated on the machine with the data. The current version of Linux in use on ICEDS is Red Hat Enterprise Linux 4 (RHEL4). There are many different distributions of Linux, each with its own advantages and idiosyncrasies. Our reason for choosing RHEL is the support that Red Hat offers to subscribers to this product and the stability of the distribution. A similar Linux distribution, produced by Red Hat as a proving ground for RHEL and available without subscription, is Fedora Core. Installation of the Linux system is felt to be beyond the scope of this document. The Web server on ICEDS is Apache 2.0.52, the version installed with RHEL4.
5.2 Installing MapServer
MapServer is a stand-alone executable that can be used or compiled on several operating systems. In this chapter it is assumed that the package will be installed on
9 http://www.cadcorp.com/
10 http://www.ionicsoft.com/
11 http://deegree.sourceforge.net/
12 http://mapserver.gis.umn.edu/
13 http://www.osgeo.org/mapserver

ICEDS: Guidelines for Implementing an OGC Web Coverage & Web Map Server Reference: ESYS-RPT-2005487-02, Issue: 30 March 2006, Version 3.
10
a Linux server running the Apache HTTP Server14, similar to the ICEDS set-up. The MapServer application is called by the Web server through the Common Gateway Interface (CGI) mechanism. For the current version of ICEDS, two different methods have been successfully tested to install MapServer. The first is to use the FWTools binary kit which is maintained by Frank Warmerdam. The second is to download the MapServer source and, having installed any required libraries, compile the source to produce the MapServer exectuable. Each method has its advantages and disadvantages. These are discussed below, after the details of each installation. The principle difference is that if one uses the FWTools version, one gets a fixed, executable version of MapServer. Hence one needs to be sure that all the capabilities your system requires have been included in the MapServer executable. In compiling MapServer from source, there is more work to do to install the necessary libraries but one gets to make specific decisions about which web mapping functionality to include (and exclude) from the executable.
5.3 Installing MapServer using FWTools
FWTools is “a set of Open Source GIS binaries for Windows (win32) and Linux (x86) systems”15. FWTools aims to capture a binary executable of MapServer and all the additional library components (for example FWTools includes OpenEV, GDAL, MapServer, PROJ.4 and OGDI, see 2.4 for more details) that are needed for MapServer to run on a typical system. At the time of writing (October 2007), the current FWTools version is 1.3.7. The version tested for ICEDS was 1.0.1. Previous versions of the kit are available for download from the FWTools site as well as the current version. Installation on Linux is very straightforward. Since it’s a binary kit, it’s simply a matter of expanding the downloaded archive, running an installation script, and setting up the shell path. Details from the FWTools installation page: • “Just unpack, run the install.sh script in the new directory, and then add the
bin_safe directory to your path, eg.
• tar xzvf FWTools-linux-0.9.5.tar.gz • cd FWTools-linux-0.9.5 • ./install.sh
• If you use Bash as your shell add the following to your startup script (ie.
~/.bash_profile): • PATH=$PATH:$HOME/FWTools/bin_safe • or if you use csh or tcsh as your shell add the following to your .cshrc:
14
http://httpd.apache.org/ 15
http://fwtools.maptools.org/
ICEDS: Guidelines for Implementing an OGC Web Coverage & Web Map Server Reference: ESYS-RPT-2005487-02, Issue: 30 March 2006, Version 3.
11
• setenv PATH $PATH:$HOME/FWTools/bin_safe”
The FWTools installation contains two executables directories: bin and bin_safe. The bin directory contains the actual executables – the MapServer mapserv executable can be found in this directory. The bin_safe directory contains a series of shell scripts which ensure the libraries in the FWTools kit are correctly referenced in the shell environment variables. The bin_safe script version of mapserv should be used in preference to the actual executable to ensure that mapserv executes correctly. Note that if the mapserv script is accessed from the web server’s /var/www/cgi-bin directory (see section 2.5 for more on this) by using a symbolic link or a copy with a name other than mapserv (e.g. ‘wms’), the mapserv script will need editing to replace the final line of code with the following:
• $FWTOOLS_HOME/bin/mapserv "$@" # new line
• #$FWTOOLS_HOME/bin/`basename $TARGET` "$@" # old line, commented out otherwise the substitution of basename will search for wms in the bin directory.
5.4 Installing MapServer from source
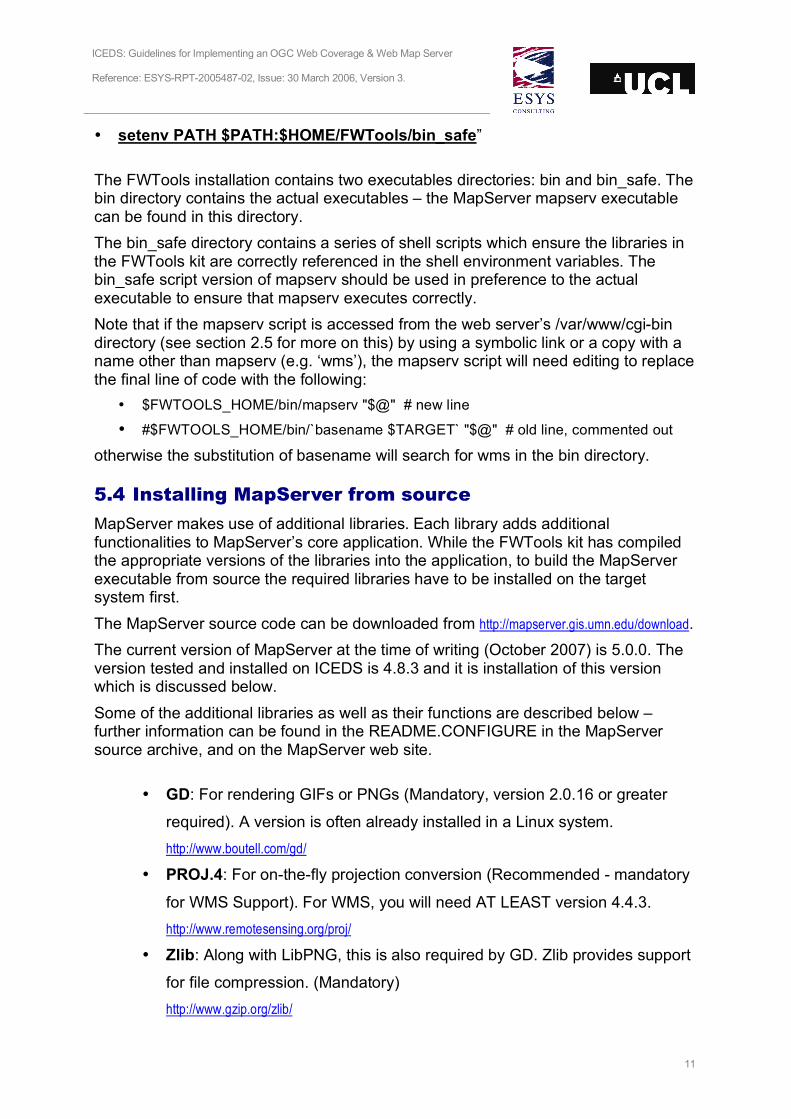
MapServer makes use of additional libraries. Each library adds additional functionalities to MapServer’s core application. While the FWTools kit has compiled the appropriate versions of the libraries into the application, to build the MapServer executable from source the required libraries have to be installed on the target system first. The MapServer source code can be downloaded from http://mapserver.gis.umn.edu/download. The current version of MapServer at the time of writing (October 2007) is 5.0.0. The version tested and installed on ICEDS is 4.8.3 and it is installation of this version which is discussed below. Some of the additional libraries as well as their functions are described below – further information can be found in the README.CONFIGURE in the MapServer source archive, and on the MapServer web site.
• GD: For rendering GIFs or PNGs (Mandatory, version 2.0.16 or greater
required). A version is often already installed in a Linux system. http://www.boutell.com/gd/
• PROJ.4: For on-the-fly projection conversion (Recommended - mandatory
for WMS Support). For WMS, you will need AT LEAST version 4.4.3. http://www.remotesensing.org/proj/
• Zlib: Along with LibPNG, this is also required by GD. Zlib provides support
for file compression. (Mandatory) http://www.gzip.org/zlib/
ICEDS: Guidelines for Implementing an OGC Web Coverage & Web Map Server Reference: ESYS-RPT-2005487-02, Issue: 30 March 2006, Version 3.
12
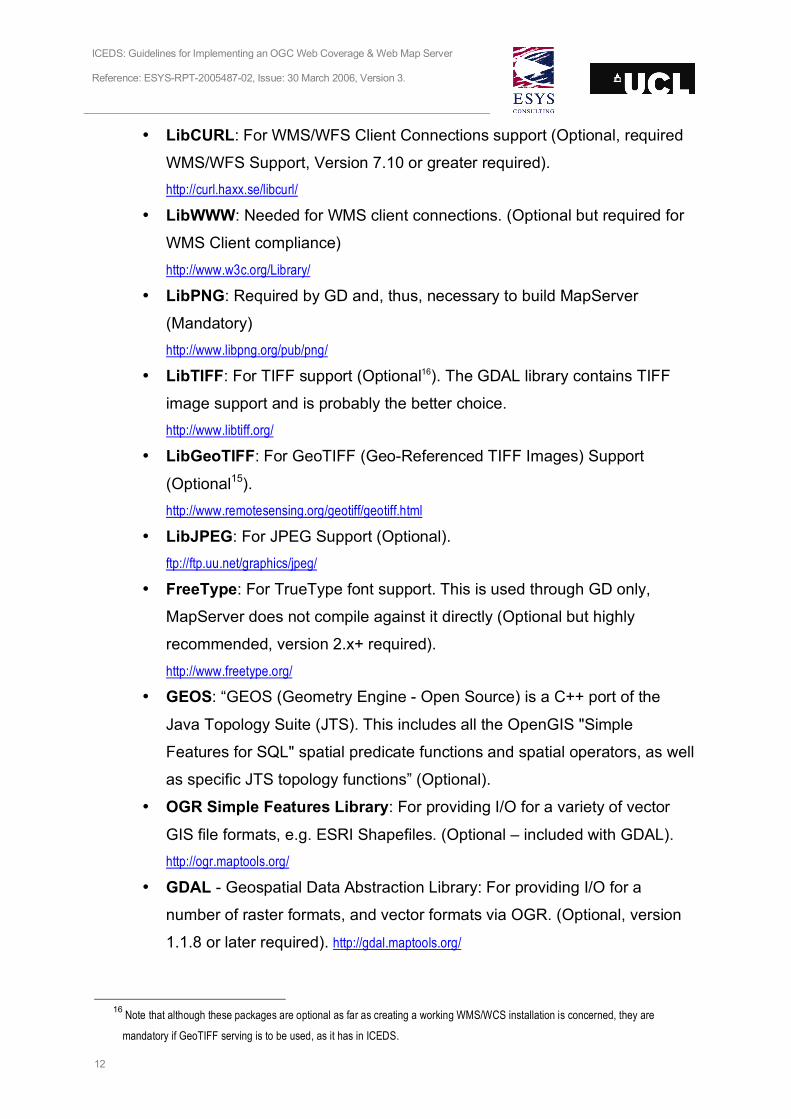
• LibCURL: For WMS/WFS Client Connections support (Optional, required
WMS/WFS Support, Version 7.10 or greater required). http://curl.haxx.se/libcurl/
• LibWWW: Needed for WMS client connections. (Optional but required for
WMS Client compliance) http://www.w3c.org/Library/
• LibPNG: Required by GD and, thus, necessary to build MapServer
(Mandatory) http://www.libpng.org/pub/png/
• LibTIFF: For TIFF support (Optional16). The GDAL library contains TIFF
image support and is probably the better choice. http://www.libtiff.org/
• LibGeoTIFF: For GeoTIFF (Geo-Referenced TIFF Images) Support
(Optional15). http://www.remotesensing.org/geotiff/geotiff.html
• LibJPEG: For JPEG Support (Optional). ftp://ftp.uu.net/graphics/jpeg/
• FreeType: For TrueType font support. This is used through GD only,
MapServer does not compile against it directly (Optional but highly
recommended, version 2.x+ required). http://www.freetype.org/
• GEOS: “GEOS (Geometry Engine - Open Source) is a C++ port of the
Java Topology Suite (JTS). This includes all the OpenGIS "Simple
Features for SQL" spatial predicate functions and spatial operators, as well
as specific JTS topology functions” (Optional).
• OGR Simple Features Library: For providing I/O for a variety of vector
GIS file formats, e.g. ESRI Shapefiles. (Optional – included with GDAL). http://ogr.maptools.org/
• GDAL - Geospatial Data Abstraction Library: For providing I/O for a
number of raster formats, and vector formats via OGR. (Optional, version
1.1.8 or later required). http://gdal.maptools.org/
16
Note that although these packages are optional as far as creating a working WMS/WCS installation is concerned, they are
mandatory if GeoTIFF serving is to be used, as it has in ICEDS.
ICEDS: Guidelines for Implementing an OGC Web Coverage & Web Map Server Reference: ESYS-RPT-2005487-02, Issue: 30 March 2006, Version 3.
13
• MING: For Macromedia Flash output support (Optional, version 0.2a or
greater required). http://ming.sourceforge.net/
• JASPER: For JPEG2000 support. (Optional). http://www.ece.uvic.ca/~mdadams/jasper/
• PDFLib: For PDF output support. (Optional, version 4.0.3 or greater
required). Note: There are licensing restrictions as this is not an entirely
open-source product. If you qualify you may however use PDFlib Lite free
of charge. http://www.pdflib.com/products/pdflib/index.html
Before compiling and installing the MapServer source code, one needs to download, compile and install the above packages according to the user’s system requirements. One should be careful and check if these libraries are already installed on your system. If so, the currently installed versions should be checked and upgraded as required. If one does not have much experience with compiling and installing source code, the use of RPM versions of the libraries (when available) is recommended. Despite this not being so flexible, RPM packages are much simpler to install and problems related to dependencies and conflicts of versions are dealt with automatically. In many Linux distributions running in graphical mode there are wizard interfaces that control the installation of such RPM packages. RPM packages come in versions suited to different Linux distributions, and it’s important to get the appropriate version for one’s system. For RHEL4, packages can be used that are specifically aimed at RHEL4. Alternatively though, Fedora Core 3 packages can be used (Fedora is Red Hat’s open source distribution that is used as a proving ground between major RHEL releases, hence Fedora Core 3 lead to the RHEL4 release). Most RPMs can be found through the service http://www.rpmfind.net. Some of the more esoteric GIS packages, though, can’t be found through RPMFind. A useful source for many such RPMs is the Mapping Hacks website maintained by Schuyler Erle, Rich Gibson, and Jo Walsh: http://mappinghacks.com/rpm/. In the ICEDS specific case, support for the Web Map and Coverage Servers as well as the Web Map Client (to cascade other WMS) was a requirement. For development purposes, PDF and JPEG2000 output functionality was desired, and as well as to be able to use PHP Mapscript. Mapscript is a means to provide script-based control of MapServer through Web server scripting languages such as Python and PHP, allowing MapServer functionality to be included in server-side scripted Web applications. A number of documents relating to Mapscript can be found in the MapServer documentation17. The PHP version of Mapscript derives from a different source than the other versions, e.g. for Python.
17
http://mapserver.gis.umn.edu/docs

ICEDS: Guidelines for Implementing an OGC Web Coverage & Web Map Server Reference: ESYS-RPT-2005487-02, Issue: 30 March 2006, Version 3.
14
PHP Mapscript functionality is built by creating a shared object library (.so) when the main MapServer executable is built. The library then forms an extra module to be loaded by the PHP system, providing MapServer functoinality. A number of additional system libraries were required for this purpose – these are additionally discussed in section 2.4.6.
5.4.1 Unpacking downloaded tarballs
In order to start compiling the code, a project folder (in a standard user account) should be created and all downloaded libraries should be copied into it. Some of the files were obtained in a “tarball” compressed format, so these need to be uncompressed by typing the following command on the prompt18, where ‘nameofile.tar.gz’ is substituted for the name of the downloaded tarball:
tar -xzvf nameofile.tar.gz This instruction creates a directory with the same name as the compressed file and extracts all the uncompressed files into the directory. The original tarball file can then be safely deleted. At this stage one should have a project folder and one sub-folder underneath it for each extracted library. The following sub-sections deal with the compilation of the various packages, particularly following the experience of setting up the ICEDS server and are aimed at less experienced Linux system administrators.
5.4.2 GD, LibCURL, LibWWW
The RHEL 4 distribution of Linux used for this version of ICEDS already contained the GD library (version 2.0.28, from the gd RPM package) as part of the installation. The development package, gd-devel, was also included. Hence so action was needed as the version of GD was up to date enough. Similarly LibCURL 7.12.1 and LibWWW 5.4.0 were already part of the RHEL installation (from the curl and w3c-libwww RPM packages respectively).
5.4.3 PROJ 4.4.9, PDFLib Lite 6.0.1
These libraries were installed using the RPM command. A GUI was not used since ICEDS was being accessed by a remote shell only. Below are listed the URLs for the RPM files used for the ICEDS RHEL4 system. Please note that different Linux distributions will probably need different RPM files.
• PROJ.419: http://mappinghacks.com/rpm/fedora/3/proj-4.4.9-mh4.i686.rpm http://mappinghacks.com/rpm/fedora/3/proj-devel-4.4.9-mh4.i686.rpm
• PDFLib Lite19: ftp://194.199.20.114/linux/dag/redhat/el4/en/i386/dag/RPMS/pdflib-6.0.1-1.2.el4.rf.i386.rpm
18
Note that unless otherwise noted, the commands were all executed using the Bourne-Again Shell (bash). 19
Note, PROJ RPMs can be found elsewhere. However the Mapping Hacks RPMs are more complete, containing for example the
EPSG SRS codes required for most uses of MapServer. PROJ can also be found as source and can easily be compiled for a
target Linux distribution.

ICEDS: Guidelines for Implementing an OGC Web Coverage & Web Map Server Reference: ESYS-RPT-2005487-02, Issue: 30 March 2006, Version 3.
15
The commands related to RPM libraries are listed below (see also the Linux man pages for rpm):
rpm -i package_name installs a package rpm -U package_name upgrades a package rpm -e package_name deletes a package rpm -qpR package_name lists packages on which this package depends rpm -qR package_name lists packages on which installed package depends rpm -q package_name prints package name, version, and release numb rpm -qa | less lists all the installed packages in the current system rpm -qa | grep –I PROJ.4 lists all the installed packages, matching PROJ.4
5.4.4 GEOS 2.2.3, JASPER 1.701.0
These two libraries were downloaded as source-code versions, compiled and added to the system libraries. The GEOS library was downloaded from http://geos.refractions.net/ as a source tarball and compiled to provide additional vector processing capability. The JASPER library was downloaded from http://www.ece.uvic.ca/~mdadams/jasper/. The standard sequence for compiling & linking a library from source is to use the the configure script provided with the source to set various options and then use the Linux make utility (and associated compilers, etc.) to compile, link and install the library. No specific options were needed for either GEOS or JASPER, so a standard sequence was used. The following command sequence was executed twice, once for the GEOS library, once for JASPER. After moving to the folder where the source file archive has been extracted, the following three commands were used:
• ./configure • make • make install
The “make install” command must be executed as root (the Linux superuser account) and installs the library into a standard system library directory, /usr/local/lib in this case. By default on RHEL 4, /usr/local/lib is not part of the standard library path that is searched when an application calls a library’s contents. To rectify this, create (again, as root) a file /etc/ld.so.conf.d/usr-local.conf containing the following line of text:
• /usr/local/lib Either log out and back in, or issue the rehash command in each shell to take account of this change.
ICEDS: Guidelines for Implementing an OGC Web Coverage & Web Map Server Reference: ESYS-RPT-2005487-02, Issue: 30 March 2006, Version 3.
16
5.4.5 GDAL 1.3.2
This was the final package to be compiled before compiling MapServer because it depends on at least one other package (PROJ.4). The source can be downloaded from http://gdal.maptools.org/download.html. RPMs are available from Mapping Hacks but compilation guarantees that the correct local libraries are linked and more importantly that the desired image formats are supported by GDAL. In this case, we set various options using the configure step to indicate to GDAL which formats we wish to support, and, where necessary, the locations of the appropriate libraries. To see the options available through configure, use the command:
• ./configure --help For ICEDS, the following configuration and make steps were used:
• ./configure --with-libz=internal --with-png=internal --with-libtiff=internal --with-geotiff=internal --with-jpeg=internal --with-gif=internal --with-jasper=/usr/lib --with-geos
• make • make install (again, as root user)
When installation is complete, a summary is displayed where the user can check the data types supported by the GDAL installation. Check that the final list matches your configure options.
5.4.6 MapServer 4.8.3
After compiling and installing all the dependent libraries, MapServer can finally be compiled. Once again,./configure --help lists the available options. Please note that the parameters used in this specific case relate directly to the required specifications for the ICEDS server (WMS and WCS support, WMS cascading). There are likely to be differences on other installations, e.g. different path for the Apache directory (the with-httpd path)
• ./configure --enable-debug --with-freetype --with-zlib --with-gd --with-proj --with-gdal --with-pdf --with-eppl --with-wcs --with-wmsclient --with-wfs --with-wfsclient --with-ogr --with-httpd=/usr/sbin/httpd --enable-runpath
• make The make command generates a single file called “mapserv” that is the CGI application itself.
5.5 Testing & CGI set-up
To test the executable and check the supported protocols and formats one can issue the following command:
• ./mapserv –v This test, when performed using the MapServer executable from the FWTools package gives the following result:
MapServer version 4.9 OUTPUT=GIF OUTPUT=PNG OUTPUT=JPEG OUTPUT=WBMP OUTPUT=SWF OUTPUT=SVG SUPPORTS=PROJ SUPPORTS=FREETYPE
ICEDS: Guidelines for Implementing an OGC Web Coverage & Web Map Server Reference: ESYS-RPT-2005487-02, Issue: 30 March 2006, Version 3.
17
SUPPORTS=WMS_SERVER SUPPORTS=WMS_CLIENT SUPPORTS=WFS_SERVER SUPPORTS=WFS_CLIENT SUPPORTS=WCS_SERVER SUPPORTS=GEOS INPUT=EPPL7 INPUT=POSTGIS INPUT=OGR INPUT=GDAL INPUT=SHAPEFILE DEBUG=MSDEBUG
The compiled version of MapServer, gives the following result: MapServer version 4.8.3 OUTPUT=GIF OUTPUT=PNG OUTPUT=JPEG OUTPUT=WBMP OUTPUT=PDF OUTPUT=SVG SUPPORTS=PROJ SUPPORTS=FREETYPE SUPPORTS=WMS_SERVER SUPPORTS=WMS_CLIENT SUPPORTS=WFS_SERVER SUPPORTS=WFS_CLIENT SUPPORTS=WCS_SERVER INPUT=EPPL7 INPUT=OGR INPUT=GDAL INPUT=SHAPEFILE DEBUG=MSDEBUG
To finish the map server installation, the mapserv executable needs to be executable from the “cgi-bin” directory of the Apache HTTP server in order to be accessible on-line. The mapserv executable can be copied to two different names in the cgi-bin/ directory, “wms” and “wcs”. This name forms part of the URL for map requests and it is felt that this gives more readable URLs. Ensure that the files have execute permission for all users, so that the Web server is able to run the program, e.g.:
• chmod 755 wms gives the wms file execute & read permissions for all, but write permission only for the owner. Alternatively, symbolic links can be set up from these filenames, “wms” and “wcs”, back to the mapserv executable or script in its original location. Note the caveat in section 2.3 about editing the mapserv script produced by FWTools if symbolic links are used.
ICEDS: Guidelines for Implementing an OGC Web Coverage & Web Map Server Reference: ESYS-RPT-2005487-02, Issue: 30 March 2006, Version 3.
18
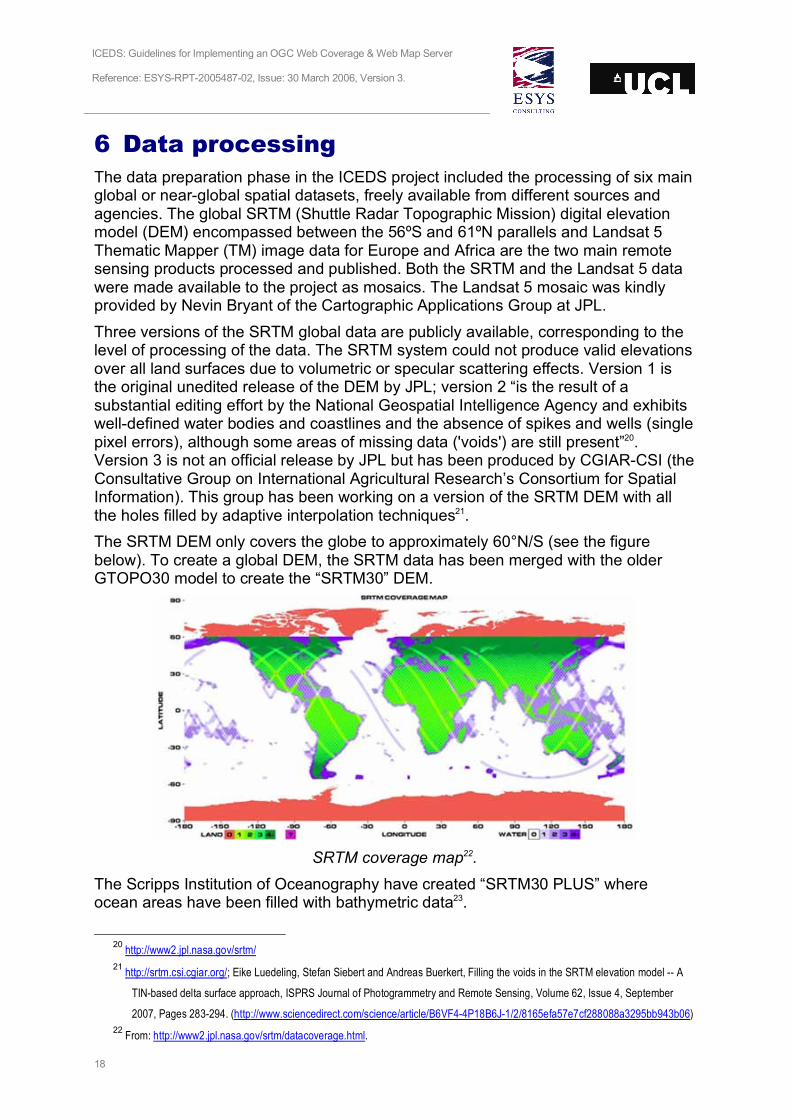
6 Data processing The data preparation phase in the ICEDS project included the processing of six main global or near-global spatial datasets, freely available from different sources and agencies. The global SRTM (Shuttle Radar Topographic Mission) digital elevation model (DEM) encompassed between the 56ºS and 61ºN parallels and Landsat 5 Thematic Mapper (TM) image data for Europe and Africa are the two main remote sensing products processed and published. Both the SRTM and the Landsat 5 data were made available to the project as mosaics. The Landsat 5 mosaic was kindly provided by Nevin Bryant of the Cartographic Applications Group at JPL. Three versions of the SRTM global data are publicly available, corresponding to the level of processing of the data. The SRTM system could not produce valid elevations over all land surfaces due to volumetric or specular scattering effects. Version 1 is the original unedited release of the DEM by JPL; version 2 “is the result of a substantial editing effort by the National Geospatial Intelligence Agency and exhibits well-defined water bodies and coastlines and the absence of spikes and wells (single pixel errors), although some areas of missing data ('voids') are still present”20. Version 3 is not an official release by JPL but has been produced by CGIAR-CSI (the Consultative Group on International Agricultural Research’s Consortium for Spatial Information). This group has been working on a version of the SRTM DEM with all the holes filled by adaptive interpolation techniques21. The SRTM DEM only covers the globe to approximately 60°N/S (see the figure below). To create a global DEM, the SRTM data has been merged with the older GTOPO30 model to create the “SRTM30” DEM.
SRTM coverage map22.
The Scripps Institution of Oceanography have created “SRTM30 PLUS” where ocean areas have been filled with bathymetric data23.
20
http://www2.jpl.nasa.gov/srtm/ 21
http://srtm.csi.cgiar.org/; Eike Luedeling, Stefan Siebert and Andreas Buerkert, Filling the voids in the SRTM elevation model -- A
TIN-based delta surface approach, ISPRS Journal of Photogrammetry and Remote Sensing, Volume 62, Issue 4, September
2007, Pages 283-294. (http://www.sciencedirect.com/science/article/B6VF4-4P18B6J-1/2/8165efa57e7cf288088a3295bb943b06) 22
From: http://www2.jpl.nasa.gov/srtm/datacoverage.html.
ICEDS: Guidelines for Implementing an OGC Web Coverage & Web Map Server Reference: ESYS-RPT-2005487-02, Issue: 30 March 2006, Version 3.
19
The other two datasets used in ICEDS (the MODIS Blue Marble global mosaic, the DMSP Night-time lights) have been used only for meta-processing or as reference layers. The objective of the data processing was to convert the datasets from their original format into something more suitable for being published with a map server. There are two main techniques for storing large volumes of spatial information in a digital archive when they need to be indexed and easily accessible: the first and the most common is to use a spatial database, such as Oracle, MySQL or PostgreSQL. These require knowledge of database management and are not necessarily easy to set up. The other method consists of storing single files in a hierarchy of directories and providing some form of index file to allow access to the appropriate data to fulfil a request. Typical index file formats are an XML or binary file, naming the individual files according to their geo-reference information, or a shapefile containing the filenames as polygon feature attributes. This indexed directories option was adopted for the ICEDS project because its intuitive structure is easier to replicate in other environments and contexts, without particular experience of spatial database management. The datasets served are all held in a regularly gridded geographic (lat,lon) format. The format and the dimension of the files stored in the different directories is very important when they have to be accessed by the map server. There are several factors conditioning the performance of a map server and some of them are indeed relevant to the structure adopted in the tiling and hierarchy of the constituent files. The dimension of the files may increase when the web server has a more powerful processor or higher RAM – here, dimension can be taken either to be image size in pixel dimensions, or simply storage space in RAM. It should be noted that some formats offer space advantages on disk through compression, for example JPEG, but may require as much memory in RAM in a map server if the server holds the data in a decompressed form. Other physical factors that can slow down the process of publishing and accessing a geospatial dataset on the Internet are the capacity of the network connecting the web server with the storage disks and the number of requests performed contemporaneously to the map server.
6.1 SRTM
ICEDS currently serves version 1 and version 2 SRTM data by WMS, and version 1 by WCS (the current limitation being disk space on the server). Hill-shaded versions are accessible via the WMS. Raw data are available in 16-bit signed integer via the WCS. In this section, all the data processing is described in detail.
23
http://topex.ucsd.edu/WWW_html/srtm30_plus.html

ICEDS: Guidelines for Implementing an OGC Web Coverage & Web Map Server Reference: ESYS-RPT-2005487-02, Issue: 30 March 2006, Version 3.
20
6.1.1 Data retrieval
All data are freely available in 1ºx1º tiles (1201 lines x 1201 samples, with an extra overlapping line and sample) with a spatial resolution of 3x3 arc-sec. (equivalent to approximately 90m at the equator) and was accessible in compressed SRTM data files (i.e. files with an “hgt.zip” extension) from ftp://e0srp01u.ecs.nasa.gov/srtm/ and in compressed float GeoTIFF data files (i.e. files with an “tif.gz” extension) from ftp://ftp.glcf.umiacs.umd.edu/glcf/SRTM/. The hgt files are organised into subdirectories by continent on the ftp server. Note: the naming convention (NYYEXXX) for the SRTM data files represents the bottom left coordinate of the tile. N and E can change to S or W for south latitudes or west longitudes. YY and XXX represent respectively the latitude and longitude in integer degrees. The data files were copied into two directories and uncompressed with gzip:
• gzip -d -S .zip *.zip (in the hgt compressed files’ folder) • gzip -d *.gz (in the GeoTIFF compressed files’ folder)
Note: there are other compressing/uncompressing utilities available such as unzip. To use this, issue the following command once in the hgt compressed files’ folder: unzip "*.zip"
6.1.2 WMS data preparation
6.1.2.1 Mask data – SRTM Water Bodies Dataset
The sea surface in the unedited, version 1 SRTM data does not lie at a constant height due to radar back scattering. Thus a land-water mask has been used in ICEDS to properly mask those specific tiles lying on the coast. As part of the production of the version 2 SRTM DEM, a water bodies mask was created called the SRTM Water Bodies Datasets (SWBD). This is available along with the SRTM DEM data from USGS at the NASA URL given in section 6.1.1. The SWBD data is a vector dataset of water body polygons, clipped to the same tile structure as the SRTM data, so tile-by-tile water masking of the SRTM DEM is possible. (By contrast, see Appendix D for a masking scheme we had previously applied to the version 1 data before the release of version 2 and the SWBD. This previous scheme used the NOAA Global Self-consistent, Hierarchical, High-resolution Shoreline (GSHHS) database which is not divided into tiles). The SWBD was downloaded and unzipped. A complication with this data is that the file naming convention is slightly different from that used for the SRTM DEM files. The following Korn shell script renames the files:
ls *dbf *shp *shx -1 > filenames.tmp sed 's/\(....\)\(...\)\(.\).\(...\)/mv \1\2\3.\4 \2\1.\4/; ln -s generic.prj \2\1.prj;' filenames.tmp > rename.tmp . ./rename.tmp rename n N *dbf *shp *shx rename e E *dbf *shp *shx rename w W *dbf *shp *shx rename s S s*dbf s*shp s*shx rename Sh sh *
The SWBD lacks a projection file. The following generic .prj file is suitable: GEOGCS["Geographic Coordinate System",DATUM["WGS84",SPHEROID["GRS 1980",6378137,298.2572220960423]],PRIMEM["Greenwich",0],UNIT["degree",0.0174532925199433]]

ICEDS: Guidelines for Implementing an OGC Web Coverage & Web Map Server Reference: ESYS-RPT-2005487-02, Issue: 30 March 2006, Version 3.
21
There are two additional complications. There is no SWBM for regions north of 60°N, resulting in a strip of no-data and random areas of scattered sea-level data. The NOAA GSHHS coastline data contains shorelines for these regions that are a reasonable fit, but due to the size this has been impossible to process (the shape-files for the coastline do not load into GlobalMapper). The pragmatic solution has been taken to remove this data from the dataset displayed. Finally, processing the SRTM version 1 data with the SWBD mask leaves a number of tiles where version 1 has data, yet which do not exist in version 2: these show up as square ‘islands’ in the oceans. The tiles affected by this have been manually identified and removed from the SRTM Version 1. The list of affected tiles can be found in Appendix E.
6.1.2.2 Hill-shading
To hill-shade the data contained in the uncompressed HGT files we use a Windows application called Global Mapper24 (Global Mapper v.8.0 was used - the current version at the time of writing (October 2007) is 9.0). Global Mapper will also carry out the water bodies masking operation. Global Mapper allows a colour table to be defined, associating RGB values with elevation ranges to create a custom hill-shading,. This can be done in “Tools -> Configure -> Shader Options tab -> New” (in “Custom Shaders” area”). A new custom shader was created for ICEDS using RGB and elevation ranges as shown in the following table.
From (meters)
To (meters)
Colour RGB (decimal values)
-∞ +20 Green 013,198,091
+20 +200 Light green 217,231,116
+200 +400 Light yellow 255,255,128
+400 +1000 Light orange 236,184,026
+1000 +1500 Red/orange 255,128,000
+1500 +2000 Brown 128,064,000
+2000 +5000 Grey 128,128,128
+5000 +5500 Light grey 225,225,225
+5500 +7000 White 252,252,252
24
Global Mapper is a low cost product – at the time of writing, a single-user licence for version 5.1 is US$ 179; or US$ 219 for version
6. See www.globalmapper.com. A cut-down version of Global Mapper, called DLGV32 Pro is available for free from the USGS but
this version does not support scripting – see http://mcmcweb.er.usgs.gov/drc/dlgv32pro/.

ICEDS: Guidelines for Implementing an OGC Web Coverage & Web Map Server Reference: ESYS-RPT-2005487-02, Issue: 30 March 2006, Version 3.
22
The lowest level of the colour table has a range from +20m to -∞m, to include all those possible areas below sea level. Note that white is not defined as 255,255,255 because this full white colour is the one we have chosen to reserve to indicate transparent pixels. Other parameters were chosen during the data processing to obtain the best looking hill-shaded product. These can be defined in “Tools -> Configure -> Vertical Options tab” before launching the script:
• 30° altitude and 330° azimuth for the light direction; • additional 20% ambient lightening; • a factor of 3.0 for vertical exaggeration;
The background colour of the display should be set using the “View -> Background Color dialog”. This last parameter is important to identify missing elevation values in the SRTM DEM data. For the SRTM version 1 data, a bright red colour was used; for version 2, cyan was used - both of these colours have a good contrast against the hill-shading colour table. The different colours allow a visual comparison of the data gaps in the two versions. After defining all of these parameters, a batch conversion, using a text script file, can then be launched. The script file was created with a perl routine called “hillshademask.pl” that needs to be run from inside the “hgt” folder. Before running the routine, a file containing all the “hgt” files that are inside the folder must be created. This is done by issuing the command:
• ls -1 *.hgt > hgtfiles.txt This command will list all the “hgt” files and will output the list to a file named “hgtfiles.txt”, one filename per line. (In our processing, we We are now ready to create the script file by calling the perl routine using the following command:
ICEDS: Guidelines for Implementing an OGC Web Coverage & Web Map Server Reference: ESYS-RPT-2005487-02, Issue: 30 March 2006, Version 3.
23
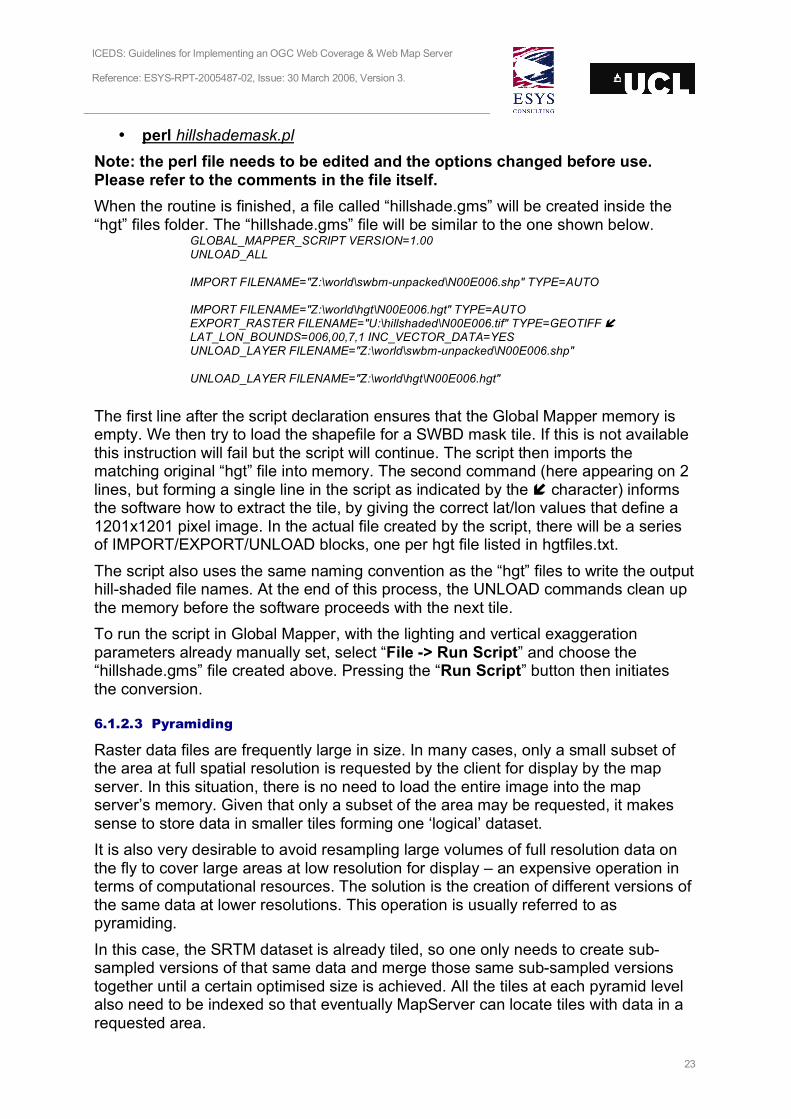
• perl hillshademask.pl Note: the perl file needs to be edited and the options changed before use. Please refer to the comments in the file itself. When the routine is finished, a file called “hillshade.gms” will be created inside the “hgt” files folder. The “hillshade.gms” file will be similar to the one shown below.
GLOBAL_MAPPER_SCRIPT VERSION=1.00 UNLOAD_ALL IMPORT FILENAME="Z:\world\swbm-unpacked\N00E006.shp" TYPE=AUTO IMPORT FILENAME="Z:\world\hgt\N00E006.hgt" TYPE=AUTO EXPORT_RASTER FILENAME="U:\hillshaded\N00E006.tif" TYPE=GEOTIFF LAT_LON_BOUNDS=006,00,7,1 INC_VECTOR_DATA=YES UNLOAD_LAYER FILENAME="Z:\world\swbm-unpacked\N00E006.shp" UNLOAD_LAYER FILENAME="Z:\world\hgt\N00E006.hgt"
The first line after the script declaration ensures that the Global Mapper memory is empty. We then try to load the shapefile for a SWBD mask tile. If this is not available this instruction will fail but the script will continue. The script then imports the matching original “hgt” file into memory. The second command (here appearing on 2 lines, but forming a single line in the script as indicated by the character) informs the software how to extract the tile, by giving the correct lat/lon values that define a 1201x1201 pixel image. In the actual file created by the script, there will be a series of IMPORT/EXPORT/UNLOAD blocks, one per hgt file listed in hgtfiles.txt. The script also uses the same naming convention as the “hgt” files to write the output hill-shaded file names. At the end of this process, the UNLOAD commands clean up the memory before the software proceeds with the next tile. To run the script in Global Mapper, with the lighting and vertical exaggeration parameters already manually set, select “File -> Run Script” and choose the “hillshade.gms” file created above. Pressing the “Run Script” button then initiates the conversion.
6.1.2.3 Pyramiding
Raster data files are frequently large in size. In many cases, only a small subset of the area at full spatial resolution is requested by the client for display by the map server. In this situation, there is no need to load the entire image into the map server’s memory. Given that only a subset of the area may be requested, it makes sense to store data in smaller tiles forming one ‘logical’ dataset. It is also very desirable to avoid resampling large volumes of full resolution data on the fly to cover large areas at low resolution for display – an expensive operation in terms of computational resources. The solution is the creation of different versions of the same data at lower resolutions. This operation is usually referred to as pyramiding. In this case, the SRTM dataset is already tiled, so one only needs to create sub-sampled versions of that same data and merge those same sub-sampled versions together until a certain optimised size is achieved. All the tiles at each pyramid level also need to be indexed so that eventually MapServer can locate tiles with data in a requested area.

ICEDS: Guidelines for Implementing an OGC Web Coverage & Web Map Server Reference: ESYS-RPT-2005487-02, Issue: 30 March 2006, Version 3.
24
Utilities for these tasks can be found in GDAL (the Geospatial Data Abstraction Library) which is installed with MapServer (see section 5.3 or 5.4.5). The three steps are:
1. The original tiles are indexed with gdaltindex. 2. Reduced size versions of individual tiles are produced with gdal_translate.
Overviews are then added to these tiles with gdaladdo and a tile index produced for this reduced data set.
3. As loading speed is not only determined by data size, but also the number of files that MapServer needs to open, merged data sets are produced with gdal_merge.py. To ensure transparency of the resulting images, the –init parameter needs to be set so that tile holes are not filled with 0, but 255, our chosen no-data value.
This sequence is controlled by three scripts: makeoverviews, makeindices, makecombined. At this point, we now have the SRTM data fully hill-shaded, masked and pyramided, ready for use in the MapServer WMS. We have two sets of files - the original hill-shaded and masked tiles, and a second set of files created by step 2 above. Each file in this second set actually contains two pyramid levels. The basic image is the intermediate pyramid level but each file also contains an overview, intended as a thumbnail but here containing the coarsest pyramid level.
6.1.3 WCS data preparation
The processing stages above relate to the data served in the WMS. In the WCS one wants to make available the original data without any hill-shading applied. These data are already available as float GeoTIFF files (via ftp from GLCF). The only thing that needs to be done is to convert them to 16-bit signed integer GeoTIFF format. The range of tools capable of handling this type of GeoTIFF is currently limited. A script (“float2int.pro”) was written in IDL/ENVI in order to simply open a float GeoTIFF file and save it as 16-bit GeoTIFF. The user can run the routine inside any directory, only the path variable inside the routine need to be changed. IDL is first started from the Linux command line – the current working directory should be the same as the script location:
• idl The script needs to be compiled before being run (note that “IDL> ” is the command-line prompt):
• IDL>.compile float2int.pro • IDL> float2int

ICEDS: Guidelines for Implementing an OGC Web Coverage & Web Map Server Reference: ESYS-RPT-2005487-02, Issue: 30 March 2006, Version 3.
25
6.2 SRTM30 and GTOPO30
ICEDS also serves a global Digital Elevation Model with a spatial resolution of 30 arc-seconds. Within the SRTM extent (56ºS - 61ºN) SRTM30 was used. SRTM30 is a combination of products derived from both the SRTM full-resolution and the GTOPO30 datasets. For the rest of the globe the GTOPO 30 is the only dataset. The preparation of a global dataset covering the entire Earth using these two different products was decided because the SRTM30 dataset has a seamless and uniform representation, due to the fact that it was created over a short period of time from a single source rather than from the numerous sources spanning many decades that went into creating the GTOPO30 dataset.
6.2.1 Data copy
All these data was downloaded via FTP. The SRTM30 dataset is available in two versions, corresponding to the two version of SRTM DEM data from which SRTM30 is derived. SRTM30 can be downloaded from
• Version 1: ftp://e0srp01u.ecs.nasa.gov/srtm/version1/SRTM30 • Version 2: ftp://e0srp01u.ecs.nasa.gov/srtm/version2/SRTM30
and the GTOPO30 files from ftp://edcftp.cr.usgs.gov/pub/data/gtopo30/global/. Both SRTM30 and GTOPO30 are in a tiled form with each file/folder name representing the coordinates of the upper left corner. SRTM30 has been divided into the same tiles as GTOPO30, except that since the data do not extend below 60 degrees south latitude the corresponding tiles, as well as the Antarctica file in GTOPO30, have not been generated. ICEDS currently only contains SRTM30 version 1 due to space restrictions on the server. The GTOPO30 files are made available in “tar.gz” compressed archived format while the SRTM30 files are just in a zip-compressed format. Folders were created and named after each of the GTOPO30 files that were then moved inside the corresponding folder. After that, the files were uncompressed. To do that, the following commands were issued:
• tar xvzf *.gz (in each of the GTOPO30 folders) • gzip -d -r -S .zip *.zip (in the folder where the GTOPO30 and SRTM30 folders
are located) The further processing of the datasets was carried out as part of a previous release of ICEDS (described in version 2 of this Guidelines document). The actual processing scheme is discussed in the following sections but would no longer be our recommended methodology. Instead it would be possible to follow a processing scheme similar to that outlined in sections 6.1.2.2 & 6.1.2.3 above for SRTM.
6.2.2 Hill-shading
The next step after extraction is to hill-shade the data contained in the uncompressed folders using the same application used to hill-shade the SRTM3 dataset (Global Mapper v.5.10).
ICEDS: Guidelines for Implementing an OGC Web Coverage & Web Map Server Reference: ESYS-RPT-2005487-02, Issue: 30 March 2006, Version 3.
26
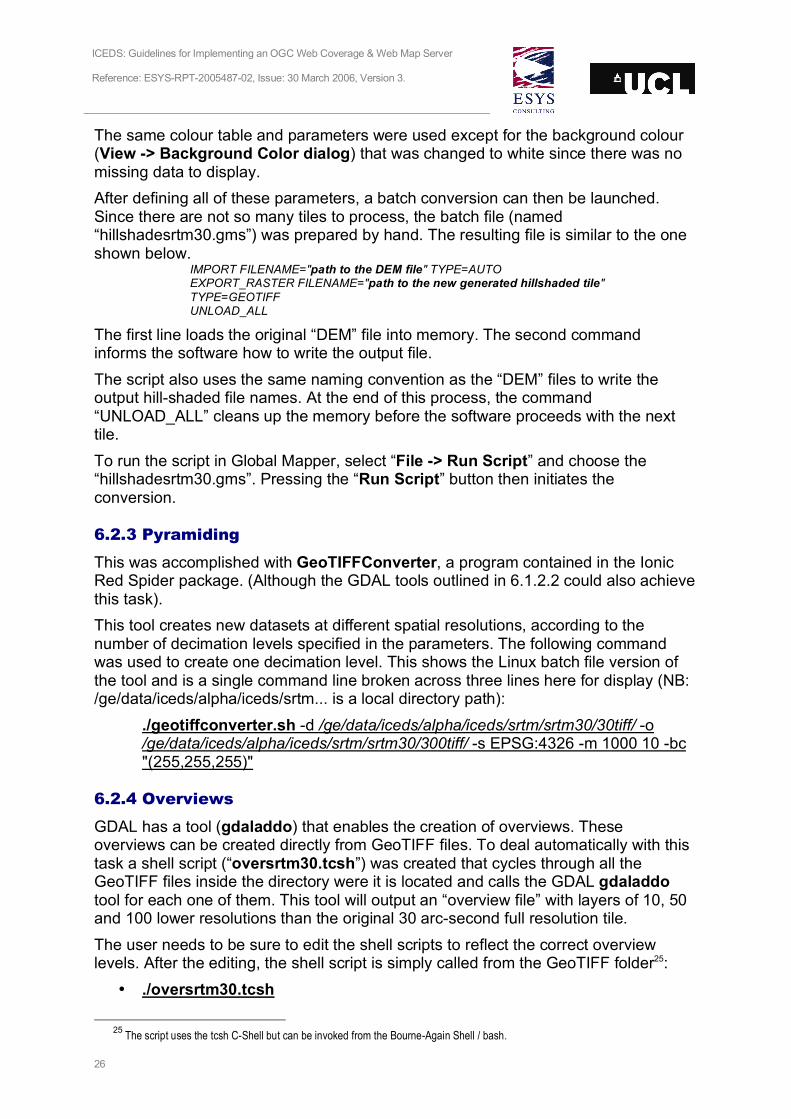
The same colour table and parameters were used except for the background colour (View -> Background Color dialog) that was changed to white since there was no missing data to display. After defining all of these parameters, a batch conversion can then be launched. Since there are not so many tiles to process, the batch file (named “hillshadesrtm30.gms”) was prepared by hand. The resulting file is similar to the one shown below.
IMPORT FILENAME="path to the DEM file" TYPE=AUTO EXPORT_RASTER FILENAME="path to the new generated hillshaded tile" TYPE=GEOTIFF UNLOAD_ALL
The first line loads the original “DEM” file into memory. The second command informs the software how to write the output file. The script also uses the same naming convention as the “DEM” files to write the output hill-shaded file names. At the end of this process, the command “UNLOAD_ALL” cleans up the memory before the software proceeds with the next tile. To run the script in Global Mapper, select “File -> Run Script” and choose the “hillshadesrtm30.gms”. Pressing the “Run Script” button then initiates the conversion.
6.2.3 Pyramiding
This was accomplished with GeoTIFFConverter, a program contained in the Ionic Red Spider package. (Although the GDAL tools outlined in 6.1.2.2 could also achieve this task). This tool creates new datasets at different spatial resolutions, according to the number of decimation levels specified in the parameters. The following command was used to create one decimation level. This shows the Linux batch file version of the tool and is a single command line broken across three lines here for display (NB: /ge/data/iceds/alpha/iceds/srtm... is a local directory path):
./geotiffconverter.sh -d /ge/data/iceds/alpha/iceds/srtm/srtm30/30tiff/ -o /ge/data/iceds/alpha/iceds/srtm/srtm30/300tiff/ -s EPSG:4326 -m 1000 10 -bc "(255,255,255)"
6.2.4 Overviews
GDAL has a tool (gdaladdo) that enables the creation of overviews. These overviews can be created directly from GeoTIFF files. To deal automatically with this task a shell script (“oversrtm30.tcsh”) was created that cycles through all the GeoTIFF files inside the directory were it is located and calls the GDAL gdaladdo tool for each one of them. This tool will output an “overview file” with layers of 10, 50 and 100 lower resolutions than the original 30 arc-second full resolution tile. The user needs to be sure to edit the shell scripts to reflect the correct overview levels. After the editing, the shell script is simply called from the GeoTIFF folder25:
• ./oversrtm30.tcsh
25
The script uses the tcsh C-Shell but can be invoked from the Bourne-Again Shell / bash.

ICEDS: Guidelines for Implementing an OGC Web Coverage & Web Map Server Reference: ESYS-RPT-2005487-02, Issue: 30 March 2006, Version 3.
27
Note: the shell script needs to be set with the correct permissions in order to run. If an error is received when trying to call it, issue the command: chmod 755 oversrtm30.tcsh and try again. At this point, we now have the SRTM30/GTOPO30 data fully hill-shaded and pyramided (with overviews built for the full-resolution level), ready for use in the MapServer WMS.

ICEDS: Guidelines for Implementing an OGC Web Coverage & Web Map Server Reference: ESYS-RPT-2005487-02, Issue: 30 March 2006, Version 3.
28
6.3 Landsat mosaics
The remotely sensed imagery data directly served by this project comes from the Thematic Mapper (TM) sensor on the Landsat 5 satellite, launched on 1 March, 1984. The image scenes were captured around 1990 over the African and European continents and were made available as a mosaic on physical media (DVD-ROMs) by Nevin Bryant of the Cartographic Applications Group at the Jet Propulsion Laboratory (JPL). Although it is unlikely that the users of this document will have access to this same dataset, the ICEDS team feel that the techniques used for preparing this dataset may be instructive. In a future phase of funding, it is planned that ICEDS will include more recent Landsat 7 mosaics. The data were provided in UNIX compressed (“.Z”) files as separate 8-bit GeoTIFF files for each spectral band. For the full-resolution African mosaic only TM bands 1, 2 and 3 were provided. For the European mosaic, band 4 was also provided. The total volume of data, approximately 230 GB (uncompressed), should be noted since this raised some issues during the processing. The non contrast-stretched images (henceforth referred to as unenhanced images) were provided at a spatial resolution of 1 arc-sec (equivalent to approximately 30m at the equator, full-resolution for Landsat 5) with a tile extent of 5ºx5º (18,000 lines x 18,000 samples with an additional overlapping line and sample). Individual images contributing to the mosaic came from different seasons and dates. JPL also made available a contrast-stretched (enhanced) and an unenhanced seamless mosaic of the entire African continent at 10 arc-sec resolution that are not being used. All images were available in separate bands. The African and European TM bands 1, 2 and 3 are available via the ICEDS WMS and WCS whilst the European band 4 is only available via the ICEDS WCS. The overall data processing scheme is shown in the diagram below.
ICEDS: Guidelines for Implementing an OGC Web Coverage & Web Map Server Reference: ESYS-RPT-2005487-02, Issue: 30 March 2006, Version 3.
29
6.3.1 Data copy
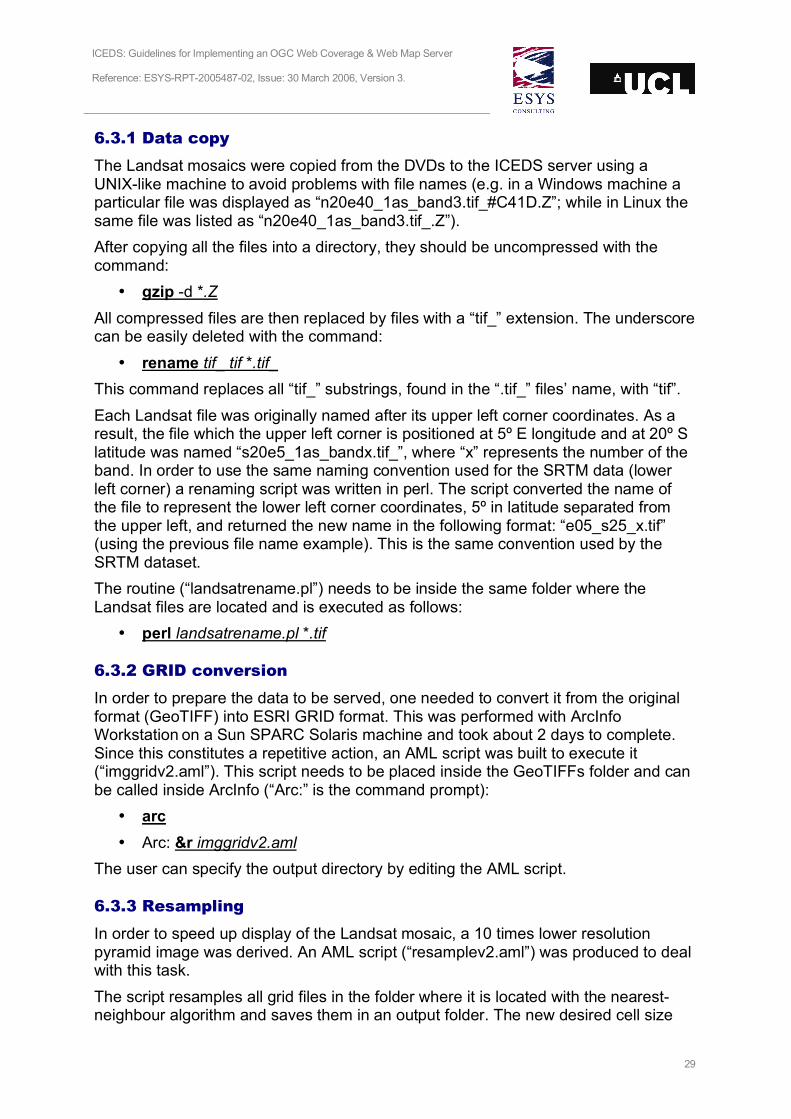
The Landsat mosaics were copied from the DVDs to the ICEDS server using a UNIX-like machine to avoid problems with file names (e.g. in a Windows machine a particular file was displayed as “n20e40_1as_band3.tif_#C41D.Z”; while in Linux the same file was listed as “n20e40_1as_band3.tif_.Z”). After copying all the files into a directory, they should be uncompressed with the command:
• gzip -d *.Z All compressed files are then replaced by files with a “tif_” extension. The underscore can be easily deleted with the command:
• rename tif_ tif *.tif_ This command replaces all “tif_” substrings, found in the “.tif_” files’ name, with “tif”. Each Landsat file was originally named after its upper left corner coordinates. As a result, the file which the upper left corner is positioned at 5º E longitude and at 20º S latitude was named “s20e5_1as_bandx.tif_”, where “x” represents the number of the band. In order to use the same naming convention used for the SRTM data (lower left corner) a renaming script was written in perl. The script converted the name of the file to represent the lower left corner coordinates, 5º in latitude separated from the upper left, and returned the new name in the following format: “e05_s25_x.tif” (using the previous file name example). This is the same convention used by the SRTM dataset. The routine (“landsatrename.pl”) needs to be inside the same folder where the Landsat files are located and is executed as follows:
• perl landsatrename.pl *.tif
6.3.2 GRID conversion
In order to prepare the data to be served, one needed to convert it from the original format (GeoTIFF) into ESRI GRID format. This was performed with ArcInfo Workstation on a Sun SPARC Solaris machine and took about 2 days to complete. Since this constitutes a repetitive action, an AML script was built to execute it (“imggridv2.aml”). This script needs to be placed inside the GeoTIFFs folder and can be called inside ArcInfo (“Arc:” is the command prompt):
• arc • Arc: &r imggridv2.aml
The user can specify the output directory by editing the AML script.
6.3.3 Resampling
In order to speed up display of the Landsat mosaic, a 10 times lower resolution pyramid image was derived. An AML script (“resamplev2.aml”) was produced to deal with this task. The script resamples all grid files in the folder where it is located with the nearest-neighbour algorithm and saves them in an output folder. The new desired cell size

ICEDS: Guidelines for Implementing an OGC Web Coverage & Web Map Server Reference: ESYS-RPT-2005487-02, Issue: 30 March 2006, Version 3.
30
can be changed by editing the AML script, but a default value of 0.002 is assumed. This script is invoked with the following command:
• arc • Arc: &r resamplev2.aml
6.3.4 Image composition
Since MapServer uses the GDAL library that supports the use of “virtual files” this was the selected method for creating virtual composite tiles for both the full and reduced resolution datasets. With this technique, no duplicate data is produced and the process is very fast and can be easily automated via the use of scripts. In order to produce the “virtual files” a perl routine, “virtualv2.pl“was created. GDAL needs to be installed on the system since the gdal_translate command is used. The user needs to be in the folder where the “virtual files” will be written and the “GridPath” variable inside the routine may need to be adjusted accordingly to the location of the grid files. This script is invoked with the following command:
• perl virtualv2.pl
6.3.5 Overviews
The GDAL tool gdaladdo can also be used to create overviews using GDAL “virtual files”. To deal automatically with this task a shell script (“overlandsat.tcsh”) was created that cycles through all the original resolution (1 arc-second) “virtual files” inside the directory where it is located and calls the GDAL gdaladdo tool for each one of them. This tool will output an “overview file” with layers of 10, 50 and 100 lower resolutions than the original 1 arc-second full resolution tile. The user needs to be sure to edit the shell scripts to reflect the correct overview levels. After the editing, the shell script is simply called from the “virtual files” folder26:
• ./overlandsat.tcsh Note: the shell script needs to be set with the correct permissions in order to run. If an error is received when trying to call it, issue the command: chmod 755 overlandsat.tcsh and try again.
26
The script uses the tcsh C-Shell but can be invoked from the Bourne-Again Shell / bash.
ICEDS: Guidelines for Implementing an OGC Web Coverage & Web Map Server Reference: ESYS-RPT-2005487-02, Issue: 30 March 2006, Version 3.
31
6.4 MODIS Blue Marble
The “Blue Marble” dataset27 is a composite mosaic of MODIS images at 1km spatial resolution. It includes both topographic elevation and bathymetry and the combination of the bands reflects a true colour view. Although the resolution limits the applications of this dataset, it forms a good, fast-loading backdrop for other information layers. The dataset in its original format was composed of two GeoTIFF files, each ~1GB in size, called “east” (from 0°E to 180°E) and “west” (from 0°E to 180°W). Their size is not suitable for publication with a map server and therefore a sub-division into smaller tiles organised in a pyramidal structure is again needed. This can also be achieved with Global Mapper (see STRTM and Landsat data preparation above). A new batch script was prepared to for Global Mapper to extract 10°x10° tiles at the original resolution of ~1km/pixel:
IMPORT FILENAME="G:\iceds\temp\modis\topo_bathy_1km_west.tif" TYPE=AUTO EXPORT_RASTER FILENAME="D:\iceds\africa\modis\W010N00.tif" TYPE=GEOTIFF LAT_LON_BOUNDS=-10,00,0,10 EXPORT_RASTER FILENAME="D:\iceds\africa\modis\W010N10.tif" TYPE=GEOTIFF LAT_LON_BOUNDS=-10,10,0,20 EXPORT_RASTER FILENAME="D:\iceds\africa\modis\W010N20.tif" TYPE=GEOTIFF LAT_LON_BOUNDS=-10,20,0,30 …
The resulting batch script imports firstly one of the two big images into the application view; then every tile is exported to smaller files according to the geographic bounding box defined. Once this new dataset was created, the GeoTIFFConverter tool was used to create a sub-sampled version of the data at 1/10 of the original resolution (10x the pixel size).
27
Available through http://www.vterrain.org/Imagery/whole_earth.html

ICEDS: Guidelines for Implementing an OGC Web Coverage & Web Map Server Reference: ESYS-RPT-2005487-02, Issue: 30 March 2006, Version 3.
32
6.5 DMSP Night-time Lights
The Defense Satellite Meteorological Program group at the National Geophysical Data Center Night released version one of a pair of DMSP-OLS "Night-time lights of the world" images processed specifically for the detection of change, covering the years 1992-93 and 2000. These data are divided into light categories (Fires, Gas Flares, Stable Lights, Human Settlements, etc.). Only the Human Settlements 2000 was imported into ICEDS. The Human settlements information has Digital Number values ranging from 0 to 63 (DN value of 63 = saturated lights DN value of 0 = no lights). These numbers are the average DN values for the year.
6.5.1 Data copy
The 2000 Night-time human settlements lights dataset was downloaded from the Defense Satellite Meteorological Program website located at http://dmsp.ngdc.noaa.gov/html/download_world_change_pair.html. The data were downloaded in one single GeoTIFF image file covering the entire globe, compressed inside a tar ball file. After copying the file into a directory, it should be uncompressed with the following commands:
• tar -xvf *.tar (in the folder where the tar file is located) • gzip -d *.gz (inside the new folder created by the tar command)
6.5.2 GRID conversion
In order to prepare the data with the correct colour for display (from white to dark yellow – higher to lower light brightness), one needs to convert it from the original format (GeoTIFF) into ESRI GRID format. This was performed with ArcInfo Workstation using a hand made colour table file. The colour table file is a simple ASCII file composed of 256 lines. Each line is composed of four numbers separated by a space and associates the Digital Number value (first number in each line) with an RGB colour (the colour table is available in the scripts pack named “colourdmsp.clr”). (“Arc:” and “Grid:” are the command prompts):
• Arc - starts ArcInfo Workstation
• Arc: imagegrid 2000.human.settlements.tif hs008 - converts the GeoTIFF file into a GRID
• Arc: hs08 = aggregate(hs008,10,max,expand) - creates a new GRID “hs08” from the “hs008” GRID. This new GRID has 10 times lower resolution.
• Arc: grid - starts the GRID module
• Grid: gridimage hs08 colourinv.clr hs08.tif tiff none - converts the “hs08” GRID into a TIFF file, using the created colour table
ICEDS: Guidelines for Implementing an OGC Web Coverage & Web Map Server Reference: ESYS-RPT-2005487-02, Issue: 30 March 2006, Version 3.
33
• Grid: gridimage hs008 colourinv.clr hs008.tif tiff none - converts the “hs008” GRID into a TIFF file, using the created colour table
6.5.3 Tiling
Since the full resolution image covering the entire world was approximately 2 GB in size, there was a need to tile it in smaller files covering 10ºx10º in latitude and longitude (approximately 4 MB each). This was done using Global Mapper in batch mode to open the source file and save 10ºx10º subset tiles. As discussed above in the SRTM data preparation chapter, Global Mapper needs to be provided with a text batch script file. The batch file (dmsptiler.gms) was created with a Perl routine (“dmsptiler.pl”). This script can be run from any location, but its contents needs first to be changed in order to reflect the correct input and output locations for the files.
• perl dmsptiler.pl To run the script in Global Mapper, select “File -> Run Script” and choose the “dmsptiler.gms”. Pressing the “Run Script” button then initiates the tiling operation.
ICEDS: Guidelines for Implementing an OGC Web Coverage & Web Map Server Reference: ESYS-RPT-2005487-02, Issue: 30 March 2006, Version 3.
34
7 Configuring MapServer The data configuration in MapServer is very simple and involves the creation and configuration of MapFiles. They are the basic configuration mechanism for the Mapserver. Anything associated with a particular application is there defined. There are some important guidelines which detail all the aspects discussed in this section:
• “MapFile reference”: http://mapserver.gis.umn.edu/doc42/mapfile-reference.html; • “MapServer WMS Server How To”:
http://mapserver.gis.umn.edu/doc42/wms-server-howto.html • “MapServer WMS Client How To”:
http://mapserver.gis.umn.edu/doc42/wms-client-howto.html • “WCS MapServer”:
http://mapserver.gis.umn.edu/cgi-bin/wiki.pl?WCSMapServer (not very detailed since WCS support is not in a full release of MapServer).
Before creating the MapFiles, the user needs to perform two tasks: • Create shapefile index files for the tiled data
This is done with the GDALTindex tool as described in section 3.2.1.3. Note that the current working directory when the GDALTindex tool is run should be the directory used as attribute in the SHAPEFILE keyword inside the MapFile. In this way, the shapefile’s attribute table will contain the path to each of the tiles relative to the path used in the SHAPEFILE keyword. Once the shapefile is created it can then be moved as another MapFile keyword will store the base path. gdaltindex indexfile.shp location/to/tiled/geotiff/files/*.tif
• create a directory where MapServer can put temporary files This is a directory for writing temporary files and images and must be writable by the user id under which the web server runs. The folder can be located anywhere and is created with the usual Linux mkdir command: mkdir /path/to/new_directory
The following notes on MapFiles are from the MapServer “MapFile reference” Web page:
• the Mapfile is NOT case-sensitive; • strings containing non-alphanumeric characters or a MapServer keyword must
be quoted. It is recommended to put all strings in double-quotes; • there is a maximum of 50 layers per MapFile. This can be changed by editing
the “map.h” file to change the value of “MS_MAXLAYERS” to the desired number and recompiling;
• file paths may be given as absolute paths, or as paths relative to the location of the MapFile. In addition, data files must be specified relative to the “SHAPEPATH”;

ICEDS: Guidelines for Implementing an OGC Web Coverage & Web Map Server Reference: ESYS-RPT-2005487-02, Issue: 30 March 2006, Version 3.
35
• the MapFile has a hierarchical structure, with the “Map” object being the root. All other objects fall under this one;
• comments are designated with a #; and • attributes are named using the following syntax: [ATTRIBUTENAME] ... Note
that the name of the attribute included between the square brackets is case sensitive. Generally ESRI generated shapefiles have their attributes (”dbf” field names) all in upper-case for instance.
Below are copied parts of the two MapFiles used in the ICEDS MapServer, one for the WMS and other for the WCS. Both files are included in the scripts pack (“wms.map” and “wcs.map”), available with this document. The user will typically create these files in a regular text editor, saving them with a “.map” extension.
7.1 WMS MapFile
Every MapFile has the “MAP” object as root: MAP #beginning of MAP object
NAME "ICEDSWMS" #prefix attached to map, scalebar and legend GIF filenames created using this MapFile. It
should be kept short
EXTENT -180 -90 180 90 #map Bounding Box
The next five keywords are not used by the WMS or WCS servers themselves, since they define parameters which will be included by the user inside the WMS or WCS requests. These keywords are important in providing defaults if the user wants to request a map using only MapServer requests.
SIZE 600 300 #size in pixels of the output image (i.e. the map)
IMAGETYPE PNG #output format to generate the map
IMAGECOLOR 255 255 255 #background colour
INTERLACE ON #interlace method on
TRANSPARENT ON #transparency enabled
SHAPEPATH "/ge/data/iceds/alpha/iceds/" #path to the base directory
UNITS DD #units of the map coordinates (degrees in this example)
DEBUG ON #enables debugging of the layer object.
The “WEB” object is a sub-object of the “Map” object WEB
IMAGEPATH "/var/www/html/imgtmp /" #path to the temporary directory where the temp files are kept. Must
end with a / or \ depending on the platform
IMAGEURL "/imgtmp/" #base URL for IMAGEPATH. This is the URL that will take the web browser to
IMAGEPATH to get the images
LOG "/var/www/html/logtmp/umms.log" #file to log MapServer activity. Must be writable by the user the web
server is running as
The next block allows for arbitrary data to be stored as name value pairs. This is used with OGC WMS to define things such as layer title.
METADATA
"wms_title" "ICEDS (Integrated CEOS European Data Server) WMS"

ICEDS: Guidelines for Implementing an OGC Web Coverage & Web Map Server Reference: ESYS-RPT-2005487-02, Issue: 30 March 2006, Version 3.
36
"wms_onlineresource" "http://iceds.ge.ucl.ac.uk/cgi-bin/icedswms?"
"wms_accesscontraints" "None"
"wms_addresstype" "Postal"
"wms_address" "Gower Street"
"wms_city" "London"
"wms_stateorprovince" "London"
"wms_postcode" "WC1E 6BT"
"wms_country" "UK"
"wms_contactfacsimiletelephone" "+44 (0)20 7380 0453"
"wms_contactperson" "Mr. Jeremy Morley"
"wms_contactorganization" "Geomatic Engineering Department - UCL"
"wms_contactposition" "Lecturer"
"wms_contactvoicetelephone" "+44 (0)20 7679 2740"
"wms_fees" "None"
"wms_keywordlist" "ICEDS, WMS, Landsat, SRTM"
"wms_abstract" " Integrated CEOS European Data Server (ICEDS) Web Map Service, maintained by
the Geomatic Engineering Dept at UCL"
END
END #end of web object
This “PROJECTION” object sets up the projection for the output image. Once again this is only used if the user wants to interact with MapServer via its specific URL requests. If the user uses a WMS or WCS request, the output projection (or SRS) will be included in the request.
PROJECTION #start of projection object
"init=epsg:4326" #Projection of the output image
END #end of projection object
A MapFile may have zero, one or more “OUTPUTFORMAT” object declarations, defining available output formats, including formats like PNG, GIF, JPEG, GeoTIFF and Flash (SWF), depending on the libraries previously compiled. If no “OUTPUTFORMAT” declarations are found in the MapFile, implicit support will be used (please refer to the “MapFile Reference” guide). The output formats in defined ICEDS are PNG 24-bit with transparency (using the GD library) and JPEG with a quality of 75% (also using the GD library).
OUTPUTFORMAT
NAME "png24" #identifies the name of the format
MIMETYPE "image/png" #identifies the format mime type
DRIVER "GD/PNG" #identifies the library used
EXTENSION "png" #identifies the image file extension
IMAGEMODE RGBA #identifies the rendering mode: 32-bit Red/Green/Blue/Alpha, with alpha transparency is
used in this case since the images are in colour
END
OUTPUTFORMAT

ICEDS: Guidelines for Implementing an OGC Web Coverage & Web Map Server Reference: ESYS-RPT-2005487-02, Issue: 30 March 2006, Version 3.
37
NAME "jpeg"
MIMETYPE "image/jpeg"
DRIVER "GD/JPEG"
EXTENSION "jpg"
IMAGEMODE RGBA
FORMATOPTION "QUALITY=75" #optional available only with JPEG output. There are also other
“FORMATOPTION” options (please refer to the “MapFile Reference” guide)
END
All the information related to the served datasets is stored inside the “LAYER” object. Below, there are a number of extracts of the layers in the ICEDS WMS MapFile. The first relates to the DMSP Night Lights: Note: MapServer in this version does not support styles definitions. Consequently, services that require style information are only apparently being cascaded through ICEDS MapServer. These services are in fact called directly (via the original server) through the dynamically created html map instead of being called through ICEDS.
LAYER #begin of the LAYER object
NAME "lights_1" #name used for this specific layer in a WMS request
GROUP "lights" #name of a group that this layer belongs to. The group name can then be referenced as a regular layer name, allowing operations like turning on and off a group of layers at once
STATUS OFF #sets the current status of the layer. Default: turns the layer on
TYPE RASTER #type of layer being served
DATA "dmsp_lights/umms/wms/08/08lights.tif" #location of the image file to be served (note that this level is composed of only one mosaicked image, not series of tiles). The path is relative to the earlier defined “SHAPEPATH”
MINSCALE 45000001 #minimum scale at which this layer will be shown
MAXSCALE 999999999999 #maximum scale at which this layer will be shown
OFFSITE 255 255 255 #sets the colour index to treat as transparent for raster layers (RGB)
PROCESSING "BANDS=1,2,3" #instructs MapServer to display all three bands
DEBUG ON #enables debugging
The next block allows for arbitrary data to be stored as name value pairs. This is used with OGC WMS to define things such as layer title.
METADATA
"wms_title" "DMSP/NOAA human settlements night lights (300 arcsec. level)"
"wms_opaque" "0" #Set this metadata to "1" to indicate that the layer represents an area-filling coverage of space (e.g. a bathymetry and elevation layer). This should be taken by the client as a hint that this layer should be placed at the bottom of the stack of layers
"wms_srs" "EPSG:4326"
"wms_group_title" "DMSP/NOAA human settlements night lights of the world"
"wms_group_abstract" "Defense Metereological Satellite Program (DMSP)/NOAA - human settlements nightime lights. The brigthness is related to the average DN values for the year. The human settlements are the stable lights minus the identified gas flares"
"wms_keywordlist" "DMSP,NOAA,WMS,night lights"

ICEDS: Guidelines for Implementing an OGC Web Coverage & Web Map Server Reference: ESYS-RPT-2005487-02, Issue: 30 March 2006, Version 3.
38
"wms_abstract" "Defense Metereological Satellite Program (DMSP)/NOAA - human settlements nightime lights. The brigthness is related to the average DN values for the year. The human settlements are the stable lights minus the identified gas flares. Data resolution is a resampled version of the original dowloaded dataset (300 arcsec.)"
"wms_extent" "-180 -60 180 75" #layer bounding box
END
PROJECTION #this object sets up the native projection of this layer "init=epsg:4326"
END
END #end of the LAYER object
The next layer block is similar to the previous one. The main differences are that the data being served by this layer is now tiled: the “DATA” keyword is replaced by two new keywords - “TILEINDEX” and “TILEITEM”; and the layer RGB bands are being stretched on the fly.
…
LAYER
NAME "landsat_1"
GROUP "landsat5"
STATUS OFF
TYPE RASTER
TILEINDEX "landsat/umms/wms/index_02.shp" #full filename for the index shapefile for this layer
TILEITEM "location" #item that contains the location of an individual tile, default is "location”
MINSCALE 9000001
MAXSCALE 999999999999
OFFSITE 0 0 0
PROCESSING "BANDS=1,2,3"
PROCESSING "SCALE_1=9,124" #instructs MapServer on the min and max values to stretch band 1
PROCESSING "SCALE_2=14,87" #instructs MapServer on the min and max values to stretch band 2
PROCESSING "SCALE_3=48,166" #instructs MapServer on the min and max values to stretch band 3 DEBUG ON
METADATA
"wms_title" " LANDSAT 5 mosaic for Africa and Europe (100 arscsec. level)"
"wms_opaque" "0" "wms_srs" "EPSG:4326"
"wms_group_title" " LANDSAT 5 mosaic for Africa and Europe "
"wms_group_abstract" "LANDSAT 5 mosaic for Africa and Europe produced and kindly provided by
Dr. Nevin Bryant (JPL)"
"wms_keywordlist" " JPL,WMS,LANDSAT 5"
"wms_abstract" "LANDSAT 5 mosaic for Africa and Europe produced and kindly provided by Dr.
Nevin Bryant (JPL). Data resolution is a resampled version of the original dataset (100 arcsec.)"
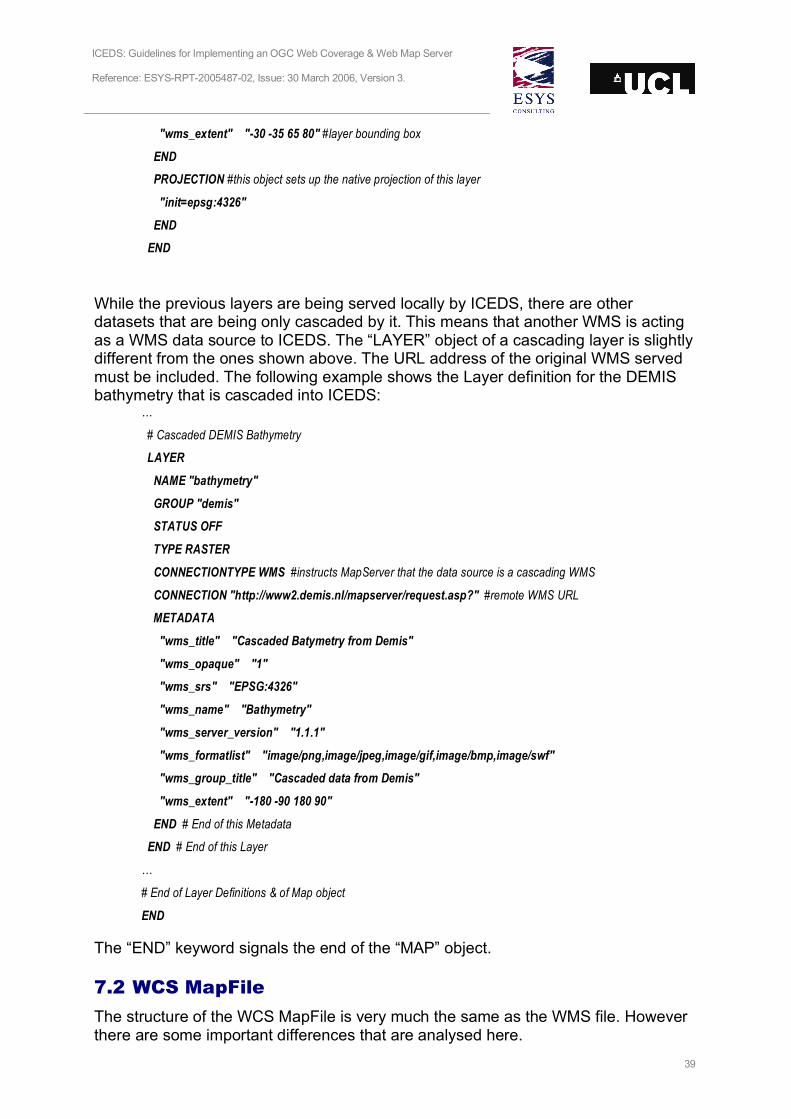
ICEDS: Guidelines for Implementing an OGC Web Coverage & Web Map Server Reference: ESYS-RPT-2005487-02, Issue: 30 March 2006, Version 3.
39
"wms_extent" "-30 -35 65 80" #layer bounding box
END
PROJECTION #this object sets up the native projection of this layer
"init=epsg:4326"
END
END
While the previous layers are being served locally by ICEDS, there are other datasets that are being only cascaded by it. This means that another WMS is acting as a WMS data source to ICEDS. The “LAYER” object of a cascading layer is slightly different from the ones shown above. The URL address of the original WMS served must be included. The following example shows the Layer definition for the DEMIS bathymetry that is cascaded into ICEDS:
…
# Cascaded DEMIS Bathymetry
LAYER
NAME "bathymetry"
GROUP "demis"
STATUS OFF
TYPE RASTER
CONNECTIONTYPE WMS #instructs MapServer that the data source is a cascading WMS
CONNECTION "http://www2.demis.nl/mapserver/request.asp?" #remote WMS URL
METADATA
"wms_title" "Cascaded Batymetry from Demis"
"wms_opaque" "1"
"wms_srs" "EPSG:4326"
"wms_name" "Bathymetry"
"wms_server_version" "1.1.1"
"wms_formatlist" "image/png,image/jpeg,image/gif,image/bmp,image/swf"
"wms_group_title" "Cascaded data from Demis"
"wms_extent" "-180 -90 180 90"
END # End of this Metadata
END # End of this Layer
…
# End of Layer Definitions & of Map object
END
The “END” keyword signals the end of the “MAP” object.
7.2 WCS MapFile
The structure of the WCS MapFile is very much the same as the WMS file. However there are some important differences that are analysed here.

ICEDS: Guidelines for Implementing an OGC Web Coverage & Web Map Server Reference: ESYS-RPT-2005487-02, Issue: 30 March 2006, Version 3.
40
The output format decided on for the WCS was GeoTIFF. For the Landsat, each coverage is available on the server as 8-bit image tiles while the SRTM data are available as 16-bit signed image tiles. The first two “OUTPUTFORMAT” blocks associates the “NAME” GEOTIFF_RGB and GEOTIFF to a BYTE “IMAGEMODE” and will be used to retrieve the Landsat data. Both names actually use the same IMAGEMODE but it can be more intuitive to use the GEOTIFF_RGB when requesting composed Landsat images. The third block defines a GEOTIFF_INT16 “IMAGEMODE” to be used by the SRTM data. These image modes define image formats that can be requested in the WMS requests to the MapServer. Below is an extract of the ICEDS WCS mapfile.
…
OUTPUTFORMAT
NAME “geotiff_rgb”
DRIVER "GDAL/GTiff"
MIMETYPE "image/tiff"
IMAGEMODE BYTE #8-bit values
EXTENSION "tif"
END
OUTPUTFORMAT
NAME “geotiff”
DRIVER "GDAL/GTiff"
MIMETYPE "image/tiff"
IMAGEMODE BYTE #8-bit values
EXTENSION "tif"
END
OUTPUTFORMAT
NAME “geotiff_int16”
DRIVER "GDAL/GTiff"
MIMETYPE "image/tiff"
IMAGEMODE INT16 #16-bit signed integer values
EXTENSION "tif"
END
On the “LAYER” definition block, the “DUMP” keyword must be set as TRUE, otherwise the WCS server will not work properly.
LAYER
NAME "landsat"
STATUS OFF
TYPE RASTER
TILEINDEX "landsat/umms/wcs/band1/index_0002.shp"
TILEITEM "location"
UNITS DD
DEBUG ON
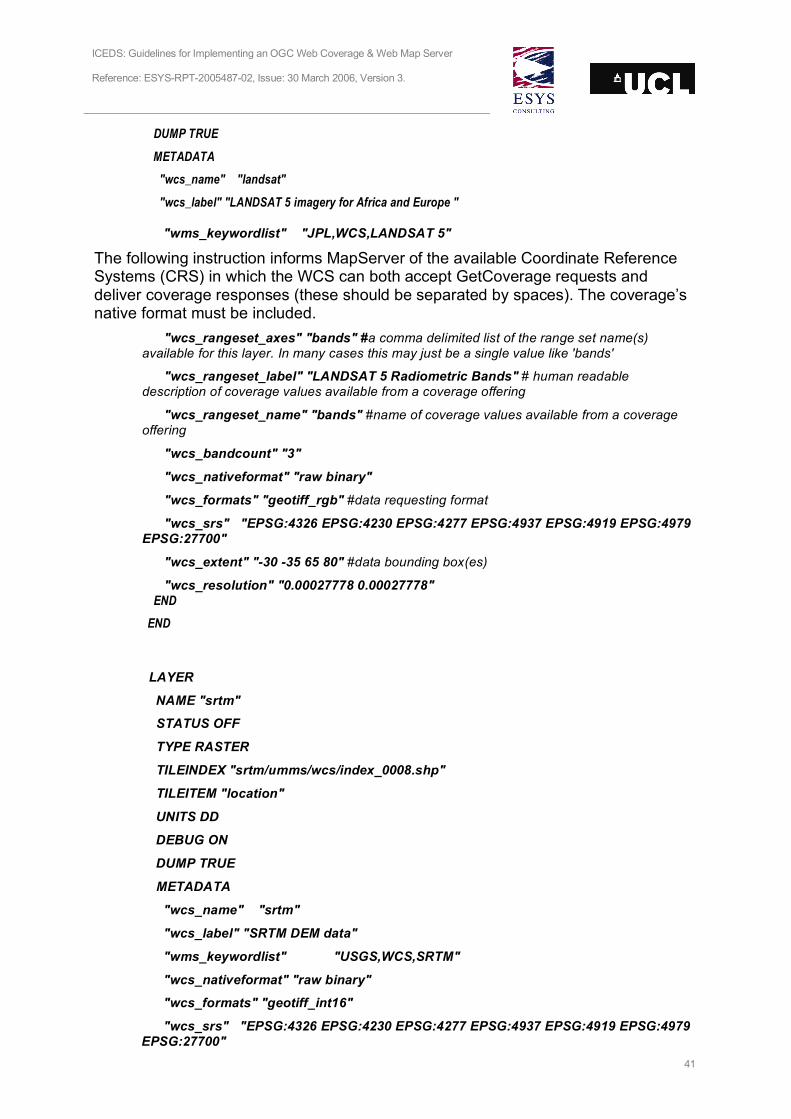
ICEDS: Guidelines for Implementing an OGC Web Coverage & Web Map Server Reference: ESYS-RPT-2005487-02, Issue: 30 March 2006, Version 3.
41
DUMP TRUE
METADATA
"wcs_name" "landsat"
"wcs_label" "LANDSAT 5 imagery for Africa and Europe "
"wms_keywordlist" "JPL,WCS,LANDSAT 5"
The following instruction informs MapServer of the available Coordinate Reference Systems (CRS) in which the WCS can both accept GetCoverage requests and deliver coverage responses (these should be separated by spaces). The coverage’s native format must be included.
"wcs_rangeset_axes" "bands" #a comma delimited list of the range set name(s) available for this layer. In many cases this may just be a single value like 'bands'
"wcs_rangeset_label" "LANDSAT 5 Radiometric Bands" # human readable description of coverage values available from a coverage offering
"wcs_rangeset_name" "bands" #name of coverage values available from a coverage offering
"wcs_bandcount" "3"
"wcs_nativeformat" "raw binary"
"wcs_formats" "geotiff_rgb" #data requesting format
"wcs_srs" "EPSG:4326 EPSG:4230 EPSG:4277 EPSG:4937 EPSG:4919 EPSG:4979 EPSG:27700"
"wcs_extent" "-30 -35 65 80" #data bounding box(es)
"wcs_resolution" "0.00027778 0.00027778" END
END
LAYER
NAME "srtm"
STATUS OFF
TYPE RASTER
TILEINDEX "srtm/umms/wcs/index_0008.shp"
TILEITEM "location"
UNITS DD
DEBUG ON
DUMP TRUE
METADATA
"wcs_name" "srtm"
"wcs_label" "SRTM DEM data"
"wms_keywordlist" "USGS,WCS,SRTM"
"wcs_nativeformat" "raw binary"
"wcs_formats" "geotiff_int16"
"wcs_srs" "EPSG:4326 EPSG:4230 EPSG:4277 EPSG:4937 EPSG:4919 EPSG:4979 EPSG:27700"

ICEDS: Guidelines for Implementing an OGC Web Coverage & Web Map Server Reference: ESYS-RPT-2005487-02, Issue: 30 March 2006, Version 3.
42
"wcs_extent" "-180 -56 180 61"
"wcs_resolution" "0.00083333 0.00083333"
"wcs_rangeset_name" "height"
"wcs_rangeset_label" "Height values from SRTM"
END
END
LAYER
NAME "eurolandsat_b4"
STATUS OFF
TYPE RASTER
TILEINDEX "landsat/umms/wcs/index_b4_0002.shp"
TILEITEM "location"
UNITS DD
DEBUG ON
DUMP TRUE
METADATA
"wcs_name" "eurolandsat_b4"
"wcs_label" "LANDSAT 5 band 4 imagery for Europe"
"wms_keywordlist" "JPL,WCS,LANDSAT 5"
"wcs_rangeset_axes" "bands"
"wcs_rangeset_label" "LANDSAT 5 Radiometric Band 4"
"wcs_rangeset_name" "bands"
"wcs_bandcount" "1"
"wcs_nativeformat" "raw binary"
"wcs_formats" "geotiff"
"wcs_srs" "EPSG:4326 EPSG:4230 EPSG:4277 EPSG:4937 EPSG:4919 EPSG:4979 EPSG:27700"
"wcs_extent" "-30 -35 65 80"
"wcs_resolution" "0.00027778 0.00027778"
END
END
# End of Layer Definitions
END
7.3 Testing the service
Having created the MapFiles, the user is now ready to test the application by issuing GetCapabilties requests to check that nothing is missing. The server will return an XML capabilities document listing all the configured MapFile parameters. The user should search for XML comments starting with "<!--WARNING: " since MapServer

ICEDS: Guidelines for Implementing an OGC Web Coverage & Web Map Server Reference: ESYS-RPT-2005487-02, Issue: 30 March 2006, Version 3.
43
includes these if it detects any missing MapFile parameters or metadata items. The request must match the following example:
http://my.host.com/cgi-in/mapserverapplicationame?map=/webpath/to/mywms.map&REQUEST=GetCapabilities
A map file, as specified in the previous sections, are specific inputs to the URL through the ‘map’ parameter. The following URLs will return the ICEDS capabilities files for comparison:
• ICEDS WMS: http://iceds.ge.ucl.ac.uk/cgi-bin/wms?map=wms.map&SERVICE=WMS&REQUEST=GetCapabilities
• ICEDS WCS: http://iceds.ge.ucl.ac.uk/cgi-bin/wcs?map=wcs.map&SERVICE=WCS&REQUEST=GetCapabilities
If the GetCapabilities requests are successful, the MapServer should be successfully serving its data to the Internet. To check the correct operation of WMS services, URLs can be constructed to return images that can be displayed in a browser window. For example, the following URL will extract a JPEG image of the Landsat 5 mosaic for all of Africa from the ICEDS server:
• http://iceds.ge.ucl.ac.uk/cgi-bin/wms?map=wms.map&VERSION=1.1.1&REQUEST=GetMap&SRS=EPSG:4326&BBOX=-30,-35,112.86,65&WIDTH=600&HEIGHT=420&LAYERS=LANDSAT5&FORMAT=image/jpeg&BGCOLOR=0xffffff&TRANSPARENT=TRUE&EXCEPTIONS=application/vnd.ogc.se_inimage
Alternatively, a Web client such as the Intergraph WMS Viewer28 application can be used to test the connection to the reader’s new service. The basic MapServer URL will contain the reference to the map file as follows:
• http://iceds.ge.ucl.ac.uk/cgi-bin/wms?map=wms.map&… Some systems expect the URL to end before the “?” which marks the start of the URL parameters. The system administrator may also prefer to use simpler URL to access MapServer without the need to specify the path and name of the MapFile. In this case, a wrapper shell script can be set up (in Linux/UNIX) that sets a MS_MAPFILE environment variable to store the path and name of the MapFile and then passes control to the MapServer CGI executable. Two wrapper shell scripts were used (inside the cgi-bin folder), one for the WMS and one for the WCS. Each one calls a different MapFile and a different MapServer executable. Please note that different names were given to the WMS and WCS MapServer executable files, however the content of the files are exactly the same. This was done just to simplify the URL in previous stages of the project.
• Wrapper shell script icedswms #! /bin/sh
# MapFile location & name
MS_MAPFILE=/var/www/cgi-bin/wms.map
export MS_MAPFILE
# MapServer executable path & name
/var/www/cgi-bin/wms
28
http://www.wmsviewer.com/

ICEDS: Guidelines for Implementing an OGC Web Coverage & Web Map Server Reference: ESYS-RPT-2005487-02, Issue: 30 March 2006, Version 3.
44
• Wrapper shell script icedswcs #! /bin/sh
# MapFile location & name
MS_MAPFILE=/var/www/cgi-bin/wcs.map
export MS_MAPFILE
# MapServer executable path & name
/var/www/cgi-bin/wcs
Using such a script, the above WMS URL can be simplified as shown below: • http://iceds.ge.ucl.ac.uk/cgi-bin/icedswms?VERSION=1.1.1&REQUEST=GetMap&SRS=EPSG:4326&BBOX=-30,-
35,112.86,65&WIDTH=600&HEIGHT=420&LAYERS=LANDSAT5&FORMAT=image/jpeg&BGCOLOR=0xffffff&TRANSPARENT=TRUE&EXCEPTIONS=application/vnd.ogc.se_inimage
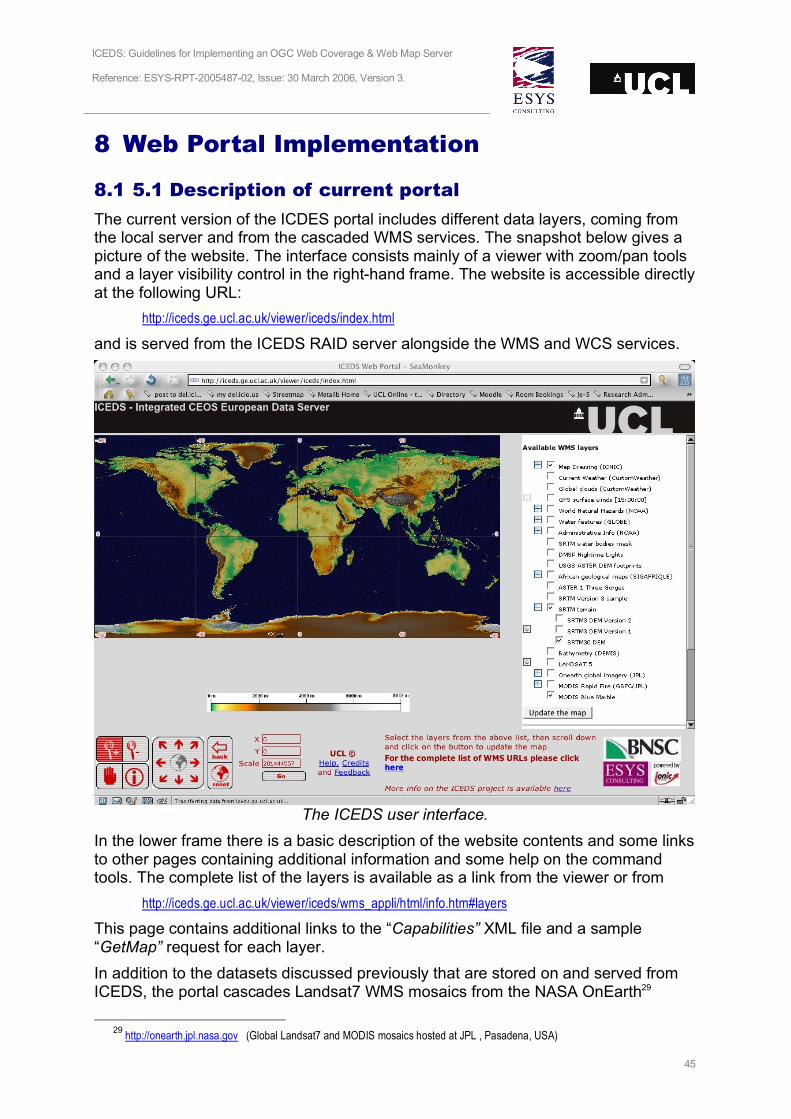
ICEDS: Guidelines for Implementing an OGC Web Coverage & Web Map Server Reference: ESYS-RPT-2005487-02, Issue: 30 March 2006, Version 3.
45
8 Web Portal Implementation
8.1 5.1 Description of current portal
The current version of the ICDES portal includes different data layers, coming from the local server and from the cascaded WMS services. The snapshot below gives a picture of the website. The interface consists mainly of a viewer with zoom/pan tools and a layer visibility control in the right-hand frame. The website is accessible directly at the following URL:
http://iceds.ge.ucl.ac.uk/viewer/iceds/index.html and is served from the ICEDS RAID server alongside the WMS and WCS services.
The ICEDS user interface.
In the lower frame there is a basic description of the website contents and some links to other pages containing additional information and some help on the command tools. The complete list of the layers is available as a link from the viewer or from
http://iceds.ge.ucl.ac.uk/viewer/iceds/wms_appli/html/info.htm#layers This page contains additional links to the “Capabilities” XML file and a sample “GetMap” request for each layer. In addition to the datasets discussed previously that are stored on and served from ICEDS, the portal cascades Landsat7 WMS mosaics from the NASA OnEarth29
29
http://onearth.jpl.nasa.gov (Global Landsat7 and MODIS mosaics hosted at JPL , Pasadena, USA)

ICEDS: Guidelines for Implementing an OGC Web Coverage & Web Map Server Reference: ESYS-RPT-2005487-02, Issue: 30 March 2006, Version 3.
46
server; bathymetry from the DEMIS30 website; World natural hazards and city names and country borders information from the NOAA31 server; constantly updated weather information kindly made available from CustomWeather32; rivers and coastlines from the GLOBE33 WMS server; NASA ASTER DEM footprints from the USGS34; daily MODIS mosaics from the Aqua and Terra sensors from GSFC/JPL35 and geology and other data from the SIGAFRIQUE36 service. Functionality has also been added to provide a cursor-based readout of latitude and longitude position. The portal usability is high and allows non-expert GIS users to manage and visualize the various sets of data. The ability to select the layers in the display allows the creation of composite and personalised maps that can be saved as images. The zoom and pan tools (shown below) give enough capacity to discover the datasets and make useful visual analysis in a very short time considering the amount of data accessed and considering that all the data-access is available through a web-service available everywhere and to everybody for free. The current version of the software allows groups of layers from individual servers to be expanded or contracted to save window space (using the ‘+’ and ‘-‘ icons – see the layers controls image below).
Map navigation tools
30
http://www.demis.nl/home/pages/home.htm 31
http://www.ngdc.noaa.gov/ 32
http://www.customweather.com/
33 http://www.globe.gov/ (a joint project managed by UCAR/CSU with support from NASA, NSF, the US Dept. of State, and other cooperating organizations.) 34
http://www.usgs.gov/
35 http://onearth.jpl.nasa.gov (Global Landsat7 and MODIS mosaics hosted at JPL , Pasadena, USA)
36 http://www.sigafrique.net/

ICEDS: Guidelines for Implementing an OGC Web Coverage & Web Map Server Reference: ESYS-RPT-2005487-02, Issue: 30 March 2006, Version 3.
47
Layer controls. The ‘+’/’-‘ icons control server layer list expansion.
Down-arrow icons provide links to download source data (section 5.1). The drop-down list of layer effects can also be seen at the bottom of the layer list (section 5.2).
The portal is based on the “Geographic Application Framework”, or GAF, provided with the IONIC RedSpiderWeb software (see Appendix B), adapted to the needs of the ICEDS interface and customized to include only the relevant tools and information. The Administrator Guide for the GAF provides exhaustive support on how to modify the various frames and a description of the webpage architecture. There are three main files that characterize the interface:
• Init.js includes references to all the layers listed in the right frame of the webpage. There are several controls that can be configured to adjust the initial visualization, the map dimensions and other features. All the sections are well furnished with comments and help text on how to configure the parameters;
• Navigation.html contains the links to the javascripts command tools and the table of the script appearing in the lower frame of the page.
• info.htm includes the pop-up page which appears when clicking on the “help”, “credits” or “layer list” links.
ICEDS: Guidelines for Implementing an OGC Web Coverage & Web Map Server Reference: ESYS-RPT-2005487-02, Issue: 30 March 2006, Version 3.
48
All the other frames are managed automatically or can be easily modified using the Administrator Guide or following the easy HTML structure of the files. It should be noted that the Minnesota Map Server package provides some capability for Web client creation that has not been explored within the ICEDS project. There are also a number of Open Source interfaces to WMSs such as OpenLayers37 or “ka-Map38” that provide different functionality to the ICEDS or GAF interfaces. A basic Web portal can be created using basic HTML forms and Javascript. The map itself is generated by a URL, which returns an image. This URL can form the HREF attribute of an IMG tag in the Web page. The HREF attribute can be constructed using Javascript embedded in the Web page which collects its information from HTML form elements on the page. The form elements indicate which layers are switched, what the current zoom extent is, etc. and can be passed from one HTML page to another, particularly through hidden form variables. Further capabilities can be added using server-side processing, particular Active Server Pages (ASP) (on a Windows server) or Java Server Pages (JSP). This allows the server to do some processing to determine the content of an updated Web portal page as a result of HTML form submission. An example ASP page, incorporating Visual Basic Script for server-side processing and Javascript for client-side processing, is included in the ICEDS example scripts, based on an example by Cadcorp. The IONIC GAF client was adopted at an early stage in the ICEDS project for server testing and has stayed as a straightforward and accessible interface that is easy to adapt. The ICEDS team were keen to add functionality to increase the utility of the portal beyond simple viewing, for example to allow better layer inter-comparison. However, this was to be achieved without the use of a plug-in or applet in the browser (to ensure that the site is as widely compatible as possible), but preferably through client-side (in-browser) processing for speed and interactivity. This has been achieved by programming the interface in Javascript in the client Web browser, using more advanced browser capabilities and making use of the way that the GAF system handles the individual layers of the map. The following sections discuss some of the functionality added to the original GAF by the ICEDS team and the functionalities exploited in the OGC specifications or modern Web browsers. The simplest change to the GAF was to incorporate an extra frame below the map area to display dataset legends – this is currently only employed for the SRTM height colour key (see interface screenshot above).
37
http://www.openlayers.org/ 38
http://ka-map.maptools.org/

ICEDS: Guidelines for Implementing an OGC Web Coverage & Web Map Server Reference: ESYS-RPT-2005487-02, Issue: 30 March 2006, Version 3.
49
8.2 Data download
The ICEDS portal allows the download of Landsat and SRTM3 data when clicking the red down-arrow icon to the left of the Layer name (see layer controls image above). Clicking the down-arrow icon temporarily replaces the layer list with a confirmation dialog (shown below). The link attached to the down-arrow icon in the confirmation dialog is a link to a GeoTIFF file of the data requested. There is an unfortunate complication here. If the user has Quicktime installed on their machine, an ordinary click on this link will not save the file but start the Quicktime plug-in to load the GeoTIFF file. However the plug-in does not recognise the GeoTIFF extensions to TIFF and hence fails to load the file. Thus users are encouraged in the ICEDS confirmation dialog to right-click and explicitly save the linked file.
Download confirmation dialog
The extracted data has the same extent as the mapping window. The download through the Web page is deliberately limited to areas covering a relatively small geographic extent to limit the file size to 50 MB, so as not to overload the server. The size is estimated from the extent and resolution of the requested extract.
ICEDS: Guidelines for Implementing an OGC Web Coverage & Web Map Server Reference: ESYS-RPT-2005487-02, Issue: 30 March 2006, Version 3.
50
This functionality works by computing a WCS GetCoverage URL corresponding to the current map extent and the layer clicked in the legend. The user is thus presented with a link to a GeoTIFF file for the appropriate area. In this case, the GeoTIFF comes out of some processing in the WCS but to a user the link works the same as access to a file on the server disk. To find out the WCS request that is being sent to the server, copy and paste the URL for the download link in the confirmation dialog. This only works for areas covering a limited geographic extent since the file size is limited to 50 MB through this interface. The WCS itself is not, however, currently limited in the requests that it will service.
8.3 Layer effects
Since the layers in the final map may be coming from multiple WMSs, the GAF system in fact loads each layer of the map as a separate HTML element (either LAYER or DIV elements) which are overlaid by the browser. Transparency of pixels in either GIF or PNG image formats is used to make parts of any image “see-through” to display the layers below. The ICEDS portal’s functionality is built almost entirely by Javascript code running in the browser, downloaded when the site initially loads. Modern browsers (Internet Explorer 5+, and the Mozilla/Firefox series) give additional properties to the LAYER and DIV page elements that can be controlled from Javascript. In particular, these elements have properties of OPACITY, VISIBILITY and CLIP. OPACITY values are by default 1 but can be changed to a range of 0 to 1. At a value of 0, the element is invisible; at values between 0 and 1, the layer is partially transparent, with the element’s pixel values being combined with values from the elements below. This property value is stored in the Javascript code for each map layer and can be adjusted through the portal to give advanced overlay maps (e.g. to overlay SIGAFRIQUE African geology on the SRTM hill-shaded topography). Unfortunately this property does not work on the Macintosh version of Internet Explorer 5 – the only example where cross-browser and cross-platform compatibility has been lost. In Windows Internet Explorer, the change of property value is not immediately reflected in the browser, so a map refresh is necessary in this case. The images should be available still in the browser cache so the refresh should be quick. Layer flickering is enabled by using a timer event in the browser. Every time the timer ‘ticks’ the VISIBILITY property of the chosen layer is inverted (between “hidden” and “visible”). When “hidden” the browser does not display the element. The change of property value has immediate effect so the page does not need to be refreshed. The CLIP property is a sub-element of the overall STYLE property of an HTML element. The CLIP property also alters the visibility of an element within a region of a browser window. In the ICEDS interface, the property is used to create a ‘swipe tool’. When a swipe is active, the mouse pointer is followed (via a MouseMove event routine) and a clipping region set base on the mouse position. So the following code displays only the area of the element whose reference is stored in clip_elt which lies to the right of pixel x in the map frame. A rectangular clipping area is used for this. The SYLE property follows the default style sheet behaviour for the application – here. Cascading Style Sheets (CSS).

ICEDS: Guidelines for Implementing an OGC Web Coverage & Web Map Server Reference: ESYS-RPT-2005487-02, Issue: 30 March 2006, Version 3.
51
var defClip = "rect(0px "+x+"px "+(MAP_HEIGHT_PIXELS-1)+"px 0px)";
clip_elt.style.clip = defClip;
When either the “Layer style” or the “Flicker layer” layer effect (see layer controls image above) is chosen, user input (e.g. which layer to flicker) is requested. The interface controls appear temporarily in the legend area of the interface. The aim here is to avoid the use of pop-up windows (which are annoying and now blocked by many browsers) and to avoid interface overloading, with too many controls visible at once. The following snapshot shows the re-use of the legend area of the interface for user input to control layer opacity.
Re-use of the legend area for transient user interface controls. (High-lighted in the yellow ellipse).
8.4 Layer styles
The OGC WMS specification includes a STYLE parameter (not to be confused with the HTML/CSS STYLE property discussed in the previous section). The parameter allows a layer to be served and hence requested in a variety of rendering styles. At present, the ICEDS service itself does not carry any layers with multiple styles. However, the OnEarth layers which the ICEDS interface cascades does carry multiple styles. At present, two OnEarth layers are served through ICEDS: the Landsat 7 global mosaic and the SRTM near-global SAR amplitude mosaic. Each of these layers is served in multiple styles39. The ICEDS client allows different styles to be selected for layers where this is available. At present, the choice of styles is hard-coded in the layer list but could be parsed from the WMS capabilities for each server. (Though an XML parser is quite a bit of extra code to add to a Javascript client). Essential the style selector simply presents the user with the list of available styles for a selected layer, and then uses the chosen value in the STYLE parameter within the WMS request for that layer.
39
See http://onearth.jpl.nasa.gov for details.

ICEDS: Guidelines for Implementing an OGC Web Coverage & Web Map Server Reference: ESYS-RPT-2005487-02, Issue: 30 March 2006, Version 3.
52
8.5 Temporal Selection
The latest version of the ICEDS client cascades surface wind forecast data40. These data are the results of a model which is used for forecasting and can provide wind fields at 3 hourly time steps out to 3 days from present (and at reduced resolution further into the future). An aim of the last phase of the ICEDS project was to add a temporal selection facility to the client. To be fully flexible, such a system would need to rely on a product catalog + metadata to list the available datasets. In the case of the GFS wind data, the available times can be predicted because of the regular output interval of the model. It is this form of prediction that the ICEDS client currently relies on. In terms of coding, the Javascript Date() object is of great use. There are a number of resources on the Web with details. Of note are that the object can report or set dates in UTC milliseconds since the Unix epoch (midnight on 1st January 1970) as well as local time strings. (Note that the present time is based on the local system clock and so will only be as accurate as that clock.) Hence, for example, the following Javascript code will give the closest ‘selectable time’ to a given time, based on a model’s interval and a reference time of day. // Finds the nearest selectable time to a given time // - assumes intvl divides into day length so that reference time is // the same every day. // - could easily contruct similar routine to take a single reference // epoch (i.e. specific time on specific date). // // now_ms: time in millisecs since Unix epoch // intvl: time interval (in ms) between selectable times // refHour: reference hours during each day // refMin: reference time during each day // function getNearestSelTime(now_ms, intvl, refHour, refMin) { var now = new Date(now_ms); // Reconstruct "current" time // Same day/month/year var d = now.getDate(); var m = now.getMonth(); var y = now.getFullYear(); // Construct reference time in Date object. var ref_time = new Date(y, m, d, refHour, refMin, 0); // d, m, y, hr, mins, secs. // Calculate intervals elapsed since reference time var delta_t = (now_ms - ref_time.getTime()) / intvl; // Round the delta_t value, convert back to ms and add to refernce time to get the nearest selectable time return ref_time.getTime() + intvl * Math.round(delta_t); }
40
From the NCEP (National Centres for Environmental Prediction; http://www.ncep.noaa.gov/ ) GFS (Global Forecast System)
model, served by WMS by Comsine Ltd. (www.comsine.co.uk).

ICEDS: Guidelines for Implementing an OGC Web Coverage & Web Map Server Reference: ESYS-RPT-2005487-02, Issue: 30 March 2006, Version 3.
53
In the ICEDS interface, temporal selectability of a layer is indicated by a small clock icon next to the layer (see snapshot of the controls in section 5.1). This option is unavailable (‘greyed out’) until the layer is switched on. This tool re-uses the layer frame (as opposed to the legend frame as used by the other tools). This is because there are a number of possible future models outputs from which to select and the interface is designed to give thumbnails of these outputs, so a larger display area is needed. The following figure shows the layer frame is used for temporal selection:
ICEDS interface showing temporal selection of GFS winds with thumbnails.
Thumbnails are easily generated from a WMS source by simply requesting the map or layer with a smaller WIDTH/HEIGHT parameter pair in the GetMap call.
8.6 Gazetteer
A gazetteer function is now also provided in the ICEDS portal. The option for this is below the layer list in the right-hand frame, as shown below:

ICEDS: Guidelines for Implementing an OGC Web Coverage & Web Map Server Reference: ESYS-RPT-2005487-02, Issue: 30 March 2006, Version 3.
54
The gazetteer tool.
A user can enter a place name in the text box and press the “Find Location” button. Optionally, the user can also select from the list what sort of place the name refers to (e.g. a Populated Place). The system then uses the free Geonames web service41 to look up feature records matching the search. Options are then presented in the Legend Window for the user to select from.
Results from a gazetteer search for “London”. Columns are Feature Name, Country
Code, Latitude, Longitude, Feature Type Code.
41
About the Geonames web service: http://www.geonames.org/export/

ICEDS: Guidelines for Implementing an OGC Web Coverage & Web Map Server Reference: ESYS-RPT-2005487-02, Issue: 30 March 2006, Version 3.
55
8.7 Connection from other OGC clients
Since ICEDS serves its information using OGC web services, other clients can easily connect to the service, other than the Web portal. For those expert technicians interested in connecting their OGC WMS compliant clients to these data sources, there are few simple steps to access them:
1. Open the layer list html webpage (the link given in section 5.1) 2. Open the service GetCapabilities link (“xml” link) 3. Find the “online resource” tag in the XML file 4. Add the service URL in your client or viewer
Some WMS compliant viewers are available online42 and allow advanced processes. Others are integrated into desktop applications like ArcGIS 9, MapInfo 7 or Cadcorp SIS 6. ICEDS has been demonstrated to interoperate with a number of clients, including desktop GISs such as ArcGIS (WMS) and Cadcorp SIS (WMS, WCS), web clients such as that of GeoConnections Canada43, and more specialised clients such as the osgPlanet 3D viewer44. This is mostly a reflection of the quality of the UMMS.
8.8 Google Earth
The geographic data display system that has probably had most impact on the public is the Google Earth 3D browser. At the time of writing (March 2006), Google Earth cannot directly connect to OGC WMS map sources. The Google Earth data and service descriptions are built around KML (Keyhole Markup Language) – a different XML application from those used by OGC. In a KML file, links to Web-based map services is provided by a <NetworkLink> element. The basic method for interfacing Google Earth to WMS is to use a proxy service. Such a service is a program which is able to receive and interpret KML requests, make an equivalent WMS request, and return the resulting map in response to the original KML request. The European Space Agency (ESA) provide this form of proxy. A KML file can be found on the ICEDS website to connect Google Earth to a number of ICEDS layers. Below is a shorter example of a KML file which uses ESA’s proxy to connect to ICEDS – the gproxy.php service takes the usual OGC parameters + the WMS server address in the SERVER parameter. <?xml version="1.0" encoding="UTF-8" ?> <kml xmlns="http://earth.google.com/kml/2.0"> <Folder> <name>ICEDS WMS service</name> <open>1</open> <NetworkLink> <name>SRTM hillshaded topography</name> <Url>
42
For example again, the Intergraph WMS MapViewer: http://www.wmsviewer.com/ 43
http://cgdi-dev.geoconnections.org/prototypes/owsview/ 44
http://www.ossim.org/tiki-read_article.php?articleId=3

ICEDS: Guidelines for Implementing an OGC Web Coverage & Web Map Server Reference: ESYS-RPT-2005487-02, Issue: 30 March 2006, Version 3.
56
<href>http://mapdev.esrin.esa.int:8080/gproxy.php?REQUEST=GetMap&SERVICE=WMS&LAYERS=srtm&VERSION=1.1.1&FORMAT=JPEG&SERVER=http://iceds.ge.ucl.ac.uk/cgi-bin/icedswms_noint</href> <viewRefreshMode>onStop</viewRefreshMode> </Url> <visibility>1</visibility> </NetworkLink> </Folder> </kml>
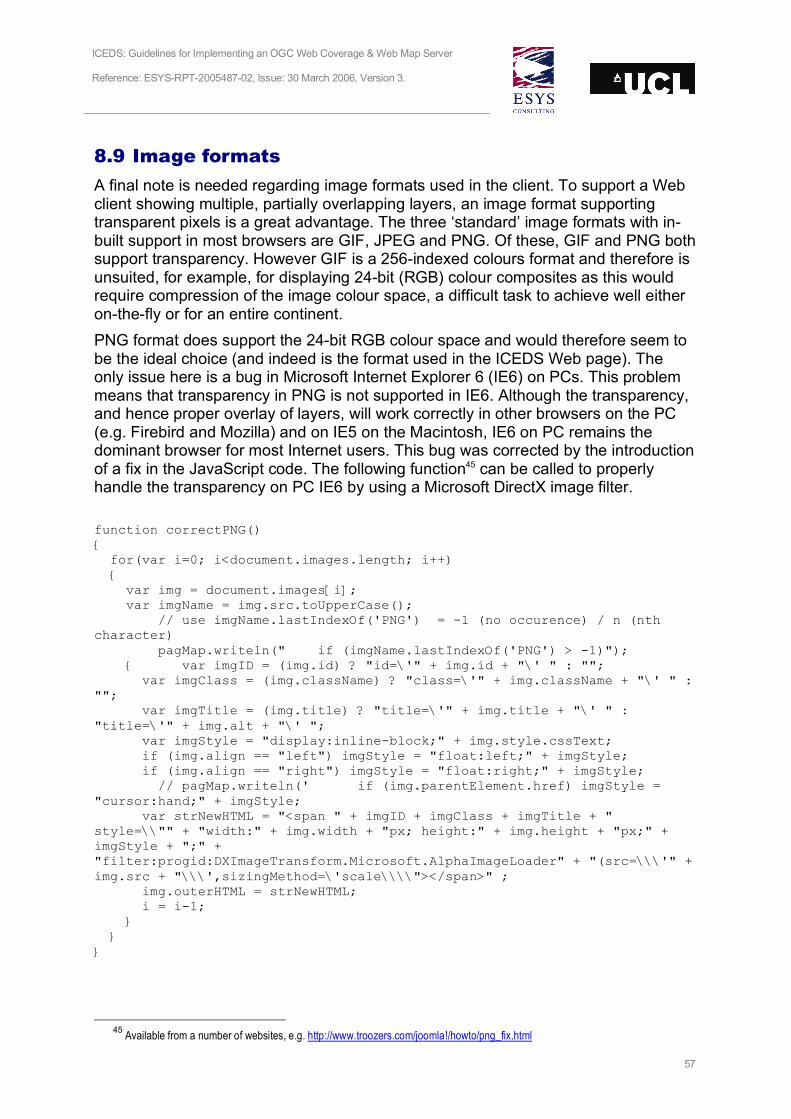
ICEDS: Guidelines for Implementing an OGC Web Coverage & Web Map Server Reference: ESYS-RPT-2005487-02, Issue: 30 March 2006, Version 3.
57
8.9 Image formats
A final note is needed regarding image formats used in the client. To support a Web client showing multiple, partially overlapping layers, an image format supporting transparent pixels is a great advantage. The three ‘standard’ image formats with in-built support in most browsers are GIF, JPEG and PNG. Of these, GIF and PNG both support transparency. However GIF is a 256-indexed colours format and therefore is unsuited, for example, for displaying 24-bit (RGB) colour composites as this would require compression of the image colour space, a difficult task to achieve well either on-the-fly or for an entire continent. PNG format does support the 24-bit RGB colour space and would therefore seem to be the ideal choice (and indeed is the format used in the ICEDS Web page). The only issue here is a bug in Microsoft Internet Explorer 6 (IE6) on PCs. This problem means that transparency in PNG is not supported in IE6. Although the transparency, and hence proper overlay of layers, will work correctly in other browsers on the PC (e.g. Firebird and Mozilla) and on IE5 on the Macintosh, IE6 on PC remains the dominant browser for most Internet users. This bug was corrected by the introduction of a fix in the JavaScript code. The following function45 can be called to properly handle the transparency on PC IE6 by using a Microsoft DirectX image filter. function correctPNG() { for(var i=0; i<document.images.length; i++) { var img = document.images[i]; var imgName = img.src.toUpperCase(); // use imgName.lastIndexOf('PNG') = -1 (no occurence) / n (nth character) pagMap.writeln(" if (imgName.lastIndexOf('PNG') > -1)"); { var imgID = (img.id) ? "id=\'" + img.id + "\' " : ""; var imgClass = (img.className) ? "class=\'" + img.className + "\' " : ""; var imgTitle = (img.title) ? "title=\'" + img.title + "\' " : "title=\'" + img.alt + "\' "; var imgStyle = "display:inline-block;" + img.style.cssText; if (img.align == "left") imgStyle = "float:left;" + imgStyle; if (img.align == "right") imgStyle = "float:right;" + imgStyle; // pagMap.writeln(' if (img.parentElement.href) imgStyle = "cursor:hand;" + imgStyle; var strNewHTML = "<span " + imgID + imgClass + imgTitle + " style=\\"" + "width:" + img.width + "px; height:" + img.height + "px;" + imgStyle + ";" + "filter:progid:DXImageTransform.Microsoft.AlphaImageLoader" + "(src=\\\'" + img.src + "\\\',sizingMethod=\'scale\\\\"></span>" ; img.outerHTML = strNewHTML; i = i-1; } } }
45
Available from a number of websites, e.g. http://www.troozers.com/joomla!/howto/png_fix.html

ICEDS: Guidelines for Implementing an OGC Web Coverage & Web Map Server Reference: ESYS-RPT-2005487-02, Issue: 30 March 2006, Version 3.
58
9 Conclusions A principal factor that has determined the direction and rate of progress in the ICEDS project has been the newness of the WCS OGC specification. Although many Web GIS packages have supported WMS for some time, WCS implementations are new and generally still developing. This was true of all the packages tested (IONIC RedSpiderWeb, Deegree and the University of Minnesota MapServer). Within the time span of this project, MapServer has proved to be the most advanced and flexible of these packages and hence has been adopted and discussed in the preceding chapters. However, it should be noted that the other two packages listed above and others are developing quickly and readers may well find capabilities to recommend other map server software. This is a fast moving area – at the time of this document’s creation (March 2006), discussions are underway in OGC for a new and improved revision of the WCS specifications and this will also have an impact on the server packages. The power of the OGC methods used to create the ICEDS server lies perhaps less in the obvious Web portal. A number of such portals, allowing users to view large spatial datasets online, are becoming available, the JPL OnEarth service being a good example. Where there is in fact most potential is the WCS interface. This allows live, online access to data (as opposed to maps) and can form the start of an online processing chain. OGC interoperability forms the glue that allows online program components to share and chain information – this is particularly useful, for example, in the new web services paradigm.

ICEDS: Guidelines for Implementing an OGC Web Coverage & Web Map Server Reference: ESYS-RPT-2005487-02, Issue: 30 March 2006, Version 3.
59
Appendix A. ICEDS Team Members
Mr. Jeremy G. Morley
Prof. Jan-Peter A.L. Muller°
Mr. Ludwig Brinckmann°
Mr. Nuno A. Gil*
Mr. Cristiano Giovando*
Dept. Civil, Environmental &
Geomatic Engineering,
University College London Mr. Kashif Munir*
Mr. Oliver Greening*
Mr. Andy Shaw*
ESYS plc
Dr. Rob Scott*
QinetiQ, Space Department (on behalf on BNSC)
Dr. Wyn Cudlip
°: now with Mullard Space Science Lab, University College London. *: now with other organisations.

ICEDS: Guidelines for Implementing an OGC Web Coverage & Web Map Server Reference: ESYS-RPT-2005487-02, Issue: 30 March 2006, Version 3.
60
Appendix B. Other Servers and Processing Methods
This appendix summarises additional methods of some interest that were explored during the project. Two other map server packages have been used in the process of publishing OGC compliant web-services in addition to the Minnesota MapServer. One of them is commercial software, RedSpider by the company IONIC and the other an open-source, Deegree distributed by the University of Bonn. UCL has an academic contract with IONIC, for free use of the software RedSpiderWeb 3.1 within the university’s non profit activities and mainly for use within the ICEDS project. Two licences have been released, one for the map-serving software, the other for the use of “Studio”, an advanced tool for creating geo-portals and web interfaces. However this package is usually a full-priced commercial product. RedSpiderWeb allows publishing WMS services in an easy way. There are several types of geographic information that can be served with this software and files can be stored in different ways into digital archives to be accessed by the servlet. For the aim of this project, big raster dataset have to be used, such as the global mosaics of the SRTM and LANDSAT. The RedSpiderWeb software was provided at no cost by IONIC within their academic contract established with UCL and the framework of the ICEDS project. This software is designed to support and facilitate the deployment of OGC compliant web-services. Although not intuitive to setup and install, a detailed user guide and good support was provided by the company allowed a complete WMS and WFS services to be set up for various types of datasets. For the second ICEDS prototype, a number of the servlets offered in the IONIC package were used in order to publish the SRTM hill-shaded and colourised mosaics of European area, the African continent and India. The IONIC image servlet is a Java component that manages and delivers an image service on geo-enabled raster files and is able to manage one single image or multiple images organized as a layer in a directory. The Image servlet is wrapped by the IONIC WMS framework and allows the client to discover and query geo-raster through a coherent and standard-based WMS interface. The setup of an image server is accomplished by configuring an ImageProvider on a raster database of multiple images (tiles) organized as a layer, geospatially indexed, and stored in a directory (LayerProvider). The image files can be of multiple types, but the engine is mostly designed to produce good results on uncompressed TIFF and GeoTIFF images. To access a collection of images and see them as a single layer, it is necessary to configure the LayerProvider in the "providers.fac" and to mention, as JCLASS attribute of the CREATE element, the “com.ionicsoft.wmtmap.provider.imageProvider.LayerProvider” class. The mandatory element to put in the CREATE attribute is the PARAM element that has "path" as NAME attribute. The path to the directory where the index file is the VALUE attribute. This is an example of the configured LayerProvider: <CREATE ID="SRTM" JCLASS="com.ionicsoft.wmtmap.provider.imageProvider.LayerProvider"/>

ICEDS: Guidelines for Implementing an OGC Web Coverage & Web Map Server Reference: ESYS-RPT-2005487-02, Issue: 30 March 2006, Version 3.
61
<PARAM NAME="path" VALUE="C:\iceds\srtm\tiles"/> <PARAM NAME="name" VALUE="SRTM" /> <PARAM NAME="SRS" VALUE="EPSG:4326" /> </CREATE>
It is possible then to add other parameters reflecting the required information for the capabilities file of the WMS service, like CONTACT_INFO, VENDOR_SPECIFIC, etc. Having a layer of images to be accessed in a continuous way, an index file was created to allow faster access to the correct files, when requested by the servlet. This binary file has the following structure, including the dimensions in pixels, the geographic extent and the name of each tile: H_IONIC_LAYER V 1 C 1115 200407021713 1206 1206 0.0 33.99902 1.00098 35.0 N34E000.tif 1206 1206 1.0 33.99902 2.00098 35.0 N34E001.tif 1206 1206 2.0 33.99902 3.00098 35.0 N34E002.tif 1206 1206 3.0 33.99902 4.00098 35.0 N34E003.tif 1206 1206 4.0 33.99902 5.00098 35.0 N34E004.tif
The large SRTM dataset generated during the data processing phase is composed of more than 1000 single tiles (files), for a total amount of 4GB disk-space. Setting up a single LayerProvider on top of this huge dataset, would cause the system to be too slow in reading and publishing the data requested. This issue derives from a common scenario of portraying a large raster dataset in a fast and reliable way, and can be solved by setting up a PyramidProvider, which displays and configures the same imagery data at several scales depending on the viewable scale range. The PyramidProvider connector acts as a proxy provider on top of one or more providers, and chooses between the providers for each request depending on the requested scale. Therefore, it is necessary to configure one provider for each different data source and display scale, plus the pyramid provider itself. It was decided, after several performance tests, that two levels were necessary to setup a reliable and fast enough WMS service. The full resolution works on the full 1,118 tiles and within a scale range of 1:1 to 1:3,000,000. The second, lower resolution pyramid is used from 1:3,000,000 to the smallest, whole-Europe scale. The pyramid provider inherits the global capabilities information from the proxied providers, named the "master" (the first at full resolution), so it’s necessary to configure at least one of the providers with meaningful information for the service name, title and abstract, the supported requests, the layer list and the supported SRSes. The project investigated beta software provided by IONIC containing a WCS implementation as a version of RSW had not been released that supported WCS in the early phases of the project (Summer 2004). This implementation required the WCS data to be stored in a database such as Oracle or MySQL. This was beyond the scope of ICEDS and was not investigated further. It was expected that the full release of the RSW WCS would support indexed files as inputs to the server.

ICEDS: Guidelines for Implementing an OGC Web Coverage & Web Map Server Reference: ESYS-RPT-2005487-02, Issue: 30 March 2006, Version 3.
62
Appendix C. MapServer 4.4.1 cookbook MapServer is a stand-alone application that can be used/compiled on several operating systems. In this chapter it is assumed that the package will be installed on a Linux server running the Apache HTTP Server46: in development, the ICEDS Web map services have been running on the RAID server storing the data, hence the above configuration. The MapServer application is called by the Web server through the Common Gateway Interface (CGI) method. The package works collaboratively with other additional libraries. Each library adds additional functionalities to MapServer’s core application. The MapServer source code can be downloaded from http://mapserver.gis.umn.edu/dload.html. The additional libraries as well as their functions are described below (taken from the MapServer Website).
• GD: For rendering GIFs or PNGs (Mandatory, version 2.0.12 or greater
required).
http://www.boutell.com/gd/
• PROJ.4: For on-the-fly projection conversion (Recommended, mandatory
for WMS Support). For WMS, you will need AT LEAST version 4.4.3.
http://www.remotesensing.org/proj/
• Zlib: Along with LibPNG, this is also required by GD. Zlib provides support
for file compression. (Mandatory) http://www.gzip.org/zlib/
• LibCURL: For WMS/WFS Client Connections support (Optional, required
WMS/WFS Support, Version 7.10 or greater required). http://curl.haxx.se/libcurl/
• LibWWW: Needed for WMS client connections. (Optional but required for
WMS Client compliance) http://www.w3c.org/Library/
• LibPNG: Required by GD and, thus, necessary to build MapServer
(Mandatory) http://www.libpng.org/pub/png/
46
http://httpd.apache.org/

ICEDS: Guidelines for Implementing an OGC Web Coverage & Web Map Server Reference: ESYS-RPT-2005487-02, Issue: 30 March 2006, Version 3.
63
• LibTIFF: For TIFF support (Optional47). http://www.libtiff.org/
• LibGeoTIFF: For GeoTIFF (Geo-Referenced TIFF Images) Support
(Optional6). http://www.remotesensing.org/geotiff/geotiff.html
• LibJPEG: For JPEG Support (Optional). ftp://ftp.uu.net/graphics/jpeg/
• FreeType: For TrueType font support. This is used through GD only,
MapServer does not compile against it directly (Optional but highly
recommended, version 2.x+ required). http://www.freetype.org/
• OGR Simple Features Library: For providing I/O for a variety of VECTOR
file formats, e.g. ESRI Shapefiles. (Optional – a part of GDAL 1.1.8). http://gdal.velocet.ca/projects/opengis/
• GDAL - Geospatial Data Abstraction Library: For providing I/O for a
number of RASTER formats (Optional, version 1.1.8 or later required). http://www.remotesensing.org/gdal/
• SDE Client Librairies: These libraries are provided with ESRI's Spatial
Data Warehouse ArcSDE (Optional).
• PostgreSQL Client: In order for MapServer to be able to read PostGIS
data, it needs to be compiled against the PostgreSQL client libraries.
(Optional). http://www.postgresql.org/
• Oracle Spatial Client Librairies: These librairies are provided with your
Oracle product, and used to interface with an Oracle Spatial warehouse.
• MING: For Macromedia Flash output support (Optional, version 0.2a or
greater required). http://ming.sourceforge.net/
• PDFLib: For PDF output support. (Optional, version 4.0.3 or greater
required). Note: There are licensing restrictions as this is not an entirely
open-source product. If you qualify you may however use PDFlib Lite free
of charge. http://www.pdflib.com/products/pdflib/index.html
47
Note that although these packages are optional as far as creating a working WMS/WCS installation is concerned, they are
mandatory if GeoTIFF serving is to be used, as it has in ICEDS.

ICEDS: Guidelines for Implementing an OGC Web Coverage & Web Map Server Reference: ESYS-RPT-2005487-02, Issue: 30 March 2006, Version 3.
64
• MPATROL: For debugging (Developers only). http://www.cbmamiga.demon.co.uk/mpatrol/
Before compiling and installing the MapServer source code, one needs to download, compile and install the above packages according to the user’s requirements. One should be careful and check if these libraries are already installed on your system. If so, the currently installed versions should be checked and upgraded as required. If one does not have much experience with compiling and installing source code, the use of RPM versions of the libraries (when available) is recommended. Despite this not being so flexible, RPM packages are much simpler to install and problems related to dependencies and conflicts of versions are dealt with automatically. Normally, in any Linux distribution running in graphical mode there are wizard interfaces that control the installation of such RPM packages. In the ICEDS specific case, support for the Web Map and Coverage Servers as well as the Web Map Client (to cascade other WMS) was a requirement. Version 4.4.1 of the MapServer project was used with both WMS and WCS support. After examining the Linux distribution available on the machine (version 9.2 of Mandrake) the additional packages to be downloaded were: GD 2.0.28, GDAL 1.2.4, LibCURL 7.10.7, LibWWW 5.2.8 and PROJ.4 4.4.8: all the other necessary packages were already installed. In order to start compiling the code, a project folder should be created and all downloaded libraries should be copied into it. Some of the files were obtained in a “tarball” compressed format, so there is a need to uncompress them by typing the following command on the prompt48, where ‘nameofile.tar.gz’ is substituted for the name of the downloaded tarball:
tar -xzvf nameofile.tar.gz This instruction creates a directory with the same name as the compressed file and extracts all the uncompressed files into the directory. The original tarball file can then be safely deleted. At this stage one should have a project folder and one sub-folder underneath it for each extracted library. The following sub-sections deal with the compilation of the various packages, particularly following the experience of setting up the ICEDS server and are aimed at less experienced Linux system administrators.
9.1.1 GD 2.0.28
As this package had all the dependent libraries already set up it was the first one to be dealt with. If there is no need to have GIF output support for MapServer then this step can be skipped. To compile source code there are normally three main steps (the user’s current directory needs to be located inside the library folder):
• ./configure The dot path is needed as most people do not have the current directory in their executables search path. The configure command allows the user to control the parameters of the installation. It queries the system and then
48
Note that unless otherwise noted, the commands were all executed using the Bourne-Again Shell (bash).
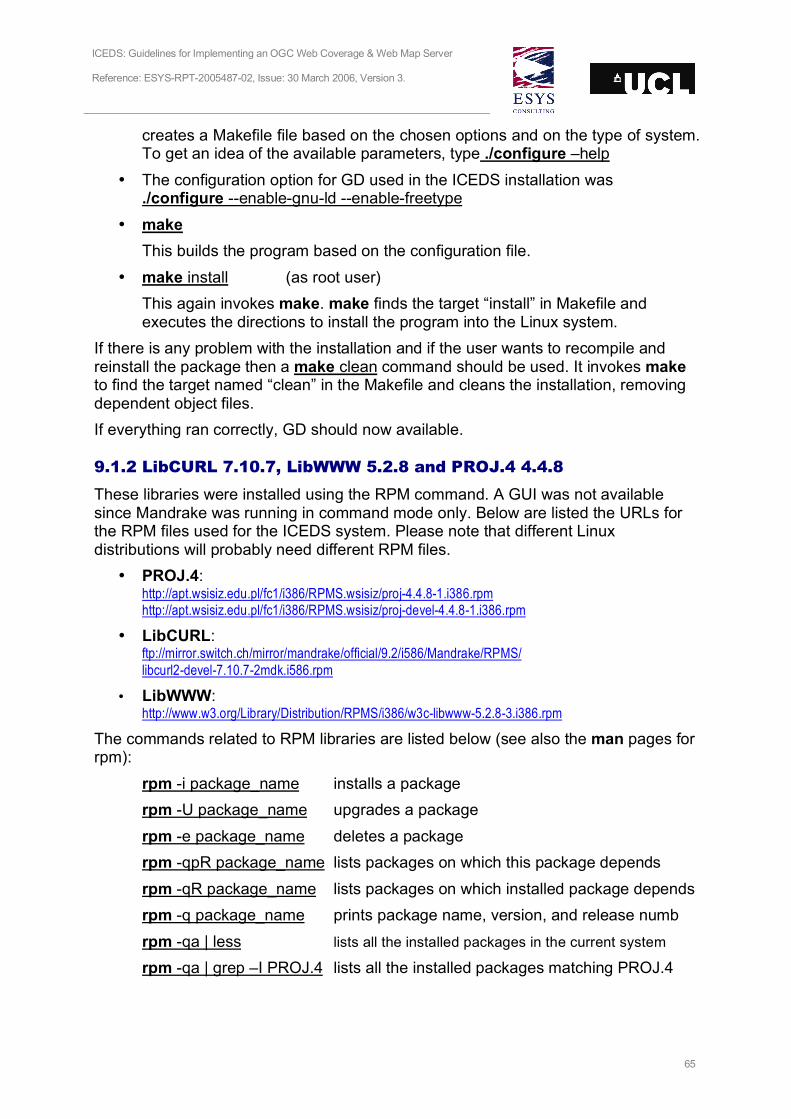
ICEDS: Guidelines for Implementing an OGC Web Coverage & Web Map Server Reference: ESYS-RPT-2005487-02, Issue: 30 March 2006, Version 3.
65
creates a Makefile file based on the chosen options and on the type of system. To get an idea of the available parameters, type ./configure –help
• The configuration option for GD used in the ICEDS installation was ./configure --enable-gnu-ld --enable-freetype
• make This builds the program based on the configuration file.
• make install (as root user) This again invokes make. make finds the target “install” in Makefile and executes the directions to install the program into the Linux system.
If there is any problem with the installation and if the user wants to recompile and reinstall the package then a make clean command should be used. It invokes make to find the target named “clean” in the Makefile and cleans the installation, removing dependent object files. If everything ran correctly, GD should now available.
9.1.2 LibCURL 7.10.7, LibWWW 5.2.8 and PROJ.4 4.4.8
These libraries were installed using the RPM command. A GUI was not available since Mandrake was running in command mode only. Below are listed the URLs for the RPM files used for the ICEDS system. Please note that different Linux distributions will probably need different RPM files.
• PROJ.4: http://apt.wsisiz.edu.pl/fc1/i386/RPMS.wsisiz/proj-4.4.8-1.i386.rpm http://apt.wsisiz.edu.pl/fc1/i386/RPMS.wsisiz/proj-devel-4.4.8-1.i386.rpm
• LibCURL: ftp://mirror.switch.ch/mirror/mandrake/official/9.2/i586/Mandrake/RPMS/ libcurl2-devel-7.10.7-2mdk.i586.rpm
• LibWWW: http://www.w3.org/Library/Distribution/RPMS/i386/w3c-libwww-5.2.8-3.i386.rpm
The commands related to RPM libraries are listed below (see also the man pages for rpm):
rpm -i package_name installs a package rpm -U package_name upgrades a package rpm -e package_name deletes a package rpm -qpR package_name lists packages on which this package depends rpm -qR package_name lists packages on which installed package depends rpm -q package_name prints package name, version, and release numb rpm -qa | less lists all the installed packages in the current system rpm -qa | grep –I PROJ.4 lists all the installed packages matching PROJ.4
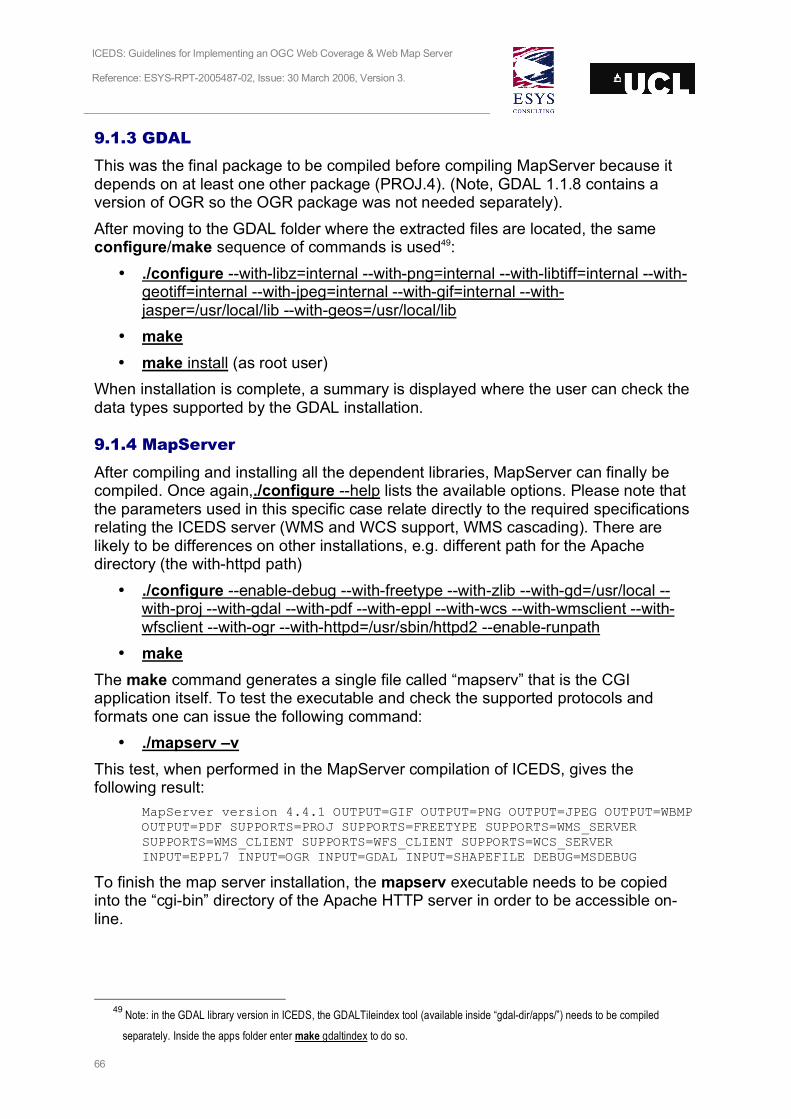
ICEDS: Guidelines for Implementing an OGC Web Coverage & Web Map Server Reference: ESYS-RPT-2005487-02, Issue: 30 March 2006, Version 3.
66
9.1.3 GDAL
This was the final package to be compiled before compiling MapServer because it depends on at least one other package (PROJ.4). (Note, GDAL 1.1.8 contains a version of OGR so the OGR package was not needed separately). After moving to the GDAL folder where the extracted files are located, the same configure/make sequence of commands is used49:
• ./configure --with-libz=internal --with-png=internal --with-libtiff=internal --with-geotiff=internal --with-jpeg=internal --with-gif=internal --with-jasper=/usr/local/lib --with-geos=/usr/local/lib
• make • make install (as root user)
When installation is complete, a summary is displayed where the user can check the data types supported by the GDAL installation.
9.1.4 MapServer
After compiling and installing all the dependent libraries, MapServer can finally be compiled. Once again,./configure --help lists the available options. Please note that the parameters used in this specific case relate directly to the required specifications relating the ICEDS server (WMS and WCS support, WMS cascading). There are likely to be differences on other installations, e.g. different path for the Apache directory (the with-httpd path)
• ./configure --enable-debug --with-freetype --with-zlib --with-gd=/usr/local --with-proj --with-gdal --with-pdf --with-eppl --with-wcs --with-wmsclient --with-wfsclient --with-ogr --with-httpd=/usr/sbin/httpd2 --enable-runpath
• make The make command generates a single file called “mapserv” that is the CGI application itself. To test the executable and check the supported protocols and formats one can issue the following command:
• ./mapserv –v This test, when performed in the MapServer compilation of ICEDS, gives the following result:
MapServer version 4.4.1 OUTPUT=GIF OUTPUT=PNG OUTPUT=JPEG OUTPUT=WBMP OUTPUT=PDF SUPPORTS=PROJ SUPPORTS=FREETYPE SUPPORTS=WMS_SERVER SUPPORTS=WMS_CLIENT SUPPORTS=WFS_CLIENT SUPPORTS=WCS_SERVER INPUT=EPPL7 INPUT=OGR INPUT=GDAL INPUT=SHAPEFILE DEBUG=MSDEBUG
To finish the map server installation, the mapserv executable needs to be copied into the “cgi-bin” directory of the Apache HTTP server in order to be accessible on-line.
49
Note: in the GDAL library version in ICEDS, the GDALTileindex tool (available inside “gdal-dir/apps/”) needs to be compiled
separately. Inside the apps folder enter make gdaltindex to do so.

ICEDS: Guidelines for Implementing an OGC Web Coverage & Web Map Server Reference: ESYS-RPT-2005487-02, Issue: 30 March 2006, Version 3.
67
In ICEDS, the mapserv executable was copied to two different names in the cgi-bin/ directory, “wms” and “wcs”. This name forms part of the URL for map requests and it was felt that this gives more readable URLs.

ICEDS: Guidelines for Implementing an OGC Web Coverage & Web Map Server Reference: ESYS-RPT-2005487-02, Issue: 30 March 2006, Version 3.
68

ICEDS: Guidelines for Implementing an OGC Web Coverage & Web Map Server Reference: ESYS-RPT-2005487-02, Issue: 30 March 2006, Version 3.
69
Appendix D. SRTM water masking using GSHHS
Previous versions of the hill shaded SRTM data used a mask generated using the Global Self-consistent, Hierarchical, High-resolution Shoreline (GSHHS) database from NOAA50. GSHHS is based on the US Navy World Vector Shoreline dataset. This shoreline shows slight differences versus the DEM 0m height contour but these have been neglected. The dataset has a resolution of about 2° and requires powerful machines to be able to display interactively. The peculiarity of this shapefile is that is centred on the 180°E meridian, instead of Greenwich. As a result the shapefile was edited manually and the area including the west part of Africa and Europe has been translated to meet with the rest of the region correctly located at longitude 0°. The picture below illustrates this process of clipping, moving and merging that was performed in ArcInfo 8.351.
50
Dataset available here: http://www.ngdc.noaa.gov/mgg/shorelines/data/gshhs/gshhs_shp/ 51
This is a commercial product from ESRI. Similar processing may be carried out in most GIS packages – lower cost systems than
those from ESRI include, for example, Manifold GIS and GRASS, though neither have been tested within ICEDS for use in this
processing. The masking process itself is not essential for serving the data.
URLs: http://www.esri.com , http://www.manifold.net/ , http://www.geog.uni-hannover.de/grass/

ICEDS: Guidelines for Implementing an OGC Web Coverage & Web Map Server Reference: ESYS-RPT-2005487-02, Issue: 30 March 2006, Version 3.
70
Two polygon shapefiles with a square polygon each, from 0º E to 180º E and 90º S to 90º N and another from 180º E to 360º E and 90º S to 90º N, were created. Inside ArcCatalog, one needs to navigate to the folder containing the shapefiles, right click the mouse and select new-> shapefile. Inside the New Shapefile dialog, type in a name for the shapefile and select polygon as the feature type. Click on the Edit button in order to select the correct coordinate system. Inside the Spatial Reference Properties box, click Select and go to Geographic Coordinate Systems, World, WGS 1984.prj. Click Add, OK and OK and the new shapefile is created. In order to create a new one, the user can simply copy the existing and paste it to a chosen folder. This gives two empty shapefiles – the next step is to draw the polygons. The user then needs to drag both shapefiles to ArcMap and check that the Editor Toolbar is visible (View->Toolbars->Editor). In the Editor Toolbar select Editor->Start Editing and choose as target one of the created shapefiles. Click on the sketch tool and move the pointer to the map window. Press the F6 key and type in the coordinates of each polygon vertex. When finished the user needs to select Editor->Stop Editing and save changes;
The two polygon shapefiles created on the previous step and the coastlines shapefile are then read into ArcMap. In Tools-> Geoprocessing Wizard the user selects clip. Now one will clip the coastlines shapefile with each of the polygon shapefiles. As a result, two new coastline shapefiles will be created. After that, adding them into ArcMap will display both in the correct coordinate system with the central meridian at Greenwich. We now need to convert the coastlines from polylines into polygons. In order to do this, and since the coastlines shapefile is a very heavy dataset, several smaller Areas of Interest (AOI) need to be created to clip the coastlines dataset against (as described in the two previous points). A fixed criterion to determine those areas has not been found, because subdividing into regions using fixed dimensions in map-
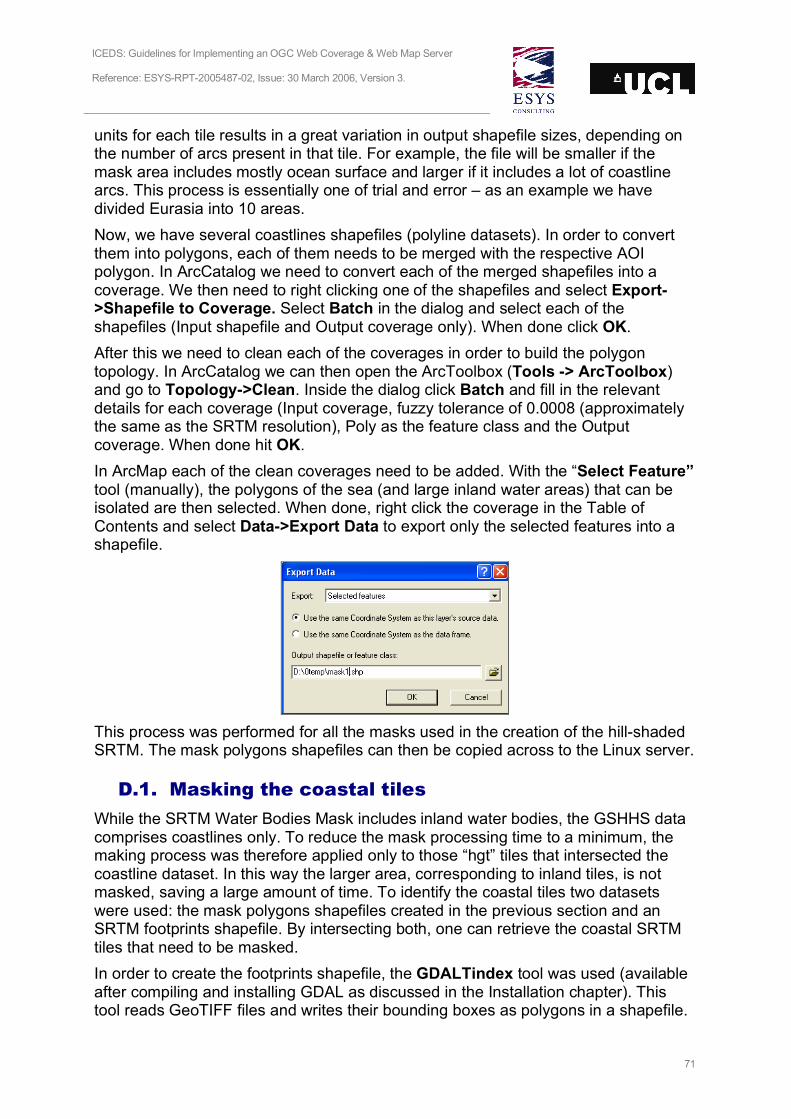
ICEDS: Guidelines for Implementing an OGC Web Coverage & Web Map Server Reference: ESYS-RPT-2005487-02, Issue: 30 March 2006, Version 3.
71
units for each tile results in a great variation in output shapefile sizes, depending on the number of arcs present in that tile. For example, the file will be smaller if the mask area includes mostly ocean surface and larger if it includes a lot of coastline arcs. This process is essentially one of trial and error – as an example we have divided Eurasia into 10 areas. Now, we have several coastlines shapefiles (polyline datasets). In order to convert them into polygons, each of them needs to be merged with the respective AOI polygon. In ArcCatalog we need to convert each of the merged shapefiles into a coverage. We then need to right clicking one of the shapefiles and select Export->Shapefile to Coverage. Select Batch in the dialog and select each of the shapefiles (Input shapefile and Output coverage only). When done click OK. After this we need to clean each of the coverages in order to build the polygon topology. In ArcCatalog we can then open the ArcToolbox (Tools -> ArcToolbox) and go to Topology->Clean. Inside the dialog click Batch and fill in the relevant details for each coverage (Input coverage, fuzzy tolerance of 0.0008 (approximately the same as the SRTM resolution), Poly as the feature class and the Output coverage. When done hit OK. In ArcMap each of the clean coverages need to be added. With the “Select Feature” tool (manually), the polygons of the sea (and large inland water areas) that can be isolated are then selected. When done, right click the coverage in the Table of Contents and select Data->Export Data to export only the selected features into a shapefile.
This process was performed for all the masks used in the creation of the hill-shaded SRTM. The mask polygons shapefiles can then be copied across to the Linux server.
D.1. Masking the coastal tiles
While the SRTM Water Bodies Mask includes inland water bodies, the GSHHS data comprises coastlines only. To reduce the mask processing time to a minimum, the making process was therefore applied only to those “hgt” tiles that intersected the coastline dataset. In this way the larger area, corresponding to inland tiles, is not masked, saving a large amount of time. To identify the coastal tiles two datasets were used: the mask polygons shapefiles created in the previous section and an SRTM footprints shapefile. By intersecting both, one can retrieve the coastal SRTM tiles that need to be masked. In order to create the footprints shapefile, the GDALTindex tool was used (available after compiling and installing GDAL as discussed in the Installation chapter). This tool reads GeoTIFF files and writes their bounding boxes as polygons in a shapefile.
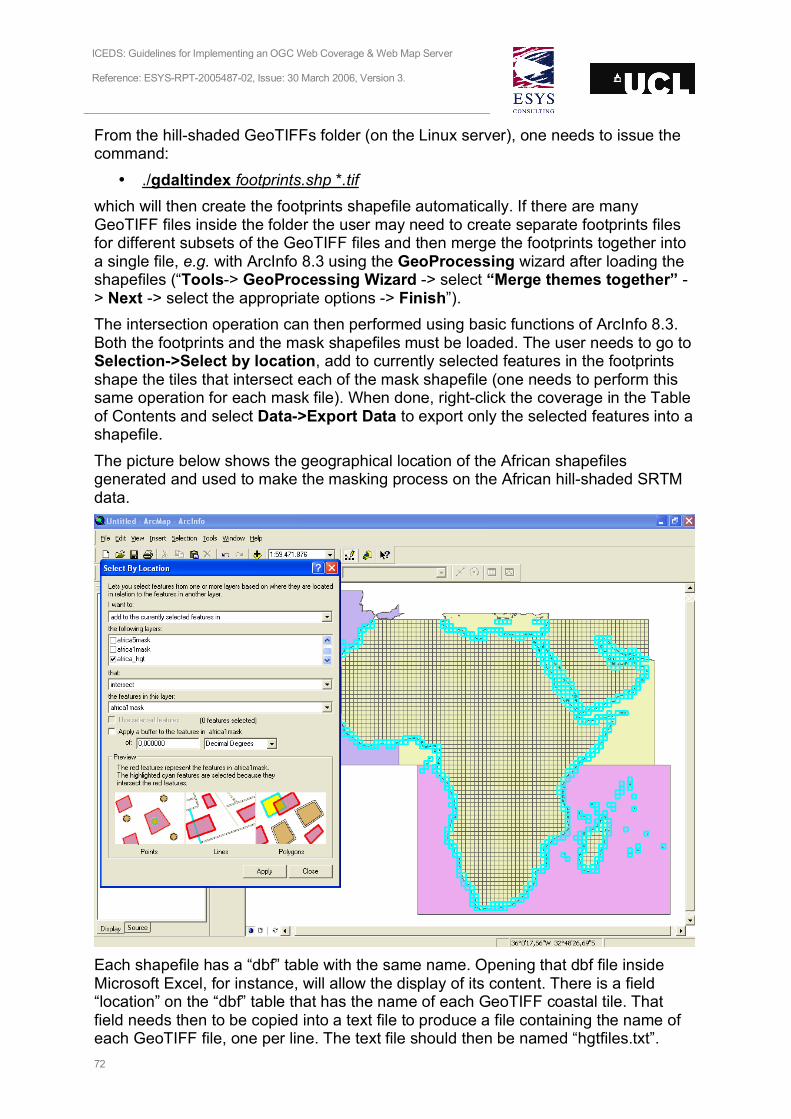
ICEDS: Guidelines for Implementing an OGC Web Coverage & Web Map Server Reference: ESYS-RPT-2005487-02, Issue: 30 March 2006, Version 3.
72
From the hill-shaded GeoTIFFs folder (on the Linux server), one needs to issue the command:
• ./gdaltindex footprints.shp *.tif which will then create the footprints shapefile automatically. If there are many GeoTIFF files inside the folder the user may need to create separate footprints files for different subsets of the GeoTIFF files and then merge the footprints together into a single file, e.g. with ArcInfo 8.3 using the GeoProcessing wizard after loading the shapefiles (“Tools-> GeoProcessing Wizard -> select “Merge themes together” -> Next -> select the appropriate options -> Finish”). The intersection operation can then performed using basic functions of ArcInfo 8.3. Both the footprints and the mask shapefiles must be loaded. The user needs to go to Selection->Select by location, add to currently selected features in the footprints shape the tiles that intersect each of the mask shapefile (one needs to perform this same operation for each mask file). When done, right-click the coverage in the Table of Contents and select Data->Export Data to export only the selected features into a shapefile. The picture below shows the geographical location of the African shapefiles generated and used to make the masking process on the African hill-shaded SRTM data.
Each shapefile has a “dbf” table with the same name. Opening that dbf file inside Microsoft Excel, for instance, will allow the display of its content. There is a field “location” on the “dbf” table that has the name of each GeoTIFF coastal tile. That field needs then to be copied into a text file to produce a file containing the name of each GeoTIFF file, one per line. The text file should then be named “hgtfiles.txt”.
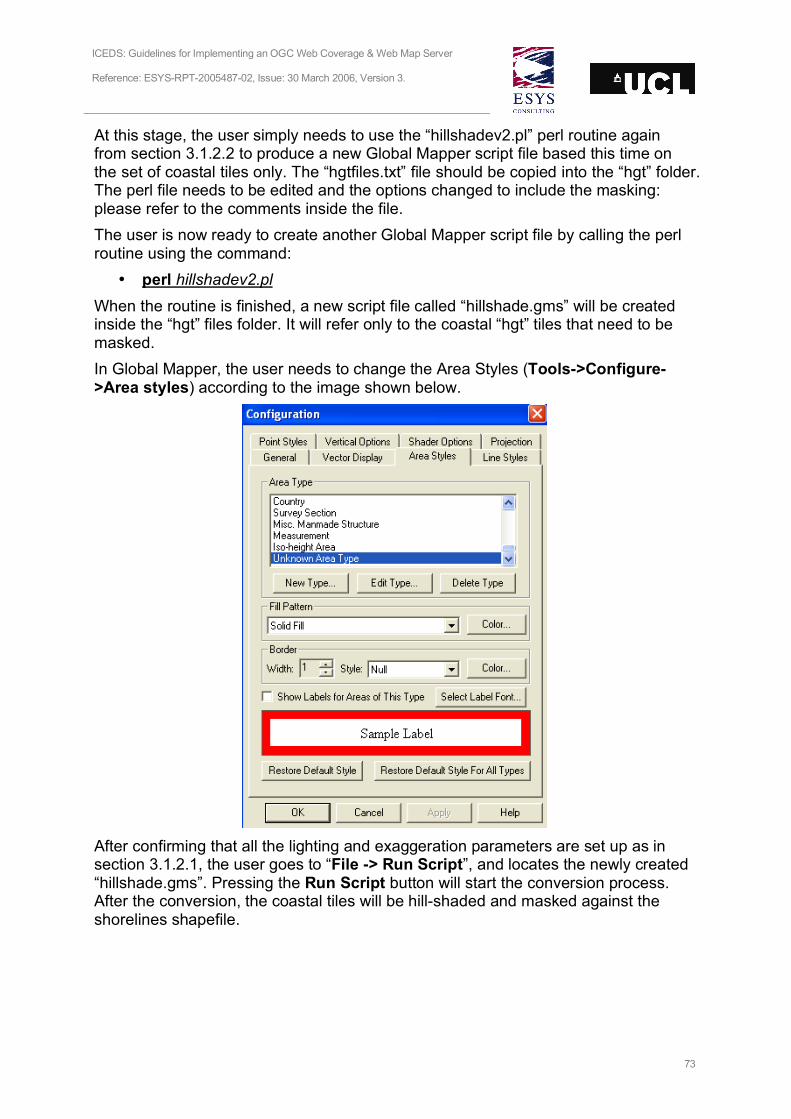
ICEDS: Guidelines for Implementing an OGC Web Coverage & Web Map Server Reference: ESYS-RPT-2005487-02, Issue: 30 March 2006, Version 3.
73
At this stage, the user simply needs to use the “hillshadev2.pl” perl routine again from section 3.1.2.2 to produce a new Global Mapper script file based this time on the set of coastal tiles only. The “hgtfiles.txt” file should be copied into the “hgt” folder. The perl file needs to be edited and the options changed to include the masking: please refer to the comments inside the file. The user is now ready to create another Global Mapper script file by calling the perl routine using the command:
• perl hillshadev2.pl When the routine is finished, a new script file called “hillshade.gms” will be created inside the “hgt” files folder. It will refer only to the coastal “hgt” tiles that need to be masked. In Global Mapper, the user needs to change the Area Styles (Tools->Configure->Area styles) according to the image shown below.
After confirming that all the lighting and exaggeration parameters are set up as in section 3.1.2.1, the user goes to “File -> Run Script”, and locates the newly created “hillshade.gms”. Pressing the Run Script button will start the conversion process. After the conversion, the coastal tiles will be hill-shaded and masked against the shorelines shapefile.

ICEDS: Guidelines for Implementing an OGC Web Coverage & Web Map Server Reference: ESYS-RPT-2005487-02, Issue: 30 March 2006, Version 3.
74
Appendix E. SRTM v1 “Island” tiles list The following is a list of tiles that appear in the SRTM version 1 data as islands but which were removed in version 2 and so lack a mask in the SWBD:
N12W068 N60E170 N16W061 N60E171 S18W175 N60E172 S20W174 N60E173 S11W153 S20E159 S11W139 S20E164 N18W011 S18E162 N19W113 S12E168 N01W093 S08E162 S04W082 S03E144 N15W095 S05E149 N16W084 S09E162 N08W086 S22E039 N51W174 N60W049 N55W165 N60W048 N16W024 N60W047 N12W071 N60W046 N06W055 N60W043 N12E071 N60W173 N12E050 N60W174 S01E097 N07E101 N10E109 N08E115 N08E112 N09E115 N08E113 N04E120 N09E113 S55E159 N09E114 S48E166 N08E119 S52E166 N08E120 S05E118 N14E119 S07E104 N15E117 S03E109 N09E161 S08E132 N09E168 S11E136 N03E155 S16E149 N48E143 S17E147 N49E141 S23E152 N50E144 S12E167 N54E143 S05E148 N47E151 N18W113 N49E153 N33E012 N53E173 N23E037 N59E170 N24E036 N60E167 N53E002 N60E168 N25E120 N60E169 S23E151