integrated arrival/departure control service (big airspace) concept
TRANSCRIPT

Integrated Arrival/Departure Control Service
(Big Airspace) Concept Validation
Federal Aviation Administration
Air Traffic Organization Operations Planning Research & Technology Development Office
Air Traffic System Concept Development, AJP-66
September 2007

TABLE OF CONTENTS
EXECUTIVE SUMMARY ............................................................................................................ 1 1 INTRODUCTION.............................................................................................................. 1-1
1.1 Background.................................................................................................................. 1-1 1.2 Program........................................................................................................................ 1-3 1.3 Scope............................................................................................................................ 1-3
2 BIG AIRSPACE OPERATIONAL CONCEPT ................................................................ 2-1 2.1 Problem Statement ....................................................................................................... 2-1 2.2 Concept Description..................................................................................................... 2-2 2.3 Assumptions................................................................................................................. 2-2 2.4 Benefits ........................................................................................................................ 2-3 2.5 Integrated Air Traffic Environment ............................................................................. 2-5 2.6 ATC Facility Factors.................................................................................................... 2-8 2.7 Concept Evolution ..................................................................................................... 2-11
3 CONCEPT VALIDATION................................................................................................ 3-1 3.1 Pre-Validation Activities ............................................................................................. 3-1 3.2 Simulation and Modeling Analysis.............................................................................. 3-1 3.3 Concept Feasibility Analysis ....................................................................................... 3-2
4 PRE-VALIDATION ACTIVITIES ................................................................................... 4-1 4.1 Cognitive Walkthrough Exercise................................................................................. 4-1 4.2 Traffic Demand Forecasts............................................................................................ 4-2 4.3 NAS Architecture Definition ....................................................................................... 4-4 4.4 Operational Characteristics Site Survey ...................................................................... 4-5 4.5 Generic Airspace Development ................................................................................... 4-8 4.6 Procedures Development ........................................................................................... 4-10 4.7 Big Airspace Components Addressed by Each Simulation Technique ..................... 4-11
5 FAST-TIME SYSTEM PERFORMANCE SIMULATION.............................................. 5-1 5.1 Introduction.................................................................................................................. 5-1 5.2 Models and Tools......................................................................................................... 5-1 5.3 Fast-Time Simulation Input Characteristics ................................................................ 5-2 5.4 Assumptions and Limitations .................................................................................... 5-11 5.5 Procedure ................................................................................................................... 5-12 5.6 Results........................................................................................................................ 5-13 5.7 Summary: Fast-Time System Performance Model Results ....................................... 5-17
6 FAST-TIME HUMAN PERFORMANCE MODELING .................................................. 6-1 6.1 Introduction.................................................................................................................. 6-1 6.2 Method ......................................................................................................................... 6-2 6.3 Scenarios ...................................................................................................................... 6-5 6.4 Assumptions and Limitations ...................................................................................... 6-9 6.5 Experimental Design.................................................................................................... 6-9 6.6 Results........................................................................................................................ 6-11 6.7 Summary: Human Performance Model Results ....................................................... 6-21
7 REAL-TIME HUMAN-IN-THE-LOOP SIMULATION.................................................. 7-2 7.1 Introduction.................................................................................................................. 7-2 7.2 Method ......................................................................................................................... 7-2
ii

7.3 Results........................................................................................................................ 7-15 7.4 Summary: HITL Simulation Results ......................................................................... 7-40
8 SIMULATION RESULTS COMPARISON ..................................................................... 8-1 9 FACILITY CONSOLIDATION ANALYSIS ................................................................... 9-1 10 COST/BENEFIT ANALYSIS ......................................................................................... 10-1
10.1 Cost Analysis ............................................................................................................. 10-1 10.2 Benefits Analysis ....................................................................................................... 10-7
11 SAFETY AND RISK ANALYSIS .................................................................................. 11-1 11.1 Disclaimers, Assumptions, and Caveats .................................................................... 11-1 11.2 Safety Objectives ....................................................................................................... 11-2 11.3 Assessment of Safety Objectives ............................................................................. 11-11 11.4 Allocated Safety Objectives and Requirements....................................................... 11-12 11.5 Conclusions and Recommendations ........................................................................ 11-12
12 REQUIREMENTS ANALYSIS ...................................................................................... 12-1 12.1 Operational Requirements ......................................................................................... 12-1 12.2 Technical Requirements............................................................................................. 12-3
13 CONCLUSIONS AND RECOMMENDATIONS........................................................... 13-1 REFERENCES ........................................................................................................................... R-1 ACRONYMS AND ABBREVIATIONS..............................................................................ACR-1
iii

LIST OF ILLUSTRATIONS Page Table Table 4-1. Selected Facilities for Operational Characteristics Survey ....................................... 4-5 Table 4-2. Operational Characteristics Summary Matrix ........................................................... 4-8 Table 4-3. Summary of BA Components by Simulation Technique ........................................ 4-11 Table 5-1. Traffic Volume by Airport ........................................................................................ 5-4 Table 5-2. Number of Aircraft per Scenario by Aircraft Type ................................................... 5-5 Table 5-3. Number of Aircraft per Scenario by Airport ............................................................. 5-6 Table 5-4. Airspace Characteristics ............................................................................................ 5-9 Table 5-5. Scenarios.................................................................................................................. 5-13 Table 5-6. Flight Time Savings ................................................................................................ 5-14 Table 5-7. Maximum Hourly Time Savings ............................................................................. 5-14 Table 5-8. Air Delay Savings.................................................................................................... 5-15 Table 5-9. Ground Delay Savings............................................................................................. 5-16 Table 5-10. Distance Flown Savings ........................................................................................ 5-16 Table 5-11. Conflict Counts...................................................................................................... 5-17 Table 6-1. Experimental Matrix................................................................................................ 6-11 Table 6-2. Cognitive Workload Means and Standard Deviations for Experimental Conditions.. 6-12 Table 6-3. ANOVA: Main Effects and Interactions for Cognitive Workload.......................... 6-13 Table 6-4. Estimated Coefficients for the Regression Model................................................... 6-17 Table 7-1. Means and Standard Deviations (SD) for Background Questionnaire Items............ 7-2 Table 7-2. Counterbalancing Order of Test Conditions............................................................ 7-10 Table 7-3. Daily Event Schedule .............................................................................................. 7-12 Table 7-4. Sample Sequence of Counterbalancing Order of Practice Conditions.................... 7-14 Table 7-5. Mean Number and Standard Deviation of Hold Commands Issued ....................... 7-23 Table 8-1. Summary of Simulation Results................................................................................ 8-2 Table 10-1. BA Cost Estimate Summary in Millions of Constant Base Year 2007 Dollars .... 10-7 Table 10-2. BA Cost Estimate Summary in Millions of Then-Year Dollars............................ 10-7 Table 10-3. Flight-Time Savings (No Weather) ....................................................................... 10-9 Table 10-4. Flight-Time Savings (No Weather), Risk Adjusted .............................................. 10-9 Table 10-5. Flight-Time Savings (Weather)............................................................................. 10-9 Table 10-6. Delay Adjustment due to Convective Weather ................................................... 10-10 Table 10-7. Fleet Mix and Total Traffic Data......................................................................... 10-11 Table 10-8. Aircraft Operating Cost ....................................................................................... 10-12 Table 10-9. Utilization ............................................................................................................ 10-12 Table 10-10. Passenger Value of Time................................................................................... 10-12 Table 10-11. Total Program Cost-Benefits Analysis (10-year OPS), Base-Year $M, Risk Adjusted ................................................................................................................................... 10-14 Table 10-12. Total Program Cost-Benefits Analysis (10-year OPS), Base-Year $M, Risk Adjusted (ADOC only) ............................................................................................................ 10-15 Table 10-13. Total Program Cost-Benefits Analysis (10-year OPS), Then-Year $M, Risk Adjusted ................................................................................................................................... 10-15
iv

Table 10-14. Total Program Cost-Benefits Analysis (10-year OPS), Then-Year $M, Risk Adjusted (ADOC only) ............................................................................................................ 10-16 Table 10-15. Cost-Benefits Summary (10-year OPS, ADOC+PVT) ..................................... 10-17 Table 10-16. Cost-Benefits Summary (10-year OPS, ADOC only)....................................... 10-17 Table 11-1. BA Safety Objectives ............................................................................................ 11-2 Table 11-2 – Operational and Infrastructure Changes to Current NAS in Support of Big Airspace (BA) Concept .................................................................................................................................. 3 Table 11-3 – Big Airspace (BA) OHA Hazards Worksheets .................................................... 11-5 Table 11-4. Operational Safety Assessment References ........................................................ 11-12 Table 12-1. Requirements Summary ........................................................................................ 12-8 Figure Figure 4-1. TRACON operations (historical and FAA forecast)................................................ 4-3 Figure 4-2. Simulated airspace within existing ZJX and ZMA airspace. ................................... 4-9 Figure 5-1. Baseline airspace sectors.......................................................................................... 5-3 Figure 5-2. BA sectors. ............................................................................................................... 5-3 Figure 5-3. BL RNAV routes...................................................................................................... 5-7 Figure 5-4. BA RNAV routes. .................................................................................................... 5-8 Figure 5-5. Weather depiction at 1100Z. .................................................................................. 5-10 Figure 5-6. Weather depiction at 1630Z. .................................................................................. 5-10 Figure 5-7. Weather depiction at 1900Z. .................................................................................. 5-11 Figure 6-1. Air MIDAS component organization and information flow.................................... 6-2 Figure 6-2. Software architecture. .............................................................................................. 6-5 Figure 6-3. Simulation airspace: Baseline airspace. ................................................................... 6-7 Figure 6-4. Simulation airspace: Big airspace. ........................................................................... 6-8 Figure 6-6. Tasks begun versus tasks completed....................................................................... 6-15 Figure 6-8. Workload associated with BA and BL procedures across conditions of weather and traffic.......................................................................................................................................... 6-19 Figure 6-9. Workload: Data link versus radio communication................................................. 6-20 Figure 7-1. Depiction of the en route and terminal workstation console configuration. ............ 7-3 Figure 7-2. Depiction of the airspace for the BL condition........................................................ 7-7 Figure 7-3. Depiction of the airspace for the BA conditions. ..................................................... 7-8 Figure 7-4. Average time in airspace by Sector and Condition................................................ 7-16 Figure 7-5. Mean number of altitude clearances issued by Condition and Interval. ................ 7-18 Figure 7-6. Mean number of altitude clearances issued by Sector and Interval. ...................... 7-19 Figure 7-7. Mean number of heading clearances issued by Condition and Interval................. 7-20 Figure 7-8. Mean number of heading clearances issued by Sector and Interval. ..................... 7-20 Figure 7-9. Mean number of heading clearances issued by ghost controller by Condition and Interval. ...................................................................................................................................... 7-21 Figure 7-10. Mean speed clearances issued by Sector and Condition...................................... 7-21 Figure 7-11. Mean number of speed clearances by Sector and Interval. .................................. 7-22 Figure 7-12. Mean number of speed clearances issued by ghost controller by Condition and Interval. ...................................................................................................................................... 7-23
v

Figure 7-13. Mean number of en route ground-ground transmissions by Sector and Condition. 7-24 Figure 7-14. Mean number of en route ground-ground transmissions by Condition and Interval..................................................................................................................................................... 7-25 Figure 7-15. Mean number of en route ground-air transmissions by Sector and Condition. ... 7-26 Figure 7-16. Mean number of en route ground-air transmissions by Condition and Interval. . 7-26 Figure 7-17. Mean number of en route ground-air transmissions by Sector and Interval. ....... 7-27 Figure 7-18. Mean number of terminal ground-ground transmissions by Sector and Condition. 7-28 Figure 7-19. Mean number of terminal ground-air transmissions by Sector and Condition. ... 7-28 Figure 7-20. Mean en route participant WAK ratings by Condition and Interval.................... 7-31 Figure 7-21. Mean en route participant WAK ratings by Sector and Interval.......................... 7-32 Figure 7-22. Mean terminal participant WAK ratings by Condition and Interval.................... 7-32 Figure 7-23. Mean terminal participant WAK ratings by Sector and Interval. ........................ 7-33 Figure 7-24. D-side participant ratings of ATC performance................................................... 7-34 Figure 7-25. R-side participant ratings for situation awareness for projected aircraft locations. . 7-35 Figure 7-26. Situation awareness for potential loss of separation for R-side (left) and D-side (right) participants by Condition................................................................................................ 7-35 Figure 7-27. Overall workload ratings for R-side (left) and D-side (right) participants by Condition.................................................................................................................................... 7-36 Figure 10-1. Percentage of total cost by WBS.......................................................................... 10-6 Figure 10-2. Total program payback. ..................................................................................... 10-16 Figure 11-1. Safety objective assessment matrix.................................................................... 11-11 Appendixes Appendix A - Informed Consent Statement Appendix B - Biographical Questionnaire Appendix C - Post-Scenario Questionnaire - 1 Appendix D - Post-Scenario Questionnaire - 2 Appendix E - Post-Experiment Questionnaire Appendix F - Communication Score Sheet Appendix G - Observer Rating Form Appendix H - Instructions for Participants Appendix I - Comments on the Repeated Measures Experimental Design Appendix J - Detailed Basis of Estimate
vi

EXECUTIVE SUMMARY Increasing air traffic demand has severely strained the efficiency of the National Airspace System (NAS). This strain is especially apparent in the arrival and departure airspace surrounding major metropolitan areas where the close proximity of multiple major and satellite airports, their competing traffic flows, and the impact of other major airports within the region greatly increase complexity and the resulting inefficiencies. The complexity of the airspace and the amount of coordination required with adjacent facilities increase controller workload and interfacility coordination. As many major metro areas serve as air carrier hubs, inefficiencies and delays experienced at these locations have ripple effects throughout the NAS. The overall impact is increased airline and passenger costs and high FAA costs to provide air traffic control service. In no area of the country is the arrival and departure airspace more complex or the traffic demand greater than in the New York metropolitan area. This airspace system is further complicated by the intersection of multiple facility boundaries in the center of the metropolitan area, creating small complex sectors of airspace and interdependent traffic flows between closely spaced airports and facilities. Over the last decade, a New York Integrated Control Complex (NYICC) concept has been proposed as a way to improve operational efficiency in the area by integrating terminal and en route airspace to expand the use of 3-mile separation procedures and improve communication and coordination. In December 2004, the FAA’s Air Traffic Organization Executive Council tasked the Operations Planning Service to conduct a research study to determine whether the NYICC concept would lead to operational improvements and benefits in other major metropolitan areas. The study was tasked to evaluate the concept for eight major metropolitan areas: Atlanta; Baltimore/Washington, DC; central Florida; Chicago; New York City; northern California; Philadelphia; and southern California. The Integrated Arrival/Departure Control Service, or “Big Airspace” (BA), study was undertaken to develop and validate the operational concept. The concept calls for improving operational efficiencies in major metropolitan areas through expanded use of 3-mile separation standards and current minima for diverging courses in all arrival and departure airspace, as well as the use of visual separation standards above 18,000 feet, dynamic airspace reconfiguration of bi-directional arrival/departure routes, and improved traffic flow management. These operational changes would enable creation of additional area navigation arrival and departure routes. The concept also calls for integrating arrival and departure airspace systems into one control service as well as one facility. This concept is a step toward the Next Generation Air Transportation System (NextGen) concept for Super Density Operations and a step toward General Service Delivery Points. To test the operational feasibility of the BA concept, a series of simulation studies employing different techniques was conducted. The studies included fast-time system performance simulation, fast-time human performance simulation, and real-time human-in-the-loop (HITL) simulation. Each technique had its own unique strengths, thus enabling a comprehensive evaluation of the BA concept regarding its impacts on efficiency, capacity, safety, and human
1

performance. The studies also helped drive requirements for further development of the concept and its components. The simulation methods did not allow for validating the need for either the use of visual separation procedures above 18,000 feet or the benefits of integrated traffic flow management as contained in the operational concept. Using generic airspace as a platform for analysis, the simulation evaluations all showed support for the BA concept by demonstrating service provider improvements and operational efficiencies. Service provider impacts were evaluated in terms of workload, task performance, safety, and controller acceptance. Overall workload ratings were lower in BA than in the baseline (BL) case. They were significantly lower in the arrival feeder and airport departure sectors, which were geographically smaller in the BA case. Workload ratings increased with traffic and the beginning of a weather event in transition sectors in both the BA and BL cases, but workload decreased in the BA condition after dynamic resectorization occurred, indicating the importance of the dynamic resectorization component of the BA concept. The simulations also showed that there was improved efficiency in adjacent high altitude sectors outside BA as indicated by less holding and fewer clearances issued in those sectors (modeled as ghost sectors). The human performance modeling found that by using BA control methods alone, controllers could handle up to 50 percent more traffic in total with about the same workload levels as in baseline traffic conditions. If data communications were used for clearances and transfer of control tasks under the BA concept, the model suggested that controllers could handle about 100 percent more traffic, and up to 150 percent before the workload started to degrade performance. This model also found that BA procedures enabled controllers to successfully complete tasks without interruption, which provides another indication of lower workload in the BA condition. The HITL simulations generally showed a slight improvement in task performance in the BA case. Although the number of aircraft handled in the BA scenario increased slightly, this increase was not statistically significant. This finding may have been due to the short duration of the simulations, and a longer duration might have shown a statistically significant increase. Ground-to-ground communications decreased in BA for arrivals and remained unchanged from the baseline case for departures. Air-to-ground communications decreased in the BA case in all sectors except the arrival transition sector, which was geographically larger. While the HITL simulations found that the BA concept is operationally sound with no significant change in the number of operational errors, the larger scale fast-time system performance analysis showed a significant decrease in the number of conflicts in the BA case with a 32 percent reduction at 2012 traffic levels and 13 percent reduction at higher traffic levels. Lastly, controller participant feedback from the HITL simulations was that the concept had a positive effect on control strategies over the baseline. Most controllers indicated that dynamic resectorization was operationally feasible and had a positive effect for the sector that received the airspace without negatively impacting the sector that gave up the airspace. Controller participant ratings of performance, situation awareness, and the ability to move traffic through the sector were among the measures that were also higher in BA conditions. All analyses showed improved operational efficiency from the concept. The system performance simulation showed that BA provided savings in terms of flight time and distance flown. These findings were validated by similar findings in the HITL simulations. BA also fostered more efficient flow strategies, which was evidenced by the increased use of speed clearances issued
2
and a reduction in the number of altitude and heading clearances issued during the real-time simulations. The HITL simulation showed that both the combined and separate control room options for managing integrated arrival and departure airspace resulted in user and FAA benefits. However, controller activities and comments indicated potential additional benefits from the combined control facility. Post-experiment questionnaires revealed that controllers felt the combined environment enhanced communication. Additional benefits might also be observed once controllers have more experience with the integrated environment and develop improved coordination methods that it affords. In addition, traffic management experts suggest that the success of implementing key BA operational improvements, such as Dynamic Airspace Reconfiguration, may be dependent on an integrated Traffic Management Unit in order to expedite dynamic route changes. A Rough Order of Magnitude Cost-Benefit analysis was conducted to find out how likely it would be for the BA concept to be cost effective for multiple major metropolitan areas. Since this study is in the concept exploration phase, the cost analysis was based on general ground rules and assumptions developed for the concept itself, not on any detailed requirements or technical solutions. The benefits analysis was based on extrapolating results from the generic airspace fast-time simulations to other sites based on traffic forecasts and historical weather patterns at those sites, and not based on actual runway capacity, airport interactions, or current and potential BA airspace design for those locations. Implementation of the BA concept at seven BA facilities covering eight major metropolitan areas was found to be highly cost beneficial, with an estimated benefit/cost (B/C) ratio of 6.8, based on the total estimated present value aircraft operating cost and passenger time savings benefits of $2,680 million and costs of $396 million. If passenger value of time was excluded from the calculation, implementation of the BA concept was still estimated to be highly beneficial, with an estimated B/C ratio of 3.8, based on total estimated present value benefits of $1,485 million and costs of $396 million. All sites evaluated are expected to be cost beneficial, with B/C ratios ranging from 2.8 to 11.7. The estimated risk-adjusted BA cost in then-year dollars is $680 million. Concept validation identified many operational and technical requirements. Research is needed in many of these areas to develop Preliminary Program Requirements. In order to implement the BA concept as a midterm solution for high density terminal operations, many challenges will need to be met successfully. The operational requirement for expansion of 3-mile aircraft separation to all arrival and departure airspace will require the discovery of a technical solution to meet Required Surveillance Performance (RSP) standards. Expansion of diverging course procedures will require expansion of the current RSP standards, as well as a technical solution to meet the new standard. Closely spaced parallel routes will require a mandate for Performance Based Navigation in BA. BA airspace redesign will need to undergo environmental and noise assessments in consultation with local communities and constituencies. Integration of all arrival and departure airspace management will require facility and control room designs and a common automation toolset, including additional Traffic Management Advisor functionality, flight plan amendment capabilities, and a time-based departure route sequencing tool.
3

A review of current and future facilities plans was conducted to determine the impact that this integrated control facility concept could have on ongoing studies of future facilities. Existing large facilities in many major metropolitan areas consist of Air Traffic Control Centers that are reaching their end of life and need to be substantially refurbished or replaced and new large Terminal Radar Approach Control (TRACON) buildings that have been built in the last 15 years and have room for additional operational positions. A rough estimate was made of the total number of operational positions (radar and assist/handoff) at each BA facility as well as the number of sectors that would remain at the adjacent centers. This analysis estimated the BA facilities would have an average of 96 total operational positions and that the number of en route sectors would be reduced by 17 percent to 35 percent (average 27 percent). Since new large TRACON buildings exist in most major metropolitan areas, it would be most economical to locate BA operations in these buildings, at least for an initial implementation of integrated arrival and departure airspace. Where new large TRACONs do not exist, new facilities are needed to house the integrated arrival/departure airspace. These facilities should be considered in the overall plan for General Service Delivery Points (GSDP), as described in the NextGen concept, that integrate operational domains (e.g., tower control, classic airspace, and trajectory based operations airspace). These GSDP facilities could also provide an economical solution for high altitude airspace restructuring that would be needed after implementing the BA concept. GSDP facility decisions should be made in consideration of moving toward this BA concept. The totality of the BA Concept Validation research found that an Integrated Arrival and Departure concept would be applicable and beneficial for any major metropolitan area where there are very large airports, particularly those where there are multiple airports whose arrival and departure flows interact. Detailed airspace design and analysis work will be needed to determine where this concept would be most beneficial and to gain information to complete requirements and associated business cases.
4

1 INTRODUCTION The increasing number of U.S. air flights has severely strained the efficiency of the National Airspace System (NAS). This strain is especially apparent in the arrival and departure airspace surrounding major metropolitan areas. The airspace is complex and contains largely inflexible route structures that can contribute to traffic flow disruptions far from the existing terminal boundaries. In addition, existing airspace design and restrictions on certain air traffic procedures limit the controllers’ ability to optimize airspace and traffic movement, forcing them to spend much of their time communicating and coordinating with surrounding control facilities. Mounting congestion and decreasing efficiency increase costs, not only for the Federal Aviation Administration (FAA), but also for the airlines and consumers. To ease some of the stress resulting from an increasingly crowded NAS, the FAA is exploring alternative concepts to develop and implement changes in air traffic control (ATC) procedures, airspace design, and routing structures to improve NAS performance and increase system efficiency. These changes are designed to increase controller productivity and decrease controller workload. To realize these changes, the FAA has developed a concept of operations for an Integrated Arrival/Departure Control Service, called the “Big Airspace” (BA) concept.
1.1 Background Today’s Air Route Traffic Control Centers’ (ARTCC) and Terminal Radar Approach Controls’ (TRACON) operations and systems have undergone many evolutions to keep pace with a continually changing ATC environment. During the 1990s, air traffic in major metropolitan areas grew at significant rates, with delays rising proportionately. Although traffic growth slowed after 2001, the recent economic recovery has again driven air traffic demand up and is testing capacity limits. Current terminal airspace design uses highly structured arrival and departure (ARR/DEP) airspace so that controllers must begin sequencing aircraft far from the airport to manage volume and complexity. Moreover, for large TRACONs in major metropolitan areas, often there are multiple terminal facilities competing to use the same transition airspace to move aircraft to and from their respective airports, usually resulting in highly structured ARR/DEP routings that add significant flight time and distance to the customer. These complex interactions between coordinating facilities cause airspace and procedural inefficiencies that negatively impact air traffic throughout the area. This complexity in metropolitan ARR/DEP airspace stems from the close proximity of multiple major and satellite airports, their competing traffic flows, and the impact of other major airports within the region. ARR/DEP airspace supporting large metropolitan areas is one of the most challenging air traffic environments in the world. For instance, in the New York metropolitan area, four ARTCCs share responsibility for the initial sequencing of arrival aircraft, the acceptance and movement of departure aircraft into their en route phase, as well as overflight traffic at higher altitudes. Simultaneously, two TRACON facilities share responsibility for the lower altitude phases of the ARR/DEP services supporting four major, two secondary, and numerous satellite airports within their sphere of control.
1-1

In a recent study, FAA researchers (Truitt, McAnulty & Willems, 2004) tested procedures to address some of these system pressures. They evaluated a New York Integrated Control Complex (NYICC) concept for dealing with congestion in the Northeast corridor around the New York airspace. The NYICC concept proposed two primary adjustments to ATC procedures to address congestion issues. First, the concept proposed locating terminal and en route controllers in a single facility to aid communications and coordination related to ATC operations. Second, the concept proposed extending terminal airspace separation standards (i.e., 3 miles instead of 5 miles lateral separation) farther from the area to ease traffic flow to and from the major airports within this combined facility. The researchers conducted human-in-the-loop (HITL) ATC simulation experiments to scientifically compare these two concepts to a baseline condition of current ATC procedures. Truitt et al. found that both proposed changes and concepts facilitated certified professional controller (CPC) performance, showing positive impacts on the efficiency of the airspace used, improved controller situational awareness, and reduction in the amount of landline communications required. The use of 3-mile separation standards within this airspace led to improvements in various system performance measures, such as the increase in the number of aircraft handled, an increase in the number of completed flights (i.e., aircraft handed off to the tower), and a decrease in the number and duration of holds. These improvements were also found through integrated operations using current separation criteria. Neither concept negatively affected ATC performance. Other findings included an increase in the number of arrivals and departures, a reduction in the number and duration of holds, and a reduction in the number and duration of departure stops. These findings, however, were limited to the New York airspace’s current design. Incorporating a broader range of facilities would be necessary to understand and plan for all metropolitan areas with similar airspace. Toward this end, the BA concept is based on the NYICC concept. BA applies concepts from the NYICC study, in addition to others, for use in other congested airspace. The proposed changes include:
• Redesigning airspace to move facility boundaries farther from the airport to increase flexibility and reduce coordination in complex airspace. By moving artificial barriers (interfacility boundaries) separating en route and terminal airspace to a point farther from congested airport airspace, the FAA can reduce procedural and airspace inefficiencies, thereby achieving its goal of smoother, more efficient air traffic flows into and out of major airports;
• Expanding use of separation procedures previously restricted to “terminal” airspace (i.e.,
3 miles lateral, degrees divergence, and visual separation). (Note: Although 3-mile and visual separation are currently used under specific conditions in en route airspace, the BA concept projects using all of these procedures throughout the ARR/DEP airspace);
• Increasing the number of Area Navigation (RNAV) routes so that more Standard Instrument Departures (SID) and Standard Terminal Arrival Routes (STAR) are available; and
1-2

• Incorporating dynamic resectorization, a procedure that makes airspace boundaries more flexible so that traffic can be more easily rerouted when weather, equipment outages, or active special use airspace disrupt normal flows (Hadley, Sollenberger, D'Arcy, & Bassett, 2000; Stein, Della Rocco, & Sollenberger, 2005).
1.2 Program The BA concept is consistent with the Joint Planning and Development Office Next Generation Air Transportation System concepts and capabilities roadmap and is a model for providing air traffic services in the future. BA moves beyond the historical FAA consolidation model by seeking to integrate ARR/DEP airspace systems—which are currently spread across TRACONs and ARTCCs—into one control service. This work is also examining the feasibility of combining these services within one facility. Integration removes many of the artificial boundaries that now divide the en route and terminal ARR/DEP environments and enables aircraft to transition seamlessly through all phases of flight.
1.3 Scope This report describes the analyses performed on the BA concept to determine the feasibility of integrated ARR/DEP airspace in complex metropolitan locations and makes recommendations based on the findings of the analyses. It includes:
• A description of the concept, including anticipated airspace and operational changes;
• The evaluation and validation performed to determine if the hypothesized benefits can be achieved for large metro areas;
• A cost/benefit analysis, including a rough order of magnitude estimate of the major cost drivers;
• Identification of preliminary operational and technical requirements;
• Identification of potential safety impacts; and
• Conclusions and recommended next steps.
The intent of this report is to provide an overall description of the BA concept and the information necessary to determine if integrated arrival/departure airspace is a viable evolution from current en route/terminal transition airspace and consequently should be considered for incorporation into the future NAS.
1-3

2 BIG AIRSPACE OPERATIONAL CONCEPT 2.1 Problem Statement
Currently, no single facility in a major metropolitan area is responsible for the ARR/DEP airspace associated with airports. To provide seamless transitions through all phases of flight throughout an area—as BA intends to do—researchers must address existing deficiencies. Many of these capability shortfalls are relevant to a number of large metropolitan areas. Major metropolitan-area facilities currently face a set of limiting factors that makes it difficult to adapt them to modern requirements of security, occupational safety, and access and energy conservation. Facility changes and improvements have become increasingly costly; and property limits create facility security risks that are difficult to mitigate. Some current capabilities that are lacking and block air traffic efficiency include the following:
• Closeness of the airports and current airspace arrangement (delegation) create operational complexities and increase workload.
• Inability to hold aircraft in terminal airspace (due to lack of airspace) results in inefficient, non-uniform flows from the en route to terminal environment during periods of high volume.
• Airspace boundaries between en route and terminal airspace are near many of the arrival airports. Often, when air traffic becomes congested in terminal airspace, sudden “no notice holding” is needed in en route airspace.
• Automation systems at ARTCCs (Host/Oceanic Computer System Replacement, and Advanced Technologies and Oceanic Procedures) must communicate and interface radar and flight data processing to the different automation systems in the terminal environment (Standard Terminal Automation Replacement System, Common Automated Radar Terminal System). The computer interface is a single-point-of-failure of the system; when it is not working properly, coordination between controllers at different facilities increases and dynamic responses to air traffic demands decrease.
• Current configuration requires considerable interfacility coordination among Traffic Management Coordinators.
• High cost for telecommunication and data distribution exists between the en route and terminal facilities due to the number of lines involved, required redundancy, and the communication network between facilities.
• Limitations are imposed on using tower/en route procedures due to the vertical limits of terminal airspace. (Tower/en route is the process of transitioning aircraft directly through adjacent TRACONs without entering en route airspace.)
• Airspace boundaries that require controllers to separate aircraft from airspace rather than from other aircraft limit their ability to effectively respond to high-volume or adverse weather events. Complicated en route and terminal airspace layout compresses the terminal airspace environment, causing controllers to do too much low-level vectoring.
2-1
This increases pilot and controller workloads, aircraft fuel costs, and noise that affects local communities.
The BA concept seeks to address generic shortfalls, many of which are cited above, that extend to a broad set of metropolitan areas. To address these limits, BA intends to realign airspace boundaries currently delegated to adjacent facilities; integrate TRACON and portions of the reconfigured ARTCC airspace into one ARR/DEP facility; and enlarge targeted areas to apply ATC procedures most commonly applied in the terminal domain.
2.2 Concept Description The BA concept seeks to combine adjacent TRACONs and ARR/DEP airspace currently controlled by en route centers, developing an integrated ARR/DEP airspace that supports all airports within a major metropolitan area. The new airspace will be configured to optimize efficient movement of aircraft by exploiting aircraft capabilities, developing multiple bi-directional ARR/DEP paths, and expanding terminal separation standards farther from the airport. Controllers will be able to complete interfacility transfers farther away from the airport and apply reduced separation during more of the ARR/DEP segments of flight. Minimizing static route constraints will enable more flexible traffic flows. It is projected that these operational changes will lead to more efficient aircraft spacing and sequencing, better weather avoidance, and fewer aircraft delays. The facility design will reflect changes that take advantage of closer interaction between controllers, equipment, aircraft capabilities, and the vast amount of information available. Modern automation, surveillance, communication, and power systems will enable functional and physical integration of the two airspaces into a united ARR/DEP control service. Control room organization is anticipated to increase controller productivity, system safety, capacity and efficiency, and situation awareness while reducing controller workload. The BA concept seeks to address the need for a new approach to ARR/DEP operations. The FAA developed BA to transform this phase of flight and optimize future airspace design to leverage advanced capabilities.
2.3 Assumptions To introduce major changes into the NAS, the FAA must first test proposed changes and their potential impacts on controller and system performance. The concept assumes a level of technology as projected by the NAS Enterprise Architecture for the year 2012. Projected capabilities for communications, automation, and surveillance—as well as for aircraft navigational accuracy—guide decisions about combining ARR/DEP operations and service providers. The BA concept is based on the following assumptions:
• Domestic enplanements are forecasted to grow an average of 4.2 percent per year through 2015; international enplanements are expected to grow an average of 5.2 percent per year in that forecast period; and total enplanements are expected to exceed 1 billion in 2014.1
1 FAA Aerospace Forecasts FY 2005–2016, March 2005.
2-2

• The timeframe for implementing the concept is 2012 or beyond.
• The facility design will support the ARR/DEP control service.
• The facility and airspace design will meet environmental and noise objectives.
• RNAV routes will be expanded.
• Airspace redesign will be an integral part of accomplishing this concept, and the changes necessary are broader than those currently planned in the Airspace Management Program.
• The airspace will support limited dynamic resectorization.
• The airspace will allow expanded use of 3-mile separation standards and current minima for diverging courses in all arrival and departure airspace, as well as the use of visual separation standards above 18,000 feet. These procedures will be supported by the surveillance and automation systems (e.g., update rates); new procedures will be developed as required.
• The infrastructure will be seamless with the necessary systems (i.e., automation, communication, surveillance, power, security) to support the concept.
• There will be a facility with an enhanced traffic management and communications infrastructure consisting of operational areas that include Traffic Flow Management (TFM) positions.
• Sector teams will be employed that consist of radar and handoff controllers with one radar console and one handoff/data console per sector.
• There will be minimum training which will focus on airspace, procedures, and familiarizing former terminal controllers with aircraft performance at higher altitudes farther from the airports.
• Those controlling the expanded ARR/DEP airspace will work proximate to each other in the new facility.
• Supervisor and traffic management roles and responsibilities will change to support the changing operational environment.
2.4 Benefits
Combining the terminal and en route ARR/DEP responsibilities into one integrated facility/control service will help enable the FAA to keep pace with air traffic demand and correct the existing air traffic anomalies and inefficiencies in metropolitan areas. The integration will result in increased capacity and flexible airspace and routings, incorporation of TFM into area operations, logical design and physical positioning of controller positions, controller face-to-face communications, and new information flow procedures that will substantially change the way the FAA provides air traffic services in the future. The BA concept will align NAS resources to optimize air traffic system efficiency in the terminal and en route transition areas, providing efficient ARR/DEP service through cohesive, single-facility control of terminal and transition airspace.
2-3

An implemented BA concept is designed to enable the following:
• ARR/DEP services will keep pace with forecasted demand.
• Separation standards of 3 miles between aircraft instead of the standard 5 miles’ separation between aircraft will increase airspace capacity, reduce delays, and allow controllers to more effectively separate, manage, and merge traffic in the ARR/DEP phases of flight, maximizing use of available runway capacity.
• Visual separation and aircraft divergence will reduce the number of errors that occur due to compression from 5 miles to 3 miles.
• Using airspace dynamically and shifting traffic flows as necessary will reduce en route sequencing complexity and enable more effective weather avoidance. Underutilized airspace can be used quickly and effectively to keep the system moving when other areas become busy or impacted by adverse weather.
• Creating an expanded area navigation system and decreasing vectoring close to the airport will result in fewer flying miles and reduced fuel usage for the users, along with increased throughput and end-to-end optimization of flows.
• Air traffic flows can be based on route efficiency, not navigational aid location.
• Interfacility coordination will be simplified, and aircraft will transition seamlessly to and from cruising altitudes and runways.
• Increasing the vertical limits of the terminal airspace to allow an expanded and higher “tower-en route” structure will improve coordination and merging for short-distance flights by keeping them in the terminal environment.
• Combining the terminal and en route ARR/DEP responsibilities into one integrated facility/control service will enable the FAA to keep pace with air traffic demand and correct existing air traffic anomalies and inefficiencies in the metropolitan areas.
• Controllers up and down the line will have more face-to-face and simpler communication. More direct communication will improve dissemination of weather and traffic information, facilitating efficient flows of traffic during periods of adverse weather and high volume.
• Controllers will be able to make efficient decisions about vectoring, speed control, sequencing, and holding because they will know the impact that these decisions will have on the surrounding sectors.
• Controller operating positions will be based on layouts that can more effectively handle major traffic flows. More effective control room organization and enhanced communications and traffic management increase controller productivity, reduce controller workload, and improve controller situational awareness of system demands in the region. Quickly changing flight paths, setting up temporary routes, and removing transfer of control points will resolve demand imbalances.
2-4

2.5 Integrated Air Traffic Environment Currently, controllers perform complex, multi-facility coordination that limits the efficiency and flexibility of the operation, which increases the number of air traffic delays. To transform the current air traffic environment, BA must address limits related to current airspace and operational environments and traffic handling. Creating a BA facility will integrate the TRACON and portions of the reconfigured ARTCC airspace to meet ARR/DEP airspace needs.
2.5.1 Airspace Environment The overall “airspace environment” determines the types of traffic manipulations that can occur in the airspace, the separation standards used, and the controller workload. The geographical arrangement of airspace boundaries, airway routes, and radar surveillance sources determine the types of control actions and coordination required.
2.5.1.1 Airspace Delegation The effectiveness of airspace responsibility depends on how one delegates it. Efficiency of air traffic operations in the current en route and terminal areas is adversely affected by increased coordination needed when high-demand ARR/DEP traffic straddles multiple facility boundaries. Coordination becomes more complex; thus, controller workload increases. Adverse weather and surges in peak demand worsen the problem. Further, traffic flow information that the Air Traffic Control System Command Center receives is often fragmented and contradictory due to the limited view of each facility. ARR/DEP airspace, such as BA asserts, would ensure a more unified mass of airspace for controllers to apply terminal techniques, rules, and control procedures.
2.5.1.2 Separation Standards and Methods
The current separation standards and methods will not be effective in a future with three times the traffic. Three miles’ separation between aircraft instead of 5 miles can be used in the ARR/DEP airspace. Additionally, visual separation and aircraft divergence will be approved throughout the ARR/DEP airspace.
2.5.1.3 Traffic Flow Monitoring Traffic flow monitoring is another aspect of the airspace environment requiring attention for the future. The current navigation structure adds unnecessary vectors and mileage to arrivals and departures and restricts controllers’ ability to use multiple parallel arrival or departure paths. Setting up RNAV procedures in the current airspace structure is not optimal due to the many transfer-of-control points and automation limits. BA promotes an RNAV environment that enables aircraft to navigate directly from point to point and allows multiple bi-directional ARR/DEP routes where practical. Current airspace and navigation systems create additional adverse impact by maintaining segregated ARR/DEP paths far from the airport. A potential solution to this problem could be implementing bi-directional flows for some arrivals and departures, as traffic would permit. Using the same airspace for multiple arrival flows enables more effective air traffic
2-5

manipulations closer to arrival airports. The nature of this type of ARR/DEP airspace would lessen the static route constraints that exist in today’s environment. BA attempts to emplace airspace resectorization. Two traditional goals of airspace resectorization are (1) providing balanced controller workload to the overall air traffic population and (2) optimizing coordination for effective ATC. Resectorization schemes try to set apart aircraft that share similar objectives, such as arriving, departing, or over flying. Sectors in a metropolitan terminal area are designed to conform to facility boundaries and accommodate traffic flows. The design provides enough workload balancing among the sectors but results in complex and rigid resectorization schemes. Reconfigured BA and integrated traffic flows will enable designers to reduce many of the complexities that the current sectorization creates. With reduction of the computational and communications barriers, airspace design and underlying sector configurations will no longer be constrained by the current geographic boundaries. Sectors will be able to adjust in response to traffic flows, weather, and system constraints. Airspace boundaries, both lateral and vertical, will be configured in real time to accommodate prevailing routings and to support operational objectives. These dynamic airspace configurations are limited to a finite number of major variations that accommodate user-preferred trajectories under a wide range of conditions, but are able to maintain sector operability and trainability.
2.5.2 Traffic Handling BA will improve capacity, efficiency, and air traffic management through enhanced traffic sequencing and spacing and weather avoidance.
2.5.2.1 Traffic Sequencing and Spacing
BA intends to improve point-to-point navigation, flexible traffic flows, coordination, and separation procedures to enable enhanced traffic sequencing and spacing. Additionally, an arrival sequencing decision support tool will be used to sequence and schedule aircraft in a way to maximize ARR/DEP capacity without compromising safety. BA operations will reduce the need to begin arrival flow disruptions far from the airport. Arrival areas managing traffic flows collaboratively, coupled with increased use of terminal rules, will enable the airspace to effectively absorb more aircraft into the area with reduced levels of restrictions. This will improve airspace and runway use by ensuring that aircraft are always geographically available to fill gaps in the traffic flow.
2.5.2.2 Weather Avoidance Due to the lengthy coordination that it requires, avoiding adverse weather is a time-consuming process that impacts today’s traffic flow environment. Often, by the time coordination is complete for air traffic to be rerouted, the weather conditions have moved to impact new routes. After the ARR/DEP control service establishes BA, controllers and traffic managers will have less interfacility coordination when weather events impact nearby routes and sectors. The new facility’s combined, enhanced airspace and infrastructure will enable controllers to collaborate more with traffic managers and respond in real time to weather events that can cause systemwide delays. Controllers will be able to freely vector aircraft around adverse weather without the
2-6
communication and data processing constraints that exist in today’s multi-facility environment. Using multiple traffic flows through areas unaffected by adverse weather or high traffic volume will be possible. Teams of controllers will be able to dynamically shift arrivals and departures with less reliance on airborne holding and departure ground delays.
2.5.3 Operational Environment The operational environment that manages the integrated ARR/DEP airspace must also evolve to optimize use of the new airspace procedures. The BA operational environment will align with the 2006 Concept of Operations for the Next Generation Air Transportation System (Joint Planning and Development Office, 2006). This concept seeks to take advantage of continuing technological advancements, such as those comprising Free Flight Phase II User Request Evaluation Tool (URET), Collaborative Decision Making (CDM), and beyond.
2.5.3.1 Control Room Environment The BA concept will increase benefits in the operational setting by creating an integrated control room environment in which controllers oversee interrelated ARR/DEP sectors. The NYICC research conducted at the FAA Technical Center Human Factors Lab indicates that integrated arrival and departure airspace management in a single facility would have benefit (Truitt et al., 2004). More efficiency and flexibility result from controllers’ increased familiarity with interdependent air traffic flows and improved situational awareness. The BA concept assumes that controllers working proximate to each other managing ARR/DEP flows will provide similar benefits. The ARR/DEP facility will not integrate the entire en route facility with the TRACON—only those en route sector controllers responsible for transition airspace. Physical proximity will enable controllers to be more aware of the conditions at interacting sectors, and improved awareness will promote improved tactical planning.
2.5.3.2 Controller Teams The BA concept calls for sector teams consisting of a radar controller and a handoff controller. The advent of an ATC environment without flight strips will minimize the need for data positions. The area supervisors will be responsible for resource management. They will work closely with TFM to support dynamic adjustment of flows as well as coordinate with adjacent facilities on dynamic airspace resectorization and coordinate with TFM to select predetermined RNAV routes. Supervisors will use automated tools to optimize schedules and resource allocations to ensure efficient use of controller resources. Coordination will ensure that each controller is aware of every aircraft that will enter or approach his/her designated airspace. Controllers will coordinate with one another in the radar environment by making aircraft “handoffs” and “point-outs.” Written agreements often require that specific information be included with coordination. Many interfacility transfer-of-control points increase demand on controllers. The BA concept moves interfacility transfer-of-control points away from critical airspace; thus, the time controllers spend coordinating will decrease, which will increase efficiency.
2-7

2.5.4 BA Operational Views The ARR/DEP controller’s view, according to BA plans, will be very different than that of today’s en route or terminal controller. Controllers will be more willing to accept staffing alterations, given the upgrade of the workstations to support the changes. Ultimately, all workstations will be adaptable to airspace as well as training needs. Controllers will train to work all potential configurations in various areas of specialization using separation procedures approved for the given operation. The cross training to integrate the operations will revolve around expanded reduced separation and transition zones. As each controller signs in for the shift, he/she will be briefed on all relevant information for meeting the current and projected operation. The briefing will cover weather, equipment and airport status, and intrafacility and interfacility traffic flows as well as the area, sector, and position configurations. A net-centric information capability at control positions will add a new dimension to the controller toolset, and an increased traffic flow management presence in the control area will provide a more global perspective at the sectors. One of the major benefits of the BA concept is integrating key portions of the ARTCC and the TRACON Traffic Management Units (TMU) into a single control complex. Traffic Management Coordinators, Airline Operations Centers, and other operators, using a suite of automated TFM planning tools, will characterize the traffic management environment of the future. The airspace is finite; therefore, airspace use must be flexible to meet demands. Automated TFM tool development is underway and being carried out with a shared vision of the future, not based on historical airspace use. The current ARTCC/TRACON TFM model has notable human redundancy that the BA does not need. The ARR/DEP facility will conduct the TFM of terminal and transition airspace. A modified TMU will support the remaining airspace in the ARTCC since the task of managing flows to feed into ARR/DEP streams will have been moved to ARR/DEP TFM. Allowing 3 nm separation, diverging courses, and visual separation farther out into transition airspace; developing fanned departures; dynamically moving airspace and routings; and creating parallel air traffic flows are all options that require approaching traffic management in new ways. An integrated traffic management strategy enables traffic managers to play a greater role than they do today. Expanded traffic management in the BA concept creates a single entity for terminal and transition airspace that evaluates, plans, and sets up flexible airspace and aircraft routings to meet expected flows and traffic volume demands. The customer demands a system in the metropolitan areas that is safe, flexible, and accessible with minimal delays. Greater access to dynamic reroutes and bi-directional flows will help the BA meet customer needs. Real-time information will allow customers to manage their flights and schedules more efficiently. The BA concept will simplify CDM initiatives already underway. A net-centric information distribution capability will enable controllers, pilots, dispatchers, and other stakeholders to make decisions based on an integrated picture of the NAS.
2.6 ATC Facility Factors The BA ARR/DEP control service facility will allow for many improvements to the current infrastructure. Chiefly, ideas developed in Airspace Redesign and Human Resources
2-8

Management will undergo maximum use. Many tangible benefits can be realized through a logically and functionally configured floor plan. The ARR/DEP control service facility will adhere to the latest design standards, including U.S. Department of Justice standards, FAA security requirements, and standards regarding accessibility and energy conservation, as well as the most current agency standards for power system design. The structure will have maximum adaptability for all building functions while providing transition space for integrating current and future needs. The major systems within this control service facility for the BA will be automation, communications, and power. The basic BA assumption is to make maximum use of available technology and adapt or replace existing technology consistent with the NAS enterprise architecture. It is assumed that the required changes will be available in the timeframes necessary and will be determined during evaluation and validation of the BA concept.
2.6.1 Automation The FAA is continually deploying ATC automation upgrades with new features and functionality. The BA concept can incorporate new automation upgrades into its operation by 2012. The current flight data management limitations of the existing en route host computer system (HOST) must be addressed to support dynamic airspace reconfiguration and flexible routings. Additionally, the concept is based on net-centric information distribution capabilities. Evaluation and validation of the concept will determine the information and technology requirements. For example, while it is evident that terminal surveillance capabilities will be required to enable a 3-mile separation standard, it is not obvious whether an en route decision support tool, such as a conflict probe, will be beneficial in the integrated ARR/DEP airspace.
2.6.2 Control Room The BA control room will be an open environment configured to maximize efficient flow of air traffic and communications between controllers. The room design will be slightly more complicated to accommodate flexible placement of control suites. There are always changes in systems and hardware that must be incorporated into existing facilities. The design of the integrated ARR/DEP airspace will allow greater flexibility in accomplishing these technology refreshes without significantly impacting the NAS operation. When new automation architecture is developed that will enable integration of multiple domains into one system, BA will be able to incorporate the automation system and maximize the benefits.
2.6.3 Communication Systems Today’s en route and terminal air traffic environments use two different voice communication systems. The ARTCC uses the Voice Switching and Control System, while the TRACON facilities use multiple generations of voice switches, including the Enhanced Terminal Voice Switch and Rapid Deployment Voice Switch. The difference between en route and terminal systems relates partly to the speed and redundancy of communications. The 3-mile separation
2-9

procedures need faster communication speed. The BA concept proposes using a next-generation voice switch that meets the needs of en route, terminal, and integrated ARR/DEP airspace. Existing FAA telecommunications are a collection of dedicated leased-capacity and FAA-owned infrastructure. Implementing the new FAA Telecommunications Infrastructure (FTI) program will consolidate these capabilities into one coherent system. Even with FTI, however, the FAA’s ATC structure will still require connectivity from, for instance, both the New York ARTCC and the New York TRACON to the remote facilities, causing multiple paths to these facilities and extra costs to the FAA. The BA concept will eliminate some of the multiple paths and reduce cost while maintaining redundancy. BA implementation blends well with FTI capabilities to maximize efficient use of vendor infrastructure while minimizing costs.
2.6.4 Air Traffic Services Because of its critical impact on the NAS, the BA concept will need power that is extremely reliable. The FAA is reevaluating its current power program to adapt to changing needs and recent issues. Several large TRACON facilities are installing Dual Redundant Critical Power Distribution Systems, while other new facilities are installing Critical Redundant Power Distribution Systems. BA assumes a state-of-the-art power distribution system that meets redundancy and availability requirements and will also work with the FAA Operational Support Directorate’s Power Systems Management Office (AOS-1000) on its size and design. FAA Order 1900.47A, Air Traffic Services Contingency Plan, establishes a framework and requirements for developing, coordinating, maintaining, revising, and activating contingency plans for ATC facilities. This order discusses operational capability levels that would trigger contingency activities. If a BA facility outage occurred, bordering facilities would be expected to preserve the integrity of the NAS; and the integrated ARR/DEP control service would be primarily responsible for providing backup services to one or more of those facilities in case of failure. The exact responsibilities and parameters associated with an ARR/DEP control service outage will be determined before commissioning and will depend on airspace configuration. At a minimum, the vulnerability and backup issues affecting BA will pose no greater challenges than those at current TRACONs and ARTCCs.
2.6.5 Technical Operations Technical operations will fall under NAS Infrastructure Management, an integrated, multi-tiered structure for centralized command and control. It will focus on user and customer satisfaction, and the NAS Infrastructure Management System provides the tools to support the approach. The Systems Management Office provides administrative, training, and technical support to Technical Operations personnel. Hardware maintenance will be under FAA Order 6000.30C, National Airspace Maintenance Policy. Maintenance will be on two levels: field and depot. Field-level maintenance includes removing and replacing defective Line Replaceable Units. Depot-level maintenance includes repair by government or contractor maintenance personnel.
2-10
The hardware maintenance approach applicable to BA—for example, the decision to select organic repair or contractor repair or to discard—is based on the maintenance concept approved for individual systems, subsystems, and equipment under their respective acquisition programs.
2.7 Concept Evolution The Integrated Arrival/Departure Control Service (Big Airspace) Concept of Operations was published in August of 2005. It defined the timeframe for implementation of the concept as 2012 and beyond. Research conducted over the last 2 years examining the feasibility of deploying the concept as early as 2012 concluded that 2015 would be a more viable timeframe for early implementation. As the simulation models were designed to validate the original Concept of Operations, they used 2012 as the baseline for Big Airspace implementation. Subsequent analyses that used the simulation model findings, such as the cost-benefit analysis, took into account the financial and technical interdependencies that suggest that this concept cannot be implemented until 2015. Therefore, throughout this document, both 2012 and 2015 dates are used to describe initial BA operations, depending on the timeframe during which the analysis was completed. Future research into more detailed program plans could lead to further changes in the implementation outlook for BA. All of the operational characteristics in the Concept for Operations remain unchanged. However, the concept validation methods used did not allow for validation of the benefits or need for some of the operational components, most notably the expanded use of visual separation standards above 18,000 feet and the benefits associated with an integrated traffic management unit. In addition, some of the features of the Arrival/Departure control service environment have evolved. For example, questions regarding the need for a conflict probe have been answered; development of the En Route Automation Modernization (ERAM) system to replace the Host computer system is well underway with a scheduled implementation date of 2012; initial program requirements and investment decisions have been made for System Wide Information Management; planning for the future NAS voice switch is well underway; implementation is well underway for the new FTI; the Roadmap for Performance-Based Navigation has evolved; and standards for Required Surveillance Performance (RSP) for 3- and 5-mile separation have been developed. Requirements and cost-benefit analyses performed during concept validation account for the evolution that has occurred since 2005 in the NAS Enterprise Architecture.
2-11
3 CONCEPT VALIDATION Under the auspices of FAA Air Traffic Organization’s Operations Planning Research and Technology Development Office (AJP-6), a team of researchers and analysts was formed to perform the simulation and concept feasibility evaluations. This team, referred to as the BA Team, consisted of individuals from the following organizations:
• FAA Air Traffic System Concept Development (AJP-66)
o Headquarters
o William J. Hughes Technical Center (WJHTC), Simulation & Analysis Team (AJP-661)
• FAA Human Factors Research & Engineering Group (AJP-61), WJHTC, Human Factors Field Team (AJP-611)
• FAA System Engineering and Safety (AJP-1900)
• San Jose State University
• BAE Systems
• Booz Allen Hamilton
• MCR
• FAA Terminal Services, ATO-T
• FAA En Route and Oceanic Services, ATO-E
• FAA System Operations Services, ATO-R
• FAA Finance Services, ATO-F
• FAA Technical Operations Services, ATO-W
3.1 Pre-Validation Activities
The BA Team conducted a series of pre-validation activities to gather information regarding subject matter expert and operational facility opinion on the BA concept, forecast data regarding future traffic levels and technologies, and airspace and procedures for simulation evaluations. The team applied this information to the simulation and modeling, and concept feasibility analysis efforts. The pre-validation activities are described in Section 4.
3.2 Simulation and Modeling Analysis To test the operational feasibility of the BA concept, the BA Team performed a series of simulation studies, employing different techniques. The studies included fast-time system performance simulation, fast-time human performance simulation, and real-time human-in-the-loop simulation. Each technique had its own unique strengths, which enabled a comprehensive evaluation of the BA concept regarding its impacts on efficiency, capacity, safety, and human performance. The studies also helped drive requirements for further development of the concept
3-1

and its components. Sections 5 through 8 present the purpose, methodology, results, and conclusions of each BA simulation and modeling evaluation.
3.3 Concept Feasibility Analysis
In addition to the simulation and modeling evaluations, the BA Team performed other pertinent analyses to assess the feasibility of BA, including a facility consolidation analysis, cost/benefit analysis, safety and risk analysis, and requirements analysis. Sections 9 through 12 document the results and recommendations from these efforts.
3-2

4 PRE-VALIDATION ACTIVITIES In late 2005 through the spring 2006, the BA Team performed information-gathering activities to help make decisions on the appropriate inputs to the simulation and concept feasibility analyses. These activities consisted of the following:
• Cognitive walkthrough exercise of the BA concept with subject matter experts (SME) from the field;
• Forecast of the traffic demand for the year 2012 (corresponding to the earliest year BA could be implemented based on available technologies);
• Forecast of the NAS architecture, with all applicable components to BA, for the year 2012;
• Development, distribution, and analysis of operational characteristic site surveys to ATC facilities;
• Development of generic airspace, representing components of BA within a major metropolitan area, and other essential airspace and weather characteristics; and
• Development of ATC procedures for the BA concept. Sections 4.1 through 4.6 describe these efforts and the information that the team applied to the BA simulation development and concept feasibility analysis. Section 4.7 summarizes the BA components addressed by each simulation technique, which was primarily based on individual simulation tool capabilities.
4.1 Cognitive Walkthrough Exercise
Members of the BA Team conducted a cognitive walkthrough (CWT) exercise at the Research and Development Human Factors Laboratory at the WJHTC on November 29 and 30, 2005. The purpose of the CWT was to elicit feedback from SMEs representing different ATC domains (e.g., terminal, en route, traffic management) regarding the BA concept. Topics pertained to the concept’s feasibility, potential benefits, and potential drawbacks. TMU managers and area supervisors from TRACON and ARTCC facilities in Orlando, Jacksonville, Chicago, Boston, and Cleveland participated in the CWT. The BA Team briefed the SMEs on the overall concept and the proposed experiment conditions, which included Baseline (BL) airspace, BA Combined (i.e., controllers working BA together in one facility), and BA Not-Combined (i.e., controllers working BA from their respective terminal and en route facilities). The team presented the concept using a generic airspace model so that all participants had a common reference. BA Team members asked questions about the impact of BA on coordination, static/dynamic routes, decision support tools, and other issues. They repeated the questions for each condition to draw out differences between them. The SMEs discussed current-day issues and offered thoughts on what effects BA would have on ATC operations. Although the team used generic airspace as a talking point, the SMEs consistently referred to issues with their specific airspace.
4-1

They were limited in their ability to envision potential benefits for airspace with which they were not familiar. The SMEs focused largely on coordination, an area where they felt BA would be most beneficial. They commented that one key factor for increasing efficiency is a reduction of coordination between facilities and hence a reduction in delays. They felt that centralizing management of several TRACON facilities and the ARR/DEP portion of an en route facility would lead to more flexibility in routes and flow structures, as well as a significant decrease in coordination time. The concept of having integrated BA facilities seemed more likely to improve efficiency than maintaining separate facilities. The SMEs discussed the scope of BA and felt that the boundaries would likely need tailoring to the specific site to which they were applied. They related the possible configurations of BA to their own airspace, basing their vision on the Orlando Sun Coast TRACON Study (FAA, 1999). Chicago experts, however, seemed to think BA would be restrictive within their airspace; they believed that combining approach controls into one sector would help reduce coordination. The SMEs discussed decision support tools (DST) extensively. They felt that the DSTs, with some exceptions, would mostly remain the same from now to 2012. They asserted that certain tools, such as data link, could reduce workload in the future. However, current avionics, with the existing flight management system—as well as strategic ATC tools (such as Traffic Manager Advisor and User Request Evaluation Tool)—may be unable to accommodate the dynamic traffic flows. Overall, the SMEs felt that BA could significantly enhance flexibility and efficiency in the area of coordination. They emphasized the need, however, for a cultural change within and between terminal and en route facilities and felt that the BA concept was a positive step in that direction.
4.2 Traffic Demand Forecasts To develop representative traffic samples for the proposed simulations, in terms of traffic levels and aircraft fleet mixes, the BA Team had to first determine the expected traffic characteristics for metropolitan areas in the year 2012. Selection of airports focused on traffic volume and operational characteristics such as constrained airspace, large origin/destination markets, and airspace restrictions. The BA Team selected nine metropolitan areas for analysis:
• Chicago and Great Lakes region • Boston • New York/New Jersey/Philadelphia • Washington, DC • Dallas-Fort Worth • Houston • Northern California/San Francisco Bay Area • Southern California/Los Angeles Basin • Central Florida (Orlando)
4-2
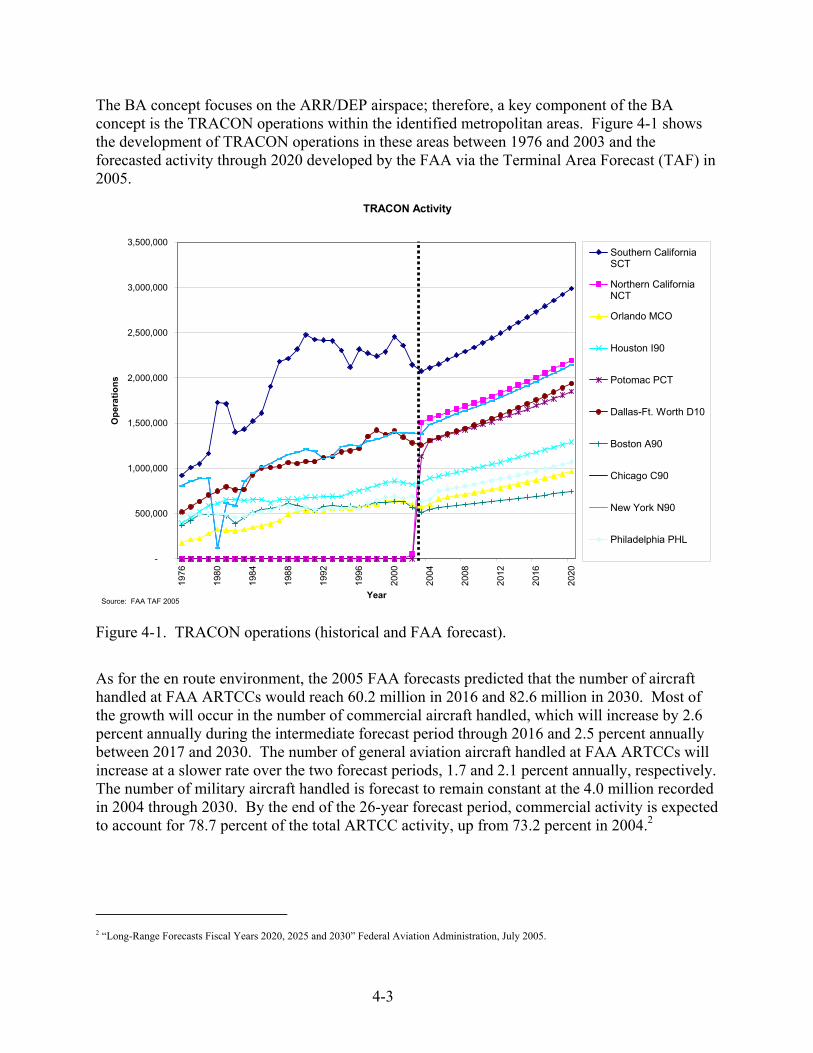
The BA concept focuses on the ARR/DEP airspace; therefore, a key component of the BA concept is the TRACON operations within the identified metropolitan areas. Figure 4-1 shows the development of TRACON operations in these areas between 1976 and 2003 and the forecasted activity through 2020 developed by the FAA via the Terminal Area Forecast (TAF) in 2005.
TRACON Activity
-
500,000
1,000,000
1,500,000
2,000,000
2,500,000
3,000,000
3,500,000
1976
1980
1984
1988
1992
1996
2000
2004
2008
2012
2016
2020
Year
Ope
ratio
ns
Southern CaliforniaSCT
Northern CaliforniaNCT
Orlando MCO
Houston I90
Potomac PCT
Dallas-Ft. Worth D10
Boston A90
Chicago C90
New York N90
Philadelphia PHL
Source: FAA TAF 2005
Figure 4-1. TRACON operations (historical and FAA forecast).
As for the en route environment, the 2005 FAA forecasts predicted that the number of aircraft handled at FAA ARTCCs would reach 60.2 million in 2016 and 82.6 million in 2030. Most of the growth will occur in the number of commercial aircraft handled, which will increase by 2.6 percent annually during the intermediate forecast period through 2016 and 2.5 percent annually between 2017 and 2030. The number of general aviation aircraft handled at FAA ARTCCs will increase at a slower rate over the two forecast periods, 1.7 and 2.1 percent annually, respectively. The number of military aircraft handled is forecast to remain constant at the 4.0 million recorded in 2004 through 2030. By the end of the 26-year forecast period, commercial activity is expected to account for 78.7 percent of the total ARTCC activity, up from 73.2 percent in 2004.2
2 “Long-Range Forecasts Fiscal Years 2020, 2025 and 2030” Federal Aviation Administration, July 2005.
4-3
4.2.1 Traffic Volume The BA Team determined traffic volume for the year 2012 using a current Official Airline Guide (OAG) schedule, 2005 Enhanced Traffic Management System (ETMS) data, TAF, and airport capacity improvement projects outlined in the Capital Investment Plan (CIP). They used the data in the resulting figures in the fast-time system performance and human performance simulations (see Sections 5 and 6). For the real-time simulation, the BA Team used the forecast data as a starting point for the traffic scenarios; however, the goal was to present steady-busy flows to the controller participants throughout the scenarios. Therefore, the team modified the initial fast-time traffic scenario to meet this objective for the real-time simulation (see Section 7).
4.2.2 Fleet Mix Aircraft types used for the future flights were developed from a Boeing forecast and previous work generated from the Domestic Reduced Vertical Separation Minimum (DRVSM) benefits program. The DRVSM benefits analysis consisted of information on RVSM-compliant aircraft types and aircraft that were likely to be retired within the near future. Aircraft that originated at or were destined for the nine metropolitan areas were recorded, and an average distribution of aircraft types (fleet mix) was developed. This average fleet mix was applied to the 2012 baseline schedule of flights traversing Central Florida to create the representative traffic sample. The Airbus 380 was not modeled, as the team lacked information concerning the forecast and performance of this aircraft at the time of simulation development. In addition, the team did not model Unmanned Aircraft Systems (UAS), also due to a lack of forecast data on using UAS in the NAS, specifically related to routing and uses around metropolitan areas. Also, Very Light Jets were not included in the HITL simulation because they were not a part of the flight dynamics model at the time of the study.
4.3 NAS Architecture Definition The NAS architecture definition activity was an effort to determine what the NAS architecture would look like, in terms of technology and equipment, in the years 2012–2015. The BA Team needed this information to simulate the BA concept as realistically as possible, and to compare it against a baseline that included technology planned for 2012. Each simulation technique, however, had its own capabilities and limitations; therefore, some technologies were “assumed” to be present in the evaluations. The BA Team reviewed the FAA NAS Architecture 6 (n.d.) and pared down a list of more than 60 mechanisms applicable to BA operations to a manageable set for the simulation evaluations. Table 3 in Section 4.7 lists the NAS architecture components included in each simulation evaluation. Not mentioned in the table are the following key assumptions:
• Aircraft were assumed equipped for RNP-1 in both the baseline and BA conditions. The BA Team assumed that by 2012, 100 percent of all aircraft going to major metropolitan airports would be equipped for RNP.
4-4
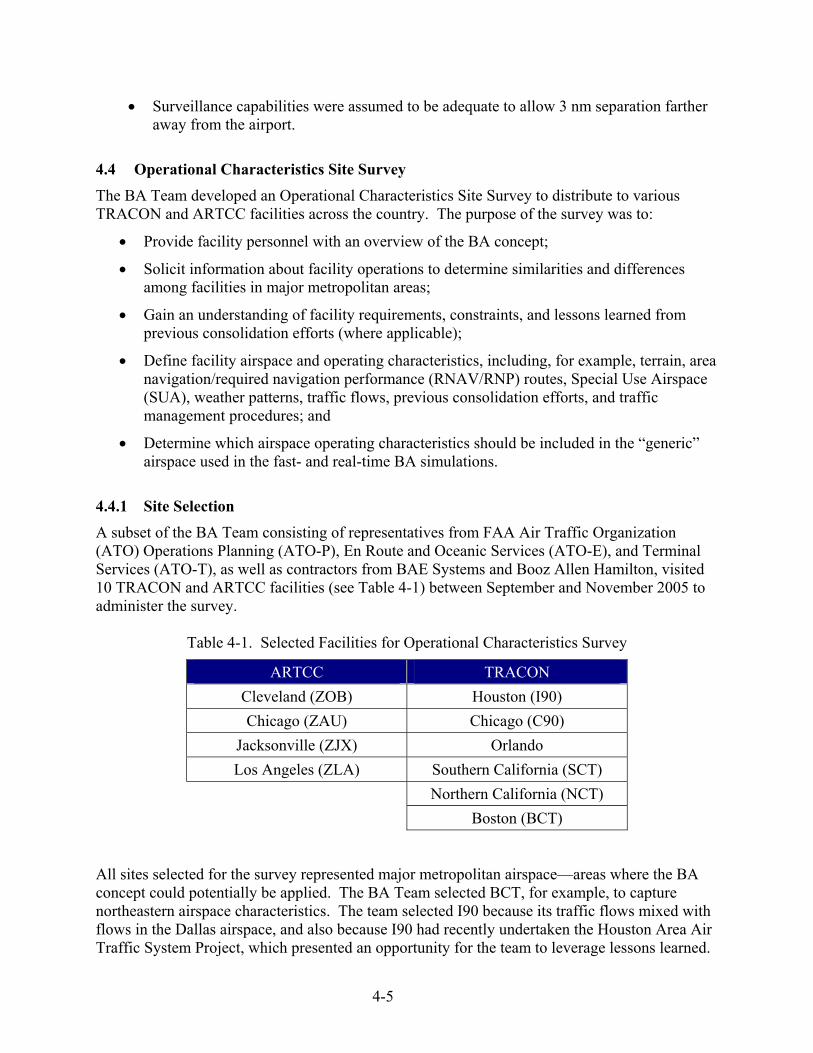
• Surveillance capabilities were assumed to be adequate to allow 3 nm separation farther away from the airport.
4.4 Operational Characteristics Site Survey The BA Team developed an Operational Characteristics Site Survey to distribute to various TRACON and ARTCC facilities across the country. The purpose of the survey was to:
• Provide facility personnel with an overview of the BA concept;
• Solicit information about facility operations to determine similarities and differences among facilities in major metropolitan areas;
• Gain an understanding of facility requirements, constraints, and lessons learned from previous consolidation efforts (where applicable);
• Define facility airspace and operating characteristics, including, for example, terrain, area navigation/required navigation performance (RNAV/RNP) routes, Special Use Airspace (SUA), weather patterns, traffic flows, previous consolidation efforts, and traffic management procedures; and
• Determine which airspace operating characteristics should be included in the “generic” airspace used in the fast- and real-time BA simulations.
4.4.1 Site Selection A subset of the BA Team consisting of representatives from FAA Air Traffic Organization (ATO) Operations Planning (ATO-P), En Route and Oceanic Services (ATO-E), and Terminal Services (ATO-T), as well as contractors from BAE Systems and Booz Allen Hamilton, visited 10 TRACON and ARTCC facilities (see Table 4-1) between September and November 2005 to administer the survey.
Table 4-1. Selected Facilities for Operational Characteristics Survey
ARTCC TRACON Cleveland (ZOB) Houston (I90) Chicago (ZAU) Chicago (C90)
Jacksonville (ZJX) Orlando Los Angeles (ZLA) Southern California (SCT)
Northern California (NCT) Boston (BCT)
All sites selected for the survey represented major metropolitan airspace—areas where the BA concept could potentially be applied. The BA Team selected BCT, for example, to capture northeastern airspace characteristics. The team selected I90 because its traffic flows mixed with flows in the Dallas airspace, and also because I90 had recently undertaken the Houston Area Air Traffic System Project, which presented an opportunity for the team to leverage lessons learned.
4-5
The team selected the central Florida area for a chance to survey its increasing traffic volume, multiple airports, weather, and SUA, as well as to obtain significant lessons learned from the Sun Coast TRACON Project. The BA Team did not include New York area facilities in the survey because those facilities had been involved in the NYICC study previously. Also, the team excluded Philadelphia from the survey list because that facility was involved in the recent New York/New Jersey/Philadelphia Metropolitan Airspace Redesign Project. The team excluded Atlanta because there was only one major airport in its metropolitan area; and the south Florida region, due to geographical constraints that made the area too unique, and therefore not applicable to development of generic airspace.
4.4.2 Survey Preparation and Conduct The BA Team sent each participating facility a two-page summary and a copy of the BA concept briefing before its visit so that the staff could become familiar with the concept. To ensure broad facility representation, the team requested participation of air traffic supervisors, and representatives from the traffic management unit, terminal planning and procedures, en route airspace and procedures, and high altitude descent control. The actual 1-day visit included a facility briefing on airspace and operational highlights; a concept briefing presented by the BA survey team; a thorough discussion of predetermined talking points; question and answer periods; a facility tour that included controller observation; and a final wrap-up. The talking points covered traffic flows, traffic flow management, airspace, operating procedures, sector team roles and responsibilities, and transition from terminal to en route airspace. BA Team members did not have time to meet with controllers. After each survey, the team developed trip reports to capture the data exchange, key discussion points, and both the common and site-specific operational and airspace characteristics.
4.4.3 Results The team categorized all of the general operational characteristics for each participating facility and entered them into a matrix to compare (see Table 4-2). They added supplemental data to ensure a more complete comparison. The matrix was used as a reference for designing generic airspace for the simulations. Some of the points considered related to airspace constraints (e.g., SUA, weather (Wx)), sector shapes, departure and arrival procedures (e.g., keep departures under arrivals, parallel arrivals through single gate), and satellite airport activity.
4-6


Table 4-2. Operational Characteristics Summary Matrix ARTCCs TRACONs
Characteristics ZLA ZJX ZOB ZAU SCT MCO Chicago Houston BCT NCT
Special Use Airspace
High High Low Low High High Med High Low Low
Weather Type Low viz Frontal, convective
Frontal, convective
Frontal, convective
Low viz Frontal, convective
Frontal, convective
Frontal, convective
Frontal, convective
Low viz
Weather Delays Low (.02 %) Low (.06 %) Low (.05 %) High (.39 %) Low High Low Low Low Low
Percent of Delays from Weather
48.8 % 70.8 % 39.4 % 84.3 % 22.7 % 96.2 % 11.5 % 92.3 % 30.0 % 3.3 %
Wx IFR Condition Smog/Fog Storms Storms /Fog/Snow
Storms /Fog/Snow
Smog/Fog Storms Snow Storms Fog/Snow
Fog
Traffic Flow Considerations
SUA North/South Overflights Congested SUA SUANorth/South
Dense Congested Dense Congested
Overflights 10.5 % 30.3 % 41.8 % 23.0 % 1.3 % 15.9 % 2.7 % 7.1 % 5.2 % 4.2 %
Major Airports High Med Med High Med High High Low Low
Minor Airports High Med High Med High High High High Low Med
Traffic Volume (relative rank)
Med (4) High (3) High (1) High (2) High (1) Med (6) High (3) Med (4) Med (5) High (2)
Aircraft Type Classification
AC 62.4 % AT 15.7 % GA 15.6 % MIL 6.2 %
AC 51.3 % AT 17.5 % GA 24.1 % MIL 7.1 %
AC 45.2 % AT 33.9 % GA 14.4 % MIL 6.6 %
AC 50.2 % AT 29.5 % GA 18.2 % MIL 2.1 %
AC 40.0 % AT 18.8 % GA 37.6 % MIL 3.7 %
AC 42.0 % AT 21.9 % GA 35.1 % MIL 1.1 %
AC 56.0 % AT 28.9 % GA 14.9 % MIL 0.1 %
AC 42.0 % AT 33.0 % GA 23.3 % MIL 1.7 %
AC 35.9 % AT 34.0 % GA 28.9 % MIL 1.1 %
AC 38.1 % AT 19.4 % GA 38.5 % MIL 4.0 %
RNAV Utilization Low Low Low Low Low Low Low Low Low Low
Route Options / Flexibility
Low Low Med Low Low Low Low Med Med High
Consolidated Facility
N/A N/A N/A N/A Yes No No No Yes Yes
2020 Forecast (Millions of ops)
3.0 3.5 4.3 3.7 2.9 0.9 2.1 1.2 0.7 2.1
AC = Air Carrier, AT = Air Transport, GA = General Aviation, MIL = Military Aircraft
4-7

4.5 Generic Airspace Development The BA Team used generic airspace for the simulations for both conceptual and experimental reasons. Generic airspace enabled the team to:
• Incorporate characteristics of several metropolitan airspaces into one;
• Recruit participants from numerous facilities as opposed to a single facility, which eased staffing pressures at facilities that provided the participants and broadened the sampling population;
• Reduce between-participant variability due to facility-specific experiences. This increased the team’s ability to reliably detect differences between baseline and experimental conditions.
4.5.1 Approach To build generic airspace from scratch would have required much time and effort due to the desired complexity of the airspace. The BA Team therefore decided to take existing airspace, with validated route structures and traffic flows, and “genericize” it. They selected the central Florida airspace to modify, which included portions of airspace from two ARTCCs (i.e., Jacksonville (ZJX) and Miami (ZMA) Centers); two major airports (i.e., Orlando International Airport (MCO) and Tampa International Airport (TPA)); and three satellite airports (i.e., Orlando Sanford International Airport (SFB), Orlando Executive (ORL), and Melbourne International Airport (MLB)). The BA Team selected central Florida airspace because it contained many of the desired characteristics for evaluating BA, including SUAs, convective weather, and several approach control facilities, with multiple ARR/DEP routes to and from the terminal area. Also, at the time of the study, central Florida had two of the 35 Operational Evolution Plan airports and two of the 45 Operational Network airports, MCO and TPA. Furthermore, MCO had spare capacity, which allowed for traffic levels to be increased to 2012 traffic levels without putting an unrealistic demand on the airport. The BA Team genericized the central Florida airspace by adding multiple RNAV routes in and out of the area; changing the sector, terminal, and en route boundaries as necessary to create BA; and changing route, fix, and waypoint names. The initial source of data to build the airspace was obtained from the Adaptation Controlled Environment System, dated February 16, 2006. Section 5.2 describes the suite of modeling programs used to develop and refine the generic airspace. Figure 4-2 shows the airspace, about 200 nm wide, which the team used as a basis for all of the simulation testing. The overall airspace, including ZJX and ZMA, was used in the fast-time system performance simulation evaluations. Only a portion of this airspace (i.e., four sectors), however, was used for the fast-time Human Performance Modeling and real-time HITL simulations. To develop procedures in enough detail for humans to interact with the entire
4-8

airspace would have required significantly more time and resources than were available. Sections 5, 6, and 7 provide descriptions of the airspace used for each simulation evaluation.
Figure 4-2. Simulated airspace within existing ZJX and ZMA airspace. Note. ZJX = dashed lines, ZMA = solid lines.
4.5.2 Airspace Conditions: Baseline and Big Airspace The BA Team developed two airspace conditions for the simulations: a baseline (BL) condition and a Big Airspace (BA) condition. The overall volume of airspace (i.e., outermost boundaries) was the same for both conditions; however, the sector boundaries changed to allow for the integrated ARR/DEP airspace sectors. Also, in BA, the boundaries between the arrival transition sectors and feeder sectors were closer to the airport than in BL, providing controllers greater flexibility in routing and sequencing before handing off to the approach controller. Both the BL and BA conditions represented the year 2012; therefore, both conditions contained RNAV Standard Instrument Departures (SID) and Standard Terminal Arrival Routes (STAR). There were more of them, however, in the BA condition due to the reduced separation capability that BA provided. The BA condition also had dynamic airspace boundaries, which supported shifting route ownership from one sector to another and the capability of bi-directional flows. The airspace in the BL condition had dedicated ARR/DEP routes, but did not allow for bi-directional flow capabilities.
4-9

4.6 Procedures Development The BA Team developed procedures for both the BL and BA test conditions since they both represented a future timeframe and a shift away from today’s ATC practices. In addition, each simulation technique had its own pieces of the architecture (e.g., Traffic Management Advisor (TMA), data link); therefore, procedures were developed as necessary for those components. This section provides an overview of the procedures; for details, refer to each simulation section (Sections 5, 6, and 7). In general, procedural development activities included writing letters of agreement and standard operating procedures between facilities and sectors, respectively, for BL and BA conditions; completing an analysis of each airspace design down to the specific BL and BA sectors; designing RNAV/RNP routes to manage the primary airports’ ARR/DEP flows; and developing crossing restrictions in altitude and airspeed for procedural separation along the RNAV routes.
4.6.1 Baseline Procedures The BL procedures remained consistent, for the most part, with the procedures in the Federal Aviation Administration Order (FAAO) 7110.65, Air Traffic Control, namely: “Separate aircraft by the following minimum: 1) When less than 40 miles from the antenna - 3 miles; 2) When 40 miles or more from the antenna - 5 miles; 3) Terminal, for single sensor Airport Surveillance Radar Model 9 (ASR-9) with Mode S, when less than 60 miles from the antenna - 3 miles.” (Note: This included the single sensor long-range radar mode.) The BL condition consisted of multiple RNAV routes within its airspace. These routes had 5 miles’ separation, which was based on the procedural limit of 3 nm and a 1 nm buffer based on current RNP limits. The RNAV routes in the transition sectors had 7 miles’ separation, which was based on the procedural limit of 5 nm and a 1 nm buffer. The procedural differences between the terminal and transition airspace, in addition to the size of the terminal area, limited the number of RNAV routes that could be built into the BL airspace.
4.6.2 Big Airspace Procedures For the BA condition, the BA Team modified the FAAO 7110.65 separation standards above to state that the standard separation between aircraft within BA was 3 miles. This modification was based on RSP. In brief, the RSP theory states that regardless of the surveillance mechanism providing the data, the accuracy and integrity of the data enable use of 3 miles’ separation between aircraft. The exceptions to this BA separation standard remained consistent with FAAO 7110.65 (i.e., wake turbulence separation). The BA condition consisted of more RNAV routes within its airspace than the BL condition, even though the distance between RNAV routes was the same as in the BL condition. This was so because in BA, the physical size of the airspace in which 3 nm separation was allowed was greater.
4-10

The dynamic resectorization component of BA was uniquely handled by each simulation technique. In general, though, the procedures for bi-directional flows began with the assumption that at a certain time, an individual (e.g., supervisor) made a decision to change the flow of traffic on one or more RNAV routes from either a departure flow to an arrival flow, or vice versa. Leading up to the change in flow, traffic ceased in the current direction, and residual aircraft cleared their current route to allow for the change in flow.
4.7 Big Airspace Components Addressed by Each Simulation Technique Table 4-3 summarizes the components of the BA concept and how they were addressed by each simulation technique. The BA Team made every effort to address as many BA components as possible. However, in some cases, parts of the concept simply were not candidates for the simulation and modeling environment at this time. In other cases, simulation limitations did not allow for components’ inclusion in the evaluations.
Table 4-3. Summary of BA Components by Simulation Technique
INTEGRATED ARRIVAL/DEPARTURE
SERVICE FAST-TIME REAL-TIME
System Performance Human Performance
Human-in-the-Loop
Increased traffic levels Yes Yes Yes
Year 2012 Yes
Also simulated 50% and 100% increases
of 2012 level
Yes
Also simulated 50% and 100% increases
of 2012 level
Yes
Added additional aircraft to keep steady
pressure on the airport
New facility built n/a n/a n/a
Environmental and noise objectives n/a n/a n/a
Expanded RNAV routes Yes Yes Yes
Airspace redesign Yes Yes Yes
The central Florida airspace was redesigned (and made generic) to function as Integrated Arrival/Departure Service airspace
Dynamic resectorization
Yes
Multiple RNAV routes had
bi-directional capability
Yes
Multiple RNAV routes had bi-
directional capability
Yes
One RNAV route had bi-directional
capability
4-11

INTEGRATED ARRIVAL/DEPARTURE
SERVICE FAST-TIME REAL-TIME
System Performance Human Performance
Human-in-the-Loop
Procedures
3 nm separation Yes Yes Yes
Visual separation, diverging courses, etc.
n/a No Visual separation - No
Diverging courses - Yes
Includes necessary
Automation
o TMA
o URET
o ERAM
Yes
n/a
n/a
Yes
Yes
n/a
No
TMA list not implemented for use by participants in the simulation. Traffic
initially set up spaced, but after controller took
control of aircraft, TMA-like spacing
was not assured
Yes
No
Would have required more extensive
participant training. Also, not all
components of ERAM were fully defined at time of
simulation.
4-12
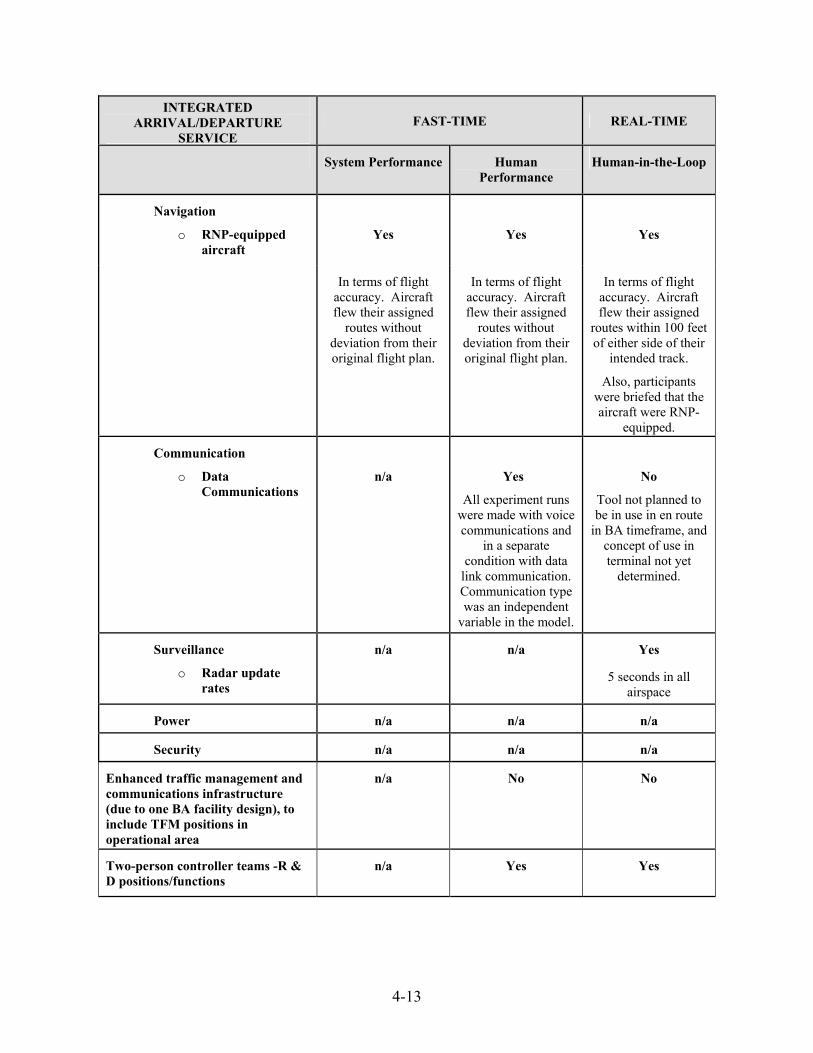
INTEGRATED ARRIVAL/DEPARTURE
SERVICE FAST-TIME REAL-TIME
System Performance Human Performance
Human-in-the-Loop
Navigation
o RNP-equipped aircraft
Yes
Yes
Yes
In terms of flight accuracy. Aircraft flew their assigned
routes without deviation from their original flight plan.
In terms of flight accuracy. Aircraft flew their assigned
routes without deviation from their original flight plan.
In terms of flight accuracy. Aircraft flew their assigned
routes within 100 feet of either side of their
intended track.
Also, participants were briefed that the aircraft were RNP-
equipped.
Communication
o Data Communications
n/a
Yes
All experiment runs were made with voice communications and
in a separate condition with data
link communication. Communication type was an independent
variable in the model.
No
Tool not planned to be in use in en route
in BA timeframe, and concept of use in terminal not yet
determined.
Surveillance
o Radar update rates
n/a n/a Yes
5 seconds in all airspace
Power n/a n/a n/a
Security n/a n/a n/a
Enhanced traffic management and communications infrastructure (due to one BA facility design), to include TFM positions in operational area
n/a No No
Two-person controller teams -R & D positions/functions
n/a Yes Yes
4-13

INTEGRATED ARRIVAL/DEPARTURE
SERVICE FAST-TIME REAL-TIME
System Performance Human Performance
Human-in-the-Loop
Minimal training n/a n/a Yes
Recruited participants who were current in en route or terminal,
or both.
BA in one facility n/a n/a Yes
Also looked at BA in two separate facilities
Modified supervisor roles and responsibilities
n/a No No
Did not have participants who
performed supervisory functions.
4-14
5 FAST-TIME SYSTEM PERFORMANCE SIMULATION 5.1 Introduction
5.1.1 Background Fast-time simulation and modeling exercises are typically performed to examine system performance, including capacity, delay, and efficiency for benefits assessment. They are often used in the early stages of validation to get initial preliminary ideas of potential benefits. Fast-time and modeling studies are also useful for identifying potential problem areas for which real-time simulation studies are necessary for further exploration (Operational Concept Validation Strategy Document, 2003).
5.1.2 Research Team The Air Traffic System Concept Development Group (AJP-66) at the WJHTC performed the fast-time system performance modeling of the BA concept. The individuals involved represented a subteam within the BA Team and hereafter are referred to as the “FT Team.”
5.1.3 Purpose The objective of the fast-time simulations was to evaluate the system performance of the BA concept. The evaluation involved using several analytical tools and fast-time models. The FT Team gathered specific metrics to identify the feasibility of the BA concept. The team also used the results of the fast-time simulations as input to a cost/benefit analysis to show annualized benefits of the BA concept (see Section 10).
5.2 Models and Tools Following are the tools and models the FT Team used to create the scenarios and assess the benefits of the BA concept.
5.2.1 Terminal Area Route Generation Evaluation and Traffic Simulation (TARGETS)
TARGETS is a program the FT Team used to develop and test aircrafts’ ability to fly RNAV routes. They used TARGETS to develop the RNAV routes for both the fast-time and real-time simulations. The team also developed the initial sector design for the BL and BA conditions using TARGETS.
5.2.2 Sector Design Analysis Tool (SDAT) SDAT is a computer program designed to assist ARTCC airspace and procedures specialists and airspace analysts in designing airspace. SDAT provides the airspace designer a fast, easy, and accurate way to develop and evaluate proposed changes to airspace structure and/or traffic loading. The FT Team used SDAT to design the BL and BA condition airspaces.
5-1

5.2.3 AWSIM AWSIM is a suite of trajectory, simulation, conflict prediction, conflict resolution, and metric tools that can perform a wide range of air traffic simulation and evaluation tasks. These capabilities include manipulating four-dimensional flight trajectories, identifying and resolving aircraft-to-aircraft and aircraft-to-airspace conflicts, evaluating future concepts, and developing new routings. The FT Team used the AWSIM suite to evaluate effectiveness of the BA concept.
5.2.4 Post Operations Evaluation Tool (POET) POET is a system used to analyze NAS performance. Analysis results can be aggregated into a variety of bins, including grouping by departure and/or arrival airports, filed arrival fixes, departure/arrival times, National Route Program (NRP)/non-NRP, departure and/or arrival centers, user class, and others. The FT Team used POET to determine the convective weather pattern in the weather scenario.
5.3 Fast-Time Simulation Input Characteristics
5.3.1 Airspace The genericized airspace that the FT Team used in the fast-time simulations consisted of two ARTCCs, two major airports, and three satellite airports (as described in Section 4.5.1). The team created two airspace conditions to simulate the BL and BA procedures and airspace characteristics. Figure 5-1 shows the BL condition was typical of the current environment; the terminal area surrounded the predominant airport(s), in this case, MCO and TPA. The terminal area for MCO was about 80 miles wide with a 0 foot mean sea level (msl) floor and 17,000-foot (ft) ceiling. The BA condition airspace, as shown in Figure 5-2, was larger, about 200 miles wide, with 0 msl floor and 27,000-ft ceiling.
5-2

Figure 5-1. Baseline airspace sectors. Note. Dark gray = 5 nm separation, Light gray = 3 nm separation
Figure 5-2. BA sectors. Note. All areas = 3 nm
5-3

The BA condition also allowed for dynamic sector boundary changes during heavy arrival and departure flows. Figure 2 shows the dynamic sectors. During heavy arrival flows, the arrival sector would temporarily gain area from the departure sector; and during heavy departure flows, the departure sector would temporarily gain area from the arrival sector. This allows for an increase in controller efficiency and throughput. This was also used effectively in the weather scenario, which allowed for the dynamic change as the convective weather passed through the sectors giving more space for maneuvering around the weather.
5.3.2 Airports The FT Team simulated two major and three satellite airports. They based the major airports on MCO and TPA and based the satellite airports on SFB, ORL, and MLB. The team simulated the two major airports to the runway. Arrival aircraft departed from their origin airport following a great circle route. The arrivals then transitioned to the predefined RNAV route and flew to the runway end. Departing aircraft departed from the runway end on a predefined RNAV route, continued until reaching a fix, and then flew a great circle to their destination airport. The team did not simulate the three satellite airports down to the runway. Aircraft arriving and departing from these airports did so at a point that defined the airport. Arrival aircraft departed from their origin airport, connected to a predefined RNAV route, flew through BA, and then flew direct to the airport. Departing aircraft flew a predefined RNAV route, continued until reaching a fix, and then flew direct to their destination airport.
5.3.3 Traffic Scenarios
The BA concept study required development of traffic scenarios that contained the same number and type of aircraft for both the BL and BA conditions. The only difference between the traffic scenarios was the routes flown. The schedule had aircraft feeding into and out of the specified airspace from five surrounding airports. Table 5-1 shows the traffic volume for each airport.
Table 5-1. Traffic Volume by Airport
Airport Year 2012 +50 percent +100 percent MCO 1323 2138 2679 TPA 873 1411 1785 SFB 61 93 125 ORL 149 207 244 MLB 80 133 162
Total Number of Aircraft
2486 3982 4995
5-4
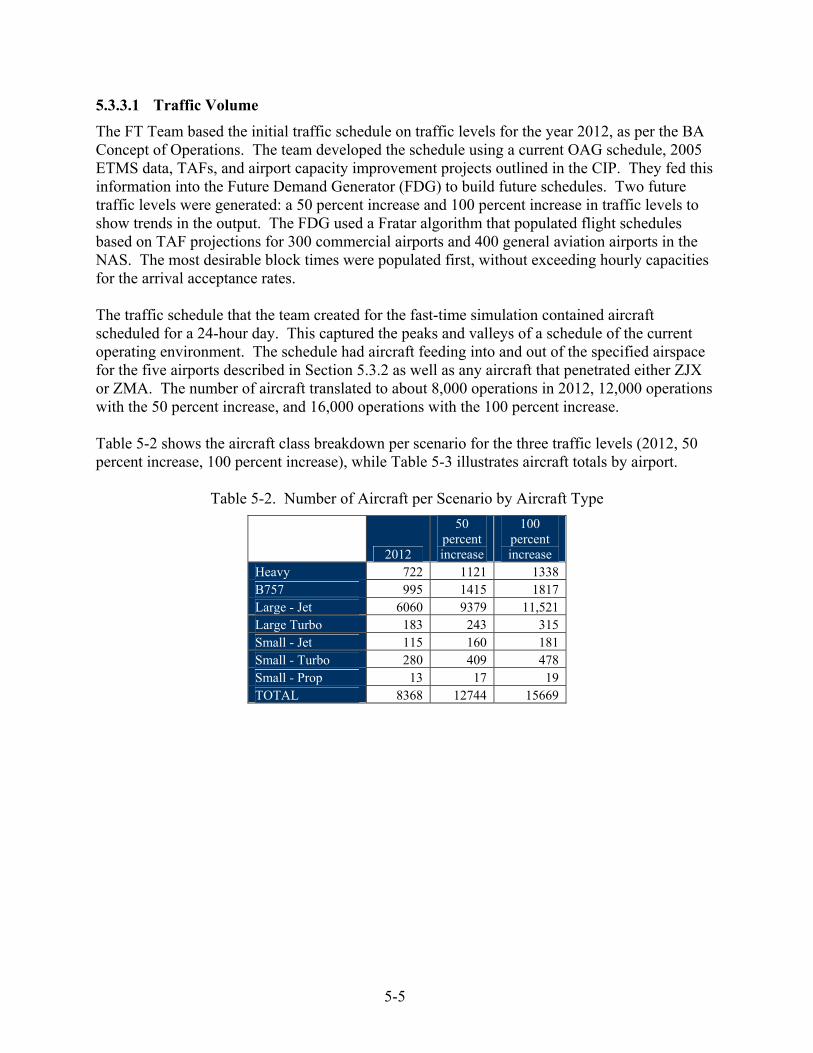
5.3.3.1 Traffic Volume The FT Team based the initial traffic schedule on traffic levels for the year 2012, as per the BA Concept of Operations. The team developed the schedule using a current OAG schedule, 2005 ETMS data, TAFs, and airport capacity improvement projects outlined in the CIP. They fed this information into the Future Demand Generator (FDG) to build future schedules. Two future traffic levels were generated: a 50 percent increase and 100 percent increase in traffic levels to show trends in the output. The FDG used a Fratar algorithm that populated flight schedules based on TAF projections for 300 commercial airports and 400 general aviation airports in the NAS. The most desirable block times were populated first, without exceeding hourly capacities for the arrival acceptance rates. The traffic schedule that the team created for the fast-time simulation contained aircraft scheduled for a 24-hour day. This captured the peaks and valleys of a schedule of the current operating environment. The schedule had aircraft feeding into and out of the specified airspace for the five airports described in Section 5.3.2 as well as any aircraft that penetrated either ZJX or ZMA. The number of aircraft translated to about 8,000 operations in 2012, 12,000 operations with the 50 percent increase, and 16,000 operations with the 100 percent increase. Table 5-2 shows the aircraft class breakdown per scenario for the three traffic levels (2012, 50 percent increase, 100 percent increase), while Table 5-3 illustrates aircraft totals by airport.
Table 5-2. Number of Aircraft per Scenario by Aircraft Type
2012
50 percent increase
100 percent increase
Heavy 722 1121 1338 B757 995 1415 1817 Large - Jet 6060 9379 11,521 Large Turbo 183 243 315 Small - Jet 115 160 181 Small - Turbo 280 409 478 Small - Prop 13 17 19 TOTAL 8368 12744 15669
5-5

Table 5-3. Number of Aircraft per Scenario by Airport
2012
50 percent increase
100 percent increase
dep 672 1084 1353 MCO arr 651 1054 1326 dep 434 698 883 TPA arr 439 713 902 dep 31 31 31 SFB arr 30 30 30 dep 81 109 126 ORL arr 68 98 118 dep 38 63 75 MLB arr 42 70 87
5.3.3.2 Fleet Mix The FT Team based the fleet mix for the 2012 schedule on a distribution of aircraft types originating from or destined for the nine metropolitan areas in the NAS. They based the aircraft types on future flights from a Boeing forecast and previous work generated from the Domestic Reduced Vertical Separation Minimum benefits program. From this distribution of aircraft types, the team assigned the aircraft fleet mixes to flights traversing central Florida for the 2012 BL, with the same proportion recorded from the metropolitan areas. The traffic fleet mix reflected actual aircraft types for 2012 to the extent possible.
5.3.4 Routes and Procedures The team assumed the use of RNAV routes within and around the generic airspace to expedite the flow of ARR/DEP aircraft to and from the simulated airports. They assigned traffic within the generic airspace to the RNAV routes based on origin and destination airports. In the en route environment outside of the generic airspace, the aircraft followed great circle routes to and from the origin and destination airports. Figures 5-3 and 5-4 depict the RNAV routes for the BL and BA condition, respectively. As mentioned, the BA concept allowed for the use of 3 nm separation standards and procedures within the newly defined transition airspace. This allowed for more RNAV routes, as shown in Figure 5-4, as well as bi-directional flows.
5-6

Figure 5-3. BL RNAV routes. Note. Arrivals = Blue, Departures = Red
5-7

Figure 5-4. BA RNAV routes. Note. Arrivals = Blue, Departures = Red For 2012, the FT Team assumed that 100 percent of all aircraft flying to major metropolitan airports would be equipped for RNP. For aircraft flying into satellite airports, due to existence of older aircraft and general aviation aircraft, the team assumed that 90 percent of aircraft would be equipped for RNP. The remaining 10 percent would fly via vectors. The BA condition also allowed for bi-directional flows on certain routes. These routes were associated with the dynamic airspace sectors described in Section 5.3.1. As the sector boundaries changed, the routes in that section of dynamic airspace changed to match the flow of the new sector, either arrival or departure traffic.
5.3.5 Weather Weather is the largest contributor to delay in the NAS. In assessing four ARTCCs and six TRACONs (see Table 5-4), the FT Team found that convective weather was the predominant weather condition that impacted operations. The inability to predict weather accurately and the lack of flexible routing contribute to much of the delay.
5-8
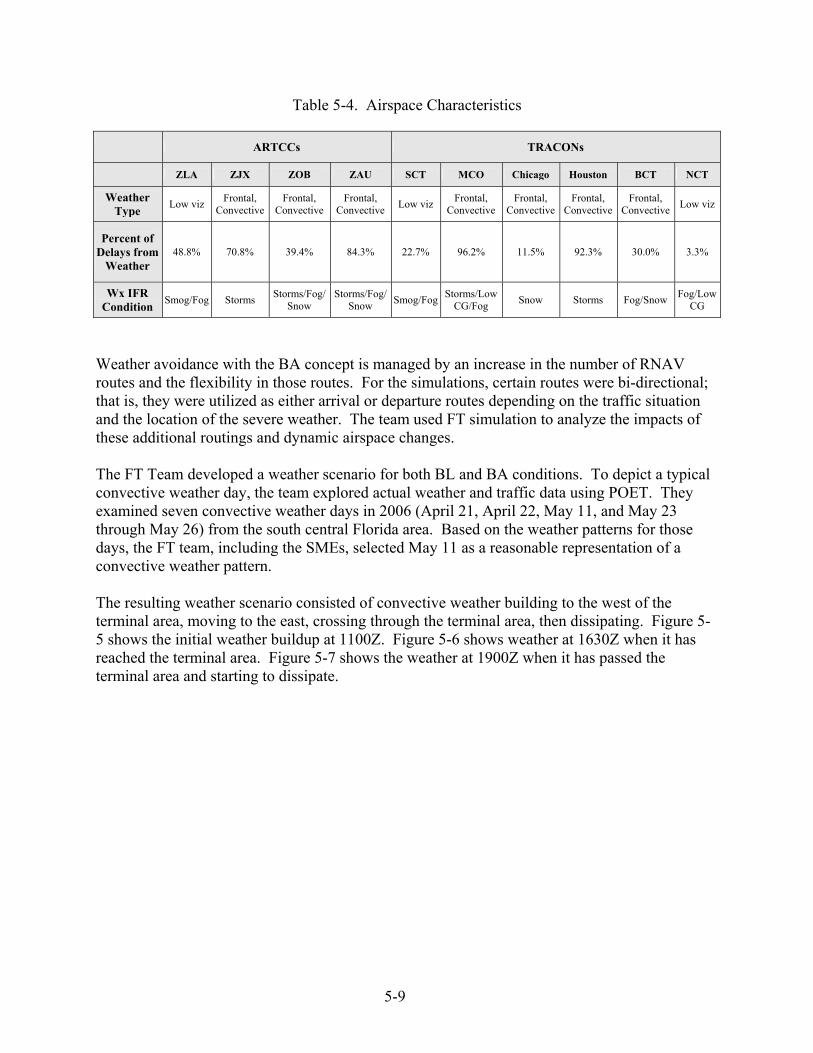
Table 5-4. Airspace Characteristics
ARTCCs TRACONs
ZLA ZJX ZOB ZAU SCT MCO Chicago Houston BCT NCT
Weather Type Low viz Frontal,
Convective Frontal,
Convective Frontal,
Convective Low viz Frontal, Convective
Frontal, Convective
Frontal, Convective
Frontal, Convective Low viz
Percent of Delays from
Weather 48.8% 70.8% 39.4% 84.3% 22.7% 96.2% 11.5% 92.3% 30.0% 3.3%
Wx IFR Condition Smog/Fog Storms Storms/Fog/
Snow Storms/Fog/
Snow Smog/Fog Storms/Low CG/Fog Snow Storms Fog/Snow Fog/Low
CG
Weather avoidance with the BA concept is managed by an increase in the number of RNAV routes and the flexibility in those routes. For the simulations, certain routes were bi-directional; that is, they were utilized as either arrival or departure routes depending on the traffic situation and the location of the severe weather. The team used FT simulation to analyze the impacts of these additional routings and dynamic airspace changes. The FT Team developed a weather scenario for both BL and BA conditions. To depict a typical convective weather day, the team explored actual weather and traffic data using POET. They examined seven convective weather days in 2006 (April 21, April 22, May 11, and May 23 through May 26) from the south central Florida area. Based on the weather patterns for those days, the FT team, including the SMEs, selected May 11 as a reasonable representation of a convective weather pattern. The resulting weather scenario consisted of convective weather building to the west of the terminal area, moving to the east, crossing through the terminal area, then dissipating. Figure 5-5 shows the initial weather buildup at 1100Z. Figure 5-6 shows weather at 1630Z when it has reached the terminal area. Figure 5-7 shows the weather at 1900Z when it has passed the terminal area and starting to dissipate.
5-9

Figure 5-5. Weather depiction at 1100Z.
Figure 5-6. Weather depiction at 1630Z.
5-10

Figure 5-7. Weather depiction at 1900Z. The FT Team used the AWSIM simulation model to analyze the effects of weather during the BL and BA conditions. The team simulated convective weather cells as a group of moving and changing circles that the aircraft had to maneuver around. The model rerouted aircraft around the circles (convective weather) and then reestablished them on their initial routes. The BL condition consisted of multiple RNAV routes within the generic airspace. These routes were separated 5 miles apart in the terminal sectors, based on the current RNP procedural limit of 3 nm and a 1nm buffer on either side. The RNAV routes in the en route sectors were separated 7 miles apart, which was based on the procedural limit of 5 nm and a 1nm buffer on either side. The procedural differences between the terminal and en route airspace, plus the size of the terminal area, limited the number of RNAV routes.
5.4 Assumptions and Limitations Fast-time simulation is a valuable tool for making comparisons between conditions. However, fast-time simulation has limitations and may not cover all aspects of a certain concept. Following is a list of fast-time simulation assumptions and limitations regarding items identified in the BA concept of operations.
• TMA was used to meter the flow of traffic to the airports contained within the expanded terminal area. Currently, TMA has not been tested to the level in which the concept describes its usage. In addition, the fast-time simulation tools do not currently have a TMA component. Integration of TMA into these tools would be time consuming. To
5-11

simulate use of TMA as it would operate in the future, the FT Team wrote additional code as a module to AWSIM that metered aircraft to the runway. Unlike TMA—which has a limited range and relies on a controller to vector or slow down the aircraft to meet the imposed meter time—the module relied only on slowing the aircraft down and delaying on the ground. This was a minor limitation, since delays outside the specified airspace did not need to be specific (i.e., vectoring versus speed control).
• The fast-time simulations were developed in a generic environment that captured the aspects of the major metropolitan areas. They assumed that all environmental and noise objectives were met.
• Although URET is a valuable controller tool, the fast-time simulation models do not account for controller tools; therefore, URET was not a part of the fast-time simulations.
• It is expected that ERAM will be implemented by 2012. ERAM enables increased surveillance performance, which in turn provides an increase in radar update rates. These increased radar update rates enable 3 nm separation in a larger area. The fast-time simulations assumed ERAM was implemented.
• The fast-time simulations typically do not consider communications (e.g., Controller-Pilot Data Link Communications); therefore, the FT Team did not examine communications in the fast-time simulations.
• The use of surveillance equipment (e.g., radars, Global Positioning System) is typically not considered in fast-time simulation. The concept calls for a faster update rate to allow for the 3 nm separation; therefore, the team assumed that the proper surveillance was in place to maintain the 3 nm separations, but it was not a specific component of the fast-time tools.
5.5 Procedure
The FT Team used the AWSIM model to analyze the BA concept. The model uses aircraft trajectories to simulate movement of traffic through the airspace. The team developed a trajectory for each individual aircraft. These trajectories were assigned to each aircraft based on condition (BL/BA), origin and destination airport, and RNAV route/procedure. The team provided other inputs such as airport capacity, airspace configuration, weather, separation values, and procedures for each scenario.
The team developed 12 scenarios to simulate the two conditions and three traffic levels. Table 5-5 identifies each scenario.
5-12

Table 5-5. Scenarios
Condition Weather/No Weather Traffic Level BL No Weather 2012 BL Weather 2012 BA No Weather 2012 BA Weather 2012 BL No Weather + 50% BL Weather + 50% BA No Weather + 50% BA Weather + 50% BL No Weather + 100% BL Weather + 100% BA No Weather + 100% BA Weather + 100%
The team simulated each scenario twice. The first run did not include conflict detection and resolution. This provided the nominal travel times and distance flown for each condition and served as a means to compute delay metrics. The second run included conflict detection and resolution. As stated earlier, the AWSIM model simulates each individual aircraft trajectory and calculates its current and future position. If an aircraft comes into conflict (separation violation) with another aircraft or a severe weather cell, the model will resolve the conflict and reroute or slow down the aircraft. This provides an estimate of additional travel time and distance flown to keep the aircraft separated and conflict free. The results presented in the next section include conflict detection and resolution.
5.6 Results 5.6.1 Flight Time
Table 5-6 shows the total number of minutes flown from origin to destination for each aircraft in the simulation. Flight time for each scenario included travel time and air delay (see Section 5.6.2). Flight time savings included any changes in travel time due to airspace/route structure and/or procedures (e.g., more RNAV routes in BA condition).
5-13

Table 5-6. Flight Time Savings
No Weather Traffic Level
Condition 2012 +50% +100% Baseline 649,932 1,044,435 1,315,468 Big Airspace 647,105 1,035,556 1,294,004 Flight Time Savings 2827 9879 21,464 Percent 0.43 0.95 1.63 Flight Time Savings per aircraft (in minutes) .34 .78 1.37
Weather Traffic Level
Condition 2012 +50% +100% Baseline 656,251 1,061,376 1,338,258 Big Airspace 648,233 1,046,326 1,313,603 Flight Time Savings 8018 15,050 24,655 Percent 1.22 1.42 1.84 Flight Time Savings per aircraft (in minutes) .96 1.18 1.57
Table 5-7 shows the maximum hourly time savings per flight in minutes for the no weather and weather scenarios. The team obtained these by computing the time saved per flight for each simulated hour and selecting the maximum value.
Table 5-7. Maximum Hourly Time Savings
Traffic Level 2012 +50% +100%
Time Saved Per Flight no weather .8 min 2.3 min 4.8 min Time Saved Per Flight weather 2.5 min 4.1 min 6.6 min
5.6.2 Air Delay The FT Team calculated air delay by taking the difference of travel time with conflict resolution versus without conflict resolution (nominal travel time). Air delay did not take into account the differences in flight time due to airspace/route structure and/or procedures. The values in Table 5-8 are in minutes.
5-14

Table 5-8. Air Delay Savings
No Weather Traffic Level
Condition 2012 +50% +100% Baseline 2,668 11,121 22,126 Big Airspace 556 3,079 3,744 Delay Savings 2,112 8,042 18,382 Percent 79.16 72.31 83.08 Delay Savings per aircraft (in minutes) .25 .63 1.17
Weather Traffic Level
Condition 2012 +50% +100% Baseline 2,762 8,694 19,810 Big Airspace 860 4974 13,286 Delay Savings 1,902 3,720 6,524 Percent 68.86 42.79 32.93 Delay Savings per aircraft (in minutes) .23 .29 .42
5.6.3 Ground Delay The team calculated ground delay as the total number of minutes aircraft were held at origin airports due to lack of capacity at the destination airports or high traffic levels in en route airspace. The values in Table 5-9 are reported in minutes.
5-15

Table 5-9. Ground Delay Savings
No Weather Traffic Level
Condition 2012 +50% +100% Baseline 2,312 5,433 6,548 Big Airspace 2,304 5,166 6,157 Delay Savings 8 267 391 Percent .35 4.91 5.97 Delay Savings per aircraft (in minutes) .00 .02 .02
Weather Traffic Level
Condition 2012 +50% +100% Baseline 2,760 6,176 7,456 Big Airspace 2,750 5,897 7,103 Delay Savings 10 279 353 Percent .36 4.52 4.73 Delay Savings per aircraft (in minutes) .00 .02 .02
5.6.4 Distance Flown Table 5-10 shows the number of nautical miles flown from origin to destination for each aircraft in the simulation. These values included any additional distance due to reroutes.
Table 5-10. Distance Flown Savings
No Weather Traffic Level
Condition 2012 +50% +100% Baseline 3,929,921 6,355,623 8,006,872 Big Airspace 3,923,636 6,344,227 7,990,065 Difference 6,285 11,396 16,807 Percent 0.16 0.18 0.21 Difference per aircraft (in nm) .75 .89 1.07
Weather Traffic Level
Condition 2012 +50% +100% Baseline 4,027,343 6,439,380 8,133,429 Big Airspace 3,985,627 6,356,457 8,004,837 Difference 41,716 82,923 128,592 Percent 1.04 1.29 1.58 Difference per aircraft (in nm) 4.99 6.51 8.21
5-16
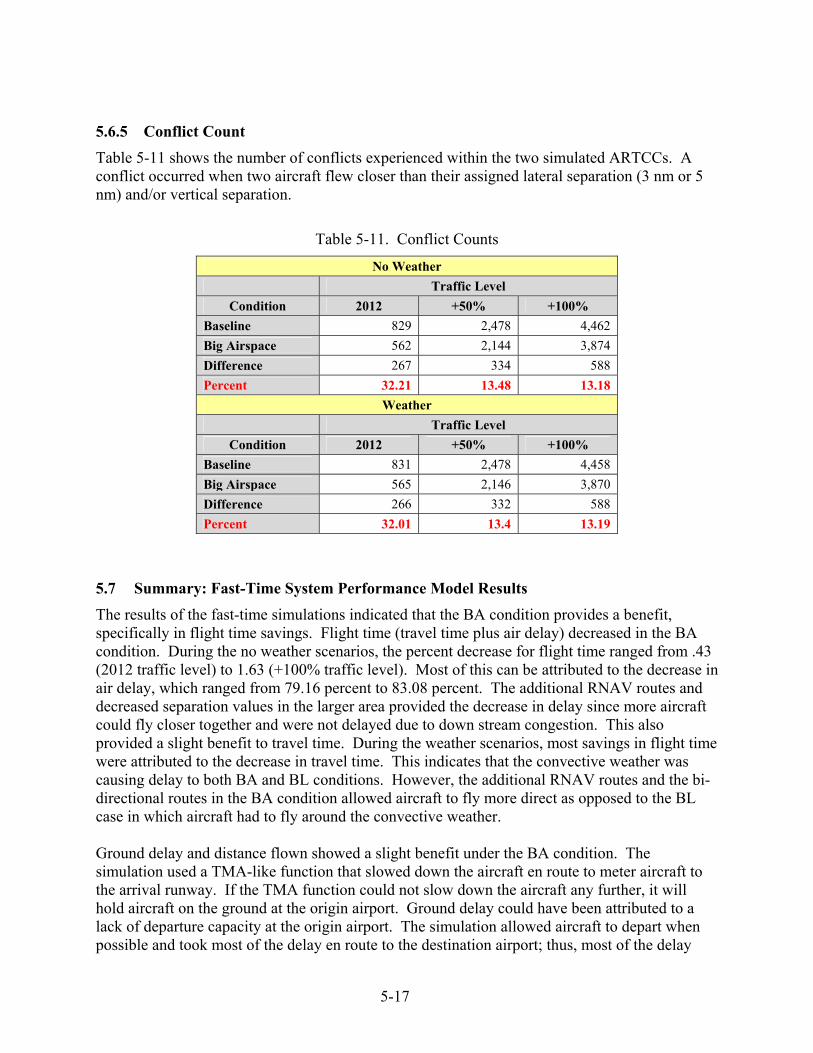
5.6.5 Conflict Count Table 5-11 shows the number of conflicts experienced within the two simulated ARTCCs. A conflict occurred when two aircraft flew closer than their assigned lateral separation (3 nm or 5 nm) and/or vertical separation.
Table 5-11. Conflict Counts
No Weather Traffic Level
Condition 2012 +50% +100% Baseline 829 2,478 4,462 Big Airspace 562 2,144 3,874 Difference 267 334 588 Percent 32.21 13.48 13.18
Weather Traffic Level
Condition 2012 +50% +100% Baseline 831 2,478 4,458 Big Airspace 565 2,146 3,870 Difference 266 332 588 Percent 32.01 13.4 13.19
5.7 Summary: Fast-Time System Performance Model Results
The results of the fast-time simulations indicated that the BA condition provides a benefit, specifically in flight time savings. Flight time (travel time plus air delay) decreased in the BA condition. During the no weather scenarios, the percent decrease for flight time ranged from .43 (2012 traffic level) to 1.63 (+100% traffic level). Most of this can be attributed to the decrease in air delay, which ranged from 79.16 percent to 83.08 percent. The additional RNAV routes and decreased separation values in the larger area provided the decrease in delay since more aircraft could fly closer together and were not delayed due to down stream congestion. This also provided a slight benefit to travel time. During the weather scenarios, most savings in flight time were attributed to the decrease in travel time. This indicates that the convective weather was causing delay to both BA and BL conditions. However, the additional RNAV routes and the bi-directional routes in the BA condition allowed aircraft to fly more direct as opposed to the BL case in which aircraft had to fly around the convective weather. Ground delay and distance flown showed a slight benefit under the BA condition. The simulation used a TMA-like function that slowed down the aircraft en route to meter aircraft to the arrival runway. If the TMA function could not slow down the aircraft any further, it will hold aircraft on the ground at the origin airport. Ground delay could have been attributed to a lack of departure capacity at the origin airport. The simulation allowed aircraft to depart when possible and took most of the delay en route to the destination airport; thus, most of the delay
5-17

savings was in the air. Because the model slowed the aircraft down as opposed to path stretching, distance flown only changed in the generic airspace where the trajectories were modified to avoid conflicts. Conflict count under the BA concept decreased due to the additional RNAV routes. With less aircraft on the same route, this is to be expected. However, at the 50 percent and 100 percent traffic levels, the percent savings went down slightly due to the increase in traffic.
5-18

6 FAST-TIME HUMAN PERFORMANCE MODELING 6.1 Introduction 6.1.1 Background The fast-time human performance model (HPM), known as the Air Man-Machine Integrated Design and Analysis System (Air MIDAS), filled a gap in the standard methodologies of both the fast-time system performance studies and the human-in-the-loop studies. The model evaluated the feasibility and effectiveness of the BA concept on human operators, who are responsible for executing and managing airspace operations.
6.1.2 Research Team The San Jose State University Industrial and Systems Engineering Department’s Human Automation Integration Lab performed the human performance modeling of the BA concept. The individuals involved represented a subteam within the BA Team and hereafter are referred to as the “HPM Team.”
6.1.3 Purpose The HPM Team used the fast-time human performance model to explore performance in the BA operational concept. The paradigm of computational human modeling is an additional tool in the analyses suite of methods that the team used in this study. Standard approaches use an incremental increase in testing complexity, fidelity, and cost—from empirical results to prototype to full mission simulation, and then field testing. Such a process is, of course, a valid paradigm. However, the rate of development of ATM systems, the tremendous economic pressure to implement and reap immediate benefits from technologies, and the significant complexity and cost of large-scale distributed air-ground tests suggest development of other, more cost-effective methods of human factors research. Prominent among these is computational human performance modeling (Laughery, Archer and Corker, 2001). This paradigm represents the human and the system elements of interest as computational entities (or agents). These agents interact as the system elements would in actual field operations, and behaviors can be observed. The benefit (assuming well-developed and validated models) is that system and human characteristics can be quickly varied (e.g., based on an assumed technology change or procedural changes), and the impact of those changes can be identified in the full-system context. Such models help focus the expensive and complex simulation and field tests. In addition, performance at the edge of system safety can be explored in the computational human performance modeling paradigm. The human performance modeling objectives were to:
• Characterize the human operators effecting the BL and BA operations;
• Identify the information requirements for their performance in the operational concepts;
• Identify and articulate the rules and procedures for human performance in the BA concept; and
6-1

• Implement human performance capabilities and constraints to model and predict the likely human performance in response to airspace operations, dynamic sector operations, and communication modes (data link versus voice) across the operational scenarios in traffic load, and weather operations.
6.2 Method The HPM Team linked the fast-time Air MIDAS to a fast-time airspace simulation to represent the airspace, air traffic, and human controller performance in BA operations. This simulation replicated, in part, the scenarios undertaken in fast-time simulation and in the human-in-the-loop simulations herein. Figure 6-1 illustrates the Air MIDAS model’s organization and the flow of information among the model’s components and its linkage to the Reconfigurable Flight Simulator for airspace representation (Shah et al., 2005). The model is based on an agent architecture that is illustrated in the figure, with the boundary of each of the hierarchically structured agents represented by a boxed enclosure. Data are transformed in each agent and passed to other agents in a cyclic process. The “cost” of the transformation regarding operator resources and time are calculated and archived for “workload” analysis.
D
AE
MO
NS
EQUI
PM
ENT
UWR
DECIDE-BY-
RULE
DOMAINKNOWLEDGE
MOTOR
ANTHRO
PERCEPTION
ATTENTION
AUDITIONVISION
PhonologicalLoop
Visio-Spat ialSketchpad
WORKING
MEMORY
SYMBOLIC OPERATOR MODEL
MIDAS Mission Simulat ion
PENDING
CURRENT
SOM QUEUES
WORKINGGOALS
POSTPONED
SUSPENDED
A
C
T
I
V
I
T
I
E
S
SCHEDULEScheduler
Sim Scenario
Specifications
Fast_Time Sim
(RFS)
Figure 6-1. Air MIDAS component organization and information flow.
The HPM operates in an integrated mode, with the fast-time simulation system representing the external world in which the operator models must interact and the Air MIDAS system representing the human operators in that world. Communication among the modules coordinates their performance. The models (airspace and human) synchronize their operations through their respective internal clocks.
6-2

6.2.1 Functions Represented in the Model Following are the specific elements of the model:
• Perceptual process models are provided for visual and audition actions of the air navigation service providers.
• An Updateable World Representation (UWR) represents the operator’s understanding of the world (i.e., information about environment, equipment, physical constraints, and procedures). The declarative information about the world is represented in a semantic net. The procedural information is held as decomposition, interruption, and completion procedures for goals, subgoals, and activities. Specific values in the world information serve to trigger activities in the simulated operator. Note that the model does not embody any representation of learning. The operator is assumed to be at some level of training regarding the mission at hand. The level of training does not change across the simulation. The simulated operator’s behavior does change in response to time-stress and competency (as will be described).
• Active decision-making processes are represented as rules in propositional structure—as heuristics, or as software triggers, daemons—which serve to trigger action in response to specific values in the environment.
• A scheduling mechanism imposes order on activities to be performed depending on their priority and the available resources to perform those activities. The scheduling mechanism also incorporates a switching mechanism that selects among control “modes” in which an operator can perform. These modes are a computational implementation of the COCOM [Contextual Control Model] (Hollnagel, 1993; Verma & Corker, 2001) in which the model uses qualitatively different action sequences to perform a required activity depending on the resource availability, time, and competence level of the operator.
• A set of queues manages current activities, which are interrupted or waiting to be rescheduled.
• A representation of motor activity represents the process of performance of the selected action in the simulation.
Each of these functions is represented in independent agents that communicate with each other in a message-passing protocol and that keep track of those interactions as a source of data about the functions of the model.
6.2.2 How the Simulation Proceeds The model is a discrete-event simulation in which events are defined as temporal increments (called “ticks”) of a clock that sends a message to all agents to proceed with their functions at each event. The events/time base is a variable that can be set by the analyst using the model. The HPM Team varied the resolution of this event-base in the BA simulation so that the model could concentrate its data collection in epochs of high intensity operations and reduce its collection in times of reduced activity. Its lower bound is a 100 millisecond (msec) step-size.
6-3

An activity is triggered in the model in two ways, either by decomposition of goals to be performed, or by occurrence of a specific value in the environment for which there is a daemon to respond and identify that value as significant and requiring action. When an activity is triggered in service of the mission goal or in response to environmental stimuli, the scheduling mechanism determines when the activity can be performed based on human operator constraints in visual, auditory, cognitive, and motor capacity. When there are enough resources available according to estimates of capacity, the activity is scheduled to be performed. If there are not enough resources available, the activity either interrupts ongoing action (if it is of high priority), or is deferred until there are resources available. Activities are characterized by several defining parameters that include the conditions under which the activity can be performed, its relative priority regarding other activities, an estimate of its duration for scheduling, its interruption specifications, and the resource to perform that activity. The scheduler is a blackboard process that evaluates these parameters and develops a time for the activities’ performance in the ongoing simulation. Following a multiple-resource assumption, activity load is defined for Visual, Auditory, Cognitive, and Psychomotor dimensions (McCracken & Aldrich, 1984). Activities also require information for their performance. The information requirement is identified as knowledge either in the operator’s memory or available from the environment. If the information necessary for activity performance is available, and its priority is sufficient to warrant performance, then the scheduler operates according to heuristics that the analyst can select. In most cases, the heuristic is to perform activities concurrently when possible, based on knowledge and resource constraints. For example, visual information, such as display information from a DSR radar display is perceived and attended to by the Air MIDAS simulated operator. The perceptual process follows a simulated scan pattern in which specific elements of the DSR display suite or the external equipment (URET, TMA, or other) are queried for their state. The processes for perception and attention require both time and dedicated perceptual resources. The amount of information “perceived” and its accuracy are calculated as a function of the amount of time provided for its perception and the characteristics of the source of the information (either environmental or instrument). This external information is then passed to the UWR. What the operator knows about the world and his/her knowledge of required procedure makes up their “situation awareness.” This information is held in a buffer in the UWR that represents working memory. This memory is structured using the architecture suggested by Baddeley and Hitch (1974) with a phonological loop, a visuo-spatial scratchpad, and an executive function with rules for invoking and retaining memory information. Behavior in the Air MIDAS model is generated by the simulated operator’s knowledge of his/her primary goals (e.g., traffic flow control) and by values of attributes in the updatable world representation. These goals are used to select action to be performed from a library of available actions. Action is performed either through a decomposition of the mission goals to tasks (the planned mode of action), or action is initiated by rules that match the incoming perceptual information to required action when some parameter values in the world are in that state. The action required is then “scheduled” to represent both human strategic behavior management and
6-4
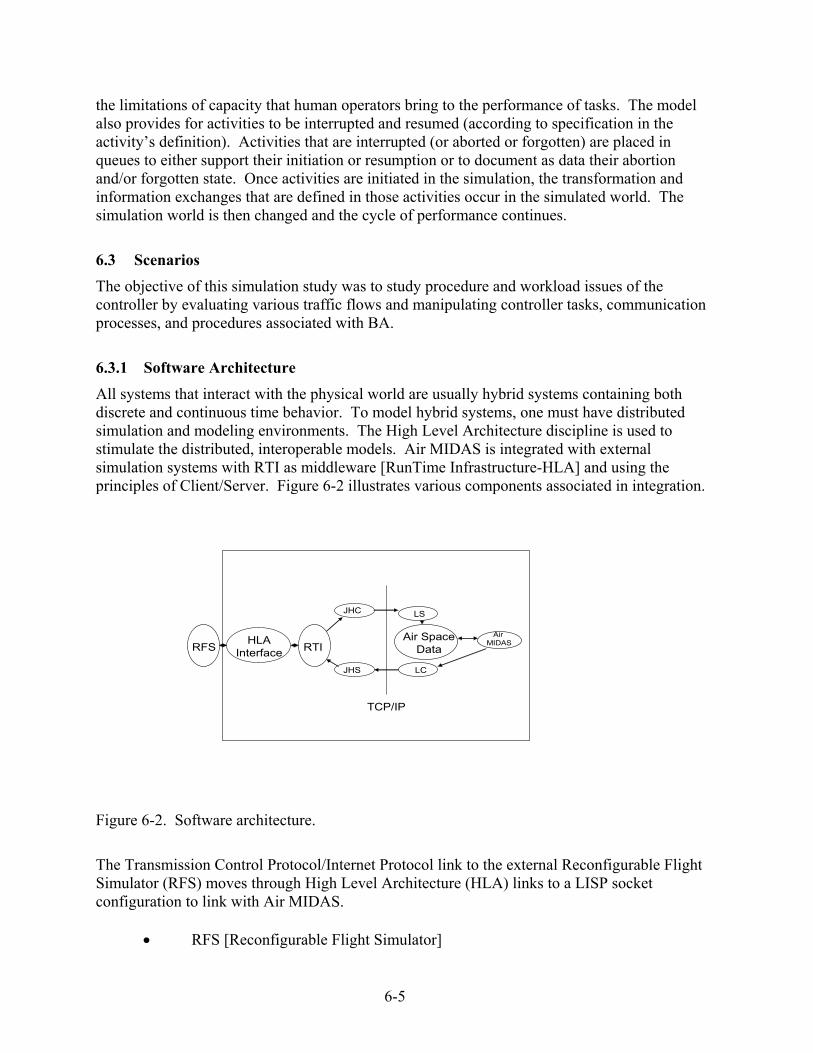
the limitations of capacity that human operators bring to the performance of tasks. The model also provides for activities to be interrupted and resumed (according to specification in the activity’s definition). Activities that are interrupted (or aborted or forgotten) are placed in queues to either support their initiation or resumption or to document as data their abortion and/or forgotten state. Once activities are initiated in the simulation, the transformation and information exchanges that are defined in those activities occur in the simulated world. The simulation world is then changed and the cycle of performance continues.
6.3 Scenarios The objective of this simulation study was to study procedure and workload issues of the controller by evaluating various traffic flows and manipulating controller tasks, communication processes, and procedures associated with BA.
6.3.1 Software Architecture All systems that interact with the physical world are usually hybrid systems containing both discrete and continuous time behavior. To model hybrid systems, one must have distributed simulation and modeling environments. The High Level Architecture discipline is used to stimulate the distributed, interoperable models. Air MIDAS is integrated with external simulation systems with RTI as middleware [RunTime Infrastructure-HLA] and using the principles of Client/Server. Figure 6-2 illustrates various components associated in integration.
RFSHLA
Interface RTI
JHC
JHS
TCP/IP
Air SpaceData
LS
LC
Air MIDAS
Figure 6-2. Software architecture.
The Transmission Control Protocol/Internet Protocol link to the external Reconfigurable Flight Simulator (RFS) moves through High Level Architecture (HLA) links to a LISP socket configuration to link with Air MIDAS.
• RFS [Reconfigurable Flight Simulator]
6-5

RFS is a reconfigurable flight software simulation system. It is used to configure airspace and traffic flows in the integrated simulation framework.
• RTI [RunTime Infrastructure]
This is a middleware provided by Defense Modeling and Simulation Office and is used to exchange data across different simulation systems over a Local Area Network/Wide Area Network.
• JHC [Java Client-HLA Compliant]
Java Client subscribes to simulation models over RTI and gathers data as required by the Human Performance Simulation System.
• JHS [Java Server –HLA Compliant]
Java Server subscribes to simulation models over RTI and gathers data as required by the Reconfigurable Flight Simulator.
• LS [Lisp Server]
Lisp Server subscribes to Java Client over network and gathers data as required by the human performance simulation system.
• LC [Lisp Client]
LISP client subscribes to Java Server over network and gathers data as required by the Reconfigurable Flight Simulator.
• Airspace Data [Airspace Data Storage Buffer]
This buffer stores airspace-related data that controllers use.
• MIDAS [Human Performance Simulation System]
MIDAS is a computational model of human performance importance.
These integration efforts are tailored to integrate the human operator model [Air-MIDAS] into other simulation models of national airspace to analyze human factors issues, safety analysis and risk analysis in the national airspace. The RFS represents the operational airspace and was developed at Georgia Tech University (Shah, A.R. Pritchett, K.M. Feigh, S.A. Kalaver, A. Jadhav, K.M. Corker, D.M. Holl, & R.C. Bea, 2005). The user enters the system through the Graphical User Interface that provides the main interaction between the designer and the MIDAS system. Generally, the sequence would require the user to establish (create and/or edit) a domain model (which includes establishment and selection of the parameters of performance for the human operator model(s) in the simulation). The user can then select the graphical animation or view to support that simulation or a set of simulations. The user can specify in the simulation module the parameters of execution and display for a given simulation set and specify in the results analysis system the data to be collected and analyzed as a result of running the simulation. The results analysis system also provides for archival processes for various simulation sessions.
6-6

The user would typically use all of the top-level features to support a new simulation. If a user were exploring, for instance, assignment of function between a human operator and an automated assistant, the user could maintain the majority of the extant domain and graphical and analytic models and make modifications through the domain model to the human operator model, to the equipment model, and to the simulation scenario. Figures 6-3 and 6-4 depict the airspace used in this simulation.
BASELINE AIRSPACE
GRUPR Departure Airspace – Red BAASS Arrival Airspace - Green
BASELINE GENERA CENTER (ZGN) AIRSPACE OVERVIEW
BAASS Arrival 120.01
GRUPR Departure 120.02 Genera Arrival 120.03
Genera Departure 120.04 Westside Approach 120.07
Ghost Sectors 120.99
Local Airports Genera KGEN Uptown KUPT Northeast KNTH Crosstown KCSS Westside KWSS Southern KSRN Wayout KWYO
NAVAIDS Uptown VORTAC UPT Southern VORTAC SRN Westside VOR/DME WSS
30-140
KCSS
KUPTUPT
KNTH
KGEN
WSS KWSS KSRN
SRN KWYO
NOJUK
Figure 6-3. Simulation airspace: Baseline airspace.
6-7

BIG AIRSPACE
GRUPR Departure Airspace – Green BAASS Arrival Airspace - Red
30-140
BIG AIRSPACE GENERA CENTER (ZGN) AIRSPACE OVERVIEW
BAASS Arrival 120.01
GRUPR Departure 120.02 Genera Arrival 120.03
Genera Departure 120.04 Westside Approach 120.07
Ghost Sectors 120.99
Local Airports Genera KGEN Uptown KUPT Northeast KNTH Crosstown KCSS Westside KWSS Southern KSRN
Wayout KWYO
NAVAIDS Uptown VORTAC UPT Southern VORTAC SRN Westside VOR/DME WSS
KCSS
KUPT UPT
KNTH
KGEN
WSS KWSS
SRN KSRN KWY
O
TERRA
TODES
RTLER
SNAIK
MNGOS
LYZRD
SATAR 10 DME
Figure 6-4. Simulation airspace: Big airspace.
6.3.2 Traffic Flows
6.3.2.1 Baseline The HPM Team categorized the baseline traffic flow into three traffic levels: BL, BL+50 percent, and BL+100 percent traffic. They created configurations to run this traffic in RFS. Some of the inputs required to create the traffic flow were aircraft call sign, route, initial latitude, and longitude and altitude, as well as start times of the aircraft.
6.3.2.2 Big Airspace The team categorized BA traffic flow into the same three traffic levels as BL. The team created configurations to run this traffic in RFS. Some of the inputs that were required to create the traffic flow were aircraft call sign, route, initial latitude, and longitude and altitude, along with start times of the aircraft.
6-8

6.4 Assumptions and Limitations One difficulty in integrating HPMs to represent a large-scale distributed model of ARTCC operations is that human performance has been studied and is most often represented as time based on continuous performance. Large-scale airspace representations, on the other hand, are most often discrete event simulations. Matching the timing of simulation operations is particularly problematic regarding the impact of task requirement on limited human resources (i.e., workload). Temporal constraint expressed as a simple ratio of time required over time available is a common way of considering human workload. The HPM Team dealt with this issue by allowing the models to run at varied time-step increments—small fine-grained time steps to review specific issues (i.e., handoffs, conflict detection and resolution, dynamic airspace reconfigurations). A larger time step is in the ATC models for use with less human-effort intense operations (i.e., monitoring traffic conformance). A second difficulty in representing human performance in large-scale models is that human performance needs to be simulated at the individual or small-team performance level because the decision-aiding techniques and workload impact are felt at this level. Typically for individuals, this would mean a resolution between 100 to 500 msec. In reviewing ARTCC operations across a period of time—one day, for example—there is a significant mismatch between resolving the human performance data and the performance data collected into large-scale simulation. The team resolved this issue by concentrating the human performance models across a critical time span (45 minutes to 1 hour of operation) and by referring to critical operational space of interest in human performance analysis.
6.5 Experimental Design The team configured the HPM with controller roles and responsibilities for a central Florida ARTCC and TRACON set of sectors. Each sector had two controller representations, one for the R-Side and the other for the D-Side. The controllers had automation tools, URET, and TMA, as well as data link, in one set of conditions.
6.5.1 Procedure
In applying the Air MIDAS model, the HPM Team performed the following steps:
• Specified and encoded airspace to apply to the HPM. In assessing human performance, the team concentrated on the following airspace elements: the GRUPR1 SID, the BAASS1 STAR, the transition airspace sectors, and traffic associated with west-north operations.
• Filtered traffic files to find aircraft associated with the airspace and routes selected in the time period specified.
• Identified activities for each human operator to perform in the scenarios to be simulated. A definition of procedures for the airspace operations was decomposed into activities for the models. An activity is triggered in the model in two ways: either through decomposition of goals to be performed or through occurrence of a specific value in the
6-9

environment for which there was a daemon to respond to and identify that value as significant and requiring action.
• Characterized an activity using several defining parameters, including conditions under which the activity can be performed, its relative priority regarding other activities, an estimate of its duration for scheduling, its interruption specifications, and the resources required to perform that activity. Assuming multiple resources, the team defined activity load for Visual, Auditory, Cognitive, and Psychomotor dimensions (McCracken & Aldrich, 1984).
• Simulated human operators by including a radar controller and data controller in each sector. This was necessary to identify workload impact, and specifically the impact of changes in communication processes (voice and data link). The western region of the airspace was modeled with two TMU supervisors to decide and communicate weather response strategies and dynamic airspace shifts.
• Developed two airspaces for the fast-time simulations: the BL condition and BA condition.
• Included two major airports and three satellite airports in the simulation to show multiple ARR/DEP routes for the terminal area. The major airports included MCO and TPA. The satellite airports included SFB, ORL, and MLB.
6.5.2 Independent Variables: Conditions The HPM Team developed and implemented the HPM in a linked human performance and airspace performance fast-time model and tested the model under the following conditions:
• Three levels of traffic: Simulated air traffic loads at BL (2012 BL); BL plus 50 percent; and BL doubled (same parameters as fast-time system performance simulations). The model ran both BL operational procedures and BA procedures at each traffic level with and without weather. Additionally, the model ran the BL and BA operations in a voice communication and data link communication mode.
• Procedures and rules: With and without BA transition airspace in BA operations, 3-mile separation throughout the airspace, and dynamic response in sector structure as a function of weather in the airspace.
• Weather event: With and without disruptive weather events in the scenario.
• Communications media: With and without using data link communications between the controller and flight crew.
The HPM Team tested all conditions across all runs in a fully crossed design (i.e., the team ran the simulation in all conditions, and levels of those conditions crossed with all others). Table 6-1 illustrates the experimental conditions.
6-10
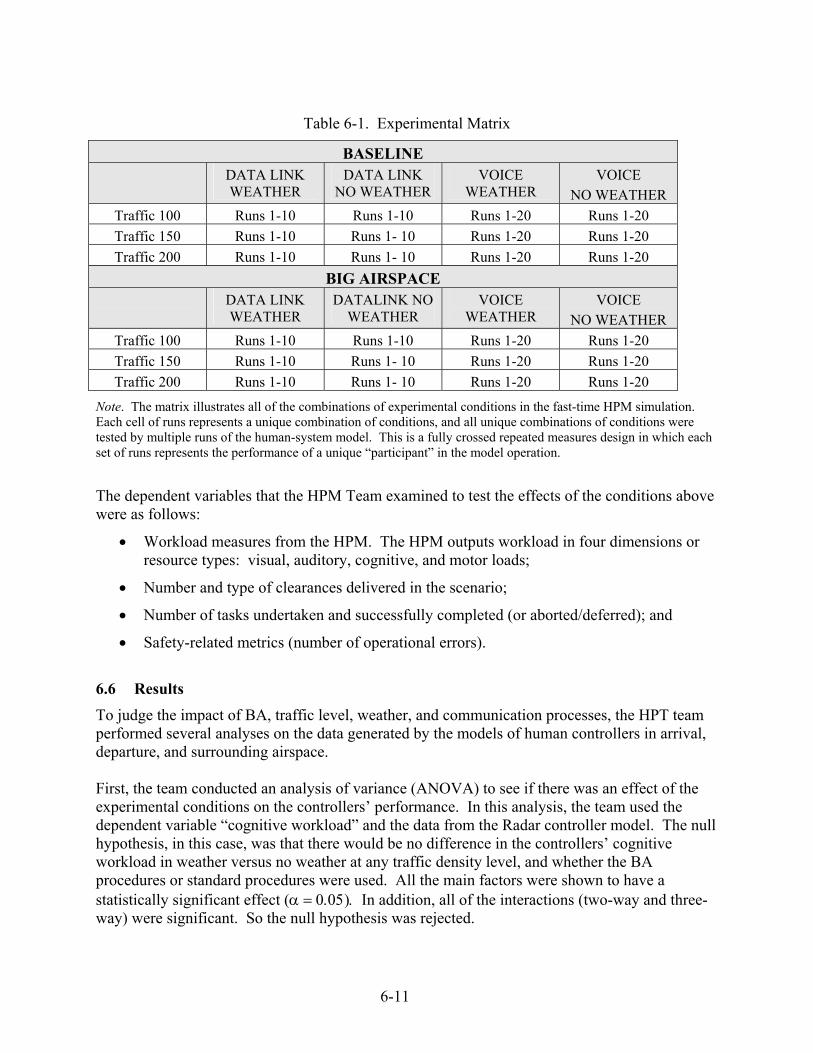
Table 6-1. Experimental Matrix
BASELINE DATA LINK
WEATHER DATA LINK
NO WEATHER VOICE
WEATHER VOICE
NO WEATHER Traffic 100 Runs 1-10 Runs 1-10 Runs 1-20 Runs 1-20 Traffic 150 Runs 1-10 Runs 1- 10 Runs 1-20 Runs 1-20 Traffic 200 Runs 1-10 Runs 1- 10 Runs 1-20 Runs 1-20
BIG AIRSPACE DATA LINK
WEATHER DATALINK NO
WEATHER VOICE
WEATHER VOICE
NO WEATHER Traffic 100 Runs 1-10 Runs 1-10 Runs 1-20 Runs 1-20 Traffic 150 Runs 1-10 Runs 1- 10 Runs 1-20 Runs 1-20 Traffic 200 Runs 1-10 Runs 1- 10 Runs 1-20 Runs 1-20
Note. The matrix illustrates all of the combinations of experimental conditions in the fast-time HPM simulation. Each cell of runs represents a unique combination of conditions, and all unique combinations of conditions were tested by multiple runs of the human-system model. This is a fully crossed repeated measures design in which each set of runs represents the performance of a unique “participant” in the model operation.
The dependent variables that the HPM Team examined to test the effects of the conditions above were as follows:
• Workload measures from the HPM. The HPM outputs workload in four dimensions or resource types: visual, auditory, cognitive, and motor loads;
• Number and type of clearances delivered in the scenario;
• Number of tasks undertaken and successfully completed (or aborted/deferred); and
• Safety-related metrics (number of operational errors).
6.6 Results To judge the impact of BA, traffic level, weather, and communication processes, the HPT team performed several analyses on the data generated by the models of human controllers in arrival, departure, and surrounding airspace. First, the team conducted an analysis of variance (ANOVA) to see if there was an effect of the experimental conditions on the controllers’ performance. In this analysis, the team used the dependent variable “cognitive workload” and the data from the Radar controller model. The null hypothesis, in this case, was that there would be no difference in the controllers’ cognitive workload in weather versus no weather at any traffic density level, and whether the BA procedures or standard procedures were used. All the main factors were shown to have a statistically significant effect (α = 0.05). In addition, all of the interactions (two-way and three-way) were significant. So the null hypothesis was rejected.
6-11

6.6.1 2x3x2 ANOVA Repeated Measures: Cognitive Workload Cognitive workload is a measure that the model generates to estimate the loading for task performance in the cognitive dimension for each activity that the model performs. As indicated above, the cognitive load for a given activity is an estimate that is based on subject matter expert opinion (McKracken & Aldrich, 1984). Table 6-2 provides the means and standard deviations of that workload for all tasks performed by the radar controller across the simulation scenarios in the arrival airspace. The arrival airspace had the highest workload for the controllers.
Table 6-2. Cognitive Workload Means and Standard Deviations for Experimental Conditions
Mean Std. Deviation N Big100Wx 2.4595 1.40439 20Big100NoWx 2.5250 1.55109 20Big150Wx 2.4430 .45966 20Big150NoWx 1.8745 .65528 20Big200Wx 3.8850 .25082 20Big200NoWx 2.1620 1.15123 20BL100Wx 1.3385 .11160 20BL100NoWx 1.3025 .22985 20BL150Wx 1.3435 .09354 20BL150NoWx 1.3120 .20086 20BL200Wx 1.4675 .16964 20BL200NoWx 1.4835 .12926 20
Note. “Big” indicates BA procedures in place; “BL” indicates baseline or standard operating procedures were in place; “Wx or No Wx” indicates the presence or absence of weather conditions; and “100, 150, and 200” indicate the traffic level relative to the 2012 standard.
The HPM Team performed an ANOVA on the conditions that the team manipulated (control mode, weather, and traffic density). For this analysis, the team did not separately analyze the condition of data link communications for transfer of communications and clearance delivery. Section 6.6.2 provides the results of this analysis. They performed an ANOVA to determine the overall effect of main variables on the performance measure of overall cognitive workload. Table 6-3 provides the “F” statistics for the cognitive workload ANOVA across all conditions and the interaction of those conditions. All main effects and interactions were significantly different than would be expected by chance at an alpha level of 0.05. This indicates that the cognitive workload was different under the varied conditions of the simulation.
6-12

Table 6-3. ANOVA: Main Effects and Interactions for Cognitive Workload
Source
Type III Sum of Squares
Degrees of
Freedom (df)
Mean Square F
Significance Level (Sig.)
Partial Eta
Squared BigAir_BL 84.052 1 84.052 128.597 .000 .871 84.052 1.000 84.052 128.597 .000 .871 84.052 1.000 84.052 .000 .871 84.052 1.000 84.052 128.597 .000 .871Level 10.684 2 5.342 .003 .262 10.684 1.503 7.110 6.753 .007 .262 10.684 1.603 6.663 6.753 .006 .262 10.684 1.000 10.684 6.753 .018 .262Weather 8.645 1 26.439 .000
128.597
6.753
8.645 .582 8.645 1.000 8.645 26.439 .000 .582 8.645 1.000 8.645 26.439 .000 .582 8.645 1.000 8.645 26.439 .000 .582BigAir_BL * Level 5.145 2 2.573 3.542 .039 .157 5.145 1.509 3.409 3.542 .054 .157 5.145 1.612 3.192 3.542 .050 .157 5.145 1.000 5.145 3.542 .075 .157BigAir_BL * Weather 7.881 1 7.881 30.143 .000 .613 7.881 1.000 7.881 30.143 .000 .613 7.881 1.000 7.881 30.143 .000 .613 7.881 1.000 7.881 30.143 .000 .613Level * Weather 7.729 2 3.864 19.462 .000 .506 7.729 1.562 4.948 19.462 .000 .506 7.729 1.677 4.609 19.462 .000 .506 7.729 1.000 7.729 19.462 .000 .506BigAir_BL * Level * Weather
8.733 2 4.367 24.023 .000 .558
8.733 1.789 4.881 24.023 .000 .558 8.733 1.963 4.449 24.023 .000 .558 8.733 1.000 8.733 24.023 .000 .558
Note. The ANOVA “F” statistic indicated significant differences among all conditions as a function of the independent variables. The conclusion is that control mode, weather, and traffic load all had an impact on the controllers’ workload across the simulation conditions. These were effective manipulations in that the model responded to the varied values of the independent variables. Figure 6-5 illustrates the cognitive workload for the radar controllers in the simulation. The figure shows the cognitive workload was higher overall (that is, across all sectors in the simulation) in the BL conditions of the experiment as compared with the BA conditions.
6-13

Workload Average
2
2.1
2.2
2.3
2.4
2.5
2.6
2.7
2.8
100Wx 100NoWx 150Wx 150NoWx 200Wx 200NoWx
Big Air
Baseline
Figure 6-5. Cognitive workload average across conditions of traffic density, weather, and standard BL verses BA operating conditions. Note. Bars represent one standard error. The conclusion is that, on average, BL operations imposed a higher cognitive load on the controller model than did BA operations, and the increased workload level was consistent across conditions (weather and traffic load). In the Big Airspace “200% traffic No Weather” case, the average workload rating actually decreased as traffic demand increased. There are two reasons why this might have occurred in the model’s prediction. First, the model operates at its demand limit, and when this occurs the model sheds tasks not directly associated with traffic separation (i.e., the highest priority tasks). Results for the interruption ratio, discussed later, provide additional support for this hypothesis. A second mechanism also works in the model, which has been termed a “context switching mechanism.” In this operation, as the model reaches a specified ratio of the number of goals to be completed compared to the resources available for their completion (e.g., the amount of time required to complete tasks), the model switches to servicing procedures that are modified to reflect a tactical shift in controller behavior. In this case, these procedures have a lower workload than do standard and less time-constrained procedures. In other words, because the model switches to a different set of procedures when workload limits are reached—the workload for these new (context switched) activities is lower than with the more complicated procedures.
6.6.2 Workload Interruption Index: Tasks Completed and Tasks Interrupted
It is important to note that the notion of workload in the HPM is to provide an estimate of the levels of stress that the modeled human operator is working under to the modeled scheduler. The model uses loads associated with activities to activate a blackboard scheduler. This scheduler looks at tasks that have yet to be performed and determines those that can be scheduled based on
6-14

the operator resource availability. These resources are determined across four channels of resource for each activity (visual, auditory, cognitive, and motor capacities). The result of this scheduling mechanism is that the model will not schedule an activity that exceeds any human’s resource. If a task demand is higher than the available resource, the model’s scheduling mechanism “interrupts” tasks that are currently ongoing, if the priority of the current task is lower than the newly arrived demand. In this way, the model maintains a priority-based interruption process for task demands. Looking at the level of interruption in a given simulation (i.e., a ratio of the tasks begun but not completed compared to tasks that were begun and successfully completed) provides another view into the level of workload the modeled operator experiences. One can infer that the more tasks interrupted, the higher the level of workload on the operator. The HPM Team performed an analysis of this interruption ratio for the simulated radar operators across the experimental conditions and compared BA procedures and BL operations. A “Chi square” test showed the levels of interruption to be significantly different between BA operations and those of BL conditions. The results X2 = 6.25 with dof = 5 showed a significant difference p<.05. Figure 6-6 provides the ratio of tasks begun versus tasks completed (the “interruption index”). These data illustrate how busy the human operator (radar controller) was in the strategic management of tasks requiring his/her attention. The higher the ratio, the more interruption occurred during task performance.
RatioTasks Begun to Tasks Completed
0
5
10
15
20
25
100Wx 100NoWx 150Wx 150NoWx 200Wx 200NoWx
BIG AIR
BASELINE
Figure 6-6. Tasks begun versus tasks completed. This analysis supports the conclusion that, on average, across conditions, the use of BA procedures enabled the controller model with the ability to strategically manage its task load. This conclusion is consistent with the hypothesis that BA procedures resulted in more resource availability, which allowed the model scheduling mechanism to manage more tasks concurrently. In the Big Airspace “200% Traffic No Weather” case, the ratio of tasks begun to tasks completed
6-15

increased over findings for other Big Airspace scenarios, and, unlike the other scenarios, was actually higher than that found in the corresponding baseline case. It is likely that this was due to tasks being started but not completed because workload increased to a point that only more high-priority tasks could be completed. The model did not yield similar results for the same traffic level “Weather” scenario. This different result may be partially explained by the fact that the task scheduler in the model has a short look-ahead function that determines whether the resources would be available to complete a task. This is described above in the context switching mechanism that is implemented in the model. In this mechanism, as the model reaches a time required to time available ration, new procedures with faster completion times and lower workload are invoked. This is intended to reflect strategic behavior management on the part of the controller. In the weather case, the scheduler look-ahead function would see that a re-route clearance might need to be issued, and therefore, may have not even scheduled the initiation of lower priority tasks.
6.6.3 Regression Analysis: Cognitive Workload The second analysis that the HPM Team performed was a regression analysis to understand the relationship of the factors that were found to influence cognitive workload in controllers under the various conditions of operation. The team used this analysis to validate the model, in that it provided an equation that accounted for the effects seen in the ANOVA (see Section 6.6.1, Table 6-3).
6.6.3.1 Methodology The simulation model, Air MIDAS, was used to investigate the impact of the presence of weather, changes in operational procedures, and traffic levels on the workload of controllers, measured by cognitive workload. The team designed 12 simulation scenarios. Each scenario was specified by three parameters: (1) whether the operational procedure was BA or BL;(2) whether the traffic level was 100 percent, or 150 percent or 200 percent of the base traffic; and (3) whether the model was run with weather conditions or without weather conditions. Each scenario was run 10 times. Therefore, there were 2*3*2=12 scenarios in the simulation experiment; and there were 12*10=120 pairs of input and output data derived from the simulation results. The HPM Team applied the linear regression model to the set of independent variables to verify that these could be modeled in a linear relationship. The independent or explanatory variables were 0-1 dummy variables used to specify the different conditions for the simulation. The team used two types of explanatory variables. The first were single variables describing the dimensions of operational procedures, traffic level, and weather conditions. For the dimension of operational procedures, the team used the single variable of “Bigair.” The value of “Bigair” was 1 if the airspace and operation procedure was the “Big Air,” and the value of “Bigair” was 0 if the airspace and the operation procedure was the BL. For the dimension of traffic level, the team used two variables: “Traffic200” and “Traffic150.” The value of “Traffic200” was 1 if the traffic was on the “200 percent” level; otherwise, “Traffic200” was 0. The value of “Traffic150” was 1 if the traffic was on the “150 percent” level; otherwise, “Traffic150” was 0. For the dimension of weather conditions, the team used one variable of “Weather.” If the weather
6-16

condition was present, the value of “Weather” was 1; if the weather condition was not present, “Weather” was 0. The second types of variables were interaction variables, which were the product of two or three of the single dummy variables above. For example, the variable of “BigairWeatherTraffic200” was the product of three single variables of “Bigair,” “Weather,” and “Traffic200.” The value of “BigairWeatherTraffic200” was 1 if the values for all three variables of “Bigair,” “Weather,” and “Traffic200” were 1’s; otherwise, it was 0. The team applied the Ordinary Least Square (OLS) method to estimate the coefficients in the model (Stone & Brooks, 1990).
6.6.3.2 Estimation Results and Implications from the Model The HPM Team first applied all the explanatory variables discussed above as independent variables in the model to find out the relationship between the dependent variable (number of clearances) and the independent variables. Then, they excluded those variables that were statistically insignificant (i.e., the hypothesis that these variables are 0 cannot be rejected at an alpha 10 percent level). Finally, the team estimated the coefficients for the refined model using the OLS method. The estimated coefficients, standard errors, and t statistics (p </= 0.05) appear in Table 6-4.
Table 6-4. Estimated Coefficients for the Regression Model
Variable Estimate Standard Error
t Statistics
Intercept 20.7 3.6 5.7 Traffic200 14.0 6.3 2.2 Bigair 26.3 6.3 4.2 BigairTraffic200 71.2 10.9 6.5 BigairTraffic150 28.9 8.9 3.2 BigairWeatherTraffic200 146.0 10.3 14.2 BigairWeatherTraffic150 -19.2 10.3 -1.9
The R2 of the model estimation was 0.91, which yielded high predictability based on the independent variables. This result supports the conclusion that a linear model accounts for the effects observed in the model’s performance. We also found that, based on this model, the forecast of the total number of clearances for each of the 12 scenarios coincided with the average of the output results of the 10 simulation runs for each corresponding scenario in the experiment. In conclusion, regarding this regression analysis, there were two forces at play in the model’s response in the Air MIDAS simulation. The first was that the sector size physically increased and the number of arrival routes increased in BA conditions. This increased the controllers’ workload in managing those arrival routes. The second factor was that the model switched its priority and procedures as workload increased (or was anticipated to increase) beyond a certain threshold level. The threshold served to reduce the peak workload the model experienced.
6-17

Compared with BL, “Big Air” procedures had two effects: one was the advanced and efficient operational procedures, which was predicted to decrease the number of clearances. The other effect was the decrease of sector size in the airport departure sector. This was expected to increase the number of clearances in the transition sectors. The ultimate results were determined by the joint effect of these two forces. “Weather” had a significant effect on the scenarios of “Big Air.” Operating in weather increased the number of clearances by 146 at the traffic level of 200 percent, but it reduced the number of clearances by 19 at the traffic level of 150 percent. This indicates a different response of the model (not a simple linear trend) to the change of operations in the BA condition in weather. This trend was consistent with the priority and workload for the BA arrival under weather procedures that were implemented. Overall, it is interesting to note that the ultimate impact on controller workload depended on the strength of the effects contributed by various conditions of operation. The effect resulting from one factor may have been offset by those resulting from other factors.
6.6.4 Number of Aircraft Handled The number of aircraft handled during the model’s performance provided an operational measure of the impact of traffic and airspace. Figure 6-7 illustrates the number of aircraft managed by the model of the radar controller in the BAASS arrival sector. The model was able to increase the number of aircraft managed as demand increased in BA operations. In BL operations, the BAASS controller did not accept as many aircraft into the sector, possibly due to a function of overload in activity demands.
BAASS Arrival: Number of A/C Handled
0
10
20
30
40
50
60
70
80
90
100Wx 100NoWx 150Wx 150NoWx 200Wx 200NoWx
Big Air
Baseline
Figure 6-7. Number of aircraft managed in BAASS arrival.
6-18

The team concluded from this analysis that the BA procedures provided an efficient method of control. The model was able to manage more aircraft without substantial increase in workload as a result of using the BA procedures. These efficiencies were experienced across all conditions. While BA procedures reduced workload when averaged across all sectors, in the arrival sector under high traffic, the model had higher workload than the BL. There are several explanations for this increase. First, workload increased in keeping with the increase in the number of aircraft managed in the BAASS arrival operations under BA conditions. Figure 6-8 illustrates the increase in workload as a function of the increased number of aircraft and weather operations. In weather operations, BAASS arrival airspace increased in size, and the number of arrival routes through the BAASS airspace increased. Second, it is possible that the number of aircraft handled in the BL condition (as analyzed above) were fewer in the arrival sector in the BL condition. Fewer aircraft may have been a result of delayed or denied handoffs into the sector. In the BA “200% Traffic No Weather” case, a decrease was seen in the number of aircraft handled from the 150% Traffic and the 200% Traffic Weather case. This could indicate that at those traffic levels, the model was reaching its threshold and model priorities changed. These results could signify that current control priorities would likely change as traffic increased to these levels. In the corresponding “weather” case, the arrival airspace had priority over other sectors, and this could account for the fact that this threshold was not reached in the weather case. The fact that the model’s priorities changed in the BA “200% Traffic No Weather “case is also evidenced by the increase in the ratio of tasks begun to tasks completed and the workload rating for this scenario.
BAASS R-Side
0
0.5
1
1.5
2
2.5
3
3.5
4
4.5
BigAir1
00W
x
Big100
NoWx
Big150
Wx
Big150
NoWx
Big200
Wx
Big200
NoWx
BL100
Wx
BL100
NoWx
BL150
Wx
BL150
NoWx
BL200
Wx
BL200
NoWx
B_WorkLoad_Datalink
Figure 6-8. Workload associated with BA and BL procedures across conditions of weather and traffic. Note. Illustrates the high workload associated with arrival sector operations with increased numbers of aircraft and arrival routes.
6-19

6.6.5 Safety Analysis The modeled human operators committed no operational errors in the simulation. This is in keeping with the priority attached to aircraft separations (highest priority). In this simulation, tasks could be shed or aircraft delayed to avoid overload and possible erroneous operations. The model performed accordingly.
6.6.6 Data Link versus Voice/Radio Communications: Cognitive Workload The HPM Team—in addition to considering the workload under the conditions of traffic increase, weather events, and BA procedures—performed a separate analysis, taking into account use of data link (controller-to-pilot data link communications). In this set of conditions, the team simulated the activities necessary to communicate a clearance to the flight deck to represent the activities necessary to compose and send a message to the flight deck that included a heading, speed, vector or route change. The data link procedures represented transfer of control and communication at the sector boundary and delivery of clearance information. In an alternative condition, the controller used voice/radio communication procedures to provide the flight crew with clearances. The team performed a “t” test for differences, and it found that the data link and voice clearance process were significantly different from each other t= 2.99 (dof, 14) at α =0.05. This difference is seen as a reduction in cognitive workload during BA procedures as opposed to BL procedures. Figure 6-9 illustrates these differences.
Workload Datalink vs Radio Communication
0
0.5
1
1.5
2
2.5
3
3.5
4
Big150Wx Big150NoWx Big200Wx Big200NoWx BL150Wx BL150NoWx BL200Wx BL200NoWx
dat a link
radio
Figure 6-9. Workload: Data link versus radio communication. Note. Illustrates the decrease in workload in BA operations when data link is used to provide clearances as compared to conditions in which voice is used. This difference was noticeable in BA procedures but not in current operations.
6-20

The conclusion drawn from this analysis is that in BA operations, data link communication consistently resulted in reduced average workload when compared with standard operations. The effect of data link communications in baseline conditions did not have an average net reduction. This result (a significant interaction) means that use of data link communications was differentially more effective in the BA procedure process, making BA operations even more efficient. Further analyses must be performed to confirm why this differential effect is seen, but a hypothesis that seems likely is that BA procedures allowed route changes and approach RNP/RNAV selection that were efficiently communicated (single-action selection of the route from a controllers’ preferred route list and single-action delivery of this clearance to the aircraft).
6.7 Summary: Human Performance Model Results The HPM Team developed and ran a fast-time human performance model under conditions that simulated BA operational concept procedures. The model indicated that BA procedures were operationally feasible. BA operations produced reduced workload overall when compared with present operations under similar experimental conditions. The model also indicated that data link communications decreased operator workload, especially under the BA procedural paradigm. BA operations imposed some procedural workload in the dynamically shifted ARR/DEP sectors (according to the procedures implemented). This workload was associated with reduced maneuver volume in feeder and airport departure airspace. Finally, a regression model fit well to the data. This linear model of the experimental variables showed that each had a predicted impact on workload in the model. Increase in aircraft increased workload to a threshold in the model’s scheduler. Decreased maneuver volume due to weather increased the controllers’ modeled workload. The procedures that were predicted by the linear model resulted in the anticipated workload changes.
6-21
7 REAL-TIME HUMAN-IN-THE-LOOP SIMULATION 7.1 Introduction 7.1.1 Background The real-time human-in-the-loop (HITL) simulation was conducted at the Research, Development, and Human Factors Laboratory (RDHFL). The RDHFL has highly advanced en route and terminal ATC simulation capabilities that replicate the functions and system interfaces of those in the field. These capabilities allow researchers to evaluate the impact of new concepts on controller performance in a highly realistic setting. HITL simulations provide the opportunity to observe users while they are working with the new concepts and to obtain both objective measures (e.g., aircraft performance) and subjective measures (e.g., controller workload) under comparative test conditions. It also allows researchers the opportunity to obtain controller feedback and comments about the concept to determine what additional tools or procedures may be needed.
7.1.2 Research Team
The Human Factors Team – Atlantic City (AJP-611) at the WJHTC planned, conducted, and analyzed the BA real-time, HITL simulation. The individuals involved represented a subteam within the BA Team and are referred to as the “HITL Team” in the following sections.
7.1.3 Purpose This experiment examined the impact of applying 3-mile separation and aircraft divergence procedures to transition sectors currently in en route airspace (BA concept). The BA HITL Team examined controller performance in a high-fidelity, HITL simulation to compare a baseline (BL) condition to two alternative control room conditions: a Big Airspace/Combined (BAC) condition and a Big Airspace/Not-Combined (BANC) condition. The HITL Team analyzed system efficiency and CPC performance, communication behavior, and workload.
7.2 Method
7.2.1 Participants A total of 24 controllers (21 male) from level 10 to level 12 facilities participated in the simulation. There were 12 participants current in en route—9 of them also had experience in the terminal domain; 12 were current in terminal, and 4 of them had experience in the en route domain. One terminal participant was currently working as a supervisor, and another was currently working in the Traffic Management Unit at their respective facilities. Table 7-1 presents summary information from the participant background questionnaire. On average, participants had over 21 years’ total experience controlling air traffic, almost 18 of
7-1 7-2
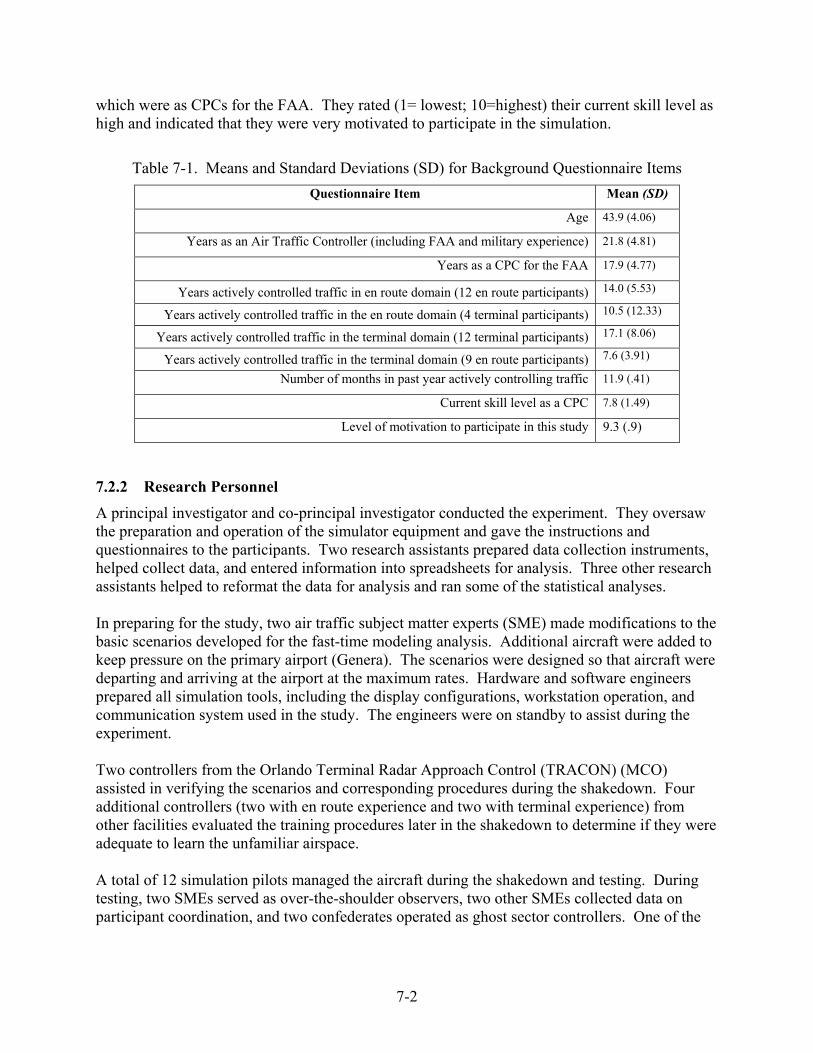
which were as CPCs for the FAA. They rated (1= lowest; 10=highest) their current skill level as high and indicated that they were very motivated to participate in the simulation.
Table 7-1. Means and Standard Deviations (SD) for Background Questionnaire Items
Questionnaire Item Mean (SD)
Age 43.9 (4.06)
Years as an Air Traffic Controller (including FAA and military experience) 21.8 (4.81)
Years as a CPC for the FAA 17.9 (4.77)
Years actively controlled traffic in en route domain (12 en route participants) 14.0 (5.53)
Years actively controlled traffic in the en route domain (4 terminal participants) 10.5 (12.33)
Years actively controlled traffic in the terminal domain (12 terminal participants) 17.1 (8.06)
Years actively controlled traffic in the terminal domain (9 en route participants) 7.6 (3.91)
Number of months in past year actively controlling traffic 11.9 (.41)
Current skill level as a CPC 7.8 (1.49)
Level of motivation to participate in this study 9.3 (.9)
7.2.2 Research Personnel A principal investigator and co-principal investigator conducted the experiment. They oversaw the preparation and operation of the simulator equipment and gave the instructions and questionnaires to the participants. Two research assistants prepared data collection instruments, helped collect data, and entered information into spreadsheets for analysis. Three other research assistants helped to reformat the data for analysis and ran some of the statistical analyses. In preparing for the study, two air traffic subject matter experts (SME) made modifications to the basic scenarios developed for the fast-time modeling analysis. Additional aircraft were added to keep pressure on the primary airport (Genera). The scenarios were designed so that aircraft were departing and arriving at the airport at the maximum rates. Hardware and software engineers prepared all simulation tools, including the display configurations, workstation operation, and communication system used in the study. The engineers were on standby to assist during the experiment. Two controllers from the Orlando Terminal Radar Approach Control (TRACON) (MCO) assisted in verifying the scenarios and corresponding procedures during the shakedown. Four additional controllers (two with en route experience and two with terminal experience) from other facilities evaluated the training procedures later in the shakedown to determine if they were adequate to learn the unfamiliar airspace. A total of 12 simulation pilots managed the aircraft during the shakedown and testing. During testing, two SMEs served as over-the-shoulder observers, two other SMEs collected data on participant coordination, and two confederates operated as ghost sector controllers. One of the
7-2

experimenters acted as a supervisor to indicate to participants when the weather would require the dynamic resectorization of airspace.
7.2.3 Equipment The HITL Team conducted the simulation at the WJHTC RDHFL.
7.2.3.1 Hardware The CPC workstations and associated equipment were located in Experiment Room (ER) 1 and ER 2 of the RDHFL (see Figure 7-1). The equipment for the ghost sector was located in an adjacent room. The simulation pilot workstations were located in the simulation pilot workstation room in the RDHFL.
Removable ER 1 Wall ER 2 Departure Arrival Arrival Departure
H R H R
En En
Terminal
A
En
En
Figure 7-1. Depiction of the en route and terminal workstatiNote. ER = Experiment Room, R = R-side position, D = D-side position
7.2.3.1.1 Air Traffic Control En Route Workstation ConThe experiment used four en route consoles to manage aircrathe transitional sectors in BA. The R-side en route console cReplacement (DSR) radar display with a Computer Readoutcontained the URET display and CRD. Each en route R-sidcommunication equipment, a keyboard, and a trackball. Theuse of TMA to modulate spacing, but the aircraft in the scenTMA sequencing when the aircraft entered the en route arrivinclude data link in the simulation because the FAA does nothe en route environment in the BA timeframe and has not dterminal environment. Therefore, all air-ground communicaThe team also limited the D-side use of URET to reflect the use the tool in the field, particularly in transition airspace. Ton the D-side workstations, and controllers used it to updatebut not for conflict probes.
7-3
Route 01
R
on console co, and H = hando
soles ft in the en roontained the Display (CRe and D-side c en route conarios were stral sector. Tht plan to haveetermined its tions were voway en route he team prov the NAS with
Route 01
Terminal
A
D
nfiguration.ff position.
ute sectors iDisplay SystD). The D-sonsole had
trollers did nuctured so ase HITL Team this tool avaconcept of uice communcontrollers cided access t flight plan
Route02
R D
n BL and em ide console
ot have the to reflect did not
ilable in se in the ications. urrently o URET changes,
Route02
Terminal
D
Terminal
D

7.2.3.1.2 Air Traffic Control Terminal Workstation Consoles
The experiment required four terminal Standard Terminal Automation Replacement System workstation consoles to manage aircraft in the terminal sectors in BL and the near-airport sectors in BA (see Figure 7-1). Only two of these consoles were operational. The handoff (H) position sat at a nonoperational console and observed and interacted with the R-side radarscope. Each of the four terminal consoles contained a set of communication equipment, a keyboard, and a trackball.
7.2.3.1.3 Simulation Pilot Workstations
The experiment used 12 simulation pilot workstations. Each workstation consisted of a computer, keyboard, monitor, and communication equipment. Each simulation pilot also had a plan view display of traffic and a list of assigned aircraft. For each assigned aircraft, the simulation pilots had information regarding the aircraft’s current state and corresponding flight plan data. The simulation pilots also had weather displayed on their workstations and were instructed to request deviations of no greater than 20 degrees because of weather for affected aircraft.
7.2.3.1.4 Communications
Communication panels and headsets were present at each console. The R-side CPCs had two-way voice communication via headsets with their respective simulation pilots. All CPCs had two-way voice communication via headsets with the other sectors involved in the simulation, including the ghost sectors.
7.2.3.1.5 Workload Assessment Keypad Workload Assessment Keypads (WAK)—which consist of a touch panel display with 10 numbered buttons—were present at each R-side position (Stein, 1985). The WAK prompts participants to press a button to provide their subjective workload ratings by using auditory and visual signals. In the simulation, the HITL Team set the WAKs to prompt the participants for a rating every 4 minutes. During the prompt, the numbered buttons on each device illuminate, and the device emits a brief tone. The participants indicated their current level of workload by pressing one of the numbered buttons, with 1 indicating low workload and 10 indicating high workload. The buttons remained illuminated throughout the response period (20 seconds) or until a participant made a response, whichever occurred first. The participants received complete WAK instructions at the beginning of the experiment and at the daily in-briefing. They also received brief reminders before each practice scenario and before the actual scenarios to refresh their memories and to increase the likelihood that they would use the same rating criteria every time.
7.2.3.2 Software The HITL Team used the Distributed Environment for Simulation, Rapid Engineering, and Experimentation (DESIREE) ATC simulator and the Target Generator Facility (TGF) to present air traffic scenarios. Software engineers at the WJHTC developed both DESIREE and TGF.
7-4

The TGF uses preset flight plans to generate radar track and data block information on the controller and simulation pilot displays. The TGF also provides an interface that allows the simulation pilots to enter flight plan changes. The TGF algorithms can control aircraft maneuvers so that they appear to the controllers to represent realistic aircraft climb, descent, and turn rates. Finally, the TGF allows researchers to capture information about aircraft trajectories, aircraft proximity, and other relevant data for use in subsequent analyses. DESIREE emulates both en route and terminal controller functions. It enables researchers to modify or add information and functionality to current ATC workstations and to evaluate new concepts and procedures. DESIREE receives input from TGF that allows it to display information on the radarscope, including radar tracks, data blocks, and sector maps. It also allows controllers to perform the typical functions that they would perform in an operational environment (e.g., accept and initiate handoffs; enter data into the host computer). Like TGF, DESIREE has data collection capabilities and can collect information on all controller entries made during a scenario.
7.2.4 Materials
7.2.4.1 Informed Consent Each participant read and signed an informed consent statement before the experiment (see Appendix A).
7.2.4.2 Biographical Questionnaire
Each participant completed the biographical questionnaire before the experiment (see Appendix B).
7.2.4.3 Post-Scenario Questionnaires
After completing each scenario, the participants provided subjective ratings about their own performance, workload, and situation awareness by making ratings on a Likert scale (1-10) for items on the Post-Scenario Questionnaire (PSQ-1). The participants also had the opportunity to provide open-ended responses so that they could include any information about the scenario they considered relevant (see Appendix C). Additionally, in the BA conditions, the participants provided information using 9-point rating scales on a second Post-Scenario Questionnaire (PSQ-2) to indicate how the BA condition affected their performance (see Appendix D).
7.2.4.4 Post-Experiment Questionnaire The participants completed a Post-Experiment Questionnaire (PEQ) after completing the entire experiment (see Appendix E). On the PEQ, the participants had the opportunity to provide their opinions, using Likert scale ratings (1-10), regarding general characteristics of the experiment (e.g., realism). Like the PSQ-1 and PSQ-2, the PEQ also posed open-ended questions.
7-5

7.2.4.5 Communication Score Sheet
The HITL Team used the Communication Score Sheet during the BAC condition to record verbal and nonverbal communication behavior (Peterson, Bailey, and Willems, 2001; Truitt et al., 2004; see Appendix F).
7.2.4.6 ATC Observer Rating Form The SMEs used a modified version (see Appendix G) of the Observer Rating Form (ORF; (Sollenberger, Stein, and Gromelski, 1997; Vardaman and Stein, 1998) to rate the participants. They rated terminal and en route participants separately. Additionally, each SME filled out two ORF forms, one for the arrival sector and one for the departure sector in each domain.
7.2.4.7 Standard Operating Procedures and Letters of Agreement The participants adhered to the Standard Operating Procedures (SOP) and the Letters of Agreement (LOA) for either the en route/transitional or the terminal/near airport environment, which varied with the CPC position and the current experimental condition.
7.2.4.8 Airspace The experiment used two different airspace designs: one for the BL condition and one for the BA conditions, which were modifications to current airspace in central Florida. The volume of the airspace in the BL and BA conditions was the same, but the boundaries changed between the higher and lower altitude sectors, as did the route structures and the fixes and waypoints. The BL airspace had two higher-altitude en route sectors—the BAASS sector (arrival sector 01) and the GRUPR sector (departure sector 02)—and a lower-altitude terminal ARR/DEP sector (see Figure 7-2), which used their respective separation procedures. The airspace for the BA conditions also contained two higher altitude BA sectors—an Arrival Transition sector (BAASS) and a Departure Transition sector (GRUPR)—and two lower-altitude, near-airport sectors—a Feeder sector and an Airport Departure sector (see Figure 7-3). In the BA conditions, controllers used terminal separation procedures in all four sectors, and the boundaries of the Feeder and Airport Departure sectors were closer to the airport than the terminal ARR/DEP sectors in BL. All conditions contained RNAV SIDs and STARs, but there were more of them in the BA conditions, enabled by the reduced separation requirements. The HITL Team treated all aircraft as RNAV equipped in all conditions. Along with these capabilities, the airspace in the BA conditions had dynamic airspace boundaries that would allow the team to change arrival-to-departure and departure-to-arrival routes. In the simulation, the HITL Team shifted airspace during the BA conditions from the GRUPR sector to the BAASS sector (refer to Dynamic Airspace 2 in Figure 7-3). The airspace in the BL condition had dedicated ARR/DEP routes and did not have dynamic sector boundaries.
7-6

7-7
Terminal Sector
D
Ghost Sector
(not depicted)
Terminal Sector
A
En Route Sector
02 (GRUPR)
En Route Sector
01 (BAASS)
Figure 7-2. Depiction of the airspace for the BL condition.
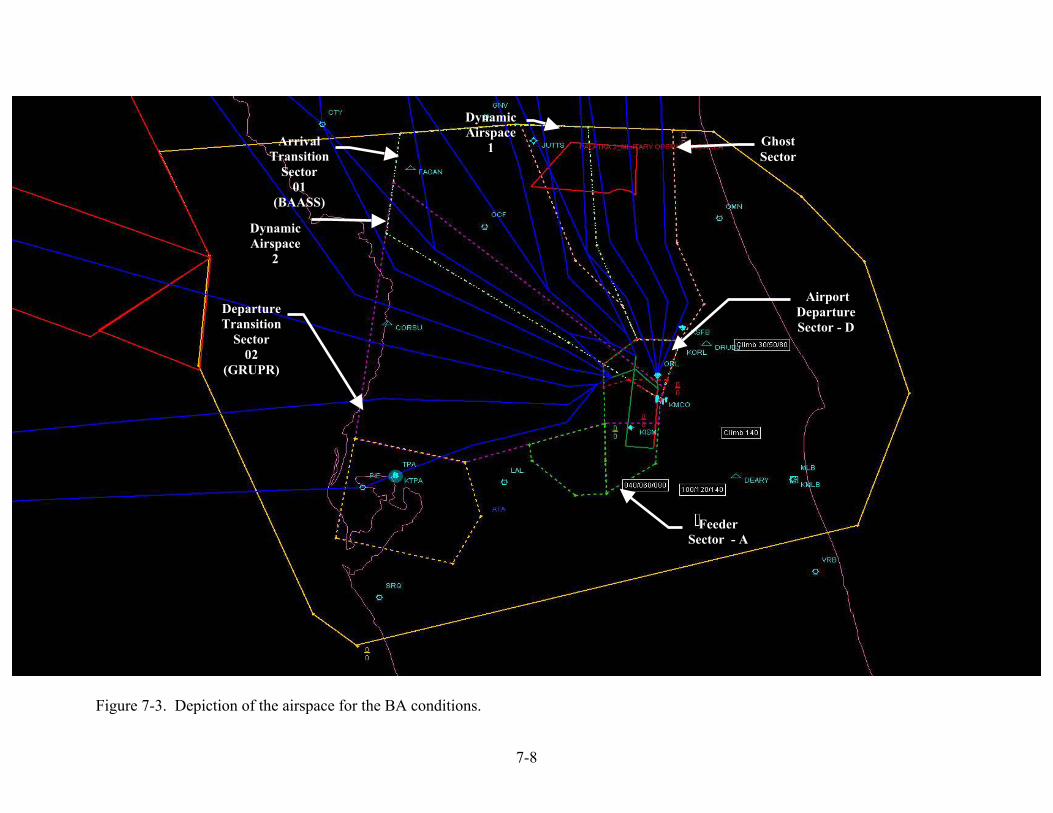
7-8
Figure
Feeder Sector - A
Airport DepartureSector - D
Departure Transition
Sector 02
(GRUPR)
Arrival Transition
Sector 01
(BAASS)
Dynamic Airspace
2
Dynamic Airspace
1 GhostSector
Figure 7-3. Depiction of the airspace for the BA conditions.

7.2.4.9 Traffic Scenarios
The experiment required the development of traffic scenarios that contained the same number and type of aircraft for both the BL and BA conditions and that differed only regarding the routes flown. One basic test scenario was developed for the BA condition and the BL condition. Then, four variations of each basic scenario were created for each test condition that differed only in the aircraft call signs. Each test scenario began with full traffic and lasted 50 minutes. The HITL Team also developed separate scenarios for use in the practice sessions. One basic practice scenario was developed for both the BL and BA conditions with four variations each that differed only in the aircraft call signs. The practice scenarios began with full traffic and were designed to run for 30 to 40 minutes. The team also developed two warm-up scenarios, one for each test condition. Each warm-up scenario began with about half the volume of traffic of the practice and test scenarios and increased to about 75 percent of the full traffic volume by the latter part of the scenario. The warm-up scenarios were used as an introduction to the airspace and were designed to run for 30 to 40 minutes.
7.2.4.10 Weather Scenario
The experiment included weather in all of the practice and experimental sessions, impacting routes in the north. The weather updated every 2 minutes on the DSR displays. It contained convective weather cells and was present from the beginning of the scenario. Through about minute 15, the weather began to impact the northern ghost departure sector to the east of the BAASS sector, shutting down those departure routes. At this point, affected aircraft were sent out on a ghosted eastern departure route. From minute 15 to minute 26, the convective weather grew and impacted the BAASS sector (sector 01), shutting down arrival routes. In the BA condition, at minute 26, the HITL team member acting as the area supervisor resectorized the airspace between the BAASS and GRUPR sectors so that the northernmost departure route in the GRUPR sector became available to the BAASS sector as an arrival route (see Figure 7-3). In doing this, the participants assumed that the Traffic Management Unit had already directed the TRACON not to send any more departing aircraft out on that route and the ARTCC to send arrivals in on that route. During the interval from minute 26 through about minute 37, the participants worked with the dynamically resectorized airspace and cleared remaining departure aircraft out of the sector and began to accept arrival aircraft entering on the new arrival route. The participants worked the remainder of the scenarios, from minute 37 to minute 50, using the resectorized airspace. In the BL condition, no resectorization occurred, and weather required controllers to use the available routes.
7.2.5 Design
7.2.5.1 Experimental Design The en route/transitional airspace consisted of two, two-person sectors with an R-side and a D-side. The terminal/near-airport airspace also consisted of two, two-person sectors with an R-side and an H position. Sector A was the Arrival/Feeder sector, and Sector D was the Departure/Airport Departure sector. Each participant controlled traffic at each position in each
7-9

sector in his/her airspace. While at each position, each participant ran one scenario in each of the three conditions in the simulation: BL, BAC, and BANC (see Table 7-2).
Table 7-2. Counterbalancing Order of Test Conditions
En Route/Transitional Sector Terminal/Near-Airport Sector Group Simulation
Run 01 01-D 02 02-D A A-H D
D-H
Condition Day
1 E1 E2 E3 E4 T3 T2 T1 T4 BL M 2 “ “ “ “ “ “ “ “ BAC M 3 “ “ “ “ “ “ “ “ BANC M 4 E2 E3 E4 E1 T4 T3 T2 T1 BAC M 5 “ “ “ “ “ “ “ “ BANC T 6 “ “ “ “ “ “ “ “ BL T 7 E3 E4 E1 E2 T1 T4 T3 T2 BANC T 8 “ “ “ “ “ “ “ “ BL T 9 “ “ “ “ “ “ “ “ BAC T 10 E4 E1 E2 E3 T2 T1 T4 T3 BAC W 11 “ “ “ “ “ “ “ “ BL W
1
12 “ “ “ “ “ “ “ “ BANC W 13 E5 E7 E6 E8 T7 T8 T5 T6 BANC M 14 “ “ “ “ “ “ “ “ BAC M 15 “ “ “ “ “ “ “ “ BL M 16 E7 E6 E8 E5 T6 T7 T8 T5 BL M 17 “ “ “ “ “ “ “ “ BANC T 18 “ “ “ “ “ “ “ “ BAC T 19 E6 E8 E5 E7 T5 T6 T7 T8 BAC T 20 “ “ “ “ “ “ “ “ BL T 21 “ “ “ “ “ “ “ “ BANC T 22 E8 E5 E7 E6 T8 T5 T6 T7 BANC W 23 “ “ “ “ “ “ “ “ BL W
2
24 “ “ “ “ “ “ “ “ BAC W 25 E9 E12 E11 E10 T9 T11 T12 T10 BAC M 26 “ “ “ “ “ “ “ “ BANC M 27 “ “ “ “ “ “ “ “ BL M 28 E10 E9 E12 E11 T11 T12 T10 T9 BL M 29 “ “ “ “ “ “ “ “ BAC T 30 “ “ “ “ “ “ “ “ BANC T 31 E11 E10 E9 E12 T12 T10 T9 T11 BANC T 32 “ “ “ “ “ “ “ “ BAC T 33 “ “ “ “ “ “ “ “ BL T 34 E12 E11 E10 E9 T10 T9 T11 T12 BL W 35 “ “ “ “ “ “ “ “ BANC W
3
36 “ “ “ “ “ “ “ “ BAC W
Note. E1 = participant 1 for en route; T1 = participant 1 for terminal.
7-10

During the BL condition, the participants controlled traffic as they normally would in the field, and a wall physically separated the terminal/near-airport and en route/transitional sectors. During the BA conditions, the lateral separation standards for the transitional sectors were reduced from 5 nm to 3 nm, and controllers were also able to use diverging course procedures. However, visual separation was not used because the simulation pilot configuration prevented pilots from having the capability to conduct this procedure. For the BANC condition, the wall remained in place. During the BAC condition, the terminal and en route controllers were in the same room, and face-to-face communication between them was possible. In both of the BA conditions, the en route controllers continued to use their en route consoles, but the radar display updated at the terminal rate of 5 seconds rather than at the en route rate of 12 seconds.
7.2.5.2 Dependent Variables For each condition, the HITL Team obtained measures of efficiency, performance, and communication. The participants provided subjective measures of performance and workload.
7.2.5.2.1 System Performance Measures The HITL Team collected many system performance measures for each sector and for the overall simulation to provide information regarding efficiency and safety for each experimental condition. These measures included the number of flights completed; number of departures; number of altitude, heading, and airspeed commands that controllers issued; time and distance flown (in nm) for all aircraft on the controller’s frequency; time and distance on RNAV routes; number of handoffs; number and duration of airborne holds; number and duration of ground stops; number and duration of departure delays; and losses of separation and operational errors.
7.2.5.2.2 Subjective Measures The SMEs used the ORF (see Appendix G) to collect over-the-shoulder performance ratings for the terminal and en route participants. Using the ORF, the SMEs assessed the participants’ performance in maintaining a safe and efficient traffic flow, sequencing aircraft efficiently, and providing control information. They also rated the frequency of occurrence of improper task performance, if any. The participants made subjective ratings of their workload, situation awareness, and control performance on the PSQs and PEQ.
7.2.5.2.3 Online Workload Measures The HITL Team recorded all WAK ratings made by each R-side controller every 4 minutes during the scenarios.
7.2.5.2.4 Communications The HITL Team automatically recorded push-to-talk (PTT) communications, including both ground-ground and ground-air transmissions. They recorded the number of times each participant transmitted a message, the duration of each transmission, and whether that transmission was from a controller to a controller or a controller to a pilot. An observer recorded
7-11

the frequency and categorized the general content of face-to-face communication between the Arrival Transition and Feeder sectors, and between the Departure Transition and Airport Departure sectors in the BAC condition (see Appendix F). The observer also recorded nonverbal gestures, such as pointing to a display. This enabled the team to better evaluate what types of correspondence occurred if PTT communications between the en route and terminal controllers decreased during the BAC condition compared to the BL and BANC conditions.
7.2.6 Procedure
7.2.6.1 General Schedule of Events The en route and terminal participants were involved in the experiment for 6 days. They traveled in on a Tuesday and left on Thursday of the following week.
Table 7-3 shows the daily schedule of events.
Table 7-3. Daily Event Schedule Week 1
Time Wednesday Time Thursday Time Friday 8:30 Introduction, Forms, Baseline
Airspace & LOA/SOP Familiarization
8:30 Daily In-Briefing & BA Review
8:30 Daily In-Briefing & Baseline Review
10:00 Break 9:00 Practice 6 & 7 9:00 Practice 13 &14 10:15 Practice 1 & 2 10:30 Break 10:30 Break 11:45 Lunch 10:45 Practice 8 10:45 Practice 15 12:45 Review Baseline Rules 11:45 Lunch 11:30 Lunch 1:00 Practice 3 & 4 12:45 Combined Control
Room Instructions 12:30 Practice 16
2:30 Break 1:00 Practice 9 & 10 1:30 Break 2:45 BA & LOA/SOP Familiarization 2:30 Break 1:45 Review Questionnaires,
Issues, and Schedule 3:30 Practice 5 2:45 Practice 11 & 12 4:15 Caucus 4:00 Break 4:15 Caucus
Week 2 Time Monday Time Tuesday Wednesday 8:30 Daily In-Briefing 8:30 Daily In-Briefing 8:30 Daily In-Briefing
10:00 Break 9:00 Experiment 5 9:00 Experiment 10 10:15 Experiment 1 10:00 Break 10:00 Break 11:15 Break 10:15 Experiment 6 10:15 Experiment 11 11:30 Experiment 2 11:15 Lunch 11:15 Lunch 12:30 Lunch 12:15 Experiment 7 12:15 Experiment 12 1:30 Experiment 3 1:15 Break 1:15 Break 2:30 Break 1:30 Experiment 8 1:30 Questionnaires &
Final Caucus 2:45 Experiment 4 2:30 Break 3:45 Break 2:45 Experiment 9 4:00 Caucus 3:45 Break
4:00 Caucus
Note. LOA = Letter of Agreement; SOP = Standard Operating Procedure. The table illustrates the schedule for Group 1.
7-12

7.2.6.2 In-Briefing The experimenter reviewed the schedule of events and explained the general procedures for the experiment, including the dependent measures that would be collected. The experimenter also reviewed the participants’ rights and responsibilities as summarized in the Informed Consent Statement (see Appendix A). Next, two SMEs briefed the participants on the hardware and software used in the study and presented the SOPs and LOAs for each experimental condition. The participants were instructed that instrument meteorological conditions would be in effect. They were also informed that the ghost controllers would be available to handle requests for aircraft outside of the participant-controlled airspace, primarily the arrival aircraft into BAASS. The participants were instructed to communicate with the ghost controllers if they wanted to hold or regulate the traffic (e.g., reduce speeds) entering BAASS. After listening to all the in-briefing information and asking any questions, the participants read and signed the informed consent statement and completed the background questionnaire (see Appendix B). The experimenter and a witness also signed the informed consent statement. The HITL Team gave a copy of the briefing slides to the participants so that they could take notes on the maps and refer to them as needed when they worked the scenarios.
7.2.6.3 Practice Scenarios The participants completed a minimum of 16 practice scenarios (including warm-up scenarios). Each practice or warm-up scenario ran for about 30 to 40 minutes and was intended to familiarize the participants with the different sectors in the generic airspace, the equipment, and the different experimental conditions. The participants received instructions about the scenario that they were about to work and instructions about the WAK device and rating scale (see Appendix H). They used the WAK device during the practice scenarios to become accustomed to it. The participants completed the practice scenarios starting with the BL condition, followed by the BANC and BAC conditions. Participants worked at each of the positions under each condition, as illustrated by the sample counterbalancing scheme in Table 7-4.
7-13

Table 7-4. Sample Sequence of Counterbalancing Order of Practice Conditions
En Route/Transitional Sector Terminal/Near-Airport Sector Practice
Run
01
01 D
02
02 D
A
A-H
D
D-H
Condition
Day 1 E1 E2 E3 E4 T1 T2 T3 T4 BL – warm up W 2 E2 E1 E4 E3 T2 T1 T4 T3 BL – warm up W 3 E4 E3 E2 E1 T4 T3 T2 T1 BL – warm up W 4 E3 E4 E1 E2 T3 T4 T1 T2 BL – warm up W 5 E2 E3 E4 E1 T2 T3 T4 T1 BL W 6 E3 E2 E1 E4 T3 T2 T1 T4 BL Th 7 E1 E4 E3 E2 T1 T4 T3 T2 BL Th 8 E4 E1 E2 E3 T4 T1 T2 T3 BL Th 9 E1 E3 E2 E4 T1 T3 T2 T4 BANC Th 10 E3 E1 E4 E2 T3 T1 T4 T2 BANC Th 11 E4 E2 E3 E1 T4 T2 T3 T1 BANC Th 12 E2 E4 E1 E3 T2 T4 T1 T3 BANC Th 13 E3 E4 E1 E2 T3 T4 T1 T2 BAC Fr 14 E4 E3 E2 E1 T4 T3 T2 T1 BAC Fr 15 E2 E1 E4 E3 T2 T1 T4 T3 BAC Fr 16 E1 E2 E3 E4 T1 T2 T3 T4 BAC Fr
Note. E1 = participant 1 for en route; T1 = participant 1 for terminal.
7.2.6.4 Data Collection Procedure During data collection, the participants completed scenarios as indicated by the counterbalancing scheme in Table 7-2. First, the participants received general instructions about the current experimental condition (see Appendix H). For the BL condition, the experimenters informed the participants that they should control traffic as they normally would in the field. Prior to both the BA conditions, the experimenters informed the participants about the airspace boundary changes—that the transitional sector lateral separation minimum would be 3 nm, and that the same set of procedures would be in effect for all sectors. They also reminded the participants about the dynamic resectorization capability and the additional RNAV routes in the BA conditions. For the BAC condition, the experimenters informed the participants that the transitional sectors and near-airport sectors would be physically located next to one another and that they could use face-to-face communication if they wished. After the participants received all instructions and the experimenters answered all questions relating to the current condition, the participants completed a final radio check, and the scenarios began. Test scenarios lasted 50 minutes. During each scenario, the experimenters and the observers collected the dependent measures, and the participants provided subjective ratings of workload at 4-minute intervals throughout each scenario. In addition, video and audio equipment recorded the participants’ communications and actions during the simulation in case the researchers needed to review the simulation later. As soon as the scenario ended, the participants completed PSQ-1 and PSQ-2, if appropriate. The participants then took a 15-minute break before beginning the next scenario. The participants moved to a new position within their domain (en route/transitional or terminal/near-airport) after every three simulation runs. Before the participants began controlling traffic at a new position, they had time to familiarize themselves with the equipment and adjust their display preferences.
7-14

After the participants completed all the experimental scenarios, they completed the PEQ. The HITL Team also held a final debrief to discuss the simulation, the BA conditions and effects, and additional requirements (e.g., automation, procedures) that may be needed to support the concept.
7.3 Results It takes a little time for participants to acclimate to a scenario. There is also a typical decline in performance at the end of a scenario. Therefore, the HITL Team included the data from the 4-minute mark to the 48-minute mark in its analyses. The team analyzed the data using a repeated measures analysis of variance (ANOVA) to compare the three airspace conditions (BL, BAC, BANC; see Appendix I for information on repeated measures designs). For all analyses, the team determined that results were significant when p values were less than or equal to .05 and reported the F values for each relevant analysis. When sphericity was violated, the team presented the adjusted degrees of freedom (df) for those tests. When they found significant effects, they also ran post hoc Tukey analyses to determine which pairs of differences were significant, again using p values of .05. Unless otherwise specified (see Section 7.3.1), the HITL Team analyzed the data collected from the terminal/near-airport and en route/transitional sectors separately (Truitt et al., 2004). When appropriate, the team conducted 2 x 3 repeated measures ANOVAs with sector type (ARR/DEP) and airspace condition (BL, BAC, BANC) as factors. They also analyzed some measures by the four, 11-minute weather intervals across the airspace conditions because they expected that the weather may affect these measures differently. In cases for which significant interactions were found, the team presented only the results of the interaction because any significant main effects would not be meaningful.
7.3.1 System Performance Measures The HITL Team analyzed system performance measures to test for hypothesized differences between the conditions. In these analyses, it was important to consider that the size of the en route/transitional and terminal/near-airport sectors changes when going from the BL condition to the BA conditions. Therefore, the team did not compare performance in the terminal ARR/DEP sectors in the BL condition to the Feeder and Airport Departure sectors in the BA conditions or performance in the en route sector in the BL condition to the transitional sectors in the BA conditions because of the differences in the sizes of the sectors. Consequently, the team collapsed the data across the en route and terminal sectors in the BL condition and across the transitional and near-airport sectors in the BAC and BANC conditions to get an overall performance metric for the three airspace conditions. For simplification, these will be referred to as the BAASS + Arrival and GRUPR + Departure sectors for each condition. This issue affected the analysis of all system performance metrics, including the total distance flown, the average distance flown per aircraft, the number of aircraft handled, the duration of aircraft handled, the number of holds, the duration of holds, and so on. In separate analyses, the HITL Team evaluated the number and duration of holds and the number of altitude, speed, and heading changes made by the ghost controller to determine the amount and type of maneuvering of aircraft needed before their entry in the BAASS + Arrival sector across the test conditions.
7-15

7.3.1.1 Number of Flights Handled The number of flights handled was higher, F(1, 11) = 2293.6, in the GRUPR + Departure sector (mean = 117.3, SD = 4.23) than in the BAASS + Arrival sector (mean = 74.2, SD = 2.55). The GRUPR + Departure sector was geographically larger and handled traffic into and out of satellite airports in one of the ghost sectors in addition to departure aircraft from the primary airport. The HITL Team found an average of 94.2 (SD = 3.35) aircraft handled in the BL condition, 96.4 (SD = 4.54) in BAC, and 96.7 (SD = 5.22) in BANC; these differences were not statistically significant. However, because the analysis window was only 44 minutes (and weather only affected the BAASS sector for about 33 minutes), these small differences may be operationally significant if they are extrapolated to longer periods of time.
7.3.1.2 Time and Distance Flown in Sectors and RNAV Routes The HITL Team found that the average time aircraft were in the airspace in the BAASS + Arrival sector and the GRUPR + Departure sector was affected differently by condition, F(2, 22) = 4.45. The aircraft were in the BAASS + Arrival sector for a longer period of time in the BL condition than in either the BAC or BANC conditions (see Figure 7-4). The average time in the airspace did not differ across conditions in the GRUPR + Departure sector.
4
6
8
10
12
BL BAC BANC
Sector x Condition
Mea
n Ti
me
in S
ecto
r (m
in)
Arrival
Departure
Figure 7-4. Average time in airspace by Sector and Condition.
The average distance that the aircraft traveled through the airspace was higher, F(2, 22) = 13.24, in BL (mean = 46.4 nm, SD = 4.07) than in either BAC (mean = 43.5, SD = 1.13) or BANC (mean = 43.2, SD = 1.46). The team also examined the proportion of time that aircraft were on the RNAV routes (within .25 nm lateral), but did not find any significant differences across conditions. The aircraft did spend proportionately more time, F(1, 11) = 361.87, on the RNAV routes in the GRUPR + Departure sector (mean = .89, SD = .05) than in the BAASS + Arrival sector (mean = .56, SD =
7-16

.13). This result is not surprising given that the weather affected the BAASS + Arrival sector and not the GRUPR + Departure sector.
7.3.1.3 Number of Completed Flights and Number of Departures The HITL Team defined the number of completed flights as those that participants handed off to approach control and were below an altitude of 1,200 feet msl. They did this to eliminate any instances in which an aircraft would not have landed at the airport because of a technical problem or error not attributable to the participant. The team found an average of 28.8 (SD = 2.12) flights completed in the BANC condition, 27.4 (SD = 4.03) in BAC, and 26.7 (SD = 3.47) in BL. These differences were not significant. However, because of the 44-minute analysis window, these differences may be operationally significant if examined over a longer period of time. The team evaluated the number of departures for each scenario and did not find any differences across conditions. A total of 45 departures were recorded for each scenario: 29 were handed off from the Departure/Airport Departure sector to the GRUPR sector, and 16 were handed off from the Departure/Airport Departure sector to a ghost sector to the east. These numbers did not vary because no participant requested ground stops in the test scenarios.
7.3.1.4 Losses of Separation The HITL Team examined losses of separation differently in the BA and BL conditions for the en route/transitional sectors because of the different procedures used in those conditions. In the BL condition, en route losses of separation occurred when aircraft were separated by less than 5 nm horizontally and 1,000 feet vertically. Terminal losses of separation occurred when aircraft were separated by less than 3 nm horizontally and 1,000 feet vertically. The terminal separation standards were also used in the transitional sectors in the BA conditions. The team eliminated any separation violations that occurred only in the ghost sectors, including those that occurred below an altitude of 2,000 feet because these would have been the responsibility of the ghost approach control sector. They also eliminated any separation violations that were shorter than the duration of one sweep of the radar (12 seconds in BL for en route, 5 seconds in the BA conditions and in terminal). They eliminated other aircraft pairs that were separated by 900 to 1,000 feet vertically because the controller does not have information available to indicate separations of less than 100 feet. The SMEs evaluated the remaining separation violations to determine if other circumstances warranted that other aircraft pairs should be excluded. For example, if the participants used diverging courses in the terminal/near-airport environment or in the transitional sectors in the BA conditions, these violations were eliminated. They also eliminated any violations that were determined to have been caused by a pilot error. The team found eight errors in one of the BL scenarios, while the other BL scenarios had from zero to three. The SME observer notes from the 8-error scenario indicated that the participants working the BAASS + Arrival sector were experiencing “more than normal” difficulty. The observer noted that the en route participants took handoffs late and that compression was an
7-17

issue for traffic downstream when aircraft were handed off to Arrival. The observer also noted that these participants probably would have stopped taking traffic in this scenario in the real world. As a result, the team eliminated this outlier from its analyses and did not find a significant difference in the number of errors across conditions. The mean number of operational errors was .72 (SD = .97) in BL, .36 (SD = .82) in BAC, and .23 (SD + .51) in BANC. Most of the errors occurred in the terminal/near-airport airspace in both the BL and BA conditions, or close to the boundary between the higher and lower altitude sectors. Several of the errors occurred between an aircraft that was arriving or departing and an overflight that was traveling east to west through the terminal/near-airport sectors from one of the satellite airports to another.
7.3.1.5 Altitude Clearances
The participants issued more altitude clearances, F(2, 22) = 11.5, in BL (mean = 173, SD = 14.12) than in either BAC (mean = 154.7, SD = 21.25) or BANC (mean = 155.4, SD = 18.51). They also issued more altitude clearances in the BAASS + Arrival sector (mean = 172.3, SD = 26.84) than in the GRUPR + Departure sector (mean = 149.8, SD = 14.34).
When the HITL Team examined these data by weather interval, they found differences in the pattern of results obtained across conditions, F(6, 66) = 2.9 (see Figure 7-5). Overall, there were fewer altitude clearances issued during the first interval than in each of the others. In BL, however, the number of clearances issued increased in the second interval and remained high in the third. In the BA conditions, the number of clearances increased between the first and second intervals, but decreased in the third after airspace resectorization occurred.
25
30
35
40
45
50
55
1 2 3 4
Condition x Interval
Mea
n N
umbe
r
BL
BAC
BANC
Figure 7-5. Mean number of altitude clearances issued by Condition and Interval.
7-18

The number of altitude clearances issued in the BAASS + Arrival sector was lower in the first interval than in the second and fourth intervals, F(3, 33) = 11.81. However, participants issued more clearances in the GRUPR + Departure sector in the second interval than in any of the others (see Figure 7-6).
20
25
30
35
40
45
50
55
60
1 2 3 4
Sector x Interval
Mea
n N
umbe
r
BAASS
GRUPR
Figure 7-6. Mean number of altitude clearances issued by Sector and Interval.
In the ghost sector, there were fewer altitude commands issued, F(3, 33) = 14.58, in the first interval (mean = 4.6, SD = 1.66) than in the second (mean = 7.9, SD = 3.5) or third (mean = 7.1, SD = 3.76), and more altitude changes made during the second and third intervals than in the fourth.
7.3.1.6 Heading Clearances The participants issued more heading clearances, F(2, 22) = 3.95, in BL (mean = 40.7, SD = 11.97) than in BANC (mean = 31.2, SD = 13.34), though neither differed significantly from BAC (mean = 35.8, SD = 11.18). There is no obvious reason why there is a significant difference between BL and BAC, but not between BL and BANC. This may simply be due to a statistical artifact given the size of the sample and variability of the data. The HITL Team also found that participants issued about 10 times more heading commands, F(1, 11) = 111.85, in the BAASS + Arrival sector (mean = 65.4, SD = 19.61) than in the GRUPR + Departure sector (mean = 6.3, SD = 3.11). This finding is not surprising given that more vectoring of aircraft would be expected in the sector affected by weather. The number of heading changes also differed significantly by condition and weather interval, F(6, 66) = 2.84. The fewest heading clearances were issued in the first interval for all conditions, but increased more in the third and fourth intervals in BL than in BANC (see Figure 7-7).
7-19
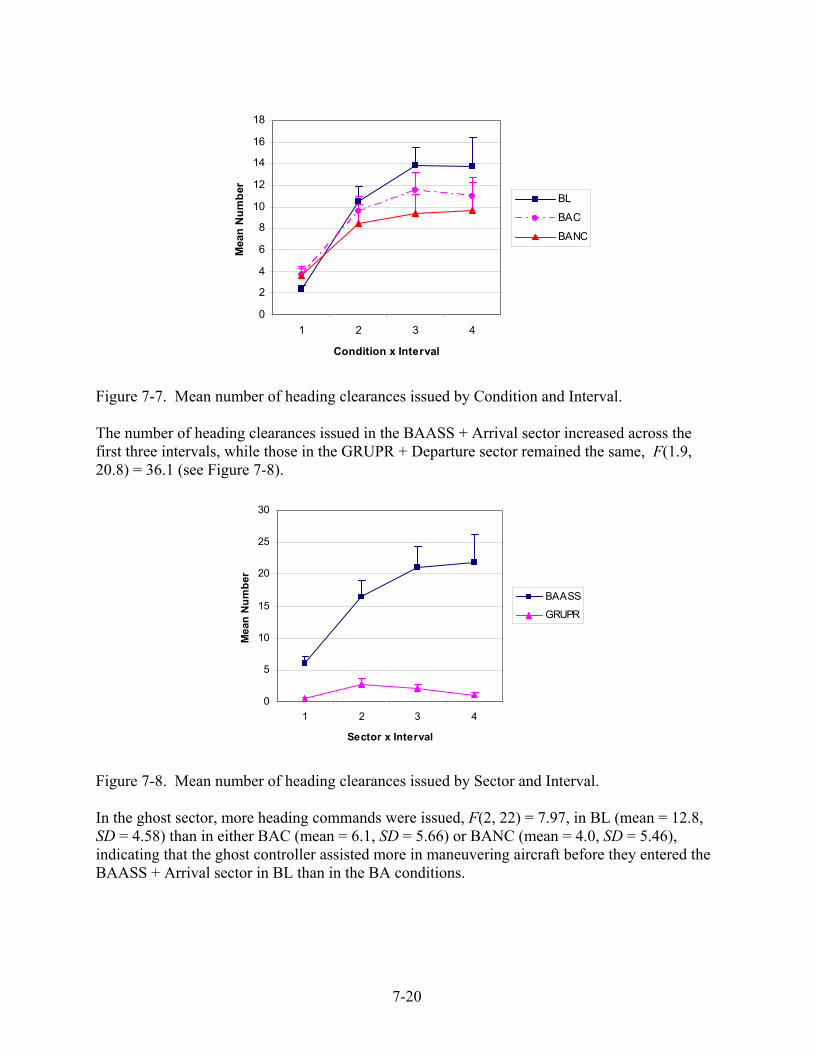
0
2
4
6
8
10
12
14
16
18
1 2 3 4
Condition x Interval
Mea
n N
umbe
r
BL
BAC
BANC
Figure 7-7. Mean number of heading clearances issued by Condition and Interval. The number of heading clearances issued in the BAASS + Arrival sector increased across the first three intervals, while those in the GRUPR + Departure sector remained the same, F(1.9, 20.8) = 36.1 (see Figure 7-8).
0
5
10
15
20
25
30
1 2 3 4
Sector x Interval
Mea
n N
umbe
r
BAASS
GRUPR
Figure 7-8. Mean number of heading clearances issued by Sector and Interval. In the ghost sector, more heading commands were issued, F(2, 22) = 7.97, in BL (mean = 12.8, SD = 4.58) than in either BAC (mean = 6.1, SD = 5.66) or BANC (mean = 4.0, SD = 5.46), indicating that the ghost controller assisted more in maneuvering aircraft before they entered the BAASS + Arrival sector in BL than in the BA conditions.
7-20

When the HITL Team examined the data across weather intervals, the team found that the ghost controller issued more heading clearances, F(2, 22.4) = 7.56, during the third and fourth intervals in BL than in either of the BA conditions (see Figure 7-9). This suggests that the ghost controller assisted less when the airspace was resectorized.
0
1
2
3
4
5
6
7
8
1 2 3 4
Condition x Interval
Mea
n N
umbe
r
BL
BAC
BANC
Figure 7-9. Mean number of heading clearances issued by ghost controller by Condition and
Interval.
7.3.1.7 Speed Clearances The HITL Team found that speed clearances in the BAASS + Arrival sector and the GRUPR + Departure sector were affected differently by condition, F(2, 22) = 4.31. Participants issued more speed clearances in BAC and BANC than in BL in the BAASS + Arrival sector; those issued in the GRUPR + Departure sector did not differ from each other (see Figure 7-10).
0
20
40
60
80
100
120
140
BL BAC BANC
Sector x Condition
Mea
n N
umbe
r
BAASS
GRUPR
Figure 7-10. Mean speed clearances issued by Sector and Condition.
7-21

When the team analyzed the data by weather interval, it found that participants issued fewer speed clearances in the first interval than in the second, third, or fourth—but only for the BAASS + Arrival sector, F(3, 33) = 29.37 (see Figure 7-11).
0
5
10
15
20
25
30
35
1 2 3 4
Sector x Interval
Mea
n N
umbe
r
BAASS
GRUPR
Figure 7-11. Mean number of speed clearances by Sector and Interval. The ghost controller issued more speed clearances in BL (mean = 34.1, SD = 13.26) than in either BAC (mean = 19.9, SD = 15.47) or BANC (mean = 19.5, SD = 15.12), F(2, 22) = 4.82, indicating that the ghost controller assisted more in maneuvering aircraft before they entered the BAASS + Arrival sector in the BL condition. The number of speed clearances that the ghost controller issued differed by condition across weather interval, F(2.87, 31.51) = 4.76. These increased from the first through third intervals, but more clearances were issued in the third and fourth intervals in the BL condition than in either BAC or BANC (see Figure 7-12). This suggests that the ghost controller assisted more when resectorization was unavailable.
7-22

0
2
4
6
8
10
12
14
16
18
1 2 3 4
Condition x Interval
Mea
n N
umbe
rBL
BAC
BANC
Figure 7-12. Mean number of speed clearances issued by ghost controller by Condition and
Interval.
7.3.1.8 Number and Duration of Holds The participants working the BAASS + Arrival sector could hold aircraft at two fixes within that sector or coordinate with the ghost controller to hold aircraft outside the sector. Overall, the participants did not hold many aircraft (see Table 7-5).
Table 7-5. Mean Number and Standard Deviation of Hold Commands Issued
BL BAC BANC
BAASS + Arrival 1.42 (2.90) 0 .08 (.29)
Ghost 5.00 (6.47) .08 (.29) .08 (.29)
The effect of condition was significant for the number of aircraft that the ghost controller held outside of the BAASS + Arrival sector, F(1.01, 11.07) = 6.97. The ghost controller did more holding in BL than in either BAC or BANC. The duration of holds outside the sector also differed significantly, F(2, 22) = 4.29, between BL and BAC. Mean holding duration was 3.2 minutes (SD = 3.71) in BL, but was less than a minute in BAC (mean = .25, SD = .86) and BANC (mean = .72, SD = 2.49). Within the BAASS + Arrival sector, the difference in the number and duration of holds did not differ significantly across conditions. Due to the limited amount of holding data, the HITL Team did not perform any statistical analyses across the weather intervals. The team did find that no holding occurred in the first interval either within the BAASS + Arrival sector or in the ghost sector for any condition. However, in BL, the number of holds increased from the second through fourth intervals in both
7-23

of those sectors, while the few holds that occurred in the BA conditions were scattered across those intervals.
7.3.2 Communications The team measured the mean number and average duration of ground-ground and ground-air PTT transmissions for the en route and terminal participants separately. The team eliminated any transmissions that were 250 milliseconds (msec) or less. It would not have been possible for participants to transmit a meaningful verbal message within this timeframe. The team also evaluated the number and type of communications that participants made during the BAC condition when they had the opportunity to talk face to face.
7.3.2.1 En Route Participant Push-To-Talk Communications The ground-ground communications included all transmissions between one participant and another as well as to the ghost controller. The participants made more ground-ground transmissions, F(1.3, 14.5) = 9.85, in the BL condition in the BAASS sector than in either BAC or BANC; the number did not differ significantly across conditions in the GRUPR sector (see Figure 7-13).
0
5
10
15
20
25
30
35
40
BL BAC BANC
Sector x Condition
Mea
n N
umbe
r of T
x
BAASS
GRUPR
Figure 7-13. Mean number of en route ground-ground transmissions by Sector and Condition. To test the effects of a combined control room more closely, the team also analyzed the data after eliminating the transmissions that the participants made to the ghost controller because the ghost position was not in the same control room as the participants. Though there was a somewhat greater mean number of transmissions made in BANC (mean = 9.8, SD = 6.15) than in BAC (mean = 7.4, SD = 4.44), this difference was not significant. The other analyses the team ran on these data indicated the same overall effects of condition, sector, and interval reported elsewhere in this section.
7-24

The team also evaluated the number of ground-ground transmissions across the four weather intervals and found that the number of transmissions increased between the first and second intervals in all conditions, F(6, 66) = 9.47, and continued to increase in the third interval in the BL condition (see Figure 7-14). However, the number of transmissions decreased in BAC and BANC in these intervals after airspace resectorization.
0
1
2
3
4
5
6
7
8
9
10
1 2 3 4
Condition x Interval
Mea
n N
umbe
r of T
x
BL
BAC
BANC
Figure 7-14. Mean number of en route ground-ground transmissions by Condition and Interval. The HITL Team analyzed the mean durations of the ground-ground transmissions and found that they were highly variable. While the team did find some significant results in the analyses, the findings were not consistent and, thus, the team did not report them because of their questionable operational significance. The team analyzed the ground-air communications similarly to the ground-ground communications. En route participants made more transmissions, F(2, 22) = 20.06, in the BAC and BANC conditions than in the BL condition in the BAASS sector (see Figure 7-15). However, the team found the opposite for the GRUPR sector. The participants made more transmissions in the BL condition than in either BAC or BANC. The most likely reasons for this result are the relative size of the en route sectors, the effects of resectorization, and the impact of weather in BAASS. In BAASS BL, there was a smaller volume of airspace, and the aircraft were handed off earlier and higher to the Arrival sector; so fewer transmissions were needed than in BA. Aircraft speeds needed to be reduced more in BAASS in BA to hand off to the smaller Feeder sector. Following resectorization in BA, more room was also available to maneuver aircraft in BAASS. In GRUPR BL, the airspace was smaller with fewer RNAV routes than in BA, requiring more transmissions. In GRUPR BA, additional routes were available, requiring fewer transmissions.
7-25

160
180
200
220
240
260
280
300
320
BL BAC BANC
Sector x Condition
Mea
n N
umbe
r of T
X
BAASS
GRUPR
Figure 7-15. Mean number of en route ground-air transmissions by Sector and Condition. The HITL Team also examined the number of ground-air transmissions across the four scenario intervals and found a significant interaction of condition X interval, F(6, 66) = 5.38. For all conditions, the number of transmissions made in the second and third intervals was higher than the number made in the first (see Figure 7-16). However, only BL and BAC had more transmissions in the fourth interval than in the first. The BANC condition had fewer transmissions in the last interval than did BL. This result was likely confounded by the differential transmission rates in the BAASS and GRUPR sectors. Unfortunately, the data did not have sufficient statistical power to test for a 3-way interaction.
45
50
55
60
65
70
75
1 2 3 4
Condition x Interval
Mea
n N
umbe
r of T
x
BL
BAC
BANC
Figure 7-16. Mean number of en route ground-air transmissions by Condition and Interval.
7-26

The team also found that the number of transmissions increased similarly in both sectors over the first three intervals, but increased, F(3, 33) = 29.52, in the fourth interval in the BAASS sector and decreased in the GRUPR sector to the level of the first interval (see Figure 7-17). It is possible that this difference was related to the increase in the size of the airspace in BAASS and decrease in GRUPR following resectorization. More airspace was available to maneuver aircraft around weather in BAASS, while GRUPR aircraft were well established on the RNAV routes as the scenarios progressed.
35
40
45
50
55
60
65
70
75
80
85
1 2 3 4
Interval
Mea
n N
umbe
r of T
x
BAASS
GRUPR
Figure 7-17. Mean number of en route ground-air transmissions by Sector and Interval. The ground-air transmission durations were not very variable. As a result, some very small mean differences (e.g., less than 150 msec) were statistically significant. Given that these small differences are not likely to be operationally significant and because the team had eliminated any transmissions that were 250 msec or less from the data, the team did not report the results of these analyses.
7.3.2.2 Terminal Participant Push-To-Talk Communications
The number of ground-ground communications made by terminal participants varied widely. The HITL Team found that the participants made more transmissions, F(2, 22) = 3.64, in the Arrival sector in the BL condition than in the Feeder sectors in either BAC or BANC (see Figure 7-18). This may have been associated with the relative decrease in the sector size in the BA condition. However, in the Departure/Airport Departure sector, the number of transmissions did not differ significantly across conditions. Overall, there were very few ground-ground transmissions in the Departure sector.
7-27

0
2
4
6
8
10
12
14
16
18
BL BAC BANC
Sector x Condtion
Mea
n N
umbe
r of T
xArrival
Departure
Figure 7-18. Mean number of terminal ground-ground transmissions by Sector and Condition. The team also found a significant effect of interval, F(3, 33) = 7.38. The participants made the fewest transmissions in the first interval (mean = .6, SD = 1.55). The means for the second (2.0, SD = 4.08), third (1.5, SD =2.63), and fourth interval (1.75, SD = 2.9) did not differ significantly from one another. The participants made more ground-air transmissions, F(2, 22) = 6.17, in the BL condition than in either BAC or BANC in the Arrival/Feeder sector, but the number of transmissions did not differ across conditions in the Departure/Airport Departure sector (see Figure 7-19).
0
50
100
150
200
250
300
350
BL BAC BANC
Sector x Condition
Mea
n N
umbe
r of T
x
Arrival
Departure
Figure 7-19. Mean number of terminal ground-air transmissions by Sector and Condition.
7-28

The number of ground-air transmissions that participants made in the first interval (mean = 39, SD = 12.45) was lower, F(3, 33) = 88.03, than that made in the second (mean = 58.6, SD = 16.15), third (mean = 55.4, SD = 20.22), or fourth (mean = 51.4, SD = 16.9) intervals. The number of transmissions in the second interval was also significantly greater than the number made in the fourth.
7.3.2.3 Face-to-Face Communication The team examined the number and type of communications that en route and terminal participants made between each other in the BAC condition when they had the opportunity to directly interact. On average, relatively few interactions were observed, but this varied across participants. Overall, terminal participants initiated more glances and verbal communications than the en route participants. The participants working the Arrival Transition and Feeder sectors initiated a greater number of glances and verbal communications than those working the Departure Transition and Airport Departure sectors. It is likely that some of the differences observed in the number of participant interactions were due to differences in the perceived difficulty between the Arrival Transition and Feeder sectors and the Departure Transition and Airport Departure sectors. However, the laboratory configuration was also likely to have influenced interactions. The BAASS and Feeder sectors were placed side by side, but, due to room constraints, the GRUPR and Airport Departure sectors were not located adjacent to one another. Therefore, position layout may have influenced the way in which the participants interacted. In the final debrief, the participants commented that the related sectors should be placed in close proximity to maximize benefits.
7.3.3 ATC Observer Rating Form The SMEs evaluated the participants’ performance in each of the scenarios using 8-point rating scales, from least effective (1) to most effective (8), on the ORF. Additional questions pertained to the frequency of occurrence of problematic events, such as issuing clearances earlier or later than appropriate. These questions used a 5-point rating scale where 1 indicated that an event was never observed, 3 indicated that an event occurred but did so within normal limits of operational acceptability, and 5 indicated that an event was observed unacceptably often. One SME provided ratings for participants working the en route/transitional sectors, and another provided ratings for participants working the terminal/near-airport sectors. The HITL Team analyzed the ratings separately for each group and evaluated whether ratings differed significantly by sector and condition.
7.3.3.1 En Route Participant Observer Ratings The observer rated the en route participants’ task performance as very effective, with mean ratings over 6.5 in each category (and standard deviations close to 1). Overall, when significant differences were found, they indicated that performance was perceived to be better in the BA condition in the GRUPR sector.
7-29

Most of the ratings about the frequency of occurrence of problematic events were low, with mean ratings typically at or below 2. Only a small number (less than 5 percent) of the individual ratings were 4’s or 5’s. Most (80 percent) of those high ratings were given in the BL condition. The team found significant differences in these ratings on four of the eight tasks. In the BL condition, the observer noted difficulties in sequencing aircraft, having room to vector aircraft, and keeping up with the pace of traffic once the weather impacted the BAASS sector. The observer also noted the use of some holding and some late descents and missed handoffs for this condition and sector. In addition, the observer noted fewer problems for the GRUPR sector and fewer negative comments about performance in the BA conditions. Comments on those conditions indicated that use of speeds was effective and that there was generally a “smoother” flow of traffic than in the BL condition. Only three negative comments were noted in the BA conditions, in which participants were observed to have done considerable vectoring in the BAASS sector or allowed traffic to become compressed into the Feeder sector.
7.3.3.2 Terminal Participant Observer Ratings Overall, the observer ratings for the terminal participants were very high with average ratings of 7.8 or higher (and standard deviations less than .6). There was little to no variability across the test conditions, which made it impossible to analyze the data statistically. The team also found very little variability for the frequency of occurrence ratings. Most of these ratings were very low, indicating that the observer rarely saw problematic instances. Mean ratings were between 1.0 and 1.2 (and standard deviations between .17 and .4) for each of these variables.
7.3.4 WAK Ratings
The team analyzed the WAK ratings separately for the en route and terminal participants. They coded any instances in which participants did not respond as missing data and included the mean rating obtained for an interval in that cell so that they would not have to drop data from the analysis.3 The team chose to do this rather than to assign the highest workload rating of 10 in instances in which participants did not respond because they could not be certain why they did not do so. The participant may have been very busy, but he/she may simply have been occupied with another task (e.g., making a call) that diverted his/her attention from the WAK prompt. The team prompted each R-side participant for a response every 4 minutes throughout the 50-minute scenarios (a total of 12 prompts) and took an average of those responses to obtain an overall WAK rating for each individual.
3 In a repeated measures design, all data for a participant are omitted from the analysis when one or more cells contain missing data. Because the participants had 144 opportunities to respond to the WAK prompt across all of test scenarios, it was likely that there would be at least one missed response. The HITL Team employed the mean substitution procedure (e.g., Tabachnick & Fidell, 1989) to analyze these data.
7-30

7.3.4.1 En Route Participant WAK Ratings
For the en route participants, WAK ratings were in the low to moderate range, but were highly variable. Average ratings were 3.8 (SD = 2.66), 3.5 (SD = 3.08), and 3.6 (SD = 3.06) for the BL, BAC, and BANC conditions, respectively, but did not differ significantly. However, the participants reported higher workload, F(1, 11) = 17.51, when working the BAASS sector (mean rating = 4.1, SD = 3.85) than when working the GRUPR sector (mean rating = 3.12, SD = 3.52). To examine workload across the weather intervals, the HITL Team averaged the three individual ratings in each interval to obtain an overall interval workload rating. The team found that average workload ratings were higher, F(2.7, 29.5) = 5.52, in the last two intervals in the BL condition than in BAC and BANC (see Figure 7-20). The last two intervals included the workload ratings made after dynamic resectorization in the BA conditions.
1
2
3
4
5
6
7
8
9
10
1 2 3 4
Interval
Mea
n W
AK
Rat
ing
BL
BAC
BANC
Figure 7-20. Mean en route participant WAK ratings by Condition and Interval. The team also found that average workload levels increased, F(3, 33) = 20.29, across intervals in the BAASS sector, but did not increase similarly in the GRUPR sector (see Figure 7-21). Each of the successive means was significantly higher than the previous one in the BAASS sector, but only the first interval rating was significantly lower than each of the other ratings in the GRUPR sector.
7-31

1
2
3
4
5
6
7
8
9
10
1 2 3 4
Sector x Interval
Mea
n W
AK
Rat
ing
BAASSGRUPR
Figure 7-21. Mean en route participant WAK ratings by Sector and Interval.
7.3.4.2 Terminal Participant WAK Ratings Terminal participant WAK ratings were low overall, with average ratings about 3 or less. WAK ratings were higher, F(1.3, 14.5) = 7.38, for BL (mean = 2.7, SD = 3.13) than for either BAC (mean = 2.4, SD = 2.36) or BANC (mean = 2.3, SD = 2.29). This difference was probably related to the larger sector sizes in BL. WAK ratings were also higher, F(1, 11) = 31.63, in the Arrival/Feeder sector (mean = 3.3, SD = 4.76) than in the Departure/Airport Departure sector (mean = 1.66, SD = 1.64). Terminal participant WAK ratings were lower, F(1.2, 13.6) = 2.79, in the first interval than in any of the others for all conditions, but were also higher in the third interval than in the second in BAC (see Figure 7-22). In the second interval, WAK ratings were higher in BL than in either BAC or BANC; and in the third interval, WAK ratings were higher in BL than in BANC.
1
2
3
4
5
6
7
8
9
10
1 2 3 4
Condition x Interval
Mea
n W
ak R
atin
g
BL
BAC
BANC
Figure 7-22. Mean terminal participant WAK ratings by Condition and Interval.
7-32

WAK ratings also increased, F(1.3, 14.2)=12.6, across intervals more in the Arrival/Feeder sector than in the Departure/Airport Departure sector (see Figure 7-23). In the Arrival/Feeder sector, the first interval ratings were lower than ratings in the other intervals, and ratings in the last interval were also higher than those in the second. In the Departure/Airport Departure sector, WAK ratings differed significantly only between the first interval and the second and third intervals.
1
2
3
4
5
6
7
8
9
10
1 2 3 4
Sector x Interval
Mea
n W
AK
Rat
ing
Arrival
Departure
Figure 7-23. Mean terminal participant WAK ratings by Sector and Interval.
7.3.5 Post-Scenario Questionnaire
Items on the PSQ-1 used 10-point rating scales (1 = poor or extremely low; 10 = excellent or extremely high). The HITL Team analyzed each item on the PSQ-1 separately for the en route and terminal participants and also analyzed the data for the R-side and D-side (or handoff) positions separately.
7.3.5.1 En Route Post-Scenario Questionnaire 1 Ratings of ATC performance were fairly high overall, with average ratings above 7. The R-side participants rated their performance higher, F(2, 20) = 4.26, in BAC (mean = 7.9, SD = 1.39) than in BL (mean = 7.2, SD = 1.56). They also rated their performance higher, F(1, 10) = 7.5, in the GRUPR sector (mean = 8.1, SD = 1.4) than in the BAASS sector (mean = 7.2, SD = 2.04). The D-side participants rated their performance lowest, F(2, 22) = 8.22, in the BAASS sector in the BL condition (see Figure 7-24).
7-33

1
2
3
4
5
6
7
8
9
10
BL BAC BANC
Sector x Condition
Mea
n R
atin
g
BAASS
GRUPR
Figure 7-24. D-side participant ratings of ATC performance Four of the PSQ-1 items pertained to situation awareness. These included overall situation awareness, situation awareness for current aircraft locations, situation awareness for projected aircraft locations, and situation awareness for potential loss of separation. In general, when the team found significant differences in these ratings, they favored the BA conditions and the GRUPR sector. The R-side participants rated their overall situation awareness higher, F(1, 11) = 9.9, in the GRUPR sector (mean = 8.3, SD = 1.4) than in the BAASS sector (mean = 7.19, SD = 2.13). The D-side participants rated their overall situation awareness higher, F(2 ,22) = 4.86, in BANC (mean = 8.5, SD = .93) than in BL (mean = 7.9, SD= .8), neither of which differed from BAC (mean = 8.4, SD = 1.2). The R-side participants rated their situation awareness for current aircraft locations higher, F(2, 22) = 6.62, in BAC (mean = 8.0, SD = 1.22) and BANC (mean = 8.0, SD = 1.36), than in BL (mean = 7.1, SD = 1.67). They also rated this variable higher, F(2, 22) = 6.91, in the GRUPR sector (mean = 8.2, SD = 1.44) than in the BAASS sector (mean = 7.2, SD = 2.15). There were no significant differences found for the D-side participants on this variable. The R-side participant ratings of situation awareness for projected aircraft locations varied by condition and sector, F(2, 22) = 4.42. In the BAASS sector, ratings were higher in BAC than in BL. In the GRUPR sector, the ratings did not differ between conditions (see Figure 7-25). The team also found this result for the D-side participants.
7-34

1
2
3
4
5
6
7
8
9
10
BL BAC BANC
Sector x Condition
Mea
n R
atin
gBAASS
GRUPR
Figure 7-25. R-side participant ratings for situation awareness for projected aircraft locations.
Both the R-side and D-side participants rated situation awareness for potential loss of separation higher, F(1.26, 13.84) = 8.88, and F(2, 22) = 6.34, respectively, in the BA conditions than in BL (see Figure 7-26).
1
2
3
4
5
6
7
8
9
10
1
Condition
Mea
n R
atin
g
BL BAC BANC1
2
3
4
5
6
7
8
9
10
1
Condition
Mea
n R
atin
g
BL BAC BANC
Figure 7-26. Situation awareness for potential loss of separation for R-side (left) and D-side (right) participants by Condition.
Workload ratings due to ground-ground communications for D-side participants were higher, F(2, 22) = 3.89, in BL (mean = 5.0, SD = 2.6) than in BAC (mean = 3.7, SD = 2.75), but neither differed from BANC (mean = 4.3, SD = 2.56). These workload ratings were also higher, F(1, 11) = 4.98, in the BAASS sector (mean = 5.2, SD = 3.71) than in the GRUPR sector (mean = 3.5, SD = 3.5). Both the R-side and D-side participants rated their overall workload higher, F(2, 22) = 8.93, and F(2, 22) =5.04, respectively, in BL than in BAC. For the R-side, the HITL Team also found higher ratings in BL than in BANC (see Figure 7-27).
7-35

1
2
3
4
5
6
7
8
9
10
1
Condition
Mea
n R
atin
g
BL BAC BANC1
2
3
4
5
6
7
8
9
10
1
Condition
Mea
n R
atin
g
BL BAC BANC
Figure 7-27. Overall workload ratings for R-side (left) and D-side (right) participants by
Condition.
The R-side and D-side participants also rated their overall workload higher, F(1, 11) = 27.78 and F(1, 11) = 18.27, respectively, in the BAASS sector (R-side mean = 8.5, SD = 1.83; D-side mean = 6.9, SD = 2.75) than in the GRUPR sector (R-side mean = 6.7, SD = 2.12; D-side mean = 5.0, SD = 3.16). The team administered three other PSQ-1 items to R-side participants only. They rated their ability to move aircraft through a sector higher, F(1.1, 12.3) = 16.43, in both BAC (mean = 8.4, SD = 1.76) and BANC (mean = 8.5, SD = 1.26) than in BL (mean = 6.7, SD = 1.49). They also rated workload due to air-ground transmissions higher, F(1, 11) = 7.38, in the BAASS sector (mean = 7.8, SD = 2.11) than in the GRUPR sector (mean = 6.1, SD = 4.26), and rated pilot performance higher, F(1, 11) = 9.5, in the GRUPR sector (mean = 8.3, SD = 1.77) than in the BAASS sector (mean = 7.8, SD = 1.71).
7.3.5.2 Terminal Post-Scenario Questionnaire 1 The HITL Team conducted the same analyses for terminal participants as it did for en route participants. The ratings of ATC performance were high, with averages over 7.5. The R-side and handoff participants rated their performance higher, F(1, 11) = 8.55, and F(1, 11) = 9.16, respectively, in the Departure/Airport Departure sector (R-side mean = 8.6, SD = 1.27; (handoff mean = 8.7, SD = 1.98) than in the Arrival/Feeder sector (R-side mean = 7.6, SD = 1.78; handoff mean = 8.2, SD = 1.80). There were no significant differences for overall situation awareness and situational awareness for potential loss of separation for either the R-side or handoff positions. There were also no significant effects for the R-side participants on ratings of situation awareness for current aircraft locations. However, those working the handoff position rated that variable higher, F(1, 11) = 12.69, in the Departure/Airport Departure sector (mean = 8.7, SD = 1.57) than in the Arrival/Feeder sector (mean = 8.31, SD =1.36). The R-side participants rated their situation awareness of projected aircraft locations higher, F(2, 22) = 4.89, in both BAC (mean = 8.3, SD = 1.61) and BANC (mean = 8.3, SD = 1.26) than in BL (mean = 7.8, SD = 1.33). The handoff participants rated their awareness higher, F(1, 11) = 9.78,
7-36

in the departure/airport departure sector (mean = 8.6, SD = 1.94) than in the Arrival/Feeder sector (mean = 8.0, SD = 1.53). Workload ratings due to ground-ground communications were highly variable. The R-side and handoff participants rated workload due to ground-ground communications higher, F(1, 11) = 6.73 and F(1, 11) = 5.08, respectively, in the Arrival/Feeder sector (R-side mean = 4.4, SD = 4.9; handoff mean = 3.2, SD = 3.51) than in the Departure/Airport Departure sector (R-side mean = 2.7, SD = 2.79; handoff mean = 2.1; SD = 1.96). Both the R-side and handoff participants also rated overall workload higher, F(1, 10) = 23.26, and F(1, 11) = 14.35, respectively, in the Arrival/Feeder sector (R-side mean = 6.2, SD = 3.08; handoff mean = 4.7, SD = 3.15) than in the Departure/Airport Departure sector (R-side mean = 3.2, SD = 2.49; handoff mean = 2.4, SD = 2.47). The three other PSQ-1 items pertained only to R-side participants. They rated their ability to move aircraft through the sector higher, F(1, 11) = 5.18, in the Departure/Airport Departure sector (mean= 8.6, SD = 1.51) than in the Arrival/Feeder (mean = 7.9, SD = 1.75), and their air-ground communication higher, F(1, 11) = 12.85, in the Arrival/Feeder sector (mean = 5.9, SD = 2.93) than in the Departure/Airport Departure sector (mean = 3.9, SD = 3.39). There was no difference in ratings of simulation pilot performance.
7.3.5.3 Post-Scenario Questionnaire 2 The HITL Team administered an additional questionnaire following completion of the BAC and BANC scenarios to allow participants to respond more specifically to the effect of the procedures used in these conditions compared to BL. These ratings were made on 9-point scales, in which a rating of 1 indicated a very negative effect, a rating of 9 indicated a very positive effect, and a rating of 5 indicated no effect. The team conducted a 2 (Sector) X 2 (Condition) repeated measures ANOVA to determine if there were any significant differences. Overall, en route R-side participants rated the effect of reduced lateral separation on their ability to control traffic as very positive, with mean ratings of about 8 overall. The ratings were higher, F(1, 11) = 6.49, in the BAASS sector (mean = 8.2, SD = 1.30) than in the GRUPR sector (mean = 7.9, SD = 1.59). There were no significant differences for D-sides. The participants also rated somewhat positively (average ratings over 6.5) the effect of using other terminal procedures on the ability to control traffic. There were no significant differences for R-side or D-side participants on this rating. Both the R-side and D-side participants rated the effect of dynamic sector boundaries on their ability to control traffic higher, F(1, 11) = 8.09 and F(1, 11) = 20.47, respectively, in the BAASS sector (R-side mean = 7.1, SD = 2.04; D-side mean 7.4, SD = 2.0) than in the GRUPR sector (R-side mean = 5.5, SD = 1.77; D-side mean = 5.5, SD = 1.69). This indicated that the dynamic sector boundary had a positive effect for the BAASS sector—the sector that received the airspace—but did not negatively affect the GRUPR sector. The R-side participants rated the effect of increasing RNAV routes on their ability to control traffic higher, F(1, 11) = 5.05, in the GRUPR sector (mean = 6.8, SD = 2.0) than in the BAASS
7-37

sector (mean = 5.4, SD = 2.7). For the D-side participants, the interaction of sector X condition was significant, F(1, 10) = 5.4. The post hoc tests were not significant; the mean ratings were about the same in BAC (mean = 5.4, SD = .85) and BANC (mean = 5.7, SD = 1.4) in the BAASS sector, but were somewhat higher in BAC (mean = 6.1, SD = 1.65) than in BANC (mean = 5.6, SD = 1.5) in the GRUPR sector. The HITL Team also administered this questionnaire to terminal participants. However, their responses on these measures were much less variable (means between 5.3 and 5.8 and standard deviations of about 1), and the team obtained no significant results. This is not surprising because terminal participants did not directly experience changes to their normal work procedures in the BA conditions.
7.3.6 Post-Experiment Questionnaire At the end of the simulation, each group of participants completed the PEQ and participated in a final debriefing session to discuss reactions to the BA concept and provide additional comments about the feasibility of its implementation. Two of the questions on the PEQ asked participants to rate what effect, if any, the BA conditions had on their control strategies compared to the BL condition. Those questions used 9-point scales, with a rating of 1 indicating a highly negative effect, a 9 indicating a highly positive effect, and a 5 indicating no effect. The en route participants indicated that, compared to BL, the BANC and BAC conditions would have a positive effect on control strategies, with averages of 7.1 (SD=1.73) and 7.5 (SD=1.57) respectively. The terminal participants indicated that the BANC would have a slightly positive effect (mean = 5.7, SD = 1.42) on control strategies, while they rated the BAC as having a more positive effect (mean = 6.9, SD = 1.68). The difference between the participant ratings is not surprising given that participants who worked the en route/transitional airspace experienced the effect of changing separation strategies and procedures between the test conditions. Their comments indicated that using reduced lateral separation and having the ability to dynamically resectorize the airspace in the BA conditions allowed more room to maneuver aircraft and resulted in more efficient flows of aircraft to the airport. Terminal participants, while still positive, included a few negative comments in their responses. Those comments primarily focused on the more limited airspace available in the BA conditions, which caused the final sequence to be essentially set after the aircraft entered the lower altitude sector and produced some increase in complexity because there was less room to maneuver the aircraft. Two other questions on the PEQ asked participants to rate the extent to which communication strategies were affected by the BA conditions compared to BL. These questions used a 10-point scale, with a rating of 1 indicating that communication was not affected at all, and a rating of 10 indicating that communication was affected a great deal. Compared to BL, the participants rated the BANC condition as having only a moderate effect on communication. Average ratings were 4.4 (SD = 1.96) and 4.3 (SD = 2.57) for the en route and terminal participants, respectively. The ratings were higher for the BAC condition. En route participants rated its effect on communication an average of 5.3 (SD = 3.32), and terminal
7-38
participants rated it substantially higher, with an average rating of 6.8 (SD = 2.63). The participants’ comments identified benefits of face-to-face communication. In general, they commented that the combined control room fostered a more cooperative work environment, though individuals differed regarding how much they took advantage of being in close proximity to one another in the simulation. Some participants moved around the room to coordinate with others or to view traffic on other displays. One participant, when working the Feeder handoff position, sat between the Feeder and arrival transition radar positions and acted much like a multi-sector planner. The comments typically indicated that being able to see and hear the other participants and view their displays helped participants assess how busy the other participants were. It also enabled them to see the traffic that would be entering a sector, so they could plan and make decisions earlier. One participant commented: “It allowed me to function better as an integrated team member.” Some participants who did not take as much advantage of the combined control room during the simulation thought it might take time to get accustomed to working that way. One participant indicated that he “went over to the other side only once as a novelty, but still called on the landline for communications.” Another said: “In time, as controllers grow more accustomed to this ‘condition,’ they would coordinate better.” The participants were also asked to indicate the most highly positive and negative aspects of the BA concept. Most participants cited benefits, including the increased sector capacity enabled by the reduced separation standards and use of terminal procedures (“3-mile separation gives you more room to move aircraft”); enhanced communication, coordination, and cooperation in the combined control room environment (“increased team concept”); increased use of RNAV routes (“RNAV routes for arrivals are the way to go”); and dynamic resectorization (“being able to take control of the airspace you need is much easier and safer than ‘borrowing’ it”). The participants made only a few negative comments about the concept. One comment indicated that having more room to move aircraft could potentially result in sector saturation and lead to an unsafe environment. Another indicated that the workload would simply shift from one sector to another. Other comments indicated that the airspace would have to be worked by highly cooperative and skilled controllers, and that a third person or coordinator would be needed to manage the traffic between the Arrival Transition and Feeder sectors. Finally, the HITL Team included questions on the PEQ that pertained to simulation and equipment realism. These questions used 10-point rating scales, with a rating of 1 being extremely unrealistic and 10 extremely realistic. The average responses indicated that these aspects of the simulation were fairly realistic. The mean rating of the overall simulation realism was 6.4 (SD = 1.53); the realism of the simulation hardware was 6.1 (SD = 1.75); the realism of the simulation software was 5.7 (SD = 1.81); and the realism of the traffic scenarios was 6.5 (SD = 1.91). The participants also indicated that the WAK online workload rating did not interfere with their control of traffic (mean = 1.8, SD = .85 on a 10-point scale, with 1 indicating that the WAK did not interfere at all and 10 indicating that it interfered a great deal). In the final debrief, the team asked participants to provide additional comments, including any display enhancements or procedures that would be necessary to implement the BA concept in the field. Most participants responded that the J-ring or Continuous Range Readout function would provide sufficient spacing guidance regardless of the separation required; however, one
7-39

participant commented that having a clear indication of heavy aircraft would be essential when 3 nm separation is in effect. There were mixed responses regarding the ease of working different sectors that use different separation standards. A few who responded reported that they would find it difficult to work a position with one standard and then move to another position that required a different separation minimum. However, others responded that it would be a relatively easy transition. One participant reported that while transitioning between 3 nm and 5 nm would not be an issue in itself, knowing when other terminal procedures (e.g., diverging courses) were in use could be problematic without additional cues. Other comments stressed the benefits of having high/low altitude sectors located side by side to better enhance coordination. In the simulation, the high and low altitude arrival sectors were located adjacent to one another, but the departure sectors were not similarly configured due to constraints in the laboratory. Most participants reported that it would be important for those working the higher and lower altitude sectors to be trained similarly and to use the same equipment. Most of those who commented during the debrief indicated that dynamic resectorization would not be a problem because controllers in busy facilities are already familiar with combining and de-combining sectors in the field and because the controllers involved in resectorization are not coming in “cold.” They are aware of the traffic in the affected sectors before resectorization, so they need minimal debriefing.
7.4 Summary: HITL Simulation Results Overall, the HITL simulation results provided support for the BA concept. The aircraft moved through the Arrival Transition and Feeder sectors more efficiently in the BA conditions than through the en route and terminal arrival sectors in BL. The participants working those sectors made fewer ground-ground transmissions and issued fewer altitude and heading clearances in the BA condition. The ghost controllers also provided less assistance in holding or maneuvering aircraft outside of the arrival transition airspace in BA. Few operational errors were observed, and their numbers did not differ across conditions. Many of the subjective measures also indicated support for the concept. The en route participant WAK ratings were lower in the second half of the scenarios in BA than in BL, indicating that it was easier to manage traffic after dynamic resectorization. The SMEs rated most of the en route participant performance measures higher and noted fewer problems in the BA conditions than BL. Participant ratings of performance, situation awareness, and ability to move traffic through the sector were among the other measures that were also higher in BA. The comments obtained during the debriefing sessions indicated that the BA procedures were beneficial and that a combined control facility would promote more effective communication and coordination, though there was wide variation in the extent to which participants actually used face-to-face interactions in the combined condition. No special modifications in equipment or automation were cited as necessary for implementation, though a couple of comments indicated that controllers would need to have an indication provided as to when other terminal procedures (e.g., diverging courses) are in use and to identify a heavy aircraft when 3 nm separation standards are in effect.
7-40

8 SIMULATION RESULTS COMPARISON Table 8-1 summarizes the results in terms of user and FAA benefits from the FT, HPM, and HITL simulation studies. From the user perspective, BA showed promise in time and distance flown, flow optimization, and delay. According to the FT simulation results, aircraft in the BA condition flew less distance overall with less air delay. In the HITL simulation, aircraft spent less time and flew shorter distances in the arrival sectors with BA operations. Controller participants used more speed control, thus, generally reducing the number of altitude and heading clearances during BA operations. Also, ghost controllers held less aircraft during BA operations, indicating benefits to sectors external to the simulated airspace. Holding within the simulated sectors was not affected by test condition. Whereas the FT and HITL simulations found no differences in throughput for BA and BL conditions, the HPM simulation found that controllers could handle more aircraft before hitting an overload point in BA as compared to BL. From the FAA perspective, BA had a positive impact on several task performance measures. The hypothesis that less coordination would be required in BA operations was validated by several communications analysis results. As compared to BL, controllers made less ground-ground communications in the arrival sectors during BA, and less air-ground communications in the departure transition sector and feeder sector in BA. However, they made more air-ground communications in the arrival transition sector during BA operations. This was likely attributed to the increased size of this sector in BA conditions, the increased use of speed control over heading and altitude changes, as well as the effects of resectorization, particularly, acquiring an additional arrival route in that sector. In the HPM simulation, controllers aborted fewer tasks during BA operations, which indicated they could more effectively manage the tasks as compared to BL. Although controller workload results varied somewhat across different test conditions (see Table 8-1), overall, the results were positive for BA. In both BL and BA conditions, workload increased as simulation scenarios progressed; however, once dynamic resectorization occurred in BA, workload ratings decreased. The HPM simulation found that by using BA control methods alone, controllers could handle up to 50 percent more traffic in total with about the same workload levels as in baseline traffic conditions. If data communications were used for clearances and transfer of control tasks under the BA concept, the model suggested that controllers could handle about 100 percent more traffic, and up to 150 percent before the workload started to degrade performance. This model also found that BA procedures enabled controllers to successfully complete tasks without interruption, which provides another indication of lower workload in the BA condition. The HITL simulation was the only analysis technique that provided a means of addressing situational awareness and controller acceptance associated with BA, both of which showed positive results. Of the variety of situational awareness measures that the HITL Team collected, those that were significant favored one or both of the BA conditions (i.e., BAC, BANC). In general, controller participants favored the BA concept, particularly those working the ARR/DEP transition sectors. In terms of safety measures, few losses of separation occurred in the HITL simulation, and no significant differences were observed between BL and BA conditions. It is typical in HITL
8-1

simulations not to see many operational errors, as the length of the scenarios is relatively short in duration and the scope of the airspace is often relatively small. The FT simulation, however, typically uses a larger traffic sample and looks at a larger piece of airspace. The FT simulation of BA generated a related measure to operational errors (i.e., number of conflicts), which showed a smaller number of conflicts in the BA condition.
Table 8-1. Summary of Simulation Results
INTEGRATED ARRIVAL/DEPARTURE
SERVICE FAST-TIME REAL-TIME
System Performance Human Performance Human-in-the-Loop
Notes Included
• TMA • Wx & No Wx
Included
• TMA • Wx & No Wx • DL & No DL
Included
• Wx only • Combined & Not
Combined Control Rooms
* All results reported below are statistically significant at p<.05, unless stated otherwise
USER BENEFITS
Time & Distance in Sector Sector level data was not gathered.
n/a Less in BA than BL in arrival corridor.
Throughput No differences between BA & BL.
More aircraft handled in BA before overload as compared to BL.
No differences between BA & BL.
Flow Optimization Less distance flown overall in BA.
n/a Fewer altitude clearances in BA and fewer heading clearances in BANC compared to BL. Used more speed control in BA.
Less time & distance in arrival sectors with BA.
Delay Less air delay in BA. (Air delay = Total Flight Time – Nominal Flight Time)
n/a Less holding and less assistance provided by ghost controllers in BA than BL.
8-2

FAA BENEFITS
Task Performance n/a Less tasks aborted, or activities interrupted, in BA
Less ground-ground communication in BA in Transition Arrival and Feeder sectors.
Less air-ground communication in departure transition sector & feeder sector in BA
More air-ground communication in arrival
Workload n/a Overall workload lower in BA than in BL.
Increased in specific sectors in both BL and BA conditions depending on Wx and traffic load.
Introducing DL decreased workload associated with communications and cognition in both BL and BA. More benefit in BA.
Terminal participant workload was lower in BA.
En route participant workload increased as scenario progressed in both BA and BL conditions until dynamic resectorization occurred, then workload was lower in BA than BL.
Observers gave higher ratings for task effectiveness in BA and reported more problematic events in en route arrival sector in BL
Situational Awareness n/a n/a When significant differences were found, participants favored one or both of the BA conditions.
Safety Conflict count lower in BA.
No operational errors observed in the simulation.
No differences between BA & BL.
Controller Acceptance n/a n/a Favorable towards BA – more so from en route participants.
8-3

9 FACILITY CONSOLIDATION ANALYSIS A review of current and future air traffic control facilities plans was conducted to determine the impact that this concept could have on ongoing studies of future facilities. This review also influenced assumptions regarding facility costs for the Rough Order of Magnitude (ROM) cost estimate. The facilities impact is dependent on the decision made regarding a combined control facility. The HITL simulation showed that both the combined and separate control room options for integrated arrival and departure airspace result in user and FAA benefits. Controller activities and comments, however, indicated potential added benefits from working together in a combined control environment. During the simulations, controllers were observed communicating and glancing at the displays of other controllers in the other control environment. Post-experiment questionnaires revealed that controllers felt the combined control environment enhanced communication. Additional benefits from a combined facility might be observed once controllers have more experience working proximate to each other and develop improved coordination methods that a combined control room affords. In addition, traffic management experts suggest that the success of implementing key BA operational improvements, such as Dynamic Airspace Reconfiguration, may be dependent on an integrated Traffic Management Unit in order to expedite dynamic route changes. A detailed airspace analysis would be needed to capture the true dependency and benefits of a combined control BA facility. In the simulations conducted for concept validation, the airspace design moved the boundary for final arrival and airport departure sectors closer to the airport. This reduced the amount of feeder and airport departure airspace and increased the size of the arrival and departure transition airspace. This shift in boundaries could in itself predicate the need for at least some reallocation of airspace between current terminal and en route facilities. Lastly, results from a detailed airspace analysis would provide the necessary inputs for a detailed staffing plan that could show staffing cost savings associated with a combined control facility. For the purposes of the facility review and in keeping with the NextGen concept, it was assumed that a combined control room option would be pursued. As the BA concept pertains to managing arrival/departure airspace in major metropolitan areas, existing facilities in major metropolitan areas were considered first. Many ARTCCs still have the space available that used to be occupied by the old M-1 control rooms, which were vacated when the facilities transitioned to DSR. Some facilities have rehabilitated this space for administrative purposes. However, all of the ARTCCs are located in old buildings that are reaching their end of life and are in need of substantial refurbishment or replacement. Conversely, new large TRACON buildings have been built in the last 15 years in the majority of major metropolitan areas, including northern California; southern California; Chicago; Washington, DC; and Atlanta. Many, if not all, of these facilities still have space available for additional operational positions given some level of space reconfiguration. As it clearly would not make economic sense to make major renovations to an old facility and abandon a relatively modern facility, a BA combined control room at ARTCCs was not considered further for purposes of ROM cost estimating. The initial task direction for the BA concept validation was to examine whether the concept would benefit the eight major metropolitan areas, which at the time were New York,
9-1

Philadelphia, Baltimore/Washington, Chicago, Atlanta, central Florida, northern California, and southern California. A cursory airspace analysis was conducted for these sites based only on distance from the major airport in the area. This analysis, as well as an analysis of the interaction in existing traffic flows, concluded that a separate integrated arrival and departure facility for Philadelphia could not be accomplished because the arrival and departure airspace needed to implement the BA concept overlapped with the airspace needed for New York and Baltimore/Washington, DC. That left four options for control of the Philadelphia arrival and departure airspace: leave it as a standalone TRACON underneath the New York and Baltimore/Washington BA; split the airspace up and transition the north, east, and west flows to the New York BA and the south flows to the Baltimore/Washington BA; give control entirely to New York BA or give control entirely to Baltimore/Washington BA. A detailed site-specific airspace study would be needed to determine which option would be optimal. Based on information and opinions received from individuals knowledgeable about the traffic flow interactions in the Northeast, it was assumed that 75 percent of the Philadelphia arrival and departure flows would be handled by New York and 25 percent by Baltimore/Washington for the purposes of this analysis. This decreased the number of facilities considered in this analysis to seven. New large TRACON facilities exist in five of the seven metro areas. In the two metropolitan areas where a new large TRACON does not exist (New York and central Florida), it was assumed that a new facility would need to be built. For each of the seven potential BA facilities, an estimate was done of the total number of operational positions required. This estimate included the current number of TRACON positions, the number of planned terminal additions to handle new airport expansion projects and announced collocation and consolidation plans, and the total number of ARTCC and existing small TRACON positions that would be combined into the facility to support the BA concept. For the en route and small TRACON position estimates, a cursory airspace analysis was conducted that assumed any low altitude en route sector within a 100 nm radius of the major airport would be included as well as any standalone TRACONs within that airspace. In some cases, where the existing TRACON was on the boundary of the BA area, it was assumed that a percentage of the airspace and traffic would be controlled by the BA facility. In the most likely case, it was assumed that airspace consolidation would lead to some reduction in the total number of current sectors, which was estimated as a 20 percent reduction in the number of sectors moved from en route and small TRACONs to the BA facility. This reduction is based on analogy to previous experience with TRACON consolidation. This analysis led to a total estimate of the number of operational positions (radar and assist/handoff) at each BA facility. The average number of total operational positions was 96, but there was a large standard deviation. The number of net additional operational positions added to the existing TRACON count was also extremely varied, ranging from 12 to 69. The higher numbers are associated with areas of the country where additional TRACON consolidation would be needed to implement the BA concept. In areas of the country where there has already been a great deal of terminal airspace consolidation, such as northern California, the number of additional positions needed would be quite small. The largest estimate for the total BA facility was over 130 operational positions for southern California. This facility currently has 112 radar and assist/handoff positions. When the BA site
9-2

visits were conducted, the information provided by the Southern California TRACON (SCT) staff was that there was enough physical room at the facility for twice the number of current operational positions. As there has been some standardization in constructing the large TRACON buildings, and as no BA facility was estimated to require more operational space than SCT, it was assumed that all the large TRACON buildings could accommodate the additional operational positions required for implementation of the BA concept. In major metropolitan areas that do not have a new large TRACON building, it was assumed that a new building would need to be built roughly the size of the current large TRACON design (95,000 square feet). If this concept moves forward, a detailed site survey would be needed to validate these assumptions. Based on the foregoing methodology, the number of en route sectors in the centers included in the analysis would likely be reduced by 17 percent to 35 percent (average 27 percent). It is assumed that the remaining airspace would be restructured and that the corresponding areas of specialization would be reconfigured to handle the reduced size of the airspace; therefore, a detailed plan for the remaining ARTCCs, including the facility impacts, in concert with pursuing the BA combined control room option, is necessary. This analysis concludes that the BA combined control facility option should not be examined unilaterally. It needs to be examined in concert with the ongoing Future Facilities study. Since new large TRACON buildings exist in most major metropolitan areas, it would be most economical to locate BA operations in these buildings, at least for an initial implementation of integrated arrival and departure airspace. Where new large TRACONs do not exist, new facilities are needed to house the integrated arrival/departure airspace. These facilities should be considered in the overall plan for General Service Delivery Points (GSDP), as described in the NextGen concept, that integrate operational domains (e.g., tower control, classic airspace, and trajectory based operations airspace). These GSDP facilities could also provide an economical solution for high altitude airspace restructuring that would be needed after implementing the BA concept. GSDP facility decisions should be made in consideration of moving toward this BA concept.
9-3

10 COST/BENEFIT ANALYSIS MCR performed the cost-benefit analysis of the BA concept based on inputs provided by Operations Planning (ATO-P), Terminal Services (ATO-T), En Route & Oceanic Services (ATO-E), System Operations Services (ATO-R), Technical Operations Services (ATO-W), and Finance (ATO-F), as well as data from the fast-time system performance simulation results. The ROM Cost-Benefit analysis was conducted to get some sense of how likely it would be for the BA concept to be cost effective for multiple major metropolitan areas. The ROM cost and benefits are based on creating seven BA facilities, covering eight major metropolitan areas—Atlanta; Baltimore/Washington, DC; central Florida; Chicago; New York City; northern California; Philadelphia; and southern California. Since this study is in the concept exploration phase, the cost analysis was based on general ground rules and assumptions developed for the concept itself; not on any detailed requirements or technical solutions. The benefits analysis was based on extrapolating results from the generic airspace fast-time simulations to other sites based on traffic forecasts and historical weather patterns at those sites, and not based on actual runway capacity, airport interactions, or current and potential BA airspace design for those locations. Therefore, the results of this analysis should only be used to reach a general conclusion about whether or not the BA concept is a valid concept and warrants more detailed study. These results should not be used for budget formulation or site prioritization. To this end—although cost and benefits were based on some top-level site characteristics—the names of sites are intentionally omitted. This analysis is based on a 10-year operational lifecycle that runs from 2015–2024. Although the operational life of both the airspace redesign and facilities and equipment will likely be much longer than 10 years, details for the final stages of the 2025 NextGen concept are yet to be defined. For example, it is not known whether research into advanced concepts and technologies will lead to changes in operational control strategies for Super Density Operations that would somewhat change the BA operational concept in 2025.
10.1 Cost Analysis The BA cost estimate is based on combining current ARTCC and TRACON personnel at BA facilities. The costs include new building construction or refurbishment; additional surveillance, communications, and automation equipment; technical and program management support personnel; air traffic controller training; airway facilities (AF) and air traffic (AT) personnel permanent change of station (PCS) costs; facilities maintenance; telecommunications; and utilities. AT and AF personnel operations salary costs and any cost-of-living adjustment that would be associated with relocation were not included in this study because sufficient information was not available in the concept exploration phase to conclude whether these costs would increase or decrease as a result of the BA concept.
10.1.1 Ground Rules and Assumptions The following ground rules and assumptions apply to the BA cost estimate:
10-1

• Costs are presented in risk-adjusted Base Year Fiscal Year (FY) 2007 Dollars (BY 2007$) and Then Year Dollars (TY$) for implementation of the concept at seven facilities controlling eight major metropolitan areas.
• Total lifecycle costs are for 15 years (5 Years Facilities and Equipment (F&E) and 10 Years Operations and Maintenance (O&M)).
• The life cycle cost period runs from Fiscal Years 2010–2024.
• Escalation rates are based on current Office of Management and Budget (OMB) Inflation rates.
• Airway Facilities and Air Traffic staffing costs are for permanent change of station (PCS) moves only with no change in salaries or cost-of-living adjustments. (Note: A separate staffing study based on a detailed site-specific airspace analysis would be needed to determine any change in controller staffing levels and costs.)
• Costs are included for all Controller PCS moves over 50 miles (50 percent for those 35–50 miles, 33 percent 10–34 miles).
• Controller backfill overtime labor costs (BFOT) are included for airspace and procedures training.
• No AF BFOT or training estimate is included at this time, but these costs are not expected to be significant enough to impact the overall results of the analysis.
• Facilities costs are included for new and refurbished facilities.
• Land and new building construction is included for two sites.
• Equipment costs are included for new Voice Switches, Displays (R- and D- Side), Surveillance Data Processing (SDP) Upgrades, Decision Support Tool and Flight Data Processing Controller Interfaces, and Remote Communications Air/Ground (RCAG) Radios at each location.
• Controller operational positions and square footage estimates are used for facility costs, facilities maintenance, and utility costs.
• Cost factors are based on prior Terminal Facilities Studies, TRACON Consolidation Cost Studies and actual expenditures from prior large TRACON Construction Projects
• The O&M estimate only includes net additional costs.
10.1.2 Work Breakdown Structure (WBS) A facilities WBS was used to develop the BA cost estimate. The major categories of the WBS are as follows:
• 2.0 Facility Costs
• 3.0 Equipment Costs
• 4.0 Technical Support
• 5.0 Program Management
10-2

• 6.0 ATC Training
• 7.0 AF Staffing (PCS)
• 8.0 AT Staffing (PCS)
• 9.0 Facilities Maintenance
• 10.0 Telecommunications
• 11.0 Utilities
10.1.3 Cost Estimating Methods and Data Sources This section provides a general description of the cost-estimating methods and data sources for the BA concept by WBS element. Appendix J provides detailed cost calculations for each element. 2.0 Facilities Costs: This cost element includes all activities associated with land acquisition and improvements, environmental impact studies, building design, new building construction, refurbishment of the existing facilities, and decommissioning of the new facilities at the end of the lifecycle. New building construction costs and refurbishment costs are based on historical costs per square foot. The costs are calculated based on the total number of square feet times the cost per square foot. For new building construction (two sites only), the total square feet was estimated at 95,000 each, which is expected to be large enough to house BA operations, but not for the larger GSDPs. This was based on similar sized buildings built for Potomac, northern California, and Atlanta (95,000, 95,000, and 90,000 square feet, respectively). The cost per square foot is based on the actual costs for northern California and Atlanta (escalated to FY 2007 dollars) because they are similar types of metropolitan areas as the proposed new building site locations. Refurbished buildings (five sites) are based on the total number of radar and assist/handoff control positions estimated for the site times 125 square feet per position, times the cost per square foot. The refurbishment cost per square foot is based on 20 percent of the average cost of new building construction. (See Section 9, BA Facility Consolidation Analysis, for a description of how some of the assumptions used in this estimate were derived.) The time phasing for facility costs is from FY2012–FY13. The total estimated facility cost is $94,813K (BY 2007$). 3.0 Equipment Costs: This cost element includes all automation, communication, surveillance, and controller workstation equipment required at the new BA facilities. This also includes the cost of developing some new ATC automation functions. Equipment costs are based on a variety of past experiences, expert judgment, and detailed cost estimates. The costs are calculated based on the quantity estimated as needed for each site location times the cost of the new equipment. The new equipment includes Voice Switches (140 positions, 139 frequencies, and 179 trunks), R- and D-Side Displays, and Remote Communications Air/Ground Radios (RCAG). For cost-estimating purposes, it was assumed that existing terminal automation systems, Common Automated Radar Terminal System (CARTS) and Standard Terminal Automation Replacement System (STARS), would form the basis of the initial BA automation system. The automation development and implementation cost associated with enabling expanded use of 3-mile separation standards was based on the assumption that data fusion would need to be developed
10-3

and implemented into existing terminal automation surveillance data processors. Controller tools were estimated based on the assumption that En Route Automation Modernization (ERAM) flight data and TMA meter list information would be generated at an adjacent en route facility and be provided to the BA facility via System-Wide Information Management (SWIM). The cost to augment CARTS and STARS to provide a means to display and provide an interface for controllers to edit this information was included in this estimate. The ability to display and a human interface to edit information from a departure metering tool was included in the BA estimate based on the assumption that a departure sequencing tool would exist. (See Section 12, Requirements Analysis, for a description of the requirement that drove some of the items included in the equipment estimate.) The time phasing for equipment costs is from FY2010–FY13. The total estimated equipment cost is $177,792K (BY 2007$). 4.0 Technical Support (including Systems Engineering): This cost element includes all activities associated with engineering design, systems engineering, logistics planning, and system testing at the BA facilities. It also includes the cost for airspace design studies and implementation plans. Costs are based on staff loading of engineering support personnel, expert judgment, and detailed cost estimates. Systems, logistics, and test planning costs are calculated based on a full-time equivalent (FTE) estimate multiplied by annual salaries. NAS implementation program telecommunications support costs are also estimated by this method. Research, engineering, design, and implementation studies include Airspace Design and Analysis; Airspace Environmental Modeling; Data Fusion 3 Mile Separation Alternatives Evaluation; Procedures and Training Development and Implementation Planning; Flight Data Management; SWIM and TMA Concept of Operations Requirements and Computer Human Interface (CHI) Prototyping; TFM Transition Strategy engineering and planning; and Airport Capacity Automation Distribution Evaluation. The time phasing for Technical Support is from FY2010–FY13. The total estimated Technical Support cost is $76,356K (BY 2007$). 5.0 Program Management: This cost element includes FAA headquarters program management personnel, field support, and contractor labor to support the program office activities. Costs are based on staff loading of FTEs for FAA headquarters and field personnel and support contractors. The costs are calculated based on the number of FTEs multiplied by average annual labor rates for FAA and contractor personnel. This WBS element also includes the cost to develop new Airspace Procedures documentation for the concept for each site. The time phasing for Program Management costs is from FY2010–FY14. The total estimated Program Management cost is $9,825K (BY 2007$). 6.0 ATC Training: This cost element includes all activities associated with ATC training and certification that would be needed to fully implement the concept. This cost is based on estimates for Backfill Overtime (BFOT) costs associated with training and certifying all controllers assigned to the BA facility in the new procedures and airspace, instructor training, simulation lab development, training materials, map study instruction, and course validation. The BFOT costs are calculated based on 260 hours of training per controller for area certification classroom (including new procedures, map drawings, and e-learning), Dynamic Simulation (DYSIM), and On-the-Job Training (OJT) for both BA Controllers and ARTCC Sector Airspace Retraining. The transfer of airspace from ARTCCs to BA facilities will require reconfiguration of en route airspace and will lead to a change in en route areas of specialization. The BA BFOT
10-4
cost estimate also includes costs to train and certify remaining ARTCC controllers in new sectors of airspace. Although it is likely that there would also be BFOT required for AF training for new technicians to maintain additional operational position equipment, additional automation functionality, and communications equipment, as well as the effort to transition activities—including dual operations for some period of time—this was not estimated because of a lack of information on both the type of training and level of effort required for these activities. ATC training costs are time phased from FY2013–FY14. The total estimated ATC Training Cost is $68,217K (BY 2007$). 7.0 AF Staffing (PCS): This cost element includes the PCS costs for all AF staff positions at BA facilities to support the additional new equipment. Positions may include Managers, Supervisors, Coordinators, System Specialists, Computer Specialists, Logistics Specialists, and Administrators. The cost was estimated using a cost-estimating relationship applied to the change in equipment quantity. It was assumed that all additional AF personnel would be relocated from an ARTCC. Costs are based on the number of eligible personnel times an average PCS cost. Eligibility is based on the change in distance between the new facility and old. Although relocated personnel may be eligible for a PCS move if the change in duty station is more than 10 miles, it was assumed that only a certain percentage of the staff would choose to move if the distance was less than 50 miles. Therefore, the eligibility percentages used were: 0-9 miles = 0 percent, 10–34 Miles = 33 percent, 35–49 Miles = 50 percent, >50 Miles = 100 percent. AF PCS costs are assumed to be incurred in FY2014. The total estimated AF PCS cost is $2,548K (BY 2007$). 8.0 AT Staffing (PCS): This cost element includes the PCS Costs for all AT controller positions moved from the En Route Centers or other TRACONs to the BA facilities. Costs are based on a detailed analysis of the controller positions required at each new site times the average PCS cost. As before, the eligibility for a PCS move is based on the change in distance between the new facility location and the old using the same eligibility criteria that was used for the AF PCS estimate. For the two new facilities, uncertainty on the location of the BA facility and the corresponding implications for AT PCS eligibility and costs was accounted for in the applied risk range. AT PCS costs are assumed to be incurred in FY2014. The total estimated AT PCS cost is $76,442K (BY 2007$). 9.0 Facilities Maintenance: This cost element includes all activities associated with repair and maintenance of the two new facilities. The cost is based on a cost-estimating relationship per square foot and is calculated at an average rate of $9.26 per square foot per year. This cost begins in FY 2014 and continues throughout the entire lifecycle through 2024. The total estimated facilities maintenance cost is $19,353 (BY 2007$). 10.0 Telecommunications: This cost element includes all non-recurring and recurring costs associated with telecommunications services, including circuitry, equipment, and infrastructure services costs. Costs are based on ROM estimates from the FAA ATO Technical Operations telecommunications group. Costs are calculated for telecommunications costs between RCAG radio sites, adjacent centers, and radar sites and the BA facility. These costs are assumed to be net additional costs during transition to the BA facility only and therefore are only included in FY2014–15. The total estimated Telecommunications cost is $9,626K (BY 2007$).
10-5

11.0 Utilities: This cost element includes all activities associated with utilities, including electrical, water, janitorial, and grounds maintenance for the two new facilities. The cost is based on a cost-estimating relationship per square foot and is calculated at an average rate of $14.88 per square foot per year. This cost begins in FY2014 and continues throughout the entire life cycle through 2024. The total estimated utilities cost is $31,099 (BY 2007$).
10.1.4 Total Cost Summary by WBS Figure 10-1 depicts the percentage contribution of each WBS element to the total estimated cost. It shows that equipment and facilities are the major cost drivers. It also shows that the cost of PCS moves, AT training, and Technical Support are significant cost elements.
Big Airspace Total Cost (TY$)
3.0 Equipment Costs32%
7.0 AF Staffing (PCS)0.5%
2.0 Facilities Costs16%
6.0 ATC Training12%
8.0 AT Staffing (PCS)14%
9.0 Facilities Maintenance
4%
10.0 Telecommunication
2%
11.0 Utilities6%
4.0 Technical Support (incl. Sys.
Eng.)12%
5.0 Program Management
2%
Figure 10-1. Percentage of total cost by WBS. The most likely cost was estimated for each element, and then a risk range reflecting the expected lower and upper bounds was developed. Monte Carlo Simulation, using the Crystal Ball ® risk tool, was run using these values to derive the risk-adjusted cost estimate. The risk-adjusted number reflects a cost that has an 80 percent probability of not being exceeded. The total BA Cost Estimate in Millions of Constant Base Year 2007 dollars appears in Table 10-1. It shows that in constant dollars the most likely cost estimate to implement the BA concept at the
10-6
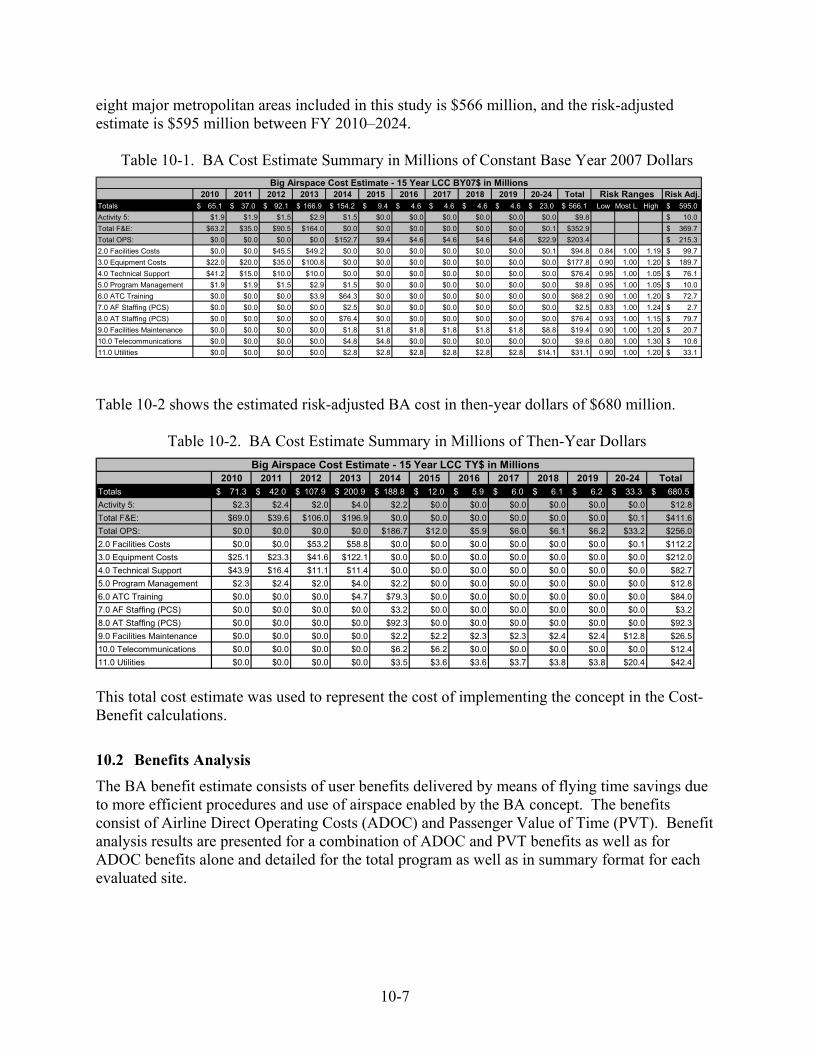
eight major metropolitan areas included in this study is $566 million, and the risk-adjusted estimate is $595 million between FY 2010–2024.
Table 10-1. BA Cost Estimate Summary in Millions of Constant Base Year 2007 Dollars
2010 2011 2012 2013 2014 2015 2016 2017 2018 2019 20-24 Total Risk Adj.Totals 65.1$ 37.0$ 92.1$ 166.9$ 154.2$ 9.4$ 4.6$ 4.6$ 4.6$ 4.6$ 23.0$ 566.1$ Low Most L. High 595.0$ Activity 5: $1.9 $1.9 $1.5 $2.9 $1.5 $0.0 $0.0 $0.0 $0.0 $0.0 $0.0 $9.8 10.0$ Total F&E: $63.2 $35.0 $90.5 $164.0 $0.0 $0.0 $0.0 $0.0 $0.0 $0.0 $0.1 $352.9 369.7$ Total OPS: $0.0 $0.0 $0.0 $0.0 $152.7 $9.4 $4.6 $4.6 $4.6 $4.6 $22.9 $203.4 215.3$ 2.0 Facilities Costs $0.0 $0.0 $45.5 $49.2 $0.0 $0.0 $0.0 $0.0 $0.0 $0.0 $0.1 $94.8 0.84 1.00 1.19 99.7$ 3.0 Equipment Costs $22.0 $20.0 $35.0 $100.8 $0.0 $0.0 $0.0 $0.0 $0.0 $0.0 $0.0 $177.8 0.90 1.00 1.20 189.7$ 4.0 Technical Support $41.2 $15.0 $10.0 $10.0 $0.0 $0.0 $0.0 $0.0 $0.0 $0.0 $0.0 $76.4 0.95 1.00 1.05 76.1$ 5.0 Program Management $1.9 $1.9 $1.5 $2.9 $1.5 $0.0 $0.0 $0.0 $0.0 $0.0 $0.0 $9.8 0.95 1.00 1.05 10.0$ 6.0 ATC Training $0.0 $0.0 $0.0 $3.9 $64.3 $0.0 $0.0 $0.0 $0.0 $0.0 $0.0 $68.2 0.90 1.00 1.20 72.7$ 7.0 AF Staffing (PCS) $0.0 $0.0 $0.0 $0.0 $2.5 $0.0 $0.0 $0.0 $0.0 $0.0 $0.0 $2.5 0.83 1.00 1.24 2.7$ 8.0 AT Staffing (PCS) $0.0 $0.0 $0.0 $0.0 $76.4 $0.0 $0.0 $0.0 $0.0 $0.0 $0.0 $76.4 0.93 1.00 1.15 79.7$ 9.0 Facilities Maintenance $0.0 $0.0 $0.0 $0.0 $1.8 $1.8 $1.8 $1.8 $1.8 $1.8 $8.8 $19.4 0.90 1.00 1.20 20.7$ 10.0 Telecommunications $0.0 $0.0 $0.0 $0.0 $4.8 $4.8 $0.0 $0.0 $0.0 $0.0 $0.0 $9.6 0.80 1.00 1.30 10.6$ 11.0 Utilities $0.0 $0.0 $0.0 $0.0 $2.8 $2.8 $2.8 $2.8 $2.8 $2.8 $14.1 $31.1 0.90 1.00 1.20 33.1$
Risk RangesBig Airspace Cost Estimate - 15 Year LCC BY07$ in Millions
Table 10-2 shows the estimated risk-adjusted BA cost in then-year dollars of $680 million.
Table 10-2. BA Cost Estimate Summary in Millions of Then-Year Dollars
2010 2011 2012 2013 2014 2015 2016 2017 2018 2019 20-24 TotalTotals 71.3$ 42.0$ 107.9$ 200.9$ 188.8$ 12.0$ 5.9$ 6.0$ 6.1$ 6.2$ 33.3$ 680.5$ Activity 5: $2.3 $2.4 $2.0 $4.0 $2.2 $0.0 $0.0 $0.0 $0.0 $0.0 $0.0 $12.8Total F&E: $69.0 $39.6 $106.0 $196.9 $0.0 $0.0 $0.0 $0.0 $0.0 $0.0 $0.1 $411.6Total OPS: $0.0 $0.0 $0.0 $0.0 $186.7 $12.0 $5.9 $6.0 $6.1 $6.2 $33.2 $256.02.0 Facilities Costs $0.0 $0.0 $53.2 $58.8 $0.0 $0.0 $0.0 $0.0 $0.0 $0.0 $0.1 $112.23.0 Equipment Costs $25.1 $23.3 $41.6 $122.1 $0.0 $0.0 $0.0 $0.0 $0.0 $0.0 $0.0 $212.04.0 Technical Support $43.9 $16.4 $11.1 $11.4 $0.0 $0.0 $0.0 $0.0 $0.0 $0.0 $0.0 $82.75.0 Program Management $2.3 $2.4 $2.0 $4.0 $2.2 $0.0 $0.0 $0.0 $0.0 $0.0 $0.0 $12.86.0 ATC Training $0.0 $0.0 $0.0 $4.7 $79.3 $0.0 $0.0 $0.0 $0.0 $0.0 $0.0 $84.07.0 AF Staffing (PCS) $0.0 $0.0 $0.0 $0.0 $3.2 $0.0 $0.0 $0.0 $0.0 $0.0 $0.0 $3.28.0 AT Staffing (PCS) $0.0 $0.0 $0.0 $0.0 $92.3 $0.0 $0.0 $0.0 $0.0 $0.0 $0.0 $92.39.0 Facilities Maintenance $0.0 $0.0 $0.0 $0.0 $2.2 $2.2 $2.3 $2.3 $2.4 $2.4 $12.8 $26.510.0 Telecommunications $0.0 $0.0 $0.0 $0.0 $6.2 $6.2 $0.0 $0.0 $0.0 $0.0 $0.0 $12.411.0 Utilities $0.0 $0.0 $0.0 $0.0 $3.5 $3.6 $3.6 $3.7 $3.8 $3.8 $20.4 $42.4
Big Airspace Cost Estimate - 15 Year LCC TY$ in Millions
This total cost estimate was used to represent the cost of implementing the concept in the Cost-Benefit calculations.
10.2 Benefits Analysis The BA benefit estimate consists of user benefits delivered by means of flying time savings due to more efficient procedures and use of airspace enabled by the BA concept. The benefits consist of Airline Direct Operating Costs (ADOC) and Passenger Value of Time (PVT). Benefit analysis results are presented for a combination of ADOC and PVT benefits as well as for ADOC benefits alone and detailed for the total program as well as in summary format for each evaluated site.
10-7

10.2.1 Benefit Estimating Methods and Data Sources
The benefit estimate is derived from an extrapolation of flight time savings results from the generic BA Fast-Time System Performance Simulations to other sites based on site-specific historical weather patterns and FAA traffic forecasts. This section details how the flight time savings results from the BA concept fast-time simulation activity was used to develop a dollar estimate of the benefits associated with implementation of the concept at seven BA facilities, covering eight major metropolitan areas. Section 5, “Fast-Time System Performance Simulation,” details the models and tools used to develop the BA scenarios, the methods and data inputs used to run these simulations, and the final results. The Flight Time Savings estimate that was extrapolated to other sites to estimate the BA benefits comes directly from these results. The methods and models used to run the simulations made very optimistic assumptions regarding NAS performance in 2012. For example, it was assumed that all aircraft were separated at 3 and 5 miles with no additional safety buffer, and that improved strategic planning initiatives would cause excess demand to be delayed en route and at the departure airport with no loss in system efficiency. These were good assumptions to make for a concept validation study. As optimistic assumptions were made regarding the baseline case, less system inefficiency was present upon implementation of the BA procedures. Had less optimistic assumptions been made of the future baseline case, the BA benefit would likely have been measurably larger. Therefore, the flight time savings estimate is viewed as a very conservative (high confidence) estimate for BA benefits. Section 5 only presents detailed results for a single simulation run because one run was sufficient to validate the concept. However, when using simulation model results to develop a benefits estimate, it is important to determine how sensitive the estimated benefit is to minor changes in model assumptions, such as the specific timing of the flight schedule. To develop a higher confidence benefits estimate, an additional run was performed for each of the no weather traffic scenarios to determine how sensitive the model was to minor variations in flight arrival and departure schedules. For the +100 percent no weather case, the second model run did show some sensitivity to schedule variations. Therefore, the model was run additional times to get an understanding of whether that level of traffic demand did make the model sensitive to schedule variations. Two additional runs yielded very similar results to the original +100 percent traffic no weather scenario; so the second run was viewed as an unexplained anomaly, and it is excluded from the benefits calculation. Aside from the one anomaly, these results did not show any significant sensitivity to schedule variation, and, therefore, it was decided that the original runs for the weather scenario were sufficient for the benefits analysis. Table 10-3 shows the flight time savings results used in the benefits calculation from the multiple fast-time simulation runs for scenarios without convective weather based on 2012, 2012+50 percent, and 2012+100 percent traffic scenarios.
10-8

Table 10-3. Flight-Time Savings (No Weather)
Run 1 Run 2 Run 1 Run 2 Run 1 Run 2 Run 3 Run 4Baseline 649,932 649,873 1,044,435 1,044,563 1,315,468 1,315,317 1,318,333 1,317,327Big Airspace 647,105 647,342 1,035,556 1,035,874 1,294,004 1,293,722 1,297,622 1,296,532Flight Time Savings (min) 2,827 2,531 9,879 8,689 21,464 21,595 20,711 20,795Flight Time Savings per aircraft (min) 0.34 0.30 0.78 0.68 1.37 1.38 1.32 1.33
ConditionTraffic Level
2012 50% 100%
These results were used to estimate a 20th percentile high confidence time savings estimate based on a linear fit. The risk-adjusted results across simulation runs for the no weather scenarios appear in Table 10-4. .
Table 10-4. Flight-Time Savings (No Weather), Risk Adjusted
2012 50% 100%Risk Adj Risk Adj Risk Adj
Flight Time Savings (min) 2,590 8,927 20,826Flight Time Savings per aircraft (min) 0.31 0.70 1.33
ConditionTraffic Level
Since only a single fast-time simulation run was performed in the convective weather scenario for each traffic level, the actual point estimate results were used in this analysis. These results, originally described in Section 5, are repeated in Table 10-5. Given that the overall benefits analysis is viewed as a conservative estimate of the BA benefits, this can still be considered a valid data point for the overall analysis.
Table 10-5. Flight-Time Savings (Weather)
2012 50% 100%Run 1 Run 1 Run 1
Baseline 656,251 1,061,376 1,338,258Big Airspace 648,233 1,046,326 1,313,603Flight Time Savings (min) 8,018 15,050 24,655Flight Time Savings per aircraft (min) 0.96 1.18 1.57
Traffic LevelCondition
An annual estimate of the flight-time savings per aircraft was estimated for each site based on adjustments for traffic forecasts and convective weather. Convective Weather Index data provided by Air Traffic Analysis, Inc. has been used to assess convective weather impacts on air traffic delays for each metropolitan area. A detailed explanation of the data and approach used to derive this index appears in the paper “Weather Index With Queuing Component For National Airspace System Performance Assessment” (Dr. Alexander Klein, FAA-Eurocontrol ATM 2007 Seminar, Barcelona, July 2–5 2007). This research has led to the calculation of site-specific historical weather obscuration factors that reflect the percentage of convective weather obscuration at a distance of 100 nm from the airport on an hourly basis and multiplied by hourly traffic demand. For each site included in the BA analysis, the annual average Convective Weather Index has been calculated and compared to the
10-9

Convective weather index for the actual weather event used in the fast-time simulation weather scenario (May 11, 2006) to estimate a delay adjustment factor. As described above, this adjustment factor accounts for differences in both traffic and convective weather. Therefore, a site with greater traffic demand during bad weather may have a higher adjustment factor than a site with less traffic but more instances of convective weather. The convective weather delay adjustment factor is used to convert the no weather and weather flight-time savings estimates into an average annual delay savings per flight for each site. The following represents the algorithms used to derive these estimates for a given traffic scenario (i.e., 2012 traffic, +50 percent, +100 percent). (No Weather Flight Time Savings per Flight) +
(Weather Flight Time Savings per Flight – No Weather Flight Time Savings per Flight) X (Convective Weather Adjustment Factor (K) -1)
The results of this adjustment (in minutes) for each site and for all traffic volume scenarios (2012, 2012+50 percent, 2012+100 percent) appear in Table 10-6. Corresponding time savings are further adjusted based on site-specific traffic forecasts compared to the modeled traffic levels in the actual benefits calculation.
Table 10-6. Delay Adjustment due to Convective Weather Location K 2012 50% 100%Site #1 1.05 0.34 0.72 1.34Site #2 1.01 0.31 0.70 1.33Site #3 1.11 0.38 0.75 1.36Site #4 1.15 0.41 0.77 1.37Site #5 1.99 0.95 1.17 1.57Site #6 1.40 0.57 0.89 1.43Site #7 1.64 0.73 1.01 1.49
The annual average flight-time savings per flight was estimated using the data in Table 10-6 based on the linear trend between the traffic levels used in the simulation scenarios (described in Section 5) compared to corresponding traffic forecasts for each site. A daily traffic forecast estimate was needed to perform this calculation. To compare annual traffic forecasts to the traffic levels used in the simulation scenarios, the ratio of the traffic modeled in the daily simulation in 2012 compared to the annual total traffic forecast was calculated to be 1/287.4. This value (annualization factor) was assumed to remain constant in the future and to be applicable to other sites. This means that the total annual operations forecast was divided by 287.4 to fit the traffic forecast against the flight time savings trend line. Annual traffic forecasts for each site were based on TAF 2006 data. These forecasts were also used to derive the operational fleet mix. For the years beyond 2025 (not actually used in the final cost-benefits analysis), the average annual traffic growth rate between 2021 and 2025 was assumed to remain as a constant growth rate for each particular site. The total number of forecasted operations for all sites considered for the BA study, along with the fleet composition, appears in Table 10-7.
10-10

Table 10-7. Fleet Mix and Total Traffic Data
AC AT GA MIL Total, % Total, ops2011 41.07% 25.06% 31.68% 2.19% 100.00% 15,926,4532012 40.97% 24.97% 31.93% 2.13% 100.00% 16,370,5732013 40.88% 24.89% 32.15% 2.08% 100.00% 16,823,4472014 40.83% 24.81% 32.34% 2.02% 100.00% 17,282,1022015 40.80% 24.76% 32.48% 1.97% 100.00% 17,741,5232016 40.80% 24.71% 32.57% 1.92% 100.00% 18,201,3332017 40.83% 24.67% 32.63% 1.87% 100.00% 18,667,5222018 40.84% 24.61% 32.72% 1.83% 100.00% 19,128,4412019 40.87% 24.54% 32.81% 1.78% 100.00% 19,604,9752020 40.89% 24.47% 32.90% 1.74% 100.00% 20,093,1642021 40.92% 24.39% 32.99% 1.70% 100.00% 20,590,5732022 40.96% 24.30% 33.09% 1.66% 100.00% 21,099,7632023 40.99% 24.22% 33.17% 1.62% 100.00% 21,620,6762024 41.04% 24.14% 33.25% 1.58% 100.00% 22,152,3822025 41.10% 24.06% 33.31% 1.54% 100.00% 22,696,8272026 41.13% 23.97% 33.39% 1.50% 100.00% 23,258,8032027 41.17% 23.89% 33.47% 1.47% 100.00% 23,834,6802028 41.21% 23.81% 33.55% 1.43% 100.00% 24,424,9272029 41.26% 23.73% 33.62% 1.40% 100.00% 25,030,1292030 41.30% 23.65% 33.70% 1.36% 100.00% 25,651,2312031 41.33% 23.56% 33.77% 1.33% 100.00% 26,288,9462032 41.37% 23.48% 33.85% 1.30% 100.00% 26,943,0172033 41.41% 23.40% 33.93% 1.27% 100.00% 27,613,9832034 41.45% 23.32% 34.00% 1.23% 100.00% 28,302,3992035 41.48% 23.24% 34.08% 1.20% 100.00% 29,008,813
Year Total
Flight-time savings were converted to dollar values for ADOC and PVT based on the most recent Economic Analysis data (May 2007) provided by Finance Services (ATO-F). Tables 10-8 through 10-10 summarize this data. The current ADOC values prescribed for use in ATO benefit analysis and used for this analysis do not reflect recent fuel cost increases. Total ADOC benefits are estimated as the sum for each group (Air Carrier, Air Taxi, and General Aviation) of the total annual time savings in hours multiplied by the user group percentage, multiplied by the economic ADOC value per airborne hour (as flight saving achieved in the air) for that user group. Military ADOC savings were not included in the estimate. Total PVT benefits are estimated as the sum for each group (Air Carrier, Air Taxi, and General Aviation) of the total annual time savings in hours multiplied by the user group percentage multiplied by the economic values for average passenger capacity for that user group multiplied by the average passenger load factor multiplied by the passenger value of time (recommended for “All Purposes” travel). PVT benefits are not calculated for the military.
10-11

Table 10-8. Aircraft Operating Cost
Per Airborne
Hour
Per Ground
HourPer Block
HourAir Carrier - Passenger 2,691$ 1,561$ 2,518$ 768$ 3,287$ Air Carrier - Cargo 5,209$ 3,021$ 4,934$ 1,761$ 6,695$ Air Carrier - TAF 2,882$ 1,672$ 2,702$ 844$ 3,545$ Air Taxi - TAF 767$ 445$ 707$ 554$ 1,261$ General Aviation N/A N/A 405$ 814$ 1,219$ Military N/A N/A N/A N/A 7,584$ 1Fuel & Oil, Crew, Maintenance2Rentals, Depreciation, Insurance
FY06$
Variable Cost1 Fixed Cost2 per
Block Hour
Total Per Block Hour
Table 10-9. Utilization
Pax Capacity
Crew Size
Cargo Capacity
Pax Load Factor 2006
Cargo Load
Factor
Daily Utilization
Average Block Speed
Air Carrier - Passenger 119.3 5 23.6 tons 79.40% 0.55 9.5 hours 365 mphAir Carrier - Cargo N/A 3 49.4 tons N/A 0.6 4.2 hours 410 mphAir Carrier - TAF 110.9 5 25.6 tons 79.40% 0.55 9.1 hours 369 mphAir Taxi - TAF 27.7 3 4.5 tons 75.30% N/A N/A N/AGeneral Aviation 4 N/A N/A 52.7% N/A N/A N/A
Table 10-10. Passenger Value of Time
Low High
Commercial: Personal $23.30 $20.00 $30.00 Business $40.10 $32.10 $48.10 All Purposes $28.60 $23.80 $35.60
General Aviation: Personal $31.50 Business $45.00 All Purposes $37.20
Category Recommended
Sensitivity Range
(No Recommendation)
Per OMB direction, a 7 percent discount rate was used to calculate benefits in Present Value dollars and OMB inflation rates were used to calculate benefits in then-year dollars. The inflation rate has not been applied to PVT, as these are the policy values determined by the U.S. Department of Transportation/Office of the Secretary of Transportation and should not be escalated for inflation.
10-12

10.2.2 Benefits Results
Extrapolation of flight time savings results from the generic BA Fast-Time System Performance Simulations to seven BA Facilities covering eight major metropolitan areas based on site-specific historical weather patterns and FAA traffic forecasts yields a total estimated benefit of $6,365 million in constant 2007 BY dollars for a 10-year operations (Ops) period. Of this total, $3,526 million are associated with aircraft direct operating cost savings and $2,839 million are associated with passenger value of time benefits. In present value dollars, the total estimated ADOC benefit is $1,485 million and the total ADOC and PVT benefit is $2,680 million. The annual benefit results appear in the cost-benefit analysis summary tables that follow. These benefits are considered to be very conservative because of the short lifecycle used, the lower than current average fuel cost component of ADOC, and the optimistic representation of NAS system performance in the baseline Fast Time System Performance simulations.
10.2.3 Cost-Benefit Analysis Implementation of the BA concept at seven BA Facilities covering eight major metropolitan areas was found to be highly cost beneficial, with an estimated benefit/cost (B/C) ratio of 6.8, based on total estimated present-value benefits of $2,680 million and costs of $396 million. The estimated Net Present Value totals $2,284 million, and the internal rate of return is 48 percent. The total risk-adjusted (high confidence cost and benefits) annual estimated benefits and costs by year as well as the results of the cost-benefit analysis appear in Table 10-11 in millions of present value and constant 2007 base year dollars.
10-13
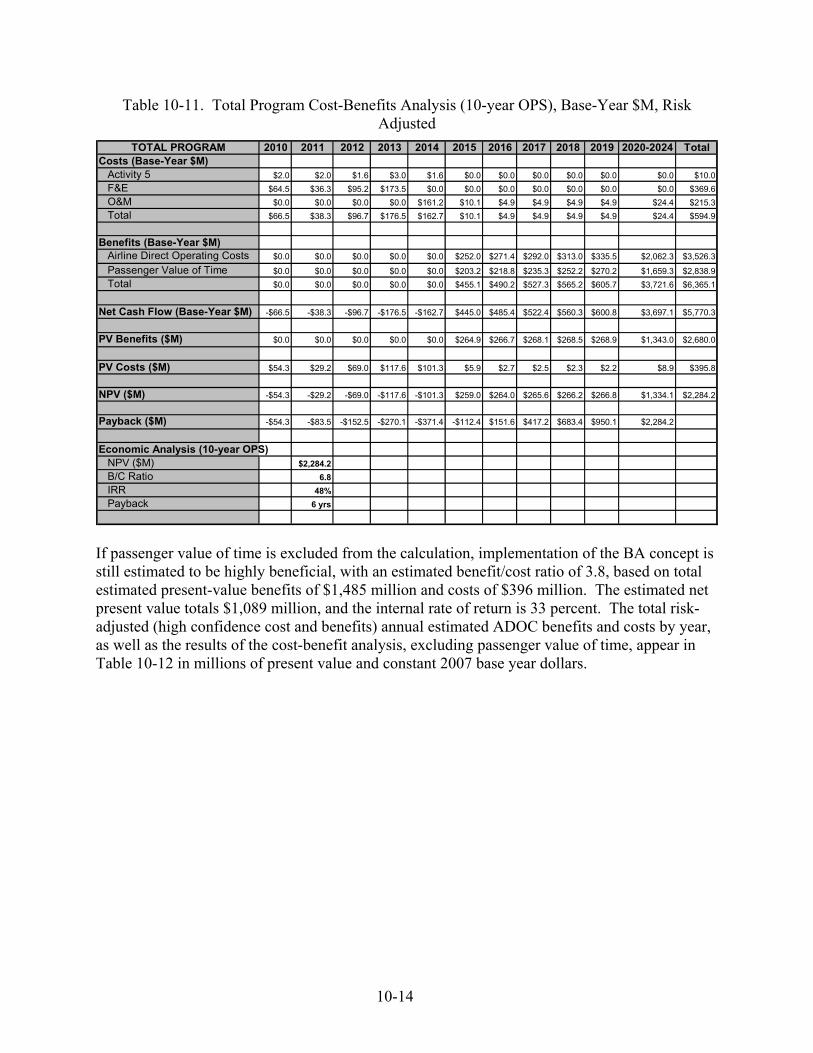
Table 10-11. Total Program Cost-Benefits Analysis (10-year OPS), Base-Year $M, Risk Adjusted
TOTAL PROGRAM 2010 2011 2012 2013 2014 2015 2016 2017 2018 2019 2020-2024 TotalCosts (Base-Year $M) Activity 5 $2.0 $2.0 $1.6 $3.0 $1.6 $0.0 $0.0 $0.0 $0.0 $0.0 $0.0 $10.0
F&E $64.5 $36.3 $95.2 $173.5 $0.0 $0.0 $0.0 $0.0 $0.0 $0.0 $0.0 $369.6O&M $0.0 $0.0 $0.0 $0.0 $161.2 $10.1 $4.9 $4.9 $4.9 $4.9 $24.4 $215.3Total $66.5 $38.3 $96.7 $176.5 $162.7 $10.1 $4.9 $4.9 $4.9 $4.9 $24.4 $594.9
Benefits (Base-Year $M)Airline Direct Operating Costs $0.0 $0.0 $0.0 $0.0 $0.0 $252.0 $271.4 $292.0 $313.0 $335.5 $2,062.3 $3,526.3
Passenger Value of Time $0.0 $0.0 $0.0 $0.0 $0.0 $203.2 $218.8 $235.3 $252.2 $270.2 $1,659.3 $2,838.9Total $0.0 $0.0 $0.0 $0.0 $0.0 $455.1 $490.2 $527.3 $565.2 $605.7 $3,721.6 $6,365.1
Net Cash Flow (Base-Year $M) -$66.5 -$38.3 -$96.7 -$176.5 -$162.7 $445.0 $485.4 $522.4 $560.3 $600.8 $3,697.1 $5,770.3
PV Benefits ($M) $0.0 $0.0 $0.0 $0.0 $0.0 $264.9 $266.7 $268.1 $268.5 $268.9 $1,343.0 $2,680.0
PV Costs ($M) $54.3 $29.2 $69.0 $117.6 $101.3 $5.9 $2.7 $2.5 $2.3 $2.2 $8.9 $395.8
NPV ($M) -$54.3 -$29.2 -$69.0 -$117.6 -$101.3 $259.0 $264.0 $265.6 $266.2 $266.8 $1,334.1 $2,284.2
Payback ($M) -$54.3 -$83.5 -$152.5 -$270.1 -$371.4 -$112.4 $151.6 $417.2 $683.4 $950.1 $2,284.2
Economic Analysis (10-year OPS)NPV ($M) $2,284.2B/C Ratio 6.8IRR 48%Payback 6 yrs
If passenger value of time is excluded from the calculation, implementation of the BA concept is still estimated to be highly beneficial, with an estimated benefit/cost ratio of 3.8, based on total estimated present-value benefits of $1,485 million and costs of $396 million. The estimated net present value totals $1,089 million, and the internal rate of return is 33 percent. The total risk-adjusted (high confidence cost and benefits) annual estimated ADOC benefits and costs by year, as well as the results of the cost-benefit analysis, excluding passenger value of time, appear in Table 10-12 in millions of present value and constant 2007 base year dollars.
10-14

Table 10-12. Total Program Cost-Benefits Analysis (10-year OPS), Base-Year $M, Risk Adjusted (ADOC only)
TOTAL PROGRAM 2010 2011 2012 2013 2014 2015 2016 2017 2018 2019 2020-2024 TotalCosts (Base-Year $M) Activity 5 $2.0 $2.0 $1.6 $3.0 $1.6 $0.0 $0.0 $0.0 $0.0 $0.0 $0.0 $10.0
F&E $64.5 $36.3 $95.2 $173.5 $0.0 $0.0 $0.0 $0.0 $0.0 $0.0 $0.0 $369.6O&M $0.0 $0.0 $0.0 $0.0 $161.2 $10.1 $4.9 $4.9 $4.9 $4.9 $24.4 $215.3Total $66.5 $38.3 $96.7 $176.5 $162.7 $10.1 $4.9 $4.9 $4.9 $4.9 $24.4 $594.9
Benefits (Base-Year $M)Airline Direct Operating Costs $0.0 $0.0 $0.0 $0.0 $0.0 $252.0 $271.4 $292.0 $313.0 $335.5 $2,062.3 $3,526.3
Passenger Value of Time $0.0 $0.0 $0.0 $0.0 $0.0 $0.0 $0.0 $0.0 $0.0 $0.0 $0.0 $0.0Total $0.0 $0.0 $0.0 $0.0 $0.0 $252.0 $271.4 $292.0 $313.0 $335.5 $2,062.3 $3,526.3
Net Cash Flow (Base-Year $M) -$66.5 -$38.3 -$96.7 -$176.5 -$162.7 $241.8 $266.6 $287.1 $308.1 $330.6 $2,037.9 $2,931.4
PV Benefits ($M) $0.0 $0.0 $0.0 $0.0 $0.0 $146.6 $147.6 $148.4 $148.7 $149.0 $744.2 $1,484.6
PV Costs ($M) $54.3 $29.2 $69.0 $117.6 $101.3 $5.9 $2.7 $2.5 $2.3 $2.2 $8.9 $395.8
NPV ($M) -$54.3 -$29.2 -$69.0 -$117.6 -$101.3 $140.7 $145.0 $146.0 $146.4 $146.8 $735.3 $1,088.8
Payback ($M) -$54.3 -$83.5 -$152.5 -$270.1 -$371.4 -$230.7 -$85.7 $60.3 $206.7 $353.5 $1,088.8
Economic Analysis (10-year OPS)NPV ($M) $1,088.8B/C Ratio 3.8IRR 33%Payback 7 yrs
Table 10-13 shows the total program cost-benefit analysis and net cash flows in millions of then-year dollars. Table 10-14 shows the total program cost-benefit analysis and net cash flows in then-year dollars based on ADOC benefits only.
Table 10-13. Total Program Cost-Benefits Analysis (10-year OPS), Then-Year $M, Risk Adjusted
TOTAL PROGRAM 2010 2011 2012 2013 2014 2015 2016 2017 2018 2019 2020-2024 TotalCosts (Then-Year $M) Activity 5 $2.3 $2.4 $2.0 $4.0 $2.2 $0.0 $0.0 $0.0 $0.0 $0.0 $0.0 $12.8
F&E $69.0 $39.6 $106.0 $196.9 $0.0 $0.0 $0.0 $0.0 $0.0 $0.0 $0.1 $411.6O&M $0.0 $0.0 $0.0 $0.0 $186.7 $12.0 $5.9 $6.0 $6.1 $6.2 $33.2 $256.0Total $71.3 $42.0 $107.9 $200.9 $188.8 $12.0 $5.9 $6.0 $6.1 $6.2 $33.3 $680.5
Benefits (Then-Year $M)Airline Direct Operating Costs $0.0 $0.0 $0.0 $0.0 $0.0 $297.6 $326.8 $358.6 $392.2 $428.8 $2,805.4 $4,609.4
Passenger Value of Time $0.0 $0.0 $0.0 $0.0 $0.0 $203.2 $218.8 $235.3 $252.2 $270.2 $1,659.3 $2,838.9Total $0.0 $0.0 $0.0 $0.0 $0.0 $500.7 $545.6 $593.9 $644.4 $699.0 $4,464.6 $7,448.3
Net Cash Flow (Then-Year $M) -$71.3 -$42.0 -$107.9 -$200.9 -$188.8 $488.8 $539.7 $587.9 $638.3 $692.7 $4,431.3 $6,767.8
10-15

Table 10-14. Total Program Cost-Benefits Analysis (10-year OPS), Then-Year $M, Risk Adjusted (ADOC only)
TOTAL PROGRAM 2010 2011 2012 2013 2014 2015 2016 2017 2018 2019 2020-2024 TotalCosts (Then-Year $M) Activity 5 $2.3 $2.4 $2.0 $4.0 $2.2 $0.0 $0.0 $0.0 $0.0 $0.0 $0.0 $12.8
F&E $69.0 $39.6 $106.0 $196.9 $0.0 $0.0 $0.0 $0.0 $0.0 $0.0 $0.1 $411.6O&M $0.0 $0.0 $0.0 $0.0 $186.7 $12.0 $5.9 $6.0 $6.1 $6.2 $33.2 $256.0Total $71.3 $42.0 $107.9 $200.9 $188.8 $12.0 $5.9 $6.0 $6.1 $6.2 $33.3 $680.5
Benefits (Then-Year $M)Airline Direct Operating Costs $0.0 $0.0 $0.0 $0.0 $0.0 $297.6 $326.8 $358.6 $392.2 $428.8 $2,805.4 $4,609.4
Passenger Value of Time $0.0 $0.0 $0.0 $0.0 $0.0 $0.0 $0.0 $0.0 $0.0 $0.0 $0.0 $0.0Total $0.0 $0.0 $0.0 $0.0 $0.0 $297.6 $326.8 $358.6 $392.2 $428.8 $2,805.4 $4,609.4
Net Cash Flow (Then-Year $M) -$71.3 -$42.0 -$107.9 -$200.9 -$188.8 $285.6 $320.9 $352.6 $386.1 $422.5 $2,772.1 $3,928.9
Figure 10-2 illustrates the short payback period estimated for the BA concept. Total benefits exceed total costs in the first year of operation when both ADOC and PVT benefits are considered and in the second year of operation when only ADOC benefits are included in the calculation. The blue line represents total benefits (ADOC+PVT), and the pink line represents ADOC only.
TOTAL PROGRAM
-$600.0
-$400.0
-$200.0
$0.0
$200.0
$400.0
$600.0
$800.0
$1,000.0
$1,200.0
2010 2011 2012 2013 2014 2015 2016 2017 2018 2019
Year
Payb
ack,
NP
V $
Mill
io
Figure 10-2. Total program payback. The cost-benefit analysis was also computed for each site, with general program costs, such as SDP enhancements, split evenly between the sites. This analysis suggests that the BA concept is likely to be cost effective for all major metropolitan areas, with B/C ratios ranging from 2.8 to 11.7. Although the benefit methodology should not be used to draw any definitive conclusion regarding the cost-effectiveness of the concept at any particular site, the results, as discussed earlier, do suggest that the concept may be more highly beneficial for some metropolitan areas. Tables 10-15 and 10-16 present the range of cost-benefit results estimated at the site level.
10-16

Table 10-15. Cost-Benefits Summary (10-year OPS, ADOC+PVT) Location NPV ($M) B/C Ratio IRR Payback (yr)
#1 $354.7 10.0 54% 6 yrs#2 $61.3 2.8 22% 9 yrs#3 $176.6 5.8 39% 6 yrs#4 $673.7 7.0 52% 6 yrs#5 $315.4 10.0 56% 5 yrs#6 $207.4 3.2 31% 7 yrs#7 $495.2 11.7 63% 5 yrsAll Sites $2,284.2 6.8 48% 6 yrs
Table 10-16. Cost-Benefits Summary (10-year OPS, ADOC only)
Location NPV ($M) B/C Ratio IRR Payback (yr)#1 $180.8 5.6 39% 6 yrs#2 $19.0 1.6 13% 12 yrs#3 $82.6 3.3 27% 8 yrs#4 $318.7 3.8 35% 7 yrs#5 $158.3 5.5 40% 6 yrs#6 $80.1 1.9 19% 10 yrs#7 $249.3 6.4 46% 6 yrsAll Sites $1,088.8 3.8 33% 7 yrs
The BA ROM Cost-Benefit Analysis suggests that the BA concept is likely to be cost effective for all or most major metropolitan areas.
10-17

11 SAFETY AND RISK ANALYSIS
An initial Operational Safety Assessment (OSA) for BA was conducted by the FAA System Engineering and Safety organization in accordance with the principles and practices as defined in the FAA Safety Risk Management Guidance for Systems Acquisition (SRMGSA), and Safety Management System Manual. It is a qualitative Severity Assessment of the hazards associated with the BA Concept. Operational Hazard Assessment (OHA) results were derived from potential hazard causational factors resulting from critical operational and infrastructure changes to the current NAS in support of BA (Table 11-2) and served as the basis of this report. These factors, as well as Severity Assessment rationales for each individual hazard, are listed in Table 11-3. As a result of these critical changes, 10 worst case credible severity hazards were qualitatively derived from the current BA Concept environment.
11.1 Disclaimers, Assumptions, and Caveats
1. Accident dynamics will vary from single events to events with multiple causes; both unsafe acts and/or conditions. The approach taken was not confined to a single outcome, but considered the entire operational concept of the BA.
2. Any changes to the approved BA OSA will be made upon concurrence of the ATO System Safety Working Group.
3. The OHA is not all-inclusive, in that there remain unknown hazards within any operation. 4. The OHA is based upon Subject Matter Expert (SME) engineering judgment and
qualitative assessments. 5. Some BA infrastructure will incorporate commercial off-the-shelf software, hardware, and
services. 6. A new facility will be constructed for the ARR/DEP control service, and it will be the
model for the type of facility to be used in large, busy metro areas throughout the NAS. 7. The facility and airspace design will meet safety, environmental, and noise objectives. 8. Airspace redesign will be an integral part of accomplishing this concept, and the changes
necessary are broader than those currently planned in the Airspace Management Program. 9. Airspace will be dynamically resectorized to maintain system capacity. 10. Current 3 nm separation standards and diverging course procedures will be used in the
ARR/DEP airspace and will be supported by the surveillance and automation systems (e.g., update rates); new procedures will be developed as required.
11. The BA will keep training to a minimum, focusing on familiarizing controllers with new and existing separation procedures and teaching skills to controllers to work higher altitudes further away from the airports.
12. While a data link was found to improve the operational efficiency of BA, it is not an operational requirement for this concept.
13. While the expanded use of visual flight rules above 18,000 feet was contained in the Big Airspace operational concept, the simulation studies proved that the benefits of the concept are not dependent on this operational feature. Therefore, it is not included in the OSA. A flight standards safety assessment would likely be needed to implement this operational procedure.
11-1

11.2 Safety Objectives
The Safety Objectives (Table 11-1) are in keeping with the Rule of a Safety Risk of no greater than Medium, and are mapped to the hazards listed in Table 11-3.
Table 11-1. BA Safety Objectives
Hazard No.
Safety Objective
BA-001
The likelihood that BA would cause a Major outcome due to loss of Required Surveillance Performance (RSP), is less than 1x10⁻⁵ (Remote).
BA-002a The likelihood that BA would cause a Major outcome due to Data Processing providing corrupted or misleading flight information, is less than 1x10⁻⁵ (Remote).
BA-002b
The likelihood that BA would cause a Major outcome due to the loss of Data Processing Service, is less than 1x10⁻⁵ (Remote).
BA-003 The likelihood that BA would cause a Major outcome due to loss of Performance-Based Navigation (PBN) capability, is less than 1x10⁻⁵ (Remote).
BA-004a The likelihood that BA would cause a Catastrophic outcome due to inaccurate misleading Airspace Structures and Procedures, is less than 1x10⁻⁹ (Extremely Improbable).
BA-004b The likelihood that BA would cause a Major outcome due to an incomplete or poorly developed BA Design Implementation Plan, is less than 1x10⁻⁵ (Remote).
BA-005 The likelihood that BA would cause a Catastrophic outcome due to loss of safe separation between carrier a/c to a/c, a/c to terrain/obstacles, or a/c to airspace, operating in controlled terminal airspace, is less than 1x10⁻⁹ (Extremely Improbable).
BA-006a The likelihood that BA would cause a Catastrophic outcome due to loss of Decision Support System (DSS) support, is less than 1x10⁻⁵ (Remote).
BA-006b The likelihood that BA would cause a Major outcome due to misleading DSS solution sets, is less than 1x10⁻⁵ (Remote).
BA-007 The likelihood that BA would cause a Minor outcome due to ineffective Departure Synchronization Plan, is less than 1x10⁻³ (Probable).
11-2

Table 11-2 – Operational and Infrastructure Changes to Current NAS in Support of Big Airspace (BA) Concept
11-3
Item No.
Function/Process Current (NAS) Big Airspace (BA) Applicable Hazard
No. (BA) 1 Surveillance
TRACONs use single-site, high rotation speed (6 sec update) radar for 3 nm and other terminal separation procedures, limited to 40-nm from the antenna (ASR-9 with Mode-S is approved to 60-nm from the antenna). ARTCCs use mosaic long range radar (12 sec update) for 5-nm separation and single-site adapted long range radar for 3-nm separation within 40-nm of the antenna.
Uses combination of surveillance technologies for 3 nm lateral separation (throughout BA) and other separation requirements like degrees divergence. Uses information management systems to transmit appropriate surveillance (networked or fused radar) data to the decision-maker in a timely fashion.
BA-001
2 Automation and Data Processing (DP)
TRACONs currently utilize Automated Radar Terminal Systems (ARTS) or Standard Terminal Automation Replacement Systems (STARS) to perform (limited) flight plan data and surveillance processing. ARTCCs currently use HOST and will shortly be installing ERAM. All of these systems are dedicated to their current operational environment.
Requires attributes from both types of processing systems; i.e., more complete flight data processing as defined in ERAM, but also faster and more accurate surveillance processing as defined in ARTS & STARS. This will require a significant evolution of one of the existing systems or design of a new hybrid automation system.
BA-002a BA-002b
3 Navigation Aircraft navigation is point to point based on fixed, ground navigation aids. Transition to RNAV and RNP routes is occurring in specific airspace. Conformance monitoring is primarily performed by ATC. Arrivals and departures on limited number of flight paths or separated by ATC-issued radar vectors.
Dependent on increased navigation precision. Heavy use of closely spaced area navigation routes leads to a PBN requirement. Multiple paths terminate and initiate within several nm of the runway. Three -dimensional PBN conformance critical due to increased volume and intercept courses near the airport.
BA-003
4 Airspace Development
TRACONs and ARTCCs have well-defined boundaries and sector configurations. Transition from En Route to TRACON occurs only through ARR/DEP gateways of segregated airspace defined by Letters of Agreement (LOAs).
BA represents a fundamental change in airspace design. As opposed to single or double lanes in the arrival gateways, multiple arrival and departure paths will allow increased flight path versatility for aircraft. Dynamic resectorization will provide increased flexibility for
BA-004a BA-004b

Item No.
Function/Process Current (NAS) Big Airspace (BA) Applicable Hazard
No. (BA) volume and weather situations.
5 Air Traffic Control (ATC)
En route, TRACON, and tower controllers all have some common skills, but each specialty has its own unique skill set developed over time.
The line between TRACON and low altitude en route controller is eliminated. Controllers will need to be proficient using a wider set of skills to adapt to a larger operating environment. Former TRACON controllers will learn techniques to handle compression at high speed and former en route controllers will learn alternative separation techniques; i.e., 3-nm, diverging courses.
BA-005
6 Decision Support Systems (DSS)
Controllers receive limited long term and short term conflict alerts and can model solutions. Traffic Management Advisor (TMA) is used as a DSS guideline to meter aircraft to arrival gates.
Decision Support and arrival/departure sequencing functionality. Decision Support and metering closer to the runway with increased accuracy.
BA-006a BA-006b
7 Traffic Management (TM)
En route controllers are involved in implementation of TM initiatives. TRACON controller’s involvement usually limited to ground stops/ground delay programs. En route facility TM deals with regional traffic flows, monitoring, and verifying conformance to national programs. TMCs in TRACONs primary duty is to manage capacity in the terminal and optimize traffic to the runway.
BA and en route Traffic Management Coordinators (TMC) will perform similar duties and work in concert to meet national TM initiatives while optimizing airspace and runway utilization.
BA-007
11-4

Table 11-3 – Big Airspace (BA) OHA Hazards Worksheets Hazard
No. Hazard
Description Causes System State Possible Effects Severity/
Rationale Existing
Controls and Requirements
Recommended Safety Controls
or Requirements
Safety Objective
BA-001 Surveillance degradesbelow Required Surveillance Performance (RSP).
- Loss of surveillance source. - Surveillance data does not meet accuracy requirements. - Target positioning error by fused surveillance.
Normal operations with all aids/tools available. ARR/DEP environment (3- nm separation standards applied) with high-density traffic load; sector saturation.
and Inclement weather conditions - poor visibility, wind, precipitation.
and A/c are on converging flight path.
- Reduction in separation or significant reduction in ATC capability. - Significant increase in flight crew workload. - Significant reduction in safety margin or functional capability.
3/Major Surveillance capability not lost; just not as accurate. When detected, ATC will revert to alternative procedural separation - applying increased separation procedures.
N/A Automationsystem shall verify surveillance accuracy and provide alert to ATC when SDP performance is questionable or suspect.
Remote
BA-002a Data Processing (DP) provides corrupted or misleading flight information.
- Uncertainty in new DP system design, reveals unintended consequences and shortfalls, such as, information management systems inability to insure system reliability; e.g., prevent bad data transmission and viruses. - Networked DP leading to increased vulnerabilities. - Human error; failure to properly provide Flight Data.
Normal operations with all aids/tools available. ARR/DEP environment (3- nm separation standards applied) with high-density traffic load; sector saturation.
and Inclement weather conditions - poor visibility, wind, precipitation.
and
- Reduction in separation or significant reduction in ATC capability. - Significant increase in flight crew workload. - Significant reduction in safety margin or functional capability.
3/Major
Surveillance capability is not lost and it is assumed ATC detects displayed flight data is corrupted or misleading; verifying via voice; taking alternative corrective action.
N/A N/A Remote
11-5

Hazard No.
Hazard Description
Causes System State Possible Effects Severity/ Rationale
Existing Controls and Requirements
Recommended Safety Controls
or Requirements
Safety Objective
A/c are on converging flight path.
BA-002b Loss of flight Data Processing service.
- Major facility infrastructure element failure. - Inherent DP component or subsystem failure. - Failure of service supporting DP; e.g., power or network synchronization. - Environmental physical damage (natural or man-made); e.g., temperature/ humidity extremes, fire, water, pests, or earthquake.
- Human error; failure to properly conduct DP and/or maintain DP equipment.
Normal operations with all aids/tools available. ARR/DEP environment (3- nm separation standards applied) with high-density traffic load; sector saturation.
and Inclement weather conditions - poor visibility, wind, precipitation.
and A/c are on converging flight path.
- Reduction in separation or significant reduction in ATC capability. - Significant increase in flight crew workload. - Significant reduction in safety margin or functional capability.
3/Major
Surveillance capability not lost and it is assumed ATC would detect loss of DP service and immediately revert to alternative procedural separation.
N/A N/A Remote
BA-003 Loss of PBN capability. A/c experiences either onboard, ground based, or space based navigational system failure; e.g., ADS-B, DME, FMS, GPS.
Normal operations with all aids/tools available. ARR/DEP environment (3- nm separation standards applied) with high-density traffic load; sector saturation.
and Inclement weather conditions - poor visibility, wind,
-Reduction in separation or significant reduction in ATC capability. - Significant increase in flight crew workload. - Significant reduction in safety margin or functional capability.
3/Major
It is assumed ATC would detect navigational error and immediately revert to alternative procedural navigational separation.
N/A N/A Remote
11-6

Hazard No.
Hazard Description
Causes System State Possible Effects Severity/ Rationale
Existing Controls and Requirements
Recommended Safety Controls
or Requirements
Safety Objective
precipitation.
and A/c are on converging flight path.
BA-004a Inaccurate misleading, “Airspace Structures and Procedures.”
Failure to properly “Provide Airspace Design Management.” Dynamic resectorization is inaccurate or insufficient.
Normal operations with all aids/tools available. ARR/DEP environment (3- nm separation standards applied) with high-density traffic load; sector saturation.
and Inclement weather conditions - poor visibility, wind, precipitation.
and Critical constraints in effect such as SUA and altitude restrictions.
and/or
Interloper a/c is on converging flight path with SUA a/c.
- Collision with other a/c, obstacles, or terrain. - Hull loss. - Multiple fatalities.
1/Catastrophic
It is assumed that ATC does not detect displayed inaccurate or misleading airspace structures and/or procedures, thus, ATC may inadvertently direct a/c on a collision course with a structure or an SUA a/c.
N/A N/A ExtremelyImprobable
11-7
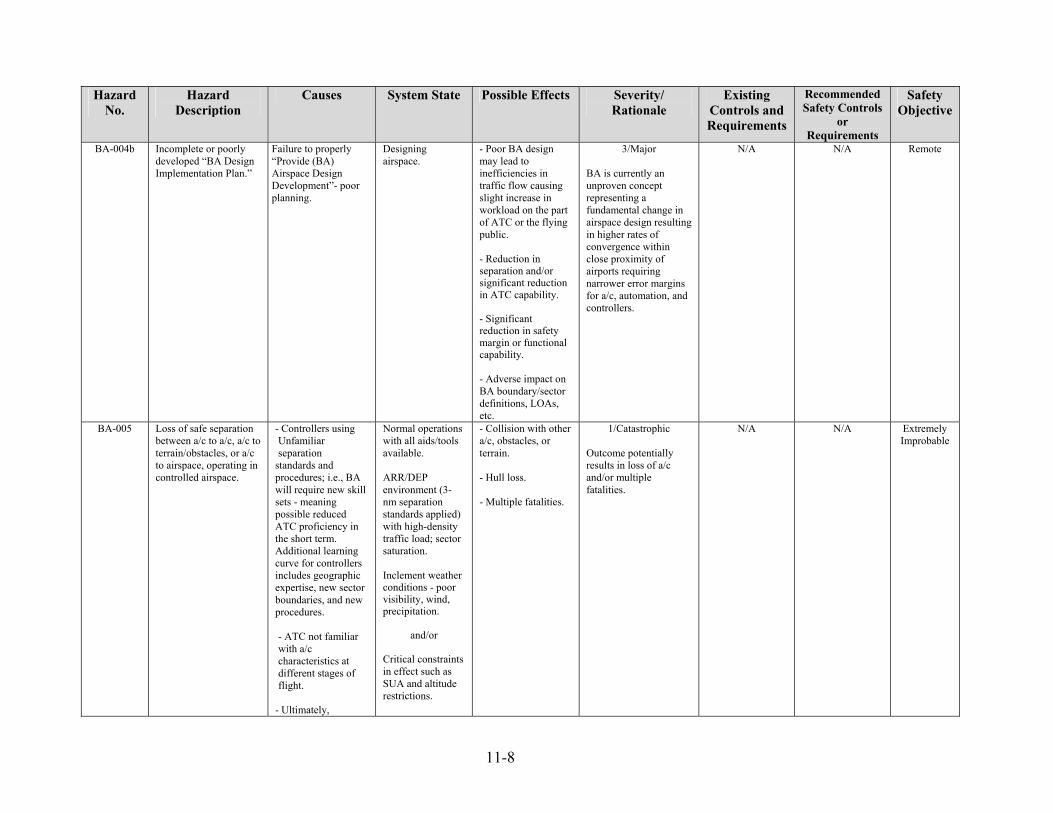
Hazard No.
Hazard Description
Causes System State Possible Effects Severity/ Rationale
Existing Controls and Requirements
Recommended Safety Controls
or Requirements
Safety Objective
BA-004b Incomplete or poorly developed “BA Design Implementation Plan.”
Designing airspace.
- Poor BA design may lead to inefficiencies in traffic flow causing slight increase in workload on the part of ATC or the flying public. - Reduction in separation and/or significant reduction in ATC capability. - Significant reduction in safety margin or functional capability. - Adverse impact on BA boundary/sector definitions, LOAs, etc.
BA is currently an unproven concept representing a fundamental change in airspace design resulting in higher rates of convergence within close proximity of airports requiring narrower error margins for a/c, automation, and controllers.
N/A N/A Remote
BA-005 Loss of safe separation between a/c to a/c, a/c to terrain/obstacles, or a/c to airspace, operating in controlled airspace.
Unfamiliar separation
standards and procedures; i.e., BA will require new skill sets - meaning possible reduced ATC proficiency in the short term. Additional learning curve for controllers includes geographic expertise, new sector boundaries, and new procedures. - ATC not familiar with a/c characteristics at different stages of flight.
- Ultimately,
Normal operations with all aids/tools available.
Inclement weather conditions - poor visibility, wind, precipitation.
and/or Critical constraints in effect such as SUA and altitude restrictions.
- Collision with other a/c, obstacles, or terrain. - Hull loss. - Multiple fatalities.
1/Catastrophic
Outcome potentially results in loss of a/c and/or multiple fatalities.
N/A N/A Extremely Improbable
Failure to properly “Provide (BA) Airspace Design Development”- poor planning.
3/Major
- Controllers using
ARR/DEP environment (3-nm separation standards applied) with high-density traffic load; sector saturation.
11-8

Hazard No.
Hazard Description
Causes System State Possible Effects Severity/ Rationale
Existing Controls and Requirements
Recommended Safety Controls
or Requirements
Safety Objective
controller fails to adjust short term trajectory of a/c or issue proper clearance, and pilot fails to maintain safe separation of a/c.
and A/c are on converging flight path.
BA-006a Loss of DSS Support.
- Major facility infrastructure element, or DS system/subsystem failure.
- Human error; failure to properly provide DS solution sets and/or maintain system..
Normal operations with all aids/tools available. ARR/DEP environment (3- nm separation standards applied) with high-density traffic load; sector saturation. Inclement weather conditions - poor visibility, wind, precipitation.
and/or Critical constraints in effect such as SUA and altitude restrictions.
and A/c are on converging flight path.
- Reduction in safe separation between carrier a/c to a/c, a/c to terrain/obstacles, or a/c to airspace, operating in Terminal Airspace. - Significant reduction in ATC capability. - Significant increase in flight crew workload. - Significant reduction in safety margin or functional capability.
3/Major
It is assumed ATC/pilot would detect loss of DSS/TMA generated flight information and immediately revert to manual sequencing. Can lead to reduced situational awareness and increased controller response time. Moreover, controllers may lose skills by over-dependence on DSSs such as loss of situational awareness.
N/A N/A Remote
BA-006b Decision SupportSystem solution sets are misleading.
- DSS/TMA degradation/ corruption. - Failure to properly provide correct DSS/TMA solution sets.
Normal operations with all aids/tools available. ARR/DEP environment (3- nm separation standards applied) with high-density traffic load; sector saturation.
- Reduction in separation or significant reduction in ATC capability. - Significant increase in flight crew workload. - Significant reduction in safety
3/Major It is assumed that either ATC or pilot, detects misleading or erroneous DSS/TMA generated Terminal flight information, and immediately reverts to manual sequencing.
N/A N/A Remote
11-9

Hazard No.
Hazard Description
Causes System State Possible Effects Severity/ Rationale
Existing Controls and Requirements
Recommended Safety Controls
or Requirements
Safety Objective
Inclement weather conditions - poor visibility, wind, precipitation.
and/or Critical constraints in effect such as SUA and altitude restrictions.
and A/c are on converging flight path.
margin or functional capability.
BA-007
Ineffective “Departure Synchronization Plan.”
- Failure to properly provide, “Departure Synchronization Plan.” - Poor planning, primarily due to unfamiliarity with BA operations.
Current demand exceeds currently established departure rate.
Specified departure rate does not meet current demand leading to increased congestion, delays, and possibly increase, significant in ATC workload.
4/Minor
As BA remains an unproven concept; blended TMC roles may confuse lines of authority. Decisions for aircraft release/departure into overhead streams may become challenging since departures may remain in BA airspace for over twice as long and twice as high as current terminal airspace. As a result, ATC will require additional traffic flow information for sequencing with en route traffic.
N/A N/A Probable
11-10

11.3 Assessment of Safety Objectives Figure 11-1 is a graphical representation depicting the number of Safety Objectives per Table 11-1, and the worst case credible hazard severities, as per the results of the OHA. Based upon these severities, Safety Objectives were established categorizing each individual hazard safety risk at no greater than Medium.
Fre
Pro
Re
ExtrRe
ExtImpr
y
Figure 11-
Severit
No SafetyEffect Minor Major Hazardous Catastrophic
Likelihoodquent A
bable B
1
mote C
7
emely mote D
remely obable E
2
*
* Unacceptable with Single Point and/or Common Cause Failures
Note: Recommended safety requirements are identified to assure that risk is within the medium or low risk zones of the table. The high risk zone is not acceptable.
High Risk
Medium Risk
Low Risk
1. Safety objective assessment matrix.
11-11

11.4 Allocated Safety Objectives and Requirements
The OSA was prepared in support of the implementation of the BA concept into the NAS— establishing Safety Objectives for the purpose of identifying Safety Requirements for inclusion into applicable Requirements Documents. Due to the current conceptual development stage of the BA, no specific system architecture was assumed for the analysis. Based on this initial assessment, one potential requirement has been identified. It relates to ensuring that the Automation system verifies surveillance accuracy and provides alerts to ATC when Surveillance Data Processing performance is questionable or suspect. This requirement should be validated as program requirements are developed.
11.5 Conclusions and Recommendations An OSA was conducted in accordance with the reference documents listed in Table 11-4. Ten hazards were identified (Table 11-3) as per the OHA, resulting in worst case credible hazard severities. Based upon these severities, Safety Objectives were established (Table 11-1), categorizing each individual hazard safety risk at no greater than Medium. Although this analysis is based on the current state of knowledge of the BA Concept of Operations, the design is not complete—all hazards may not be adequately identified. After the BA concept becomes fully defined, the OSA will be updated to reflect any new information. Moreover, Safety hazard assessments will subsequently continue throughout the program lifecycle in response to changes to hardware, software, operational concept, and/or interfaces. These subsequent assessments shall be coordinated with ATO-S and the ATO System Safety Working Group. These results will be provided to the BA program for promulgation into applicable Requirements Documents and for periodic review of changes to the baselined safety risk.
Table 11-4. Operational Safety Assessment References
FAA Order 8040.4, Safety Risk Management FAA Safety Management System (SMS) Manual, Version 1.1, May 21, 2004 FAA System Safety Handbook (SSH), December 30, 2000 FAA Safety Risk Management Guidance for Systems Acquisition (SRMGSA), V1.4, November 29, 2006 FAA Integrated Arrival/Departure Control Service (Big Airspace) Concept of Operations, August 2005.
11-12

12 REQUIREMENTS ANALYSIS The Integrated Arrival/Departure Control Service (Big Airspace) Concept of Operations published in August of 2005 described the assumptions, benefits, and air traffic operational and control service technical requirements associated with providing a more integrated arrival and departure air traffic control service. BA concept validation activities conducted in the ensuing two years have confirmed or disproved some of these original assumptions. This BA concept validation research has identified areas where realization of the concept depends on the successful implementation of new operational and technical requirements, and where original assumptions made regarding operational and technical requirements have been disproved due to a lack of dependency on the realization of benefits. The operational requirements identified drive many of the technical requirements. In many instances, a detailed assessment, such as an Operational Safety Assessment, will be needed to definitively list the requirements. In such cases, the analyses that must be done, their potential findings, and the associated challenges and uncertainties are described below. In other instances, the requirements do not pose any technical challenges, with elements already contained in existing Preliminary and Final Program Requirements documents. Other requirements discussed in the section are not necessary to achieve the benefits of BA in 2012–2015 timeframe, but are expected to increase the overall effectiveness in this time period and may be needed to achieve additional benefits in later time periods when traffic increases.
12.1 Operational Requirements
12.1.1 Procedural Requirements The original BA Operational Concept was based on three major procedural changes: 3-mile separation and use of current minima for diverging courses (See FAA Order 7110.65R, section 5-5-7 for a description) in all arrival and departure airspace, as well as the use of visual separation standards above 18,000 feet. For the purpose of the BA concept validation, arrival/departure airspace was defined to be 100 nm from the major airport and up to FL 270, but the airspace could be larger or smaller depending on the specific traffic flows for each site. The ability to operate with diverging course procedures and 3-mile separation is dependent on surveillance accuracy, which is a function of the speed of the radar, the accuracy of the target based on the proximity of the target to the radar antenna, and the methods used to process and display the target information on the controller’s radar display. RSP standards exist for 3- and 5-mile separation, but this standard would need to be expanded to address surveillance performance requirements for diverging courses. Development of RSP for diverging courses is technically feasible and, if started in the near future, should be accomplished by 2010. The ability for existing technologies to meet the RSP for these procedures does pose a technical risk, which is discussed below under surveillance requirements. Achieving the benefits afforded by the BA concept is dependent on the ability to implement these procedural changes. Although the expanded use of visual separation procedures above 18,000 feet was contained in the BA operational concept, it was not used in the real-time simulations because the scenario
12-1

used was a bad weather scenario (versus one where visual separation procedures could be applied) and because the use of this procedure is not within the capabilities of the simulation pilots. As the real-time simulations validated that the benefits of the concept can be achieved without this procedural change, it is no longer considered to be an operational requirement for the implementation of BA. However, air traffic control subject matter experts believe that this procedural change could provide additional benefits to BA. If this procedure is pursued in the future for BA implementation, its use will require the successful completion of a safety assessment by Flight Standards. This assessment would need to determine whether pilots can accurately recognize specific aircraft at greater speeds in higher altitudes where the closure rates between aircraft are faster. The results of this assessment may conclude that this procedure cannot be safely implemented at faster speeds in higher altitudes only using a pilot’s visual abilities.
12.1.2 Airspace Design Requirements
The success of achieving the operational benefits associated with the BA concept is highly dependent on the ability to develop site-specific airspace design plans that incorporate key features of the concept. The most important operational features, including both procedural changes and airspace redesign, needed to produce benefits may vary by site. Site-specific airspace design will provide the information needed to help clarify many of the uncertainties identified during concept validation. The development and successful implementation of airspace redesign plans that incorporate significant route changes in lower altitudes, such as BA, are major undertakings that require environmental and noise assessments and consultation with impacted communities and constituencies. These activities take years to complete and, in the best case, it is expected that airspace design, environmental assessment, and implementation activities, such as controller training, will require at least 5 years. Any delay in this area would directly delay implementation of the concept. An important component of BA airspace design is the close spacing of parallel area navigation routes. The Performance-Based Navigation (PBN) requirement for BA may vary by site, depending on the route spacing needed to accommodate the airspace design. Although PBN standards exist, BA may alter current implementation plans, as discussed below in Navigation Requirements. Closely spaced area navigation routes are an important component of BA and significant contributor to the concept’s benefits. The other BA airspace design characteristic that can be expected to yield significant benefits in many locations, especially those with convective weather, is dynamic airspace reconfiguration of bi-directional arrival/departure routes. It should be possible to implement this concept feature based on airspace design changes alone without the need for any additional safety or technical assessments. Post real time simulation experiment questionnaires revealed controllers thought that dynamic resectorization would not be a problem because sectors are safely combined and de-combined today to adjust for changes in demand, and controllers involved in resectorization are aware of the traffic in the affected sectors before resectorization occurs, so minimal debriefing is needed.
12-2

12.1.3 Control Environment
Concept validation methods did not allow for testing the entirety of the control room environment. However, subjective feedback from the real-time simulations, expert judgment received throughout this study, and the concept itself suggest that the implementation of BA will require changes to the control environment, including the integration of all arrival/departure airspace management, integrated traffic flow management, and a common radar and assist/handoff automation platform. The integration of all air traffic management functions through a combined control facility is expected to improve communication and coordination, which will improve work flows and, in turn, expedite traffic flows. The BA operational concept calls for an integrated traffic management strategy where traffic managers play even more of a role than they do today. Expanded traffic management in the BA concept creates a single entity for arrival/departure airspace that evaluates plans and initiates flexible airspace and aircraft routings to meet expected flows and traffic volume demands. Traffic management experts expect that the success of implementing key BA operational improvements, such as Dynamic Airspace Reconfiguration, may be dependent on an integrated Traffic Management Unit (TMU) in order to expedite dynamic route changes. For example, to minimize the disruptive impacts of a weather event, it is important that route changes are planned and implemented before arrival and departure routes become impacted. In the current environment, this takes coordination between traffic management and air traffic control managers in both the TRACON and, in many cases, multiple en route centers, each of which has a limited view of the situation. An integrated arrival/departure facility will eliminate artificial boundaries, which will expand the situational view and decrease the amount of coordination and negotiation needed to adjust flows, leading to faster and likely improved workaround strategies that reduce system disruptions. This will also lead to improved and less fragmented coordination with the Air Traffic Control System Command Center, which will help to further improve and expedite changes and minimize system-wide impacts. The operational control room in the BA facility should be designed in a way that facilitates the coordination process by situating those working adjacent flows side by side. As air traffic controllers are trained to work all positions in an operational area to facilitate workflows and staffing, it will be important that controller toolsets are common for the entire facility.
12.2 Technical Requirements
12.2.1 Surveillance Requirements The BA Operational Concept requires that surveillance systems meet current RSP criteria for 3- mile separation and future RSP criteria for the use of current minima for diverging courses (See FAA Order 7110.65R, section 5-5-7 for a description) in all arrival and departure airspace. Currently, NAS TRACONs use single-site, high rotation speed radar (6 sec update) for 3 nm and other Terminal separation procedures—limited to 40 nm from the antenna or 60 nm with ASR-9/Mode-S. ARTCCs use long range radar (12 sec update) operating in mosaic radar data processing mode for 5 nm lateral separation and single-site adapted long range radar for 3 nm separation within 40 nm of the antenna. For the purpose of the BA concept validation,
12-3

arrival/departure airspace was defined to be 100 nm from the major airport and up to FL 270, but the airspace could be larger or smaller depending on the specific traffic flows for each site. Research is still needed to determine the technologies that will satisfy RSP to safely meet the procedural requirements. Potential findings of this research are changes to surveillance data processing algorithms to enable data fusion (already contained in the STARS and ERAM tracker system specifications) and perhaps firmware upgrades to long range radars to add time stamps and upgrade to Internet Protocol data exchange. Research will also need to validate whether or not transition to Automatic Dependent Surveillance-Broadcast alone would allow all of these operational requirements to be met safely. The FAA Enterprise Architecture “Increase Arrivals/Departures at High Density Airports Roadmap” shows the reduction in horizontal separation standards to 3 miles beginning in 2012. It describes this operational capability as being enabled through the integration of multiple surveillance sources (primary, beacon, and automatic dependent surveillance); increased surveillance coverage area and availability; and improved surveillance data processing that increase the position accuracy. For each BA location, a detailed surveillance coverage analysis based on a detailed airspace plan would likely be needed to fully understand the full implications of RSP compliance.
12.2.2 Navigation Requirements
In the BA concept validation study, routes were spaced 5 miles apart from centerline to centerline. Although Performance-Based Navigation (PBN) standards exist for aircraft navigation systems to ensure that aircraft can be flown within this containment zone, detailed airspace design and analysis will be needed to determine the precise requirements for BA. Specific navigation performance requirements may be based on Area Navigation (RNAV) or Required Navigation Performance (RNP) standards. A requirement for RNP Level 1 (RNP-1) or RNAV-1, which represents 95 percentile accuracies of +/- 1.0 nautical mile, will be required at a minimum to achieve a 5-mile route spacing interval. The Roadmap for Performance-Based Navigation (FAA, July 2006, version 2.0) calls for the introduction of airspace and procedures improvements using PBN in the near term (2006–2010), including the introduction of RNP-1 SIDs and STARs where beneficial. In the mid term (2011–2015), the Roadmap calls for RNP-1 or lower SIDs and STARs where beneficial and outlines a plan to mandate RNAV for arriving and departing aircraft at Operational Evolution Partnership airports by the end of this timeframe. In the far term (2016–2025), the Roadmap discusses mandating RNP in busy terminal airspace. Although BA navigation requirements are consistent with the overall strategies outlined in the Roadmap, site airspace design plans are likely to require an update that delineates the planned mandate for RNAV or RNP for departing and arriving aircraft at major airports or busy terminal airspace. A PBN mandate for BA may present a challenge in the mid term.
12.2.3 Communications Requirements Communications requirements were considered for ground-to-ground communications, air-to-ground communications, voice switching, and data communications. The results of the rough level of magnitude airspace and facility analysis indicate that in the combined control room case, a new voice switch would be needed that could handle up to 140 radar and assist/handoff
12-4

positions plus support positions. The FAA Enterprise Architecture shows a new voice switch known as the NAS Voice Switch (NVS) with an initial operational date in 2013 with the capabilities to handle the BA requirements for operational positions and dynamic airspace changes. Assumptions were made regarding ground-to-ground communications and air-to-ground radio requirements for cost-estimating purposes. Detailed program plans would be needed to determine the true requirements in this area. Ground-to-ground links would be needed to carry any new air-to-ground radio channels or surveillance sources to the BA facility, as well as to provide communications between the BA and any adjacent ATC facilities. The BA concept should not increase and may even decrease the number of air-to-ground frequencies required. During transition, the total number required would increase temporarily. Additional radio frequencies needed for transition could require additional RCAG equipment, including VHF/UHF Transmitters, VHF/UHF Receivers, Antennas, and Radio Control Equipment, as well as other ancillary equipment associated with this change. Recent studies conducted by FAA ATO Technical Operations found that the spectrum was available to meet modest projected demand for new frequencies over the next decade. This analysis did not include any assumption regarding future frequency demands associated with implementation of this concept. The Chicago to New York corridor, an area where BA is likely to be highly beneficial, is the most congested from an air-to-ground communications perspective. Therefore, detailed airspace design should aim to minimize the number of frequencies needed in BA to ensure that the overall number of frequencies required for BA is no greater and preferably less than the number being used today to control the same airspace. In addition, the impact that transition strategies would have on spectrum requirements should also be included to ensure feasibility. The output from surveillance studies, discussed above, should provide an understanding of the surveillance sources needed to meet RSP as well as the associated communications latency requirement. The communications cost associated with relaying surveillance data will depend on the number and type of surveillance sources and the availability and latency required. The real-time simulation analysis demonstrated that data communications is not needed to implement this concept at 2012 traffic levels, and the Human Performance modeling found that by using BA control methods alone, controllers could handle up to 50 percent more traffic in total, with about the same workload levels as in baseline (2012) traffic conditions. If data communications were used for clearances and transfer of control tasks under the BA concept, the model suggests that controllers could handle about 100 percent more traffic and up to 150 percent before the workload started to degrade performance. Therefore, data communications would enhance the benefits of the concept and may be especially beneficial as traffic increases over time.
12.2.4 Automation Requirements The real-time simulations demonstrated that the BA concept could use existing en route and terminal automation systems capabilities. Based on BA study findings, as well as discussions with en route and terminal controllers and engineers, general automation requirements were
12-5

identified. Specific solutions and automation alternatives to meet these requirements will need to be evaluated based on future preliminary program requirements. As described above under surveillance requirements, changes to existing surveillance data processors may be needed to support 3-mile separation standards. Post-HITL survey questionnaires also revealed that most participants felt that the J-ring or Continuous Range Readout function would provide sufficient spacing guidance regardless of the separation required; however, one participant commented that having a clear indication of heavy aircraft would be essential when 3 nm separation is in use. In the real-time simulations, controllers working arrival and departure transition airspace used existing en route flight data processing capabilities (Host, Display System Replacement, and URET); and those working departure and feeder sectors did not. Post-HITL survey questionnaires revealed that most participants reported that it would be important for those working the higher and lower altitude sectors to be trained similarly and to use the same equipment. In addition, under the combined control room concept, it would not be cost effective to use multiple automation systems. Both en route and terminal controllers and engineers familiar with existing and future automation system capabilities were consulted regarding whether or not flight data processing amendment capabilities were important for BA control. It was unanimously thought that the ability to amend flight plans was needed due to the size of the airspace, especially to deal with diversions and overflights. The real-time simulations only used the flight plan list and amendment features of URET and did not utilize the conflict probe capability. The same group of controllers and engineers did not feel that conflict probe or any new conformance monitoring automation capability would be needed. The real-time simulations did not use the arrival TMA per se; however, attempts were made to create the schedule as if a time-based metering tool had been used to deliver the aircraft to the BA boundary. The en route and terminal controllers and engineers were asked their opinion of arrival metering tool requirements for BA. There was consensus that TMA would be needed with enhancements. Currently, TMA meters to the boundary of terminal airspace, and the tool could handle the additional RNAV routes through adaptation. For effective use of multiple arrival paths, additional metering points would be required within the BA arrival transition areas, with final meter points near the sector boundaries between the arrival transition and feeder sectors. Additionally, TMA calculations would need to evolve beyond 1-minute estimates to ensure minimum separation at RNAV arrival convergence points. Research should be done to determine the necessary level of accuracy for multiple converging arrival routes at 3-mile separation. Research should also be performed on the concept of dynamically assigned arrival and departure routes. Ideally, an aircraft should be assigned the route that is most in line with its existing flight path. However, to expedite the movement of aircraft and/or reduce the impact of multiple vectors and interim altitude assignments, an alternate arrival or departure route might be the more effective and/or preferred alternative. Technical requirements concerning route assignment, communication of route structure, and impacts on TMA would all need to be defined.
12-6

There was no departure sequencing automation capability used in the real-time simulations; therefore, the results of this study suggest that for the generic airspace and 2012 traffic levels, a departure sequencing tool is not needed. The en route and terminal controllers and engineers felt that a departure sequencing tool, not necessarily the current Departure Spacing Program used in the New York TRACON today, would be needed especially for departures from any airport where the same runway is used for both arrivals and departures. In addition, an integrated departure scheduler that analyzed the interrelationships of closely spaced major metropolitan airports would optimize common departure paths and optimally reduce ground delay.
12.2.5 Requirements Summary
BA concept validation identified many operational and technical requirements. Research is needed in many of these areas to develop Preliminary Program Requirements. In order to implement the BA concept as a midterm solution for high density terminal operations, many challenges will need to be met successfully. Table 12-1 provides a summary of the key operational and related technical requirements, as well as the challenges that must be met to implement the operational concept.
12-7

Table 12-1. Requirements Summary
Operational Requirement Technical Requirement Challenges • 3-mile separation in all
arrival/departure airspace • RSP for 3 mile separation • Surveillance and
automation upgrades to meet RSP
• Diverging course procedures in all arrival/departure airspace
• RSP for diverging courses • RSP criteria for diverging courses
• Surveillance and automation upgrades to meet RSP
• Closely spaced parallel routes
• Performance Based Navigation
• TMA upgrades • Departure Sequencing tool
• Determination of RNP or RNAV requirements
• Mandates for Performance Based Airspace and associated business case
• TMA level of accuracy for multiple converging arrival routes at 3-mile separation.
• Departure sequencing tool for mixed use runways
• Airspace redesign • To be determined • Environmental and Noise • Public opinion
• Dynamic bi-directional routes
• TMA upgrades • Research optimal route assignments
• Combined control facility • Facility/Control room design
• Common R&D side displays with ability to amend flight plan
• Concerns of impacted constituencies and communities
• Integrated TMU (Roles and Responsibilities need to be further defined)
• Need to determine whether current tools are sufficient
• To be determined
12-8

13 CONCLUSIONS AND RECOMMENDATIONS The FAA and supporting contractor organizations performed a multifaceted concept validation on the Integrated Arrival/Departure Airspace, “BA,” concept, which included simulation, facility consolidation, cost-benefit, safety and risk, and requirements analyses. These analyses evaluated the feasibility and operational benefits associated with the expanded use of 3-mile separation standards and current minima for diverging courses in all arrival and departure airspace, and dynamic airspace reconfiguration of bi-directional arrival/departure routes. The totality of the BA Concept Validation research found that an Integrated Arrival and Departure concept would be applicable and beneficial for any major metropolitan area where there are very large airports, particularly those where there are multiple airports whose arrival and departure flows interact. The results of the simulation evaluations validated the operational feasibility of the concept by showing service provider improvements and operational efficiencies. Service provider impacts were evaluated in terms of workload, task performance, safety, and controller acceptance. Operational efficiencies included savings in flight time and distance flow as well as use of more efficient flow strategies. The HITL simulation showed that both the combined and separate control room options for integrated arrival and departure airspace result in user and FAA benefits. Controller activities and comments, however, indicated potential added benefit from working together in a combined control environment. In addition, traffic management experts suggest that the success of implementing key BA operational improvements, such as Dynamic Airspace Reconfiguration, may be dependent on an integrated Traffic Management Unit in order to expedite dynamic route changes. Implementation of the BA concept at seven BA Facilities covering eight major metropolitan areas was found to be highly cost beneficial. The analysis suggests that the BA concept is likely to be cost-effective for all major metropolitan areas. Although the benefit methodology should not be used to draw any definitive conclusion regarding the cost-effectiveness of the concept at any particular site, the results do suggest that the concept may be more highly beneficial for some metropolitan areas. New RSP standards are needed for expanded use of diverging course procedures. Research is still needed to determine the technologies that will satisfy RSP to safely meet both 3-mile separation and diverging course procedural requirements. For each BA location, a detailed surveillance coverage analysis based on a detailed airspace plan would likely be needed to fully understand the implications of RSP compliance. Although the expanded use of visual separation procedures above 18,000 feet was contained in the BA operational concept, it was not used in the real-time simulations because the scenario used was a bad weather scenario (versus one where visual separation procedures could be applied) and because the use of this procedure is not within the capabilities of the simulation pilots. As the real-time simulations validated that the benefits of the concept can be achieved without this procedural change, it is no longer considered to be an operational requirement for the implementation of BA. However, air traffic control subject matter experts believe that this procedural change could provide additional benefits to BA. If this procedure is pursued in the
13-1

future for BA implementation, its use will require the successful completion of a safety assessment by Flight Standards. Detailed airspace analysis and design work will also be needed to determine where this concept would be most beneficial and to gain information needed to complete requirements and associated business cases. This analysis is needed to validate the requirement for Performance-Based Navigation, develop sector designs that would support staffing studies, and support the environment analysis that must be completed on low altitude airspace design changes. Both detailed airspace analysis and facility options are needed to develop a transition and implementation strategy. These results would provide inputs into the Business Case, especially regarding the impact of the concept to operations costs. The transition strategy needs to assess spectrum requirements to ensure feasibility. Based on BA study findings, as well as discussions with en route and terminal controllers and engineers, general automation requirements were identified. Specific solutions and automation alternatives to meet these requirements will need to be evaluated based on future preliminary program requirements. It was unanimously thought that the ability to amend flight plans was needed due to the size of the airspace, especially to deal with diversions and overflights. TMA with enhanced capabilities to support BA concepts, and a departure metering tool were expected to improve the operational effectiveness of the concept. Lastly, the controllers working the BA should use a common automation toolset. The results of multiple simulation methods all conclude that an integrated arrival and departure concept will result in service provider and user benefits from improved traffic flows and traffic management. It is recommended that the FAA work toward implementing this concept as an initial step toward NextGen Super Density operations. Challenges exist to implement this concept in the near term, and research should be initiated to meet these challenges and define detailed program requirements. Operational characteristics of major metropolitan areas should be examined to determine a prioritized list of future BA sites. Lastly, the integration of arrival and departure airspace in a single integrated facility is recommended. Since new large TRACON buildings exist in most major metropolitan areas, it would be most economical to locate BA operations in these buildings, at least for an initial implementation of integrated arrival and departure airspace. Where new large TRACONs do not exist, new facilities are needed to house the integrated arrival/departure airspace. These facilities should be considered in the overall plan for GSDPs, as described in the NextGen concept. These GSDP facilities could also provide an economical solution for high altitude airspace restructuring that would be needed after implementing the BA concept. GSDP facility decisions should be made in consideration of moving toward this BA concept.
13-2
REFERENCES
Algina, J., & Keselman, H. J. (1997). Detecting repeated measures effects with univariate and multivariate statistics. Psychological Methods, 2, 208-218.
Baddeley, A. D. and Hitch, G. J. (1974). Working memory. In G. Bower (Ed.), Advances in
Learning and Motivation, 8, 47-90. New York: Academic Press. Federal Aviation Administration, Southern Regional Office. (1999). Sun Coast TRACON study. Federal Aviation Administration & EUROCONTROL. (2003). FAA/EUROCONTROL
cooperative R&D: Action Plan 5 operational concept validation strategy document. Edition 1.3.
Geisser, S., & Greenhouse, S. W. (1958). An extension of Box’s results on the use of the F
distribution in multivariate analysis. Annals of Mathematical Statistics, 29, 885-891. Hadley, J., Sollenberger, R., D'Arcy, J., & Bassett, P. (2000). Interfacility boundary adjustment
(DOT/FAA/CT-TN00/06). Atlantic City International Airport: Federal Aviation Administration William J. Hughes Technical Center.Hollnagel, E (1993). The Context of Control. Duxbury Press.
Huynh, H., & Feldt, L. S. (1976). Estimation of the Box correction for degrees of freedom from
sample data in randomized block and split-plot designs. Journal of Educational Statistics, 1, 69-82.
Joint Planning and Development Office (2006). Concept of Operations for the Next Generation
Air Transportation System. Laughery, R., Archer, S. & Corker, K. (2001). Modeling Human Performance in Complex
Systems. In G. Salvendy (Ed.), Handbook of Industrial Engineering. Interscience Human Performance Modeling, Hoboken, New Jersey: Wiley.
McCracken, J.H. & Aldrich, T.B. (1984). Analysis of selected LHX mission functions:
Implications for operator workload and system automation goals (Technical note ASI 479-024-84(b)). Fort Rucker, AL: Anacapa Sciences, Inc.
Myers, J. L., & Well, A. D. (2003). Research design and statistical analysis (2nd ed.). New
Jersey: Lawrence Erlbaum Associates. NAS Architecture 6. (n.d). Retrieved January 2006 from the Federal Aviation Administration
NAS Architecture 6 Web site: http://nas-architecture.faa.gov/nas/home.cfm O’Brien, R. G., & Kaiser, M. K. (1985). MANOVA method for analyzing repeated measures designs: an extensive primer. Psychological Bulletin, 97, 316-333.
R-1

Peterson, L. M., Bailey, L. L., & Willems, B. F. (2001). Controller-to-controller communication and coordination taxonomy (C4T) (DOT/FAA/AM-01/19). Washington, DC: Office of Aerospace Medicine.
Shah, A. P., Pritchett, A.R., Feigh, K.M., Kalaver, S.A., Jadhav, A., Corker, K.M., Holl, D.M., &
Bea, R.C. (2005). Analyzing air traffic management systems using agent-based modeling and simulation. USA/Europe International Symposium in Air Traffic Control, Baltimore, MA.
Sollenberger, R. L., Stein, E. S., & Gromelski, S. (1997). The development and evaluation of a
behaviorally based rating form for assessing air traffic controller performance (DOT/FAA/CT-TN96/16). Atlantic City International Airport: Federal Aviation Administration William J. Hughes Technical Center.
Stein, E.S. (1985). Air traffic controller workload: An examination of workload probe.
(DOT/FAA/CT-TN84/24). Atlantic City International Airport: Federal Aviation Administration William J. Hughes Technical Center.
Stein, E. S., Della Rocco, P. S., Sollenberger, R. L. (2005). Dynamic resectorization in air traffic
control: A human factors perspective (DOT/FAA/CT-TN05/19). Atlantic City International Airport, NJ: Federal Aviation Administration William J. Hughes Technical Center.
Stone, M. and Brooks, R.J. (1990). Continuum Regression: Cross-validated sequentially
constructed prediction embracing ordinary least squares, partial least squares and principal components regression. Journal of the Royal Statistical Society: Series B (Methodological) 52 (2), 237-269.
Truitt, T., McAnulty, D. M., & Willems, B. (2004). Effects of collocation and reduced lateral
separation standards in the New York integrated control complex (DOT/FAA/CT-TN04/08). Atlantic City International Airport, NJ: Federal Aviation Administration William J. Hughes Technical Center.
Vardaman, J. J., & Stein, E. S. (1998). The development and evaluation of a behaviorally based
rating form for the assessment of en route air traffic controller performance (DOT/FAA/CT-TN98/5). Atlantic City International Airport: Federal Aviation Administration William J. Hughes Technical Center.
Verma, S. & Corker, K. (2001). Introduction of context in human performance model as applied
to dynamic resectorization. In Proceedings of the 11th International Symposium on Aviation Psychology, Columbus, Ohio: Ohio State University.
R-2

ACRONYMS AND ABBREVIATIONS
A/C Aircraft ADOC Airline Direct Operating Cost AF Airway Facilities ANOVA Analysis of Variance ARR/DEP Arrival/Departure ARTCC Air Route Traffic Control Center ARTS Automated Radar Terminal System ASR-9 Airport Surveillance Radar Model 9 AT Air Traffic ATC Air Traffic Control ATO-E Air Traffic Organization – En Route and Oceanic Services ATO-P Air Traffic Organization – Operations Planning ATO-T Air Traffic Organization – Terminal Services B/C Benefit/Cost BA Big Airspace BAC BA/Combined BANC BA/Not-Combined BCT Boston TRACON BFOT Backfill Overtime BL Baseline BY Base Year CDM Collaborative Decision Making CHI Computer Human Interface CIP Capital Investment Plan CPC Certified Professional Controller CRD Computer Readout Display CWT Cognitive Walk Through D-Side Data Side DESIREE Distributed Environment for Simulation, Rapid Engineering and Experimentation DL Data Link DP Data Processing DME Distance Measuring Equipment DRVSM Domestic Reduced Vertical Separation Minimum DSR Display System Replacement DSS Decision Support System DST Decision Support Tool DYSIM Dynamic Simulation ER Experiment Room ERAM En Route Automation Modernization F&E Facilities and Equipment FAA Federal Aviation Administration FAAO Federal Aviation Administration Order FDG Future Demand Generator FL Flight Level
ACR-1

FMS Flight Management System FT Fast Time ft Foot FTE Full Time Equivalent FTI FAA Telecommunications Infrastructure GA General Aviation GPS Global Positioning System GSDP General Service Delivery Point HAIL Human Automation Integration Laboratory HITL Human-in-the-Loop HPM Human Performance Model HOCSR Host/Oceanic Computer System Replacement HOST En Route Host Computer System HPM Human Performance Model(ing) I90 Houston TRACON IFR Instrument Flight Rules K Thousand LCC Life Cycle Cost LOA Letter of Agreement MCO Orlando International Airport MIDAS Man Machine Integrated Design and Analysis System MIL Military MLB Melbourne International Airport msec Milliseconds N/A (n/a) Not Applicable NAS National Air Space System NCT Northern California NextGen Next Generation Air Transportation System nm Nautical Miles NPV Net Present Value NYICC New York Integrated Control Complex O&M Operations and Maintenance OHA Operational Hazard Assessment OJT On-the-Job Training OPS Operations OSA Operational Safety Assessment ORF Observer Rating Form ORL Orlando Executive Airport PBN Performance Based Navigation PCS Permanent Change of Station PEQ Post-Experiment Questionnaire PI Principal Investigator POET Post Operational Evaluation Tool PSQ Post-Scenario Questionnaire PTT Push to Talk PV Present Value
ACR-2

PVT Passenger Value of Time R-Side Radar Side RCAG Remote Communications Air/Ground RDHFL Research and Development Human Factors Laboratory RFS Reconfigurable Flight Simulator RNAV Area Navigation RNP Required Navigation Performance ROM Rough Order of Magnitude RSP Required Surveillance Performance RTI RunTime Infrastructure RVSM Reduced Vertical Separation Minimum SCT Southern California TRACON SD Standard Deviation SDAT Sector Design Analysis Tool SDP Surveillance Data Processing SFB Orlando Sanford International Airport SID Standard Instrument Departure SJSU San Jose State University SME Subject Matter Expert SOP Standard Operating Procedure SRMGSA Safety Risk Management Guidance for Systems Acquisition STAR Standard Terminal Arrival Route STARS Standard Terminal Automation Replacement System SUA Special Use Airspace TAF Terminal Area Forecasts TARGETS Terminal Area Route Generation Evaluation and Traffic Simulation TFM Traffic Flow Management TGF Target Generator Facility TM Traffic Management TMA Traffic Management Advisor TMC Traffic Management Coordinator TMU Traffic Management Unit TPA Tampa International Airport TRACON Terminal Radar Approach Control Tx Transmissions UHF Ultra High Frequency URET User Request Evaluation Tool VHF Very High Frequency WAK Workload Assessment Keypad WJHTC William J. Hughes Technical Center Wx Weather ZAU Chicago Cleveland Air Route Traffic Control Center ZJX Jacksonville Air Route Traffic Control Center ZLA Los Angeles Air Route Traffic Control Center ZMA Miami Air Route Traffic Control Center ZOB Cleveland Air Route Traffic Control Center
ACR-3

Appendix A - Informed Consent Statement
I, ______________________________, understand that this study, entitled “Big Airspace: A Human-in-the-Loop Evaluation of an Integrated Arrival/Departure Control Service” is sponsored by the Federal Aviation Administration and is being directed by Dr. Mike McAnulty.
Nature and Purpose: I have been recruited to volunteer as a participant in this project. The purpose of the study is to determine the effects of alternative air traffic control procedures in a high-fidelity, controller-in-the-loop simulation. The results of the study will be used to establish the feasibility of implementing these alternative or similar air traffic control procedures in an operational environment.
Experimental Procedures: En route Certified Professional Controllers (CPCs) and Terminal CPCs will arrive at the simulation laboratory in groups of eight and will participate for 6 days over a 2-week simulation session. Each participant will work complex traffic scenarios that involve handoffs with other participants. The first 3 days of the simulation will consist of a project briefing, equipment familiarization, and practice scenarios. During the second week, the CPCs will work twelve 50-minute scenarios. A daily caucus will be scheduled at the end of each test day. On the final day, both en route and terminal CPCs will participate in a 1-hour debriefing session. The participants will work from about 8:30 AM to about 5:00 PM every day with a lunch break and at least two rest breaks.
The participants will control traffic under each of three different experimental procedures. After each scenario, the participants will complete questionnaires to evaluate the impact of the alternative procedures on participant workload and acceptance. In addition, subject-matter experts will make over-the-shoulder observations during the simulation to further assess the procedures. Finally, an automated data collection system will record system operations and generate a set of standard ATC simulation measures, which include safety, capacity, efficiency, and communications measures. The simulation will be audio-video recorded in case researchers need to reexamine any important simulation events.
Confidentiality: My participation is strictly confidential, and I understand that no individual names or identities will be associated with the data or released in any reports.
Benefits: I understand that the only benefit to me is that I will be able to provide the researchers with valuable feedback and insight into the effects of alternative ATC procedures for use in en route and terminal airspace. My data will help the FAA to establish the feasibility of these procedures within such an environment.
A-1

Participant Responsibilities:
I am aware that to participate in this study I must be a certified professional controller who is qualified at my facility and holds a current medical certificate. I will control traffic and answer questions asked during the study to the best of my abilities. I will not discuss the content of the experiment with anyone until the study is completed.
Participant Assurances: I understand that my participation in this study is completely voluntary and I can withdraw at any time without penalty. I also understand that the researchers in this study may terminate my participation if they believe this to be in my best interest. I understand that if new findings develop during the course of this research that may relate to my decision to continue participation, I will be informed.
I have not given up any of my legal rights or released any individual or institution from liability for negligence.
The research team has adequately answered all the questions I have asked about this study, my participation, and the procedures involved. I understand that Dr. McAnulty or another member of the research team will be available to answer any questions concerning procedures throughout this study.
If I have questions about this study or need to report any adverse effects from the research procedures, I will contact Dr. McAnulty at (609) 485-5380.
Discomfort and Risks: I understand that I will not be exposed to any foreseeable risks or intrusive measurement techniques. I agree to immediately report any injury or suspected adverse effect to Dr. Mike McAnulty at (609) 485-5380. Local clinics and hospitals will provide any treatment, if necessary. I agree to provide, if requested, copies of all insurance and medical records arising from any such care for injuries/medical problems.
Signature Lines: I have read this informed consent form. I understand its contents, and I freely consent to participate in this study under the conditions described. I understand that, if I want to, I may have a copy of this form.
Research Participant:________________________________________ Date:__________
Investigator:_______________________________________________ Date:__________
Witness:__________________________________________________ Date:__________
A-2

P#_____ Date_______________ Airspace Type: En Route/BA Terminal
Appendix B - Biographical Questionnaire
Instructions: This questionnaire is designed to obtain information about your background and experience as a certified professional controller (CPC). Researchers will only use this information to describe the participants in this study as a group. Your identity will remain anonymous.
Demographic Information and Experience
1. What is your gender? Male Female
2. What is your age? _____ years
3. How long have you worked as an Air Traffic Controller (include both FAA and military experience)? _____ years _____ months
4. How long have you worked as a CPC for the FAA? _____ years _____ months
5. How long have you actively controlled traffic in the en route
environment? _____ years _____ months
6. How long have you actively controlled traffic in the terminal
environment? _____ years _____ months
7. How many of the past 12 months have you actively controlled
traffic? _____ months
8. Rate your current skill as a CPC. Not
Skilled 123456789Extremely Skilled
9. Rate your level of motivation to participate in this study. Not
Motivated 123456789Extremely Motivated
B- 1

P#_____ Date_______________ Condition: baseline BA/C BA/N Scenario:______ Sector: 10 10D 20 20D A AH D DH
Appendix C - Post-Scenario Questionnaire-1
Instructions: Please answer the following questions based upon your experience in the scenario just completed. Your identity will remain anonymous.
1. Rate your overall level of ATC performance during this scenario. Poor 123456789 Excellent
2. Rate your overall level of situation awareness during this scenario. Poor 123456789 Excellent
3. Rate your situation awareness for current aircraft locations during this scenario. Poor 123456789 Excellent
5. Rate your situation awareness for potential aircraft loss-of-separation during this scenario. Poor 123456789 Excellent
6. Rate your workload due to ground-to-ground communications during this scenario.
Extremely Low 123456789 Extremely
High
7. Rate your overall workload during this scenario. Extremely Low 123456789 Extremely
High
4. Rate your situation awareness for projected aircraft locations during this scenario. Poor 123456789 Excellent
For R-side Controllers Only:
8. Rate your ability to move aircraft through the sector during this scenario. Poor 123456789 Excellent
9. Rate your workload due to air-to-ground communications during this scenario.
Extremely Low 123456789 Extremely
High
10. Rate the performance of the simulation pilots in terms of their responding to your control instructions and providing readbacks.
Extremely Poor 123456789
Extremely Good
C-1

P#_____ Date_______________ Airspace Type: En Route/BA Terminal
Appendix D - Post-Scenario Questionnaire-2 For Big Airspace Conditions Only:
1. What effect, if any, did the reduced lateral separation standard (3 nm) have on your ability to control traffic? Negative
Effect
123456789 |
None
Positive Effect
Explain how the reduced lateral separation standards affected your ability to control traffic, if at all.
___________________________________________________________________________
___________________________________________________________________________
___________________________________________________________________________
___________________________________________________________________________
___________________________________________________________________________
___________________________________________________________________________
___________________________________________________________________________
___________________________________________________________________________
2. What effect, if any, did the use of other terminal procedures (e.g.,
green between, diverging courses) have on your ability to control traffic?
NegativeEffect
123456789 |
None
Positive Effect
Explain how the use of other terminal procedures affected your ability to control traffic, if at all.
___________________________________________________________________________
___________________________________________________________________________
___________________________________________________________________________
___________________________________________________________________________
___________________________________________________________________________
___________________________________________________________________________
___________________________________________________________________________
D-1

P#_____ Date_______________ Airspace Type: En Route/BA Terminal
3. What effect, if any, did the dynamic sector boundaries have on your ability to control traffic (e.g., in terms of timeliness, coordination with other sectors, impact on workload, and traffic flows)?
NegativeEffect
123456789 |
None
Positive Effect
Explain how the dynamic sector boundaries affected your ability to control traffic, if at all.
___________________________________________________________________________
___________________________________________________________________________
___________________________________________________________________________
___________________________________________________________________________
___________________________________________________________________________
___________________________________________________________________________
___________________________________________________________________________ 4. What effect, if any, did the increase in the number of RNAV routes
have on your ability to control traffic? NegativeEffect
123456789 |
None
Positive Effect
Explain how the increase in the number of RNAV routes affected your ability to control traffic, if at all.
___________________________________________________________________________
___________________________________________________________________________
___________________________________________________________________________
___________________________________________________________________________
___________________________________________________________________________
___________________________________________________________________________
___________________________________________________________________________ 5. Do you have any additional comments or clarifications about your experience in the simulation?
___________________________________________________________________________
___________________________________________________________________________
___________________________________________________________________________
D-2

P#_____ Date_______________ Airspace Type: En Route/BA Terminal
Appendix E - Post-Experiment Questionnaire
Instructions: Please answer the following questions based upon your overall experience in the simulation. Your answers will remain anonymous.
1. Compared to baseline, what effect, if any, did the ‘Big
Airspace’/non-collocated condition have on your control strategies?
NegativeEffect
123456789 |
None
Positive Effect
Explain how the ‘Big Airspace’/non-collocated condition affected your control strategies, if at all.
___________________________________________________________________________
___________________________________________________________________________
___________________________________________________________________________
___________________________________________________________________________
___________________________________________________________________________
2. Compared to baseline, did your communication strategies change during the ‘Big Airspace’/non-collocated condition?
Not AtAll 123456789
A Great Deal
Explain how the ‘Big Airspace’/non-collocated condition affected your communication strategies, if at all.
___________________________________________________________________________
___________________________________________________________________________
___________________________________________________________________________
___________________________________________________________________________
___________________________________________________________________________
E-1

P#_____ Date_______________ Airspace Type: En Route/BA Terminal
3. Compared to baseline, what effect, if any, did the ‘Big
Airspace’/collocated condition have on your control strategies? NegativeEffect
123456789 |
None
Positive Effect
Explain how the ‘Big Airspace’/collocated condition affected your control strategies, if at all.
___________________________________________________________________________
___________________________________________________________________________
___________________________________________________________________________
___________________________________________________________________________
___________________________________________________________________________
4. Compared to baseline, did your communication strategies change during the ‘Big Airspace’/collocated condition?
Not AtAll 123456789
A Great Deal
Explain how the ‘Big Airspace’/collocated condition affected your communication strategies, if at all.
___________________________________________________________________________
___________________________________________________________________________
___________________________________________________________________________
___________________________________________________________________________
___________________________________________________________________________
5. Rate the realism of the overall simulation experience compared
to actual ATC operations. Extremely Unrealistic 123456789
Extremely Realistic
6. Rate the realism of the simulation hardware compared to actual
equipment. Extremely Unrealistic 123456789
Extremely Realistic
7. Rate the realism of the simulation software compared to actual
functionality. Extremely Unrealistic 123456789
Extremely Realistic
E-2

P#_____ Date_______________ Airspace Type: En Route/BA Terminal
8. Rate the realism of the simulation traffic scenarios compared to actual NAS traffic.
Extremely Unrealistic 123456789
Extremely Realistic
9. To what extent did the WAK online workload rating technique interfere with your ATC performance?
None At All 123456789
A Great Deal
10. Are there any additional requirements (e.g., for communications, automation, surveillance) you feel are necessary for controllers to implement the Big Airspace concept in an operational setting?
___________________________________________________________________________
___________________________________________________________________________
___________________________________________________________________________
___________________________________________________________________________
___________________________________________________________________________
11. Describe any aspects of the Big Airspace concept that are highly positive.
___________________________________________________________________________
___________________________________________________________________________
___________________________________________________________________________
___________________________________________________________________________
___________________________________________________________________________
12. Describe any aspects of the Big Airspace concept that are highly negative.
___________________________________________________________________________
___________________________________________________________________________
___________________________________________________________________________
___________________________________________________________________________
___________________________________________________________________________
E-3

P#_____ Date_______________ Airspace Type: En Route/BA Terminal
13. Do you have any comments or suggestions for improvement about our simulation capability?
___________________________________________________________________________
___________________________________________________________________________
___________________________________________________________________________
___________________________________________________________________________
___________________________________________________________________________
14. Is there anything about the study that we should have asked or that you would like to comment about?
___________________________________________________________________________
___________________________________________________________________________
___________________________________________________________________________
___________________________________________________________________________
___________________________________________________________________________
E-4

Date_______________
Appendix F - Communication Score Sheet (Arrival)
Communication Type
A >>>> 01 01 >>>> A
Glance
Approval
Handoff
Point Out
Traffic
Altitude
Route
Speed
Weather
Frequency
Flow Messages
Equipment
ACID
Non-verbal (pointing)
Non-ATC
Other
Could Not Code
F-1

Date_______________ Condition: baseline BA/C BA/NC Scenario:______
Appendix G - Observer Rating Form (ORF)
This form is designed to be used by Subject Matter Experts (SMEs) to evaluate the effectiveness of controllers working in simulations. You will observe and rate the controllers’ performance on several different performance dimensions using a rating scale of 1 to 8, with 1 indicating the least effective performance and 8 indicating the most effective performance. Most controller performance is at or above the minimum standards regarding safety and efficiency. The goal of the rating system is to differentiate performance above this minimum. The lowest rating should be assigned for meeting minimum standards and also for anything below the minimum since this should be a rare event. It is important for the observer/rater to feel comfortable using the entire scale and to understand that all ratings should be based on behavior that is actually observed.
The rating scale is provided at the top of the ORF, so you can refer to it as you make your ratings.
• Use the entire scale range.
• Write down your observations. Space is provided on the second page of the ORF for comments. Wait until the scenario is finished before making your final ratings. Remain flexible until the end of the scenario so you have an opportunity to see all the available behavior.
• At all times, focus on what you actually see and hear. This includes what the controller does and what you might reasonably infer from the actions of the pilots. If you do not observe relevant behavior or the results of that behavior, you may leave a specific rating blank.
• Remember to rate the arrival controllers and the departure controllers on separate forms.
• Do not write your name on the form. Enter only the observer code assigned to you.
• The observations you make may include other areas that you think are important.
G-1

Date_______________ Condition: baseline BA/C BA/NC Scenario:______
Rating Scale Descriptors
Least Effective 12345678 Most
Effective
I - MAINTAINING SAFE AND EFFICIENT TRAFFIC FLOW 1. Maintaining Separation and Resolving Potential Conflicts................................. 1 2 3 4 5 6 7 8 • using control instructions that maintain appropriate aircraft and airspace
separation
• detecting and resolving impending conflicts early • recognizing the need for speed restrictions and wake turbulence separation 2. Sequencing Aircraft Efficiently .......................................................................... 1 2 3 4 5 6 7 8 • using efficient and orderly spacing techniques for arrival, departure, and en
route aircraft
• maintaining safe arrival and departure intervals that minimize delays 3. Using Control Instructions Effectively/Efficiently ............................................. 1 2 3 4 5 6 7 8 • providing accurate navigational assistance to pilots • issuing economical clearances that result in need for few additional
instructions to handle aircraft completely
• ensuring clearances require minimum necessary flight path changes 4. Overall Safe and Efficient Traffic Flow Rating 1 2 3 4 5 6 7 8
Questions 5 & 6: Handoff position/D-side only 5. Handoff position/D-side – Communication and Coordination............................ 1 2 3 4 5 6 7 8
6. D-side – Entering Flight Plan Amendments........................................................ 1 2 3 4 5 6 7 8
Questions 7 through 13: Frequency of Occurrence Ratings
Occurred Unacceptably Often
Occurred More Than Normal
Occurred, but within Normal Limits of Operational Acceptability
1 2 4 5 8. Gave departing aircraft climb too late 2 3 4 5 9. Issued clearances earlier or later than appropriate 1 2 3 4 5 10. Offered handoffs earlier than appropriate 1 3 4 5 11. Offered handoffs later than appropriate 2 3 4 5 12. Accepted handoffs later than appropriate 1 3 5 13.Transfered communications later than appropriate 1 2 3 4 5
2 1
2 4
Rarely Occurred Never Occurred Task
7. Gave arriving aircraft descent too early
1 3
G-2

Date_______________ Condition: baseline BA/C BA/NC Scenario:______
Notes about observations:
___________________________________________________________________________
___________________________________________________________________________
___________________________________________________________________________
___________________________________________________________________________ ___________________________________________________________________________
Explanatory comments supporting the ratings:
___________________________________________________________________________
___________________________________________________________________________
___________________________________________________________________________
___________________________________________________________________________
___________________________________________________________________________
___________________________________________________________________________
___________________________________________________________________________
Differences in performance between sectors or positions:
___________________________________________________________________________
___________________________________________________________________________
___________________________________________________________________________
___________________________________________________________________________ ___________________________________________________________________________
G-3

Appendix H - Instructions for Participants Practice Scenario Instructions During this brief practice scenario, please take the opportunity to familiarize yourself with your position. Familiarize yourself with the landlines and the Workload Assessment Keypads, or WAKs as we call them. This practice scenario is for your benefit and you should use this time to prepare for the scenarios that will follow. I will now read the WAK instructions to you. Baseline Condition Instructions (Practice and Experiment) During this scenario, please control traffic as you normally would in the field. As in every scenario, you will be making workload ratings using the WAK. I will now read the WAK instructions to you. Big Airspace Condition(s) Instructions (Practice and Experiment) During this scenario, we will simulate the Big Airspace concept. Sector 10 and Sector 20 will use terminal separation and procedures. The lateral separation standard will be reduced from 5 nautical miles to 3 nautical miles. You may also use other terminal separation procedures such as diverging courses and green between separation criteria. The halos and conflict alert algorithm will be adjusted accordingly. The radar sweep will also be 5 seconds. You will also have dynamic sector boundaries, which will allow you to swap routes with the adjacent sectors, and additional RNAV routes. You will be informed by one of the experimenters (who will be acting as a supervisor) when the dynamic resectorization occurs. For Collocation, add the following italicized statement: During this scenario, we will simulate the collocation of terminal and en route facilities. Because there is no physical barrier between the terminal and en route sectors, face-to-face communication is possible and you may use it at your discretion. As in every scenario, you will be making workload ratings using the WAK. I will now read the WAK instructions to you. WAK Instructions (The full set of instructions will be read at the beginning of each test day). An abbreviated set of instructions will be read prior to each experimental run. The abbreviated instructions will omit the first paragraph below.)
One purpose of this research is to obtain an accurate evaluation of controller workload. By workload, we mean all the physical and mental effort that you must exert to do your job. This includes maintaining the “picture,” planning, coordinating, decision making, communicating, and whatever else is required to maintain a safe and expeditious traffic flow. Workload is your perception of how hard you must work to perform all of the tasks necessary to meet these demands, not necessarily a measure of how much traffic you are working. Workload levels fluctuate. All controllers, no matter how proficient, will experience all levels of workload at one time or another. It does not detract from a controller’s professionalism when he indicates that he is working very hard at certain times or that he is hardly working at other times.
Every 4 minutes the WAK device, located at your position, will emit a brief tone and the 10 buttons will illuminate. The buttons will remain lit for 20 seconds. Please tell us what your workload is at that moment by pushing one of the buttons numbered from 1 to 10.
H-1

At the low end of the scale (1 or 2), your workload is low - you can accomplish everything easily. As the numbers increase, your workload is getting higher. The numbers 3, 4, and 5 represent increasing levels of moderate workload where the chance of making a mistake (e.g., leaving a task unfinished) is still low but steadily increasing. The numbers 6, 7, and 8 reflect relatively high workload where there is some chance of making a mistake. At the high end of the scale are the numbers 9 and 10, which represent a very high workload, where it is likely that you will have to leave some tasks unfinished. Feel free to use the entire rating scale and tell us honestly how hard you are working at the instant that you are prompted. Do not sacrifice the safe and expeditious flow of traffic in order to respond to the WAK device. Does anyone have any questions? (After answering questions, if any, instruct participants to do comm check with pilots and adjacent sectors and centers.)
H-2

Appendix I -Comments on the Repeated Measures Experimental Design
The experiment uses a repeated measures design in which each participant is tested under each experimental condition. Experimenters often use a repeated measures (or within-subjects) design to control variability due to differences between participants. Too much variability related to participant differences may prevent the researcher from detecting significant effects that are due to the experimental conditions. However, there are certain assumptions that must be met when analyzing data from a repeated measures design. The data must be evaluated and determined not to violate sphericity, the assumption that the variances of the difference scores between the conditions are homogeneous. To address instances when there are violations of sphericity, some researchers employ multivariate analysis of variance (MANOVA) when analyzing repeated-measures data (Myers & Well, 2003; O’Brien & Kaiser, 1985). This analysis helps to avoid potentially inflated Type I error rates (incorrectly rejecting a true null hypothesis). Other researchers perform unfocused significance tests (i.e., omnibus ANOVA tests) to screen for differences in the data. When the omnibus ANOVA is significant but sphericity is violated, then a conservative F test is completed by adjusting the degrees of freedom (e.g., Geisser & Greenhouse, 1958; Huynh & Feldt, 1976) used to calculate the F statistic.4 If the conservative F test is significant, the data are then analyzed using conservative post hoc procedures for pair-wise comparisons (e.g., Tukey’s Honest Significant Difference (HSD) test).
4 Although the MANOVA avoids sphericity problems and inflated Type I error, it suffers even more severely from inflation of Type II error rates. Because there are methods that correct degrees of freedom (df) that reduce the risk of a Type I error, we recommend using these corrections in all but the most severe cases (see Algina & Keselman, 1997, for specific recommendations).
I-1

Appendix J - Detailed Basis of Estimate The following is the detailed basis of estimate for each WBS cost element: Cost Element: 2.0 Facilities Costs Definition: This cost element includes all activities associated with land purchases, environmental impact studies, new building construction or refurbishment of the existing facilities, and decommissioning. Methodology: New building construction costs and refurbishment are based on historical costs per square foot Calculation: (Number of Sq. Ft. * Cost per Sq. Ft.) New Building Construction: Square Foot Est. * New Construction Cost per Square Foot 1 Building @ 95,000 Sq. Ft. * $357.3 = $33,944K 1 Building @ 95,000 Sq. Ft. * $600.3 = $57,029K Refurbished Operational Space: Number of total BA Positions * Square Foot Est. * Refurbished Cost per Square Foot 459 Positions * 125 Sq. Ft. * $65.2 ($326.2 avg. sq. ft. for new Facility * 20%) = $3,741K Decommissioning: 2 *$50,000 = $100K Total Cost = $94,813K Source: BA Study "Position Estimates" file, Historical TRACON Studies and Actuals from Large TRACON Construction Projects Phasing: FY12 – FY13, FY24 Risk Adjustments: Values used are 0.84 (low), 1.00 (most likely) and 1.19 (high) using the Crystal Ball ® risk tool Most Likely Time Phased Cost Summary in Thousands of BY07 Dollars: Total 2010 2011 2012 2013 2014 2015 2016 2017 2018 2019 2020-2024 TotalAnnual Cost $0 $0 $45,485 $49,228 $0 $0 $0 $0 $0 $0 $100 $94,813 Cost Element: 3.0 Equipment Costs Definition: This cost element includes all automation, communication, surveillance and controller workstation equipment required at the BA facility. Also includes the cost of implementation for several air traffic control improvements. Methodology: Past Experience, Expert Judgment and Detailed Cost Estimates
J-1

Calculation: (Number of Locations x Unit Costs) Voice Switch (140 positions, 139 frequencies and 179 trunks) = “Source Selection Sensitive Pricing” Voice Switch site prep., installation, test, and checkout = “Source Selection Sensitive Pricing” R-Side Display = $200,000 132 * $200,000 = $26,400K D-Side Display = $100,000 104 * $100,000 = $10,400K Display site prep., installation, test and checkout = $10,000 per position (est.) 236 * $10,000 = $2,360K Remote Communications Air/Ground Radio (RCAG) = $100,000 per R-Side 132 * $100,000 = $13,200K Furniture (consoles, chairs, headsets, misc. electronic equipment) = $20,000 (est.) R- and D-Side for additional positions in refurbished buildings. (For new buildings, this cost is included for all positions in the Facilities estimate.) 114 * $20,000 = $2,280K Implementation of 3 miles separation for Terminal SDP and automation = $33M Implementation of Flight Data Management capabilities = $30M Implement additional Multi-Center - TMA capabilities = $7M Implementation of TMA and Departure/Arrival Sequence List capabilities = $35M STARS Automatic Barometric Pressure Entry (APBE) and CARTS/STARS workload capacity increase = $7M Total Cost = $177,792K Source: FAA Voice Switching and Recording Program Office, Equipment ROM Pricing and ATO-Terminal ROM Cost Estimates Phasing: FY10 - FY13 Risk Adjustments: Values used are 0.90 (low), 1.00 (most likely) and 1.20 (high) using the Crystal Ball ® risk tool Most Likely Time Phased Cost Summary in Thousands of BY07 Dollars: Total 2010 2011 2012 2013 2014 2015 2016 2017 2018 2019 2020-2024 TotalAnnual Cost $22,000 $20,000 $35,000 $100,792 $0 $0 $0 $0 $0 $0 $0 $177,792 Cost Element: 4.0 Technical Support (incl. Sys. Eng.) Definition: This cost element includes all activities associated with engineering design, systems engineering, logistics planning and system testing at the BA facility. Also included are the costs for several design studies and implementation plans. Methodology: Staff Loading of Engineering Support Personnel, Expert Judgment and Detailed Cost Estimates
J-2

Calculation: (FTE * Annual Salary) 3 FTEs (Systems, Logistics, and Test Planning) * $175,000 = $525,000 1.25 FTE (ANI Telecommunications Support) * $150,000 = $187,500 Airspace Design & Analysis = $1,050K * 7 sites = $7,350K (FY10) Airspace Environmental = $4,000K * 7 sites = $28,000K Airspace Design Travel and Overtime = $450K * 7 sites = $3,150K (FY10) Data Fusion 3 Mile Separation Alternatives Evaluation, Procedures and Training Development and Implementation Plan = $11M Flight Data Management and SWIM and TMA CONOPS Requirements and CHI Prototype = $16M TFM Transition Strategy = $4M Airport Capacity Automation Distribution Evaluation = $4M Total Cost = $76,356K Source: NY TRACON Study dated 5/14/02, Program Office Studies and Estimates Phasing: FY10 - FY13 Risk Adjustments: Values used are 0.95 (low), 1.00 (most likely) and 1.05 (high) using the Crystal Ball ® risk tool Most Likely Time Phased Cost Summary in Thousands of BY07 Dollars: Total 2010 2011 2012 2013 2014 2015 2016 2017 2018 2019 2020-2024 TotalAnnual Cost $41,214 $15,047 $10,047 $10,047 $0 $0 $0 $0 $0 $0 $0 $76,356 Cost Element: 5.0 Program Management Definition: This cost element includes FAA headquarters program management personnel, field support and contractor labor to support the program office activities Methodology: Staff Loading of FAA and Support Personnel and Expert Judgment Calculation: (FTE * Annual Salary) 3 FTE FAA Program Management, 6 FTE Field Support, 2 FTE Contractor Support 9 FTE * $125,000 = $1,125,000 2 FTE * $200,000 = $400,000 $1,525,000 per year Terminal Procedures = $800,000 (Spread over first 2 years) Airspace Procedures Development = $200,000 per site $200K * 7 = $1,400K (FY13) Total Cost = $9,825K Source: PMO FTE Estimate
J-3

Phasing: FY10 – FY14 Risk Adjustments: Values used are 0.95 (low), 1.00 (most likely) and 1.05 (high) using the Crystal Ball ® risk tool Most Likely Time Phased Cost Summary in Thousands of BY07 Dollars: Total 2010 2011 2012 2013 2014 2015 2016 2017 2018 2019 2020-2024 TotalAnnual Cost $1,925 $1,925 $1,525 $2,925 $1,525 $0 $0 $0 $0 $0 $0 $9,825 Cost Element: 6.0 ATC Training
Definition: This cost element includes all activities associated with Air Traffic Control training and certification Methodology: Backfill Overtime costs and Instructor Training/Simulation Cost Estimates
Calculation: (Total Training Hours * BFOT Rate) Backfill Controller Rate = $66.03 * 1.5 = $99.05/hour 260 Hours of Training per Controller for Area Certification Classroom (e.g. procedures, map drawings and e-learning), DYSIM and OJT for both BA Controller and ARTCC Sector Airspace Retaining 649,157 Hours * $99.05 = $64,299K Instructor Training (Train-the-Trainer) - 2 Trainers, 40 hours * $66.02 (ATC Level 10/11) = $5K* 7 = $35K Simulation Lab Development - (2 Air Traffic Instructors * $154K) + (1 Sys. Eng. *$124K) + (1 Sr. C++ Programmer * $105K) = $537K * 7 = $3,759K Training Materials = $10K * 7 = $70K Map Study Instruction (Train-the-Trainer) - 2 Trainers, 40 hours * $66.02 (ATC Level 10/11) = $5K * 7 = $35K Validating course Material - 2 Trainers, 16 hours * $66.02 (ATC Level 10/11) = $2K * 7 = $14K Total Cost = $68,217K Source: Historical Training Costs Phasing: FY13 - FY14 Risk Adjustments: Values used are 0.90 (low), 1.00 (most likely) and 1.20 (high) using the Crystal Ball ® risk tool Most Likely Time Phased Cost Summary in Thousands of BY07 Dollars: Total 2010 2011 2012 2013 2014 2015 2016 2017 2018 2019 2020-2024 TotalAnnual Cost $0 $0 $0 $3,918 $64,299 $0 $0 $0 $0 $0 $0 $68,217
J-4

Cost Element: 7.0 AF Staffing (PCS) Definition: This cost element includes all support staff positions at the BA facility to support the additional position and automation equipment
Risk Adjustments: Values used are 0.83 (low), 1.00 (most likely) and 1.24 (high) using the Crystal Ball ® risk tool
Methodology: PCS costs for Managers, Supervisors, Coordinators, System Specialists, Computer Specialists, Logistics Specialists and Administrators Calculation: (# of PCS Positions * % Eligible * PCS Costs) Distance: 0-9 Miles = 0%, 10-34 Miles = 33%, 35-49 Miles = 50%, >50 Miles = 100% 29 Eligible Positions (ranges from 1-14 per site) * $87,864 = $2,548K
Source: BA Study "Position Estimates" file, Average PCS Cost Estimates
Phasing: FY14
Most Likely Time Phased Cost Summary in Thousands of BY07 Dollars: Total 2010 2011 2012 2013 2014 2015 2016 2017 2018 2019 2020-2024 TotalAnnual Cost $0 $0 $0 $0 $2,548 $0 $0 $0 $0 $0 $0 $2,548 Cost Element: 8.0 AT Staffing (PCS) Definition: This cost element includes all controller staffing positions moved from En Route or other TRACONs to the BA facilities including relocation expenses Methodology: PCS Cost Per Controller Calculation: (# of PCS Positions * % Eligible * PCS Costs) Distance: 0-9 Miles = 0%, 10-34 Miles = 33%, 35-49 Miles = 50%, >50 Miles = 100% 870 Eligible Positions (controllers assigned to new facilities ranges from 48 to 271 per site) * $87,864 = $76,442K Source: BA Study "Position Estimates" file, Average PCS Cost Estimates Phasing: FY14 Risk Adjustments: Values used are 0.93 (low), 1.00 (most likely) and 1.15 (high) using the Crystal Ball ® risk tool Most Likely Time Phased Cost Summary in Thousands of BY07 Dollars: Total 2010 2011 2012 2013 2014 2015 2016 2017 2018 2019 2020-2024 TotalAnnual Cost $0 $0 $0 $0 $76,442 $0 $0 $0 $0 $0 $0 $76,442
J-5

Cost Element: 9.0 Facilities Maintenance Definition: This cost element includes all activities with repair and maintenance of the new facilities Methodology: Cost Per Square Foot Calculation: (Square Foot Estimate * Cost per Square Foot)
Cost Per Sq. Ft. = $9.26 190,000 Sq. Ft. * $9.26 = $1,759K (Steady State) Total Costs = $19,353K Source: Historical Facility Maintenance Costs (New York TRACON Study dated 5/14/02)
Phasing: FY14 - FY24 Risk Adjustments: Values used are 0.90 (low), 1.00 (most likely) and 1.20 (high) using the Crystal Ball ® risk tool Most Likely Time Phased Cost Summary in Thousands of BY07 Dollars: Total 2010 2011 2012 2013 2014 2015 2016 2017 2018 2019 2020-2024 TotalAnnual Cost $0 $0 $0 $0 $1,759 $1,759 $1,759 $1,759 $1,759 $1,759 $8,797 $19,353 Cost Element: 10.0 Telecommunications Definition: This cost element includes all activities associated with telecommunications services including circuitry, equipment and infrastructure services costs Methodology: Telecommunications Cost per Site Calculation: (New and Refurbished Facilities * Annual Telecom Costs) Telecom costs for Remote Communications Air/Ground (RCAG) Radio Comm Cost for Air/Ground, Ground/Ground, and Surveillance Communication Air/Ground Comm (based on additional 132 R-Side positions) = $450 N/R, $34,500 Annual Cost per Sector Ground/Ground (based on 11 adjacent ARTCCs) = $225 N/R, $6,000 Annual Cost per Circuit
Phasing: FY14 - FY15 (Transition Period only)
Surveillance (based on 5 relayed from each ARTCC, totaling 35) = $250 N/R, $4,500 Annual Cost per Circuit Total Cost = $9,626K Source: ROM Estimate from FAA ATO-W FTI/ITT/TEOM
J-6
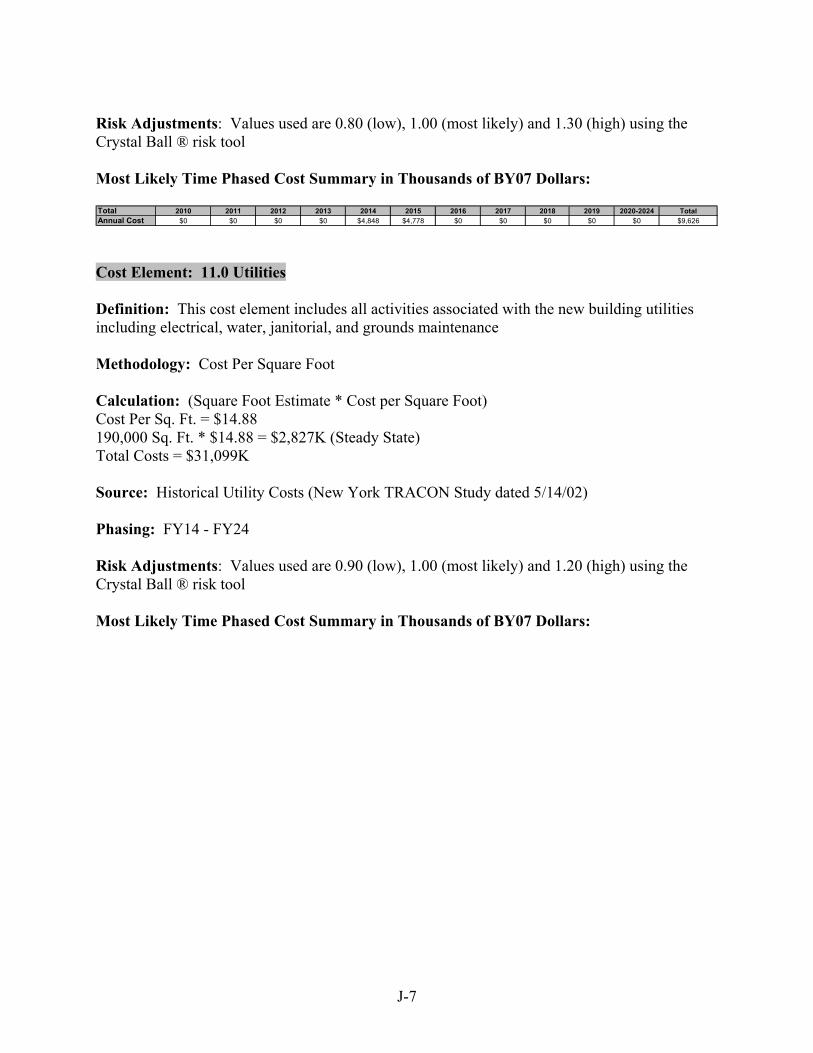
J-7
Risk Adjustments: Values used are 0.80 (low), 1.00 (most likely) and 1.30 (high) using the Crystal Ball ® risk tool Most Likely Time Phased Cost Summary in Thousands of BY07 Dollars: Total 2010 2011 2012 2013 2014 2015 2016 2017 2018 2019 2020-2024 TotalAnnual Cost $0 $0 $0 $0 $4,848 $4,778 $0 $0 $0 $0 $0 $9,626 Cost Element: 11.0 Utilities Definition: This cost element includes all activities associated with the new building utilities including electrical, water, janitorial, and grounds maintenance Methodology: Cost Per Square Foot Calculation: (Square Foot Estimate * Cost per Square Foot) Cost Per Sq. Ft. = $14.88 190,000 Sq. Ft. * $14.88 = $2,827K (Steady State) Total Costs = $31,099K
Source: Historical Utility Costs (New York TRACON Study dated 5/14/02) Phasing: FY14 - FY24 Risk Adjustments: Values used are 0.90 (low), 1.00 (most likely) and 1.20 (high) using the Crystal Ball ® risk tool
Most Likely Time Phased Cost Summary in Thousands of BY07 Dollars: