insurance, funds and capital market - mnb 2498-6097 (on-line) insurance, funds and capital market...
TRANSCRIPT
H-1054 BUDAPEST, SZABADSÁG TÉR 9. 177
AND CAPITAL MARKET R I S K R E P O R T
INSURANCE, FUNDS

‘… after mature consideration we have made a decision for the good of the whole country, its peaceful state and for the benefit of its residents…’
(from the ‘urban articles’ of 1405 of King Sigismund)

M A YH -1054 BU DA PEST, SZ A BA D SÁG TÉR 9.
7

Published by the Magyar Nemzeti Bank
Publisher in charge: Eszter Hergár
H-1054 Budapest, Szabadság tér 9.
www.mnb.hu
ISSN 2416-3562 (print)
ISSN 2498-6097 (on-line)

INSURANCE, FUNDS AND CAPITAL MARKET RISK REPORT • 2017 3
Pursuant to Act CXXXIX of 2013 on the Magyar Nemzeti Bank, the MNB supervises the financial intermediary system in order to ensure, amongst other things, the smooth, transparent and efficient functioning of the financial intermediary system, to foster prudent operations, to identify undesirable business and economic risks, to protect the interests of users of financial services and to strengthen public confidence in the financial intermediary system. Consistent with those tasks and in accordance with Article 135 (2) of the Act, the MNB has prepared this risk report, which presents the most important characteristics and risks of insurance companies, funds, intermediaries, non-banking group entities and markets of capital market participants.
The Report incorporates input from the Financial Institutions Supervision Executive Directorate, the Consumer Protection and Market Supervision Executive Directorate and the Directorate Methodology. The Report was approved for publication by Dr László Windisch, Deputy Governor.
Published by the Magyar Nemzeti Bank
Publisher in charge: Eszter Hergár
H-1054 Budapest, Szabadság tér 9.
www.mnb.hu
ISSN 2416-3562 (print)
ISSN 2498-6097 (on-line)


INSURANCE, FUNDS AND CAPITAL MARKET RISK REPORT • 2017 5
Contents
Executive Summary 7
1 Developments in households’ savings 10
2 Insurance market and its risks 132.1 Overall picture of the market 132.2 Life sector 172.3 Non-life sector 242.4 Profitability and capital position 282.5 Risks of the insurance market 322.6 Special features of intermediaries 36
3 Funds market and its risks 403.1 Overall picture of the funds sector 403.2. Voluntary pension funds 403.3. Health and mutual aid funds 493.4. Risks of the funds market 51
4 Financial enterprises not belonging to a banking group and their risks 58
5 Capital market and its risks 665.1 Investment services market: turnover and balances 675.2 Regulated market, post-trading infrastructures 715.3. Risks affecting the investment firms 735.4 Fund management market and risks affecting investment fund managers 785.5 Venture capital and private capital fund managers 84
6 Glossary 86


INSURANCE, FUNDS AND CAPITAL MARKET RISK REPORT • 2017 7
Executive Summary
The level of savings in Hungary has exceeded the level of the GDP every year since 2014; and while the savings-to-GDP ratio of EU-countries is practically stagnating, in Hungary a growing tendency can be observed. This has a fundamental effect on the entirety of the insurance, funds and capital market sectors.
The key indicators of the Hungarian insurance sector reflect improvement, and now it is clear that 2013 was a turning point. Total premium in the insurance sector in 2016 was close to HUF 900 billion. Premium levels this high were last observed on the market in 2008. Within the sector it can be observed that life and non-life markets show different trends: while the life segment is characterized by a consistent but moderate growth of premium, in the non-life segment the growth is stronger, more dynamic. The premium from regular premium life insurance products has steadily risen since 2013; last year, the premium from pension insurance accounted for almost 17 per cent of this. The regular premium market, which was formerly characterized by high concentration, gradually became more balanced in 10 years: based on premium, in the last three years 6 institutions had a market share over 5 per cent, 4 of which cover 55 per cent of the market. In the life segment the level of government securities exposure in underlying assets is outstanding even in European comparison, though among the risks of the life segment the market risk is significant: the low yield environment jeopardises the production of the guaranteed interest. In order to restore customer trust the MNB introduced the main parts of the ethical concept on a mandatory basis on 1st of January 2017 as an element of reducing the market appearance risk. It had a substantial effect on insurance product range with more expensive products phased out, as a result of which the customers may choose from a more homogenous product range with higher safety. In regard to the insurers’ profitability the fade-out of surrender profit may have risk, which could be compensated by the retention period of the contracts getting longer.
The driver of dynamic growth in the premium of non-life insurance market, observed since 2012, is the motor insurance, particularly the compulsory motor third party liability insurance (MTPL). While in previous years it was typical that the premiums and yields realised on reserves even together did not cover the claims and costs, in 2016 the premiums covered the full volume of claims and costs, even despite falling yields. As a sign of the competition getting fiercer, concentration of the entire non-life segment is continuously decreasing, except for the home insurance segment, where the concentration remained high and the profitability is outstanding, which indicates necessity to stimulate competition. Among the risks of the non-life segment it should be highlighted that the low yield environment decreases investment performance of the assets composing the equity, and from the profitability point of view the possible increase of claim ratio and combined ratio may represent risk, mainly in the MTPL market.
Profitability of the Hungarian insurance market shows a continuously rising trend: the amount of the profit and the profit to equity ratio is more and more favourable. Last year only three insurers realised losses. Despite the improving results, the profit volume has not yet reached three-quarters of the pre-crisis level. Consolidation of the sector is expected to continue, which may increase the returns of insurers. The sector’s capital position is excellent even by EU standards: capital adequacy is continuously improving.
In our view the favourable profitability tendencies in the future may allow a greater competition to unfold in the market of the various insurance products, and they may positively affect the value for money of insurance products.
Beside the dynamic assets growth of the voluntary funds sector, the process of concentration continued, now only 70 institutions operate. One of the reasons is that in 2016 a new category appeared in the market, the health and mutual aid funds, as a result of which some funds merged on efficiency considerations, on the other
MAGYAR NEMZETI BANK
INSURANCE, FUNDS AND CAPITAL MARKET RISK REPORT • 20178
hand the voluntary pension funds with less assets and fewer members merged into bigger institutions with banking and insurance background on an economies of scale basis.
Majority of the funds are basically still following a conservative investment strategy, the ratio of government securities is about 60 percent at the pension funds and 76 percent at the health and mutual aid funds, as a result of tightened investment diversification rules (the limit applicable to the liquid resource of the funds that may be placed with a single credit institution was reduced from the former 40 per cent to 20 per cent) The asset-weighted average net rate of return of the voluntary pension funds in 2016 was 6.59 per cent, so the funds can still be regarded as a form of savings of stable value despite the low yield environment. Owing also to the permanently favourable returns by the end of 2016 the assets of the pension funds grew to 150 percent of the pre-crisis level, exceeding 1200 HUF billion. The continuously growing number of new members since 2012 indicates that consumer trust towards pension funds is still strong. It is particularly important because in the period of 2002-2015 the number of fund members below the age of 33 considerably decreased, by 125 000 (“the missing generation”).
In the funds sector changes in the rules related to fringe benefits and the increase of tax burden on employers’ member fee contribution represents significant risk, as a result of which the employers’ member fee contributions may decrease mainly in the health and mutual aid funds segment, that can have a negative impact on the long-term sustainability of the institutions’ operation. The employers have an important role in member recruitment and in the active liaison with members; accordingly, due to the decrease in employers’ commitment, further increase may be expected in the ratio of members not paying membership fee (which is above 40 percent at both type of funds), and the sum deductible from yield to compensate the foregone operation income may decrease too due to the low yield environment. It is noteworthy though, that the ratio of individual contribution increases in the voluntary pension funds, while in 2007 the ratio of employers’ and individual fee payment was 71-29, which changed to 44-56, for 2016.
The contraction of credit institution refinancing funds continued in 2016, which the financial enterprises not belonging to a banking group are forced to replace it with other resources, typically related to the owners. The decreasing interest margins and narrowing refinancing funds are moving toward market consolidation in terms of credit activity. Thus those financial enterprises may remain in the market in the longer run that have a suitable size of operation, a well-capitalised ownership background, and that are able to grow from their own resources. The average balance sheet total of the financial enterprises not belonging to a banking group slightly decreased in the past year, and the average difference in respect of the size of the institutions increased. This evidences the analytical findings that the continuous compliance with the statutory licensing condition represents an increasing challenge for the institutions, which in several cases led to the withdrawal of their activity licence in recent years.
The financial lease portfolio of the financial enterprises not belonging to a banking group stagnates, as they failed to capitalise on the growth potential inherent in the market.
The whole capital market – besides the balanced consolidation process in the investment service sector – was characterized by stability both on institutional level and considering the portfolio managed by the sector. The sector adapted to the circumstances caused by the permanently low interest and yield environment on product and service level in a complex way. The MNB managed the risks of the institution system of the capital market, and it did not identify any type of risk that did not occur last year.
In 2016 growth in the portfolio of customer securities managed by investment service providers – credit institutions and investment firms – at market value continued, and simultaneously a shift in capital market investments was observed. Besides the nominal rise in the portfolio of government securities, in the lower yield environment there was a shift towards riskier instruments promising higher yields. The portfolio of long-term investment accounts increased further, however at a slower pace.
ExEcutIVE SuMMaRy
INSURANCE, FUNDS AND CAPITAL MARKET RISK REPORT • 2017 9
The turnover of the investment service providers decreased further in 2016, which was primarily caused by the decrease in the OTC spot and OTC derivative turnover, while the portfolio exchange spot turnover increased further. In 2016 the Budapest Stock Exchange registered four private capital increases, one initial and one secondary public offering, and four delisting events.
In the case of investment firms the credit, market, profitability and capital adequacy risks are considered high, having regard to the decreasing profitability stemming from the indemnification burdens, the existing market constraints, the strong competition and the high concentration of the sector. The consolidation process that started in 2015 continued in 2016, with the result of three investment firms returning their activity licence. The consolidation process is expected to continue, since the concentration of capital market turnover at the investment firms increased further in 2016, and besides the declining capital adequacy index, the number of loss-making investment firms rose significantly. In this regard it should be pointed out that in 2017 the indemnification burdens are considerably exceeding the level of 2016.
The assets managed by the investment fund managers continued to increase last year, albeit at a decreasing rate. The driver of the growth was essentially the pension fund sector. The assets managed in mutual funds were at a historic high in 2016; however, the period of dynamic growth ended: the net capital inflow was negative on the whole, thus the rise in the net asset value was attributable to the return on investment realised on the managed assets. Similarly to previous years the globally low interest environment, and the relatively high yield of the retail government securities led to capital outflows from the funds investing in short-term interest-bearing assets, which is the main reason for the negative net capital flow of the fund managers. In accordance with the previous trend, the growth in the real estate funds’ portfolio continued in 2016 as well, which is essentially linked with the real estate fund managed by three fund managers. On the whole it can be stated that similarly to the investment service sector, there are changes in progress in the composition of assets managed by fund managers, which makes it necessary for the fund managers to adept to these processes properly.
The fund management sector is still characterised by stable profitability and adequate capitalisation level, but the strengthening of cross-border services presumably leading to a decrease in fees might negatively affect the profitability and the capital position of certain small fund managers with low portfolio managed due to economies of scale reasons, particularly if their funds are affected by capital outflows. Despite this, we do not expect a strong consolidation process like in the case of investment firms.
In 2016 the number of venture capital funds did not change, while the number of private capital funds and of the institutions managing them, increased. The net asset value, the paid-in funds, the investments and loans granted managed by the venture and private capital funds dynamically grew in 2016, although it can be seen that considering the portfolio managed by the investment fund sector these values cannot be regarded as significant.
INSURANCE, FUNDS AND CAPITAL MARKET RISK REPORT • 201710
1 Developments in households’ savings
In addition to the dynamically increasing bond investments, there is also a substantial rise in long-term (insurance and pension funds) savings
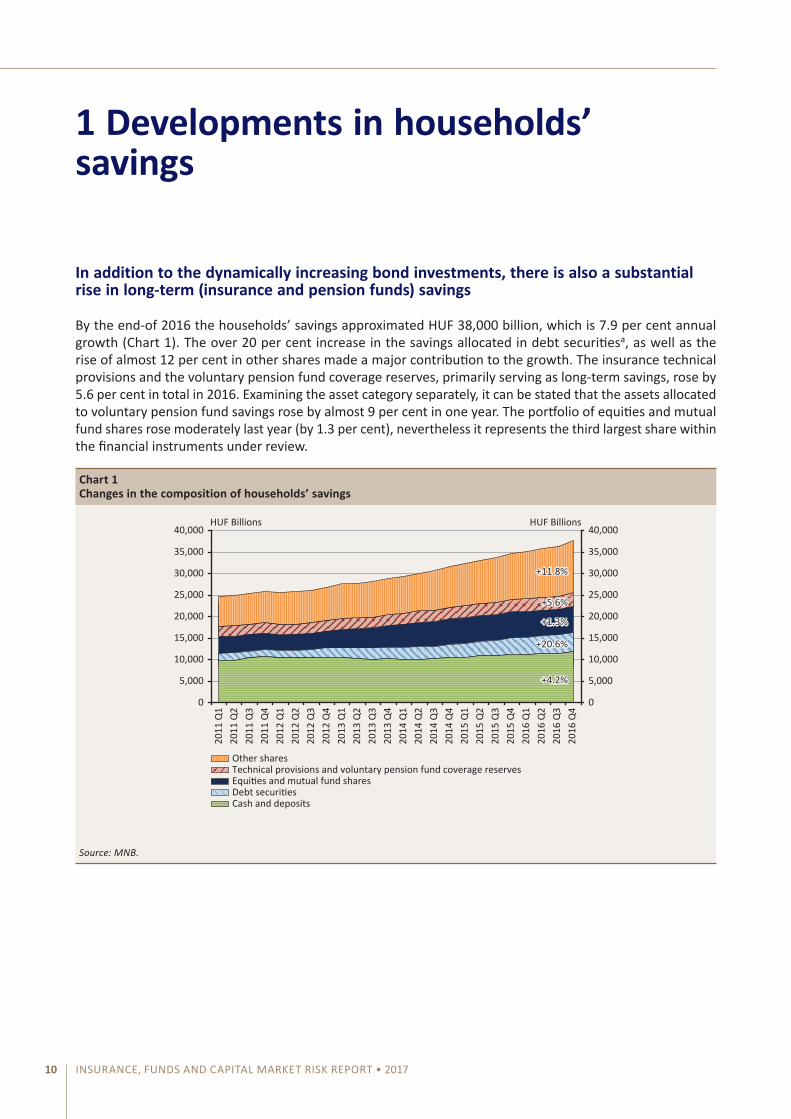
By the end-of 2016 the households’ savings approximated HuF 38,000 billion, which is 7.9 per cent annual growth (chart 1). the over 20 per cent increase in the savings allocated in debt securitiesa, as well as the rise of almost 12 per cent in other shares made a major contribution to the growth. the insurance technical provisions and the voluntary pension fund coverage reserves, primarily serving as long-term savings, rose by 5.6 per cent in total in 2016. Examining the asset category separately, it can be stated that the assets allocated to voluntary pension fund savings rose by almost 9 per cent in one year. the portfolio of equities and mutual fund shares rose moderately last year (by 1.3 per cent), nevertheless it represents the third largest share within the financial instruments under review.
Chart 1Changes in the composition of households’ savings
0
5,000
10,000
15,000
20,000
25,000
30,000
35,000
40,000
0
5,000
10,000
15,000
20,000
25,000
30,000
35,000
40,000 HUF Billions HUF Billions
Debt securitiesEquities and mutual fund sharesTechnical provisions and voluntary pension fund coverage reservesOther shares
Cash and deposits
+11.8%
+5.6%
+1.3%
+20.6%
+4.2%
2011
Q1
2011
Q2
2011
Q3
2011
Q4
2012
Q1
2012
Q2
2012
Q3
2012
Q4
2013
Q1
2013
Q2
2013
Q3
2013
Q4
2014
Q1
2014
Q2
2014
Q3
2014
Q4
2015
Q1
2015
Q2
2015
Q3
2015
Q4
2016
Q1
2016
Q2
2016
Q3
2016
Q4
Source: MNB.

ExEcutIVE SuMMaRy
INSURANCE, FUNDS AND CAPITAL MARKET RISK REPORT • 2017 11
In the long run the gap between the EU and Hungarian savings to GDP ratio may narrow
the volume of savings exceeded the GDP in Hungary for the first time in 2014 and during the 2 years elapsed since then a trend-like growth appears to unfold. It is worth comparing the dynamics of the growth in savings with the average of the other Visegrád countries and of the Eu Member States: contrary to the buoyant growth seen in Hungary in recent years, the level of savings relative to GDP in the neighbouring and Eu countries practically stagnates (chart 2). Presuming the continuation of this trend, the gap between the Hungarian and the average Eu volume of savings may decrease.
In 2015, the ratio of accumulated financial assets relative to GDP rose by 3 percentage points to 105.8 per cent from the level of 102.7 per cent registered in 2014. When comparing the average of the various groups of countries to 2014, it is a remarkable change that the savings level of the Eu28 (168.6 per cent) and the euro area (170.3 per cent) countries fell in 2015 by 1.3 and 3.1 per cent, thus the ratio of the savings of Hungarian households compared to the Eu28 average reached 63 per cent by the end-of 2015, after a rise of almost 3 percentage points. the average of the Visegrád countries, calculated without Hungary, rose by 0.4 per cent two years ago; however, when comparing the ratio of 87.9 per cent with the Hungarian savings level, we can see a major shortfall in the V3 states. the average of club Medb, comprising of the Mediterranean countries (187.5 per cent), rose slightly, by 0.2 per cent, between 2014 and 2015.
Chart 2Changes in the degree of savings (as a percentage of GDP) in Europe, 2011-2015
60
80
100
120
140
160
180
200
60
80
100
120
140
160
180
200
2011 2012 2013 2014 2015
Per cent Per cent
HungaryEurozoneClub MedV3EU28*
*EU28 average without the V4 average.Source: Eurostat.
MAGYAR NEMZETI BANK
INSURANCE, FUNDS AND CAPITAL MARKET RISK REPORT • 201712
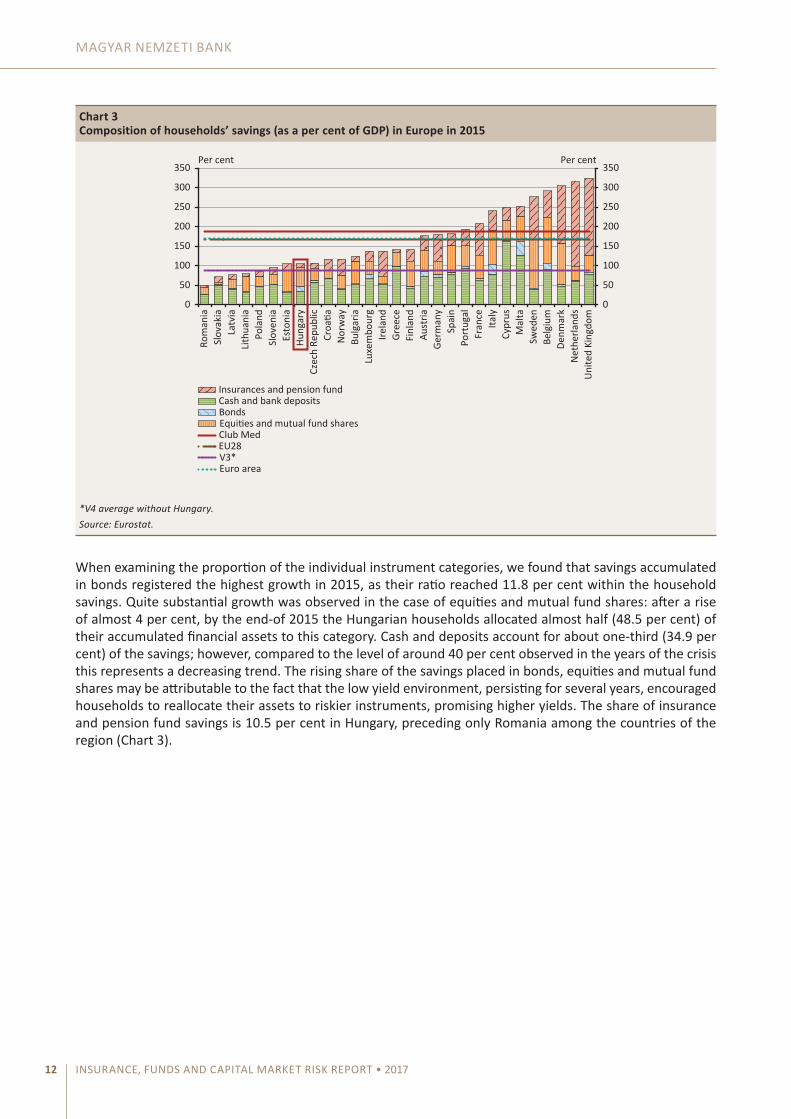
When examining the proportion of the individual instrument categories, we found that savings accumulated in bonds registered the highest growth in 2015, as their ratio reached 11.8 per cent within the household savings. Quite substantial growth was observed in the case of equities and mutual fund shares: after a rise of almost 4 per cent, by the end-of 2015 the Hungarian households allocated almost half (48.5 per cent) of their accumulated financial assets to this category. cash and deposits account for about one-third (34.9 per cent) of the savings; however, compared to the level of around 40 per cent observed in the years of the crisis this represents a decreasing trend. the rising share of the savings placed in bonds, equities and mutual fund shares may be attributable to the fact that the low yield environment, persisting for several years, encouraged households to reallocate their assets to riskier instruments, promising higher yields. the share of insurance and pension fund savings is 10.5 per cent in Hungary, preceding only Romania among the countries of the region (chart 3).
Chart 3Composition of households’ savings (as a per cent of GDP) in Europe in 2015
Rom
ania
Sl
ovak
ia
Latv
ia
Lith
uani
a Po
land
Sl
oven
ia
Esto
nia
Hung
ary
Czec
h Re
publ
ic
Croa
tia
Nor
way
Bu
lgar
ia
Luxe
mbo
urg
Irela
nd
Gree
ce
Finl
and
Aust
ria
Germ
any
Spai
n Po
rtug
al
Fran
ce
Italy
Cy
prus
M
alta
Sw
eden
Be
lgiu
m
Denm
ark
Net
herla
nds
Uni
ted
King
dom
0
50
100
150
200
250
300
350
0
50
100
150
200
250
300
350 Per cent Per cent
Insurances and pension fund
BondsCash and bank deposits
V3* EU28
Euro area
Club Med Equities and mutual fund shares
*V4 average without Hungary.Source: Eurostat.

INSURANCE, FUNDS AND CAPITAL MARKET RISK REPORT • 2017 13
2 Insurance market and its risks
2.1 OVERALL PICTURE OF THE MARKET
Insurance market in figures
In the Hungarian insurance market, including also the small insurance unions, 43 institutions operate in total, 27 of which belong to the scope of Solvency IIc (hereinafter: S2), which commenced on 1 January 2016. as regards the breakdown by insurance segments, 8 of the S2 institutions are life insurers, 10 of them are non-life insurers and 9 of them are composite companies. Last year, in the life segment premium income was realised in the amount of HuF 441.5 billion on 2.4 million contracts, while the premium income realised in the non-life segment reached HuF 447.02 billion, on 10.5 million contracts. thus the premium income of the entire market was close to HuF 900 billion, which is 4.4 per cent increase compared to 2015. the capital adequacy compared to the level of Day1d, i.e. the level at the commencement of S2 on 1 January 2016, increased by 8.8 per cent to 222 per cent by the end-of 2016. the Hungarian insurers realised a profit after tax of HuF 50.4 billion on total equity amounting to HuF 230.2 billion (table 1).
Table 1Key data of the insurance sector as at 31 December 2016
2016Insurance sector
Total
Number of institutions (pcs)
total S2 insurers 27*
43
Life 8Non-life 10
composite 9Small insurance
union 16
Life sector Non-life sector TotalPremium income (HuF billions) 441.5 447.02 888.5Number of contracts (thousand pcs) 2,394 10,545 12,939Balance sheet total (HuF billions) 2,464.7**capitalisation level (per cent) 222Profit or loss (HuF billions) 50.4technical provision (HuF billions) 1,664.60 250.6 1,915.20Share of government bonds within investments (per cent) 68Volume of new contracts (HuF billions) 50.2 155.1 205.312-month regular premium (HuF billions)e 296.8 414.6 711.412-month regular premium per contract (HuF millions) 123.98 39.3 54.98
* One insurer got out of the scope of the S2 due to the withdrawal of its activity licence during the year, but its premium income data is still included in the sector level data.
**2015Q4 data, calculated on Solvency I basis
2015*** Small insurance unionNumber of institutions (pcs) 16Premium income (HuF million) 351.5Ratio of government bonds within technical provisions (per cent) 43.6Number of contracts (pcs) 389
***The 2016 data of the small insurance unions is not yet available

MAGYAR NEMZETI BANK
INSURANCE, FUNDS AND CAPITAL MARKET RISK REPORT • 201714
The premium income of the sector came close to HUF 900 billion
In 2016 the sector-level premium income, after an annual growth of 4.4 per cent, came close to HuF 900 billion despite the fact that due to one of the actor becoming a branch office, last year’s premium income does not contain the premium income figures of that institution. Premium incomes are characterised by a steady increase since 2012; the average annual growth, net data of the aforementioned actor, is 4.5 per cent, while the unadjusted growth rate is 4 per cent. the life segment’s premium incomes decreased slightly, by 0.2 per cent, compared to 2015 due to the one-off effect. In the non-life segment the dynamic growth observed in recent years continued: after the 8.6 per cent growth of 2015/2014, in 2016 the premium income realised on non-life products exceeded that of last year by 9.3 per cent. taking into consideration the period of 2012-2016, adjusted for one-off effects, the life segment’s premium incomes rose on average by 3.4 per cent, while in the non-life segment the growth rate was close to 6 per cent; thus it can be stated that a vast part of the entire market growth was attributable to the expansion of the non-life segment, led by the compulsory motor third party liability insurance (MtPL) (chart 4).
Slightly increasing concentration in the life segment, continuing decrease in the non-life segment
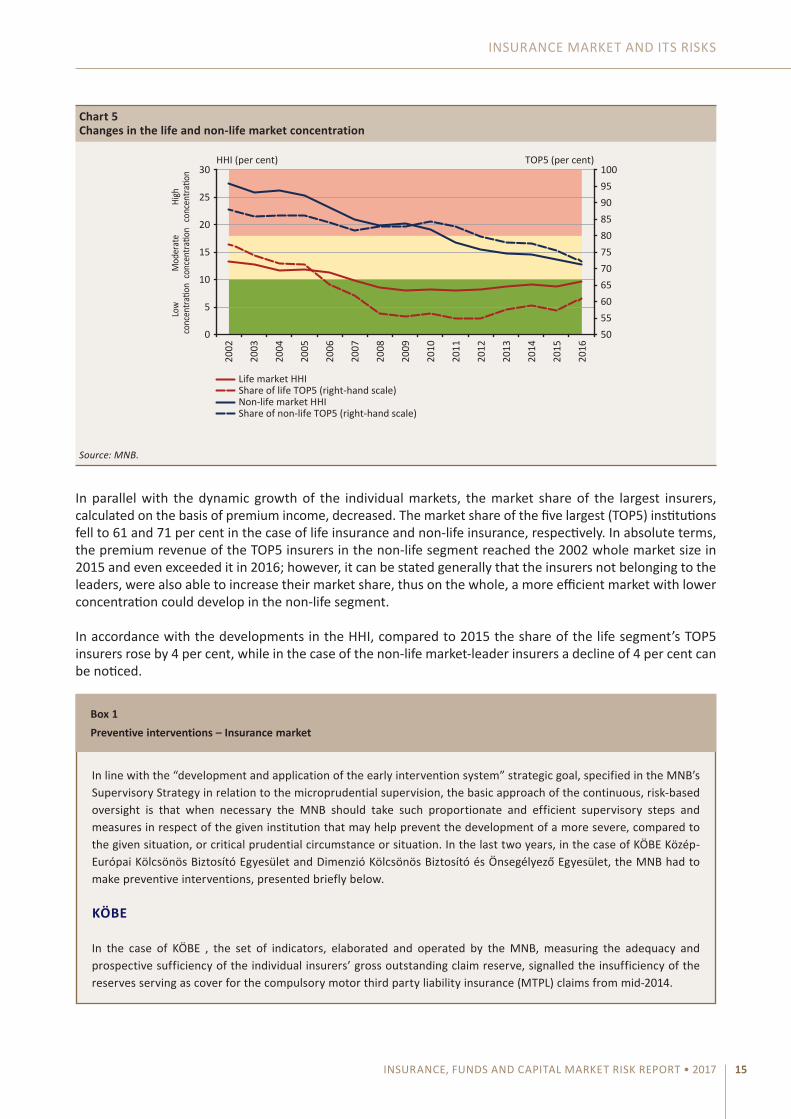
the changes in the market concentration of the individual segments are well reflected by the Herfindahl–Hirschman index (HHI)f. In the life insurance market the value of the index from 2009 until 2013 was steadily around 8 per cent, and then, as a result of a moderate growth, by the end-of 2016 it reached the value of 10 per cent, regarded as the lower bound of moderate concentration (chart 5). In the case of the non-life segment, the HHI fell below the level signalling high concentration in 2010, and since then it is steadily approaching the upper bound of low concentration. In order to ensure better comparability with the concentration of other sectors, this year we changed, in accordance with the uniform scale applied by the Hungarian competition authority (GVH), the upper bound of the band signalling moderate concentration from 28 to 18 per cent.
Chart 4Changes in the total premium income of the insurance sector
0
100
200
300
400
500
600
700
800
900
1000
0
100
200
300
400
500
600
700
800
900
1000
2006 2007 2008 2009 2010 2011 2012 2013 2014 2015 2016
HUF Billions HUF Billions
+4.5%/year
Non-lifeLife
Source: MNB.
INSuRaNcE MaRkEt aND ItS RISkS
INSURANCE, FUNDS AND CAPITAL MARKET RISK REPORT • 2017 15
In parallel with the dynamic growth of the individual markets, the market share of the largest insurers, calculated on the basis of premium income, decreased. the market share of the five largest (tOP5) institutions fell to 61 and 71 per cent in the case of life insurance and non-life insurance, respectively. In absolute terms, the premium revenue of the tOP5 insurers in the non-life segment reached the 2002 whole market size in 2015 and even exceeded it in 2016; however, it can be stated generally that the insurers not belonging to the leaders, were also able to increase their market share, thus on the whole, a more efficient market with lower concentration could develop in the non-life segment.
In accordance with the developments in the HHI, compared to 2015 the share of the life segment’s tOP5 insurers rose by 4 per cent, while in the case of the non-life market-leader insurers a decline of 4 per cent can be noticed.
Chart 5Changes in the life and non-life market concentration
50 55 60 65 70 75 80 85 90 95 100
0
5
10
15
20
25
30 HHI (per cent) TOP5 (per cent)
2002
2003
2004
2005
2006
2007
2008
2009
2010
2011
2012
2013
2014
2015
2016
Life market HHIShare of life TOP5 (right-hand scale)Non-life market HHIShare of non-life TOP5 (right-hand scale)
Low
conc
entra
tion
Mod
erat
eco
ncen
tratio
nHi
ghco
ncen
tratio
n
Source: MNB.
In line with the “development and application of the early intervention system” strategic goal, specified in the MNB’s Supervisory Strategy in relation to the microprudential supervision, the basic approach of the continuous, risk-based oversight is that when necessary the MNB should take such proportionate and efficient supervisory steps and measures in respect of the given institution that may help prevent the development of a more severe, compared to the given situation, or critical prudential circumstance or situation. In the last two years, in the case of kÖBE közép-Európai kölcsönös Biztosító Egyesület and Dimenzió kölcsönös Biztosító és Önsegélyező Egyesület, the MNB had to make preventive interventions, presented briefly below.
KÖBE
In the case of kÖBE , the set of indicators, elaborated and operated by the MNB, measuring the adequacy and prospective sufficiency of the individual insurers’ gross outstanding claim reserve, signalled the insufficiency of the reserves serving as cover for the compulsory motor third party liability insurance (MtPL) claims from mid-2014.
Box 1Preventive interventions – Insurance market
MAGYAR NEMZETI BANK
INSURANCE, FUNDS AND CAPITAL MARKET RISK REPORT • 201716
after the identification of the risk, the MNB continuously monitored, in addition to the processing of the regular data reporting also by the in-depth analysis of the detailed claim data, the changes in kÖBE’s reserves and the adequacy of those. after a period that showed an improving trend, but proved to be temporary, bearing in mind the interests of kÖBE’s customers and claimants, as well as the functional operation of the MtPL system, in 2015 Q3 the MNB decided to bring forward the general audit, originally planned for 2017. the preventive decision, aimed at early intervention and the mitigation of kÖBE’s risk, was also attributable, in addition to the high level of the reserve adequacy risk, to the poor capital position, forecast by the impact analyses conducted as a preparation for the Solvency II regime, that was due to be implemented at that time, entering into force on 1 January 2016.
During the general audit, particularly due to the major shortfall in claim reserve and the inadequacy of the MtPL premium calculation, the MNB – as an interim measure – suspended the distribution of the MtPL product, restricted its right to dispose over the assets and obliged kÖBE to create a financial plan.
In February 2016, the MNB approved the financial plan submitted by kÖBE, and as kÖBE implemented the short-term measures, substantially reducing the prudential risks, in March 2016 it lifted the suspension of the MtPL product distribution.
at the closing of the general audit in august 2016, the MNB also lifted the restriction of the right to dispose over the assets. according to the year-end figures, the company’s operation stabilised, thus it can be stated that the MNB managed to intervene in due course and efficiently in respect of an institution that was on the wrong track.
DIMENZIÓ
the insurance activity of Dimenzió between 1993 and 2009 was profitable, and it had stable capital background. In its products, being of fund nature as regards the type of the service and the tax consequences thereof, distributed in this period, Dimenzió promised 100 per cent excess return refund, and also guaranteed, until 2003, a yield of 4 per cent. Dimenzió’s product and counterparty concentration risk was substantial from as early as its foundation, which became even higher when it became loss-making from 2010, due to the continuous decrease in the support by a legal entity founding member and in the central bank base rate, and simultaneously with this, its capital level also started to decrease continuously. then Dimenzió started to investigate the possible strategic solutions, and partially as a result of this, its internal management became polarised, which had a negative effect on all key risks.
From end-2012 the MNB obliged Dimenzió to send monthly regular reports of a special structure, and to provide continuous information on the decisions of its management (controlling and supervisory) boards. Based on this, later on it was able to closely monitor the developments in Dimenzió’s financial situation, the strategic decisions taken and to be taken, as well as the efficiency of the internal control system.
Since Dimenzió had a new controlling body in 2013, simultaneously with this its internal control system became so weak that it was necessary to conduct prudential consultations with the management of Dimenzió several times, and to conduct comprehensive and follow-up audits at the institution more frequently than prescribed by the law. While the persistently loss-making activity and the continuous deterioration in the capital position evidenced the failure of the intensive search for strategic solutions, it planned to reduce its capital requirement substantially through the unlawful and non-contractual unilateral termination of masses of insurances. Due to the inadequacy of the internal control system, the MNB had to issue preventive resolutions in respect of this on several occasions, thereby preventing a large number of consumer protection infringements. as a consequence of the foregoing, in 2015 the MNB rejected the applications for the authorisation of the SB members’ re-election.
after this, by 2015 Q3 the capital (yet under Solvency I) of Dimenzió fell below the prudential level, hence the MNB obliged it to prepare an action plan. the submitted action plan was controversial in respect of the current, already Solvency II capital adequacy, and with a view to clarifying this, a general audit was launched at Dimenzió earlier than scheduled, from april 2016.

INSuRaNcE MaRkEt aND ItS RISkS
INSURANCE, FUNDS AND CAPITAL MARKET RISK REPORT • 2017 17
2.2 LIFE SECTOR
Tendency of growth in the life insurance technical provisions
Between 2007 and 2013 the mathematical and the unit-linked (uL) reservesg together rose annually by 1.8 per cent on average, while the period of 2013-2016 was characterised by an average annual growth of 3.2 per cent. In 2016 the life insurance technical provisions fell by 1.96 per cent due to one of the insurers becoming a branch office. Without taking into account the technical provisions of the institution that became a branch office, from 2013 the adjusted growth rate was 5.6 per cent. as regards the benefit levels, i.e. the ratio of pay-outs (expiry, death benefit, surrender) and premium, we found that as a result of the major fall that followed the local peak attributable to the 2011-2012 early repayment of the foreign currency loans at preferential exchange rate, by the end-of 2016 the benefit level of both technical provisions stabilised below 80 per cent, which is in line with the maturity of the market (chart 6). Regarding the case of contracts concluded in former years, the guaranteed interest rate may be deemed favourable in the present yield environment, in the upcoming years we do not expect a major growth in the traditional benefit level.
Not long after the commencement of the audit, in May 2016 the MNB appointed a supervisory commissioner, in view of the emergency situation that had developed at the organisation. the 2016 data supplies revealed that the regulatory capital of the insurer failed to reach even the minimum capital requirement level both on 1 January and on 31 March 2016.
In connection with this, in September 2016 the MNB rejected the action plan, and obliged Dimenzió to prepare a financial plan.
Since in the submitted financial plan Dimenzió failed to present a series of lawfully implementable measures, the implementation of which would have guaranteed that by 31 December 2016 its regulatory capital reaches the mini-mum capital requirement level, the MNB rejected the financial plan and withdrew the insurer’s activity licence.
Chart 6Changes in the life insurance technical provisions
0
20
40
60
80
100
120
140
160
180
200
0
200
400
600
800
1,000
1,200
1,400
1,600
1,800
2,000
2006 2007 2008 2009 2010 2011 2012 2013 2014 2015 2016
Per centHUF Billions
+3.2%/year+1.8%/year
1,745 Bin
Unit-linked reservesMathematical reservesUnit-linked benefit level (right-hand scale)Traditional benefit level (right-hand scale)
Source: MNB.

MAGYAR NEMZETI BANK
INSURANCE, FUNDS AND CAPITAL MARKET RISK REPORT • 201718
Conservative investments are still dominant
the institutions invested 56 per cent, i.e. about HuF 1,000 billion, of the life insurance technical provisions approximating HuF 1,800 billion, in Hungarian government bonds. the government bonds provide more predictable cash flows compared to other assets, they are more liquid and their market price is less volatile. their dominance stabilises the capital adequacy of the domestic institutions, thus the Hungarian insurance sector may be in better situation from a prudential point of view compared to the rest of the European countries. In addition, due to the government bonds, they also play a substantial role in the financing of the Hungarian government debt. the long-term persistence of this is supported by the fact that the Solvency II regulation, effective from 2016, encourages – through the calculation of the solvency capital requirement – the holding of safe instruments (government bonds) denominated in the same currency (forint) as the currency of the insurance activity. the Hungarian sector has outstanding government bond ratio even by European standards, as in the Eu28 states approximately one-third of the technical provisions are invested in government securities.
compared to 2015, the share of corporate, structured and mortgage bonds, classified as other bonds, increased by 2 percentage points and reached HuF 260 billion. the sector’s corporate bond portfolio mostly contains debt securities issued by domestic and foreign large banks and large corporations. 25 per cent of the life insurance reserves, i.e. almost HuF 430 billion, were invested in equities, representing a growth of 4 percentage points compared to 2015. Other investments comprise of cash and bank deposits, and properties, amounting to approximately HuF 70 billion. the share of the category rose to 4 per cent in one year, which is presumably attributable to the dynamically increasing property prices resulting from the property market boom. Mutual fund shares account for 43 per cent of the life insurance technical provisions; however, in order to provide a more accurate picture of the shares of the individual instrument categories, they were decomposed based on estimation (chart 7). the essence of the methodology is that the mutual fund share portfolio of the insurers
Chart 7Composition of the life insurance technical provisions
56%
15%
25%
4%
86%
5% 3%
39%
22%
36%
4% 5%
Not unit-linkedUnit-linked
EquitiesCorporate and structured bond, mortgage bondHungarian government bonds
Other
Source: MNB.

INSuRaNcE MaRkEt aND ItS RISkS
INSURANCE, FUNDS AND CAPITAL MARKET RISK REPORT • 2017 19
with technical provisions, accounting for almost half of the unit-linked reserves, was decomposed, based on their data reporting, to the aforementioned categories, and after weighting the proportion with the share of the solo institutions within the total unit-linked reserve, we projected it on the entire market. Examining the proportion of the assets underlying the unit-linked reserves, we found that two-thirds of the portfolio is comprised of assets representing higher risk than the government securities, since in the case of the unit-linked insurances it is the customer who bears the investment risk, furthermore within the framework of S2 the insurers have more room for manoeuvre when making their investment decisions. In the case of the assets, covering life insurance other than unit-linked insurance, traditionally being less risky, it is remarkable that in addition to the Hungarian government securities, having a share of almost 90 per cent, other forms of investments representing higher risk level, also appeared. It should be noted that with the Solvency II entering into force, a new methodology prevails in respect of the valuation and reporting of assets, which does not always enable the comparison of the data of 2016 with those of the previous periods.
After a continuous growth, premium from pension insurance reached one-sixth of the regular premium revenues
the regular premium life insurance portfolio rose by more than 2 per cent1 compared to 2015 (chart 8). compared to the low point in 2013, the number of contracts is increasing at a slow rate and already approximates the 2012 level. the growth in the portfolio at sector level in the current year compared to last year, is the combined effect of the almost unchanged new contract portfolio and the portfolio loss, which decreased by almost 13 per cent. the majority of the contracts still terminate due to expiry and surrender. these termination reasons together account for 63 per cent of the portfolio shrinkage, which may be deemed particularly high compared to the 50 per cent ratio observed since 2006. In 2016 almost 100,000 regular premium contracts were surrendered, exceeding the 2015 value by 12 per cent. On an annual basis, the number of regular premium contracts ceased due to expiry increased by 3 per cent.
the shrinkage of the regular premium traditional portfolio continues. although the steady, almost 10 per cent decrease in the number of contracts seen in 2008-2013 can no longer be noticed, the number of contracts at end-2016 fell by 3 per cent compared to that of the previous year. the continuous decrease in the number of traditional contracts is offset by the growth in the unit-linked portfolio. the stable, 6 per cent annual growth seen in 2015-2016 was outstripped by the 10 per cent increase this year. Pension insurance is still the driver of the growth in the unit-linked (uL) portfolio, accounting for 16 per cent of the acquisition in the current year. Simultaneously with the 5 per cent increase in the acquisition of regular premium unit-linked pension insurance compared to last year, the regular premium of the new unit-linked contracts at sector level fell by 8 per cent on current year basis. as part of the MNB’s ethical concept, the saving life insurances’ cost level decreases; the former profit level can be achieved by increasing the retention period of the contracts. additional opportunity is provided by the pick-up in the sales of risk life insurances.
the current year’s gross written premium (gross premium) from the regular premium life insurances across the sector rose by 3 per cent compared to 2015, due to the unit-linked portfolio, continuing the growth tendency started in 2014. the share of the unit-linked contracts also increases in terms of premium and number of policies; in 2016 60 per cent of the premium was generated by the unit-linked contracts accounting for 47 per cent of the regular premium portfolio. the premium from the traditional regular premium contracts in the last three years practically has not changed. 73 per cent of the premium from regular premium contracts is distributed among six institutions.
1 By 2016, the range of institutions supervised by the MNB shrank by one insurer, as it was transformed into a branch office, the impact of which is eliminated for the pre-2016 years allowing the analysis of the trends; however, the charts do contain the institution’s data reported for the pre-2016 periods.

MAGYAR NEMZETI BANK
INSURANCE, FUNDS AND CAPITAL MARKET RISK REPORT • 201720
In the current year, 17 insurers sold pension insurance products; the number of outstanding contracts by the end-of 2016 exceeded 193,000. the growth rate of the portfolio observed since 2014 is decelerating (+42 per cent in the current year), but this is not surprising due to the rising basis. 97 per cent of the pension insurance contracts are regular premium contracts, and 70 per cent of the regular premium portfolio are still unit-linked products. Only one-third of the market participants sell traditional pension insurance products, while the single premium version is available only at one insurer (its volume is negligible though). the number of new pension insurance contracts concluded in 2016 was more than 78,000, which exceeds the 2015 data by 2.6 per cent. In terms of premium paymenth frequency, the new acquisitions reflect the composition of the portfolio. the number of traditional products hardly exceeds 57,000, but it increases faster (4 per cent) compared to the unit-linked portfolio.
By end-2016 the gross premium from pension insurances amounted to HuF 42 billion, which exceeds the end-2015 value by 47 per cent, in line with acquisition of regular premium contracts and the higher top-up premium payments. the gross premium from the regular premium pension insurances was close to HuF 35 billion at the end of2016. the average portfolio premium allocable to the pension insurance contracts concluded in 2016 decreased to HuF 191,000, which also varies in a lower band (HuF 94,000 – 298,000) compared to 2015. the difference between the portfolio premium allocable to the pension and non-pension contracts is negligible; by 2016 the average portfolio premium allocable to non-pension contracts also reached HuF 187,000. this levelling-off is attributable to the fact that the ratio of the uL insurances within the non-pension contracts is higher (77 per cent), which also has a higher portfolio premium.
Stable single premium market
contrary to the regular premium market, it is more difficult for the insurers to plan the premium income from the single and top-upi premium products, in view of the variable nature thereof. By end-2016 the gross premium income from single and top-up premium products amounted to HuF 169.3 billion. the growth, exceeding the 2015 value by more than 2 per cent, is primarily attributable to the 21 per cent increase in the traditional premium incomes. Since the traditional contracts account for only 35 per cent of the portfolio, the impact of
Chart 8Premium income (left chart) and number (right chart) of regular premium contracts in the life segment
0
500
1,000
1,500
2,000
2,500
3,000
3,500
0
50
100
150
200
250
300
350
2006
2007
2008
2009
2010
2011
2012
2013
2014
2015
2016
Thousand pieces Per centPer centHUF Billions
+1.6%/year
0
10
20
30
40
50
60
70
80
90
100
0
10
20
30
40
50
60
70
80
90
100
2014
2015
2016
UL regular premiumTraditional regular premium
Non-pension insurancePension insuranceTotal pcs (right-hand scale)
Traditional regular pcs (right-hand scale)UL regular pcs (right-hand scale)
2.7%9.9%
16.7%
Source: MNB.

INSuRaNcE MaRkEt aND ItS RISkS
INSURANCE, FUNDS AND CAPITAL MARKET RISK REPORT • 2017 21
the higher premium income in the reporting year can be felt to a lesser degree. after the more volatile period of 2009-2012, in the next 4 years the premium income of the market stabilised around HuF 170 billion (chart 9).
Concentrating single and top-up premium market, and competitive regular premium market
Based on gross premium, the concentration of life insurance market (based on HHI) developed according to different trends in the single and regular premium segments. the regular premium market, which was characterised by high concentration back in 2006, gradually, in 10 years, has been becoming more balanced, and by 2016 it has already approached the upper bound of low concentration (10 per cent of the HHI). Based on the premium, in the last three years 6 institutions had a market share higher than 5 per cent, and 4 of them cover 55 per cent of the market.
apart from the downturn in 2015, the concentration has continuously been increasing in the single and top-up premium market since the outbreak of the crisis. the decline in the HHI in 2015 was caused by the fall in the market leader insurers’ single and top-up premium. Based on gross premium, 56 per cent of the single and top-up premium segment is possessed by 3 institutions, while 6 institutions have a market share over 5 per cent. the range and order of the 3 largest institutions has not changed compared to the previous year; the market share of the market leader institution rose to 29 per cent in 2016 (chart 10).
Chart 9Changes in the single and top-up premium income
0
50
100
150
200
250
0
50
100
150
200
250
2006
2007
2008
2009
2010
2011
2012
2013
2014
2015
2016
HUF BillionsHUF Billions
Crisis, Taxation on savings
–18.9% +15.9%
Low yield environment
+2.05%
Unit-linked (single + top-up) premiumTraditional (single + top-up) premiumTrends in the single and top-up premium portfolio
Source: MNB.

MAGYAR NEMZETI BANK
INSURANCE, FUNDS AND CAPITAL MARKET RISK REPORT • 201722
2
2 Recommendation No. 8/2016 (VI.30) on the application of the prudential and consumer protection principles related to unit-linked life insurances.
Chart 10Concentration of the regular and single premium market
50 55 60 65 70 75 80 85 90 95 100
0
5
10
15
20
25
30 HHI (per cent) TOP5 (per cent)
2002
2003
2004
2005
2006
2007
2008
2009
2010
2011
2012
2013
2014
2015
2016
Single and top-up HHITOP 5 – single and top-up (right-hand scale)Regular HHITOP 5 – regular (right-hand scale)
Low
conc
entra
tion
Mod
erat
eco
ncen
tratio
nHi
ghco
ncen
tratio
n
Source: MNB.
With a view to restoring customer confidence and reducing misselling, i.e. sales through providing misleading information, the Magyar Nemzeti Bank - after long consultation with market participants - elaborated the elements of the ethical concept in close co-operation with the legislator. the new regulation serves as a point of reference for insurers, similarly to the act on Fair Banking, but in certain topics even beyond that, on how to adjust their products and behaviour to such common norms that serve the customers’ interest and may result in a long-term, stable portfolio for the insurers.
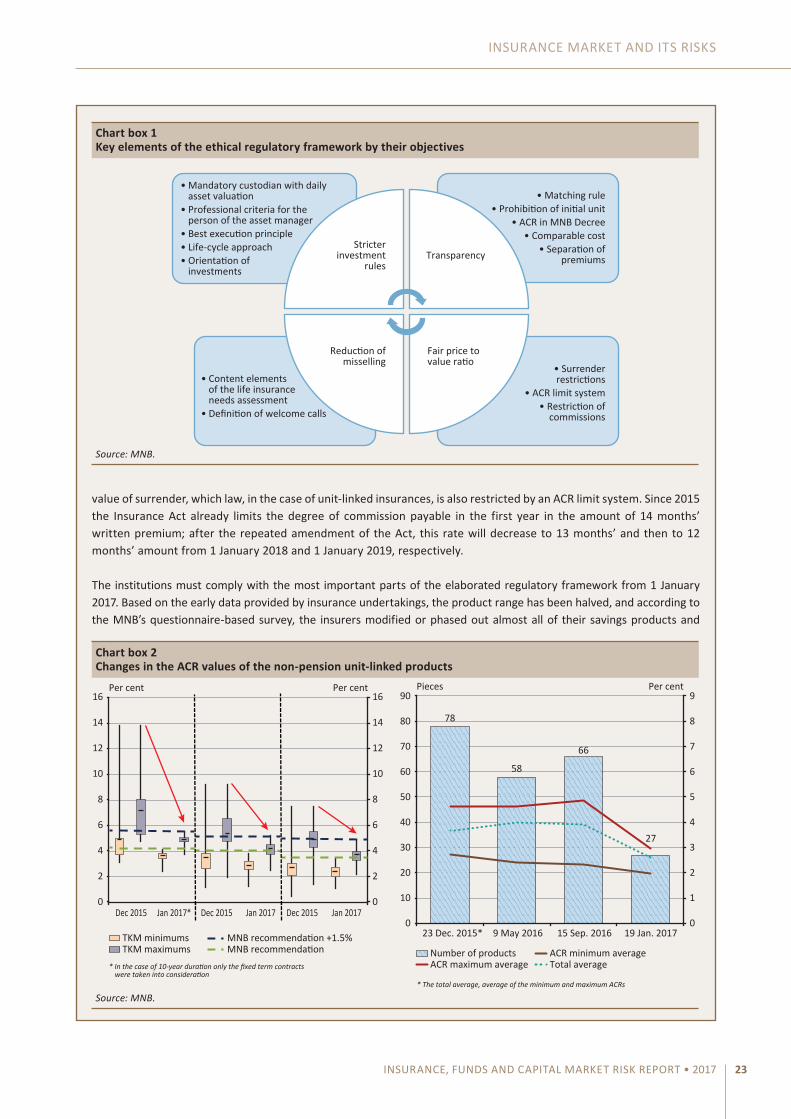
the elements of the ethical concept were introduced on a continuous basis, relying on various regulatory instruments; accordingly, several sections of the Insurance act were modified, and two MNB Decrees and one MNB recommendation were also issued. the key elements are summarised in chart box 1 below, by the goals to be achieved:
With the introduction of the ethical regulatory environment, the MNB wishes to increase the transparency and comparability of the products in order to which it expects insurers to ensure consistency between the title of costs and the underlying content thereof, prohibits the reduction of initial units, which used to be typical before, and specifies the method of calculating the annual cost rate (acR). In addition to this, it makes a proposal in respect of the unit-linked products for the standard names of the costs, and for the separation of the biometric risk premium and the investment premium. It lays down stricter investment rules to ensure that the insurers can make investment decisions complying with the customer’s requirements, being the most favourable for them. Furthermore, it also encourages the development of an asset fund product range aligned with the customer’s life cycle, and proposes to reduce the currency risk by also prescribing asset funds denominated in the currency of the product. the definition of the content elements of the mandatory needs assessment and the requirement set forth in the recommendation related to the unit-linked (uL) life insurance contracts that defines in which cases it is mandatory to make a welcome call and verify the client’s needs, are aimed at reducing the formerly experienced misselling. With a view to achieving a fair price to value ratio, it is prescribed by law for life insurance products what part of the premium paid by the customer for savings purposes (the premium after deducting the risk premium) should serve as basis for the minimum
Box 2The ethical regulatory framework had a major market cleaning and cost-cutting effect
INSuRaNcE MaRkEt aND ItS RISkS
INSURANCE, FUNDS AND CAPITAL MARKET RISK REPORT • 2017 23
value of surrender, which law, in the case of unit-linked insurances, is also restricted by an acR limit system. Since 2015 the Insurance act already limits the degree of commission payable in the first year in the amount of 14 months’ written premium; after the repeated amendment of the act, this rate will decrease to 13 months’ and then to 12 months’ amount from 1 January 2018 and 1 January 2019, respectively.
the institutions must comply with the most important parts of the elaborated regulatory framework from 1 January 2017. Based on the early data provided by insurance undertakings, the product range has been halved, and according to the MNB’s questionnaire-based survey, the insurers modified or phased out almost all of their savings products and
Chart box 1Key elements of the ethical regulatory framework by their objectives
• Mandatory custodian with daily asset valuation• Professional criteria for the person of the asset manager• Best execution principle• Life-cycle approach• Orientation of investments
• Content elements of the life insurance needs assessment • Definition of welcome calls
Transparency
Fair price tovalue ratio
Reduction ofmisselling
Stricterinvestment
rules
• Matching rule • Prohibition of initial unit
• ACR in MNB Decree • Comparable cost
• Separation ofpremiums
• Surrenderrestrictions
• ACR limit system • Restriction of
commissions
Source: MNB.
Chart box 2Changes in the ACR values of the non-pension unit-linked products
0
2
4
6
8
10
12
14
16
0
2
4
6
8
10
12
14
16 Per cent Per cent
TKM minimumsTKM maximums
* In the case of 10-year duration only the fixed term contracts were taken into consideration
MNB recommendation +1.5%MNB recommendation
Dec 2015 Jan 2017* Dec 2015 Jan 2017 Dec 2015 Jan 2017
78
58
66
27
0
10
20
30
40
50
60
70
80
90
0
1
2
3
4
5
6
7
8
9
23 Dec. 2015* 9 May 2016 15 Sep. 2016 19 Jan. 2017
Pieces Per cent
Number of productsACR maximum average
ACR minimum averageTotal average
* The total average, average of the minimum and maximum ACRs
Source: MNB.

MAGYAR NEMZETI BANK
INSURANCE, FUNDS AND CAPITAL MARKET RISK REPORT • 201724
2.3 NON-LIFE SECTOR
The premium income of the non-life market with almost HUF 450 billion exceeded the pre-crisis level
the driver of the dynamic growth in the premium of non-life insurance segment, observed since 2012, is the motor insurance, particularly the compulsory motor third party liability insurance (MtPL) (chart 11). the whole market growth in MtPL premiums can be attributed essentially to three reasons:
• the number of vehicles falling within the scope of MtPL is rising with increasing intensity since 2011 (by 20.8 per cent total in 5 years).
• the risk has been continuously and significantly increasing since 2011-2013 (e.g. the 12-month rolling average of injured persons rose by 11.6 per cent since early 2012, while the loss ratio per contract increased by 14.9 per cent since 2013).
• the profit content of the premiums has been improving after the trough in 2012 (in 2012 the claims and costs accounted for 121.6 per cent of the gross earned premiumj, while in 2016 this ratio was only 97 per cent).
Of the 27 per cent growth in the MtPL premium income realised in 2016, 7.4 per cent is attributable to an increase in portfolio, 4.8 per cent to an increase in risks and 11.7 per cent to a decrease in combined ratio reflecting the improvement in profitability, which may be interpreted as a real rise in the price of contracts.
In the case of casco, similar processes took place, but the impacts appeared in the premiums later and in a much more balanced way. the premium per contract was at its lowest point in 2013; since then this index has risen by 11.2 per cent. Of the 6.6 premium increase in 2016, only 1 per cent is attributable to the portfolio growth, while the remaining part is caused by a rise in the average price of contracts. However, this approximately matches the rise in risks, thus the profitability of the casco has not changed in this respect.
the premium of non-motor insurances has steadily been increasing since 2010, by 1.6-6 per cent on average annually; the average 3.4 per cent shift in 2016 fully fits in this trend. the change in home insurance premiums is also steady, although the growth rate has noticeably decelerated since 2010; the growth rate decreased from
replaced them with new ones. the unit-linked insurance product range received more attention in the regulatory framework. the acR limit system introduced for these products took over, among others, the acR limit recommendations already proven in the pension insurance recommendation, and tightening it further, additional restrictions were also introduced, such as the separate acR limit used in the case of the single premium products or the intermediate acR limit, restricting the costs of early surrender. as a result of the limit system, the average acR value fell roughly by one-quarter. the average acR of the regular premium non-pension insurances fell from 4.95 to 3.83 per cent, while the average of the single premium insurances, calculated for a term of 5 years, decreased from 4.02 to 2.67 per cent (chart box 2).
Based on the data available, the change in the regulatory framework had a substantial effect on the insurance product range and the more expensive products were phased out, as a result of which the customers may choose from a more homogenous product range with higher safety. the reduction of the costs paid by customers temporarily decreases the insurers’ income, and thereby the profit as well; however, due to the fact that as a result of the measures, the insurers and the customers are equally interested in the long-term maintenance of the contracts, we expect a growth in the holding period of the contracts with settled premium. With the increased trust and the self-provisioning willingness further strengthening, the improvement in the retention ratio may be accompanied by further growth in the number of contracts, the joint effect of which may offset the loss of income. In view of the fact that the profit per contract decreases, in the future the emphasis may be put on the economies of scale, and presumably the institutions will focus more on the long-term retention of the contracts.

INSuRaNcE MaRkEt aND ItS RISkS
INSURANCE, FUNDS AND CAPITAL MARKET RISK REPORT • 2017 25
the former almost 10 per cent to an annual average of 2.4 per cent. the premiums per contract also followed a similar trend, but with even more moderate growth rates: since 2013 the rate of the average price increase has remained below 1 per cent.
More buoyant competition in the motor segment, sluggish competition in the home insurance segment
In a business sector characterised by strong competition, and where the only important factor is the price of service, a natural levelling off process takes place, because if two insurers announce completely identical premiums, roughly the same ratio of their portfolio will find cheaper insurance that may be worth switching to. However, they can acquire new contracts from the same range of customers, i.e. those who change insurer. accordingly, the larger insurers presumably lose a higher portfolio in absolute value, while they may acquire roughly the same volume of new contracts as the small insurers.
the turn in the concentration ratio of the MtPL segment, experienced in 2016, in the steady declining trend seen since the crisis, shows that this natural levelling off process no longer makes its impact felt with such a high intensity (chart 12). In view of the fact that in terms of the MtPL it is basically still the price that counts, the turn in the trend signals the slackening of the competition (see the box entitled “after the premium adjustment lasting since 2013 no additional premium increase is justified in the MtPL market”).
In the case of the casco, the competition has strengthened in recent years as a result of price comparing applications of online brokers. thus the levelling off effect continues to prevail despite the fact that here the anticipated quality of the service and the brand are important factors. the ratio indicating the market concentration already approximates, from above, the middle part of the band signalling moderate concentration.
In the case of home insurance segment, the level of the index is unchanged, in the band signalling high concentration. While due to the MtPL campaigns and the linking with MtPL premiums, the possibility of changing casco insurers came into the limelight, in the case of home insurance this pick-up failed to commence despite the fact that it is possible to compare prices here as well (albeit to a more limited degree), and many insurers would like to enter the profitable home insurance market.
Chart 11Changes in the premium income of the non-life business by segments
0
500
1,000
1,500
2,000
2,500
3,000
3,500
4,000
4,500
5,000
0
50
100
150
200
250
300
350
400
450
500
2006
2007
2008
2009
2010
2011
2012
2013
2014
2015
2016
Thousands piecesHUF Billions
Other segments premium Corporate property premiumRetail property premium Casco premiumMTPL premium MTPL pcs (right-hand scale)Casco pcs (right-hand scale) Retail property pcs (right-hand scale)Corporate property pcs (right-hand scale) Health pcs (right-hand scale)Other segments pcs (right-hand scale)
Source: MNB.

MAGYAR NEMZETI BANK
INSURANCE, FUNDS AND CAPITAL MARKET RISK REPORT • 201726
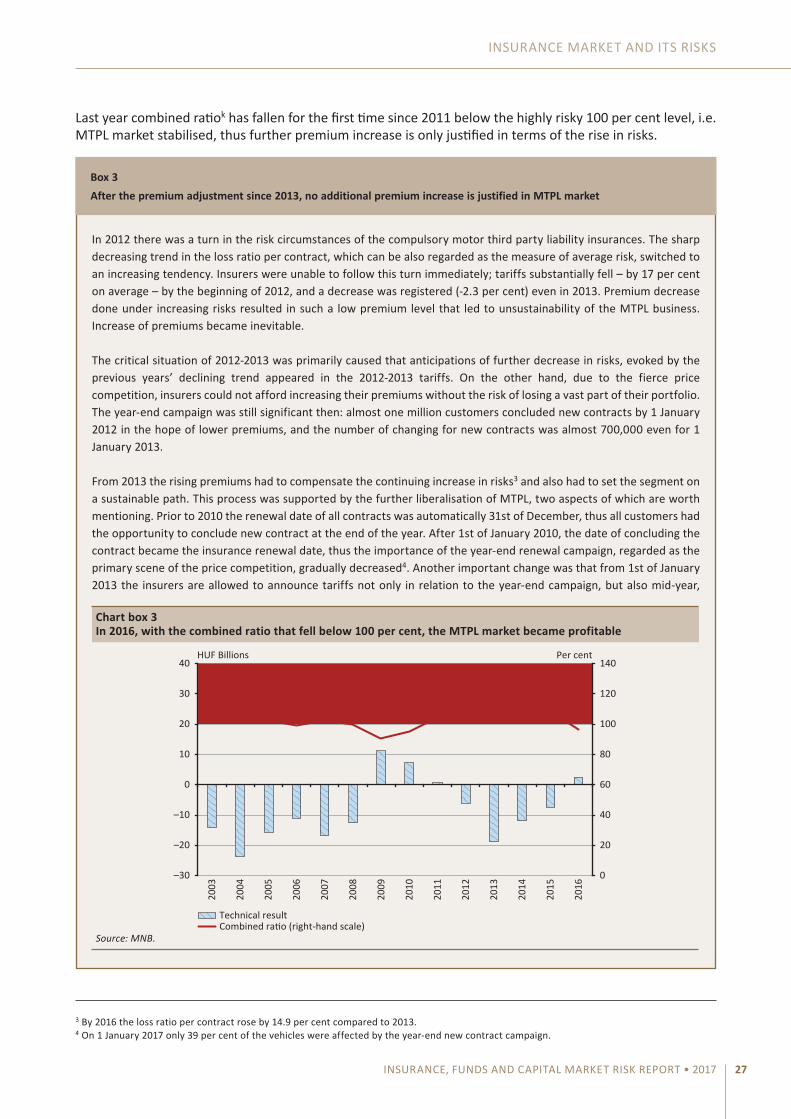
After 5 years the MTPL stabilised at last
the negative trend experienced in the motor insurance segment in recent years, where premiums and yields realised on reserves together failed to cover the claims and costs, seems to turn (chart 13). By 2015 the income and expenditure sides became actually balanced, and in 2016 premiums entirely covered the total volume of the claims and costs, despite the declining yields.
By 2016, gross earned premium per contract rose by 18 per cent, to HuF 25,715 compared to the previous years. the increase in the claim and cost per contract was 5 and 6 per cent, respectively, in 2016.
Chart 12Market concentration of the non-life business segments
50 55 60 65 70 75 80 85 90 95 100
0
5
10
15
20
25
35
30
HHI (per cent)Lo
w co
ncen
tratio
nM
oder
ate
conc
entra
tion
High
conc
entra
tion
TOP5 (per cent)
2002
2003
2004
2005
2006
2007
2008
2009
2010
2011
2012
2013
2014
2015
2016
MTPL HHIShare of MTPL TOP5 (right-hand scale)Retail property HHIShare of retail property TOP5 (right-hand scale)Casco HHIShare of Casco TOP5 (right-hand scale)
Source: MNB.
Chart 13MTPL combined ratio, average premium, claim, cost and yield data (left chart) and change in the average premium of automobiles and other than automobiles (right chart)
0
10,000
20,000
30,000
40,000
50,000HUF Per cent Per centPer cent
2006
2007
2008
2009
2010
2011
2012
2013
2014
2015
2016
0
25
50
75
100
125
0
20
40
60
80
100
120
0
20
40
60
80
100
120
2010
20
11
2012
20
13
2014
20
15
2016
20
17
Return per contract
Cost per contractAverage gross claim
Average gross earned premiumCombined ratio (right-hand scale)Loss ratio (right-hand scale)
AutomobileOther than automobile
Source: MNB.
INSuRaNcE MaRkEt aND ItS RISkS
INSURANCE, FUNDS AND CAPITAL MARKET RISK REPORT • 2017 27
Last year combined ratiok has fallen for the first time since 2011 below the highly risky 100 per cent level, i.e. MtPL market stabilised, thus further premium increase is only justified in terms of the rise in risks.
3 By 2016 the loss ratio per contract rose by 14.9 per cent compared to 2013.4 On 1 January 2017 only 39 per cent of the vehicles were affected by the year-end new contract campaign.
In 2012 there was a turn in the risk circumstances of the compulsory motor third party liability insurances. the sharp decreasing trend in the loss ratio per contract, which can be also regarded as the measure of average risk, switched to an increasing tendency. Insurers were unable to follow this turn immediately; tariffs substantially fell – by 17 per cent on average – by the beginning of 2012, and a decrease was registered (-2.3 per cent) even in 2013. Premium decrease done under increasing risks resulted in such a low premium level that led to unsustainability of the MtPL business. Increase of premiums became inevitable.
the critical situation of 2012-2013 was primarily caused that anticipations of further decrease in risks, evoked by the previous years’ declining trend appeared in the 2012-2013 tariffs. On the other hand, due to the fierce price competition, insurers could not afford increasing their premiums without the risk of losing a vast part of their portfolio. the year-end campaign was still significant then: almost one million customers concluded new contracts by 1 January 2012 in the hope of lower premiums, and the number of changing for new contracts was almost 700,000 even for 1 January 2013.
From 2013 the rising premiums had to compensate the continuing increase in risks3 and also had to set the segment on a sustainable path. this process was supported by the further liberalisation of MtPL, two aspects of which are worth mentioning. Prior to 2010 the renewal date of all contracts was automatically 31st of December, thus all customers had the opportunity to conclude new contract at the end of the year. after 1st of January 2010, the date of concluding the contract became the insurance renewal date, thus the importance of the year-end renewal campaign, regarded as the primary scene of the price competition, gradually decreased4. another important change was that from 1st of January 2013 the insurers are allowed to announce tariffs not only in relation to the year-end campaign, but also mid-year,
Box 3After the premium adjustment since 2013, no additional premium increase is justified in MTPL market
Chart box 3In 2016, with the combined ratio that fell below 100 per cent, the MTPL market became profitable
0
20
40
60
80
100
120
140
–30
–20
–10
0
10
20
30
40
2003
2004
2005
2006
2007
2008
2009
2010
2011
2012
2013
2014
2015
2016
Per centHUF Billions
Technical resultCombined ratio (right-hand scale)
Source: MNB.
MAGYAR NEMZETI BANK
INSURANCE, FUNDS AND CAPITAL MARKET RISK REPORT • 201728
2.4 PROFITABILITY AND CAPITAL POSITION
Continuously improving results, the sector’s profit slowly reaches the three quarters of the pre-crisis level
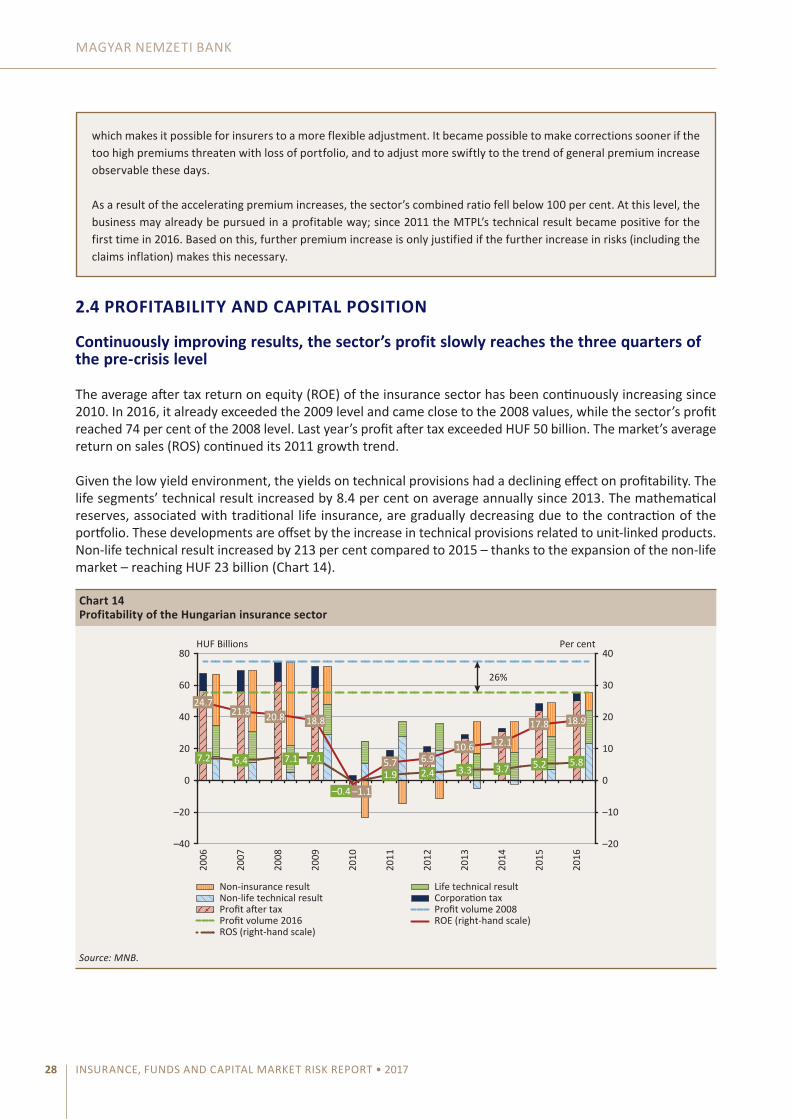
the average after tax return on equity (ROE) of the insurance sector has been continuously increasing since 2010. In 2016, it already exceeded the 2009 level and came close to the 2008 values, while the sector’s profit reached 74 per cent of the 2008 level. Last year’s profit after tax exceeded HuF 50 billion. the market’s average return on sales (ROS) continued its 2011 growth trend.
Given the low yield environment, the yields on technical provisions had a declining effect on profitability. the life segments’ technical result increased by 8.4 per cent on average annually since 2013. the mathematical reserves, associated with traditional life insurance, are gradually decreasing due to the contraction of the portfolio. these developments are offset by the increase in technical provisions related to unit-linked products. Non-life technical result increased by 213 per cent compared to 2015 – thanks to the expansion of the non-life market – reaching HuF 23 billion (chart 14).
which makes it possible for insurers to a more flexible adjustment. It became possible to make corrections sooner if the too high premiums threaten with loss of portfolio, and to adjust more swiftly to the trend of general premium increase observable these days.
as a result of the accelerating premium increases, the sector’s combined ratio fell below 100 per cent. at this level, the business may already be pursued in a profitable way; since 2011 the MtPL’s technical result became positive for the first time in 2016. Based on this, further premium increase is only justified if the further increase in risks (including the claims inflation) makes this necessary.
Chart 14Profitability of the Hungarian insurance sector
24.7 21.8 20.8 18.8
–1.1
5.7 6.9 10.6 12.1
17.8 18.9
7.2 6.4 7.1 7.1
–0.4 1.9 2.4 3.3 3.7 5.2 5.8
–20
–10
0
10
20
30
40
–40
–20
0
20
40
60
80
2006
2007
2008
2009
2010
2011
2012
2013
2014
2015
2016
Per centHUF Billions
26%
Profit volume 2008Profit volume 2016 ROE (right-hand scale)ROS (right-hand scale)
Profit after taxNon-life technical resultNon-insurance result Life technical result
Corporation tax
Source: MNB.
INSuRaNcE MaRkEt aND ItS RISkS
INSURANCE, FUNDS AND CAPITAL MARKET RISK REPORT • 2017 29
Most of the institutions closed the year with profits
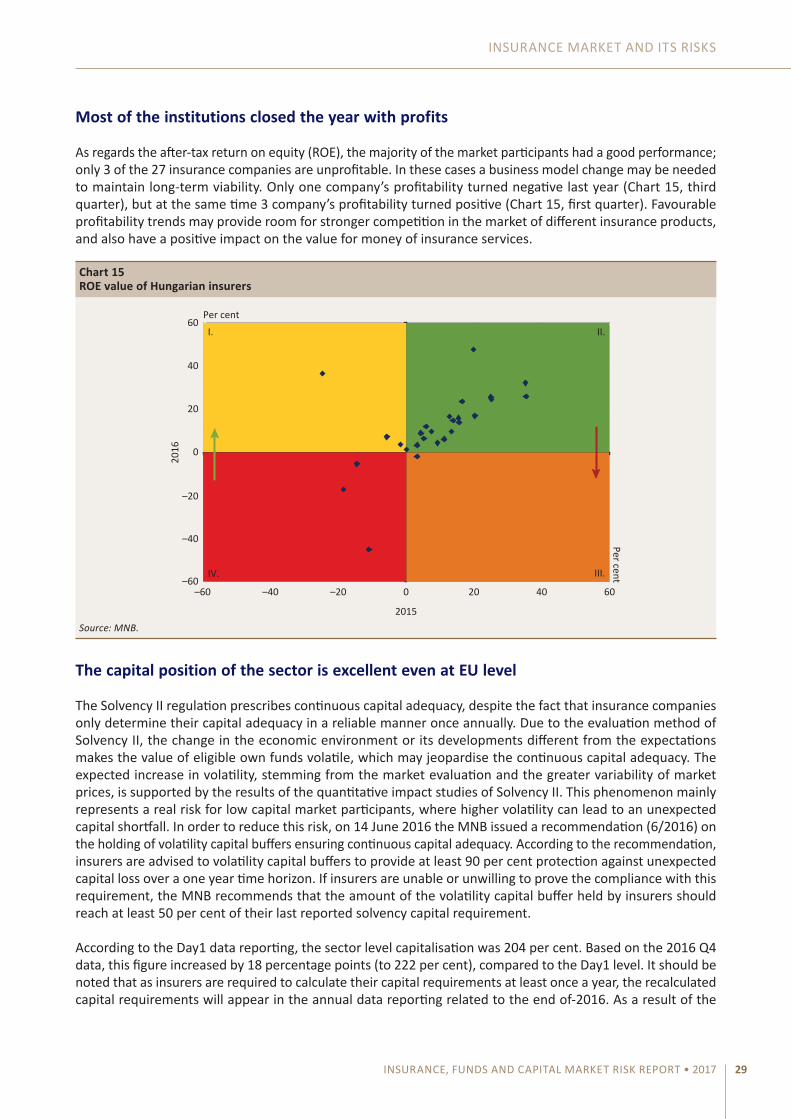
as regards the after-tax return on equity (ROE), the majority of the market participants had a good performance; only 3 of the 27 insurance companies are unprofitable. In these cases a business model change may be needed to maintain long-term viability. Only one company’s profitability turned negative last year (chart 15, third quarter), but at the same time 3 company’s profitability turned positive (chart 15, first quarter). Favourable profitability trends may provide room for stronger competition in the market of different insurance products, and also have a positive impact on the value for money of insurance services.
The capital position of the sector is excellent even at EU level
the Solvency II regulation prescribes continuous capital adequacy, despite the fact that insurance companies only determine their capital adequacy in a reliable manner once annually. Due to the evaluation method of Solvency II, the change in the economic environment or its developments different from the expectations makes the value of eligible own funds volatile, which may jeopardise the continuous capital adequacy. the expected increase in volatility, stemming from the market evaluation and the greater variability of market prices, is supported by the results of the quantitative impact studies of Solvency II. this phenomenon mainly represents a real risk for low capital market participants, where higher volatility can lead to an unexpected capital shortfall. In order to reduce this risk, on 14 June 2016 the MNB issued a recommendation (6/2016) on the holding of volatility capital buffers ensuring continuous capital adequacy. according to the recommendation, insurers are advised to volatility capital buffers to provide at least 90 per cent protection against unexpected capital loss over a one year time horizon. If insurers are unable or unwilling to prove the compliance with this requirement, the MNB recommends that the amount of the volatility capital buffer held by insurers should reach at least 50 per cent of their last reported solvency capital requirement.
according to the Day1 data reporting, the sector level capitalisation was 204 per cent. Based on the 2016 Q4 data, this figure increased by 18 percentage points (to 222 per cent), compared to the Day1 level. It should be noted that as insurers are required to calculate their capital requirements at least once a year, the recalculated capital requirements will appear in the annual data reporting related to the end of-2016. as a result of the
Chart 15ROE value of Hungarian insurers
0
20
40
60Per cent
Per cent
–60–60
–40
–40
–20
–20
0 20 40 60
2016
2015
I.
IV. III.
II.
Source: MNB.

MAGYAR NEMZETI BANK
INSURANCE, FUNDS AND CAPITAL MARKET RISK REPORT • 201730
change in the solvency capital requirements, the sector-level capitalisation shown on chart 16, is also expected to change.
Based on the opening first Solvency II data report, the sector level capitalisation showed a better value compared to Solvency I due to the risk-based capital calculation and the economy-based evaluation of the assets side, as well as the favourable interest rate and yield environment.
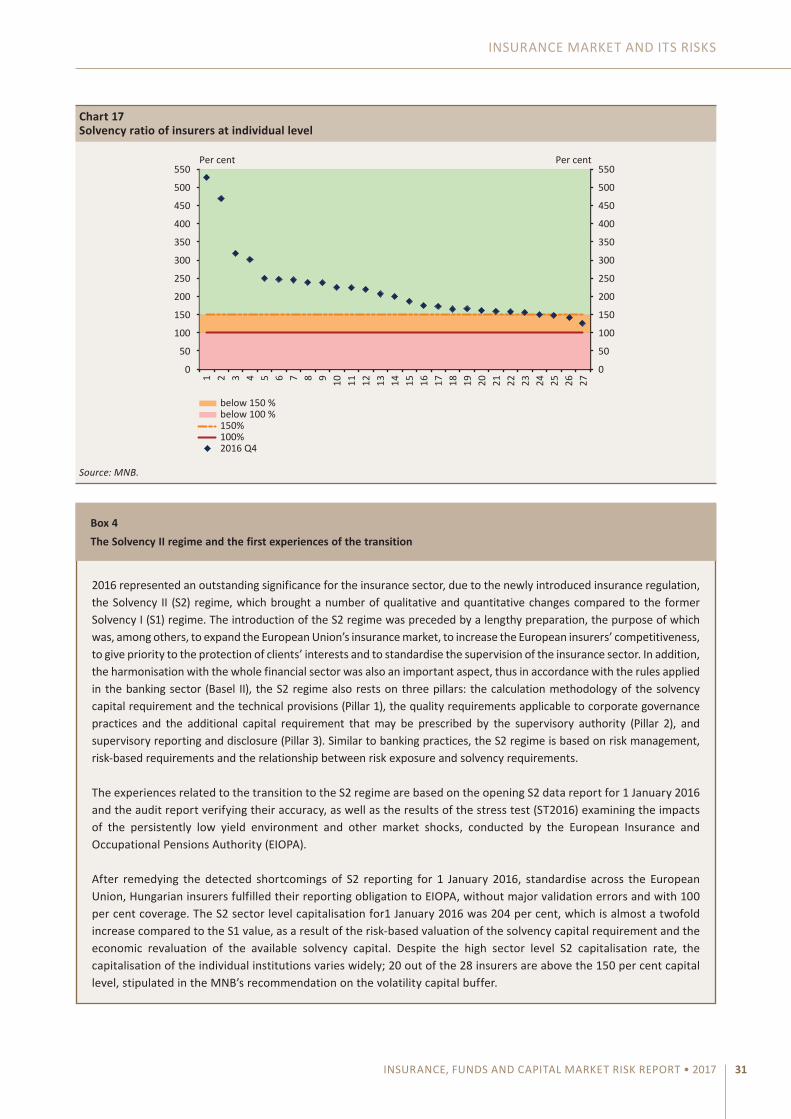
With regards to individual data, all institutions have reached 100 per cent, and only three insurers’ solvency ratio remained below 150 per cent; however, the aggregate market share of these companies is merely 1.7 per cent. It can be stated that – based on capital adequacy– the transition to Solvency II regime took place under favourable circumstances.
considering the individual data, the capital adequacy of insurers can be regarded as adequate. 74 per cent of the institutions’ solvency ratio falls in the 150-250 per cent band. these solvency ratios already include the foreseeable dividends reported by insurers in the 2016Q4 data supply, which is expected to reach almost HuF 51 billion at sector level. In the fourth quarter there was no institution with a solvency ratio less than 100 per cent, and only the three aforementioned insurers failed to comply with the MNB’s recommendation related to the holding of volatility capital buffer (chart 17).
Chart 16Capitalisation rate of insurers at sector level
199 205 211 215
184 186 188 189
169 169
204 222 224
204*
0
25
50
75
100
125
150
175
200
225
250
0
100
200
300
400
500
600 2
006
200
7
200
8
200
9
201
0
201
1
201
2
201
3
201
4
201
5
D1
201
6
Per centHUF BillionsSolvency
II Solvency I
Capital surplus Capital requirementSolvency ratio EU (right-hand scale)Solvency ratio (right-hand scale)
*2016Q3 data.Source: MNB.
INSuRaNcE MaRkEt aND ItS RISkS
INSURANCE, FUNDS AND CAPITAL MARKET RISK REPORT • 2017 31
Chart 17Solvency ratio of insurers at individual level
0
50
100
150
200
250
300
350
400
450
500
550
0
50
100
150
200
250
300
350
400
450
500
550
1 2 3 4 5 6 7 8 9 10
11
12
13
14
15
16
17
18
19
20
21
22
23
24
25
26
27
Per cent Per cent
below 100 %
2016 Q4
below 150 %
100%150%
Source: MNB.
2016 represented an outstanding significance for the insurance sector, due to the newly introduced insurance regulation, the Solvency II (S2) regime, which brought a number of qualitative and quantitative changes compared to the former Solvency I (S1) regime. the introduction of the S2 regime was preceded by a lengthy preparation, the purpose of which was, among others, to expand the European union’s insurance market, to increase the European insurers’ competitiveness, to give priority to the protection of clients’ interests and to standardise the supervision of the insurance sector. In addition, the harmonisation with the whole financial sector was also an important aspect, thus in accordance with the rules applied in the banking sector (Basel II), the S2 regime also rests on three pillars: the calculation methodology of the solvency capital requirement and the technical provisions (Pillar 1), the quality requirements applicable to corporate governance practices and the additional capital requirement that may be prescribed by the supervisory authority (Pillar 2), and supervisory reporting and disclosure (Pillar 3). Similar to banking practices, the S2 regime is based on risk management, risk-based requirements and the relationship between risk exposure and solvency requirements.
the experiences related to the transition to the S2 regime are based on the opening S2 data report for 1 January 2016 and the audit report verifying their accuracy, as well as the results of the stress test (St2016) examining the impacts of the persistently low yield environment and other market shocks, conducted by the European Insurance and Occupational Pensions authority (EIOPa).
after remedying the detected shortcomings of S2 reporting for 1 January 2016, standardise across the European union, Hungarian insurers fulfilled their reporting obligation to EIOPa, without major validation errors and with 100 per cent coverage. the S2 sector level capitalisation for1 January 2016 was 204 per cent, which is almost a twofold increase compared to the S1 value, as a result of the risk-based valuation of the solvency capital requirement and the economic revaluation of the available solvency capital. Despite the high sector level S2 capitalisation rate, the capitalisation of the individual institutions varies widely; 20 out of the 28 insurers are above the 150 per cent capital level, stipulated in the MNB’s recommendation on the volatility capital buffer.
Box 4The Solvency II regime and the first experiences of the transition
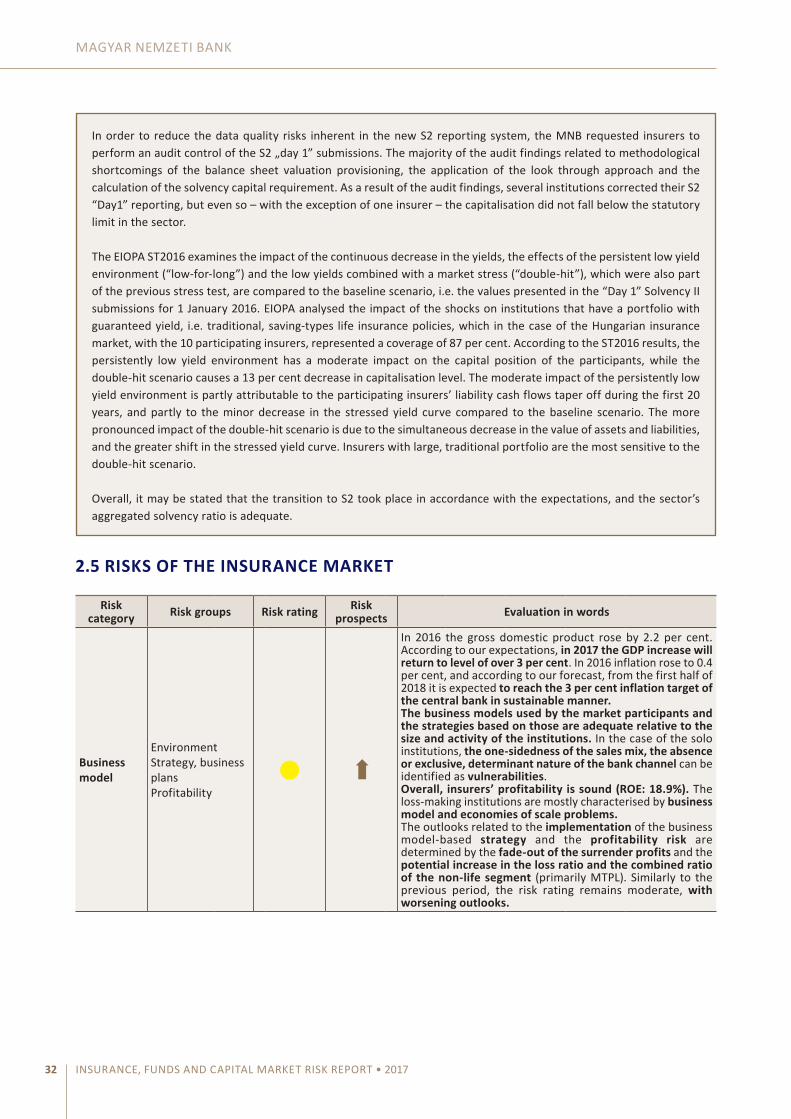
MAGYAR NEMZETI BANK
INSURANCE, FUNDS AND CAPITAL MARKET RISK REPORT • 201732
2.5 RISKS OF THE INSURANCE MARKET
Riskcategory Risk groups Risk rating Risk
prospects Evaluation in words
Business model
EnvironmentStrategy, business plansProfitability
● ➡
In 2016 the gross domestic product rose by 2.2 per cent. according to our expectations, in 2017 the GDP increase will return to level of over 3 per cent. In 2016 inflation rose to 0.4 per cent, and according to our forecast, from the first half of 2018 it is expected to reach the 3 per cent inflation target of the central bank in sustainable manner.The business models used by the market participants and the strategies based on those are adequate relative to the size and activity of the institutions. In the case of the solo institutions, the one-sidedness of the sales mix, the absence or exclusive, determinant nature of the bank channel can be identified as vulnerabilities. Overall, insurers’ profitability is sound (ROE: 18.9%). the loss-making institutions are mostly characterised by business model and economies of scale problems. the outlooks related to the implementation of the business model-based strategy and the profitability risk are determined by the fade-out of the surrender profits and the potential increase in the loss ratio and the combined ratio of the non-life segment (primarily MtPL). Similarly to the previous period, the risk rating remains moderate, with worsening outlooks.
In order to reduce the data quality risks inherent in the new S2 reporting system, the MNB requested insurers to perform an audit control of the S2 „day 1” submissions. the majority of the audit findings related to methodological shortcomings of the balance sheet valuation provisioning, the application of the look through approach and the calculation of the solvency capital requirement. as a result of the audit findings, several institutions corrected their S2 “Day1” reporting, but even so – with the exception of one insurer – the capitalisation did not fall below the statutory limit in the sector.
the EIOPa St2016 examines the impact of the continuous decrease in the yields, the effects of the persistent low yield environment (“low-for-long”) and the low yields combined with a market stress (“double-hit”), which were also part of the previous stress test, are compared to the baseline scenario, i.e. the values presented in the “Day 1” Solvency II submissions for 1 January 2016. EIOPa analysed the impact of the shocks on institutions that have a portfolio with guaranteed yield, i.e. traditional, saving-types life insurance policies, which in the case of the Hungarian insurance market, with the 10 participating insurers, represented a coverage of 87 per cent. according to the St2016 results, the persistently low yield environment has a moderate impact on the capital position of the participants, while the double-hit scenario causes a 13 per cent decrease in capitalisation level. the moderate impact of the persistently low yield environment is partly attributable to the participating insurers’ liability cash flows taper off during the first 20 years, and partly to the minor decrease in the stressed yield curve compared to the baseline scenario. the more pronounced impact of the double-hit scenario is due to the simultaneous decrease in the value of assets and liabilities, and the greater shift in the stressed yield curve. Insurers with large, traditional portfolio are the most sensitive to the double-hit scenario.
Overall, it may be stated that the transition to S2 took place in accordance with the expectations, and the sector’s aggregated solvency ratio is adequate.
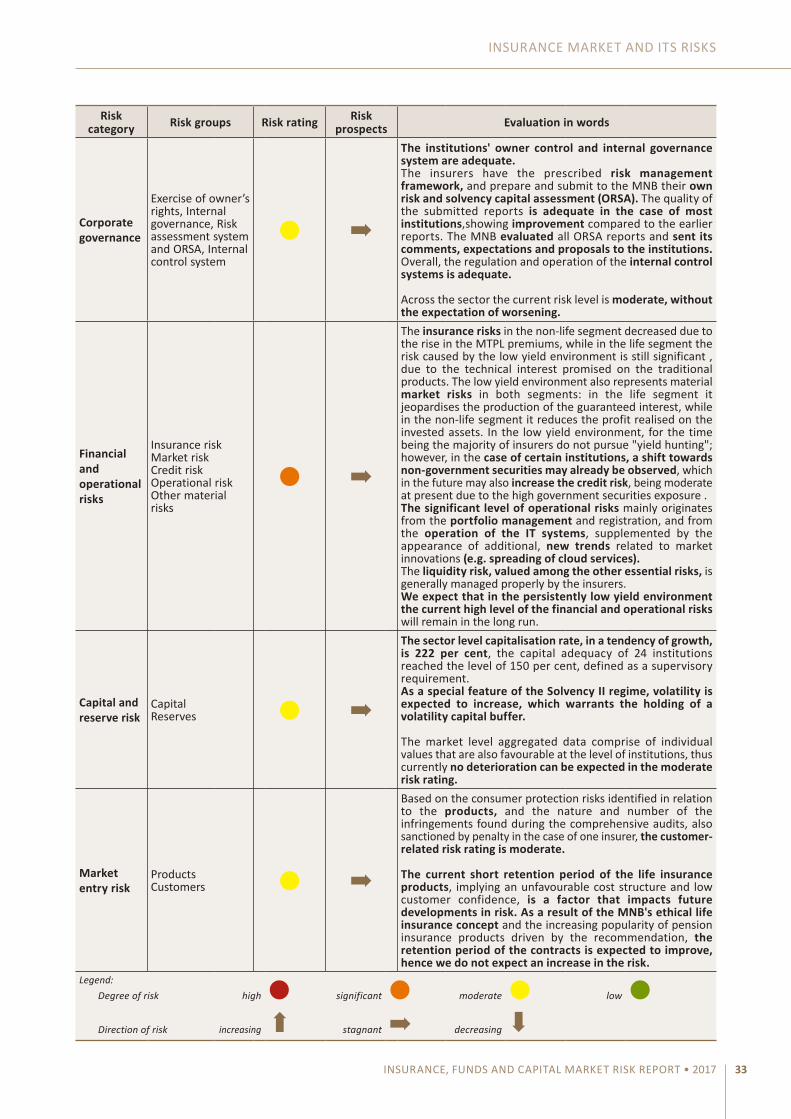
INSuRaNcE MaRkEt aND ItS RISkS
INSURANCE, FUNDS AND CAPITAL MARKET RISK REPORT • 2017 33
Riskcategory Risk groups Risk rating Risk
prospects Evaluation in words
Corporate governance
Exercise of owner’s rights, Internal governance, Risk assessment system and ORSa, Internal control system
● ➡
The institutions' owner control and internal governance system are adequate.the insurers have the prescribed risk management framework, and prepare and submit to the MNB their own risk and solvency capital assessment (ORSA). the quality of the submitted reports is adequate in the case of most institutions,showing improvement compared to the earlier reports. the MNB evaluated all ORSa reports and sent its comments, expectations and proposals to the institutions.Overall, the regulation and operation of the internal control systems is adequate.
across the sector the current risk level is moderate, without the expectation of worsening.
Financial and operational risks
Insurance risk Market risk credit risk Operational risk Other material risks
● ➡
the insurance risks in the non-life segment decreased due to the rise in the MtPL premiums, while in the life segment the risk caused by the low yield environment is still significant , due to the technical interest promised on the traditional products. the low yield environment also represents material market risks in both segments: in the life segment it jeopardises the production of the guaranteed interest, while in the non-life segment it reduces the profit realised on the invested assets. In the low yield environment, for the time being the majority of insurers do not pursue "yield hunting"; however, in the case of certain institutions, a shift towards non-government securities may already be observed, which in the future may also increase the credit risk, being moderate at present due to the high government securities exposure .The significant level of operational risks mainly originates from the portfolio management and registration, and from the operation of the IT systems, supplemented by the appearance of additional, new trends related to market innovations (e.g. spreading of cloud services). the liquidity risk, valued among the other essential risks, is generally managed properly by the insurers.We expect that in the persistently low yield environment the current high level of the financial and operational risks will remain in the long run.
Capital and reserve risk
capital Reserves ● ➡
The sector level capitalisation rate, in a tendency of growth, is 222 per cent, the capital adequacy of 24 institutions reached the level of 150 per cent, defined as a supervisory requirement.As a special feature of the Solvency II regime, volatility is expected to increase, which warrants the holding of a volatility capital buffer.
the market level aggregated data comprise of individual values that are also favourable at the level of institutions, thus currently no deterioration can be expected in the moderate risk rating.
Market entry risk
Products customers ● ➡
Based on the consumer protection risks identified in relation to the products, and the nature and number of the infringements found during the comprehensive audits, also sanctioned by penalty in the case of one insurer, the customer-related risk rating is moderate.
The current short retention period of the life insurance products, implying an unfavourable cost structure and low customer confidence, is a factor that impacts future developments in risk. As a result of the MNB's ethical life insurance concept and the increasing popularity of pension insurance products driven by the recommendation, the retention period of the contracts is expected to improve, hence we do not expect an increase in the risk.
Legend: Degree of risk high ● significant ● moderate ● low ●
Direction of risk increasing ➡ stagnant ➡ decreasing
➡
MAGYAR NEMZETI BANK
INSURANCE, FUNDS AND CAPITAL MARKET RISK REPORT • 201734
the business model of the insurers must be maintained in an external environment that may be deemed favourable. In 2016 the gross domestic product increased at a moderate rate, compared to the previous years, by 2.2 per cent. according to our expectations, as a result of the favourable labour market trends and the recovering public and private sector investment activity, the growth rate will once again exceed 3 per cent in 2017. In 2016 inflation rose to 0.4 per cent, and according to our forecast, it is expected to reach the central bank’s 3 per cent inflation target in a sustainable way from the first half of 2018.
the business models applied by the market participants and the strategies based on those are adequate relative to the size and activity of the institutions. the assessment is based on criteria varying by institutions. certain insurers give preference to gradual, stable growth based on their own sales network, while others define the product range and the targeted customer base adjusted to some specific characteristics. an example of the latter one may be where the bank sales channel is of great significance, the development of mass products that sell well in the branch network, or focusing on the protection of the previously successfully built portfolios. upon assessing the sustainability of the business model, the justifiability and stability of such individual “advantages” also receive special attention. thus, in the case of certain institutions, the one-sidedness of the sales mix, the absence or exclusive, dominant nature of the banking channel, or the strong competition in the market of the key product, jeopardising the insurer’s position, may be identified as vulnerabilities.
Overall, the insurers’ profitability is sound (ROE: 18.9 per cent). the loss-making institutions are mostly characterised by business model and economies of scale problems. the factors determining the prospects related to the implementation of the business model-based strategy and to the profitability risks include the fade-out of the surrender profitl, and the potential increase in the loss ratio and combined ratio of the non-life (primarily the MtPL) segment.
Similarly to the previous period, the risk rating is still moderate with worsening outlooks.
the continuous and sound assessment of the risks related to the operation of the corporate governance system is eased by the fact that a large part of the Solvency II corporate governance requirements must be applied already from 1 July 2014. the owner’s control and internal governance system of the institutions are adequate.
In November 2016, the insurers submitted to the MNB, for the first time on a mandatory basis their own risk and solvency assessment (ORSa). there are major differences in the quality of the submitted reports, but it can be stated generally that in the case of most of the institutions the level of detail and quality of the reports is adequate, or at least there are no major shortcomings. compared to the previous reports, sent in the preparatory period on a non-mandatory basis, the trend is clearly improving. the MNB evaluated all ORSa reports and sent its comments, expectations and proposals to all institutions.
the regulation level and operation of the internal control systems are satisfactory on the whole; however, the independence of certain elements of it and the ensuring of the proper operation of the otherwise independent control tasks are still in the special focus of the on-site and off-site supervision.
Currently the risk level within the sector is moderate, which is not expected to worsen.
Of the financial and operational risks, the insurance risks decreased during 2016, which is attributable to the rise in the level of the MtPL premiums. as a result of the premium increase, the income and expenditure sides basically became balanced, and the sector level technical result of the segment became positive. thus, additional premium increase may only be justified by a potential further increase in risks. Within the life insurance segment, and particularly in the case of the traditional products, the main challenge is still posed by the low yield environment. Namely, the guaranteed interest (technical interest) formerly offered to the customers at present exceeds the realisable risk-free yields. In order to manage this risk, the MNB reduced

INSuRaNcE MaRkEt aND ItS RISkS
INSURANCE, FUNDS AND CAPITAL MARKET RISK REPORT • 2017 35
the maximum of the technical interest rate from 1 July 2016: in the case of the forint-denominated products sold after this date the guaranteed interest rate must not exceed 2.3 per cent.
the low yield environment represents a significant market risk for both segments: in the life insurance segment it jeopardises the production of the interest guaranteed to the policy holders of traditional life insurances, while in the non-life segment it reduces the investment result realised on the technical provisions and on the instruments representing the equity. In the low yield environment, for the time being the majority of insurers do not pursue “yield hunting”, assuming higher investment risk with a view to realising potentially higher return; however, in the case of certain institutions, a shift towards the non-government securities, primarily corporate bonds and mutual fund shares can already be observed, which in the future may also increase the credit risk, being moderate at present due to the high government securities exposure.
the significant level of operational risks mainly originates from the portfolio management and registration, and from the operation of the It systems, supplemented by the appearance of additional, new trends related to market innovations (e.g. spreading of cloud services).
the liquidity risk, valued among the other essential risks, is generally managed properly by the insurers. Based on the experiences of the on-site inspections, the institutions mostly have operative and crisis liquidity regulations of suitable quality, and they have also developed the organisational framework of asset-liability management and liquidity management.
We expect that in the persistently low yield environment the present high level of the financial and operational risks will remain in the long run.
In the MNB’s view, the capital and reserve risk at present is moderate at sector level. this is primarily evidenced by the fact that the market’s combined capital adequacy ratio is 222 per cent, which exceeds not only the statutory 100 per cent, but also the 150 per cent set in the MNB’s recommendation related to the holding of capital buffers. Positive trends can be observed at the level of the individual institutions as well that constitute the average. at present there is no institution in the Hungarian insurance market whose capital adequacy fails to reach 100 per cent, and there are only three insurers – representing 1.7 per cent of the market in total – in the case of which the index is below the prudential target of 150 per cent.
according to the MNB’s expectation, no deterioration may be expected in the sector level capital adequacy that would jeopardise the operation of the institutions and the customers’ interests. at the same time, the volatility in the capital requirements and the available solvency capital, being a special feature of the Solvency II regime, renders it necessary to ensure the capital adequacy specified in the capital buffer recommendation or, in the case of certain institutions – due to some of their special characteristics – even higher.
In relation to the market appearance of the insurers no fact was identified that would justify a classification of a worse than moderate risk level. During the on-site inspections, in addition to reviewing the statutory compliance of the contractual terms of the products, the customer information and complaint management, these are also assessed in terms of consumer protection. the MNB always takes actions when it experiences infringements and/or practices contrary to the consumers’ interests.
the MNB expects that as a result of the ethical concept, which entered into force after comprehensive market consultations, the low average duration of the pension insurance products seen before, will perceivably increase, thus no deterioration can be expected in the level of product and client risk.

MAGYAR NEMZETI BANK
INSURANCE, FUNDS AND CAPITAL MARKET RISK REPORT • 201736
2.6 SPECIAL FEATURES OF INTERMEDIARIES
The emphasis in insurance intermediation was realigned to the benefit of the non-life segment
Relying on the data reporting, the MNB continuously measures the performance of independent insurance intermediary brokers and the tied insurance intermediary multiple agents, in the area of life and non-life insurances alike. the commission amount is a proven, clear method of performance measurement. Formerly the incomes in the two segments were harmonised; however, at present the commission from non-life insurances are twice as high as the life insurance commissions. With a declining tendency the life insurance commissions changed hectically since 2007, and shrank by 37 per cent in total, while in the non-life segment the commission incomes rose by 45 per cent, after a continuous increase, compared to the 2007 base. On the whole, commission incomes rose in the last 3 years, but they have not reached the 2007 level.
after the economic crisis, there was a major decline in the life insurance commissions; from 2009 a temporary recovery started on the basis of individual business models, followed by a consolidation process from 2011. Several of the large intermediaries, focusing solely on the sales of life insurance, shrank. at the companies that remained in the market, a strategic shift can be observed, as instead of the former “single product” sales they turned to the intermediation of as broad range of insurance products as possible (chart 18).
One-third of the life insurance portfolio is sold by brokers and multiple agents
the volume of life insurance intermediation has been following the trends of the whole market since 2010; the ratio of intermediated 12-month regular premium compared to the whole market stabilised around 30-40 per cent. at the same time, a decrease in the level of commissions can be also observed, as under the essentially stagnating intermediated volume since 2012, the commissions paid by the insurers in respect of the intermediation of life insurances have fallen by 15.3 per cent compared to the base of 3 years ago (chart 19).
Chart 18Changes in commissions paid to brokers and multiple agents
23.024.5 25.0
27.427.5
27.9 28.5
32.735.4
28.5
31.7
18.0
26.3
29.7
20.9
19.219.1
17.7
0
5
10
15
20
25
30
35
40
0
5
10
15
20
25
30
35
40
2007
2008
2009
2010
2011
2012
2013
2014
2015
HUF Billions HUF Billions
Rest of the intermediaries (non-life)Current year TOP10 (Life)Rest of the intermediaries (Life)
Current year TOP10 (non-life)
Source: MNB.

INSuRaNcE MaRkEt aND ItS RISkS
INSURANCE, FUNDS AND CAPITAL MARKET RISK REPORT • 2017 37
More than half of the non-life segment’s sales are referred by brokers and multiple agents
the portfolio premium of the intermediated 12-month regular premium products has been steadily increasing since 2012; in 2015 the growth rate was 11 per cent, while the intermediaries’ share in the new acquisitions decreased by 6 percentage points, as the whole market growth outstripped the increase in intermediation. Despite this fact, more than half of the non-life new contracts are concluded by the customers via brokers or multiple agents (chart 20).
The number of intermediary natural persons stabilised around thirty thousand
Based on the present regulation, the insurance intermediary brokers and multiple agents have to submit a report on their intermediation activity to the MNB once a year; hence at present we have the data related
Chart 19Life insurance sales volume of brokers and multiple agents
49.8 51.157.3
61.6
74.2
49.742.9
48.7 50.447%
43%
27%34% 33% 33%
38% 36% 36%
19.5 17.813.7 17.2 16.0 13.5 17.7 18.9 16.616.6
0
10
20
30
40
50
60
70
80
90
100
0
10
20
30
40
50
60
70
80
90
100
2007
2008
2009
2010
2011
2012
2013
2014
2015
HUF Billions Per cent
Non-intermediary 12-month regular premiumIntermediary premium income from single premium contractsNon-intermediary premium income from single premium contracts
Intermediary 12-month regular premiumRatio of the total intermediary 12-month regular premium to the total market (right-hand scale)
*In regard to the volatility of the single premium, we took 10% of the premium every year.Source: MNB.
Chart 20Non-life sales volume of brokers and multiple agents
36%
48% 43% 41% 37%
46% 47%
57% 51%
170.1 179.0 181.1 183.7 185.2
136.0 132.0 127.9
157.8
0
10
20
30
40
50
60
70
80
90
100
0
20
40
60
80
100
120
140
160
180
200
2007
2008
2009
2010
2011
2012
2013
2014
2015
HUF Billions Per cent
Non-intermediary 12-month regular premiumIntermediary 12-month regular premiumRatio of the total intermediary 12-month regular premium to the total market
Source: MNB.

MAGYAR NEMZETI BANK
INSURANCE, FUNDS AND CAPITAL MARKET RISK REPORT • 201738
to 2015. On the other hand, the register of insurance intermediaries contains up-to-date information on the number of intermediaries. Since 2013 the number of intermediary natural persons stabilised around 29-30,000. as a result of the amendment of the Insurance act with effect of 1 January 2016, multiple agents were reclassified as tied intermediaries.
No major change in the headcount or realignment was observed in the last two years; on the other hand, the 3.4 per cent decrease in the number of multiple agents was accompanied by a 3 per cent increase in the insurers’ tied agent staff and a 4.7 increase in the number of brokers (chart 21).
Chart 21Changes in the number of insurance intermediary natural persons
19,9
02
19,9
83
16,6
39
16,5
97
16,6
06
15,3
66
14,4
82
14,8
07
13,8
40
14,2
61
9,49
7
12,0
04
10,6
18
7,74
5
7,48
0
5,99
0
5,55
2
6,14
6
6,55
3
6,34
0
9,41
2 9,74
2
9,15
6
9,28
2
9,17
1
8,80
5
8,85
2
8,67
0
8,66
7
9,09
1
38,81141,729
36,413
33,624 33,25730 161 28,886 29,623 29,060 29,692
0
5,000
10,000
15,000
20,000
25,000
30,000
35,000
40,000
45,000
0
5,000
10,000
15,000
20,000
25,000
30,000
35,000
40,000
45,000
2007
2008
2009
2010
2011
2012
2013
2014
2015
2016
PersonsPersons
Multiple agentBroker
AgentTotal
Source: MNB.
Since 2013 an independent department performs the supervision of the insurance intermediaries, and of the financial market intermediary brokers and multiple agents. Since the set-up of the dedicated department, the methodology of the intermediary supervision is under continuous development. Initially, the prudential supervision of the intermediaries was performed by verifying the existence of the fundamental personal and material conditions, representing the cornerstone of supervision, and – along targeted inspections, performed with the participation of the consumer protection area. the next step was that the MNB improved the quality of the intermediaries’ data reporting by analysing the data supplies and elaborating monitoring indicators, and in certain cases it identified operational anomalies. In the spirit of the Insurance Distribution Directive (IDD) (in order to ensure that intermediaries always act in an honest, fair and professional manner in the best interest of their customers), the MNB, strengthening the consumer protection approach, extended the focus of the prudential audits to the inspection of properly documented professional care. the inspection of professional care and competence in the area of intermediary audit is performed by new tools, including the analysis of large volumes of individual contract documentation, hearing of witnesses and trial purchases. as a next step of the improvement of intermediary oversight, from 2017 the MNB integrated the prudential and consumer protection supervision of the intermediaries into a single department, thus by capitalising on the synergy between the two areas and applying standardised measures, it increases the efficiency of the intermediary oversight.
Box 5Integrated intermediary oversight

INSuRaNcE MaRkEt aND ItS RISkS
INSURANCE, FUNDS AND CAPITAL MARKET RISK REPORT • 2017 39
Extension of the intermediaries’ reporting obligations
until the end of 2016 only the insurance intermediaries had regular supervisory reporting obligations; as part of the expansion of the set of supervisory instruments, from 2017 the independent financial market intermediaries (brokers, multiple agents) are also required to perform supervisory data reporting, which affects almost five hundred institutions. Due to the high number of intermediaries, one of the most important means of oversight is the analysis of the intermediaries’ operation through the data supply. as for performing the supervisory work the availability of the proper data is essential, similarly to all other sectors supervised by the MNB, it is the main priority of the MNB in 2017 in respect of the financial market intermediaries as well to ensure proper data quality in the data reporting, exercising zero tolerance in respect of data errors.
Measures
One of the most important means of oversight is the information obtained from the data reporting, thus meeting the reporting requirements by the supervised institutions in due course and in proper quality bears an outstanding importance, the existence of which is also essential upon the oversight of intermediaries. In 2016 the activity licence of 5 insurance intermediaries was withdrawn due to their failure to fulfil the reporting obligations, while in 76 cases penalty was imposed in the total amount of HuF10.6 million.
the area responsible for the supervision of the intermediaries inspected the existence of the liability insurance of the financial market intermediaries through thematic audits. as a result of the inspection, the MNB established the absence of the liability insurance at several intermediaries, as a result of which it withdrew the licence of 48 financial market intermediaries by applying sanctions. the total amount of the imposed penalties is HuF 6.75 million.
Directive 2016/97 on insurance distribution entered into force on 22 February 2016. Similarly to the previous regulation (Insurance Mediation Directive), the directive is a minimum harmonisation directive; however, compared to the previous directive, its scope has been substantially extended, and from now on it covers – with specified exceptions – all organisations engaged in insurance distribution. With a view to ensuring more efficient consumer protection, the directive reinforces the distributors’ obligations in respect of the needs assessment and information of customers, particularly in the case of insurance-based investment products, and prescribes ongoing professional training and in-service training, meaning at least 15 hours of professional training/in-service training annually. the directive is an important step towards the implementation of a higher level integration, facilitates the proper functioning of the internal insurance market of the European union, and together with this, in the case of cross-border sales the host member state’s competent authority receives new, more efficient tools in the area of fulfilling the obligations set forth in the directive. the product oversight and governance (POG) requirements, the conflict of inte-rest rules, the rules related to remuneration and incentives and the detailed rules related to the assessment of suitability and appropriateness, and the information of customers, included in the new directive, are determined in the form of delegated acts. the professional opinion for these sub-rules was delivered by the European Insurance and Occupational Pensions authority (EIOPa) to the European commission on 1 February 2017. the deadline for the implementation of the Eu regulation, completed by the sub-rules, in the Member States is 23 February 2018.
Box 6Regulation of insurance distribution across Europe
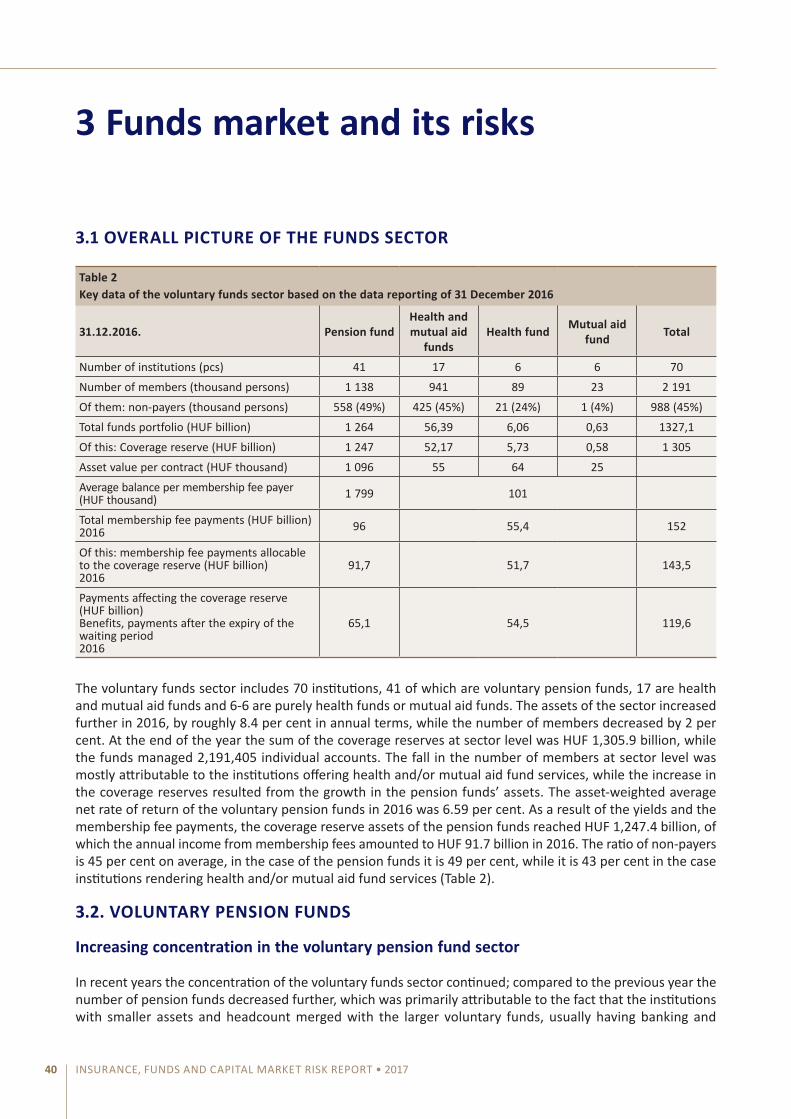
INSURANCE, FUNDS AND CAPITAL MARKET RISK REPORT • 201740
3 Funds market and its risks
3.1 OVERALL PICTURE OF THE FUNDS SECTOR
Table 2Key data of the voluntary funds sector based on the data reporting of 31 December 2016
31.12.2016. Pension fundHealth and mutual aid
fundsHealth fund Mutual aid
fund Total
Number of institutions (pcs) 41 17 6 6 70
Number of members (thousand persons) 1 138 941 89 23 2 191
Of them: non-payers (thousand persons) 558 (49%) 425 (45%) 21 (24%) 1 (4%) 988 (45%)
total funds portfolio (HuF billion) 1 264 56,39 6,06 0,63 1327,1
Of this: coverage reserve (HuF billion) 1 247 52,17 5,73 0,58 1 305
asset value per contract (HuF thousand) 1 096 55 64 25
average balance per membership fee payer (HuF thousand) 1 799 101
total membership fee payments (HuF billion) 2016 96 55,4 152
Of this: membership fee payments allocable to the coverage reserve (HuF billion) 2016
91,7 51,7 143,5
Payments affecting the coverage reserve (HuF billion) Benefits, payments after the expiry of the waiting period 2016
65,1 54,5 119,6
the voluntary funds sector includes 70 institutions, 41 of which are voluntary pension funds, 17 are health and mutual aid funds and 6-6 are purely health funds or mutual aid funds. the assets of the sector increased further in 2016, by roughly 8.4 per cent in annual terms, while the number of members decreased by 2 per cent. at the end of the year the sum of the coverage reserves at sector level was HuF 1,305.9 billion, while the funds managed 2,191,405 individual accounts. the fall in the number of members at sector level was mostly attributable to the institutions offering health and/or mutual aid fund services, while the increase in the coverage reserves resulted from the growth in the pension funds’ assets. the asset-weighted average net rate of return of the voluntary pension funds in 2016 was 6.59 per cent. as a result of the yields and the membership fee payments, the coverage reserve assets of the pension funds reached HuF 1,247.4 billion, of which the annual income from membership fees amounted to HuF 91.7 billion in 2016. the ratio of non-payers is 45 per cent on average, in the case of the pension funds it is 49 per cent, while it is 43 per cent in the case institutions rendering health and/or mutual aid fund services (table 2).
3.2. VOLUNTARY PENSION FUNDS
Increasing concentration in the voluntary pension fund sector
In recent years the concentration of the voluntary funds sector continued; compared to the previous year the number of pension funds decreased further, which was primarily attributable to the fact that the institutions with smaller assets and headcount merged with the larger voluntary funds, usually having banking and
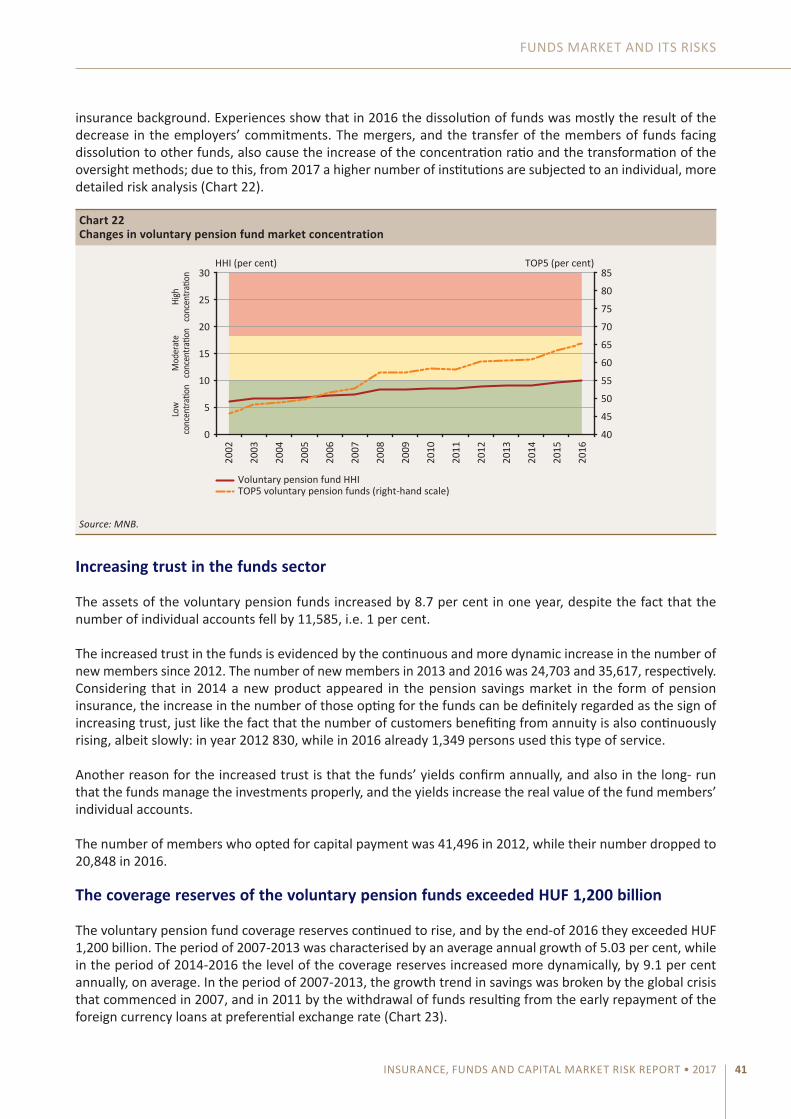
FuNDS MaRkEt aND ItS RISkS
INSURANCE, FUNDS AND CAPITAL MARKET RISK REPORT • 2017 41
insurance background. Experiences show that in 2016 the dissolution of funds was mostly the result of the decrease in the employers’ commitments. the mergers, and the transfer of the members of funds facing dissolution to other funds, also cause the increase of the concentration ratio and the transformation of the oversight methods; due to this, from 2017 a higher number of institutions are subjected to an individual, more detailed risk analysis (chart 22).
Increasing trust in the funds sector
the assets of the voluntary pension funds increased by 8.7 per cent in one year, despite the fact that the number of individual accounts fell by 11,585, i.e. 1 per cent.
the increased trust in the funds is evidenced by the continuous and more dynamic increase in the number of new members since 2012. the number of new members in 2013 and 2016 was 24,703 and 35,617, respectively. considering that in 2014 a new product appeared in the pension savings market in the form of pension insurance, the increase in the number of those opting for the funds can be definitely regarded as the sign of increasing trust, just like the fact that the number of customers benefiting from annuity is also continuously rising, albeit slowly: in year 2012 830, while in 2016 already 1,349 persons used this type of service.
another reason for the increased trust is that the funds’ yields confirm annually, and also in the long- run that the funds manage the investments properly, and the yields increase the real value of the fund members’ individual accounts.
the number of members who opted for capital payment was 41,496 in 2012, while their number dropped to 20,848 in 2016.
The coverage reserves of the voluntary pension funds exceeded HUF 1,200 billion
the voluntary pension fund coverage reserves continued to rise, and by the end-of 2016 they exceeded HuF 1,200 billion. the period of 2007-2013 was characterised by an average annual growth of 5.03 per cent, while in the period of 2014-2016 the level of the coverage reserves increased more dynamically, by 9.1 per cent annually, on average. In the period of 2007-2013, the growth trend in savings was broken by the global crisis that commenced in 2007, and in 2011 by the withdrawal of funds resulting from the early repayment of the foreign currency loans at preferential exchange rate (chart 23).
Chart 22Changes in voluntary pension fund market concentration
HHI (per cent)
Low
concen
tratio
nM
oder
ate
concen
tratio
nHi
ghconcen
tratio
n
TOP5 (per cent)
2002
2003
2004
2005
2006
2007
2008
2009
2010
2011
2012
2013
2014
2015
2016
Voluntary pension fund HHITOP5 voluntary pension funds (right-hand scale)
40
45
50
55
60
65
70
75
80
85
0
5
10
15
20
25
30
Source: MNB.

MAGYAR NEMZETI BANK
INSURANCE, FUNDS AND CAPITAL MARKET RISK REPORT • 201742
High yields despite the low interest environment
the funds still invest mostly in Hungarian government securities. almost 60 per cent of the pension funds’ assets are invested directly in Hungarian government securities.
In 2016, the Hungarian money and capital market was characterised by varying interest environment. the yields of long-term government securities were between 2 and 4 per cent, depending on the tenor, while the return on bank deposits was practically close to 0 per cent. However, the capital market performed well; the Bux index, representing the domestic equity investments, accounting for 6 per cent of the funds’ investments, realised a yield of 35 per cent, while the cEtOP index, covering the central and Eastern Europe region, registered a 4.3 per cent yield.
In 2016, the voluntary pension funds realised an asset-weighted average net yield of 6.59 per cent, which shows large differences between the individual portfolios; the yield realised by the best performing fund portfolio exceeded 13 per cent. the average yield exceeded the 2015 yields by 2 percentage points. the funds’ yield substantially exceeded the 1.8 per cent year-on-year inflation of 2016/2015, thus the value of the members’ assets rose considerably in real terms as well (chart 24.)
Since the vast majority of the pension funds have a history of more than 15 years, the presentation of the 15-year yields was justified. the 15-year asset-weighted average net rate of return was 7.22 per cent, while the 15-year average year-on-year inflation was 3.86 per cent, thus the funds may be regarded as a form of savings of stable value in the long run as well.
Chart 23Developments in the voluntary pension fund coverage reserves
0
200
400
600
800
1,000
1,200
1,400
0
200
400
600
800
1,000
1,200
1,400
2006
2007
2008
2009
2010
2011
2012
2013
2014
2015
2016
HUF Billions HUF Billions
+9.1%/year
+5.03%/year
Voluntary pension fund coverage reserve
Source: MNB.

FuNDS MaRkEt aND ItS RISkS
INSURANCE, FUNDS AND CAPITAL MARKET RISK REPORT • 2017 43
The share of government securities is still high
Within the voluntary pension funds’ coverage reserve investments, Hungarian government securities still account for the largest part. the estimated government securities exposure in the Hungarian investment funds is around 10 per cent, thus the actual level of the total government securities holding in voluntary pension funds’ portfolios exceeds 60 per cent. Both the Hungarian and the foreign mutual fund shares represent an increasing proportion within the funds’ portfolios, thus through the indirect and direct investments, by expanding the investment funds, the actual ratio of the equity exposure may be higher than 6 per cent (chart 25).
5 the securities in respect of which the Hungarian government provides demand guarantee are also included in the Hungarian government securities category. the bonds and mortgage bonds issued by enterprises and credit institutions are stated in the category of bonds. the Other category includes: petty cash, bank accounts and cash, term deposit, the privately distributed equity of banks with a registered office in Hungary, real property, other collective investment securities and loan to members.
Chart 24Developments in the voluntary pension fund coverage reserves, membership fee income, volume of yields and annual average rate of return
5.8
–10.7
16.38.2
0.6
14.87.8 8.4 4.41 6.6
–15
0
15
30
45
60
75
90
105
–200
0
200
400
600
800
1,000
1,200
1,400
2007 2008 2009 2010 2011 2012 2013 2014 2015 2016
HUF Billions Per cent
Return on coverageMembership fee income received
Coverage reserve calculated without incomeAverage annual rate of return (right-hand scale)
Source: MNB.
Chart 25Composition of the voluntary pension funds’ investments5
Hungarian government securities Corporate bond and mortgage bondEquitiesMutual fund shares registered in HungaryMutual fund shares registered abroadOther
59%
5% 6%
16%
10% 4%
Source: MNB.

MAGYAR NEMZETI BANK
INSURANCE, FUNDS AND CAPITAL MARKET RISK REPORT • 201744
The ratio of individual contribution increases in the voluntary pension funds
after the nadir in 2011, the volume of payments to the voluntary pension funds once again started to show a rising trend; in 2016 a year-on-year growth of 9 per cent was registered as a result of the 12 per cent increase in the membership fees paid by the members. a substantial part of the payments took place under a decrease in the number of members by 145,000 persons between 2007 and 2016, which evidences that this form of self-provision is becoming increasingly popular among the members. Within this period, from 2011 a shift can be observed from the membership fee payments by employers towards the individual contributions: in 2007 the ratio of the employer’s contribution to the individual membership payments was 71-29 per cent, in 2016 this ratio was already 44-56 per cent.
In addition to the aforementioned effect, the growth in the received membership fees was also attributable to the fact that several institutions of major volume decided to increase the compulsory membership fee, which was unchanged for several years, with effect from 1 January 2016.
In 2009-2010 the decline in the employers’ contribution was attributable to the crisis, and thereafter to the employers’ higher tax burdens and the change in the rules related to fringe benefits (available limit and range of fringe benefit elements). another reason for the decrease in the employers’ contribution may be the fact that contrary to other fringe benefit elements, the pension fund contribution is becoming a less and less attractive form of fringe benefits for the employees.
the increase in the members’ willingness to make individual membership fee contribution may be attributable to the fact that the fund members tend to recognise the importance of self-provision; the increase in the average wage, resulting from the reduction of the personal income tax rate, also points to this direction, and many of the members regard the voluntary pension funds as a favourable form of saving due to the yields realised on them (chart 26).
6 after the amendment of the data reporting decree, effective from 1 January 2016, it is the first time that we have data on the ratio and breakdown of the individual and employer’s membership fee contribution actually credited to the coverage reserve; the breakdown of the previous years’ data contained only the prescribed membership fee. Based on the breakdown of the individual and employer’s membership fee contribution, actually received in 2016, in respect of the previous years we estimated the breakdown of the membership fees actually credited to the coverage reserves.
Chart 26Membership fee income credited to the voluntary pension funds’ coverage reserves, broken down by payers6
0
10
20
30
40
50
60
70
80
90
100
0
10
20
30
40
50
60
70
80
90
100
2007 2008 2009 2010 2011 2012 2013 2014 2015 2016
HUF Billions HUF Billions
Individual membership fee incomeEmployers’ membership fee contribution
Source: MNB.

FuNDS MaRkEt aND ItS RISkS
INSURANCE, FUNDS AND CAPITAL MARKET RISK REPORT • 2017 45
there are also inherent risks in the decrease in the ratio of the employers’ membership fee contribution within the funds’ income. the employers’ representatives are active participants in the operation of the institution through the member recruitment and liaison with the members; the unfavourable effects of the decrease in the employers’ role can be felt primarily in the change in the number of the institutions’ members. It should be also emphasised that the employees with moderate wages have no, or have only limited possibility to increase their savings of self-provision nature by their individual contributions, thus the decline in the employers’ contribution may have an adverse effect particularly on these fund members.
It is particularly important to ensure that in addition to the saving objective the pension objective is also achieved, and the product is not only a form of a 10-year saving combined with tax allowance; hence it is also necessary to emphasise the importance of annuities.
In the case of the health and mutual aid funds, a shift towards the individual membership fee payments can be also observed, although at sector level the employers’ contribution still has higher share in the payments (in 2007 the employers’ to individual contribution ratio was 81-19 per cent, while in 2016 this ratio is 60-40 per cent).
the operation of the pension fund sector has a history of over 20 years and the maturation process of the system can already be observed over this period. after the initial soar in the number of members, the membership growth rate decelerates and then halts, while the number of the members reaching the retirement age and thereby becoming eligible for benefits, increases. the initial increase in the number of members stopped a few years ago; moreover, from 2012 it has been decreasing with varying intensity, which was 1 per cent in 2016. the more detailed analysis of the change in the age breakdown of the pension funds members highlights a risk that could be reduced by managing the lifecycle of the scheme.
When comparing the 2002 and 2015 age pyramid charts of the pension fund members, we find that in the period of 2002-2015 the number of fund members below the age of 33 considerably decreased. On the chart, the striped area
Box 7Missing generation at the pension funds
Chart box 4Change in the number of voluntary pension fund members by age pyramid (2002-2015)
40
27
0
10
20
30
40
50
60
0
10
20
30
40
50
60
16
18
20
22
24
26
28
30
32
34
36
38
40
42
44
46
48
50
52
54
56
58
60
62
64
66
68
70
72
74
76
78
80
Thousands persons Thousands persons
Age (years)
Non-payers 2015Number of members 2015Number of members 2002
Source: MNB.

MAGYAR NEMZETI BANK
INSURANCE, FUNDS AND CAPITAL MARKET RISK REPORT • 201746
In 16 years the costs charged to the voluntary pension fund members substantially decreased
the charge ratio shows the average percentage value of the deductions from the voluntary pension fund members compared to the balance of their individual accounts, based on the membership fee part allocable to the operational and liquidity reserves and the asset management and custodian fee linked with the savings. the charge ratio at the voluntary pension funds substantially decreased in 15 years; by the end-of 2015 at sector level it fell from 1.97 to 0.84 per cent. this was partly attributable to the upper limit introduced in respect of the asset management fees, and the market competition between the asset managers also contributed to the decrease in the fees and costs. the decrease in the operational charge ratio was caused by the fact that due to competition, the institutions determine an increasing part of the received membership fees to be allocated to the coverage reserve and by applying tiered membership fee payment, the fund members making higher membership fee payments can increase their individual savings to an even larger degree.
With the years passing by, the investment charge part represents an increasing proportion in the composition of the charge, in view of the fact that the funds’ assets are continuously increasing, hence the costs paid in respect of the asset and custody management also rises relating to this. the level of the operational charge ratio seems to stabilise, as the conditions connected with the operation of the funds business are established, and as a result of the consolidation of the funds the size of the operation tend to reach the economies of scale (chart 27).
In addition to the charge ratio, an acR-like index is being constructed which also calculates with the indirect investment costs when considering the costs burdening the pension fund members.
indicates the degree of the decrease, which represents more than 125,000 members. as regards the younger pension fund members, in 2002 the number of members in the 27-year age group was outstanding. 13 years later – in the age of 40 – these members, together with the members of the same age who joined meanwhile – represent the peak of the end-2015 age pyramid.
In the period of 2002-2015 the number of new members per year significantly declined generally as well; within that, the decrease in the number of young, below 35 years, members was slightly higher. the decrease may be attributable to demographic reasons, as one of the consequences of the ageing of the total population is that the number of young people entering the labour market is lower; naturally, the change may also have been caused by other social or economic reasons. It is a favourable development for the sector that the number of new members from the age group of 35-45 decreased to a much smaller degree in the period under review. Based on this we may assume that the pension fund is a popular long-term form of savings for the consumers with savings opportunities, being in a more mature phase of their financial lifecycle. Raising of financial awareness may help make long-term savings more popular for the younger generation as well, since the invested small amounts may substantially increase the value of the saving in the long run.
the chart also shows the breakdown of members who failed to pay membership fee, by years of age. as regards the ratio of the non-payers, there are no extreme age groups; at the majority of the members close to the retirement age and in the age group of 25-65, at each year of age the ratio of non-payers is over 40 per cent, but in the age group of 30-40 years it exceeds the average (55-60 per cent). In the younger, below 30age group, the ratio of membership fee payment is higher, presumably supported by the employers’ contribution, and with progressing in age, the members over the age of 40 also realise the importance of saving in advance, which increases the willingness to pay the membership fee.
the absence of the new generation, and the decrease in the number of new, particularly the young members represents a risk for the sector. the ratio of the paying members could increase with the joining of young new members, which may help finance the operation of the funds. By increasing the number of new members, the economies of scale effect may also help decrease the specific cost burden per fund member.
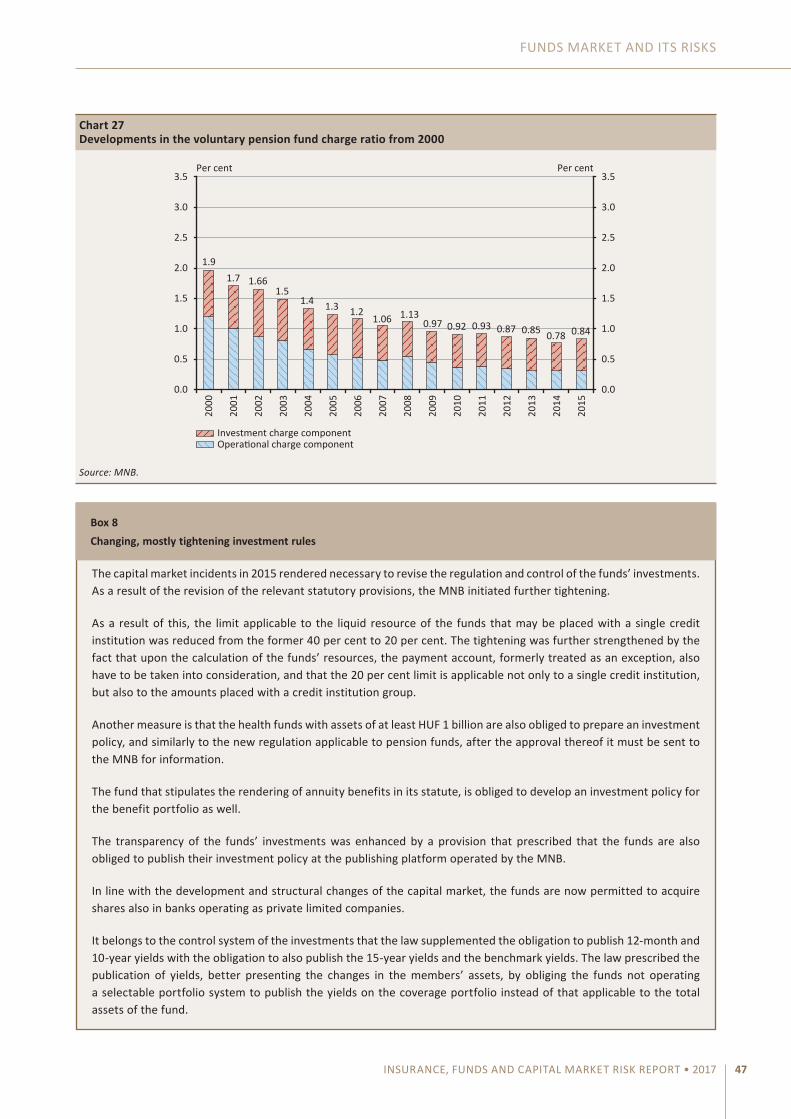
FuNDS MaRkEt aND ItS RISkS
INSURANCE, FUNDS AND CAPITAL MARKET RISK REPORT • 2017 47
Chart 27Developments in the voluntary pension fund charge ratio from 2000
1.91.7 1.66
1.51.4 1.3 1.2
1.06 1.130.97 0.92 0.93 0.87 0.85 0.78 0.84
0.0
0.5
1.0
1.5
2.0
2.5
3.0
3.5
0.0
0.5
1.0
1.5
2.0
2.5
3.0
3.5Per cent Per cent
2000
2001
2002
2003
2004
2005
2006
2007
2008
2009
2010
2011
2012
2013
2014
2015
Investment charge componentOperational charge component
Source: MNB.
the capital market incidents in 2015 rendered necessary to revise the regulation and control of the funds’ investments. as a result of the revision of the relevant statutory provisions, the MNB initiated further tightening.
as a result of this, the limit applicable to the liquid resource of the funds that may be placed with a single credit institution was reduced from the former 40 per cent to 20 per cent. the tightening was further strengthened by the fact that upon the calculation of the funds’ resources, the payment account, formerly treated as an exception, also have to be taken into consideration, and that the 20 per cent limit is applicable not only to a single credit institution, but also to the amounts placed with a credit institution group.
another measure is that the health funds with assets of at least HuF 1 billion are also obliged to prepare an investment policy, and similarly to the new regulation applicable to pension funds, after the approval thereof it must be sent to the MNB for information.
the fund that stipulates the rendering of annuity benefits in its statute, is obliged to develop an investment policy for the benefit portfolio as well.
the transparency of the funds’ investments was enhanced by a provision that prescribed that the funds are also obliged to publish their investment policy at the publishing platform operated by the MNB.
In line with the development and structural changes of the capital market, the funds are now permitted to acquire shares also in banks operating as private limited companies.
It belongs to the control system of the investments that the law supplemented the obligation to publish 12-month and 10-year yields with the obligation to also publish the 15-year yields and the benchmark yields. the law prescribed the publication of yields, better presenting the changes in the members’ assets, by obliging the funds not operating a selectable portfolio system to publish the yields on the coverage portfolio instead of that applicable to the total assets of the fund.
Box 8Changing, mostly tightening investment rules
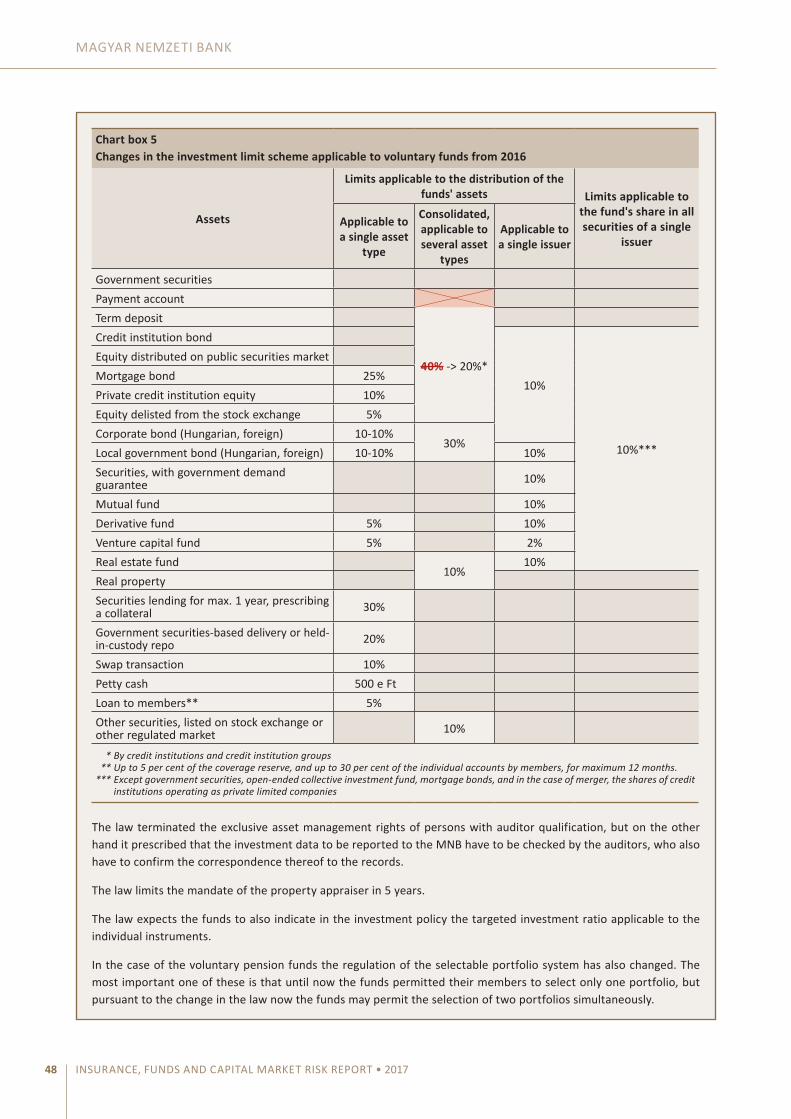
MAGYAR NEMZETI BANK
INSURANCE, FUNDS AND CAPITAL MARKET RISK REPORT • 201748
Chart box 5Changes in the investment limit scheme applicable to voluntary funds from 2016
Assets
Limits applicable to the distribution of the funds' assets Limits applicable to
the fund's share in all securities of a single
issuer
Applicable to a single asset
type
Consolidated, applicable to several asset
types
Applicable to a single issuer
Government securitiesPayment account term deposit
40% -> 20%*
credit institution bond
10%
10%***
Equity distributed on public securities marketMortgage bond 25%Private credit institution equity 10%Equity delisted from the stock exchange 5%corporate bond (Hungarian, foreign) 10-10%
30%Local government bond (Hungarian, foreign) 10-10% 10%Securities, with government demand guarantee 10%
Mutual fund 10%Derivative fund 5% 10%Venture capital fund 5% 2%Real estate fund
10%10%
Real propertySecurities lending for max. 1 year, prescribing a collateral 30%
Government securities-based delivery or held-in-custody repo 20%
Swap transaction 10%Petty cash 500 e Ft Loan to members** 5%Other securities, listed on stock exchange or other regulated market 10%
* By credit institutions and credit institution groups** Up to 5 per cent of the coverage reserve, and up to 30 per cent of the individual accounts by members, for maximum 12 months.
*** Except government securities, open-ended collective investment fund, mortgage bonds, and in the case of merger, the shares of credit institutions operating as private limited companies
the law terminated the exclusive asset management rights of persons with auditor qualification, but on the other hand it prescribed that the investment data to be reported to the MNB have to be checked by the auditors, who also have to confirm the correspondence thereof to the records.
the law limits the mandate of the property appraiser in 5 years.
the law expects the funds to also indicate in the investment policy the targeted investment ratio applicable to the individual instruments.
In the case of the voluntary pension funds the regulation of the selectable portfolio system has also changed. the most important one of these is that until now the funds permitted their members to select only one portfolio, but pursuant to the change in the law now the funds may permit the selection of two portfolios simultaneously.
FuNDS MaRkEt aND ItS RISkS
INSURANCE, FUNDS AND CAPITAL MARKET RISK REPORT • 2017 49
3.3. HEALTH AND MUTUAL AID FUNDS
Consolidation in the health and mutual aid funds market
as a result of the change in the Voluntary Mutual Funds act, in 2016 a new type of fund appeared in the market, which may render both health fund and mutual aid fund services. the already operating health funds or mutual aid funds were allowed to transform into health and mutual aid funds in a simplified manner, by adding the new types of services to their statutes. In parallel with this the merger and fusion – primarily in the case of funds belonging to the “same group” – of the health and mutual aid funds also commenced, thereby creating funds that offered both types of services. this rationalised the institutions, as instead of the former two types of institutions both services can be rendered through the operation of a single fund. By end-2016, the consolidation decreased the number of institutions, and only a few funds remained that provide solely health fund or mutual aid fund services; thus by end-2016 only one larger fund (with assets exceeding HuF 500 million) remained that offers mutual aid services only (chart 28).
While on 31 December 2015 the number of health funds and mutual aid funds was 26 and 10, respectively, by end-2016 there were 17 health and mutual aid funds, 6 health funds and 6 mutual aid funds in the market. the funds that continue to render solely health or mutual aid services – within the framework of the Voluntary Mutual Funds act – mostly operate in a special model, partially with trade union or employer background, or within the services range they render special services. the measurement of the consolidation’s impact on the operating expenses will be possible later.
In the case of funds operating a selectable portfolio system, the law clearly separated the regulation applicable to the selectable portfolio and the investment policy, thereby increasing the transparency of the two documents, at the same time clarifying the licensing procedure applicable to the first one.
the regulation of the funds’ investments basically fulfils its role, while the developed investment limit scheme ensures the security of the member’s long-term savings. the attached table summarises the limits prescribed in the government degree regulating the investments of the voluntary pension funds. according to the MNB’s experiences to date, these rules attain their objective, provide an appropriate framework for the management of investment risks, at the same time allow the funds to develop portfolios aligned with the members’ age-specific features and willingness to take risks. (See the attached table).
Other changes in the oversight of the funds’ investments
Since 85 per cent of the voluntary pension funds’ assets are managed under a selectable portfolio scheme, the MNB revised and reworked its recommendation applicable to the development and operation of the selectable portfolio scheme, which entered into force on 1 January 2017.
the MNB tightened the formerly started audit of the matching rulem, prescribed by the law, and extended it to the audit of investment funds managed not by the asset manager. the verification of the matching rule is one the priority topics of the comprehensive audits, as a result of which some of the fund managers pursuing asset management reviewed their asset management – in the knowledge of the MNB’s expectations – within their own competence, and where they found infringements, the fund managers repaid, by their own decision, to the funds the unjustified surplus costs arising from the difference of the fund management fee of the given investment fund and the fund’s asset mana-gement fund.

MAGYAR NEMZETI BANK
INSURANCE, FUNDS AND CAPITAL MARKET RISK REPORT • 201750
Decreasing the rate of deduction in proportion to the amount paid in and the impacts thereof
Pursuant to the statutory provision effective from 1 January 2016, the health funds, and later on the health and mutual aid funds, are obliged to credit at least 90 per cent of the member’s payments to the coverage reserve. the previous statutory provisions did not determine a percentage limit for this, hence certain funds, making use of the former statutory framework, deducted a larger proportion of the individual and employers’ membership fee contribution for covering the operational expenses. as a result of the new regulation, the savings of the fund members could increase at a higher rate; in addition, the modified provisions led to cost cutting measures at the level of institutions (e.g. reducing the fees and administration costs that were unduly high compared to the sector’s average or the size of the institution, etc.). In the case of the health, and health and mutual aid funds offering collective services only, the regulation is less tight; it is enough to credit at least 70 per cent of the membership fees to the coverage reserve. Due to the special service organisation requirements, these institutions offer not the classic health fund type services, but other healthcare services, usually of special nature; thus the related service organisation costs also differ from those of the other institutions, and also in view of the operation arising from the stronger solidarity principle, the membership fees received by the funds are substantially lower.
The investment structure changed at the health and mutual aid funds
the investment structure of the health and mutual aid funds underwent a transformation in 2016. at end-2015 about 66 per cent of the health and mutual aid funds’ coverage reserves was invested in Hungarian government securities; by end-2016 the savings placed in government securities already accounted for 76 per cent of the reserves serving as coverage for the funds’ services. as a result of the tightened investment diversification rules detailed above, the balance of term deposits substantially declined, and their former ratio of more than 20 per cent stabilised at around 13 per cent by end-2016 (chart 29).
the assets of the health and mutual aid funds for coverage purpose slightly increased compared to the previous year. However, it should be noted that in 2016 the membership fee payments received for the coverage reserves did not cover the funds’ benefit payment expenses at annual level; however, the membership fee payments together with the amounts received from the sponsors and the 20 per cent personal income tax refund by the tax authorities exceeded the service costs.
Chart 28Changes in the health and mutual aid funds market concentration
HHI (per cent)Lo
wconcen
tratio
nM
oder
ate
concen
tratio
nHi
ghconcen
tratio
n
TOP5 (per cent)
2002
2003
2004
2005
2006
2007
2008
2009
2010
2011
2012
2013
2014
2015
2016
Health fund and mutual aid fund HHITOP5 health funds and mutual aid funds (right-hand scale)
40 45 50 55 60 65 70 75 80 85 90 95 100
0
5
10
15
20
25
30
35
40
Source: MNB.

FuNDS MaRkEt aND ItS RISkS
INSURANCE, FUNDS AND CAPITAL MARKET RISK REPORT • 2017 51
3.4. RISKS OF THE FUNDS MARKET
The ratio of the non-payers is still high at the voluntary pension funds
In the voluntary pension fund sector the ratio of members not paying the membership fee substantially increased between 2007 and 2012, mostly due to the economic crisis. the ratio of the non-payers at the voluntary pension funds peaked at 53 per cent in 2013, then it started to decline; by end-2016 the non-payer ratio dropped compared to the previous years (chart 30.). Based on the data reported by the funds, exclusions due to non-payment occurred in the highest number in the period of 2012-2015, hence the members’ activity statistics improved. the assets of the non-paying members within the coverage reserve of the voluntary pension funds still represent a relatively high ratio, i.e. around 19 per cent; the exclusions mostly affect the fund members with low balances. However, it is also important to show that the amendment of the Voluntary Mutual Funds act, from 2016 permits the fund member reaching the retirement age to withdraw the balance on his individual pension account in one sum or as annuity, and to maintain his fund membership undertaking the payment of the membership fee. the new regulation may strengthen the willingness to pay the membership fee, thereby improving the savings balance of the paying members in the short run; however, in the longer run, the recruitment of younger members of active age-group to the pension fund scheme should be strengthened, while maintaining the membership fee payment on a permanent basis.
Chart 29Composition of the health and mutual aid funds’ coverage reserves on 31 December 2016 (upper chart), and change in the government securities portfolio (lower chart to the left) and in the term deposit portfolio (lower chart to the right)
20304050607080
20304050607080
Per cent Per cent Per cent Per cent
76%76%
13%13%
11%11%
2011
2012
2013
2014
2015
2016
051015202530
05
1015202530
2011
2012
2013
2014
2015
2016
Term depositHungarian government securities
Other
Source: MNB.

MAGYAR NEMZETI BANK
INSURANCE, FUNDS AND CAPITAL MARKET RISK REPORT • 201752
the ratio of the non-payment of membership fees has been declining since 2013; however, the ratio of around 50 per cent may still be deemed high and represents a risk for the operation of the funds. according to the business model of the voluntary funds, the operating expenses must be covered by the amount deducted from the members’ payments. However, thus the non-payers do not contribute in the usual way to the operation, and in the case of the voluntary pension funds it is not possible to exclude the members before the expiry of the 10-year waiting period.
By end-2016, some of the health and mutual aid funds decided to exclude the non-paying members, primarily with a view to reducing the administration costs; however, despite the exclusions, the ratio of membership fee payments substantially worsened at this fund type in one year. the funds excluded primarily the members with low balance, who failed to pay the membership fee despite several warnings. Based on the closing figures related to the headcount of the sector, it can be also established from the decaying willingness to pay the health and mutual aid fund membership fee, that there was a deterioration also in the payment willingness of those members who joined newly the members that failed to make the payment despite several reminders and of those who already had been in the system in the previous period and paid the fee in the past years.
In the membership fee payment statistics of the health and mutual aid funds, the rise in the number of non-payments was also attributable, to a substantial degree, to the changes in the statute determining the operation of the institutions. this means that certain market-leading institutions changed the classification specified in the statute for the non-paying members, and defined stricter, i.e. shorter deadline for the fulfilment of the membership fee payment, the impact of which can be felt from 2013-2014 (chart 31).
Chart 30Ratio of members paying voluntary pension fund membership fee
1,283 1,356 1,318 1,295 1,267 1,227
38
52 53 50 50 49
16
24 23 21 20 19
0
10
20
30
40
50
60
70
0
200
400
600
800
1,000
1,200
1,400
2011 2012 2013 2014 2015 2016
Thousands persons Per cent
Number of membership fee payersNumber of members classified as non-payers based on the fund’s statute Ratio of non-payers to the total headcount (right-hand scale)Assets of non-payers within the total assets (right-hand scale)
Number of members
Source: MNB.

FuNDS MaRkEt aND ItS RISkS
INSURANCE, FUNDS AND CAPITAL MARKET RISK REPORT • 2017 53
the law permits the funds to deduct from the yield realised on the savings of the non-paying members, up to the uniform part that may be deducted from the membership fee for operation, to cover the operating expenses. this solution helps finance the operation of the fund, and facilitates that the non-paying members also contribute to the operating expenses; however, this does not entirely cover the risk arising from the non-payment of the membership fee. If the yield realised on the saving of the non-paying members is insufficient – because the balance of the member’s individual account is too low or the realised yield is too small – the fund cannot deduct even the minimum part for the expenses.
One way to reduce the risk may be, if the fund – in the manner specified in the statute – excludes the non-paying member, usually having zero or very low balance on his account. Partly these exclusions also contributed to the decrease in the non-payers’ ratio at the voluntary pension funds. On the other hand, the majority of the funds make attempts to motivate the non-paying members in a positive manner, i.e. by reminders, notices and promotions, to pay the membership fee, thus part of the passive members may serve as a potential addition to the paying members.
the total headcount of the pension fund members is decreasing; one cause of this is that while in the period of 2005-2008 the annual number of new members was around 100,000, after a gradual decrease, in the period of 2013-2016 the annual number of new members was only around 30,000. the maturation of the scheme alone may result in a decrease in the number of new members; however, other factors also influence the rate of decline. the new members may replace the members becoming for some reason non-payers; however, due to the low number of new members, this effect is negligible for the time being. Within the trend-like process it may signal a positive turn that in 2015 and 2016 the number of new members rose by 3,000-4,000 year on year. the members of the pension funds represent 26 per cent of the number of people in employment, thus the pension fund market cannot be deemed saturated.
In 2016 the voluntary pension funds operated with a loss at sector level; however, the deductions from the yield of non-paying members could offset the operating loss. at annual level, the operation of 19 institutions ended with a negative balance; however, at 6 institutions, which applied deductions from the non-payers’ yield, the year-end operating balance turned into positive. accordingly, the yield developments, in addition to the fund members’ savings, may significantly influence the operation of the fund.
Chart 31Changes in the number of members not paying the health and mutual aid fund membership fee
29% 29%33% 32%
40%43%
0
10
20
30
40
50
60Per centThousand persons
0
200
400
600
800
1,000
1,200
2011 2012 2013 2014 2015 2016
Number of membership fee payersNumber of non-payers
Number of members
Ratio of non-payers to the total headcount (right-hand scale)
1,007 1,069 1,064 1,053 1,087 1,053
Source: MNB.

MAGYAR NEMZETI BANK
INSURANCE, FUNDS AND CAPITAL MARKET RISK REPORT • 201754
The yields deducted from the non-payers made a substantial contribution to covering the operation so far
the operating result of the health and mutual aid funds, which also includes the deduction from the non-payers’ yield, was not in the red in the past years at sector level, but there are major differences among the institutions (chart 32). Based on the 2016, quarterly aggregated, unaudited data, at annual level the operating result of the health and mutual aid funds sector was not in the red even without the deduction of the yield from the non-paying members, as the part of the 2016 membership fee payments allocable to the operating reserve also rose compared to the previous year, simultaneously with the fall in the operating expenses, year on year. the funds’ operation did not represent a sector level risk on the operating income and cost structure of recent years; however, as a result of the fall in the employers’ membership fee contribution, the institutions’ operating result may turn into the red in 2017 and it is unlikely that the yield deducted from the individual account of the non-payers will be able to offset.
Risk of lower employers’ contribution due to the change in the fringe benefit rules
the change in the fringe benefit rules in 2017 carries the risk of a decrease in the employers’ contribution. the ratio of the employers’ contribution within the membership fee income allocated to operation is 48.9 per cent at the pension funds, while it amounted to 64.2 per cent at the health and mutual aid funds in 2016. Based on the quarterly, unaudited data, in 2016 29.3 per cent of the pension funds and 48.3 per cent of the health and mutual aid funds operated with a loss, i.e. at these institutions the membership fee income did not cover the operating expenses. calculating with a 30 per cent decrease in the employers’ contribution this ratio may be as high as 49-69 per cent in 2017. Based on the data, the impact of the fall in the employers’ commitment may represent a higher risk on the operation of the health, mutual aid, and the health and mutual aid funds. In order to manage the risks, the fund commenced consultations with the partner employers already at end-2016. according to the preliminary surveys, the employers intend to reduce their contributions to the funds’ savings on average at the rate of the increase in the tax burden.
7 Due to the different accounting rules, in the case of the voluntary pension funds the balance sheet profit did not contain the deduction from the yield of non-paying members, while it did in the case of the health and mutual aid funds. In order to ensure uniform presentation and the comparability of data, from the balance sheet profit indicated at the health and mutual aid funds, we subtracted the deduction from the non-payers’ yield, thus now it presents the data in a similar manner as at the voluntary pension funds, i.e. the balance sheet profit shown on the chart does not include the deductions from the non-payers’ yield.
Chart 32Changes in the profit/loss of the voluntary, health and mutual aid pension funds7
–1
–0.5
0
0.5
1
1.5
–1
–0.5
0
0.5
1
1.5
2013 2014 2015 2016
HUF Billions HUF Billions
Deduction from the yield of non-payers (Health and mutual aid funds)Balance sheet profit (Voluntary pension funds)Deduction from the yield of non-payers (Voluntary pension funds)
Balance sheet profit (Health and mutual aid funds)
Source: MNB.

FuNDS MaRkEt aND ItS RISkS
INSURANCE, FUNDS AND CAPITAL MARKET RISK REPORT • 2017 55
Weaknesses of the internal control system
according to the audits conducted by the MNB, there are still shortcomings in the internal control system of the funds. the audit committees often fail to perform their statutory tasks in an adequate manner, no one in charge of the audit tasks is appointed and no deadlines are set, and the measures prescribed during the internal audits are often not followed up. In order to strengthen the internal control system, it is proposed that the funds above a certain volume of assets and headcount should be obliged by law to employ an internal auditor, in addition to the audit committee, on a mandatory basis.
Problems of complying with the investment rules at the “micro” funds
the health, mutual aid and the health and mutual aid funds with assets below HuF 100 million are subject to special investment rules, which restrict the range of investment instruments they may purchase. the law applicable to this range of institutions has also changed in the investment category used by the funds the most often. accordingly, from 1 January 2016, the aggregate value of the payment account and deposits placed with a single credit institution or with the credit institutions belonging to the same group, plus the securities issued or distributed by a single credit institution or the credit institutions belonging to the same group must not exceed 20 per cent of the invested assets of the fund. In addition, the fund may only hold a balance on the payment account that exceeds the value of the average monthly benefits paid by the fund, calculated on the basis of the previous year’s quarterly reports, by maximum 20 per cent.
the tightening of the limit rules detailed above, and the compliance with the provision prescribing the commissioning of a custodian from 1 July 2016, even in the event of holding Hungarian government securities only, generated difficulties – due to other market circumstances – for the “micro” funds, with assets that may be as low as HuF 5-6 million. One reason for this is that upon the placement of a term deposit, the funds have to be placed with several credit institutions, but the credit institutions do not accept it without keeping a payment account with them, while on the other hand, the law permits having only one payment account simultaneously, with the exception of the case of changing the account-keeping institution. the placement of the assets with more credit institutions than before may also generate substantial extra costs for the funds. Due to these circumstances, these “micro” funds occasionally breach the limit. It is an additional problem that the custody management of assets below HuF 100 million falls outside the business policy of the custodians, thus the custodians price themselves out of this market. Hence these “micro” funds are unable to comply with their obligation to commission a custodian, if they want to replace the funds held on the payment account or on terms deposits by government securities.
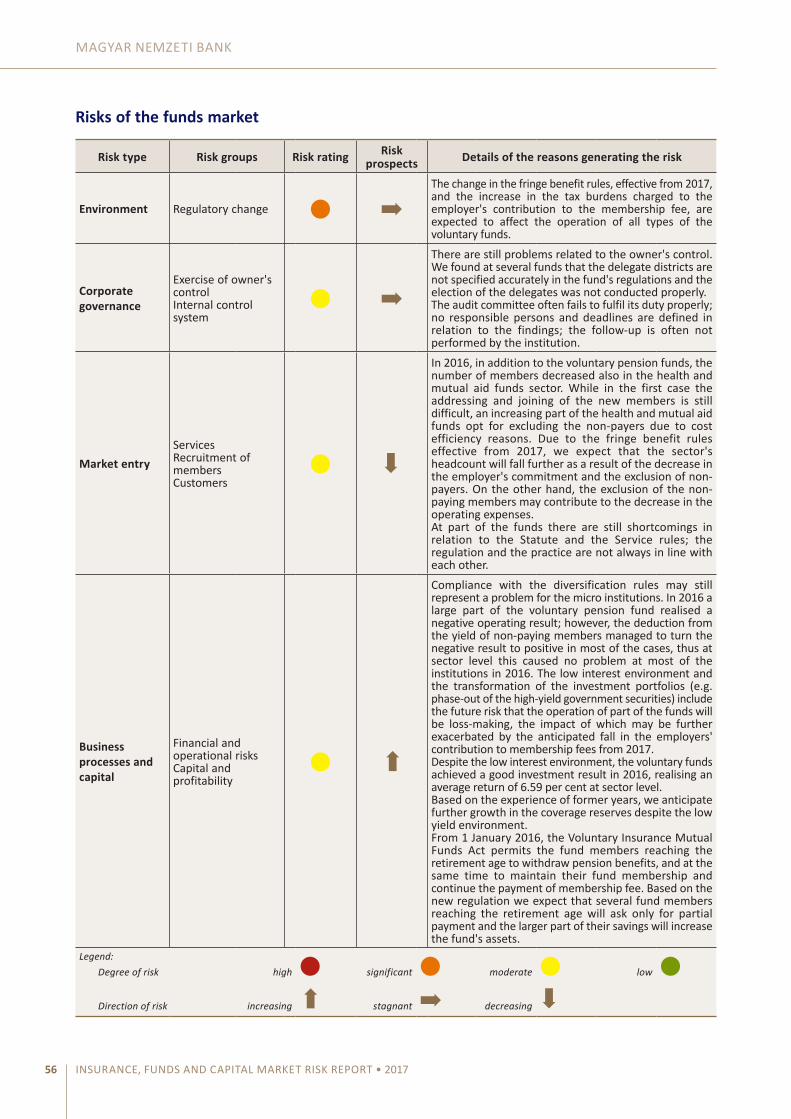
MAGYAR NEMZETI BANK
INSURANCE, FUNDS AND CAPITAL MARKET RISK REPORT • 201756
Risks of the funds market
Risk type Risk groups Risk rating Risk prospects Details of the reasons generating the risk
Environment Regulatory change ● ➡the change in the fringe benefit rules, effective from 2017, and the increase in the tax burdens charged to the employer's contribution to the membership fee, are expected to affect the operation of all types of the voluntary funds.
Corporate governance
Exercise of owner's controlInternal control system
● ➡
there are still problems related to the owner's control. We found at several funds that the delegate districts are not specified accurately in the fund's regulations and the election of the delegates was not conducted properly. the audit committee often fails to fulfil its duty properly; no responsible persons and deadlines are defined in relation to the findings; the follow-up is often not performed by the institution.
Market entryServicesRecruitment of memberscustomers
●
➡
In 2016, in addition to the voluntary pension funds, the number of members decreased also in the health and mutual aid funds sector. While in the first case the addressing and joining of the new members is still difficult, an increasing part of the health and mutual aid funds opt for excluding the non-payers due to cost efficiency reasons. Due to the fringe benefit rules effective from 2017, we expect that the sector's headcount will fall further as a result of the decrease in the employer's commitment and the exclusion of non-payers. On the other hand, the exclusion of the non-paying members may contribute to the decrease in the operating expenses.at part of the funds there are still shortcomings in relation to the Statute and the Service rules; the regulation and the practice are not always in line with each other.
Business processes and capital
Financial and operational riskscapital and profitability
● ➡
compliance with the diversification rules may still represent a problem for the micro institutions. In 2016 a large part of the voluntary pension fund realised a negative operating result; however, the deduction from the yield of non-paying members managed to turn the negative result to positive in most of the cases, thus at sector level this caused no problem at most of the institutions in 2016. the low interest environment and the transformation of the investment portfolios (e.g. phase-out of the high-yield government securities) include the future risk that the operation of part of the funds will be loss-making, the impact of which may be further exacerbated by the anticipated fall in the employers' contribution to membership fees from 2017.Despite the low interest environment, the voluntary funds achieved a good investment result in 2016, realising an average return of 6.59 per cent at sector level. Based on the experience of former years, we anticipate further growth in the coverage reserves despite the low yield environment.From 1 January 2016, the Voluntary Insurance Mutual Funds act permits the fund members reaching the retirement age to withdraw pension benefits, and at the same time to maintain their fund membership and continue the payment of membership fee. Based on the new regulation we expect that several fund members reaching the retirement age will ask only for partial payment and the larger part of their savings will increase the fund's assets.
Legend: Degree of risk high ● significant ● moderate ● low ●
Direction of risk increasing ➡ stagnant ➡ decreasing
➡
FuNDS MaRkEt aND ItS RISkS
INSURANCE, FUNDS AND CAPITAL MARKET RISK REPORT • 2017 57
the change in the regulatory environment from 2017 will hit the voluntary funds hard, because as a result of the change in the fringe benefit rules the public dues burdening the employers’ membership fee contribution will increase. the change will impact primarily those members who, due to their modest income, have less opportunity to make individual membership fee payments, and the payments received from the employer contributed to a larger degree to the accumulation of their individual account balance.
Within corporate governance problems are still identified at the funds operating a general delegate meeting scheme, as the definition of the delegate districts is not clear at several institutions, and usually only a small part of the members attend the meetings where the delegates are elected. as regards the operation of the internal control system, there are still shortcomings related to the activity of the audit committee; the follow-up of the shortcomings identified by the audit committee and the internal auditor in the operation of the institution is performed only partially or not at all, and no persons in charge of the findings are appointed, nor deadlines are set.
In the case of market presence the high ratio of members not paying the membership fee in the voluntary funds sector still carries a substantial risk. Within the channels of member acquisition, the employers have an important role in member recruitment and in the active liaison with the members; accordingly, due to the decrease in the employers’ commitment, further increase may be expected in the number of members not paying the membership fee. the high ratio of non-payers represents major operational costs for the funds; as a result of this, the exclusion of members in large numbers can be expected in the future as well, primarily in the health and mutual aid funds sector. During the regulation of the funds’ products and services, and the inspection of the related practice, it is often found that they are not in line with each other, and the detailed rules linked with the various payments are defined inaccurately.
Within the business processes and capital risk category, it should be emphasised that the compliance with the investment diversification rules is cumbersome in the case of micro institutions, as due to the smaller volume of assets, the distribution of the asset groups incurs high investment costs relative to their size. In recent years, the aggregate result of the deduction of yields from non-payers and the operating activity was positive at sector level, but due to the low interest environment and the decrease in the employers’ commitment the operating result of the institutions may become negative in 2017. In the case of the voluntary pension funds, due to the expiry of the waiting period and the approaching of the retirement age, there is a high ratio of members who will become eligible in one year to withdraw the member’s savings; however, the laws effective from 1 January 2016 permit the withdrawal of the pension benefit in parallel with maintaining the membership in the fund and continuing the payment of the membership fee; as a result of this, it is expected that the fund members reaching the retirement age will continue to accumulate some part of their savings in funds.

INSURANCE, FUNDS AND CAPITAL MARKET RISK REPORT • 201758
4 Financial enterprises not belonging to a banking group and their risks
Increasing risks in respect of the continuous compliance with the statutory regulations
the most typical activities of the financial enterprises operating in the Hungarian market include lending, financial lease, current factoring and factoring purchased for workout, of which the financial enterprises often mix more in their activity. the former growth of the sector halted as a result of the 2009 crisis, and the slow consolidation that started since then continued in 2016 as well. Based on the unaudited data reporting, at end-2016 the composition and profit/loss of the sector by activity type developed as follows (table 3):
Table 3Composition of the gross outstanding customer receivables and profit/loss of financial enterprises not belonging to a banking group by activity type at end-2016
Outstanding receivables
(HUF million)
Number of institutions
pursuing (also) this activity
(pcs)
Outstanding receivables of
institutions pursuing solely
this activity (HUF million)
Number of institutions
pursuing solely this activity
(pcs)
Revenues of institutions
pursuing solely this activity
(HUF million)
Pre-tax profit or loss of
institutions pursuing solely
this activity (HUF million)
Loan 536,182 127 335,513 62 81,177 9,558
– of which, pawn loan 26,903 25 17,588 21 11,640 777
Financial lease 274,816 35 58,006 6 29,962 2,212
current factoring* 37,266 27 28,446 8 5,332 1,166
Factoring purchased for workout
180,862 96 149,887 53 47,264 5,349
*after eliminating the data of an institution pursuing a special activity.Forrás: MNB.
It is clear from the table above that the majority of the institutions pursue lending activity, followed by the purchase of overdue receivables; however, about half of the institutions offering such services also registered other activities. Based on the profit and loss account of the institutions specialised in a single activity, we may also obtain a picture on the changes in the average profitability of the given range of activity.
as regards the distribution by gross outstanding receivables from clients, the activity of the financial enterprises not belonging to a banking group is still dominated primarily by lending; however, as a result of the decrease that took place by end-2016, the outstanding receivables from clients stemming from this activity now account only for about half of the total portfolio. the financial lease portfolio remained at the same level within one year, thus the market share of this activity in the entire sector at present amounts to roughly 27 per cent. a special transaction (financing of another financial institution) of an institution pursuing a special activity was eliminated of the current factoring portfolio, thus the entire portfolio showed a minor increase in 2016, while the share thereof in the entire sector is still negligible (4 per cent). In addition to the overall decline in the active business lines, the growth in the weight of purchase of overdue receivables can be still observed, which may continue in 2017 as well due to the portfolio cleaning up strategy of commercial banks.

FINaNcIaL ENtERPRISES NOt BELONGING tO a BaNkING GROuP aND tHEIR RISkS
INSURANCE, FUNDS AND CAPITAL MARKET RISK REPORT • 2017 59
the sector is extremely heterogeneous not only in terms of the types of activity pursued, but also in terms of the balance sheet total; the 10 largest institutions have a market share of roughly 50 per cent, based on the supervisory data reporting. Owing to the composition of the market the unique transactions of the institutions may generate major changes in the entire balance sheet total. accordingly – and due to the negligible size of the financial enterprises not belonging to a banking group relative to the entire financial market sector – the changes in the outstanding receivables of solely this range of institutions does not necessarily reflect the sector (activity related) trends characterising the entire Hungarian market, and even conclusions with regard to the underlying economic processes often may only be made during the individual analysis of the institutions (chart 33).
the contraction of the credit institution refinancing funds continued in 2016, which the financial enterprises not belonging to a banking group are forced to replace by other resources, typically related to the owners (chart 34).
as a result of the decreasing leverage – as it was observed in previous years as well – those financial enterprises may remain in the market in the longer run that have a suitable size of operation, a well-capitalised owner background, and that are able to grow from their own resources. at the same time, it can be established that – after eliminating the institutions that pursue special activities – the average balance sheet total of the financial enterprises not belonging to a banking group slightly decreased in the past year, and the average difference in respect of the size of the institutions increased. this evidences the analytical findings that the continuous compliance with the statutory licensing condition represents an enhanced challenge for the institutions, which in several cases led to the withdrawal of their activity licence in recent years.
Chart 33Composition of the gross outstanding customer receivables of financial enterprises not belonging to a banking group by activity type
0
200
400
600
800
1,000
1,200
1,400
1,600
0
200
400
600
800
1,000
1,200
1,400
1,600
2011 2012 2013 2014 2015 2016
HUF Billions HUF Billions
Financial leaseCurrent factoringFactoring purchased for workout
LoansSource: MNB.
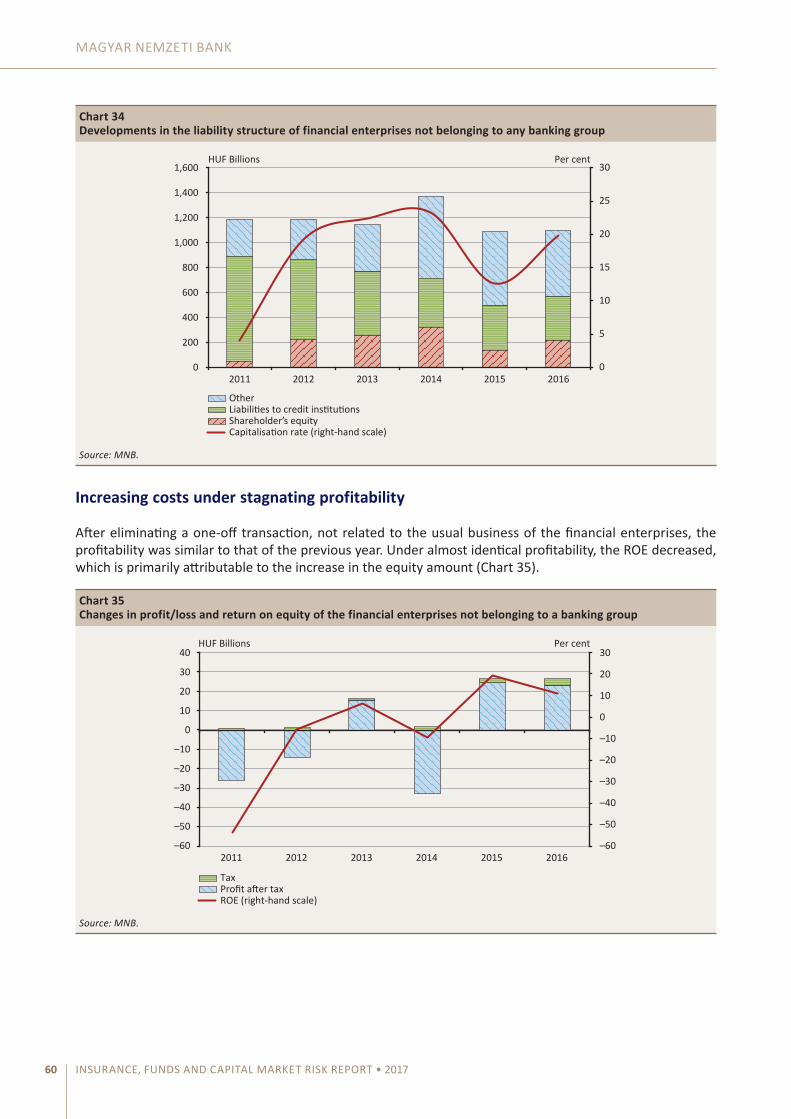
MAGYAR NEMZETI BANK
INSURANCE, FUNDS AND CAPITAL MARKET RISK REPORT • 201760
Increasing costs under stagnating profitability
after eliminating a one-off transaction, not related to the usual business of the financial enterprises, the profitability was similar to that of the previous year. under almost identical profitability, the ROE decreased, which is primarily attributable to the increase in the equity amount (chart 35).
Chart 34Developments in the liability structure of financial enterprises not belonging to any banking group
0
5
10
15
20
25
30
0
200
400
600
800
1,000
1,200
1,400
1,600
2011 2012 2013 2014 2015 2016
Per centHUF Billions
Liabilities to credit institutionsOther
Shareholder’s equityCapitalisation rate (right-hand scale)
Source: MNB.
Chart 35Changes in profit/loss and return on equity of the financial enterprises not belonging to a banking group
–60
–50
–40
–30
–20
–10
0
10
20
30
–60
–50
–40
–30
–20
–10
0
10
20
30
40
2011 2012 2013 2014 2015 2016
Per centHUF Billions
TaxProfit after taxROE (right-hand scale)
Source: MNB.
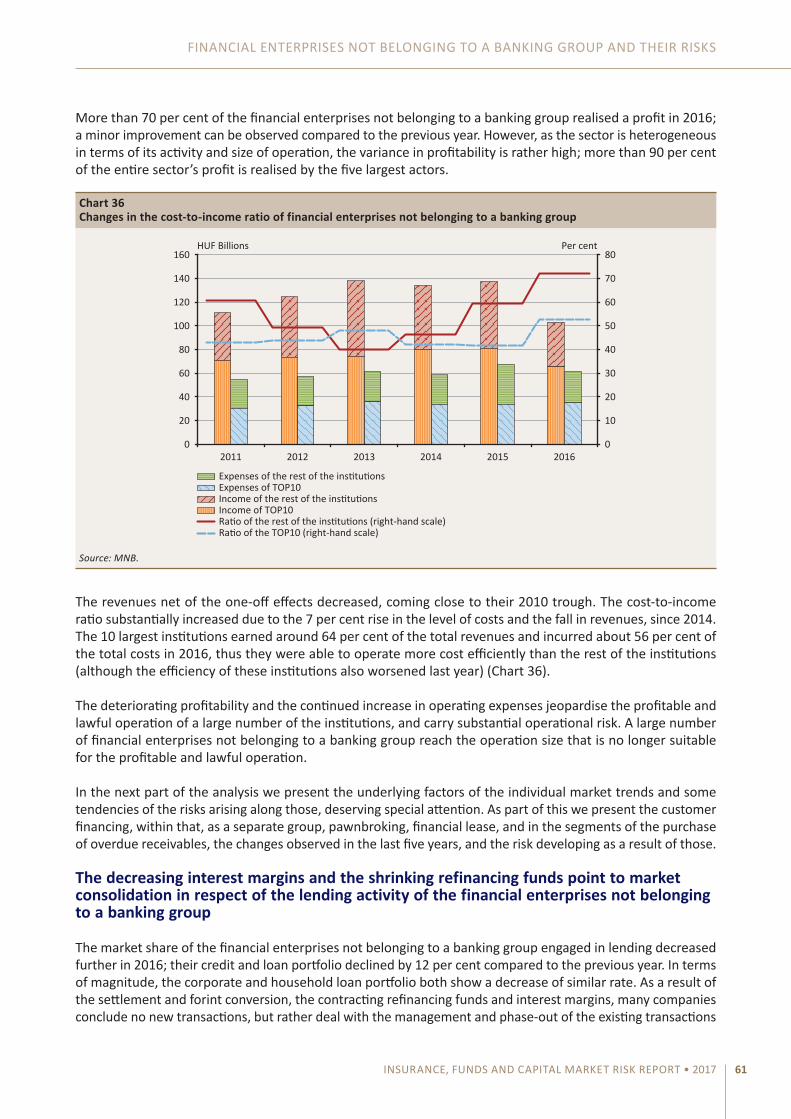
FINaNcIaL ENtERPRISES NOt BELONGING tO a BaNkING GROuP aND tHEIR RISkS
INSURANCE, FUNDS AND CAPITAL MARKET RISK REPORT • 2017 61
More than 70 per cent of the financial enterprises not belonging to a banking group realised a profit in 2016; a minor improvement can be observed compared to the previous year. However, as the sector is heterogeneous in terms of its activity and size of operation, the variance in profitability is rather high; more than 90 per cent of the entire sector’s profit is realised by the five largest actors.
the revenues net of the one-off effects decreased, coming close to their 2010 trough. the cost-to-income ratio substantially increased due to the 7 per cent rise in the level of costs and the fall in revenues, since 2014. the 10 largest institutions earned around 64 per cent of the total revenues and incurred about 56 per cent of the total costs in 2016, thus they were able to operate more cost efficiently than the rest of the institutions (although the efficiency of these institutions also worsened last year) (chart 36).
the deteriorating profitability and the continued increase in operating expenses jeopardise the profitable and lawful operation of a large number of the institutions, and carry substantial operational risk. a large number of financial enterprises not belonging to a banking group reach the operation size that is no longer suitable for the profitable and lawful operation.
In the next part of the analysis we present the underlying factors of the individual market trends and some tendencies of the risks arising along those, deserving special attention. as part of this we present the customer financing, within that, as a separate group, pawnbroking, financial lease, and in the segments of the purchase of overdue receivables, the changes observed in the last five years, and the risk developing as a result of those.
The decreasing interest margins and the shrinking refinancing funds point to market consolidation in respect of the lending activity of the financial enterprises not belonging to a banking group
the market share of the financial enterprises not belonging to a banking group engaged in lending decreased further in 2016; their credit and loan portfolio declined by 12 per cent compared to the previous year. In terms of magnitude, the corporate and household loan portfolio both show a decrease of similar rate. as a result of the settlement and forint conversion, the contracting refinancing funds and interest margins, many companies conclude no new transactions, but rather deal with the management and phase-out of the existing transactions
Chart 36Changes in the cost-to-income ratio of financial enterprises not belonging to a banking group
0
10
20
30
40
50
60
70
80
0
20
40
60
80
100
120
140
160
2011 2012 2013 2014 2015 2016
Per centHUF Billions
Income of the rest of the institutionsExpenses of TOP10Expenses of the rest of the institutions
Income of TOP10Ratio of the rest of the institutions (right-hand scale)Ratio of the TOP10 (right-hand scale)
Source: MNB.
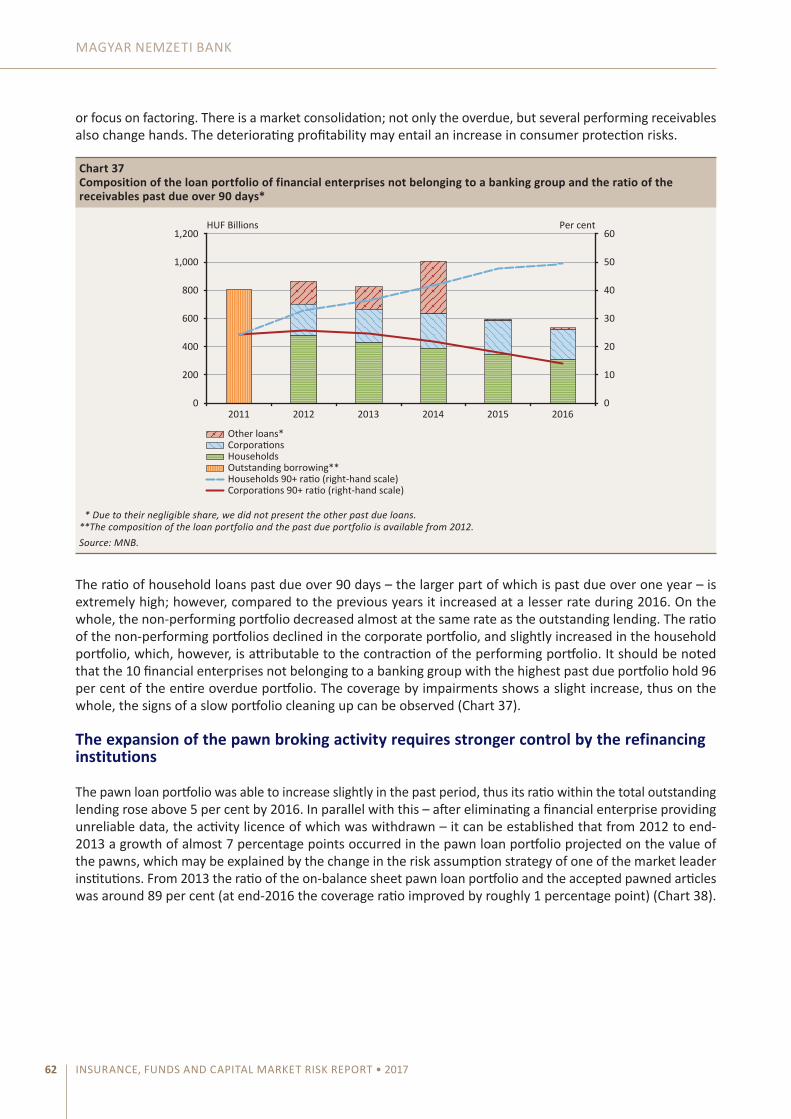
MAGYAR NEMZETI BANK
INSURANCE, FUNDS AND CAPITAL MARKET RISK REPORT • 201762
or focus on factoring. there is a market consolidation; not only the overdue, but several performing receivables also change hands. the deteriorating profitability may entail an increase in consumer protection risks.
the ratio of household loans past due over 90 days – the larger part of which is past due over one year – is extremely high; however, compared to the previous years it increased at a lesser rate during 2016. On the whole, the non-performing portfolio decreased almost at the same rate as the outstanding lending. the ratio of the non-performing portfolios declined in the corporate portfolio, and slightly increased in the household portfolio, which, however, is attributable to the contraction of the performing portfolio. It should be noted that the 10 financial enterprises not belonging to a banking group with the highest past due portfolio hold 96 per cent of the entire overdue portfolio. the coverage by impairments shows a slight increase, thus on the whole, the signs of a slow portfolio cleaning up can be observed (chart 37).
The expansion of the pawn broking activity requires stronger control by the refinancing institutions
the pawn loan portfolio was able to increase slightly in the past period, thus its ratio within the total outstanding lending rose above 5 per cent by 2016. In parallel with this – after eliminating a financial enterprise providing unreliable data, the activity licence of which was withdrawn – it can be established that from 2012 to end-2013 a growth of almost 7 percentage points occurred in the pawn loan portfolio projected on the value of the pawns, which may be explained by the change in the risk assumption strategy of one of the market leader institutions. From 2013 the ratio of the on-balance sheet pawn loan portfolio and the accepted pawned articles was around 89 per cent (at end-2016 the coverage ratio improved by roughly 1 percentage point) (chart 38).
Chart 37Composition of the loan portfolio of financial enterprises not belonging to a banking group and the ratio of the receivables past due over 90 days*
0
10
20
30
40
50
60
0
200
400
600
800
1,000
1,200
2011 2012 2013 2014 2015 2016
Per centHUF Billions
HouseholdsCorporationsOther loans*
Outstanding borrowing**
Corporations 90+ ratio (right-hand scale)Households 90+ ratio (right-hand scale)
* Due to their negligible share, we did not present the other past due loans.**The composition of the loan portfolio and the past due portfolio is available from 2012.Source: MNB.
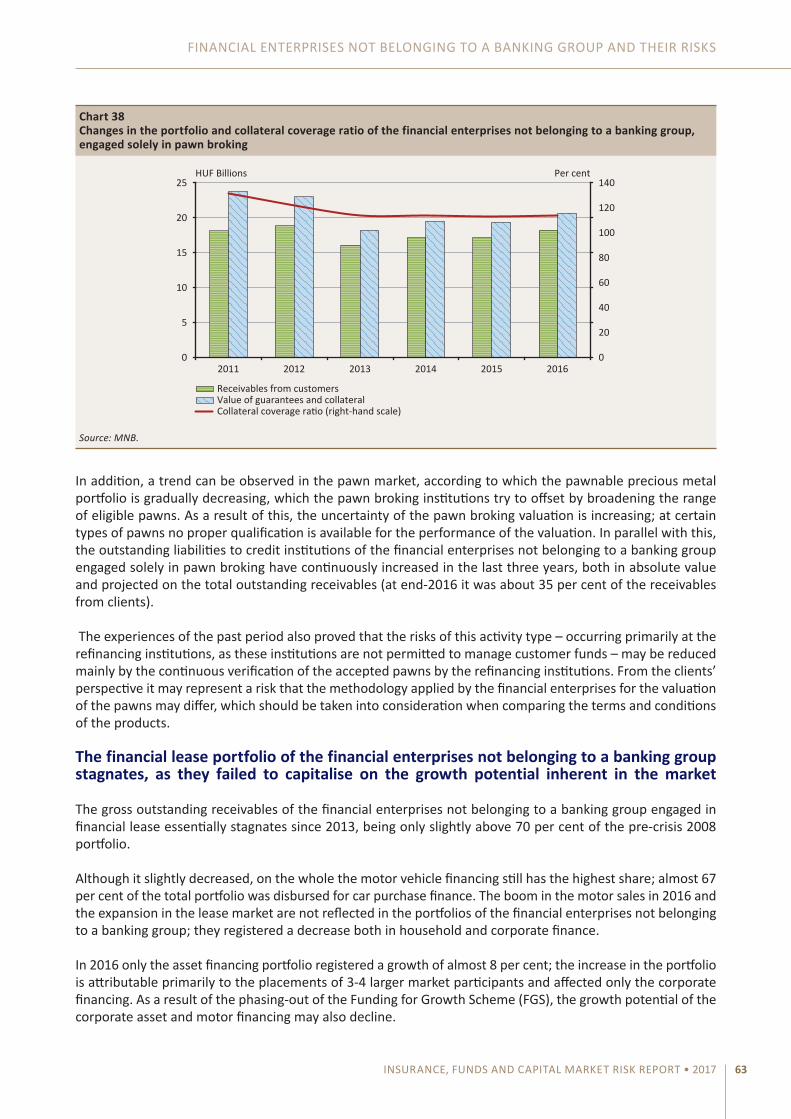
FINaNcIaL ENtERPRISES NOt BELONGING tO a BaNkING GROuP aND tHEIR RISkS
INSURANCE, FUNDS AND CAPITAL MARKET RISK REPORT • 2017 63
In addition, a trend can be observed in the pawn market, according to which the pawnable precious metal portfolio is gradually decreasing, which the pawn broking institutions try to offset by broadening the range of eligible pawns. as a result of this, the uncertainty of the pawn broking valuation is increasing; at certain types of pawns no proper qualification is available for the performance of the valuation. In parallel with this, the outstanding liabilities to credit institutions of the financial enterprises not belonging to a banking group engaged solely in pawn broking have continuously increased in the last three years, both in absolute value and projected on the total outstanding receivables (at end-2016 it was about 35 per cent of the receivables from clients).
the experiences of the past period also proved that the risks of this activity type – occurring primarily at the refinancing institutions, as these institutions are not permitted to manage customer funds – may be reduced mainly by the continuous verification of the accepted pawns by the refinancing institutions. From the clients’ perspective it may represent a risk that the methodology applied by the financial enterprises for the valuation of the pawns may differ, which should be taken into consideration when comparing the terms and conditions of the products.
The financial lease portfolio of the financial enterprises not belonging to a banking group stagnates, as they failed to capitalise on the growth potential inherent in the market
the gross outstanding receivables of the financial enterprises not belonging to a banking group engaged in financial lease essentially stagnates since 2013, being only slightly above 70 per cent of the pre-crisis 2008 portfolio.
although it slightly decreased, on the whole the motor vehicle financing still has the highest share; almost 67 per cent of the total portfolio was disbursed for car purchase finance. the boom in the motor sales in 2016 and the expansion in the lease market are not reflected in the portfolios of the financial enterprises not belonging to a banking group; they registered a decrease both in household and corporate finance.
In 2016 only the asset financing portfolio registered a growth of almost 8 per cent; the increase in the portfolio is attributable primarily to the placements of 3-4 larger market participants and affected only the corporate financing. as a result of the phasing-out of the Funding for Growth Scheme (FGS), the growth potential of the corporate asset and motor financing may also decline.
Chart 38Changes in the portfolio and collateral coverage ratio of the financial enterprises not belonging to a banking group, engaged solely in pawn broking
0
20
40
60
80
100
120
140
0
5
10
15
20
25
2011 2012 2013 2014 2015 2016
Per centHUF Billions
Receivables from customersValue of guarantees and collateralCollateral coverage ratio (right-hand scale)
Source: MNB.

MAGYAR NEMZETI BANK
INSURANCE, FUNDS AND CAPITAL MARKET RISK REPORT • 201764
the share of real estate lease is negligible, and still shows substantial decline; under the present low level of interest rates no expansion is likely to take place in the forthcoming years.
On the whole, the quality of the financial lease portfolio of the financial enterprises not belonging to a banking group improved; compared to the previous year, the non-performing portfolio shrank by almost one and a half percentage point, while the coverage by impairment rose by roughly 4 percentage points (chart 39).
The surge in the purchase of mortgage-backed receivables in the sector may entail a growth in consumer protection risks
the portfolio of the financial enterprises not belonging to a banking group engaged solely in the purchase of overdue receivables registered a dynamic growth in the last two years. While the growth that occurred by end-2015 was partially attributable to the market entry of a financial enterprise pursuing a special activity, the growth of 28 per cent achieved from 2015 by end-2016 was the result of the sales of the financial institutions’ mortgage-backed receivables portfolio.
In connection with this, a major change can be observed in the last five years in the structure of the receivables portfolio: while in 2012 the collateral coverage of the total portfolio was below 5 per cent, by end-2016 it rose above 55 per cent. However, the total value, claimed from the clients still exceeds the book value of the receivables portfolio purchased from the financial institution several times. While in 2012 the book value was merely 3 per cent of the total value of the receivables portfolio, by 2016 this reaches almost 10 per cent.
In parallel with the increasing rate of overdue receivables purchase, the return on equity of the institutions solely engaged in this activity has been continuously worsening in the last three years: although most institutions still closed 2016 with a positive result, the return they are able to realise on the purchases portfolios is continuously decreasing. this may represent risks primarily for the owners of the financial enterprises, since the refinancing of this activity by the credit institutions has been continuously decreasing in recent years, and by end-2016 it reached only a fraction of the institutions’ equity (chart 40).
Chart 39Composition of the financial lease portfolio of the financial enterprises not belonging to a banking group and the ratio of the receivables past due over 90 days*
0
5
10
15
20
25
30
0
50
100
150
200
250
300
350
2011 2012 2013 2014 2015 2016
Per centHUF Billions
Vehicle leaseAsset leaseReal estate leaseOther lease
Lease portfolio*90+ ratio (right-hand scale)
* The composition of the financial lease portfolio is available from 2012.Source: MNB.

FINaNcIaL ENtERPRISES NOt BELONGING tO a BaNkING GROuP aND tHEIR RISkS
INSURANCE, FUNDS AND CAPITAL MARKET RISK REPORT • 2017 65
In view of the fact that among the financial enterprises not belonging to a banking group purchasing overdue receivables there are several institutions in the market for which the continuous statutory compliance may also pose a challenge, the enforcement of the receivables – particularly in respect of the mortgage-backed portfolios – may increase the institutions’ statutory compliance risk, and it necessitates closer monitoring in terms of consumer protection as well.
Chart 40Changes in the portfolio and collateral coverage ratio of the financial enterprises not belonging to a banking group, engaged solely in the purchase of overdue receivables
0
10
20
30
40
50
60
70
0
20
40
60
80
100
120
140
160
180
2011 2012 2013 2014 2015 2016
Per centHUF Billions
Receivables purchased from non-financial institutionsValue of collaterals
Receivables purchased from financial institutionsCollateral coverage (right-hand scale)
Source: MNB.

INSURANCE, FUNDS AND CAPITAL MARKET RISK REPORT • 201766
5 Capital market and its risks
at end-2016, similarly to 2015, the number of investment service providers active in the Hungarian market was 39. While the number of the credit institutions rendering investment services remained unchanged (21), the number of the investment firms with registered office in Hungary fell from 17 of 2015 to 15 by end-2016, and this was offset by the increase in the number of investment firms operating as branch office to 3, from 1 registered in 2015. the volume of customer securities managed by the investment firms continued to rise: the holding of HuF 29,454 registered in 2016 – of which HuF 26,966 billion is with credit institutions and HuF 2,488 billion is with investment firms – exceeds the 2015 value by 7.7 per cent. at end-2016 the number of active clients was 1,361 thousand, which falls short of the 2015 value by 3.9 per cent – the decrease affected primarily the credit institutions. the indemnification incurred due to the frauds committed by investment firms in 2015 generate substantial extra burden for investment service providers, due to which the consolidation process that commenced in 2015 continued in 2016 as well (table 4).
Table 4Key data of the investment service providers at end-2016
2016Investment service sector
Credit institutions Investment firms Total
Number of institutions (pcs) 21 18 39
customer securities portfolio (HuF billion) 26,966 2,488 29,454
Number of active customers (thousand persons) 1,110 251 1,361
Number of securities accounts managed (thousand pcs) 1,640 291 1,931
capital market turnover (HuF billion) 262,808 28,318 291,126
Profit after tax (HuF million) 4,049
capital adequacy ratio (per cent) 16.5 per cent
the assets managed by the 37 fund managers continued to rise in 2016, albeit at a lesser rate: the portfolio of HuF 8,723 billion registered in December 2016 exceeds the 2015 value by 0.7 per cent. the growth in assets is primarily linked with the pension fund portfolios, which increased by 9.8 per cent on an annual basis, and by end-2016 reached HuF 1,297 billion. the assets of HuF 5,842 billion managed by the mutual funds was a historic high at end-2016, although in annual terms the growth decelerated from 4.5 per cent registered in 2015 to 1.1 per cent in 2016. the private capital funds’ net asset value of HuF 40.1 billion at end-2016 represents a dynamic growth compared to the net asset value of HuF 3 billion registered at early 2016. until the end of 2016 of the funds paid in by the capital fund shareholders in the amount of HuF 154 billion, available for the venture capital fund managers, HuF 100 billion was allocated in the form of capital investment and HuF 16 billion was granted in the form of loans (table 5).

caPItaL MaRkEt aND ItS RISkS
INSURANCE, FUNDS AND CAPITAL MARKET RISK REPORT • 2017 67
Table 5
Key data of fund managers at end-2016
2016Fund management sector
Investment fund managers
Venture capital fund managers Total
Number of institutions (pcs) 37 31 68
Number of funds managed (pcs) 595 42 637
Volume of assets managed (HuF billion) 8,723
Funds placed (HuF billion) 156
Profit after tax (HuF million) 23,491 1,020 24,511
5.1 INVESTMENT SERVICES MARKET: TURNOVER AND BALANCES
In 2016 the capital market turnover of investment firms continued to decrease
In 2016 the investment service providers – i.e. the credit institutions and the investment firms – realised a total turnover of HuF 291,100 billion, which falls short of the total HuF 325,700 billion turnover registered in 2015 by 10.6 per cent (see chart 34). the decline was larger in terms of ratio at the investment firms, and in terms of absolute value at the credit institutions: the total turnover of investment firms dropped by 20.2 per cent (HuF -7,200 billion), while that of the credit institution contracted by 9.5 per cent (HuF -27,400 billion). accordingly, the former increasing trend in the investment firms’ share in the total turnover came to a halt in 2016: it was 7.9 per cent in 2013, 9.2 per cent in 2014, 10.9 per cent in 2015, and 9.7 per cent in 2016.
With the exception of the organised market8 (hereinafter: stock exchange) prompt segment of the capital market, the capital market turnover in the remaining three segments of the capital market – stock exchange derivative, Otc prompt and Otc derivative turnover – decreased in 2016, but at a different rate. the HuF 34,600 billion fall in the capital market turnover is essentially linked with the Otc turnover. the Otc derivative and Otc prompt turnover fell by HuF 21,100 and 12,200 billion, respectively, while the stock exchange derivative turnover fell short of the previous year’s turnover by HuF 971 billion (this represents a decrease of 16, 9 and 11 per cent, respectively).
the decrease in the turnover of credit institutions and investment firms appeared in different segments. the 9.5 per cent decline in the credit institutions’ capital market total turnover (the total turnover registered in 2015 was HuF 290,300 billion, and HuF 262,800 billion in 2016) is mostly attributable to the decrease in the prompt, and in the Otc derivative turnover. the credit institutions’ Otc prompt turnover of HuF 60,700 billion in 2016 fell short of the 2015 turnover by 15.3 per cent, while the Otc derivative turnover of HuF 196,700 billion in 2016 fell short of the 2015 turnover by 7.7 per cent. the 20.2 per cent decline in the investment firms’ capital market total turnover (the total turnover registered in 2015 was HuF 35,500 billion, and HuF 28,300 billion in 2016) is mostly attributable to the decrease in the Otc – prompt and derivative – turnover. the investment firms’ 2016 Otc derivative turnover of HuF 10,600 billion and HuF 5,500 billion Otc prompt turnover falls short of the 2015 values by 31.1 and 18.0 per cent, respectively (chart 41).
8 Organised market turnover means the data included in the data supply of the institutions pursuing investment services activity sent to MNB, which also include – apart from the BSE – other recognised stock exchanges (regulated markets), multilateral trading facilities (MtFs) and the so-called organised trading facilities (OtF).

MAGYAR NEMZETI BANK
INSURANCE, FUNDS AND CAPITAL MARKET RISK REPORT • 201768
The share of investment firms in the stock exchange turnover continued to increase in 2016
In 2016 the increase in the investment firms’ share in the stock exchange prompt turnover continued (63.9 per cent in 2013, 70.3 per cent in 2014, 80.4 per cent in 2015 and 84.3 per cent in 2016), while in the stock exchange derivative turnover an opposite process took place. the concentration of the stock exchange prompt turnover continued to increase in 2016: the share of the top five investment service providers transacting the highest stock exchange prompt turnover rose from 80 per cent of 2015 to 85 per cent by 2016, while the ranks of the investment service providers did not change (chart 42).
Chart 41Developments in the capital market turnover
0
50,000
100,000
150,000
200,000
250,000
300,000
350,000
400,000
450,000
0
50,000
100,000
150,000
200,000
250,000
300,000
350,000
400,000
450,000
2011 2012 2013 2014 2015 2016
HUF Billions HUF Billions
Credit institutionsInvestment firms
TotalSource: MNB.
Chart 42Stock exchange prompt capital market turnover and concentration
70%
65%
68%
72%
80%
85%
60
66
72
78
84
90
0
2,500
5,000
7,500
10,000
12,500
2011 2012 2013 2014 2015 2016
%HUF Billions
Investment firmsCredit institutions
TOP5 concentration (right-hand scale)Source: MNB.
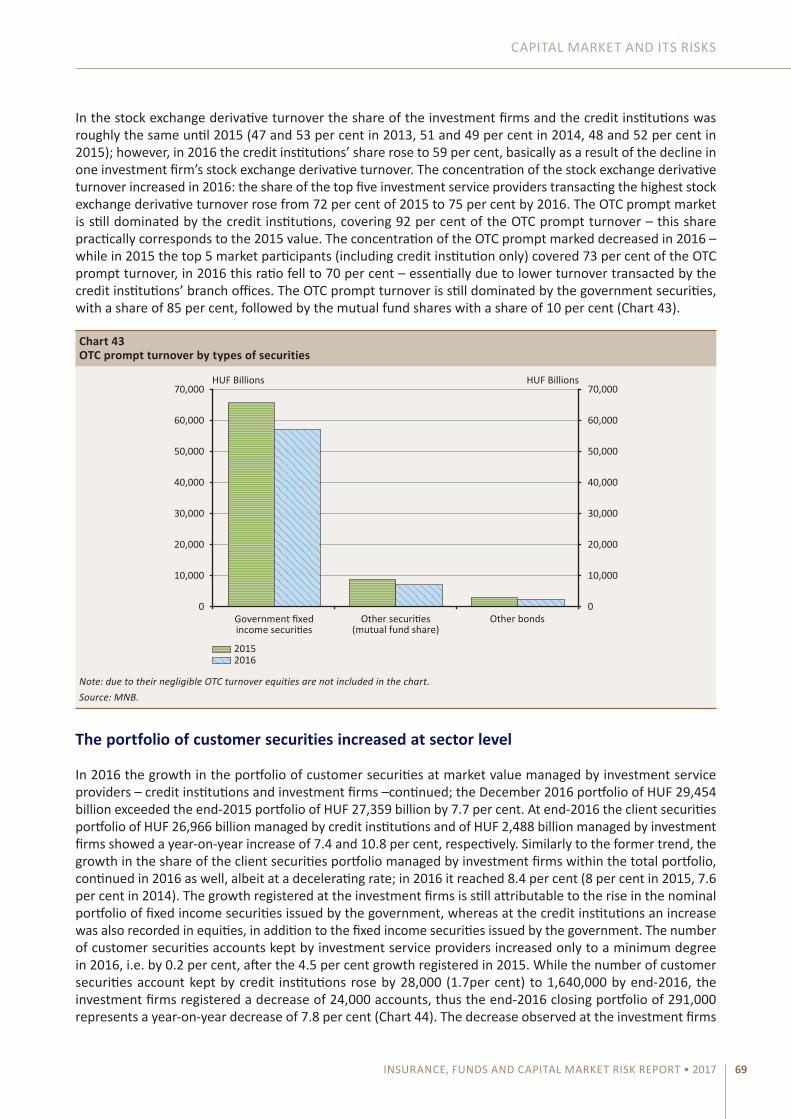
caPItaL MaRkEt aND ItS RISkS
INSURANCE, FUNDS AND CAPITAL MARKET RISK REPORT • 2017 69
In the stock exchange derivative turnover the share of the investment firms and the credit institutions was roughly the same until 2015 (47 and 53 per cent in 2013, 51 and 49 per cent in 2014, 48 and 52 per cent in 2015); however, in 2016 the credit institutions’ share rose to 59 per cent, basically as a result of the decline in one investment firm’s stock exchange derivative turnover. the concentration of the stock exchange derivative turnover increased in 2016: the share of the top five investment service providers transacting the highest stock exchange derivative turnover rose from 72 per cent of 2015 to 75 per cent by 2016. the Otc prompt market is still dominated by the credit institutions, covering 92 per cent of the Otc prompt turnover – this share practically corresponds to the 2015 value. the concentration of the Otc prompt marked decreased in 2016 – while in 2015 the top 5 market participants (including credit institution only) covered 73 per cent of the Otc prompt turnover, in 2016 this ratio fell to 70 per cent – essentially due to lower turnover transacted by the credit institutions’ branch offices. the Otc prompt turnover is still dominated by the government securities, with a share of 85 per cent, followed by the mutual fund shares with a share of 10 per cent (chart 43).
The portfolio of customer securities increased at sector level
In 2016 the growth in the portfolio of customer securities at market value managed by investment service providers – credit institutions and investment firms –continued; the December 2016 portfolio of HuF 29,454 billion exceeded the end-2015 portfolio of HuF 27,359 billion by 7.7 per cent. at end-2016 the client securities portfolio of HuF 26,966 billion managed by credit institutions and of HuF 2,488 billion managed by investment firms showed a year-on-year increase of 7.4 and 10.8 per cent, respectively. Similarly to the former trend, the growth in the share of the client securities portfolio managed by investment firms within the total portfolio, continued in 2016 as well, albeit at a decelerating rate; in 2016 it reached 8.4 per cent (8 per cent in 2015, 7.6 per cent in 2014). the growth registered at the investment firms is still attributable to the rise in the nominal portfolio of fixed income securities issued by the government, whereas at the credit institutions an increase was also recorded in equities, in addition to the fixed income securities issued by the government. the number of customer securities accounts kept by investment service providers increased only to a minimum degree in 2016, i.e. by 0.2 per cent, after the 4.5 per cent growth registered in 2015. While the number of customer securities account kept by credit institutions rose by 28,000 (1.7per cent) to 1,640,000 by end-2016, the investment firms registered a decrease of 24,000 accounts, thus the end-2016 closing portfolio of 291,000 represents a year-on-year decrease of 7.8 per cent (chart 44). the decrease observed at the investment firms
Chart 43OTC prompt turnover by types of securities
0
10,000
20,000
30,000
40,000
50,000
60,000
70,000
0
10,000
20,000
30,000
40,000
50,000
60,000
70,000
Government fixedincome securities
Other securities(mutual fund share)
Other bonds
HUF Billions HUF Billions
20162015
Note: due to their negligible OTC turnover equities are not included in the chart.Source: MNB.

MAGYAR NEMZETI BANK
INSURANCE, FUNDS AND CAPITAL MARKET RISK REPORT • 201770
is primarily attributable to the fact that certain large service providers terminated the contracts of inactive customers after the completion of the customer due diligence.
The growth trend at the long-term investment accounts continued
the portfolio of long-term investment accounts (LtIa) continue to rise in 2016, albeit at a decreasing pace. the LtIa portfolio of 345,000 contracts, recorded by the investment service providers at end-2016, represents a year-on-year increase of 3.5 per cent (in 2015 this growth was 14.3 per cent, while it was 27.0 per cent in 2014). the growth is primarily connected with the credit institutions: the credit institutions’ 2016 closing portfolio of 240,600 contracts exceeds the 2015 closing portfolio by 4.4 per cent, while at the investment firms the LtIa closing portfolio of 104,400 contracts in 2016 exceeds the previous year’s closing portfolio only by 1.4 per cent (the growth in 2015 was 15.2 and 12.2 per cent, respectively). By contrast, the LtIa securities portfolio growth rate did not decrease in 2016: the 2016 LtIa closing securities portfolio of HuF 2,042 billion exceeded the 2015 closing securities portfolio of HuF 1,844 billion by 10.7 per cent (the growth recorded in 2015 and 2014 was 10.3 and 39.9 per cent, respectively). accordingly, the average securities portfolio per LtIa rose from HuF 5.5 million at the end of 2015 to HuF 5.9 million by the end of 2016. In line with the former trend, the fall in the portfolio of the pension savings accounts (PSa) continued: after the decrease of 5.4 and 7.4 per cent registered in 2014 and 2015, respectively, in 2016 the portfolio of pension savings account shrank by 8 per cent, and closed with 127,100 accounts at end-2016. the decrease affected mainly the investment firms: in 2016 the PSa portfolio registered by the investment firms fell by 12.3 per cent, whereas the credit institutions only registered a decline of 6.7 per cent. the fall observed at the investment firms was basically linked with one institution (chart 45).
Chart 44Customer securities portfolio
0
300
600
900
1,200
1,500
1,800
2,100
0
4,000
8,000
12,000
16,000
20,000
24,000
28,000
2011 2012 2013 2014 2015 2016
Thousands piecesHUF Billions
Customer securities – credit institutionsCustomer securities – investment firmsAccounts kept – credit institutions (right-hand scale)Accounts kept – investment firms (right-hand scale)
Source: MNB.

caPItaL MaRkEt aND ItS RISkS
INSURANCE, FUNDS AND CAPITAL MARKET RISK REPORT • 2017 71
5.2 REGULATED MARKET, POST-TRADING INFRASTRUCTURES
The turnover of the Budapest Stock Exchange (BSE) continued to rise
In 2016 the prompt turnover of securities continued to increase at the Budapest Stock Exchange: the prompt turnover of HuF 3,726 billion registered in 2016 exceeds the 2015 turnover of HuF 3,506 billion by 6.3 per cent, which was also reflected in the growth of the average daily turnover (chart 46). When examining it in a quarterly breakdown, the first quarter of 2016 realised a particularly high growth: the quarter-on-quarter and year-on-year growth was 35 and 22 per cent, respectively, while the second quarter registered a decrease both in quarter-on-quarter (-16 per cent) and year-on-year (-7 per cent) terms. the concentration ratio s in the prompt market segment continued to increase in 2016: the turnover generated by the top five stock exchange members covered 78.7 per cent of the total turnover, which is higher by 5.4 percentage points compared to 2015 (in 2014 this amounted to 65.6 per cent). In the prompt market segment the turnover of securities other than equities – fixed income securities issued by the government, mutual fund shares, certificates, mortgage bonds, corporate bonds – was still low; the share of the other securities in the total prompt turnover rose from 3.9 per cent of 2015 to 4.5 per cent by 2016: the increase of 0.6 per cent is primarily attributable to the rise in the turnover of mutual fund shares. In 2016 the BSE’s derivative turnover was HuF 5,175 billion, which falls short of previous year’s turnover by 6.3 per cent. Foreign exchange derivative contracts account for 87.3 per cent of the turnover, followed by the turnover realised in individual equity and Bux index derivatives with a share of 9.6 and 2.4 per cent, respectively. at annual level, the turnover of foreign exchange contracts fell by 7.9 per cent, while the turnover of individual equities and the Bux index rose by 5.4 and 27.8 per cent, respectively.
Chart 45LTIA and PSA accounts, and the portfolios held on the accounts
0
60,000
120,000
180,000
240,000
300,000
360,000
0
400
800
1,200
1,600
2,000
2,400 PiecesHUF Billions
Securities portfolio registered on PSA at market valueSecurities portfolio registered on LTIA at market value
Long-term investment account (right-hand scale)Pension savings account (right-hand scale)
2013
Q1
2013
Q2
2013
Q3
2013
Q4
2014
Q1
2014
Q2
2014
Q3
2014
Q4
2015
Q1
2015
Q2
2015
Q3
2015
Q4
2016
Q1
2016
Q2
2016
Q3
2016
Q4
Source: MNB.
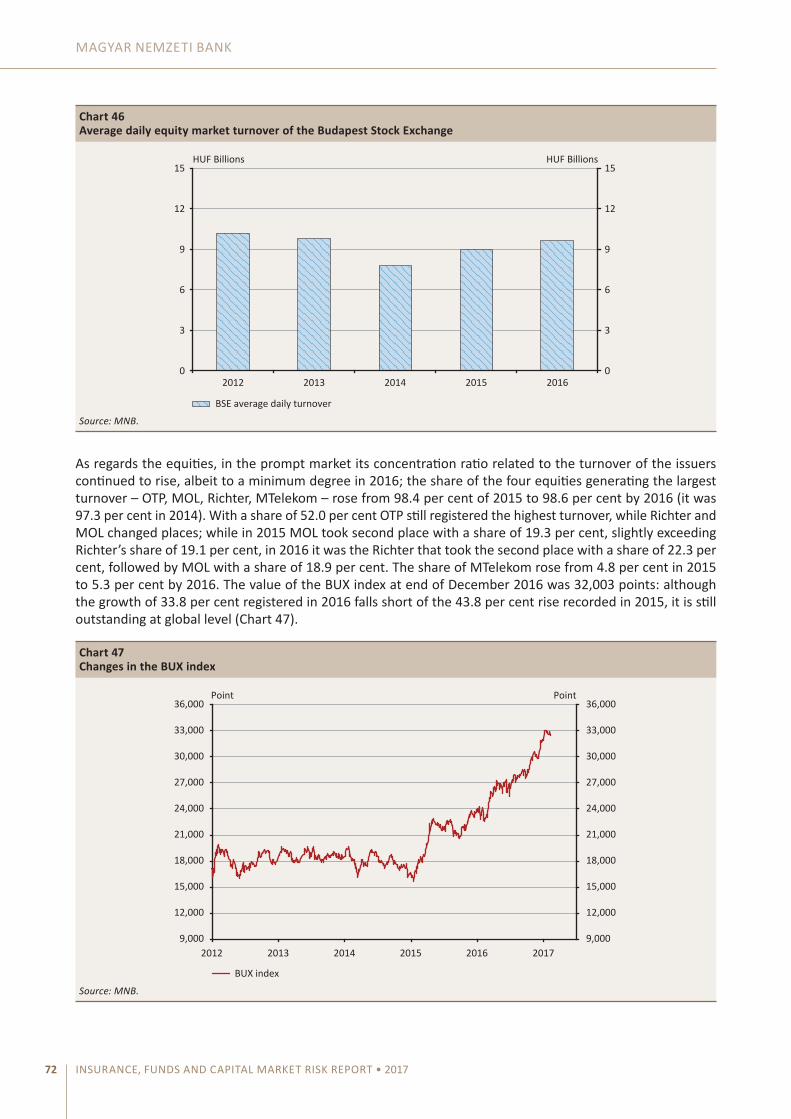
MAGYAR NEMZETI BANK
INSURANCE, FUNDS AND CAPITAL MARKET RISK REPORT • 201772
as regards the equities, in the prompt market its concentration ratio related to the turnover of the issuers continued to rise, albeit to a minimum degree in 2016; the share of the four equities generating the largest turnover – OtP, MOL, Richter, Mtelekom – rose from 98.4 per cent of 2015 to 98.6 per cent by 2016 (it was 97.3 per cent in 2014). With a share of 52.0 per cent OtP still registered the highest turnover, while Richter and MOL changed places; while in 2015 MOL took second place with a share of 19.3 per cent, slightly exceeding Richter’s share of 19.1 per cent, in 2016 it was the Richter that took the second place with a share of 22.3 per cent, followed by MOL with a share of 18.9 per cent. the share of Mtelekom rose from 4.8 per cent in 2015 to 5.3 per cent by 2016. the value of the Bux index at end of December 2016 was 32,003 points: although the growth of 33.8 per cent registered in 2016 falls short of the 43.8 per cent rise recorded in 2015, it is still outstanding at global level (chart 47).
Chart 46Average daily equity market turnover of the Budapest Stock Exchange
0
3
6
9
12
15
0
3
6
9
12
15
2012 2013 2014 2015 2016
HUF BillionsHUF Billions
BSE average daily turnover
Source: MNB.
Chart 47Changes in the BUX index
9,000
12,000
15,000
18,000
21,000
24,000
27,000
30,000
33,000
36,000
9,000
12,000
15,000
18,000
21,000
24,000
27,000
30,000
33,000
36,000
2012 2013 2014 2015 2016 2017
Point Point
BUX index
Source: MNB.

caPItaL MaRkEt aND ItS RISkS
INSURANCE, FUNDS AND CAPITAL MARKET RISK REPORT • 2017 73
In 2016 the BSE registered four private capital increases, one initial, one secondary public offering and four delisting events.
Of the four delisting events in 2016, there was an automatic one (Norbi update Lowcarb), one was performed based on Section 63 of the capital Markets act (Libri Bookline) and 2 were executed through liquidation or dissolution (Synergon, Visonka). In 2016 the trading of new equity (Duna House) commenced at BSE, and there was one secondary public offering (alteo).
Further developments at the KELER group
In 2015, kELER launched its project aimed at acquiring an LEI code issuer licence, expected to be obtained in 2017. Once it acquires the licence, it will be able to issue and renew LEI codes for the Hungarian market participants, which would be important due to a number of statutory regulations (e.g. cSDRn, MiFID II/MiFIRo). Owing to the delay in the second-level laws related to cSDR, kELER can presumably submit the licence application in the second half of 2017, and as well as the going live of the new depository account management system (BaNcS) was also postponed to July 2017. In February 2017, kELER, as the member of the fourth round of accession, successfully joined the taRGEt2 Securities scheme.
In the case of kELER ccP, in accordance with the EMIRp requirements, the MNB performed the comprehensive audit in 2016 too, the result of which was also communicated to the college of kELER ccP. In September 2016, kELER ccP signed a cooperation agreement with the Romanian commodity exchange (Bursa Romana de Marfuri, BRM) and on the launch of central clearing services by kELER ccP to the clients of the BRM platform.
5.3. RISKS AFFECTING THE INVESTMENT FIRMS
Increasing white-label scheme portfolios
the foreign exchange market events in early 2015 related to the Swiss franc threw light on the risks of white-label agreements. the white-label scheme is a service where the investment firm purchases a fully supported product from a third party and then resells it under its own brand and business name. In the case of white-label contracts the customers’ funds and positions are recorded on subaccounts opened at the third party under the customer account registered in the name of the investment firm. although the third party is able to state the customers’ positions and collaterals separately, in respect of the open positions it aggregates their assets that may serve as collateral. as a result of this, the Hungarian counterparties – i.e. the investment firms and their customers – have substantial credit and counterparty risk exposure to the third party service providers.
In the Hungarian market there are five investment firms engaged in white-label services. During 2016, the deal date notional principal of deals executed under the white-label scheme with an open positions characterized by a leverage higher than 10, substantially increased: the 2016 closing portfolio of HuF 79.2 billion exceeds the 2015 closing portfolio of HuF 55.1 billion by 43.7 per cent (chart 48). accordingly, the MNB continues to pay special attention to the monitoring of this type of exposures, and when it finds it necessary, during the annual supervisory review of the internal capital adequacy assessment process it prescribes additional capital requirement for the institutions.

MAGYAR NEMZETI BANK
INSURANCE, FUNDS AND CAPITAL MARKET RISK REPORT • 201774
Market risk: the market share of the small investment firms continued to decrease in 2016
the concentration of the clients’ securities portfolio of the investment firm, calculated by HHI, decreased further in 2016: the 32 per cent registered in 2016 is lower than the 33.6 per cent of 2015 by 1.6 percentage points (it was 35.5 per cent in 2014). the sector is still characterised by very high concentration: the top three market participants covered 78.7 per cent of the entire investments business sector’s client securities portfolio in 2016. the 6.8 per cent decline, compared to previous year’s value of 85.5 per cent, was attributable to the appearance of a new market participant and the realignment of the market. the market share of small investment firms – i.e. the investment firms with client securities portfolio of less than HuF 100 billion – continued to decline (2015: 9.1 percent, 2016: 8.8 per cent) (chart 49).
Chart 48Deal date notional principal of the white-label products
0
10
20
30
40
50
60
70
80
90
0
10
20
30
40
50
60
70
80
90
2013 2014 2015 2016
HUF Billions HUF Billions
Deal date notional principal
Source: MNB.
Chart 49Market concentration of the client securities portfolio
20
24
28
32
36
40
20
24
28
32
36
40
2011 2012 2013 2014 2015 2016
HHI (per cent) HHI (per cent)
Customer securities HHI
Source: MNB.
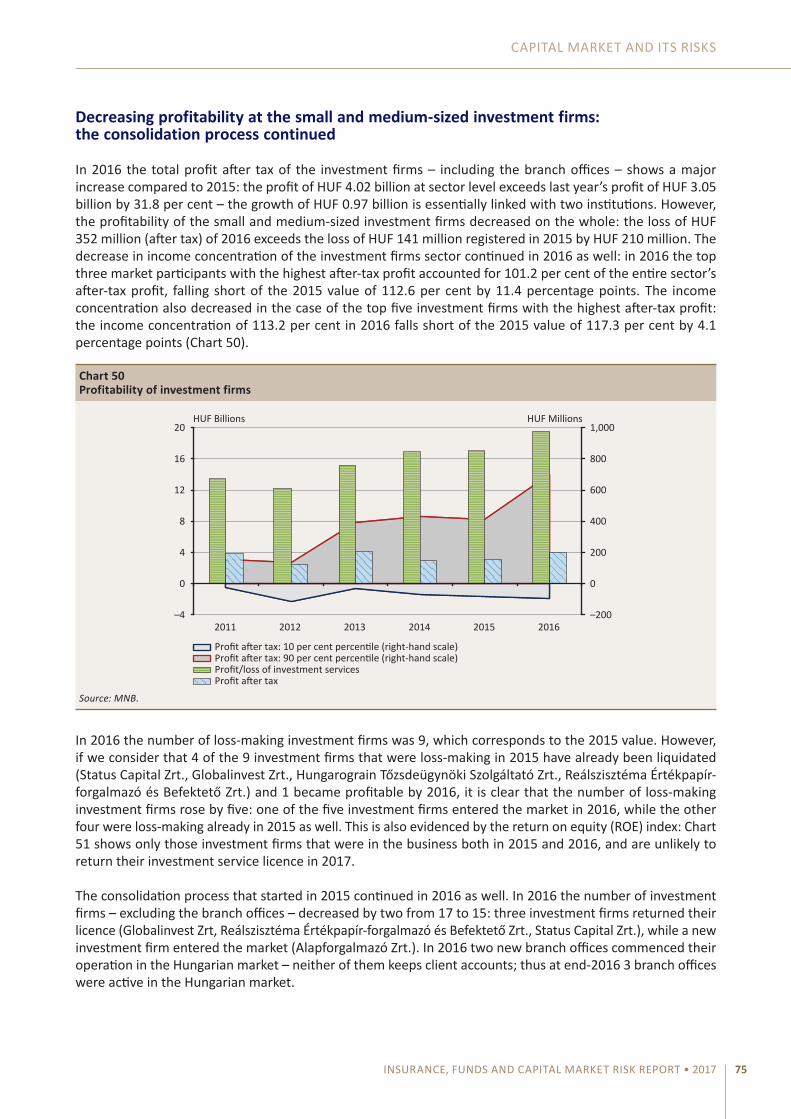
caPItaL MaRkEt aND ItS RISkS
INSURANCE, FUNDS AND CAPITAL MARKET RISK REPORT • 2017 75
Decreasing profitability at the small and medium-sized investment firms: the consolidation process continued
In 2016 the total profit after tax of the investment firms – including the branch offices – shows a major increase compared to 2015: the profit of HuF 4.02 billion at sector level exceeds last year’s profit of HuF 3.05 billion by 31.8 per cent – the growth of HuF 0.97 billion is essentially linked with two institutions. However, the profitability of the small and medium-sized investment firms decreased on the whole: the loss of HuF 352 million (after tax) of 2016 exceeds the loss of HuF 141 million registered in 2015 by HuF 210 million. the decrease in income concentration of the investment firms sector continued in 2016 as well: in 2016 the top three market participants with the highest after-tax profit accounted for 101.2 per cent of the entire sector’s after-tax profit, falling short of the 2015 value of 112.6 per cent by 11.4 percentage points. the income concentration also decreased in the case of the top five investment firms with the highest after-tax profit: the income concentration of 113.2 per cent in 2016 falls short of the 2015 value of 117.3 per cent by 4.1 percentage points (chart 50).
In 2016 the number of loss-making investment firms was 9, which corresponds to the 2015 value. However, if we consider that 4 of the 9 investment firms that were loss-making in 2015 have already been liquidated (Status capital Zrt., Globalinvest Zrt., Hungarograin tőzsdeügynöki Szolgáltató Zrt., Reálszisztéma Értékpapír-forgalmazó és Befektető Zrt.) and 1 became profitable by 2016, it is clear that the number of loss-making investment firms rose by five: one of the five investment firms entered the market in 2016, while the other four were loss-making already in 2015 as well. this is also evidenced by the return on equity (ROE) index: chart 51 shows only those investment firms that were in the business both in 2015 and 2016, and are unlikely to return their investment service licence in 2017.
the consolidation process that started in 2015 continued in 2016 as well. In 2016 the number of investment firms – excluding the branch offices – decreased by two from 17 to 15: three investment firms returned their licence (Globalinvest Zrt, Reálszisztéma Értékpapír-forgalmazó és Befektető Zrt., Status capital Zrt.), while a new investment firm entered the market (alapforgalmazó Zrt.). In 2016 two new branch offices commenced their operation in the Hungarian market – neither of them keeps client accounts; thus at end-2016 3 branch offices were active in the Hungarian market.
Chart 50Profitability of investment firms
–200
0
200
400
600
800
1,000
–4
0
4
8
12
16
20
2011 2012 2013 2014 2015 2016
HUF MillionsHUF Billions
Profit/loss of investment servicesProfit after tax: 90 per cent percentile (right-hand scale)Profit after tax: 10 per cent percentile (right-hand scale)
Profit after tax
Source: MNB.

MAGYAR NEMZETI BANK
INSURANCE, FUNDS AND CAPITAL MARKET RISK REPORT • 201776
The capital adequacy ratio has fallen, but the capital adequacy is still outstanding
the subscribed capital of the investment firms rose last year by HuF 1.04 billion and the 2016 closing balance thereof was HuF 7 billion: the increase is attributable to the market entry of a new investment firm. accordingly, the equity rose by HuF 2.35 billion to HuF 21.68 billion: the growth was also contributed to by last year’s profit. the investment firms sector’s average capital adequacy ratio of 16.5 per cent in 2016 falls short of the 2015 capital adequacy ratio of 21.2 per cent by 4.7 percentage points, which is fundamentally attributable to the increase in capital requirements.
Of the 15 investment firms with registered office in Hungary, at end of 2016 4 institutions did not have the prescribed capital requirement: 2 of them failed to satisfy the statutory initial the start-up capital requirement, while 2 did not comply with the additional capital requirement prescribed during the SREPr procedure. two of the four institutions will downsize its scope of activities, as a result of which the statutory initial capital requirements will decrease, while supervisory measures were taken at the other two. contrary to the former situation, by end-2016 those investment firms that have to comply with capital requirements calculated on the basis of exposure were in majority: this applied to 8 of the 15 investment firms, while in the case of the remaining 7 institutions the capital requirement is represented by the statutory initial capital requirement, as a higher limit. In 2015 the situation was the opposite: 11 of the 18 investment firms had to comply with the statutory initial capital requirement specified in the Investment Provider act, as a higher limit (chart 52).
Chart 51ROE value of the investment firms (per cent)
–140
–120
–100
–80
–60
–40
–20
0
20
40 Per cent
–140 –120 –100 –80 –60 –40 –20 0 20 40
2016
2015
Source: MNB.
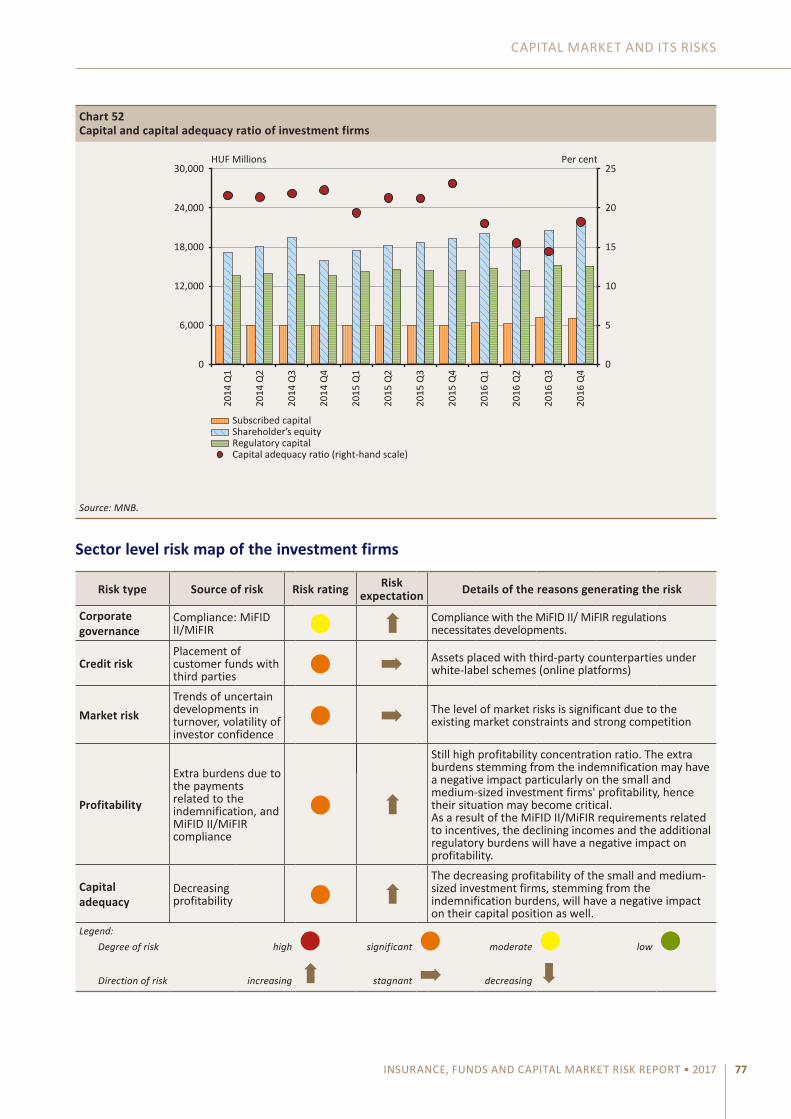
caPItaL MaRkEt aND ItS RISkS
INSURANCE, FUNDS AND CAPITAL MARKET RISK REPORT • 2017 77
Sector level risk map of the investment firms
Risk type Source of risk Risk rating Risk expectation Details of the reasons generating the risk
Corporate governance
compliance: MiFID II/MiFIR ● ➡ compliance with the MiFID II/ MiFIR regulations
necessitates developments.
Credit riskPlacement of customer funds with third parties ● ➡ assets placed with third-party counterparties under
white-label schemes (online platforms)
Market risktrends of uncertain developments in turnover, volatility of investor confidence
● ➡ the level of market risks is significant due to the existing market constraints and strong competition
Profitability
Extra burdens due to the payments related to the indemnification, and MiFID II/MiFIR compliance
● ➡
Still high profitability concentration ratio. the extra burdens stemming from the indemnification may have a negative impact particularly on the small and medium-sized investment firms' profitability, hence their situation may become critical.as a result of the MiFID II/MiFIR requirements related to incentives, the declining incomes and the additional regulatory burdens will have a negative impact on profitability.
Capital adequacy
Decreasing profitability ● ➡
the decreasing profitability of the small and medium-sized investment firms, stemming from the indemnification burdens, will have a negative impact on their capital position as well.
Legend: Degree of risk high ● significant ● moderate ● low ●
Direction of risk increasing ➡ stagnant ➡ decreasing
➡
Chart 52Capital and capital adequacy ratio of investment firms
0
5
10
15
20
25
0
6,000
12,000
18,000
24,000
30,000
Per centHUF Millions
Regulatory capitalShareholder’s equitySubscribed capital
Capital adequacy ratio (right-hand scale)
2014
Q1
2014
Q2
2014
Q3
2014
Q4
2015
Q1
2015
Q2
2015
Q3
2015
Q4
2016
Q1
2016
Q2
2016
Q3
2016
Q4
Source: MNB.
MAGYAR NEMZETI BANK
INSURANCE, FUNDS AND CAPITAL MARKET RISK REPORT • 201778
the compliance with the new MiFIDII/MiFIR European union regulation, applicable to the investment service providers – and particularly to the investment firms – entering into force from January 2018, highlighted the corporate governance risks, as compared to the provisions of the present MiFID regulatory regime, the MiFIDII/MiFIR regulation includes a number of new requirements. the new regulatory regime affects the entire investment process, starting from the regulation through the execution to the trading venue, hence the compliance with these requirements represents a challenge for the investment firms.
the foreign exchange market events in early 2015 related to the Swiss franc pointed out the vulnerabilities of white-label agreements, i.e. the credit risks arising in relation to the placement of client assets on online platforms with third parties, which followed a rising trend in 2016. Within the framework of the present capital market processes – declining capital market turnover, new regulatory regime (MiFIDII/MiFIR), strong market concentration – the business model of the small investment firms does not seem to be sustainable: accordingly, we still regard the market risk to be high at sector level. although the after-tax profit of the investment firm sector showed a vigorous growth compared to 2015, the rise is essentially linked with only two institutions. In 2017 the indemnification burdens (IPF premium, Loss adjustment Fund) incurred as a result of the frauds in 2015 that affected certain investment firms, substantially exceed the 2016 level. accordingly, we still classify the profitability risk as significant with the prospect of increase – in this respect, particularly the small and medium-sized investment firms show the signs of vulnerability. this is also evidenced by the consolidation process that commenced in the investment firms sector, within the framework of which in 2016 three investment firms returned their activity licence. the capital position at sector level is satisfactory on the whole, but as a result of the indemnification burdens, the profitability of certain small investment firms is expected to turn negative and this also has a negative impact on their capital position: accordingly, we classify the capital adequacy risk as significant.
5.4 FUND MANAGEMENT MARKET AND RISKS AFFECTING INVESTMENT FUND MANAGERS
The assets managed by the investment fund managers continues to rise, albeit at a decreasing pace
In 2016 the growth in the number of investment funds continued: the 595 investment funds – securities and real estate funds – in 2016 exceeded the 2015 closing value by 18: the growth affected the real estate funds, while the number of securities funds remained the same (547). the number of investment fund managers rose by one to 37 in 2016.
the assets managed by the investment fund managers in 2016 rose by 0.7 per cent to HuF 8,723 billion. the key growth driver was the pension fund sector: the voluntary and private pension fund assets managed by the investment fund managers rose by HuF 115 billion (9.8 per cent) in 2016 and by the end of the year reached HuF 1,297 billion. the growth in the assets managed in the investment funds decelerated in 2016: the volume of HuF 5,842 billion in 2016 exceeds the 2015 value of HuF 5,777 billion by 1.1 per cent, while the growth registered in 2015 and 2014 was 4.5 and 18.6 per cent, respectively. the assets managed in the insurance portfolios continued to decrease in 2016: the managed insurance funds of HuF 997 billion fall short of the previous year’s managed funds by 10.1 per cent – the decline of HuF 111 billion is essentially linked with one institution. the value of the assets managed in other portfolios dropped by 1.5 per cent to HuF 551 billion in 2016 (chart 53).
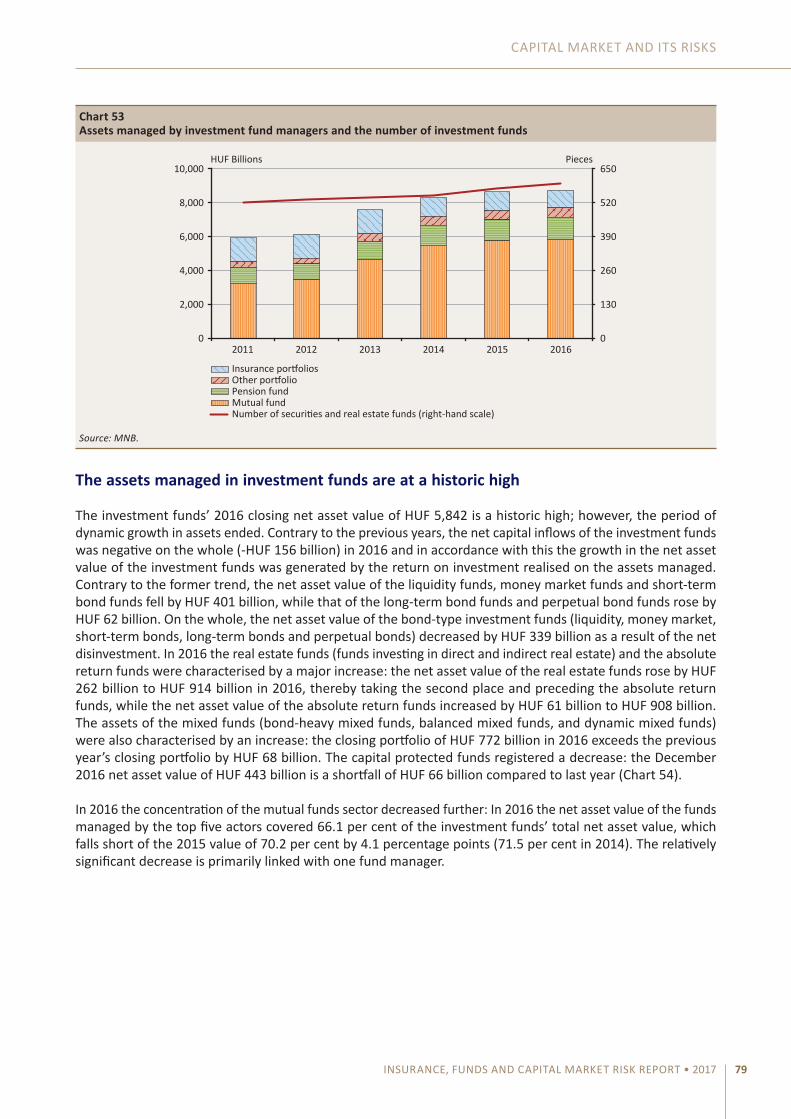
caPItaL MaRkEt aND ItS RISkS
INSURANCE, FUNDS AND CAPITAL MARKET RISK REPORT • 2017 79
The assets managed in investment funds are at a historic high
the investment funds’ 2016 closing net asset value of HuF 5,842 is a historic high; however, the period of dynamic growth in assets ended. contrary to the previous years, the net capital inflows of the investment funds was negative on the whole (-HuF 156 billion) in 2016 and in accordance with this the growth in the net asset value of the investment funds was generated by the return on investment realised on the assets managed. contrary to the former trend, the net asset value of the liquidity funds, money market funds and short-term bond funds fell by HuF 401 billion, while that of the long-term bond funds and perpetual bond funds rose by HuF 62 billion. On the whole, the net asset value of the bond-type investment funds (liquidity, money market, short-term bonds, long-term bonds and perpetual bonds) decreased by HuF 339 billion as a result of the net disinvestment. In 2016 the real estate funds (funds investing in direct and indirect real estate) and the absolute return funds were characterised by a major increase: the net asset value of the real estate funds rose by HuF 262 billion to HuF 914 billion in 2016, thereby taking the second place and preceding the absolute return funds, while the net asset value of the absolute return funds increased by HuF 61 billion to HuF 908 billion. the assets of the mixed funds (bond-heavy mixed funds, balanced mixed funds, and dynamic mixed funds) were also characterised by an increase: the closing portfolio of HuF 772 billion in 2016 exceeds the previous year’s closing portfolio by HuF 68 billion. the capital protected funds registered a decrease: the December 2016 net asset value of HuF 443 billion is a shortfall of HuF 66 billion compared to last year (chart 54).
In 2016 the concentration of the mutual funds sector decreased further: In 2016 the net asset value of the funds managed by the top five actors covered 66.1 per cent of the investment funds’ total net asset value, which falls short of the 2015 value of 70.2 per cent by 4.1 percentage points (71.5 per cent in 2014). the relatively significant decrease is primarily linked with one fund manager.
Chart 53Assets managed by investment fund managers and the number of investment funds
0
130
260
390
520
650
0
2,000
4,000
6,000
8,000
10,000
2011 2012 2013 2014 2015 2016
PiecesHUF Billions
Pension fundOther portfolioInsurance portfolios
Mutual fundNumber of securities and real estate funds (right-hand scale)
Source: MNB.

MAGYAR NEMZETI BANK
INSURANCE, FUNDS AND CAPITAL MARKET RISK REPORT • 201780
In 2016 the investment funds were characterised by divestiture on the whole
In 2016 at sector level the investment funds were characterised by net capital outflows of HuF 156 billion, contrary to the substantial net capital inflows in the previous three years – HuF 984 billion in 2013, HuF 631 billion in 2014 and HuF 145 billion in 2015. the negative capital flows observed in 2016 is essentially attributable to the divestiture from the bond-type (liquidity, money market, short-term bonds, long-term bonds and perpetual bonds) investment funds, in excess of that observed in 2015: while in 2015 the volume of funds withdrawn from the bond-type investment funds amounted to HuF 126 billion in total, in 2016 this amount trebled and reached HuF 379 billion. In parallel with this, the households’ government fixed income securities holdings rose by HuF 1,019 billion in 2016 and by the end of the year it reached HuF 4,179 billion, corresponding to an annual growth of 32 per cent. the HuF 904 billion portfolio, registered at end-2016, of government securities held by the households with the custodianship of the Hungarian State treasury exceeds the opening portfolio of HuF 750 billion by 21 per cent. the growth in the government securities held by the households with the custodianship of investment service providers was more vigorous: the end-2016 closing portfolio of HuF 3,274 billion exceeds the opening portfolio of HuF 2,409 billion by 36 per cent.
the mixed funds (bond-heavy mixed funds, balanced mixed funds, and dynamic mixed funds) were still characterised by net capital inflows in 2016, albeit in a decreasing amount: the net capital inflows of HuF 44 billion registered in 2016 substantially falls short of the net capital inflows of HuF 232 billion and 155 billion registered in 2014 and 2015, respectively. at the capital protected funds the former divestiture trend continued in 2016: the net capital outflows of HuF 79 billion registered in 2016 substantially exceeded the net capital outflows of HuF 8 billion and HuF 25 billion registered in 2014 and 2015, respectively (chart 55).
Chart 54Breakdown of the investment funds by investment policy
0
1,000
2,000
3,000
4,000
5,000
6,000
0
1,000
2,000
3,000
4,000
5,000
6,000 HUF Billions HUF Billions
Derivative and commodity market fundsReal estate fundsAbsolute yield fundsEquity fundsCapital protected fundsMixed fundsBond-type funds
2013 2014 2015 2016
Source: MNB.

caPItaL MaRkEt aND ItS RISkS
INSURANCE, FUNDS AND CAPITAL MARKET RISK REPORT • 2017 81
Substantial capital inflows to the real estate funds
In accordance with the previous trend, the growth of the real estate funds’ portfolio continued in 2016 as well, which is mainly attributable to the dynamic net capital inflows (chart 56). In 2016 the net capital inflows of funds investing in direct real estate – with year-end net asset value of HuF 859 billion – soared to HuF 192 billion, while this amounted to HuF 68 billion and hardly HuF 9 billion in 2015 and 2014, respectively. a vast part of the growth is essentially attributable to the real estate funds managed by three funds managers. In the case of funds investing in indirect real estate – the year-end net asset value of which was HuF 55 billion – the trend of former years characterised by net divestiture (HuF 6 billion in 2014 and HuF 1 billion in 2015) reversed in 2016, and the net capital inflows reached HuF 21 billion, which is mostly related to one investment fund.
Chart 55Net capital flows of investment funds
–400
–300
–200
–100
0
100
200
300
400
500
600
700
–400
–300
–200
–100
100
200
300
400
500
600
700
Bond-type Mixed Capitalprotected
Equity Absolute yieldand derivative
Real estate
HUF Billions HUF Billions
201520142013
2016Source: MNB.
Chart 56Portfolio and net capital inflows of real estate funds
0
160
320
480
640
800
960
–20
0
20
40
60
80
100 HUF Billions HUF Billions
Real estate funds net CF (left-hand scale)Real estate funds' managed assets (right-hand scale)
2013
Q1
2013
Q2
2013
Q3
2013
Q4
2014
Q1
2014
Q2
2014
Q3
2014
Q4
2015
Q1
2015
Q2
2015
Q3
2015
Q4
2016
Q1
2016
Q2
2016
Q3
2016
Q4
Source: MNB.

MAGYAR NEMZETI BANK
INSURANCE, FUNDS AND CAPITAL MARKET RISK REPORT • 201782
Stable profitability and high capitalisation in investment fund management sector
as a result of the growth in the investment funds and portfolio managed assets, the investment fund managers’ after-tax profit rose from HuF 21.4 billion of 2015 to HuF 23.5 billion by 2016 – the largest part of the growth of HuF 2.1 billion is linked with one fund manager: the 9.6 per cent rise in after-tax profit is well above the 2.4 per cent growth in the assets managed by the investment fund managers. the concentration of the sector declined further: the five asset managers with the highest after-tax profit accounted for 65.2 per cent of the entire sector’s after-tax profit in 2016, falling short of the previous year’s value by 2 percentage points. In 2016 there was one change in the composition of the top five market participants: the actor formerly ranked sixth took the fifth place. the number of loss-making investment fund managers fell from ten, registered in 2015, to eight in 2016; their total loss amounted to HuF 223 million, which is a major decrease compared to the 2015 level of HuF 511 million. Four of the eight fund managers that realised a loss in 2016 suffered a loss in 2015 as well; however, their aggregated result after tax was relatively low (-HuF 56 million), while one of them started its operation in 2016. the value of the portfolio managed by the loss-making investment fund managers was HuF 71 billion at end-2016, accounting for 0.8 per cent of the total managed assets. the business model of the investment fund managers is characterised by strong profitability – this is also evidenced by the return on equity (ROE): chart 57 includes only the institutions that operated both in 2015 and 2016, and their investment service licence was not withdrawn in 2017 and they are not planning to return it.
the fund management sector was characterised by high capitalisation level in 2016 as well: the regulatory capital available in the amount of HuF 11.7 billion corresponded to 215 per cent of the regulatory capital requirement of HuF 5.4 billion. the dividends paid from the 2015 after-tax profit amounted to HuF 17.5 billion in 2016, which fell short of the 2014 dividends by HuF 8.4 billion (chart 58).
Chart 57ROE value of investment fund managers (per cent)
–40
–20
0
20
40
60
80
100Per cent
–80 –40 0 40 80 120 160
2016
2015
Source: MNB.

caPItaL MaRkEt aND ItS RISkS
INSURANCE, FUNDS AND CAPITAL MARKET RISK REPORT • 2017 83
Sector level risk map of the investment fund managers
Risk type Source of risk Risk rating Risk expectation Details of the reasons generating the risk
Corporate governance
compliance: MiFID II/MiFIR and PRIIPS ● ➡
In the case of fund managers also holding a licence for investment services, the compliance with the MiFID II/MiFIR regulations, and in the case of the fund managers managing closed-end funds the compliance with the directly effective rules of PRIIPS represent a challenge.
Operational risk Risk management systems ● ➡ at some of the fund managers the risk management
framework needs to be supplemented.
Market risk Low interest environment ● ➡
the low interest environment, and the relatively high yield of the retail government fixed income securities led to capital outflows from the funds investing in interest-bearing assets.
Profitabilitycapital outflows from bond-type funds and capital protected funds
● ➡
Profitability concentration is still high; at certain small fund managers profitability problems may arise due to economies of scale reasons, particularly if their funds are affected by the capital outflows. the strengthening of the cross-border services may point to a decrease in fees in the Hungarian market as well.
Capital adequacy
Decreasing profitability ● ➡
the fund management sector is characterised by adequate capitalisation level, but the decreasing profitability may have a negative impact on the capital position of certain small fund managers.
Legend: Degree of risk high ● significant ● moderate ● low ●
Direction of risk increasing ➡ stagnant ➡ decreasing
➡
Chart 58Profitability of the investment fund managers
0
50
100
150
200
250
300
0
5
10
15
20
25
30
2011 2012 2013 2014 2015 2016
HUF MillionsHUF Billions
Total after-tax profit/loss of the sectorTotal dividend of the sectorAfter-tax profit/loss median (right-hand scale)
Note: No approved dividend data are available for 2016 yet. Source: MNB.

MAGYAR NEMZETI BANK
INSURANCE, FUNDS AND CAPITAL MARKET RISK REPORT • 201784
compared to the investment firms, the investment fund management sector is mainly characterised by lower risk level as a result of the business model applied. the investment fund managers also holding a licence for the rendering of investment services (e.g. distribution) are also affected by the MiFIDII/MiFIR regime effective from January 2018, while the PRIIPS European union level, directly effective regulation relates to the fund managers managing closed-end funds. the compliance with the two regulatory regimes represents a challenge for the respective fund managers, thus we classify the corporate governance risk as moderate.
the globally low interest environment and the relatively high yield of the retail government fixed income securities generated significant capital outflows from the bond-type funds: in 2016 the net capital outflows of the bond-type funds amounted to HuF 379 billion. although the assets managed in the investment funds were at their historic high in 2016, in view of the above, the level of the market risk increased. the investment fund management sector is still characterised by stable profitability and high capital portfolio. However, the profitability of certain fund managers varies in a low or even negative range due to economies of scale reasons, hence on the whole we deem the profitability risk moderate.
5.5 VENTURE CAPITAL AND PRIVATE CAPITAL FUND MANAGERS
Dynamic growth at the private capital funds
In 2016 the number of venture capital funds did not change – there are still 37 venture capital funds, while as a new market segment – based on an operating model conditional upon supervisory licence – the private capital funds entered the market. In 2016 the number of private capital funds rose to 5 from one registered in 2015. at end-2016 already 4 institutions pursued the management of private capital funds. the increasing trend is also evidenced by the changes in the net asset value of private capital funds: the assets managed in the private capital funds rose from HuF 3 billion of end-2015 to HuF 40 billion by end-2016. the number of venture capital funds managers decreased by one to 31 in 2016. During the oversight of the venture and private capital funds, the MNB focuses on the institution’s statutory compliance rather than on the economic return realised on the investments, as a result of the absence of retail stakeholders and the relevant legislative environment.
The allocation of the venture capital funds rose further in 2016
at end-2016 the paid-in capital available for venture and private capital funds amounted to HuF 196 billion, which exceeds the level of end-2015 by 33 per cent (HuF 49 billion). the funds available for the venture capital funds, paid in by the holders of capital fund units, rose from HuF 143 billion of 2015 to HuF 154 billion by 2016: the growth affected 17 venture capital funds in the amount of HuF 17 billion, while 3 venture capital funds registered a decrease in the amount of HuF 6 billion. the paid-in capital available for the private capital funds soared from HuF 4 billion of 2015 to HuF 42 billion by 2016.
Of the capital available for the venture capital funds until end-2016 HuF 116 billion was allocated in the form of investments and loans granted, which is a 14.4 per cent growth compared to 2015. the concentration of the venture capital fund sector decreased further in 2016: based on the amount of the capital investments the top five capital funds covered 29 per cent of all capital investments, which was by 4 percentage points lower than the 32 per cent registered in 2015 (it was 47 per cent in 2014). Four of the top five actors of 2016 were included in the top five in 2015 as well (chart 59).

caPItaL MaRkEt aND ItS RISkS
INSURANCE, FUNDS AND CAPITAL MARKET RISK REPORT • 2017 85
Chart 59Subscribed capital, paid-up capital and capital allocations of venture and private capital funds
0
50
100
150
200
250
300
0
50
100
150
200
250
300
2011 2012 2013 2014 2015 2016
HUF Billions HUF Billions
Capital allocationPaid-up capital
Subscribed capital
Source: MNB.

INSURANCE, FUNDS AND CAPITAL MARKET RISK REPORT • 201786
6 Glossary
a Debt securities: bonds, treasury bills, certificates of deposit, fund certificates, dedicated proprietary shares, fixed amount deposits, mortgage bonds, bills of lading, warehouse warrants, delivery slips, certificates of pledge, compensation vouchers and mutual fund shares issued by fixed term mutual funds
b club Med: Greece, Spain, Italy and Portugal
c Solvency II: contrary to the previous, rule-based capital requirement (Solvency I), it introduces complex, risk-based capital requirement and risk-based oversight rules at European level, thereby enforcing a risk-based approach in the entire set of requirements.
d Day1: the start date of S2 on 1 January 2016
e Portfolio premium: the premium of all insurance contracts valid in a specific period
f the Herfindahl–Hirschman Index is a measure of the market concentration. the value of the HHI is the sum obtained by squaring the percentage market share of the insurers operating in a market, and then adding the resulting numbers. the calculation of the market share is based on the gross premium income of insurances.
g actuarial reserve: includes the following reserve types: life insurance and health insurance premium reserve, accident insurance and liability insurance annuity reserve. It must calculated and recognised as the difference of the present values, relevant for the time of the reserve recognition, of the future expenditures and revenues from the contract. Reserves of unit-linked life insurances: the net asset value of the asset funds, reported to the contracting parties, reduced by the assets withheld to cover the incurred costs, as stipulated in the product schedule
h Insurance premium payment frequency: Single or regular premium contracts.
i top-up premium: top-up premium linked with the single premium contracts
j Earned premium: part of the premium income that is due to the insurer during the accounting period.
k combined ratio: the quotient of the average gross claim and the cost per contract, and the average gross earned premium and the yield per contract
l Surrender profit: the profit realised upon the surrender of contracts.
m Matching rule: When using indirect investment instruments, it must be ensured that the investment costs indirectly incurred for fund member – relative to the costs incurred by direct investments – are in line with the asset management costs.
n cSDR: Regulation 909/2014/Eu of the European Parliament and of the council on improving securities settlement in the European union and on central securities depositories and amending Directives 98/26/Ec and 2014/65/Eu and Regulation 236/2012/Eu.
o MiFID II (Markets in Financial Instruments Directive) Directive 2014/65/Eu of the European Parliament and council on markets in financial instruments. MiFIR (Markets in Financial Instruments Regulation) Regulation

GLOSSaRy
INSURANCE, FUNDS AND CAPITAL MARKET RISK REPORT • 2017 87
of the European Parliament and the council (Eu) No 600/2014 on markets in financial instruments and amending Regulation (Eu) No 648/2012.
p EMIR (European Market Infrastructure Regulation) is the Resolution No 648/2012/Eu of the European Parliament and council on Otc derivatives, central counterparties and trade repositories.
q SREP (Supervisory Review and Evaluation Process): according to international and Hungarian regulations it means the control and evaluation by the MNB of the business model, corporate governance, risk profile and capital and liquidity position of institutions.
r a PRIIPS (Packaged Retail and Insurance-based Investment Products) Regulation 1286/2014/Eu of the European Parliament and the council on key Information Documents for Packaged Retail and Insurance-based Investment Products.

1 RISK OUTLOOK FOR NON-BANK FINANCIAL SECTORS • 2015 JUNE
Sigismund of Luxemburg(1387–1437)
King of Hungary with the longest reign in the Medieval Age, moreover King of Germany, King of Bohemia, Holy Roman Emperor, Sigismund was the most respected figure of contemporary Europe. His reign of half a century in Hungary can be divided into two parts. The first period was a time of overcoming disturbances following succession to the throne and the dealing with an increasing Turkish threat, while the second period can be regarded as nearly four decades of stability.
Sigismund changed power relations between the ruler and the barons by giving castles and lands, and was compelled to accept the dominance of leagues of barons. The king’s court was the centre of culture in the time of his predecessors; thereafter the courts of barons had equally high influence on the culture and politics of the kingdom.
The king gathered the nobility into the Order of the Dragon, and practically left governance with them, he rather dealt with his ambitious plans of foreign policy. Governance in Hungary was solid, which is best shown by the fact that the king could be absent for many years attending to business in the other countries throughout Europe, without triggering any political disturbances within the kingdom.
His era was a turning point in the foreign relations of Hungary: the regionally dominant Hungary became threatened by the Ottoman Turks, and after a series of unsuccessful campaigns it was clear to everyone that the kingdom must resort to a defensive stance, this is why Sigismund decided to strengthen the southern line of border castles to ensure that the country can defend itself from the Turks. He entered into prolonged wars with the Republic of Venice over the domination of Dalmatia, and fought against the Hussites in Bohemia.Sigismund was a reformist, which originated from a new way of thinking: institutions and systems can be changed and modified. In this spirit, the king founded a university in Óbuda; ensured the right of patronage of Hungarian nobles; introduced a standard unit of weight, length and volume; cities developed at a high pace during his reign; and he granted all peasants the right of free movement. He made Buda the centre of his empire, and rebuilt the castle to make it royal residence of European renown. Sigismund was a politician who was thinking above nations in the contemporary sense, capable of taking regional interests aside and focus on efforts that are in the best interest of the whole of Christianity, as he did at the Council of Constance on the Western Schism. He could ingeniously turn his personal traits to his advantage in diplomatic affairs and on negotiations relating to strategic decisions. He had a good eye to choose colleagues, he drew accurate conclusions from the disorders the kingdom experienced early on his reign, and later succeeded in earning the full support of dominant political figures of the country.
In the last year of his reign a peasant revolt erupted in Transylvania. The nobility joined its forces against the peasantry, which led to the alliance of Hungarians, Székelys and Saxons, hence laying the basis of a later political organisation of Transylvania.
Dying without a male successor and a chaotic period coming after his death, Sigismund’s heritage slowly faded into oblivion in the national remembrance; however, he was not only a notable king of Hungary, but also an Emperor with an integrating force and ruler of great deeds influencing history.

INSURANCE, FUNDS AND CAPITAL MARKET RISK REPORT • 2017 89
INSURANCE, FUNDS AND CAPITAL MARKET RISK REPORT
2017
Print: Prospektus–SPL consortium
H-8200 Veszprém, tartu u. 6.

H-1054 BUDAPEST, SZABADSÁG TÉR 9. 177
AND CAPITAL MARKET R I S K R E P O R T
INSURANCE, FUNDS