institutional analysis report for pei botswana · 8 executive summary the undp‐unep...
TRANSCRIPT
1
Draft Institutional Analysis Report for PEI Botswana
September 2009
2
CONTENTS EXECUTIVE SUMMARY............................................................................................................................. 8
1. INTRODUCTION ................................................................................................................................. 10
1.1. The UNDP‐UNEP Poverty Environment Initiative...................................................................... 10
1.2. Scope of the Institutional Analysis ............................................................................................ 10
1.3. Structure of the Report ............................................................................................................. 11
2. OVERVIEW OF THE POVERTY‐ENVIRONMENT SITUATION IN BOTSWANA ....................................... 12
2.1. The Economy.............................................................................................................................. 12
2.2. Socioeconomic Situation............................................................................................................ 13
2.3. STATE OF THE ENVIRONMENT ................................................................................................... 14
2.3.1 Climate and Climate Change................................................................................................ 14
2.3.2. Water .................................................................................................................................. 15
2.3.3. Land ............................................................................................................................... 15
2.3.4. Fisheries......................................................................................................................... 16
2.3.5. Energy............................................................................................................................ 16
2.3.6. Minerals and Geology.................................................................................................... 16
2.3.7. Environmental Disasters................................................................................................ 16
2.4. POVERTY, ENVIRONMENT AND GROWTH IN BOTSWANA‐ MAKING THE LINK ........................ 16
2.4.1. Growth and Poverty Challenges .................................................................................... 16
2.4.2. Delivering Growth and Poverty Reduction by Investing in the Environment..................... 17
3.1. Vision 2016................................................................................................................................. 20
3.1.1. Key Objectives of the Vision ............................................................................................... 20
3.1.2. Institutional Ownership and Implementation .................................................................... 20
3.1.3. Coverage of Poverty‐ Environment Linkages...................................................................... 20
3.1.4. PEI Challenges and Opportunities for PEI...................................................................... 20
3.2. National Development Plan 10 (NDP10).................................................................................... 21
3.2.1. Key Objectives of NDP 10 .............................................................................................. 21
3.2.2. Institutional Ownership and Implementation............................................................... 21
3.2.3. Coverage of Poverty Environment Linkages.................................................................. 21
3.2.4. Challenges and Opportunities for PEI............................................................................ 22
3.3. National Strategy for Poverty Reduction (NSPR) 2003 .............................................................. 22
3.3.1. Key Objectives of NSPR....................................................................................................... 22
3.3.2. Institutional Ownership and Implementation............................................................... 22
3.3.3. Coverage of Poverty‐Environment Linkages....................................................................... 23
3.3.4. PEI ‐ Challenges and Opportunities .................................................................................... 23
3.4. The National Strategy for Sustainable Development (NSSD)..................................................... 23
3.5. The National Budget .................................................................................................................. 23
3
3.5.1. Overview of Sector Allocations by Ministry for 2009 ......................................................... 24
3.5.2. Overview of the Budget Process......................................................................................... 24
3.5.3. Overview of Policy Making and Review Process................................................................. 24
3.5.4. General Budget and Policy Challenges for PEI.................................................................... 25
4. REVIEW AND ANALYSIS OF KEY POLICIES WITH PE FOCUS........................................................... 25
4.1. Overview Summarizing Policies with PE Focus: ........................................................................ 25
4.1.1. Summary Table of Policies with PE Based Analysis ............................................................ 26
5.1. Overview and Structure of the Government of Botswana (GoB) .............................................. 35
5.1.1. Central Government Administrative Structure .................................................................. 37
5.1.2. International Links .............................................................................................................. 37
5.2. KEY PEI SECTOR MINISTRIES AND PARASTATALS ........................................................................... 37
5.2.1. Office of the President ............................................................................................................ 37
5.2.1.1. National Disaster Management Office ............................................................................ 38
5.2.1.2. NDMO ‐ PE Challenges and Opportunities ...................................................................... 38
5.2.2.1. The Government Implementation Coordination Office (GICO)....................................... 38
5.3.1. The Ministry of Finance and Development Planning (MFDP)................................................. 39
5.3.1.1. Economic and Financial Policy Division (EFPD)................................................................ 40
5.3.2.1. Food and Poverty Policy Coordination Section (FPPCS) .................................................. 41
5.3.3. The Central Statistics Office (CSO) .......................................................................................... 43
5.3.3.1. CSO – PEI Challenges and Opportunities ......................................................................... 44
5.3.4. The Ministry of Environment, Wildlife and Tourism (MEWT)................................................. 44
5.3.4.1. The Department of Meteorological Services (DMS)........................................................ 46
5.3.4.2. DMS‐ PE Challenges and Opportunities........................................................................... 46
5.3.5.1 Department of Environmental Affairs (DEA) .................................................................... 46
5.3.5.2 DEA – PE Challenges and Opportunities ........................................................................... 47
5.3.6.1. Department of Waste Management and Pollution Control (DWMPC) ............................... 48
5.3.7.1. Department of Forestry and Range Resources (DFRR) ........................................................ 48
5.3.7.2. DFRR – PE Challenges and Opportunities ........................................................................ 49
5.3.8.1. Department of Wildlife and National Parks (DWNP)....................................................... 49
5.3.9.1. Department of Tourism (DOT)......................................................................................... 50
5.4.1. Ministry of Agriculture (MoA) ................................................................................................. 51
5.4.1.1. Department of Crop Production (DCP)............................................................................ 52
5.4.1.2. Department Animal Health and Production (DAP).......................................................... 54
5.4.1.3. Department of Veterinary Services (DVS) ....................................................................... 55
5.4.1.4. Department of Extension Services (DES) ......................................................................... 55
5.4.1.5. Department of Agricultural Research (DAR).................................................................... 55
5.5.1. Ministry of Local Government (MOLG)................................................................................... 56
4
5.5.1.1. The Department of Local Government and Development Planning (DLGDP)................. 56
5.5.2.1. The Department of Social Services (DSS)......................................................................... 57
5.6.1. Ministry of Minerals, Energy and Water Resources (MMEWR).............................................. 57
5.6.1.1. The Department of Water Affairs (DWA) ........................................................................ 58
5.6.2.1. The Energy Affairs Division (EAD) .................................................................................... 60
5.6.3.1. Department of Mines (DOM)............................................................................................... 60
5.6.3.2. DOM – PE Challenges and Opportunities ........................................................................ 61
5.7.1. Ministry of Health (MOH) ....................................................................................................... 61
5.7.1.1. Department of Public Health‐ Environmental Health (DEH) ........................................... 61
5.8.1. Ministry of Lands and Housing (MOLH) .................................................................................. 62
5.8.2. MOLH ‐ PE Challenges and Opportunities .......................................................................... 62
5.8.1.1. Department of Land Board Services (DLBS)..................................................................... 62
5.9.1. Ministry of Trade and Industry (MOTI) ................................................................................... 63
5.9.1.2. MOTI – PE Challenges and Opportunities........................................................................ 64
5.10.1. Ministry of Education (MOE)................................................................................................. 64
6.1. Water Utilities Corporation........................................................................................................ 65
6.1.1. WUC ‐ PE Challenges and Opportunities................................................................................. 66
6.2. Botswana Power Corporation (BPC) .......................................................................................... 66
6.2.1. BPC – PE Challenges and Opportunities ............................................................................. 67
6.3. Botswana Tourism Board (BTB) ................................................................................................. 67
6.3.1. BTB ‐ PE Challenges and Opportunities .............................................................................. 68
7. REVIEW & ANALYSIS OF LOCAL GOVERNMENT INSTITUTIONS .................................................... 68
7.1. The Overview of Local Government in Botswana ..................................................................... 68
7.1.1. The Administrative Setting ............................................................................................ 68
7.1.2. The District Council ............................................................................................................. 69
7.1.3. The Land Board ................................................................................................................... 69
7.1.4. The Department of Tribal Administration .......................................................................... 69
7.1.5. The Department of District Administration and Food Relief Services................................ 69
7.2. The District Development Planning Process .............................................................................. 69
7.2.1. PE Links and Mainstreaming............................................................................................... 70
7.3. KEY DISTRICT TEAMS ...................................................................................................................... 70
7.3.1. Objectives ........................................................................................................................... 70
7.3.1. Organization ....................................................................................................................... 70
7.3.2. PE Interface......................................................................................................................... 70
8. REVIEW & ANALYSIS OF NON‐GOVERNMENT INSTITUTIONS ........................................................... 72
8.1. The Botswana Parliament .......................................................................................................... 72
8.2. Civil Society ................................................................................................................................ 72
5
8.2.1. The Botswana Council of Non‐Governmental Organizations (BOCONGO) ........................ 72
8.2.2. The Kgalagadi Conservation Society (KCS).......................................................................... 73
8.2.3. Somarelang Tikologo (ST) ................................................................................................... 73
8.3. UN Agencies: UNDP, FAO, UNEP,............................................................................................... 74
8.3.1. UNDP: Environment Office ................................................................................................. 74
8.3.2. Global Environmental Facility (GEF) ................................................................................... 75
8.3.3. United Nations Population Fund (UNFPA).......................................................................... 75
8.3.4. Food Agriculture Organization (FAO) ................................................................................. 75
8.3.4. Donors: EC, World Bank...................................................................................................... 75
8.4. Research Institutions: UB, BIDPA ............................................................................................... 76
8.4.1. Department of Environmental Science, University of Botswana ....................................... 76
8.4.1.1. PE Interface...................................................................................................................... 77
8.4.2. The Botswana Institute of Development Policy Analysis (BIDPA) ...................................... 77
8.4.1. Media .................................................................................................................................. 77
9.1. Government Development Expenditure Analysis by Sector..........Error! Bookmark not defined.
9.2. Findings from Development Expenditure Analysis by Sector .................................................... 78
9.3. PE Challenge and Opportunity ................................................................................................... 80
9.4. Key Conclusions of the Institutional Analysis............................................................................. 80
REFERENCES ...................................................................................................................................... 82
Annex 1: Interviewees:...................................................................................................................... 83
Annex 2: Botswana: Facts and Figures on Environment and Natural Resources ............................. 84
6
LIST OF ABBREVIATION AND ACRONYMS
ABS Access and Benefit Sharing ADB African Development Bank AG Attorney General AIDS Acquired Immune Deficiency Syndrome AU African Union BCL Bamangwato Concessions Limited BIAC Botswana Institute of Administration and Commerce BIDPA Botswana Institute of Development Policy Analysis BoB Bank of Botswana BOCONGO Botswana Council of Non Governmental Organizations BOBS Botswana Bureau of Standards BPC Botswana Power Corporation BTB Botswana Tourism Board CAB Cabinet Memorandum CAR Centre of Applied Research CBNRM Community Based Natural Resource Management CBO Community Based Organization CBD Convention on Biodiversity CC Climate Change CCF Community Conservation Fund CITES Convention on International Trade in Endangered Species CSO Central Statistics Office DAR Department of Agricultural Research DEA Department of Environmental Affairs DEH Department of Environmental Health DES Department of Extension Services DDP District Development Plan DFRR Department of Forestry and Range Resources DMS Department of Meteorological Services DOT Department of Tourism DWA Department of Water Affairs DWMPC Department of Waste Management and Pollution Control DWNP Department of Wildlife and National Parks EAD Energy Affairs Division EE Environmental Education EC European Community EIA Environmental Impact Assessment EMA Environmental Management Act EMB Environment Management Bill ESP Environmental Support Group ESU Environmental Statistical Unit EU European Union EWTC Early Warning Technical Committee FAO Food and Agricultural Organisation GDP Gross Domestic Product GEF Global Environmental Facility GIS Geographical Information System GoB Government of Botswana GICO Government Implementation and Coordination Office HCW Health Care Waste HIES Household Income Expenditure Survey HIV Human Immunodeficiency Virus HOORC Harry Oppenheimer Okavango Research Centre
7
IMDC Interministerial Drought Committee IMF International Monetary Fund IPCC Intergovernmental Panel on Climate Change ISPAAD Integrated Support for Arable Agriculture Development KPP Key Policy Papers KCS Kgalagadi Conservation Society LFS Labour Force Survey LIMID Livestock Management and Infrastructure Development LS Literacy Survey MEWT Ministry of Environment, Wildlife and Tourism MFDP Ministry of Finance and Development Planning MMEWR Ministry of Minerals, Energy and water Resources MOA Ministry of Agriculture MOE Ministry of Education MOH Ministry of Health MOLG Ministry of Local Government MOTI Ministry of Trade and Industry MSCPR Multi Sectoral Committee of Poverty Reduction NAP National Action Plan NES National Export Strategy NGO Non Governmental Organization NPAD National Policy on Agricultural Development NCS National Conservation Strategy NDMO National Disaster Management Office NDP National Development Plan NRTC Natural Resources Technical Committee NFS‐MG National Food Strategy Monitoring Group NSPR National Strategy for Poverty Reduction NSWCPU North South Water Carrier Project Unit ODMP Okavango Delta Management Plan OP Office of the President PE Poverty Environment PEI Poverty Environment Initiative RDC Rural Development Council RECC Rural Extension Coordinating Committee SADC Southern African Development Community SACU Southern African Customs Union SKIPs Sectoral Keynote Issue Papers SEA Strategic Environmental Assessment SSNs Social Safety Nets ST Somarelang Tikologo TAC Technical Advisory Committee TGLP Tribal Grazing Lands Policy TOR Terms of Reference UB University of Botswana UDP Urban Development Plan UNDP United Nations Development Programme UNEP United Nations Environment Programme UNFCC United Nations Forum on Climate Change UNFPA United Nations Population Fund UNWTO United Nations World Tourism Organization USD United States Dollars WHO World Health organization WTO World Trade organization WUC Water Utilities Corporation
8
EXECUTIVE SUMMARY The UNDP‐UNEP Poverty‐Environment Initiative (PEI) is a programme aimed at strengthening capacity of Governments to integrate environmental sustainability as a core objective in development planning and implementation. The programme in Africa is currently being implemented in nine countries: Kenya, Mali, Malawi, Mauritania, Mozambique, Rwanda, Tanzania, Uganda, and in Burkina Faso the preparatory phase of PEI is on‐going. The programme in Botswana is at the preparatory phase and it is expected that the actual programme itself will be implemented in 2010 in conjunction with National Development Plan (NDP) 10.
The PEI will help to mainstream environmentally sustainable natural resources use into Botswana’s plans, policies, programmes and projects at all levels so as to reduce environmental degradation, improve food security, reduce vulnerability to natural disasters and to reduce poverty.
Detailed consultations were under‐taken with key decision makers and policy makers from sector ministries relevant for the study in order to identify key poverty and environment (PE) issues, priority needs and to guide the scope of the PEI programme in Botswana. The following key findings emerged from the institutional analysis: • PE issues are covered in a fragmented way in Vision 2016 and other key plans, policies and strategies. • Responsibility for PE issues is fragmented and spread across a range of sectors making inter‐ministerial coordination difficult. • Existing structures, mechanisms and processes for implementing and coordinating issues that are cross cutting need to be strengthened and capacitated to improve their ability to champion and lead PE issues. • Contradictions and duplication when it comes to remits between ministries need to be harmonized. • Little emphasis on environmental education hampers efforts to promote understanding, awareness, and advocacy for making environmental investments. • Appropriate tools are not consistently used meaning that environmental investments are given low priority. • Civil society with potentially good capacity is fragmented and not united on interventions on PE in policies and plans and under resourced. • There is limited dialogue on PE issues across government and society generally and stories in the media tend to be alarmist spelling doom and gloom scenarios. This report indicates challenges and opportunities for better management of PE issues and identifies areas for potential PEI support. The following broad themes have been identified as potential areas for PEI support based on the stakeholder assessment: • Support for increased evidence, awareness and advocacy on the role of environment in delivering poverty reduction and economic growth; • Support for improved integration of PE issues in key plans and policies and harmonization of approaches across Government institutions; and • Increased capacity for budgeting and financing PE related policies and programmes and for Monitoring and Evaluating the impact of such interventions. Examples of areas for potential support could include: • Support to the Office of the President (OP), Government Implementation Coordination Office (GICO), Ministry of Finance and Development Planning (MFDP), Ministry of Environment, Wildlife and Tourism (MEWT), Ministry of Minerals, Energy and Water Resources (MMEWR), Ministry of Trade and Industry and Pastatals for improved coordination of development and environment linkages

9
• Strengthening of the Rural Development Council (RDC), its Technical Committees and the Agriculture and Environment Parliamentary Committee to improve their effectiveness • Support for the National Coordinating Committee on Climate Change led by the Department of Meteorological Services (DMS) to ensure that climate change is recognized as a key development issue rather than just an environment issue • Advocacy and facilitating political leadership and commitment of environmental issues • Strengthening the role of civil society organizations in environmental issues • Support to increase community awareness, involvement and capacity in dealing with environmental issues and problems • Support for analytical work that will provide evidence on the contribution of the environment and natural resources to growth and poverty reduction and the likely costs and benefits of measures to tackle environmental degradation • Scope for PEI outputs to contribute towards preparation of the National Strategy for Sustainable Development (NSSD) • Support to strengthen integration of sustainable land and water conservation approaches in key agricultural plans & programmes e.g. Integrated Support for Arable Agricultural Development (ISPAAD), the Livestock Infrastructure and Development Program (LIMID) and the National Master Plan for Arable Agriculture and Dairy Development (NAMPAADD) so that they contribute to increased agricultural productivity for subsistence and commercial farmers This analysis notes that there already exist a number of existing institutional structures and systems with a remit to tackle PE issues and, although some are operating at suboptimal levels, wherever possible these offer a framework and entry points within which to target support.
10
1. INTRODUCTION
1.1. The UNDP‐UNEP Poverty Environment Initiative The poor in Botswana are most directly dependent on environmental resources such as land and water, and they are the ones who suffer the most when the environment is degraded. For example, soil erosion reduces agricultural productivity and incomes; water pollution causes serious illness and death. Yet, despite their critical importance, environmental assets such as forests and vegetation cover continue to be degraded at an alarming rate. A significant factor in this continuing degradation is that the links between environment and poverty are not currently adequately reflected in national and sectoral development processes such as NDP10.
The UNDP‐UNEP Poverty‐Environment Initiative (PEI) provides support to countries to mainstream environmentally sustainability natural resource management into national and sectoral development processes. Such mainstreaming will ensure that poverty reduction is not undermined by the unsustainable use of natural resources.
The UNDP‐UNEP PEI supports governments to: • Include environmental sustainability as a core objective in development planning & implementation so that poverty reduction and other economic development objectives are not undermined by the unsustainable use of natural resources. • Build capacity so that decision‐makers know: how environmental sustainability contributes to development and how to include environmental sustainability in development planning and implementation The focus of PEI country programmes is thus on integrating environmentally sustainable natural resource use into national and sectoral development processes and budgets and on capacity building at the national and sectoral level. While PEI sometimes funds small demonstration projects, the programme does not directly support large scale on the ground programmes such as forestry programmes or soil erosion control programmes. Rather, it is aimed at helping government to integrate sustainable natural resource management into national and sectoral development plans so that government ministries include and better fund such programmes, including from increased donor support.
Background information on the UNDP‐UNEP PEI and the various aspects of the planning processes at country level can be found on the PEI website at http://www.unpei.org.
The UNDP‐UNEP Poverty Environment Initiative (PEI) will support the Government of Botswana in its goals to promote diversified economic growth and poverty reduction by integrating environmentally sustainable natural resource use as a core objective in development planning and implementation, and to build capacity so that decision makers better understand how environmental sustainability contributes to development and how to achieve this in development planning and implementation. It should be noted that efforts to mainstream of environment strategies in Botswana began as early as National Development Plan (NDP) 6‐7 in 1990. For example, the National Conservation Strategy was implemented in 1990. Yet, there still remain some challenges such as the fragmentation of PE issues across sectors amongst others, which mean that PE mainstreaming still needs to be addressed.
1.2. Scope of the Institutional Analysis In order to inform the design of the PEI Botswana programme the Government of Botswana (GoB), UNDP and UNEP committed to undertake an institutional analysis to better understand the dynamics of environmental and development issues in Botswana. This involved meetings with a range of stakeholders across
11
Government, civil society, private sector and the donors (see Annex 2 for details of stakeholders interviewed) as well as review of key documents. The stakeholder analysis was aimed at:
• Providing an assessment of the local context in terms of economic and environmental issues, policy and planning frameworks, political drivers, key institutions, governance processes and actors. • Providing an understanding of the “Machinery of Government” (how the government makes its decisions) relevant to PEI objectives, e.g. Government development policy and planning processes at the national and sectoral levels related to natural resources and environment including identification of links or lack of them between institutions. • Identifying and analyzing institutional incentives, opportunities and obstacles that influence reform in the way environment and natural resources are managed, taking into account the range of relevant institutions; legislation, policies and plans and key stakeholders. • Identifying potential Government, Civil society, private sector, media and donor “champions” for improved integration of sustainable natural resources management. • Identifying possible entry point for the PEI in Botswana at the national and sectoral levels.
1.3. Structure of the Report This report provides an assessment of key government institutions, the private sector, and civil society in the area of development, environment and natural resources management. It identifies their roles, mandates and policies. It also highlights their challenges and areas requiring support and action to address them. Based on this assessment, the report provides recommendations with regards to the areas for potential PEI support. These areas have to be further analyzed and prioritized in order to develop a plan for PEI in Botswana. A synthesis of the key issues arising from the analysis and suggested areas for PEI engagement in Botswana is presented in the Executive Summary.
12
2. OVERVIEW OF THE POVERTY‐ENVIRONMENT SITUATION IN BOTSWANA
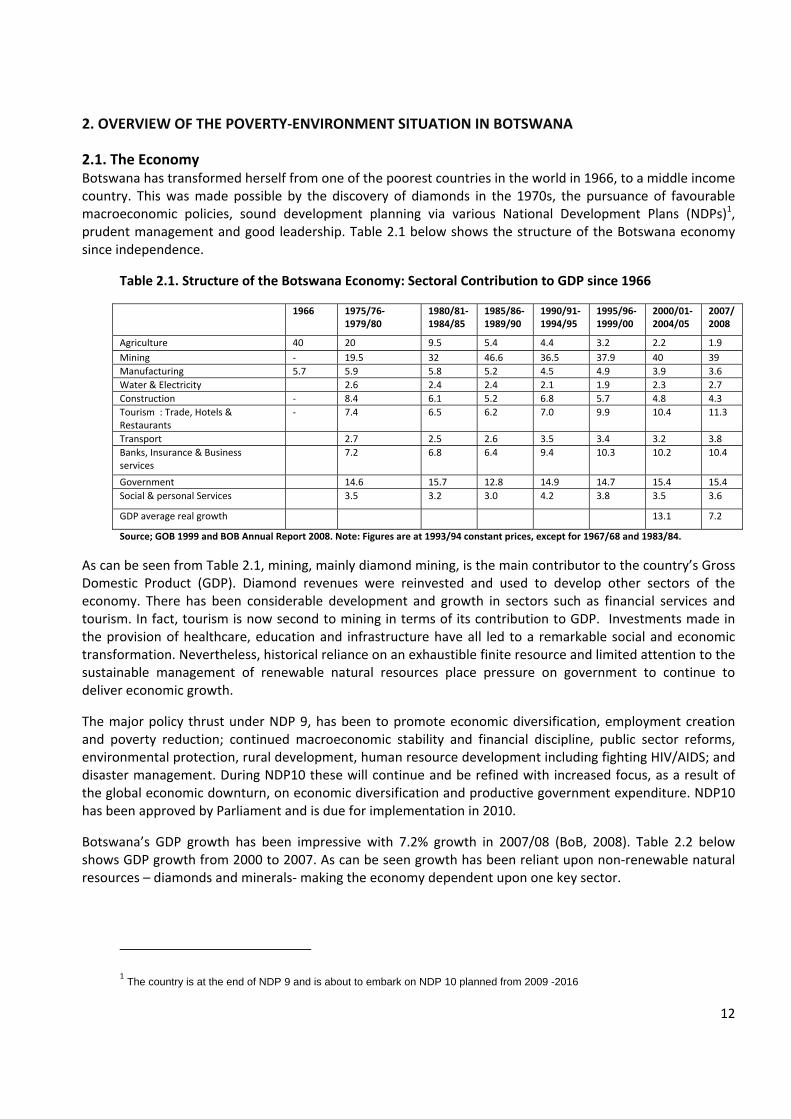
2.1. The Economy Botswana has transformed herself from one of the poorest countries in the world in 1966, to a middle income country. This was made possible by the discovery of diamonds in the 1970s, the pursuance of favourable macroeconomic policies, sound development planning via various National Development Plans (NDPs)1, prudent management and good leadership. Table 2.1 below shows the structure of the Botswana economy since independence.
Table 2.1. Structure of the Botswana Economy: Sectoral Contribution to GDP since 1966
Source; GOB 1999 and BOB Annual Report 2008. Note: Figures are at 1993/94 constant prices, except for 1967/68 and 1983/84.
As can be seen from Table 2.1, mining, mainly diamond mining, is the main contributor to the country’s Gross Domestic Product (GDP). Diamond revenues were reinvested and used to develop other sectors of the economy. There has been considerable development and growth in sectors such as financial services and tourism. In fact, tourism is now second to mining in terms of its contribution to GDP. Investments made in the provision of healthcare, education and infrastructure have all led to a remarkable social and economic transformation. Nevertheless, historical reliance on an exhaustible finite resource and limited attention to the sustainable management of renewable natural resources place pressure on government to continue to deliver economic growth.
The major policy thrust under NDP 9, has been to promote economic diversification, employment creation and poverty reduction; continued macroeconomic stability and financial discipline, public sector reforms, environmental protection, rural development, human resource development including fighting HIV/AIDS; and disaster management. During NDP10 these will continue and be refined with increased focus, as a result of the global economic downturn, on economic diversification and productive government expenditure. NDP10 has been approved by Parliament and is due for implementation in 2010.
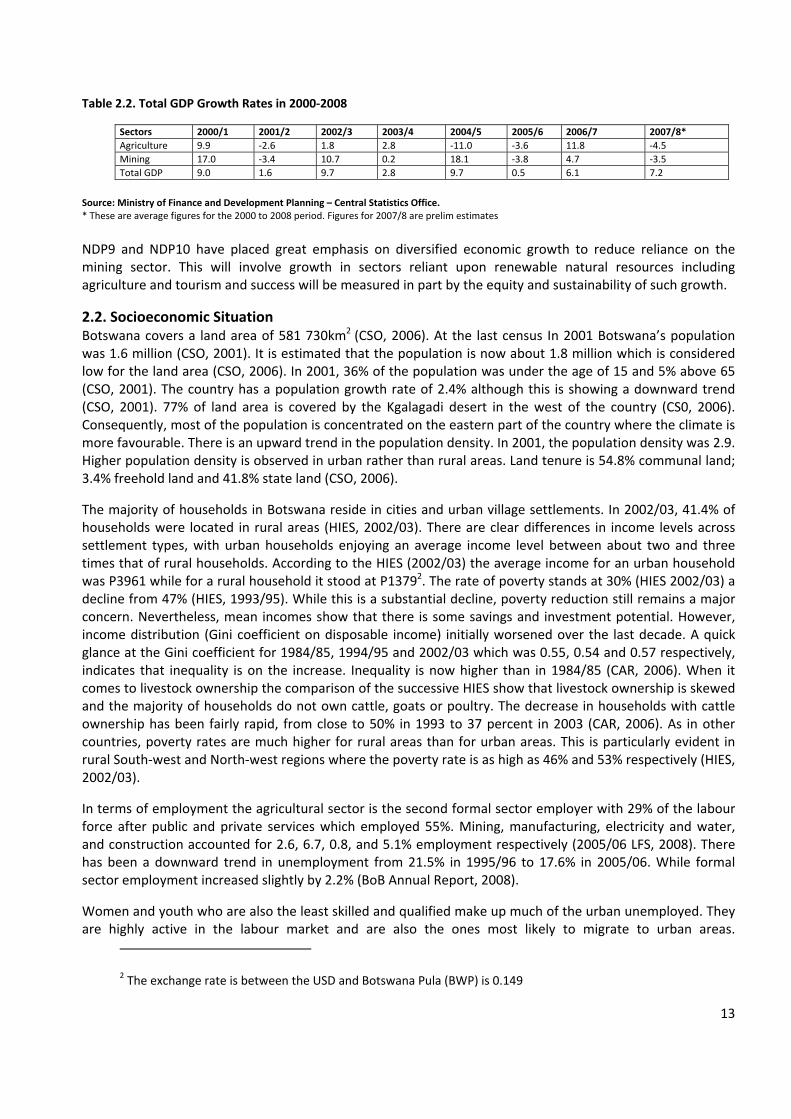
Botswana’s GDP growth has been impressive with 7.2% growth in 2007/08 (BoB, 2008). Table 2.2 below shows GDP growth from 2000 to 2007. As can be seen growth has been reliant upon non‐renewable natural resources – diamonds and minerals‐ making the economy dependent upon one key sector.
1 The country is at the end of NDP 9 and is about to embark on NDP 10 planned from 2009 -2016
1966 1975/76‐1979/80
1980/81‐ 1984/85
1985/86‐ 1989/90
1990/91‐ 1994/95
1995/96‐ 1999/00
2000/01‐ 2004/05
2007/ 2008
Agriculture 40 20 9.5 5.4 4.4 3.2 2.2 1.9 Mining ‐ 19.5 32 46.6 36.5 37.9 40 39 Manufacturing 5.7 5.9 5.8 5.2 4.5 4.9 3.9 3.6 Water & Electricity 2.6 2.4 2.4 2.1 1.9 2.3 2.7 Construction ‐ 8.4 6.1 5.2 6.8 5.7 4.8 4.3 Tourism : Trade, Hotels & Restaurants
‐ 7.4 6.5 6.2 7.0 9.9 10.4 11.3
Transport 2.7 2.5 2.6 3.5 3.4 3.2 3.8 Banks, Insurance & Business services
7.2 6.8 6.4 9.4 10.3 10.2 10.4
Government 14.6 15.7 12.8 14.9 14.7 15.4 15.4 Social & personal Services 3.5 3.2 3.0 4.2 3.8 3.5 3.6
GDP average real growth 13.1 7.2
13
Table 2.2. Total GDP Growth Rates in 2000‐2008
Sectors 2000/1 2001/2 2002/3 2003/4 2004/5 2005/6 2006/7 2007/8* Agriculture 9.9 ‐2.6 1.8 2.8 ‐11.0 ‐3.6 11.8 ‐4.5 Mining 17.0 ‐3.4 10.7 0.2 18.1 ‐3.8 4.7 ‐3.5 Total GDP 9.0 1.6 9.7 2.8 9.7 0.5 6.1 7.2
Source: Ministry of Finance and Development Planning – Central Statistics Office. * These are average figures for the 2000 to 2008 period. Figures for 2007/8 are prelim estimates
NDP9 and NDP10 have placed great emphasis on diversified economic growth to reduce reliance on the mining sector. This will involve growth in sectors reliant upon renewable natural resources including agriculture and tourism and success will be measured in part by the equity and sustainability of such growth.
2.2. Socioeconomic Situation Botswana covers a land area of 581 730km2 (CSO, 2006). At the last census In 2001 Botswana’s population was 1.6 million (CSO, 2001). It is estimated that the population is now about 1.8 million which is considered low for the land area (CSO, 2006). In 2001, 36% of the population was under the age of 15 and 5% above 65 (CSO, 2001). The country has a population growth rate of 2.4% although this is showing a downward trend (CSO, 2001). 77% of land area is covered by the Kgalagadi desert in the west of the country (CS0, 2006). Consequently, most of the population is concentrated on the eastern part of the country where the climate is more favourable. There is an upward trend in the population density. In 2001, the population density was 2.9. Higher population density is observed in urban rather than rural areas. Land tenure is 54.8% communal land; 3.4% freehold land and 41.8% state land (CSO, 2006).
The majority of households in Botswana reside in cities and urban village settlements. In 2002/03, 41.4% of households were located in rural areas (HIES, 2002/03). There are clear differences in income levels across settlement types, with urban households enjoying an average income level between about two and three times that of rural households. According to the HIES (2002/03) the average income for an urban household was P3961 while for a rural household it stood at P13792. The rate of poverty stands at 30% (HIES 2002/03) a decline from 47% (HIES, 1993/95). While this is a substantial decline, poverty reduction still remains a major concern. Nevertheless, mean incomes show that there is some savings and investment potential. However, income distribution (Gini coefficient on disposable income) initially worsened over the last decade. A quick glance at the Gini coefficient for 1984/85, 1994/95 and 2002/03 which was 0.55, 0.54 and 0.57 respectively, indicates that inequality is on the increase. Inequality is now higher than in 1984/85 (CAR, 2006). When it comes to livestock ownership the comparison of the successive HIES show that livestock ownership is skewed and the majority of households do not own cattle, goats or poultry. The decrease in households with cattle ownership has been fairly rapid, from close to 50% in 1993 to 37 percent in 2003 (CAR, 2006). As in other countries, poverty rates are much higher for rural areas than for urban areas. This is particularly evident in rural South‐west and North‐west regions where the poverty rate is as high as 46% and 53% respectively (HIES, 2002/03).
In terms of employment the agricultural sector is the second formal sector employer with 29% of the labour force after public and private services which employed 55%. Mining, manufacturing, electricity and water, and construction accounted for 2.6, 6.7, 0.8, and 5.1% employment respectively (2005/06 LFS, 2008). There has been a downward trend in unemployment from 21.5% in 1995/96 to 17.6% in 2005/06. While formal sector employment increased slightly by 2.2% (BoB Annual Report, 2008).
Women and youth who are also the least skilled and qualified make up much of the urban unemployed. They are highly active in the labour market and are also the ones most likely to migrate to urban areas.
2 The exchange rate is between the USD and Botswana Pula (BWP) is 0.149
14
Investments have been made in education to achieve gender parity between the male and female population so that both genders have similar access to job opportunities. Education attainment and gender equality, access to education in 2003 stood at 97.8% (Literacy Survey, 2003). The same survey shows that primary school completion rates exceed 80% and the transition from primary to secondary education is 98%. Male and female adult literacy is 80 and 81% respectively (Literacy Survey, 2003).
54% of the population resides in the urban areas and urbanization rate is fairly high at 3% (HIES, 2002/03). This places greater pressure on the environment and natural resources in terms of waste management, sanitation, water scarcity, pollution and depletion of natural resources in areas surrounding settlements in urban and rural areas. Nevertheless, urbanisation also presents a wide range of opportunities, including increased access to public and private services, such as health and education as well as the development of markets and enterprises in cities and towns.
It is estimated that 77 % of households in the country had access to adequate sanitation in 2001 (Botswana MDGR, 2004). But access is better in urban areas at 95% compared to 51% in rural areas (Botswana MDGR, 2004). The majority of households outside towns and cities use pit latrines and septic tanks which pose a threat to underground water sources. The management of waste differs between urban and rural areas. In the former, it is regularly and frequently collected while in the latter this is often not the case. Even where waste is collected disposal does not always occur in properly managed sites. Littering is widespread in settlements despite efforts to manage it through education campaigns.
In 2000, 97% of the population had access to potable water within a distance of 2.5km (CSO, 2006). Some disparities in access to water also exist between urban and rural areas. In 2000, 51% of urban households had access to running water in their homes or could collect it from a nearby stand pipe. In contrast, only 9% of rural households had piped water in their homes and 7% had no access to safe drinking water at all (Botswana MDGR, 2004). Cross subsidization is used to reduce the costs of water to low income households.
In terms of energy utilization the majority of households still rely on firewood as a source of fuel wood. There is a very high reliance on fuel wood for cooking in the rural areas. 77% of the rural population rely on this energy source while 23% of urban households also rely on fuel wood for cooking (CSO, 2006). This has resulted in the cutting down of trees on a large scale around towns and villages. Access to electricity is as low as 21% in the rural areas and as high as 63% in the urban areas (CSO, 2006). Most of the electricity consumed in the country is imported. Although there is awareness about renewable energy there is very little use of renewable technologies despite the abundance of solar energy in the country.
2.3. STATE OF THE ENVIRONMENT3
2.3.1 Climate and Climate Change Botswana’s climate is arid and semi‐arid, with low rainfall and high rates of evapotranspiration. Mean annual rainfall is 416 mm, ranging from 650 mm in the north east to 250 mm in the extreme southwest (CSO, 2006). Rainfall pattern has large temporal and spatial variations. Rain generally falls between October and March, but the pattern is highly irregular. Frequent droughts are characterized by conditions of low rainfall, high temperatures and elevated soil moisture stress (MEWT, 2006).
These conditions greatly diminish the ability of the agricultural sector to produce enough to meet the country’s food needs. Only about 5% of the country is suitable for agricultural crop production and less than
3 This section draws heavily from the First Communication to the UNFCC complied by the Meteorological Department, Botswana National Action programme to Combat Desertification, DEA, MEWT 2006 and Second Common Country Assessment for Botswana, UN System, 2007.
15
1% is cultivated (Draft ASPR, 2007). Most arable production takes place in the eastern region where rainfall and soil conditions are most favourable. The western region with the poorest soil and climatic conditions has the lowest level of production for all crops.
Drought affects the livelihoods of the majority of the population which is dependent on agriculture and the rural communities that depend on individual water sources that cannot withstand prolonged drought. Droughts have occurred in 2001‐03, 2005‐06 and 2007 (MFDP, 2008). The consequences of drought induced water stress adversely affects crop and livestock productivity as well as the condition of wildlife.
Botswana is vulnerable to climate variability and experiences some drought and flooding. The Intergovernmental Panel on Climate Change (IPCC) indicates that over the longer term Botswana will be affected significantly by climate change. This is likely to result in increased frequency and intensity of severe weather events including droughts and floods. Whilst climatic change modelling is subject to uncertainty a general synopsis for Southern Africa suggests that Botswana may, on average, experience up to 20% less rainfall each year and that average temperatures may rise by 1‐2 Celsius (MEWT, 2006).
2.3.2. Water Water demand is expected to grow from 120 million cubic metres in 1990 to 355 million cubic metres in 2020 due to population growth, improvements in living conditions and economic development (NDP 10, 2009). In 2003 water usage by sector stood at 37% for agriculture, 33% for households, 16% for mining with government usage at 6%, all the other sectors accounted for less than 3% each (MEWT, 2009). All rivers in Botswana apart from the Okavango and the Chobe are ephemeral. Since Botswana has a paucity of surface water the provision of a reliable water supply is costly. Dams have to be constructed to supply water to urban areas.
Ground water is an important water source especially for rural communities, because of the limited supply of surface water. Heavy reliance on ground water 80% in 2005 presents several challenges (MEWT, 2006). These include the protection of aquifers from pollution, the high cost of provision due to the depth at which water is available, high levels of salinity in some locations and the absence of precise knowledge with regards to the exact rate of recharge which makes estimation of future availability difficult. The augmentation of domestic water supply for the Gaborone area through the reuse of effluent is being investigated.
Despite the existing challenges Botswana has achieved high levels of potable water provision. Currently 97% of the population has access to potable water within a distance of 2.5km (MEWT, 2006). Cross subsidization is used to reduce the costs of water to low income households.
2.3.3. Land Botswana has three categories of land tenure. There is state land 41.8%, freehold 3.4% and tribal land 54.6% (CSO, 2006). State land is primarily used for national parks, forest reserves and urban settlements. Tribal land is used mainly for grazing, crop production, settlement, game reserves and as wildlife management areas. Freehold land is used for livestock farming and on a smaller scale for housing in urban areas. High priority is given to the conservation of natural resources in land allocation and this is reflect in the allocation of land to protected areas.
Land designated for arable farming is small due to the poor climate and agroecological conditions. Productivity levels are very low, at 200kg/ha on communal farms and 2500kg/ha on commercial farms (CSO, 2004). Consequently the country is a net importer of food. The agricultural sector is dominated by livestock farming. Livestock production accounts for more than 80% of agricultural GDP (MOA, 2007). In addition to its benefits in terms of employment and income generation, there have been some negative environmental impacts of the sector. Rangelands particularly in the eastern part of the country are overstocked and this has led to land degradation around watering points and settlements. Other factors such as low offtake rates and the frequent incidence of bushfires reduce the availability of forage.

16
Land is becoming increasing scarce and expensive in some areas. In areas in and around Gaborone this problem has manifested itself through the self allocation of land. More and more grazing land around Gaborone is being converted for residential purposes.
2.3.4. Fisheries Botswana fisheries are primarily in the Okavango Delta and Chobe areas. Some fishing also takes place in some ephemeral rivers. Fishing is mainly practiced by the poor communities and for subsistence. Fish catches in the Delta vary from 110 to 117 tonnes (DWNP, 2009). Two major species caught are Tilapia and Catfish but there is potential for other species to be caught as well. Increasingly dams and reservoirs are being managed to include productive fisheries and there is considerable scope to grow this economic activity.
2.3.5. Energy
The following energy sources are found in the country: electricity, petroleum products and coal and biomass in the form of fuel wood. Petroleum products contribute the largest form of energy supply at 38%, fuel wood 29% and coal 27%. Electricity 6% is imported while 0.98% of the energy supply is LPG (CSO, 2006).
2.3.6. Minerals and Geology The Botswana economy is mineral driven and owes its transformation and improved standards of living over the last four decades to the proper harnessing and investment of mineral revenues in various sectors. Nevertheless, mining has not been without its negative impact on the environment. Mining has led to high levels of sulphur dioxide emissions and in surface waters, high levels of pH, total dissolved solids, sulphates and nickel is discharged effluent at Selebi‐Phikwe Mine. In addition there are some abandoned mines around Francistown which pose safety risks and need rehabilitation.
2.3.7. Environmental Disasters Botswana experiences occasional flooding, veld fires, vector borne diseases such as malaria, diarrhoea and foot and mouth disease (FMD) outbreaks amongst livestock and the invasion of crop pests. For example, in 2008 there were 532 diarrhoeal deaths amongst children who were under five years of age caused by E. coli contamination of drinking water as a direct result of flooding. Table 14 in Annex 2 shows the frequency of FMD outbreaks from 2002 to 2007. Crops such as sorghum in Pandamatenga4 have also been subjected to quelea bird attacks.
2.4. POVERTY, ENVIRONMENT AND GROWTH IN BOTSWANA‐ MAKING THE LINK The environment is inextricably linked to and underpins goals to reduce poverty and promote economic growth and diversification. However the links are not always well understood. This section sets out some of the key poverty‐environment issues that decision‐makers in Botswana ought to take into account in developing policies, plans and budgets.
2.4.1. Growth and Poverty Challenges NDP 10 sets out ambitious targets to reach the Vision 2016 targets for growth and development in Botswana. It sets an overall GDP growth goal of 5.9% per annum with targets set in key sectors to assist in achieving this overall goal. For instance the agriculture sector aims to shift from current 15% to 50% self sufficiency in cereal production by 2016 (NDP 10, 2009). On poverty the Government aims to reduce the proportion of the 1.8 million Batswana from 30% in 2003 and eradicate poverty by 2016. This includes a wide range of activities
4 Pandamatenga is a commercial farming area in Northern Botswana

17
including tackling the 32% of the population which is malnourished (FAO, 2008)5, the 33% which does not have access to sanitation and the eradication of malaria; all by 2016 (NDP 10, 2009).
2.4.2. Delivering Growth and Poverty Reduction by Investing in the Environment Despite achieving middle income status Botswana faces problems of poverty, income inequality and unemployment. Poverty is more severe in rural areas, reaching 53% in the rural South West (CAR, 2006). The country has a Gini Coefficient of 57% (HIES, 2002/03). Ignoring environmental investments is likely to exacerbate the situation because the poor are mainly dependent on the environment for their livelihoods. Unemployment which stands at 17.2% (LFS, 2003) is also a problem. 57% of Batswana reside in urban areas and the rate of urbanization due to rural to urban migration is around 3% (HIES, 2002/03). Botswana faces some serious environmental challenges which, if ignored, may threaten realisation of the country’s goals to reduce poverty and promote economic growth and diversification. These include: ‐
Land and Rangeland Degradation – Agriculture’s contribution to GDP is 1.9% (BoB Annual Report, 2008) but this masks the fact that for 70% of the rural population it is the primary source of household income (MEWT, 2006). The NDP10 target has been set to raise production to meet 50% of the country’s cereal demand needs (NDP 10, 2009). However, yields for subsistence crop farmers are extremely low – some 200kg/ha compared to 2500 kg/ha for commercial farms (CSO, 2004). The causes are numerous and well documented including limited access to markets, finance and technologies but also environmental, including vulnerability to drought, land degradation and poor water resource management.
Meeting the NDP10 agriculture target presents the country with several environmental challenges. 69% of Botswana’s land suffers from degradation linked to deforestation and soil erosion and gulley erosion (MEWT, 2006). This has a detrimental impact upon agricultural productivity and food security with 29% of children underweight (FAO, 2008). Current solutions include the costly subsidisation of inputs such as fertilisers to mitigate the impacts of degradation and increase productivity. Future solutions to tackle the root causes of poor agricultural productivity and food insecurity should include analysis of investments in soil and vegetation conservation, land rehabilitation, water conservation and rain water harvesting, use of drought resistant crop varieties and review of sustainable carrying capacity of land for livestock. In addition, investments in fisheries (both subsistence and commercial) offer scope for pro‐poor growth and improved food security benefiting the poorest in society.
Water Resources Management ‐ as a nation Botswana is water stressed with limited water resources and an annual demand of 88M m3 (NWMP, 1991). Based upon a growth target of 5.9% it is estimated that water resources demand will increase by about 2% each year due to increased demands from agriculture and industry as well as population increase (NDP 10, 2009). There is however anecdotal evidence of aquifers already running dry in southern Botswana. Delivering sustainable and equitable access to water resources will be essential if NDP10 is to succeed and this will require investment in sustainable water resource management including demand management to reduce inefficient and wasteful use of water and systems to ensure access for the poorest in society. Planners must consider and build into development plans the multifunctional roles that new dams can play (for tourism, fisheries and agriculture) for a more results based contribution to economic diversification.
Biodiversity conservation and sustainable utilisation – the NDP10 target is to increase tourism’s contribution to GDP from 6% to 9% by 2016 (NDP10, 2009). This is crucial as it provides an additional avenue for economic diversification and poverty reduction by empowering communities through the CBNRM programme. Nevertheless, tourism is based on access to high quality ecosystems and biodiversity is under threat from increased tourist numbers due which may, if not properly managed, exceed the carrying capacity of popular
5 This figure is for 2005. The situation may have changed since then as a result of various social safety nets that have been implemented since then to support vulnerable groups.
18
tourist zones such as the Chobe Riverfront. The challenge is to manage increased volume in tourists so as not to exceed the sustainable carrying capacity. Managing the environment in a way that communities also benefit will go a long way to preserving ecosystems and biodiversity.
Access to Energy ‐ fuel wood is the primary energy source in 92% of rural households yet with increased rates of deforestation (0.9% per annum) and with 69% of Botswana’s land degraded the daily search for fuel wood can now take up to 3.3 hours and require a journey of 5.8km for women and children charged with sourcing fuel (MEWT, 2009). Firewood is also a major cause of indoor air pollution resulting in respiratory disease. Tackling issues of access to energy, poverty and deforestation are linked. Investments in activities which increase energy efficiency and access to cleaner energies will benefit the poor, reduce women and children’s workload and also reduce deforestation and land degradation.
Pollution and Waste Management – 57% of Batswana reside in urban areas and the rate of urbanization due to rural to urban migration is around 3% (HIES, 2002/03). Unemployment stands at 17% (Labour Force Survey, 2003). Urbanisation places increased pressure on provision of key services such as water supply, sanitation and waste management and, if these are insufficient, may increase risk of water or vector borne diseases. Investment prioritisation of key environmental services such as water and waste management services will be critical to reduce the burden of disease and to make both urban and rural communities clean, healthy and pleasant environments in which to work and live.
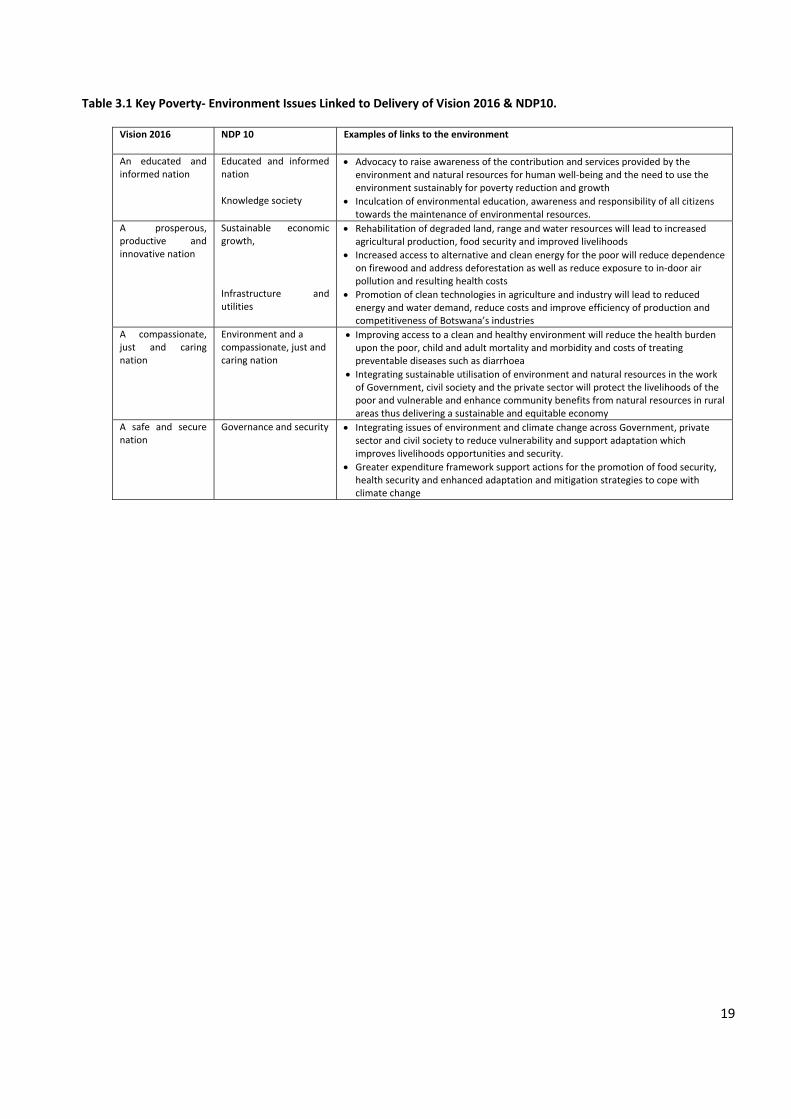
Changing Climate: A Threat to Botswana’s Prosperity The temporal and spatial patterns of rainfall and temperature in southern Africa are likely to change significantly and include up to 20% less rainfall by 2025 (MEWT, 2006). Already there is evidence that climate change is affecting Botswana ‐ malaria is now appearing in new areas including Ghantsi and Kgatleng and anthrax which poses a threat to the livestock industry is being found further south than ever before. In 2008 heavy rainfall led to 532 reported infant deaths from diarrhea due to poor sanitation (NDMO, 2009). The threat posed by climate change means that stresses caused by water scarcity and land degradation will worsen. Without doubt the poor and most vulnerable will be those most severely affected by climate change in Botswana. The challenge is therefore to ensure appropriate coordination and harmonization across Government to develop preparedness to tackle climate change through adaptation measures. Such measures could include use of drought resistant varieties in agriculture, risk reduction strategies to tackle malaria in the health sector and demand management to reduce wastage in the water sector. Convincing Skeptics: How to Prioritize the Environment in Policies and Budgets The issues raised above indicate how goals to tackle both economic growth and poverty reduction are linked to management of the environment. However evidence from across the world suggests that these links are not always understood and when Governments allocate budgets, investments in the environment are not always given a high priority. In Ghana, for instance, recent studies indicate that the costs of environmental degradation account for over 9% of GDP each year and lost production in the agricultural sector caused by land degradation is equal to 1.9% of GDP – which is more than the education budget (World Bank, 2007). Such analytical work can help decision‐makers to understand the links between environment, growth and poverty and accord higher priority to investments in the environment where they deliver growth and poverty reduction goals. PEI Botswana will aim to provide compelling evidence and strong analysis to convince policy and decision makers that investments in the environment which promote sustainable and pro‐poor growth should be prioritized. Table 3.1 below uses examples to demonstrate how environmental investments can help deliver Vision 2016 and NDP 10.
19
Table 3.1 Key Poverty‐ Environment Issues Linked to Delivery of Vision 2016 & NDP10.
Vision 2016 NDP 10 Examples of links to the environment
An educated and informed nation
Educated and informed nation
Knowledge society
• Advocacy to raise awareness of the contribution and services provided by the environment and natural resources for human well‐being and the need to use the environment sustainably for poverty reduction and growth
• Inculcation of environmental education, awareness and responsibility of all citizens towards the maintenance of environmental resources.
A prosperous, productive and innovative nation
Sustainable economic growth,
Infrastructure and utilities
• Rehabilitation of degraded land, range and water resources will lead to increased agricultural production, food security and improved livelihoods
• Increased access to alternative and clean energy for the poor will reduce dependence on firewood and address deforestation as well as reduce exposure to in‐door air pollution and resulting health costs
• Promotion of clean technologies in agriculture and industry will lead to reduced energy and water demand, reduce costs and improve efficiency of production and competitiveness of Botswana’s industries
A compassionate, just and caring nation
Environment and a compassionate, just and caring nation
• Improving access to a clean and healthy environment will reduce the health burden upon the poor, child and adult mortality and morbidity and costs of treating preventable diseases such as diarrhoea
• Integrating sustainable utilisation of environment and natural resources in the work of Government, civil society and the private sector will protect the livelihoods of the poor and vulnerable and enhance community benefits from natural resources in rural areas thus delivering a sustainable and equitable economy
A safe and secure nation
Governance and security • Integrating issues of environment and climate change across Government, private sector and civil society to reduce vulnerability and support adaptation which improves livelihoods opportunities and security.
• Greater expenditure framework support actions for the promotion of food security, health security and enhanced adaptation and mitigation strategies to cope with climate change
20
3. KEY HIGH LEVEL AND STRATEGIC NATIONAL PLANNING PROCESSES
This section outlines the key strategic national planning processes in Botswana namely: the Vision 2016, National Development Plan 10 (NDP 10) and the National Strategy of Poverty Reduction (NSPR) of 2003.
3.1. Vision 2016 The “Long Term Vision for Botswana: Towards Prosperity for All” or Vision 2016 articulates and reflects the long term aspirations for Botswana and provides a broad framework for development.
3.1.1. Key Objectives of the Vision By 2016 Botswana will be: • An educated, informed nation • A prosperous, productive and innovative nation • A compassionate, just, caring nation • A safe and secure nation;
• An open, democratic and accountable nation; • A moral and tolerant nation and • A proud and united nation
According to Vision 2016, GDP per capital will be trebled by 2016 to USD8500 in real terms and incomes will grow at 6% in real per capita terms. With regards to employment the country will have reached full employment with an equitable gender distribution. All Batswana will have access to good quality shelter and income distribution will be more equitable by 2016. Poverty will be eradicated. Social safety nets will be in place to assist the poor. All nationals will have access to good health care and the spread of HIV/AIDS will be stopped. The country will be food secure and have adequate plans and preparation to ensure the safety of nationals in the event a national disaster occurs (GoB, 1997).
3.1.2. Institutional Ownership and Implementation The lead and implementation of the Vision falls under the Office of the President (OP). A Vision Council monitors and evaluates the implementation of the Vision. Since its conception Vision 2016 has been operating and is supervised by BIDPA. Its secretariat consists of seven (7) full time staff.
3.1.3. Coverage of Poverty‐ Environment Linkages Vision 2016 sets out the high level vision and goals for delivering growth and poverty reduction in Botswana. It states that by 2016 “the country will use renewable resources at a rate that is in balance with their regeneration capacity …and that these will be equitably distributed among its people… and that the eradication of poverty will create a situation where no‐one will have to damage the environment to meet their basic needs”. Environmental issues such as: the management of pollution, wildlife for tourism and CBNRM are regarded as being important for delivering the vision. But the linkages between PE and between growth and resource exploitation are not examined explicitly, in significant detail or systematically. Climate change is not explored in any detail. This analysis concludes that Vision 2016 views the environment as a sectoral rather than cross‐cutting issue and does not fully address the links to poverty reduction or growth objectives.
3.1.4. Challenges and Opportunities for PEI All development plans and various sectoral plans and policies are designed to provide the detailed implementation to deliver the Vision. The critical entry point for PEI will be to identify plans and policies with the greatest potential to tackle PE linkages by undertaking analytical work, developing evidence and supporting stakeholder capacity to integrate PE linkages into policies and plans which will help to deliver Vision 2016’s goals.

21
3.2. National Development Plan 10 (NDP10) NDP10 is the blueprint for implementing Vision 2016 and it is based on the five national principles of democracy, development, self‐reliance, unity and botho.
3.2.1. Key Objectives of NDP 10 The NDP10 goals are foster: • Adequate supply of qualified productive and competitive human resources • Innovative and productive usage of information and technology • Sustainable rapid economic growth • Well developed and reliable infrastructure • Sustainable management of natural resources • Eradication of absolute poverty • Adequate social services • Affordable and quality healthcare • Prevention of new HIV/AIDS infections • Public Safety and protection • Territorial integrity and sovereignty • Transparency and accountability in all public and private institutions • Enhanced and sustained participatory democracy • Rule of Law • Enhanced cultural heritage and diversity • Strong national identity and unity
3.2.2. Institutional Ownership and Implementation MFDP led the formulation of NDP10 using thematic working groups. For each goal the most appropriate ministry was selected to lead and guide its implementation. NDP 10 has been approved by Parliament and is due for implementation in 2010. The Government Implementation Coordination Office (GICO) has the remit for monitoring and evaluating NDP 10.
3.2.3. Coverage of Poverty Environment Linkages The NDP 10 chapters are written in line with key thematic areas of Vision 2016. While NDP 10 notes that poverty reduction and the environmental asset base are critical to achieving its objectives, a cross cutting mechanism for dealing with the environment is not adopted. Instead, the environment is dealt with as a standalone section. If NDP10 valued the importance of environment as a driver of poverty reduction and economic growth it would integrate PE across the NDP rather than segregating it as a standalone issue. The NDP does however; include some PE related targets, to achieve the broad goal of sustainable management of natural resources. For example, the NDP intends to improve access to sanitation facilities from 40% to 55%; and improve vegetation cover from 80% to 85% by 2016 (NDP 10, 2009).
Submissions made to MFDP for inclusion in the plan by some sector ministries indicate that PE issues were initially planned for but were the first to be dropped during the rationalization and prioritization exercise. Hence, the plan does not reflect the importance environmental investments for sustainable economic growth. Although based on a results based framework, the plan does not spell out how environmental investments can contribute toward the achievement of employment creation and economic diversification.
22
3.2.4. Challenges and Opportunities for PEI • Better integration of PE linkages as drivers of growth and poverty reduction across the NDP. • Support to ensure all ministries recognize the links between their work and PE issues so that PE linkages straddle across Government. • Use of tools such as reviews and monitoring and evaluation of plans and policies offer opportunities for PEI to work government and other stakeholders to strengthen integration of PE linkages to mainstream PE issues. • Scope to use the NDP Mid‐term review as an opportunity to integrate PE indicators, evidence and analysis within the NDP10 framework.
3.3. National Strategy for Poverty Reduction (NSPR) 2003
3.3.1. Key Objectives of NSPR The NSPR 2003 sets out the Botswana Government’s Strategy to reduce the proportion of population living in poverty to 23% by 2007 and to eradicate absolute poverty by 2016 (MFDP, 2003). It aims to achieve this by strengthening the national development management of central government and the capacity of local government institutions to facilitate poverty reduction at the local level. It can be summarized as provision of broad based, labour absorbing economic growth; cost effective, pro‐poor social safety nets; reducing HIV/AIDS and strengthening institutions for the poor.
NSPR 2003 sets out a range of broad policy foci where poverty issues should be addressed which include the development of pro‐poor policies around: macro‐economic growth, price stability, monetary and fiscal policy, foreign direct investment, land issues; and tourism. Its five programme areas to tackle poverty focus on: sustainable livelihoods, enhancing human capabilities, enhancing participation, strengthening local government institutions; and strengthening national development capacity.
The MFDP Socio‐Economic Division under whose remit the NSPR falls has embarked on a review of the NSPR in order to determine its effectiveness. The review focuses on three key thematic areas: ‐ i) economic growth, diversification and employment ii) social protection policy and iii) poverty‐environment linkages. It will also consider poverty in its widest sense including both rural and urban poverty. Reviews of the first two thematic areas are already underway. The third on PE will also begin during 2009. The results of the overall review will inform revision of NSPR 2003 and feed into the midterm review of NDP 10 to strengthen the integration of poverty reduction as a key goal of national planning processes
3.3.2. Institutional Ownership and Implementation MFDP is responsible for the overall preparation, coordination and review processes regarding NSPR but implementation remains the responsibility of sector ministries and local government. This fragmented responsibility for policy implementation makes implementation difficult.
The Multi‐Sectoral Committee on Poverty Reduction (MSCPR) whose membership comprises key sector ministries coordinates progress on NSPR implementation in 6 action areas: (1) poverty assessment and policy; (2) poverty focus of policies and programmes; (3) poverty focus of institutions; (4) poverty monitoring system; (5) impact assessment, lessons learned and scaling up; and (6) knowledge sharing, advocacy and building consensus).
Major obstacles to NSPR include the general lack of human capabilities and productive skills to enable the poor to take advantage of the existing assistance schemes to work themselves out of poverty; and secondly, the unsatisfactory implementation capacity of existing programmes, particularly due to limited implementation capacity. Thirdly, inefficient monitoring and evaluation systems of key data and pro‐poor institutions capable of identifying, mapping and assisting the poor and greater emphasis placed on social safety nets rather than on job creation remain obstacles to meeting the goals of the NSPR (MFDP, 2006).
23
3.3.3. Coverage of Poverty‐Environment Linkages NSPR 2003 mentions the causes of poverty including isolation in rural areas, limited access to employment and a narrow economic base. It also refers to environment related issues such as access to land and natural resources and persistent drought as causes of poverty.
PE linkages are not explicitly cited in NSPR although programmatic activities such as support for CBNRM and rain fed crop production do address some PE linkages but not in a comprehensive manner. Many other environment dimensions which are closely linked to poverty are ignored including access to, and use of, key resources such as energy and water and access to key environmental services such as waste management and clean water and sanitation. No analysis of the impacts of environmental change and degradation on the poor is made. However issues such as high rates of land degradation (69% of land area), low crop productivity (300kg/ha for subsistence farmers (CSO, 2004)) and continuing levels of malnutrition suggest strong links between continuing poverty and environmental degradation.
Considerable emphasis is placed in the NSPR on social safety nets (SSNs) which have been criticized for being “non‐productive” and creating dependency amongst beneficiaries To increase preparedness for environmental change there is scope to switch support to more productive activities such as promotion of sustainable land and water management practices in agriculture, use of drought resistant crop types.
NSPR does not effectively address the multi‐sectoral dimensions of PE linkages where both an environment issue and its poverty outcome are the shared responsibilities of several sectoral ministries making tackling them institutionally complex and difficult. The issue of climate change is not addressed in the NSPR although this is an issue which will have a significant impact upon the poor and vulnerable in Botswana.
3.3.4. PE ‐ Challenges and Opportunities The current NSPR does not comprehensively tackle PE issues in its approach. The fact that the poor are the most dependent upon the quantity and quality of environmental assets in Botswana means that this critical issue has to be addressed in the ongoing review of the NSPR. The Terms of Reference for the NSPR review were finalized through the support of PEI Botswana to ensure that it takes into account PE issues so that they are better integrated as part of the national strategy for tackling poverty. The NSPR through its oversight role to tackle poverty in a cross‐cutting and multi‐sectoral manner across sectors at both national and local government level offers huge potential to address PE linkages and its limited success to date can be seen as an opportunity for the future.
Strong and compelling evidence on the nature of PE linkages and the entry points for NSPR to tackle them together with supporting analysis which justifies budgetary expenditure on PE interventions is required. Existing institutional structures such as the MSCPR & NRTC offer potential entry points which, with support could be used to raise awareness of PE linkages and strengthen the capacity to tackle cross‐cutting and multi‐sectoral approaches to addressing PE issues. In addition, support to shift from safety nets to increased capacity to withstand environmental change could be a useful entry point for support to promote agriculture which is resilient to climate variability and change.
3.4. The National Strategy for Sustainable Development (NSSD) The Department of Environmental Affairs (DEA) in the Ministry of Environment, Wildlife and Tourism (MEWT) and key stakeholders have embarked on a process to develop a national strategy for sustainable development (NSSD) which aims to integrate sustainability across the work of Government. A scoping exercise in July 2009 brought key stakeholders on board. Development and implementation of the NSSD will be an area of Government activity for which PEI outputs could be very relevant.
3.5. The National Budget The fiscal rule approved during the midterm review of NDP9 is used when formulating the national budget. By this rule, government expenditure must not exceed 40% of forecasted GDP for that year. In addition, the fiscal
24
rule specifies a 70:30 percent ratio between the recurrent and development budget which must be adhered to in order to maintain a sustainable fiscal position.
3.5.1. Overview of Sector Allocations by Ministry for 2009 The following budget was approved for recurrent and development expenditure for the current financial year: MOE P7.57 billion or 29.4%; MLG P4.47 billion or 17.4%; State President P3.38 billion or 13.2% and MOH P2.20 billion or 8.6%; MOWT P1.54 billion or 6%; MOA P913.1 million or 3.6%; MFDP P1.17 billion or 4.6%; MEWR P609.2 or 2.4%; MCST P640.8 million or 2.5%; MLH P643 million or 2.5%; MLHA 625.2 million or 2.5%; MWET P443.5 million or 1.7% and the remaining nine ministries shared the 3.9% of the recurrent budget (Budget Speech, 2009). With respect to the development budget the Ministry of the State President received P2.09 billion or 19.8%; MOLG P1.45 billion or 13.69%; MOWT P1.257 billion 11.9%; MEWR P965.7 million or 9.15%; MOE P890.5 million or 8.43%. The rest of the budget is shared amongst the remaining ministries. In light of the current global financial crisis these figures have had to be revised downwards by 5% and 7% for recurrent and development expenditures respectively (MFDP, 2009).
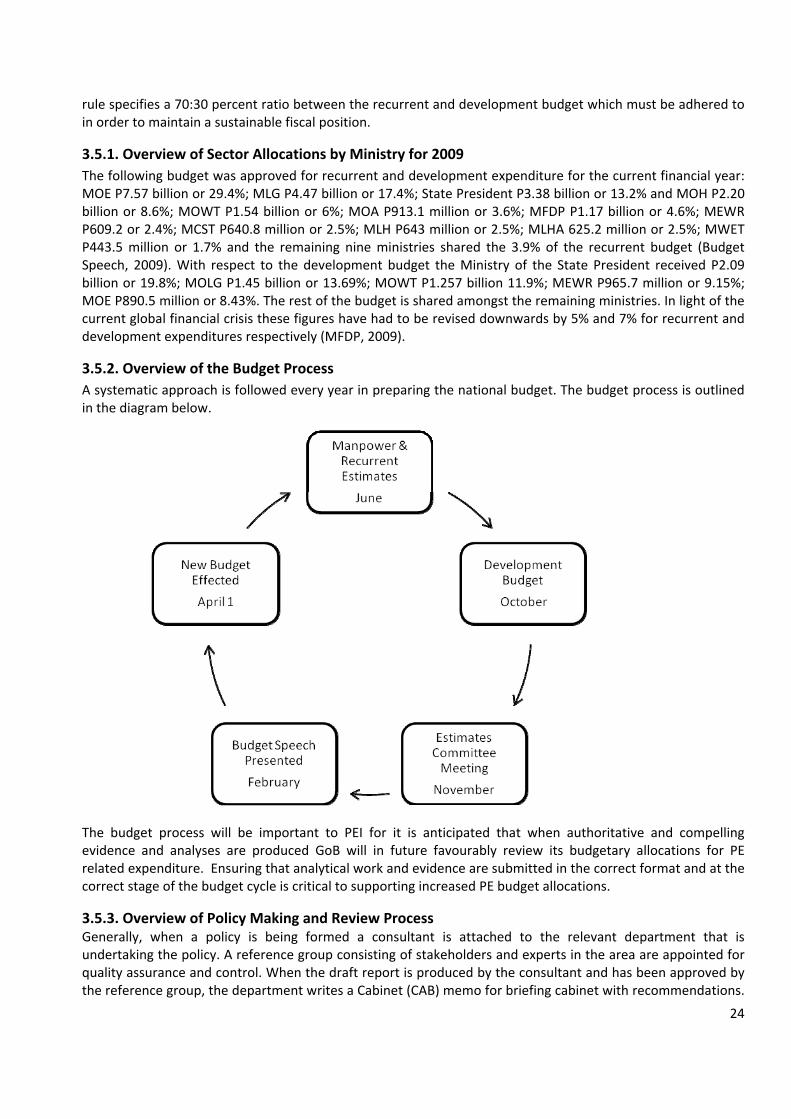
3.5.2. Overview of the Budget Process A systematic approach is followed every year in preparing the national budget. The budget process is outlined in the diagram below.
The budget process will be important to PEI for it is anticipated that when authoritative and compelling evidence and analyses are produced GoB will in future favourably review its budgetary allocations for PE related expenditure. Ensuring that analytical work and evidence are submitted in the correct format and at the correct stage of the budget cycle is critical to supporting increased PE budget allocations.
3.5.3. Overview of Policy Making and Review Process Generally, when a policy is being formed a consultant is attached to the relevant department that is undertaking the policy. A reference group consisting of stakeholders and experts in the area are appointed for quality assurance and control. When the draft report is produced by the consultant and has been approved by the reference group, the department writes a Cabinet (CAB) memo for briefing cabinet with recommendations.
25
A White Paper is produced by the Ministry which goes through to Parliament for discussion and approval. Throughout the whole process there are extensive consultations with stakeholders and the nation at various levels.
3.5.4. General Budget and Policy Challenges for PEI Budget Processes: The analysis identifies the need for PEI to provide appropriate evidence and analysis in a timely manner alongside awareness and capacity raising to ensure that, in future year, PE related investment proposals by sector ministries are better understood and presented giving them a better chance of approval.
Policy Processes: This institutional analysis has identified a significant number of policy reviews under‐way or planned for 2009/10 including Rural Development, Tourism, Agriculture, Water Conservation and Energy. PEI will be unable to provide support to all policy reviews. The challenge will be to intelligently produce analytical work and evidence which can be utilized across a range of policy reviews and to ensure that the PEI team and process is linked to on‐going or planned policy and plan reviews to allow timely interventions.
4. REVIEW AND ANALYSIS OF KEY POLICIES WITH PE FOCUS
4.1. Overview Summarizing Policies with PE Focus: NDP10 is the framework via which Vision 2016 will be achieved. Various policies have been put in place to operationalize and address each of the NDP10 objectives. Table 4.1.1 identifies and critically analyses these key policies to highlight the risks to implementation and potential conflict between them.
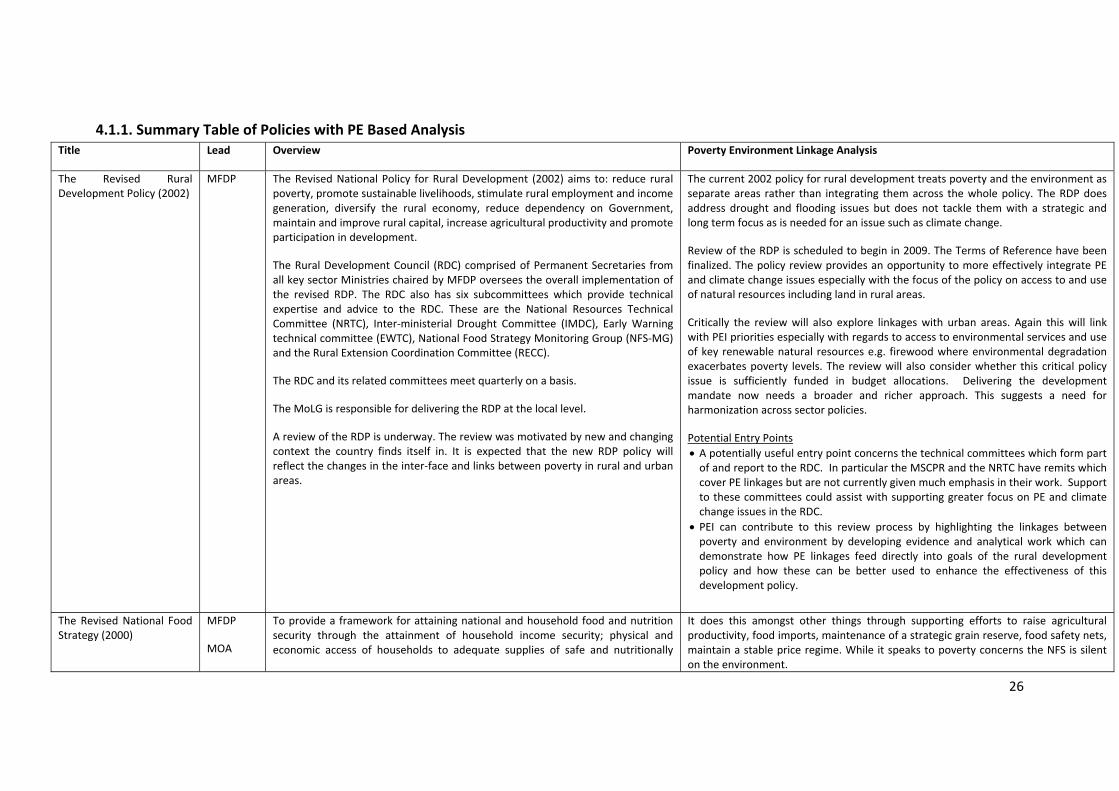
26
4.1.1. Summary Table of Policies with PE Based Analysis Title Lead Overview Poverty Environment Linkage Analysis
The Revised Rural Development Policy (2002)
MFDP The Revised National Policy for Rural Development (2002) aims to: reduce rural poverty, promote sustainable livelihoods, stimulate rural employment and income generation, diversify the rural economy, reduce dependency on Government, maintain and improve rural capital, increase agricultural productivity and promote participation in development.
The Rural Development Council (RDC) comprised of Permanent Secretaries from all key sector Ministries chaired by MFDP oversees the overall implementation of the revised RDP. The RDC also has six subcommittees which provide technical expertise and advice to the RDC. These are the National Resources Technical Committee (NRTC), Inter‐ministerial Drought Committee (IMDC), Early Warning technical committee (EWTC), National Food Strategy Monitoring Group (NFS‐MG) and the Rural Extension Coordination Committee (RECC).
The RDC and its related committees meet quarterly on a basis.
The MoLG is responsible for delivering the RDP at the local level.
A review of the RDP is underway. The review was motivated by new and changing context the country finds itself in. It is expected that the new RDP policy will reflect the changes in the inter‐face and links between poverty in rural and urban areas.
The current 2002 policy for rural development treats poverty and the environment as separate areas rather than integrating them across the whole policy. The RDP does address drought and flooding issues but does not tackle them with a strategic and long term focus as is needed for an issue such as climate change.
Review of the RDP is scheduled to begin in 2009. The Terms of Reference have been finalized. The policy review provides an opportunity to more effectively integrate PE and climate change issues especially with the focus of the policy on access to and use of natural resources including land in rural areas.
Critically the review will also explore linkages with urban areas. Again this will link with PEI priorities especially with regards to access to environmental services and use of key renewable natural resources e.g. firewood where environmental degradation exacerbates poverty levels. The review will also consider whether this critical policy issue is sufficiently funded in budget allocations. Delivering the development mandate now needs a broader and richer approach. This suggests a need for harmonization across sector policies.
Potential Entry Points • A potentially useful entry point concerns the technical committees which form part of and report to the RDC. In particular the MSCPR and the NRTC have remits which cover PE linkages but are not currently given much emphasis in their work. Support to these committees could assist with supporting greater focus on PE and climate change issues in the RDC.
• PEI can contribute to this review process by highlighting the linkages between poverty and environment by developing evidence and analytical work which can demonstrate how PE linkages feed directly into goals of the rural development policy and how these can be better used to enhance the effectiveness of this development policy.
The Revised National Food Strategy (2000)
MFDP
MOA
To provide a framework for attaining national and household food and nutrition security through the attainment of household income security; physical and economic access of households to adequate supplies of safe and nutritionally
It does this amongst other things through supporting efforts to raise agricultural productivity, food imports, maintenance of a strategic grain reserve, food safety nets, maintain a stable price regime. While it speaks to poverty concerns the NFS is silent on the environment.
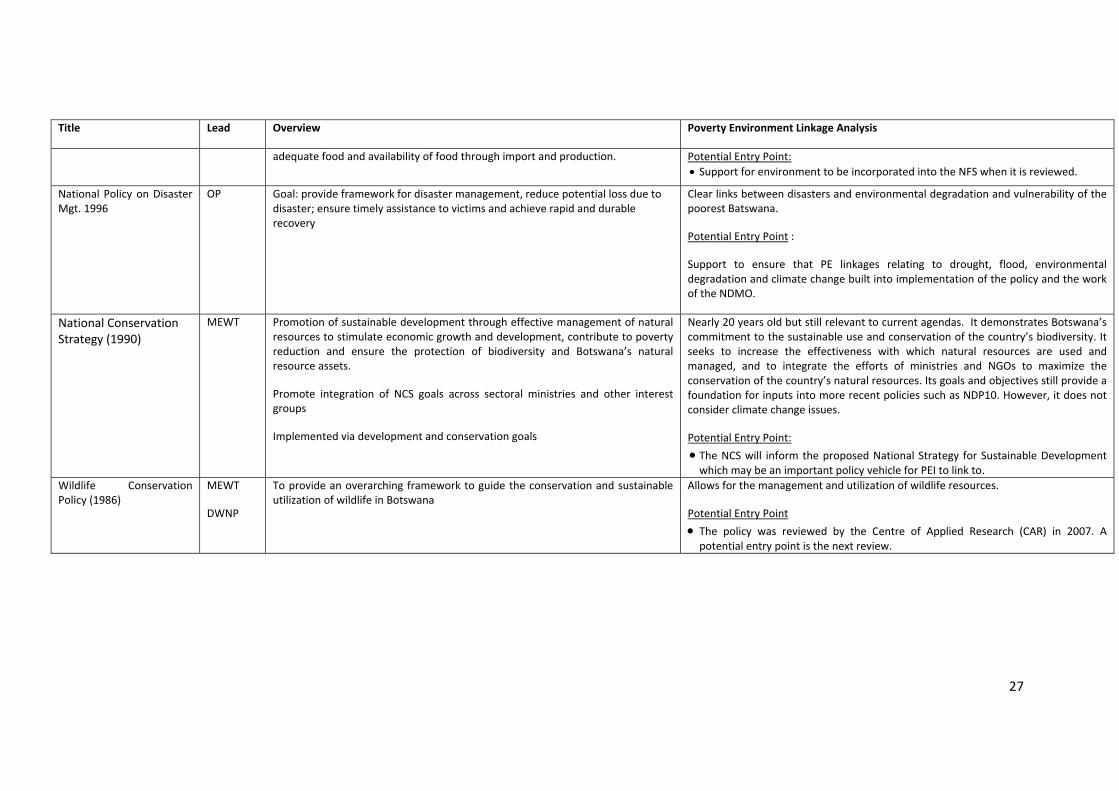
27
Title Lead Overview Poverty Environment Linkage Analysis
adequate food and availability of food through import and production. Potential Entry Point: • Support for environment to be incorporated into the NFS when it is reviewed.
National Policy on Disaster Mgt. 1996
OP Goal: provide framework for disaster management, reduce potential loss due to disaster; ensure timely assistance to victims and achieve rapid and durable recovery
Clear links between disasters and environmental degradation and vulnerability of the poorest Batswana.
Potential Entry Point :
Support to ensure that PE linkages relating to drought, flood, environmental degradation and climate change built into implementation of the policy and the work of the NDMO.
National Conservation Strategy (1990)
MEWT Promotion of sustainable development through effective management of natural resources to stimulate economic growth and development, contribute to poverty reduction and ensure the protection of biodiversity and Botswana’s natural resource assets.
Promote integration of NCS goals across sectoral ministries and other interest groups
Implemented via development and conservation goals
Nearly 20 years old but still relevant to current agendas. It demonstrates Botswana’s commitment to the sustainable use and conservation of the country’s biodiversity. It seeks to increase the effectiveness with which natural resources are used and managed, and to integrate the efforts of ministries and NGOs to maximize the conservation of the country’s natural resources. Its goals and objectives still provide a foundation for inputs into more recent policies such as NDP10. However, it does not consider climate change issues.
Potential Entry Point:
• The NCS will inform the proposed National Strategy for Sustainable Development which may be an important policy vehicle for PEI to link to.
Wildlife Conservation Policy (1986)
MEWT
DWNP
To provide an overarching framework to guide the conservation and sustainable utilization of wildlife in Botswana
Allows for the management and utilization of wildlife resources.
Potential Entry Point
• The policy was reviewed by the Centre of Applied Research (CAR) in 2007. A potential entry point is the next review.
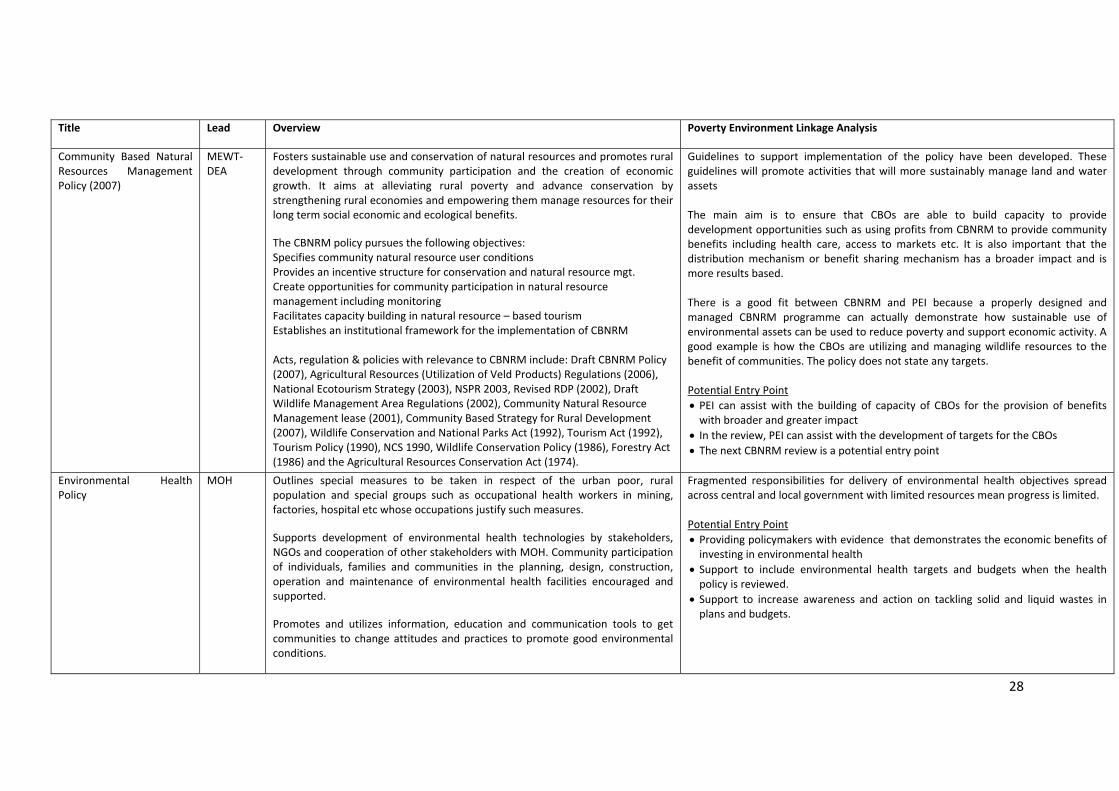
28
Title Lead Overview Poverty Environment Linkage Analysis
Community Based Natural Resources Management Policy (2007)
MEWT‐ DEA
Fosters sustainable use and conservation of natural resources and promotes rural development through community participation and the creation of economic growth. It aims at alleviating rural poverty and advance conservation by strengthening rural economies and empowering them manage resources for their long term social economic and ecological benefits.
The CBNRM policy pursues the following objectives: Specifies community natural resource user conditions Provides an incentive structure for conservation and natural resource mgt. Create opportunities for community participation in natural resource management including monitoring Facilitates capacity building in natural resource – based tourism Establishes an institutional framework for the implementation of CBNRM Acts, regulation & policies with relevance to CBNRM include: Draft CBNRM Policy (2007), Agricultural Resources (Utilization of Veld Products) Regulations (2006), National Ecotourism Strategy (2003), NSPR 2003, Revised RDP (2002), Draft Wildlife Management Area Regulations (2002), Community Natural Resource Management lease (2001), Community Based Strategy for Rural Development (2007), Wildlife Conservation and National Parks Act (1992), Tourism Act (1992), Tourism Policy (1990), NCS 1990, Wildlife Conservation Policy (1986), Forestry Act (1986) and the Agricultural Resources Conservation Act (1974).
Guidelines to support implementation of the policy have been developed. These guidelines will promote activities that will more sustainably manage land and water assets The main aim is to ensure that CBOs are able to build capacity to provide development opportunities such as using profits from CBNRM to provide community benefits including health care, access to markets etc. It is also important that the distribution mechanism or benefit sharing mechanism has a broader impact and is more results based. There is a good fit between CBNRM and PEI because a properly designed and managed CBNRM programme can actually demonstrate how sustainable use of environmental assets can be used to reduce poverty and support economic activity. A good example is how the CBOs are utilizing and managing wildlife resources to the benefit of communities. The policy does not state any targets. Potential Entry Point • PEI can assist with the building of capacity of CBOs for the provision of benefits with broader and greater impact
• In the review, PEI can assist with the development of targets for the CBOs • The next CBNRM review is a potential entry point
Environmental Health Policy
MOH Outlines special measures to be taken in respect of the urban poor, rural population and special groups such as occupational health workers in mining, factories, hospital etc whose occupations justify such measures.
Supports development of environmental health technologies by stakeholders, NGOs and cooperation of other stakeholders with MOH. Community participation of individuals, families and communities in the planning, design, construction, operation and maintenance of environmental health facilities encouraged and supported.
Promotes and utilizes information, education and communication tools to get communities to change attitudes and practices to promote good environmental conditions.
Fragmented responsibilities for delivery of environmental health objectives spread across central and local government with limited resources mean progress is limited. Potential Entry Point • Providing policymakers with evidence that demonstrates the economic benefits of investing in environmental health
• Support to include environmental health targets and budgets when the health policy is reviewed.
• Support to increase awareness and action on tackling solid and liquid wastes in plans and budgets.
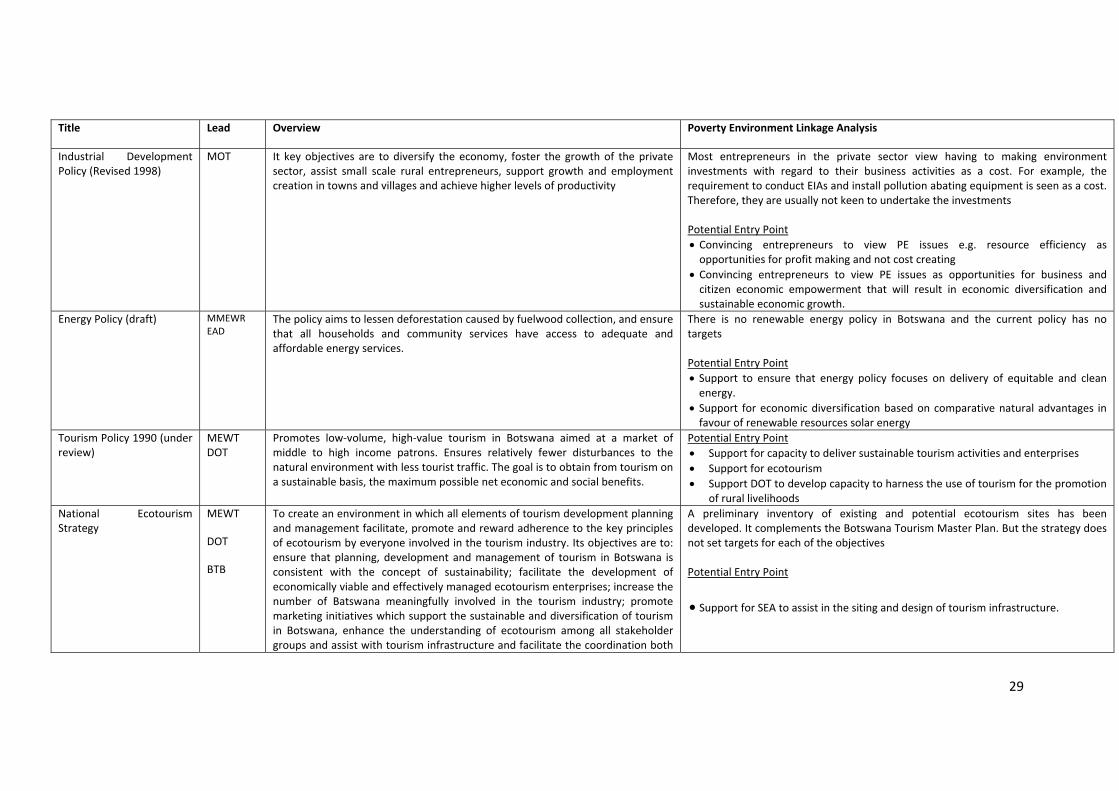
29
Title Lead Overview Poverty Environment Linkage Analysis
Industrial Development Policy (Revised 1998)
MOT It key objectives are to diversify the economy, foster the growth of the private sector, assist small scale rural entrepreneurs, support growth and employment creation in towns and villages and achieve higher levels of productivity
Most entrepreneurs in the private sector view having to making environment investments with regard to their business activities as a cost. For example, the requirement to conduct EIAs and install pollution abating equipment is seen as a cost. Therefore, they are usually not keen to undertake the investments Potential Entry Point • Convincing entrepreneurs to view PE issues e.g. resource efficiency as opportunities for profit making and not cost creating
• Convincing entrepreneurs to view PE issues as opportunities for business and citizen economic empowerment that will result in economic diversification and sustainable economic growth.
Energy Policy (draft) MMEWR EAD
The policy aims to lessen deforestation caused by fuelwood collection, and ensure that all households and community services have access to adequate and affordable energy services.
There is no renewable energy policy in Botswana and the current policy has no targets Potential Entry Point • Support to ensure that energy policy focuses on delivery of equitable and clean energy.
• Support for economic diversification based on comparative natural advantages in favour of renewable resources solar energy
Tourism Policy 1990 (under review)
MEWT DOT
Promotes low‐volume, high‐value tourism in Botswana aimed at a market of middle to high income patrons. Ensures relatively fewer disturbances to the natural environment with less tourist traffic. The goal is to obtain from tourism on a sustainable basis, the maximum possible net economic and social benefits.
Potential Entry Point • Support for capacity to deliver sustainable tourism activities and enterprises • Support for ecotourism • Support DOT to develop capacity to harness the use of tourism for the promotion
of rural livelihoods National Ecotourism Strategy
MEWT
DOT
BTB
To create an environment in which all elements of tourism development planning and management facilitate, promote and reward adherence to the key principles of ecotourism by everyone involved in the tourism industry. Its objectives are to: ensure that planning, development and management of tourism in Botswana is consistent with the concept of sustainability; facilitate the development of economically viable and effectively managed ecotourism enterprises; increase the number of Batswana meaningfully involved in the tourism industry; promote marketing initiatives which support the sustainable and diversification of tourism in Botswana, enhance the understanding of ecotourism among all stakeholder groups and assist with tourism infrastructure and facilitate the coordination both
A preliminary inventory of existing and potential ecotourism sites has been developed. It complements the Botswana Tourism Master Plan. But the strategy does not set targets for each of the objectives Potential Entry Point
• Support for SEA to assist in the siting and design of tourism infrastructure.
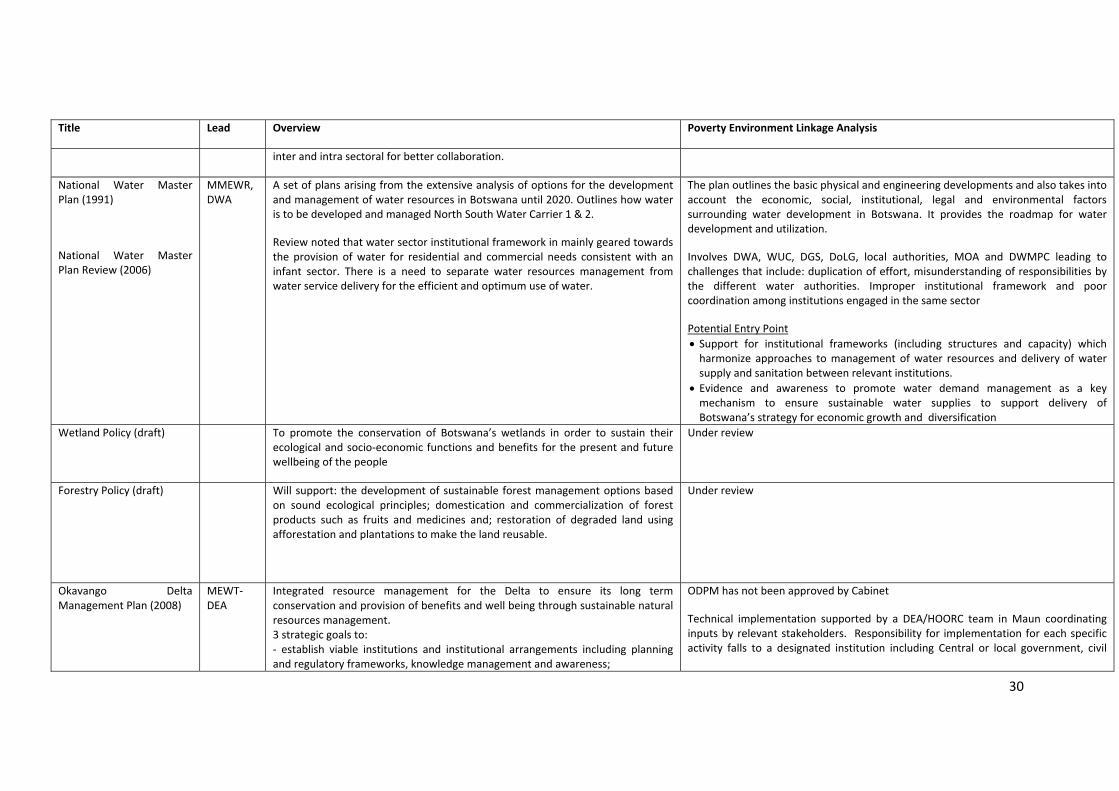
30
Title Lead Overview Poverty Environment Linkage Analysis
inter and intra sectoral for better collaboration.
National Water Master Plan (1991)
National Water Master Plan Review (2006)
MMEWR, DWA
A set of plans arising from the extensive analysis of options for the development and management of water resources in Botswana until 2020. Outlines how water is to be developed and managed North South Water Carrier 1 & 2.
Review noted that water sector institutional framework in mainly geared towards the provision of water for residential and commercial needs consistent with an infant sector. There is a need to separate water resources management from water service delivery for the efficient and optimum use of water.
The plan outlines the basic physical and engineering developments and also takes into account the economic, social, institutional, legal and environmental factors surrounding water development in Botswana. It provides the roadmap for water development and utilization.
Involves DWA, WUC, DGS, DoLG, local authorities, MOA and DWMPC leading to challenges that include: duplication of effort, misunderstanding of responsibilities by the different water authorities. Improper institutional framework and poor coordination among institutions engaged in the same sector
Potential Entry Point • Support for institutional frameworks (including structures and capacity) which harmonize approaches to management of water resources and delivery of water supply and sanitation between relevant institutions.
• Evidence and awareness to promote water demand management as a key mechanism to ensure sustainable water supplies to support delivery of Botswana’s strategy for economic growth and diversification
Wetland Policy (draft) To promote the conservation of Botswana’s wetlands in order to sustain their ecological and socio‐economic functions and benefits for the present and future wellbeing of the people
Under review
Forestry Policy (draft) Will support: the development of sustainable forest management options based on sound ecological principles; domestication and commercialization of forest products such as fruits and medicines and; restoration of degraded land using afforestation and plantations to make the land reusable.
Under review
Okavango Delta Management Plan (2008)
MEWT‐ DEA
Integrated resource management for the Delta to ensure its long term conservation and provision of benefits and well being through sustainable natural resources management. 3 strategic goals to: ‐ establish viable institutions and institutional arrangements including planning and regulatory frameworks, knowledge management and awareness;
ODPM has not been approved by Cabinet
Technical implementation supported by a DEA/HOORC team in Maun coordinating inputs by relevant stakeholders. Responsibility for implementation for each specific activity falls to a designated institution including Central or local government, civil
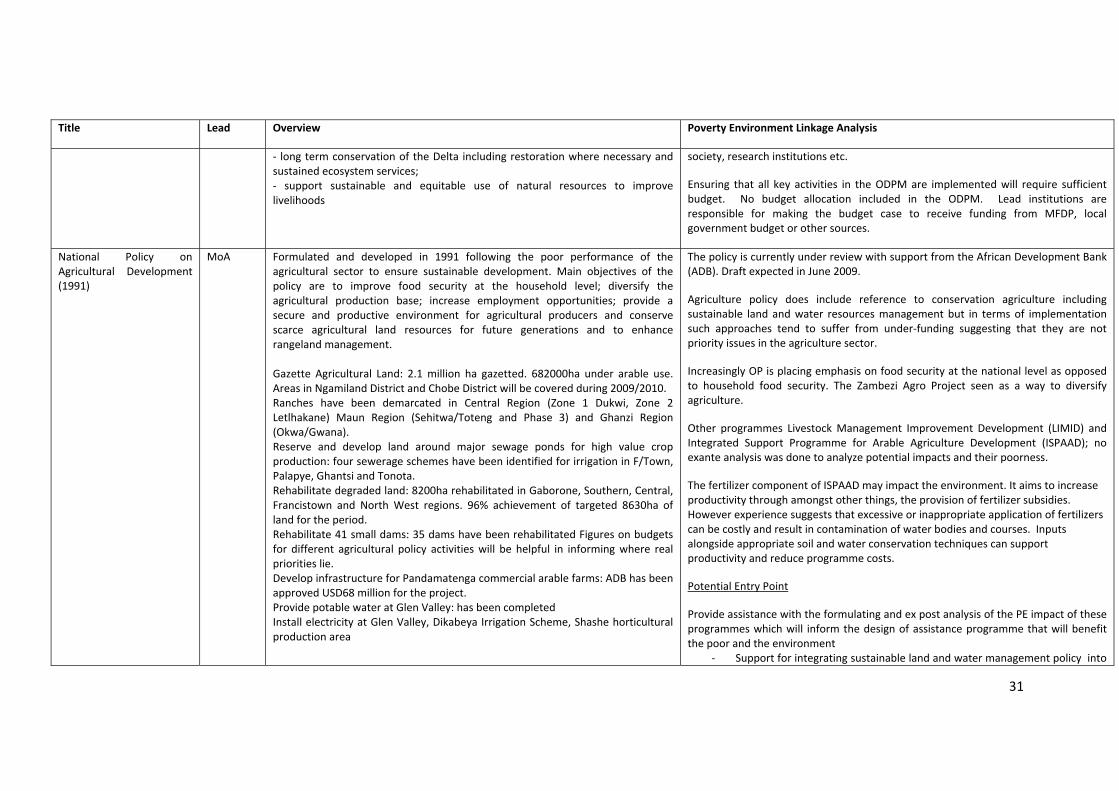
31
Title Lead Overview Poverty Environment Linkage Analysis
‐ long term conservation of the Delta including restoration where necessary and sustained ecosystem services; ‐ support sustainable and equitable use of natural resources to improve livelihoods
society, research institutions etc.
Ensuring that all key activities in the ODPM are implemented will require sufficient budget. No budget allocation included in the ODPM. Lead institutions are responsible for making the budget case to receive funding from MFDP, local government budget or other sources.
National Policy on Agricultural Development (1991)
MoA Formulated and developed in 1991 following the poor performance of the agricultural sector to ensure sustainable development. Main objectives of the policy are to improve food security at the household level; diversify the agricultural production base; increase employment opportunities; provide a secure and productive environment for agricultural producers and conserve scarce agricultural land resources for future generations and to enhance rangeland management. Gazette Agricultural Land: 2.1 million ha gazetted. 682000ha under arable use. Areas in Ngamiland District and Chobe District will be covered during 2009/2010. Ranches have been demarcated in Central Region (Zone 1 Dukwi, Zone 2 Letlhakane) Maun Region (Sehitwa/Toteng and Phase 3) and Ghanzi Region (Okwa/Gwana). Reserve and develop land around major sewage ponds for high value crop production: four sewerage schemes have been identified for irrigation in F/Town, Palapye, Ghantsi and Tonota. Rehabilitate degraded land: 8200ha rehabilitated in Gaborone, Southern, Central, Francistown and North West regions. 96% achievement of targeted 8630ha of land for the period. Rehabilitate 41 small dams: 35 dams have been rehabilitated Figures on budgets for different agricultural policy activities will be helpful in informing where real priorities lie. Develop infrastructure for Pandamatenga commercial arable farms: ADB has been approved USD68 million for the project. Provide potable water at Glen Valley: has been completed Install electricity at Glen Valley, Dikabeya Irrigation Scheme, Shashe horticultural production area
The policy is currently under review with support from the African Development Bank (ADB). Draft expected in June 2009.
Agriculture policy does include reference to conservation agriculture including sustainable land and water resources management but in terms of implementation such approaches tend to suffer from under‐funding suggesting that they are not priority issues in the agriculture sector.
Increasingly OP is placing emphasis on food security at the national level as opposed to household food security. The Zambezi Agro Project seen as a way to diversify agriculture.
Other programmes Livestock Management Improvement Development (LIMID) and Integrated Support Programme for Arable Agriculture Development (ISPAAD); no exante analysis was done to analyze potential impacts and their poorness.
The fertilizer component of ISPAAD may impact the environment. It aims to increase productivity through amongst other things, the provision of fertilizer subsidies. However experience suggests that excessive or inappropriate application of fertilizers can be costly and result in contamination of water bodies and courses. Inputs alongside appropriate soil and water conservation techniques can support productivity and reduce programme costs.
Potential Entry Point
Provide assistance with the formulating and ex post analysis of the PE impact of these programmes which will inform the design of assistance programme that will benefit the poor and the environment
‐ Support for integrating sustainable land and water management policy into
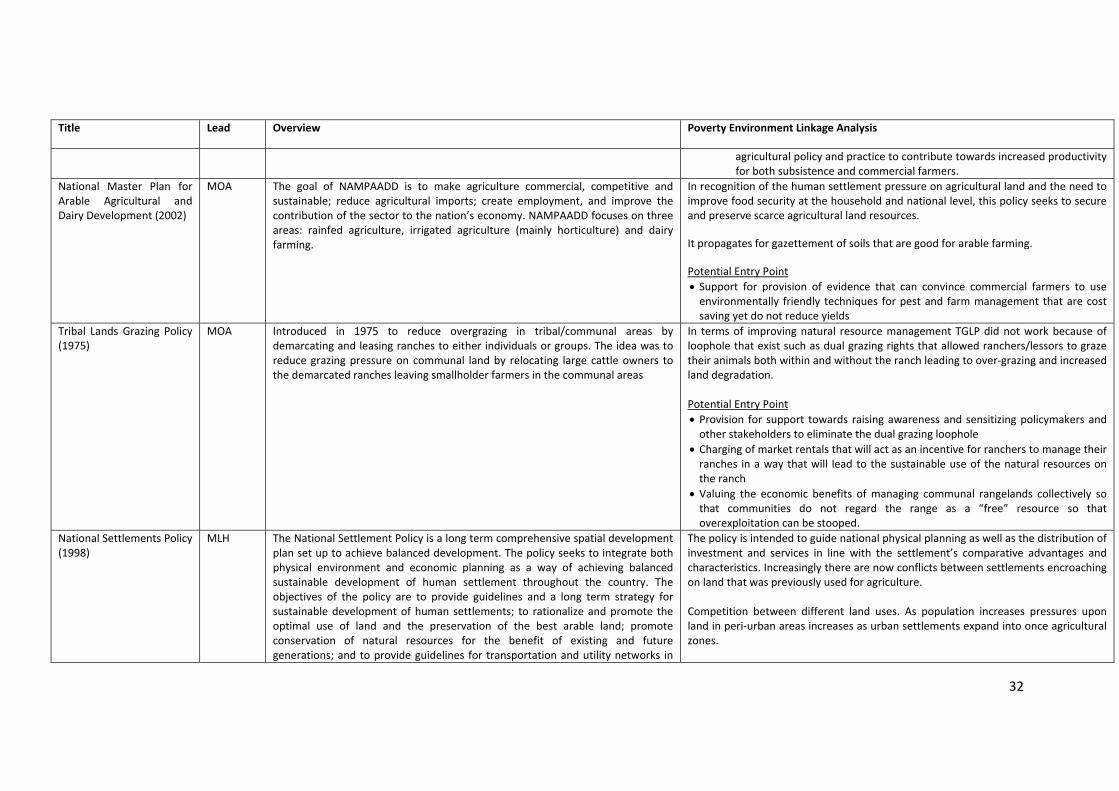
32
Title Lead Overview Poverty Environment Linkage Analysis
agricultural policy and practice to contribute towards increased productivity for both subsistence and commercial farmers.
National Master Plan for Arable Agricultural and Dairy Development (2002)
MOA The goal of NAMPAADD is to make agriculture commercial, competitive and sustainable; reduce agricultural imports; create employment, and improve the contribution of the sector to the nation’s economy. NAMPAADD focuses on three areas: rainfed agriculture, irrigated agriculture (mainly horticulture) and dairy farming.
In recognition of the human settlement pressure on agricultural land and the need to improve food security at the household and national level, this policy seeks to secure and preserve scarce agricultural land resources.
It propagates for gazettement of soils that are good for arable farming.
Potential Entry Point • Support for provision of evidence that can convince commercial farmers to use environmentally friendly techniques for pest and farm management that are cost saving yet do not reduce yields
Tribal Lands Grazing Policy (1975)
MOA Introduced in 1975 to reduce overgrazing in tribal/communal areas by demarcating and leasing ranches to either individuals or groups. The idea was to reduce grazing pressure on communal land by relocating large cattle owners to the demarcated ranches leaving smallholder farmers in the communal areas
In terms of improving natural resource management TGLP did not work because of loophole that exist such as dual grazing rights that allowed ranchers/lessors to graze their animals both within and without the ranch leading to over‐grazing and increased land degradation. Potential Entry Point • Provision for support towards raising awareness and sensitizing policymakers and other stakeholders to eliminate the dual grazing loophole
• Charging of market rentals that will act as an incentive for ranchers to manage their ranches in a way that will lead to the sustainable use of the natural resources on the ranch
• Valuing the economic benefits of managing communal rangelands collectively so that communities do not regard the range as a “free” resource so that overexploitation can be stooped.
National Settlements Policy (1998)
MLH The National Settlement Policy is a long term comprehensive spatial development plan set up to achieve balanced development. The policy seeks to integrate both physical environment and economic planning as a way of achieving balanced sustainable development of human settlement throughout the country. The objectives of the policy are to provide guidelines and a long term strategy for sustainable development of human settlements; to rationalize and promote the optimal use of land and the preservation of the best arable land; promote conservation of natural resources for the benefit of existing and future generations; and to provide guidelines for transportation and utility networks in
The policy is intended to guide national physical planning as well as the distribution of investment and services in line with the settlement’s comparative advantages and characteristics. Increasingly there are now conflicts between settlements encroaching on land that was previously used for agriculture. Competition between different land uses. As population increases pressures upon land in peri‐urban areas increases as urban settlements expand into once agricultural zones.
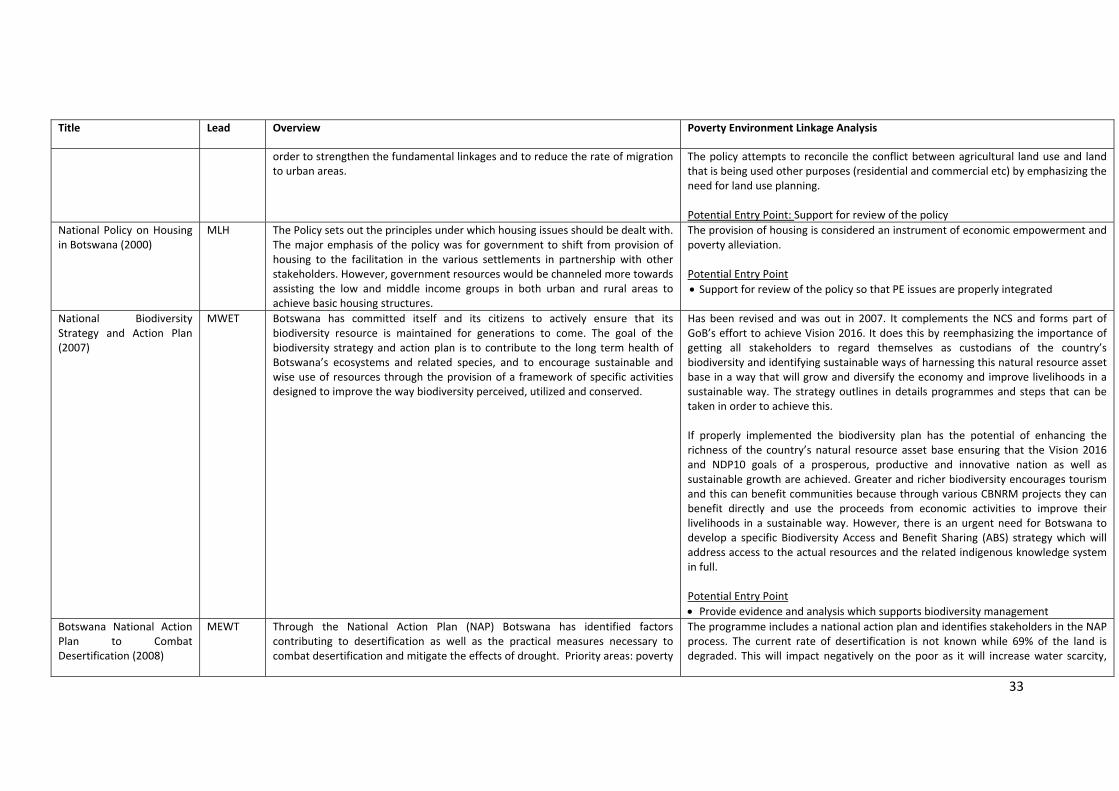
33
Title Lead Overview Poverty Environment Linkage Analysis
order to strengthen the fundamental linkages and to reduce the rate of migration to urban areas.
The policy attempts to reconcile the conflict between agricultural land use and land that is being used other purposes (residential and commercial etc) by emphasizing the need for land use planning. Potential Entry Point: Support for review of the policy
National Policy on Housing in Botswana (2000)
MLH The Policy sets out the principles under which housing issues should be dealt with. The major emphasis of the policy was for government to shift from provision of housing to the facilitation in the various settlements in partnership with other stakeholders. However, government resources would be channeled more towards assisting the low and middle income groups in both urban and rural areas to achieve basic housing structures.
The provision of housing is considered an instrument of economic empowerment and poverty alleviation. Potential Entry Point • Support for review of the policy so that PE issues are properly integrated
National Biodiversity Strategy and Action Plan (2007)
MWET Botswana has committed itself and its citizens to actively ensure that its biodiversity resource is maintained for generations to come. The goal of the biodiversity strategy and action plan is to contribute to the long term health of Botswana’s ecosystems and related species, and to encourage sustainable and wise use of resources through the provision of a framework of specific activities designed to improve the way biodiversity perceived, utilized and conserved.
Has been revised and was out in 2007. It complements the NCS and forms part of GoB’s effort to achieve Vision 2016. It does this by reemphasizing the importance of getting all stakeholders to regard themselves as custodians of the country’s biodiversity and identifying sustainable ways of harnessing this natural resource asset base in a way that will grow and diversify the economy and improve livelihoods in a sustainable way. The strategy outlines in details programmes and steps that can be taken in order to achieve this. If properly implemented the biodiversity plan has the potential of enhancing the richness of the country’s natural resource asset base ensuring that the Vision 2016 and NDP10 goals of a prosperous, productive and innovative nation as well as sustainable growth are achieved. Greater and richer biodiversity encourages tourism and this can benefit communities because through various CBNRM projects they can benefit directly and use the proceeds from economic activities to improve their livelihoods in a sustainable way. However, there is an urgent need for Botswana to develop a specific Biodiversity Access and Benefit Sharing (ABS) strategy which will address access to the actual resources and the related indigenous knowledge system in full. Potential Entry Point • Provide evidence and analysis which supports biodiversity management
Botswana National Action Plan to Combat Desertification (2008)
MEWT Through the National Action Plan (NAP) Botswana has identified factors contributing to desertification as well as the practical measures necessary to combat desertification and mitigate the effects of drought. Priority areas: poverty
The programme includes a national action plan and identifies stakeholders in the NAP process. The current rate of desertification is not known while 69% of the land is degraded. This will impact negatively on the poor as it will increase water scarcity,
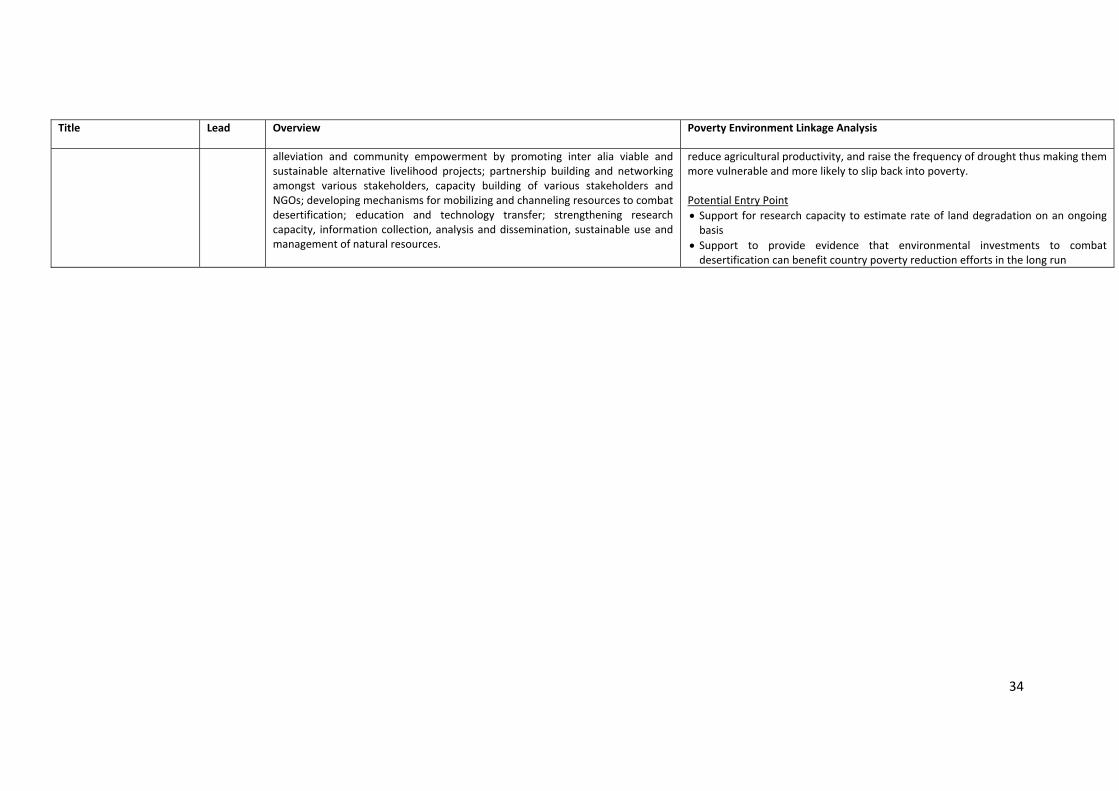
34
Title Lead Overview Poverty Environment Linkage Analysis
alleviation and community empowerment by promoting inter alia viable and sustainable alternative livelihood projects; partnership building and networking amongst various stakeholders, capacity building of various stakeholders and NGOs; developing mechanisms for mobilizing and channeling resources to combat desertification; education and technology transfer; strengthening research capacity, information collection, analysis and dissemination, sustainable use and management of natural resources.
reduce agricultural productivity, and raise the frequency of drought thus making them more vulnerable and more likely to slip back into poverty. Potential Entry Point • Support for research capacity to estimate rate of land degradation on an ongoing basis
• Support to provide evidence that environmental investments to combat desertification can benefit country poverty reduction efforts in the long run
35
The following key observations were made from the analysis: • NDP10 does not systematically integrate PE issues. More work is needed to achieve this. • Policies and plans are linked directly/ indirectly to PE but have little attention paid to PE issues • Fragmentation of PE issues across GoB reduces impact of sustainable & equitable management of natural resources. • CBNRM is a cross‐cutting PE related policy being effectively implemented. There is a high level of awareness and understanding of links between key natural resource assets growth and poverty reduction. Analytical work and evidence to prove benefits together with political commitment have helped to achieve this. • Policy reviews are conducted in silos hence, synergies not fully exploited and possible conflicts are ignored and not dealt with once they emerge. • Not all policies are harmonized. For instance agricultural policies to reduce soil erosion by protecting field boundary vegetation are contradicted by pest control policies to remove such vegetation. • Ideally, policy reviews must be done as integrated processes ensuring that related policies are properly integrated and harmonized to enhance their effectiveness at achieving objectives • Policies good on PE are often not supported by budget allocation to support implementation. • PEI will explore where it can help to strengthen policy and plan making to be more integrated, reducing risk of policy contradictions and where possible emphasizing cross policy synergies and strengthening evidence to support appropriate budgetary allocations. • An evidence base will be developed with convincing analytical work which will aim to inform and influence technical and political stakeholders to promote commitment to PE related policies and budgets. 5. REVIEW AND ANALYSIS OF CENTRAL GOVERNMENT INSTITUTIONS
5.1. Overview and Structure of the Government of Botswana (GoB) GoB is the primary stakeholder for PEI Botswana hence, it is important to understand its structure and how it functions to deliver NDP10. Figure 5.1.1 below lays out its organization at national and local level including the executive and judiciary functions.
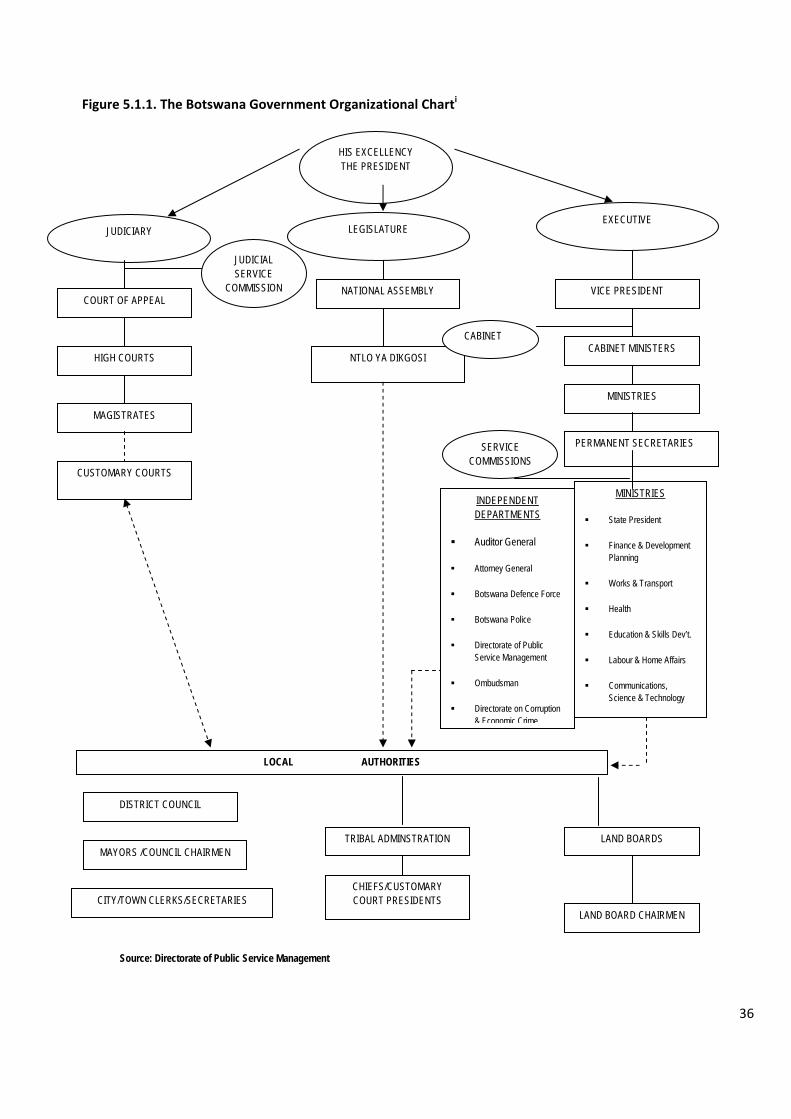
36
Figure 5.1.1. The Botswana Government Organizational Charti
Source: Directorate of Public Service Management
HIS EXCELLENCY THE PRESIDENT
JUDICIARY LEGISLATURE EXECUTIVE
COURT OF APPEAL NATIONAL ASSEMBLY VICE PRESIDENT
HIGH COURTS NTLO YA DIKGOSI CABINET MINISTERS
MAGISTRATES
CUSTOMARY COURTS
MINISTRIES
PERMANENT SECRETARIES
MINISTRIES
State President
Finance & Development Planning
Works & Transport
Health
Education & Skills Dev’t.
Labour & Home Affairs
Communications, Science & Technology
INDEPENDENT DEPARTMENTS
Auditor General
Attorney General
Botswana Defence Force
Botswana Police
Directorate of Public Service Management
Ombudsman
Directorate on Corruption & Economic Crime
LOCAL AUTHORITIES
DISTRICT COUNCIL
MAYORS /COUNCIL CHAIRMEN
CITY/TOWN CLERKS/SECRETARIES
TRIBAL ADMINSTRATION
CHIEFS/CUSTOMARY COURT PRESIDENTS
LAND BOARDS
LAND BOARD CHAIRMEN
JUDICIAL SERVICE
COMMISSION
CABINET
SERVICE COMMISSIONS
37
GoB comprises the President, the Judiciary, the Legislature and the Executive. An independent judiciary with a High Court is presided over by a Chief Justice with Magistrates presiding over subordinate courts; customary courts are presided over by the local chiefs or their representatives. The Legislature comprises of the National Assembly made up of Members of Parliament (MPs) elected from each constituency. Parliament has several committees with a PE focus that deliberate on poverty and environment related issues. For example, there is an Agriculture and Environment Parliamentary committee6. Cabinet is selected by the President from the National Assembly. The Ntlo ya Dikgosi (House of Chiefs) comprised of 35 traditional leaders advises on matters pertaining to custom and tradition, and reviews draft bills before they are considered in Parliament. The Ntlo ya Dikgosi is an important institution for integrating PE issues because the chiefs are custodians of the nation’s environmental asset base in the rural areas where they are also in direct in contact with rural communities on a day to day basis.
5.1.1. Central Government Administrative Structure The Permanent Secretary to the President is the head of the Civil Service. Each Ministry is headed at the official level by a Permanent Secretary. The civil service falls under the Directorate of Public Service Management (DPSM). The country is divided into 16 administrative districts and 16 district councils. The Central Government is represented in each District by the Department of District Administration, headed by a District Commissioner. At the local level, District, City and Town Councils have elected councilors. Additional councilors are nominated by the Minister of Local Government (MOLG). At the political level, a Town/City Council is headed by the Town/City Mayor, while administratively it is headed by the Town/City Clerk. On the political side, a District Council is headed by a Council Chairperson and a Council Secretary on the administrative side. Both the Chief Executives and their supporting staff are recruited by the Department of Local Government Service Management.
5.1.2. International Links Botswana is a member of various international organizations, such as the United Nations (UN), the World Bank (WB), the International Monetary Fund (IMF), the World Trade Organisation (WTO), the African Union (AU) and regional bodies, such as the Southern African Customs Union (SACU) and the Southern African Development Community (SADC). The country is also signatory to various environmental agreements, treaties and conventions some of which include: The Convention on International Trade in Endangered Species (CITES), The Convention on Biological Diversity (CBD); The Unities Nations Convention to Combat Desertification and The United Nations Framework on Climate Change (UNFCC) to name a few.
5.2. KEY PEI SECTOR MINISTRIES AND PARASTATALS The following key PEI sector Ministries and Parastatals were selected for review based upon their potential direct or indirect linkages to PE issues: The Office of the President, Ministry of Finance and Development Planning, the Central Statistics Office, Ministry of Environment, Wildlife and Tourism, Ministry of Minerals, Energy and Water Resources, Ministry of Agriculture, Ministry of Local Government, Ministry of Health, Ministry of Land and Housing, Water Utilities Corporation, Botswana Power Corporation and the Botswana Tourism Board.
5.2.1. Office of the President (OP) OP is the top central government agency and provides integrated advice and support to the President and Cabinet as to the functioning of ministries, interministerial coordination and collaboration. Two offices in the OP
6 Details provides in details under section on Local Government
38
were identified for review for the PEI because of the direct relations their remits have with PE issues. These are the National Disaster Management Office (NMDO) and the Government Implementation Office (GICO).
5.2.1.1. National Disaster Management Office (NDMO) NDMO coordinates the management of all disasters. A crosscutting strategy is followed since disaster impacts cut across all sectors. NDMO noted that many disasters are linked to environmental change and degradation and that invariably the poor are the hardest hit. The District Commissioner is the coordinator at the district level and has powers to declare a disaster and issue orders on how it must be managed.
A major concern to NDMO with regards to PE is climate change which will exacerbate pre‐existing environmental problems. With climate change a greater frequency and impact of vector borne diseases (malaria, diarrhoea, anthrax etc) is likely. In 2008, 532 children died from diarrhoea because flooding led to the contamination of drinking water. Veld fires are also a problem. In 2008, 12 million ha were gutted by veld fires (NDMO, 2009).
5.2.1.2. NDMO ‐ PE Challenges and Opportunities Many disasters which affect Botswana are linked to environmental and climatic change. Some disasters such as veld fires or floods and droughts have immediate and dramatic effects upon society and the economy whilst others such as soil erosion and gradual mean temperature increases are insidious but nonetheless have a significant impact upon society such as reduced crop yields. NDMO recognizes the significance of PE linkages to its work and is keen to integrate them in its activities. NDMO noted that studies on the costs of environmental damage (forest loss, degradation, soil erosion, veld products, biodiversity, carbon sink, construction catchment areas etc) are needed. These could be used to justify budget requests for national disaster management.
NDMO noted that GoB typically views disasters as once off events and consequently, inadequate planning is made to develop response mechanisms and actions for when disasters occur. Botswana tends to be reactive towards disasters. In addition it was noted that poor preparedness means that poor management of disasters sometimes increases vulnerability amongst the poor. A slight increase or change in the climate can slip most of the population into absolute poverty because of increased vulnerability. To this end, a sensitization workshop was held in April 2009 to improve perception and build capacity around disaster management. NDMO plans to link up with Southern African Development Community (SADC) efforts with regard to disaster management at the regional level.
NDMO needs a comprehensive risk reduction strategy. Although NDMO has a risk reduction management plan, it is yet to be adopted by GoB. A National Disaster Policy was approved in 1996 but it is yet to be to be implemented. CC also has to be incorporated into disaster management. NMDO being in the OP does not guarantee that it gets due attention. A fully fledged secretariat is needed to deal with CC issues of adaptation and mitigation. Finding the best structure or institution for dealing with climate change is a major issue. The main problem is convincing government that climate change is a real problem. Furthermore, the link between the national level and district level planning and delivery teams needs to be strengthened.
Outputs from the PEI programme could be relevant to NDMO and its work especially if evidence can be provided to demonstrate the economic benefits in investing in disaster risk reduction to tackle the impacts of environmental and climate change.
5.2.2.1. The Government Implementation Coordination Office (GICO) GICO is the overarching Implementation Coordination Unit in the OP set up to achieve effective policy and project implementation coordination by overseeing and promoting the diversification growth strategy. It is also performs the coordinating and monitoring function for all major government projects. The goal is to improve the focus, speed, quality and cost effectiveness of project implementation. GICO also provides advice to Cabinet and individual Ministries concerning projects being put forward. It assists Ministries with projects from conceptualization to completion, in conjunction with MFDP, which takes care of the financial dimension.
39
5.2.2.2. GICO ‐ PE Challenges and Opportunities With its key coordinating role GICO is potentially a key institution for improving integration of PE issues in national and local development processes. In particular, it offers scope to deliver effective PE monitoring and evaluation (M&E) linked to the NDP10 mid‐term review and opportunities for building PE linkages into policy reviews and implementation. PEI can also support GICO with capacity building for its staff to enhance better PE indicators in their M&E work.
5.3.1. The Ministry of Finance and Development Planning (MFDP) The overall mandate of the Ministry of Finance and Development Planning (MFDP) is to coordinate national development planning, mobilize and prudently manage available financial and economic resources. MFDP is also responsible for the formulation of economic and financial policies for sustainable economic development.
MFDP mobilizes resources for economic development; improves accountability for the use of resources; facilitates improvements in project implementation and monitoring processes; ensures strict adherence to budgetary processes; facilitates the contributing role of the private sector and non‐ governmental organizations (NGOs) to the strategy of creating greater prosperity and embracing this in the development process; facilitates and supports citizen economic empowerment schemes and initiatives, and facilitates the involvement of Botswana in regional and global economic issues.
MFDP’s core functions fall into three main divisions namely: Economic and Financial Policy Division (EFPD), Development and Budget Division (DBD) and Office of the Accountant General. Figure 5.3.1 below is an organogram which depicts the divisions and departments that fall within MFDP.
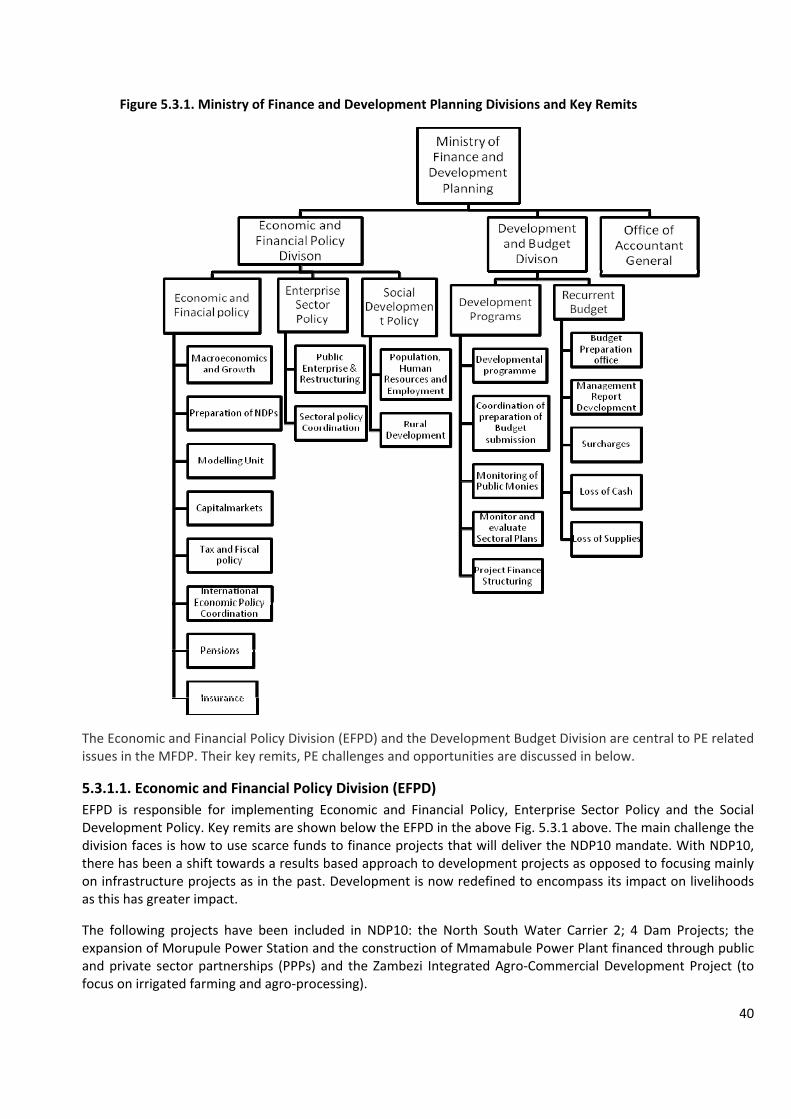
40
Figure 5.3.1. Ministry of Finance and Development Planning Divisions and Key Remits
The Economic and Financial Policy Division (EFPD) and the Development Budget Division are central to PE related issues in the MFDP. Their key remits, PE challenges and opportunities are discussed in below.
5.3.1.1. Economic and Financial Policy Division (EFPD) EFPD is responsible for implementing Economic and Financial Policy, Enterprise Sector Policy and the Social Development Policy. Key remits are shown below the EFPD in the above Fig. 5.3.1 above. The main challenge the division faces is how to use scarce funds to finance projects that will deliver the NDP10 mandate. With NDP10, there has been a shift towards a results based approach to development projects as opposed to focusing mainly on infrastructure projects as in the past. Development is now redefined to encompass its impact on livelihoods as this has greater impact.
The following projects have been included in NDP10: the North South Water Carrier 2; 4 Dam Projects; the expansion of Morupule Power Station and the construction of Mmamabule Power Plant financed through public and private sector partnerships (PPPs) and the Zambezi Integrated Agro‐Commercial Development Project (to focus on irrigated farming and agro‐processing).
41
In view of the current economic situation, a task force was set up to rationalize and prioritize the projects. In addition, the Government is making use of its reserves to cushion the effects of the credit crunch. Monitoring and evaluation of MFDP financed projects is undertaken by finance officers and development officers placed in individual ministries.
5.3.1.2. EFPD‐ PE Challenges and Opportunities There is a need to quantify the costs and benefits of environmental investments to strengthen the case for inclusion of projects that have a PE focus in NDP10. The major challenge EFPD faces in catering for PE concerns is that there are competing issues that have to be catered for such as HIV/AIDS, economic diversification and poverty reduction. A better understanding by economists on how to, as well as a greater appreciation of the need to, incorporate the environment into project appraisal is needed. A multi‐criteria analysis framework has been developed by the Department of Environmental Affairs (DEA) for use by planning officers in appraising the environmental component of proposed projects. But this is not yet being used by MFDP officers.
MFDP officers in individual ministries attempt as much as possible to ensure that PE issues are incorporated when projects are appraised and evaluated. But they mainly rely on the Environmental Impact assessment (EIA). This EIA is catered for in the financial budget of the project so that it is undertaken before the start of the project. MFDP officers in line ministries also take into consideration the socio‐economic aspect of the project. For instance, if a clinic is constructed, they look at the positioning of the building, whether it would benefit the adjacent communities as well as labour intensive projects and women will be employed thus reducing poverty. The budget matrix is an effective tool which planning officers assert has improved efficiency by about 80%. However, the current focus on results based development which is pro‐poor and takes the environment into consideration, means that the budget matrix needs to be reviewed to ensure that it includes a variety of indicators for appraising and evaluation of projects.
5.3.2.1. Food and Poverty Policy Coordination Section (FPPCS) FPPCS uses several policies to execute its mandate. These include: Revised National Policy for Rural Development of 2002; National Strategy for Poverty Reduction 2003 the 2000 Revised National Food Strategy and the CBNRM policy. The Food and Poverty Policy Coordination Section of MFDP is currently conducting the NSPR review. Three focal areas have been identified: Labour market, Social Safety nets and Environment‐poverty links. The first two components are underway and the consultants for the third component are being recruited. There is also a continuous effort to mainstream poverty and the environment into the NDP processes.
The Rural Development Council (RDC) is the structure responsible for promoting and coordinating all rural development activities of the RDP across various sectors and levels of Government, as well as across the various stakeholders within the economy. The council achieves this through its various technical sub‐committees. RDC and its sub‐committees as well as their responsibilities are shown in table 5.3.2.1 below. MFDP is the focal point for all anti‐poverty initiatives. As stated earlier, an additional committee, MSCPR whose membership comprises key sector ministries is the implementation machinery of RDC and drives and coordinates the NSPR. MSCPR provides input and reports on a quarterly basis to the RDC on poverty reduction related issues. Additionally, a Poverty Desk housed within the Socio‐Economic Division MFDP has been established with support from GoB/UNDP programme of collaboration. Its capacity has been augmented by an international consultant who has been in office since September 2005. The main remit for the consultant is to chart the course for the Poverty Unit and the MSCPR by translating the ideals in the NSPR into action.
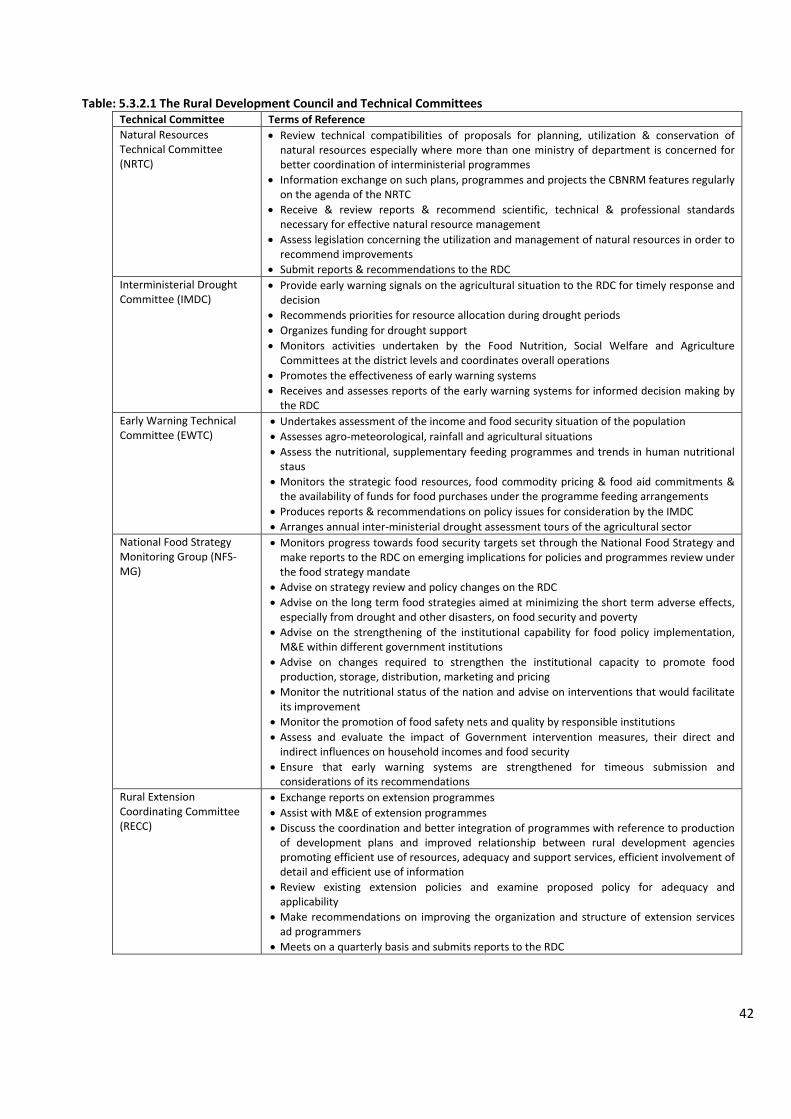
42
Table: 5.3.2.1 The Rural Development Council and Technical Committees Technical Committee Terms of Reference Natural Resources Technical Committee (NRTC)
• Review technical compatibilities of proposals for planning, utilization & conservation of natural resources especially where more than one ministry of department is concerned for better coordination of interministerial programmes
• Information exchange on such plans, programmes and projects the CBNRM features regularly on the agenda of the NRTC
• Receive & review reports & recommend scientific, technical & professional standards necessary for effective natural resource management
• Assess legislation concerning the utilization and management of natural resources in order to recommend improvements
• Submit reports & recommendations to the RDC Interministerial Drought Committee (IMDC)
• Provide early warning signals on the agricultural situation to the RDC for timely response and decision
• Recommends priorities for resource allocation during drought periods • Organizes funding for drought support • Monitors activities undertaken by the Food Nutrition, Social Welfare and Agriculture Committees at the district levels and coordinates overall operations
• Promotes the effectiveness of early warning systems • Receives and assesses reports of the early warning systems for informed decision making by the RDC
Early Warning Technical Committee (EWTC)
• Undertakes assessment of the income and food security situation of the population • Assesses agro‐meteorological, rainfall and agricultural situations • Assess the nutritional, supplementary feeding programmes and trends in human nutritional staus
• Monitors the strategic food resources, food commodity pricing & food aid commitments & the availability of funds for food purchases under the programme feeding arrangements
• Produces reports & recommendations on policy issues for consideration by the IMDC • Arranges annual inter‐ministerial drought assessment tours of the agricultural sector
National Food Strategy Monitoring Group (NFS‐MG)
• Monitors progress towards food security targets set through the National Food Strategy and make reports to the RDC on emerging implications for policies and programmes review under the food strategy mandate
• Advise on strategy review and policy changes on the RDC • Advise on the long term food strategies aimed at minimizing the short term adverse effects, especially from drought and other disasters, on food security and poverty
• Advise on the strengthening of the institutional capability for food policy implementation, M&E within different government institutions
• Advise on changes required to strengthen the institutional capacity to promote food production, storage, distribution, marketing and pricing
• Monitor the nutritional status of the nation and advise on interventions that would facilitate its improvement
• Monitor the promotion of food safety nets and quality by responsible institutions • Assess and evaluate the impact of Government intervention measures, their direct and indirect influences on household incomes and food security
• Ensure that early warning systems are strengthened for timeous submission and considerations of its recommendations
Rural Extension Coordinating Committee (RECC)
• Exchange reports on extension programmes • Assist with M&E of extension programmes • Discuss the coordination and better integration of programmes with reference to production of development plans and improved relationship between rural development agencies promoting efficient use of resources, adequacy and support services, efficient involvement of detail and efficient use of information
• Review existing extension policies and examine proposed policy for adequacy and applicability
• Make recommendations on improving the organization and structure of extension services ad programmers
• Meets on a quarterly basis and submits reports to the RDC
43
5.3.2.2. FPPCS ‐ PE Challenges and Opportunities There is a need to develop the key requisites that are needed to properly integrate PE into FPPCS initiatives. These include: a developing good statistical base and capacity building within the FFPCS. Adequate documentation of the state of the environment and the natural resource base together with clarification regarding the links between poverty and the environment is needed. This could then be used to enhance sensitization and more advocacy for PE issues which is needed. Most of the current strategies, programmes and projects are welfare focused and the productivity is aspect not emphasized. This is critical if the programmes and projects are to be sustainable. Existing SSNs also need to be harmonized to avoid duplication and wasting of scarce resources. Further, the SSN concept needs to be broadened to focus on moving people out of SSNs. The ongoing review of the NSPR presents a golden opportunity for PEI to support integration of PE across the NSPR and address issues raised here.
The RDC is crosscutting in terms of the key ministries and issues covered. However, its ability to perform effectively is seriously hampered by the fact that while members who sit on the various technical committees may have the expertise and knowledge of the subject area to deal with poverty and environmental issues and how they relate to economic growth, it has been observed that over the years membership of the technical committees is at junior level and not director level. This is has hampered progress on inclusion of PE issues when it comes to budget allocation because junior members do not have the leadership and authority to drive PE issues to the forefront.
5.3.3. The Central Statistics Office (CSO) CSO which also falls under MFDP has the primary function to provide Government Ministries and Departments, Non‐ Governmental Organizations (NGOs) and members of the public in general, with information for monitoring, evaluation and formulation of development plans and programmes. It performs this function through collection, processing and analysis of data; reporting and dissemination of results through publications, workshop and seminars.
CSO provides regular and timely statistical information on the economic and social state of the country and its people. For example, it provides statistical information on the socio‐economic status of households, families and population characteristics. The CSO also conducts large scale national sample surveys for creating data base needed for studying the impact of specific problems for the benefit of different population groups in diverse socio‐economic areas such as employment, consumer expenditure, literacy levels, health, informal sector activity etc. It has an in‐house facility to process data, conduct and arrange training programmes in statistics and related subjects and disseminate diverse statistical information through a number of regular or ad‐hoc publications to Government, parastatals, SADC member countries and various other national and international organizations.
CSO has nine divisions, namely the divisions of: agriculture and environment; transport and industrial; communication, prices and trade; labour, national accounts and regional offices; cartography, surveys; demography and census, education and health; information technology; and administration. Each division has its own statistical unit.
The Environment Statistics Unit (ESU) compiles statistics on the availability and the state (quality) of natural resources, the human activities and natural events that have impact on the state of the environment, and the responses of the Government, NGOs, communities and individuals to these impacts. The data is collected from both Government and non‐Government sources and covers a broad range of subject areas such as population numbers and population distribution; mineral production; water production, consumption and quality; air quality; land tenure and use; energy production and consumption; wildlife; and bio‐diversity.
44
ESU has produced 6 publications since 2000. These include: the Enviro Stats Brief (2008), Environment Report (2006); Energy Statistics Publication (2002); Selected Environmental Indicators Publications (2002); Forestry Statistics Digest (2004); Wildlife Statistics (2005); Energy Stats Brief and the Energy Statistics Publication (2004).
In the area of poverty and socioeconomic status of households CSO conducts censuses at 10 year intervals; these are subsequently followed by household income expenditures surveys (HIESs). To date, three HIESs have been conducted. Due to the realization that the HIES does not capture all poverty related indicators to CSO recently embarked on a core welfare indicator survey which is intended to address this shortcoming of the HIES.
5.3.3.1. CSO – PE Challenges and Opportunities CSO faces a number of challenges in fulfilling it remit. For example, for some of its publications it relies on data from departments of key sectoral ministries and hence, if there is a delay in data provision it hampers CSO’s ability to publish all inclusive statistics in its publications. CSO is about to conduct a core welfare indicator survey after it was noted that conventional instruments currently being used (such as the HIES) do not encompass all welfare or poverty related indicators. The core welfare indicator survey is intended to capture this data as it utilizes more poverty indicators. Additionally, most of the environmental statistics collected and published by CSO are not captured in an all encompassing way. This suggests that there is an avenue through which PEI support can be targeted at CSO to assist with coming up with all inclusive indicators for the environment.
5.3.4. The Ministry of Environment, Wildlife and Tourism (MEWT) The mandate of MEWT is to formulate and support the implementation of environmental policy covering issues as diverse as forestry and range resources, meteorological services, waste management and pollution control, wildlife conservation and tourism development and promotion. Figure 5.3.4 on the following page depicts MEWT, its departments and together with their key responsibilities.
An environmental keynote paper was prepared by DEA as a key input for NDP10. This document is informative and it is a useful guide for applying environmental considerations to the sectoral agenda. One key recommendation of the Keynote paper was to stress the importance of various sector ministries taking responsibility for key environmental issues and that environment should be seen as an issue cutting across Government. To this end during NDP10 MEWT will focus on mainstreaming environmental practices into national planning processes. The guidelines for doing this are yet to be developed and disseminated to all stakeholders within and outside government. A communication strategy is being developed by MEWT with support from the Environmental Support Programme (ESP). Areas that were identified as requiring action during NDP10 are sustainable natural resource utilization, energy, biodiversity management, ecosystem management, pollution and waste management, climate change and public awareness, environmental education and environmental information. All the MEWT departments are responsible for implementing the CBNRM policy. The following have been identified as possible areas for PEI support: providing evidence and analysis to strengthen the case for integrating environment and climate change across Government (i.e. not just a MEWT responsibility); making sure that the NSSD will have a poverty focus; support to raise cross‐Government capacity to tackle climate change including coordination, evidence, tools and diagnostics and plan to take forward this agenda.
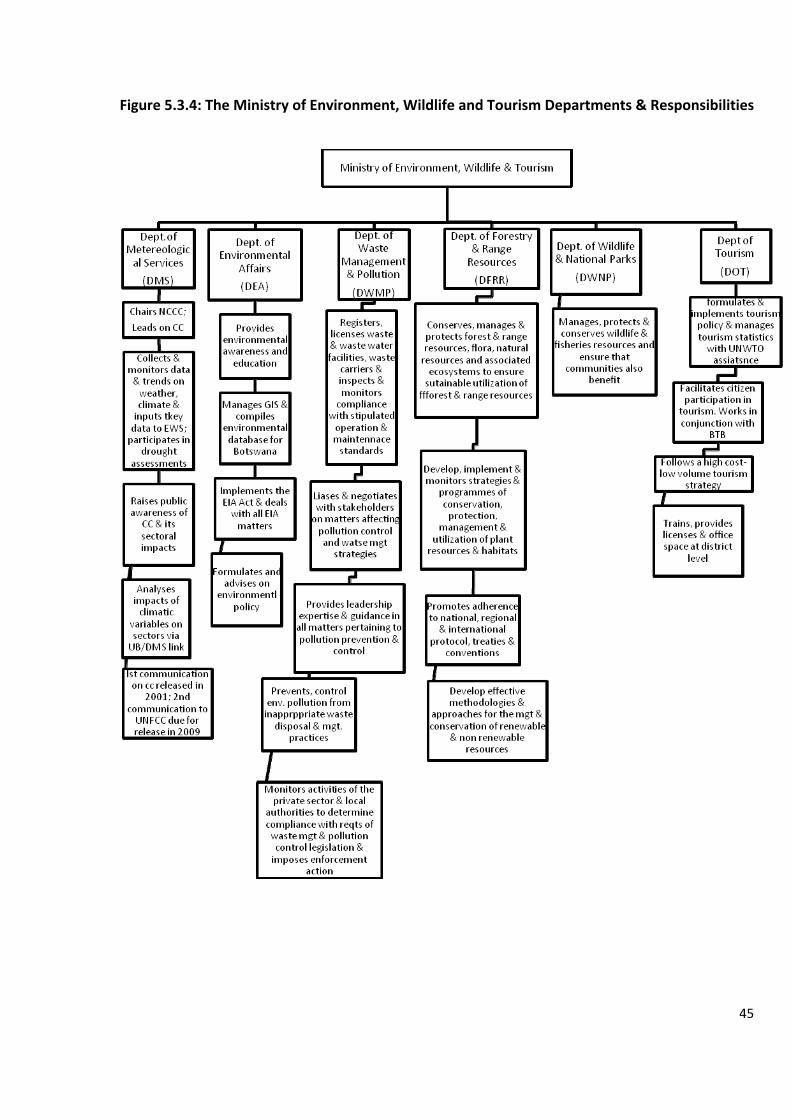
45
Figure 5.3.4: The Ministry of Environment, Wildlife and Tourism Departments & Responsibilities

46
5.3.4.1. The Department of Meteorological Services (DMS) DMS has the remit to provide timely and exchange reliable and accurate data and information on the weather and climate. It does this by observing, collecting, monitoring, processing, analyzing, forecasting and predicting weather and climate. Its functions include: the measurement, observation and recording of meteorological observations required for various socio‐economic development activities at national, regional and international levels. For example, DMS participates in drought assessments, inputs data to the early warning system and conducts studies on the sectoral impact of climate change in Botswana. To this end, DMS recently established a link with the University of Botswana through which the two institutions will collaborate. DMS also provides weather forecasting and advisory services, issues warnings of floods, severe storms, heat waves, cold spells and other adverse weather conditions likely to endanger life and/or property. Additionally, it supplies meteorological information and disseminates its information to the public through the publication of meteorological bulletins and the provision of meteorological data, information and advice to the general public. It also works in cooperation with other meteorological services regionally and internationally. DMS is the lead on climate change issues in Botswana and as such is the chair of the national committee on climate change (NCCC).
5.3.4.2. DMS‐ PE Challenges and Opportunities The DMS has strived to convince sector Ministries that climate change is an issue which will impact significantly upon all sectors but to date there is still a perception in some Ministries that climate change is an environmental issue and the sole responsibility of MEWT. This emphasizes a need to work across government to ensure that politicians and senior civil servants recognize the (economic and social) importance of climate change across all government portfolios. Of note is that the key ministry MEWT personnel and the minister are very much aware of the issues. In fact, the minister of MEWT is a champion of issues related to the environment and climate change. The challenge is ensuring that other Ministries recognize their need to take action with regards to adaptation and mitigation. DMS is the CDM focal point in Botswana and very much aware of potential opportunities for carbon financing mechanisms to support the Botswana Government and private sector to benefit from global financing mechanisms. However the capacity of both government and private sector interests to access such financing mechanisms is limited and needs support. A key challenge for DMS, a primarily science based department, is for it to take on the mantle of coordinator and advocate for climate change across Government so that it becomes embedded. The institutional frameworks for tackling climate change therefore need strengthening.
5.3.5.1 Department of Environmental Affairs (DEA) DEA emerged from the National Conservation Strategy Agency and was established in 2005 as a department of MEWT. It key responsibility is to integrate, coordinate and document all activities and initiatives of government departments within the same Ministry. These include the formulation of environmental policy (such as leading the finalization of the CBNRM policy), environmental education and overseeing multilateral environmental agreements.
DEA has developed several tools it uses in its work. A key tool that DEA uses to carry out its mandate is the EIA Act which promotes environmental assessment and management in development projects and also allows for Strategic Environmental Assessments (SEA). SEA could be applied to policies and plans across Government to support environmental mainstreaming. An Environmental Management Bill (EMB) was drafted and is currently before the Attorney General (AG). The DEA has also undertaken natural resource accounting for the livestock,
47
minerals and water sectors to influence policy in these sectors. For example, livestock looks at cattle numbers, their contribution to the economy as well as the cost of degradation as a result of overstocking. These studies are very useful but their impact in policy making has been limited. The DEA also undertook a study on the Net Genuine Savings Index (GSI) with regard to the environment. An Environmental Information System (EIS) is being developed by the Environmental Support Programmes (ESP) co‐funded by the UNDP and GoB. When fully operational it is expected that the EIS will incorporate data from various sectors including the private sector.
Environmental journalism is an avenue DEA could use to raise public awareness. However, journalists need training in the area because their articles and reports tend to be alarmist spelling doom and gloom scenarios as opposed to being educational and informative to the public.
The DEA has initiated formulation of a National Strategy for Sustainable Development (NSSD) which aims to integrate sustainability across the work of Government and society.
Table 5.3.5.1. Examples of DEA Efforts at Environmental Mainstreaming from 1990 to date National Policy on Conservation and Development (1990) • Mandated DEA to produce a State of the Environment Report (SOER) very two
years. 2002 first one published. Used to inform national and district development planning.
• In 2005 district SOER takes place to ensure integration into district –urban planning processes. Saw the establishment of district/urban environmental committees comprising sectoral officers and planners to undertake the SOER.
• Regular training seminars and national workshops for district officers and planners have been held on SOER processes, institutional and data requirements
• Southern District Council has produced an Integrated Land Use Plan (ILUP) • All districts will have produced ILUPs by the end of NDP 10 , DDP7, UDP3 period.
EIA Legislation enacted in 2005 • Provides for the establishment & strengthening of EIA in the decision making processes so that environmental implications of policies, programmes, plans and projects are evaluated prior to implementation
Environmental Economics and natural Resource Accounting programme (2004)
• Assessed the value of natural resources and mainstream environmental or economic instruments into the planning process. Three accounts produced for livestock, water and minerals.
• 120 sectoral officers trained in environmental economic principles and methodologies with the goal of getting them to integrate these concepts into their development planning activities.
The National Environmental Education Strategy and Action Plan (NEESAP) 2007‐2012
• Guides the implementation of environmental education and awareness building in Botswana by outlining strategies and objectives necessary to build awareness and educate the general public on the environment.
• The DEA coordinates environmental education activities through an Environmental Education Committee comprising of various stakeholders in the area of environment and related areas. NEESAP has just undergone a review and the revised version is due for publication.
• DEA continues to raise awareness through commemoration of environmental days, participation at national fairs, publications for the general public, community environmental workshops, promoting CBNRM and raising awareness in schools through resource workshops for in‐service and pre‐service teachers and students.
5.3.5.2 DEA – PE Challenges and Opportunities Data availability is a key issue in the environment field. Accurate data and statistics on the state of the environment in Botswana are scarce. Environmental data capture and management is a key constraint for the nation. Information and data on environmental trends is needed to inform policy formulation and facilitate research.
DEA has successfully trained district planners to use the multi‐criteria analysis tool to integrate environment in district plans. This approach could be relevant to the work of MFDP planning officers in their work. High level of strategic advocacy is needed to lobby the parliamentary committee on agriculture and the environment; and the parliamentary committee on population and sustainable development.
48
There is a debate regarding the powers and mandate that DEA has to effectively promote sustainable environmental management in Botswana. This includes discussion regarding the evolution of DEA into an environmental regulatory authority as envisaged in the EMB. Regardless it is clear that there is a need for line ministries to undertake reform or provide institutional space to better manage environment within their own institutions. The EIA legislation allows for strategic environmental and an SEA of key policies and plans such as NDP 10 could help to better integrate the environment across GoB.
5.3.6.1. Department of Waste Management and Pollution Control (DWMPC) DWMPC provides leadership, expertise and guidance in all matters pertaining to pollution prevention and control. It also deals with the prevention and control of environmental pollution from inappropriate and inadequate waste disposal and waste management practices. The DWMPC liaises and negotiates with stakeholders on matters affecting pollution control and waste management strategies. DWMPC also registers and licenses waste and waste water facilities and inspects and monitors compliance with stipulated operation and maintenance standards. Additionally, DWMPC monitors activities of the private sector and local authorities to determine compliance with the requirements of waste management and pollution control legislation and undertakes enforcement. DWMPC conducts research on pollution and waste management.
5.3.6.2. DWMPC – PE Challenge and Opportunities Sanitation efforts have concentrated on the building of ventilated improved (VIP) and closed pit latrines and to a smaller extent on improved sewerage coverage. Efforts have focused on prioritizing the segment of the population without access to sanitation, converting pit latrines to VIP latrines and raising the target population with adequate sanitation to 75% by 2030 (CWP‐ Botswana, 2004). Population growth in major centres and extended sewerage systems have led to an exponential increase of return flows of waste water. Inappropriate designs of treatment facilities have resulted in spillage and damage to the environment. There are approximately 75 treatment facilities nationwide that use different technologies (pond systems, activated sludge, trickling filters, RBC and wetlands) each with varying quality, treatment and discharge compliance rates. Urban centres have good sewage coverage; focus should be on the rural areas. The amount of wastewater will increase significantly in the next 25 years and water reuse strategies need to be developed. Other requirements include trade effluent standards and agreements, licensing water of sewer networks and treatment facilities, proper legislation and monitoring protocols. Work has been done on vulnerability mapping, case studies on hazardous waste, landfill studies and the country is a member of the Basel Convention. There no sanitary landfills in Botswana. Problems of waste management and pollution control also include pollution due to spillage of used oil on to the ground which may eventually contaminate water and the improper disposal of hazardous waste. There is a clear need to undertake analysis and provide evidence on the costs and benefits of safe and sustainable waste management in Botswana as well as mechanisms to reduce and avoid pollution from waste.
5.3.7.1. Department of Forestry and Range Resources (DFRR) DFRR was established in 2006 through a merging of the former Department of Forestry, the Agricultural Resources Board and the Division of Range Ecology. DFRR is to conserve, manage and protect forest, range resources, flora and other natural resources and associated ecosystems to ensure the sustainable utilization of forests and range resources in order to improve the socio‐economic development of Botswana. DFRR is the lead in all matters pertaining to the conservation and management of the country’s forest and range resources through the development, coordination and implementation of policies, legislation and programmes in the forestry and range resources sectors. It coordinates the development of licensing and permit systems to regulate, control and monitor the utilization of forest and wild plant genetic resources. Develops strategies, programmes and undertakes research to promote sustainable utilisation of forests and other wild plant
49
resources; forestry regeneration through tree seed production and tree nurseries development; combats soil and environmental degradation in adherence with national and international principles and agreements and provides guidance for management and control of bush fires. DFRR works with other stakeholders in facilitating and promoting CBNRM programmes crucial for improving livelihoods in a sustainable manner. DFFRR support to CBNRM comes through involving communities in the sustainable management of rangeland and forest resources so that they can derive livelihoods from them while creating incentives for biodiversity conservation. To this end, DFRR supports the formation of community trusts and helps to access funds through the Community Conservation Fund (CCF). DFRR also provides training to communities in sustainable harvesting practices and the cultivation of high value plant resources, advises on product development and assist communities in their marketing efforts. Additionally, DFRR promotes public awareness and appreciation of forest and range resources conservation through the development of conservation education strategies and programmes in collaboration with other relevant stakeholders. The indigenous vegetation project is an innovative approach to community involvement in rangeland monitoring and management that DFRR has piloted. It also advises Land boards, Councils, private sector and civil society on all matters related to forestry and range resources management. There is a conflict between the methodology used by DFRR and MOA when conducting the range assessment for the drought assessment. DFRR officers look at range cover and MOA officers look at palatable species for livestock. This obviously results in different range condition score coming out of MOA and DFRR. This needs to be reconciled to avoid conflict.
5.3.7.2. DFRR – PE Challenges and Opportunities Forest and rangeland degradation are significant issues in Botswana and there is a need for improved data and analysis on the rates of degradation and their impact upon society and the economy. More recently the occurrence of veld fires some of which are anthropogenic in Botswana has been a source of concern. DFRR needs more support in its efforts the area of prevention, management and control of such fires.
5.3.8.1. Department of Wildlife and National Parks (DWNP) DWNP’s mandate is to manage, protect and conserve Botswana’s wildlife and fisheries resources while at the same time ensuring that communities that reside in areas where the wildlife and fisheries are found also benefit. Wildlife and fisheries are renewable resources and provide another avenue through which the country can diversify its economy away from being solely reliant on minerals which are non‐renewable. For example, wildlife provide a key resource to the tourism industry which now contributes between 6 and 9% to GDP (NDP 10, 2009) and its full potential is yet to be fully exploited. The Community Extension and Outreach Division of DWNP provide support to CBNRM and facilitate the involvement of local communities in the sustainable utilization of wildlife and fish resources. The division employs officers at national level as well as liaison officers at the district level and offers direct assistance to communities in the form of: community mobilization; training for Community Based Organizations (CBOs) in governance, financial management, managerial and administrative skills; capacity building for Boards of Trustees; extension support to CBOs to design strategic community action plans and facilitate their implementation, facilitate the formation of Technical Advisory Committees (TACs) and CBNRM related advice on areas such as rural development and benefit sharing. CBNRM has been generating significant revenues, P23 million in 2008, for communities. Most of the revenue comes from wildlife hunting. Communities in a given block are given a hunting quota and benefit from the proceeds from the hunting license. For example, an elephant license is worth P80 000. The CBO receives the proceeds and uses them for the CBO defined priorities. Of the P80 000 received for the elephant P20 000 goes to
50
the DWNP. The DWNP also monitors the performance of projects and uses an annual financial audit as a toll for monitoring. The audit is conducted before hunting quotas are issued. The DWNP also has a CBO database which it uses to monitor and evaluate CBNRM projects.
5.3.8.2. DWNP‐PE Challenges and Opportunities DWNP is concerned that accountability of some CBOs may be a problem, as Civil Society Organizations (CSOs) receive significant CBNRM resources but how it is distributed is a major concern. The existence of human – wildlife conflict whereby animals destroy crops is a serious concern. To combat this problem DWNP offers compensation to farmers. Additionally, the DWNP provides guidance for communities to take part in CBNRM as doing so will reduce wildlife – human conflict because when communities begin to get revenues from wildlife conservation they will see the value in the animals and will not resort to killing the animals as a way to resolve the problem, but will instead find a way to coexist with the animals.
With regard to fisheries, DWNP has been conducting fish stock assessments quarterly since 1999. However these data are yet to be analyzed so that they can adequately inform policy. Current catches are around 170 tonnes per annum. Generally, the observation is that the fish resource is underutilized. It is estimated that commercial fisheries in the Delta could reach 10 000 tonnes.
5.3.9.1. Department of Tourism (DOT) The DOT has the responsibility of formulating and implementing Botswana’s Tourism Policy and managing tourism statistics with assistance from the United Nations World Tourism Organization (UNWTO). The Tourism Policy of 2002 and the Tourism Act of 1992 are both currently under review and it is expected that they will be out in 2009. DOT recognizes that poverty and the environment are inextricably linked to tourism. It is for this reason that they have adopted a high cost – low volume tourism strategy. Several measures have been adopted to promote diversification and meaningful participation by local communities. These include the implementation of the National Eco‐tourism strategy which promotes community‐based tourism principles. The strategy has a list of potential eco‐tourism sites and communities residing adjacent to sites are encouraged and assisted to develop projects. Tourism extension services and tourism officers cover almost all districts and provide assistance to interested parties especially communities. DOT has 6 extension offices countrywide whose main remit is to provide licensing and training and office space. The DOT also implements the tourism master plan which assists all stakeholders especially rural communities to derive sustainable benefits from tourism while safeguarding the very resources upon which the tourism industry depends. The tourism policy is government led but private sector driven. At its core is its recognition that citizens have to participate actively in tourism. To this end DOT works in conjunction with the Botswana Tourism Board (BTB) whose activities are discussed below. In order to encourage and facilitate investment in the tourism sector, the MWET through the Land Boards have established a Land Bank whose sole purpose will be to assist tourism promoters obtain access to land for their activities. Currently Botswana receives about 18 000 tourist per annum. During NDP10 it is the goal to increase these numbers so that tourism’s contribution to GDP rises to 15% of GDP from the current 6‐9%. Examples of community based projects which the DOT has been involved with are the Camel Utilization Project in Tsabong, the Gudigwa community project and the World Heritage Site of Tsodilo Hills. DOT has also taken the lead in the sustainable tourism component of the Okavango Delta Management Plan.
5.3.9.2. DOT – PE Challenges and Opportunities DOT has over the years acquired strength and experience in ensuring that the tourism product is a pristine and wilderness preserve on the environmental side. However, there is a need to diversify and strengthen their
51
capability in other areas so that tourism can also be used concurrently as a way to improve rural livelihoods. The new policy will bring in diversification with a focus on promoting and improving rural livelihoods.
5.4.1. Ministry of Agriculture (MoA) MOA is responsible for ensuring national food security in Botswana around livestock and arable agriculture production as well as conservation and cooperative development. In so doing it also to tackles poverty by promoting diversified livelihoods which create jobs, increased nutritional levels, improved household incomes and sustainable management of land and water resources. NDP 10 sets targets to increase agricultural productivity and self‐sufficiency. Cereal productivity is targeted to rise to 50% of national demand from its current 15% and agriculture’s contribution is set to rise from its current 1.7% to 2.2% (NDP 10, 2009). MOA has an annual budget of 1.2 billion pula of which 75% is for recurrent costs. MOA has experts charged with tackling issues of environmental degradation as they impact on agricultural productivity but these activities are accorded low priority by decision makers and are often under budgeted. For example, the NDP 10 budget for land rehabilitation has been reduced to due to budgetary constraints. While the NSPR and the National Agricultural Development Policy (NADP) 1991 set out targets to use agriculture as a driver of poverty reduction in reality such activity tends to be underfunded and have variable success. Subsistence farmer productivity is a lowly 50kg/ha – well below similar figures in the region and reflect on‐going difficulties in raising agricultural productivity for the poorest and most vulnerable members of society (2004). MOA has seven departments: Crop Production, Agricultural Research, Extension Services, Animal Production, Veterinary Services, Agribusiness promotion and Corporate Services. The department and their key remits are shown in Figure 5.4.1. below:
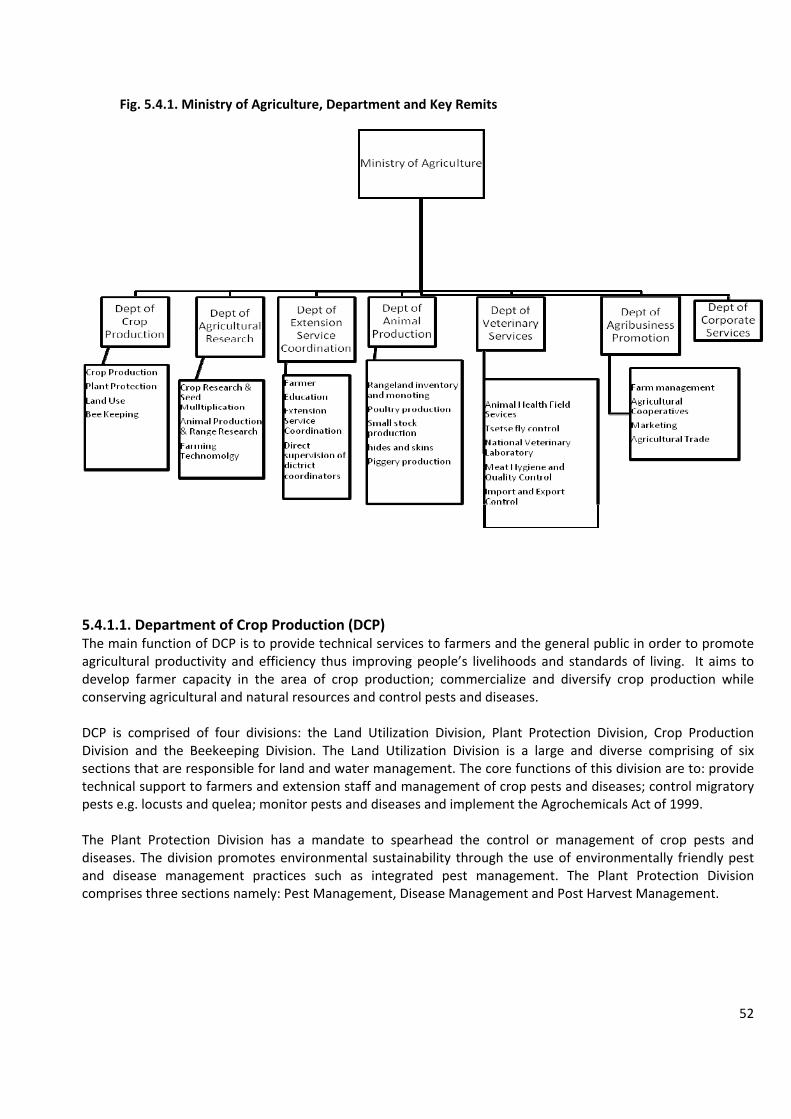
52
Fig. 5.4.1. Ministry of Agriculture, Department and Key Remits
5.4.1.1. Department of Crop Production (DCP) The main function of DCP is to provide technical services to farmers and the general public in order to promote agricultural productivity and efficiency thus improving people’s livelihoods and standards of living. It aims to develop farmer capacity in the area of crop production; commercialize and diversify crop production while conserving agricultural and natural resources and control pests and diseases. DCP is comprised of four divisions: the Land Utilization Division, Plant Protection Division, Crop Production Division and the Beekeeping Division. The Land Utilization Division is a large and diverse comprising of six sections that are responsible for land and water management. The core functions of this division are to: provide technical support to farmers and extension staff and management of crop pests and diseases; control migratory pests e.g. locusts and quelea; monitor pests and diseases and implement the Agrochemicals Act of 1999. The Plant Protection Division has a mandate to spearhead the control or management of crop pests and diseases. The division promotes environmental sustainability through the use of environmentally friendly pest and disease management practices such as integrated pest management. The Plant Protection Division comprises three sections namely: Pest Management, Disease Management and Post Harvest Management.
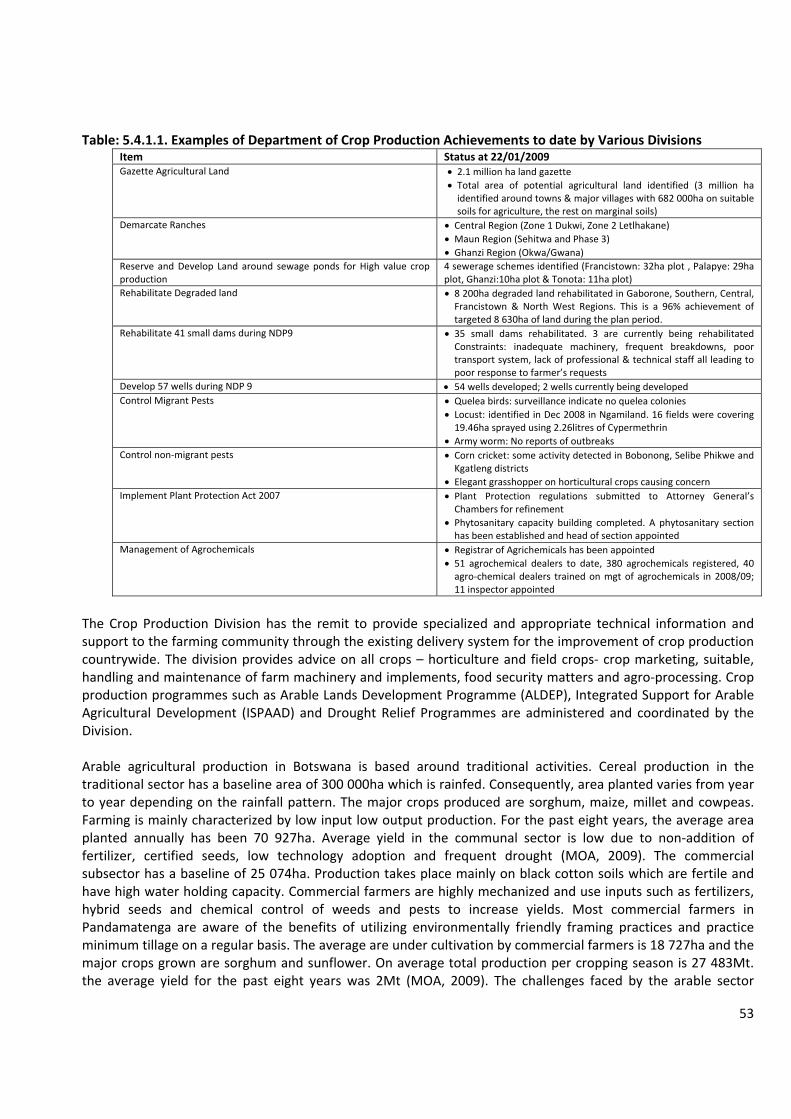
53
Table: 5.4.1.1. Examples of Department of Crop Production Achievements to date by Various Divisions
Item Status at 22/01/2009 Gazette Agricultural Land • 2.1 million ha land gazette
• Total area of potential agricultural land identified (3 million ha identified around towns & major villages with 682 000ha on suitable soils for agriculture, the rest on marginal soils)
Demarcate Ranches • Central Region (Zone 1 Dukwi, Zone 2 Letlhakane) • Maun Region (Sehitwa and Phase 3) • Ghanzi Region (Okwa/Gwana)
Reserve and Develop Land around sewage ponds for High value crop production
4 sewerage schemes identified (Francistown: 32ha plot , Palapye: 29ha plot, Ghanzi:10ha plot & Tonota: 11ha plot)
Rehabilitate Degraded land • 8 200ha degraded land rehabilitated in Gaborone, Southern, Central, Francistown & North West Regions. This is a 96% achievement of targeted 8 630ha of land during the plan period.
Rehabilitate 41 small dams during NDP9 • 35 small dams rehabilitated. 3 are currently being rehabilitated Constraints: inadequate machinery, frequent breakdowns, poor transport system, lack of professional & technical staff all leading to poor response to farmer’s requests
Develop 57 wells during NDP 9 • 54 wells developed; 2 wells currently being developed Control Migrant Pests • Quelea birds: surveillance indicate no quelea colonies
• Locust: identified in Dec 2008 in Ngamiland. 16 fields were covering 19.46ha sprayed using 2.26litres of Cypermethrin
• Army worm: No reports of outbreaks Control non‐migrant pests • Corn cricket: some activity detected in Bobonong, Selibe Phikwe and
Kgatleng districts • Elegant grasshopper on horticultural crops causing concern
Implement Plant Protection Act 2007 • Plant Protection regulations submitted to Attorney General’s Chambers for refinement
• Phytosanitary capacity building completed. A phytosanitary section has been established and head of section appointed
Management of Agrochemicals • Registrar of Agrichemicals has been appointed • 51 agrochemical dealers to date, 380 agrochemicals registered, 40 agro‐chemical dealers trained on mgt of agrochemicals in 2008/09; 11 inspector appointed
The Crop Production Division has the remit to provide specialized and appropriate technical information and support to the farming community through the existing delivery system for the improvement of crop production countrywide. The division provides advice on all crops – horticulture and field crops‐ crop marketing, suitable, handling and maintenance of farm machinery and implements, food security matters and agro‐processing. Crop production programmes such as Arable Lands Development Programme (ALDEP), Integrated Support for Arable Agricultural Development (ISPAAD) and Drought Relief Programmes are administered and coordinated by the Division. Arable agricultural production in Botswana is based around traditional activities. Cereal production in the traditional sector has a baseline area of 300 000ha which is rainfed. Consequently, area planted varies from year to year depending on the rainfall pattern. The major crops produced are sorghum, maize, millet and cowpeas. Farming is mainly characterized by low input low output production. For the past eight years, the average area planted annually has been 70 927ha. Average yield in the communal sector is low due to non‐addition of fertilizer, certified seeds, low technology adoption and frequent drought (MOA, 2009). The commercial subsector has a baseline of 25 074ha. Production takes place mainly on black cotton soils which are fertile and have high water holding capacity. Commercial farmers are highly mechanized and use inputs such as fertilizers, hybrid seeds and chemical control of weeds and pests to increase yields. Most commercial farmers in Pandamatenga are aware of the benefits of utilizing environmentally friendly framing practices and practice minimum tillage on a regular basis. The average are under cultivation by commercial farmers is 18 727ha and the major crops grown are sorghum and sunflower. On average total production per cropping season is 27 483Mt. the average yield for the past eight years was 2Mt (MOA, 2009). The challenges faced by the arable sector
54
include inadequate technology application, unreliable rainfall, and lack of access to credit, high input costs, and lack of crop insurance, poor agricultural infrastructure and flooding. Botswana cereal production is low and threatens food insecurity. Both the subsistence and commercial farmers produce 15% of the country’s total annual cereal requirement. Average cereal production for the current period by both sectors is 43 000MT while national demand is 177 000Mt. Consequently, Botswana is a net importer of food with about 80% of the cereal requirement being imported (MoA, 2009). The agriculture budget for 2009/10 is 1.2 billion pula, 900 million is for recurrent costs and 300 million is for development projects. NADP 1991 is the overarching policy framework whose key objectives are to promote agricultural diversification, promote irrigation and the commercialization of agriculture. To this end, two programmes Integrated Support Programme for Arable Agriculture Development (ISPAAD) and National Master Plan for Arable Agriculture and Dairy Development (NAMPAADD) are being implemented by the DCP. Under ISPAAD cluster fencing, potable water, seeds and fertilizer and access to credit and markets for farmers is facilitated. Farmers register with extension officers and indicate the hectares which they intend to plough. Each farmer is assisted to plough and plant 5ha for free; additional area planted up to a maximum of 16ha receives a 50% subsidy. ISPAAD has a P158.7 million budget. To date 71 899 farm families have collected 1 772Mt of seed enough to cover 238 132ha; 4 330 farm families have collected 2 000Mt of fertilizer enough to cover 2 600ha. A total of 42 567ha has been planted by 14 588 farmers in the communal subsector and 5 870ha in the commercial (Pandamatenga) sector. To date the expenditure on ISPAAD stands at P27 360 306 and ISPAAD will continue in NDP 10 (Draft ASPR, 2007). The ISPAAD programme includes a component for supporting fertilizer subsidies which pose potential environmental risks and excessive financial costs unless they are accompanied by support to promote sustainable land and water management practices which will reduce input runoff. Under NAMPAADD the aim is to make agriculture commercial, competitive and sustainable, reduce agricultural imports; create employment and improve the sector’s contribution to the nation’s economy. NAMPADD focuses on three areas: rainfed agriculture, irrigated agriculture (mainly horticulture) and dairy farming.
5.4.1.2. Department Animal Health and Production (DAP) DAP supports livestock farmers through extension services in training farmers on good management practices, transference of technologies, marketing strategies and livestock production systems; encouraging youth, women and resource poor persons to venture into rabbit, guinea fowl, Tswana chicken, pigs, dairy, beef and small stock production; encouraging citizen investment in ostrich and equine production; facilitating and implementing livestock support programmes to raise production and reduce poverty amongst the poor and vulnerable; and facilitating the demarcation and development of ranches to improve livestock management and the sustainable use of range resources. NDP 10 sets targets of increasing beef production from 10% to 15% and increase the cattle population to 3.5 million. It aims to increase small stock production from an offtake of 5 % to 10% while poultry production will be increased from 65 000 tonnes to 71 500 tonnes by 2016 (NDP 10, 2009). Livestock is the key agricultural sector in terms of contribution to growth and in terms of political patronage. It is also the sector which contributes the most to environmental degradation through overgrazing – especially in the communal lands – and water consumption (livestock consume nearly 80% of the country’s water resources. The Livestock Infrastructure Improvement Development (LIMID) programme is one intervention administered by the DAP to achieve its objectives. LIMID’s objectives are to promote food security through improved livestock (cattle and smallstock) productivity; improve livestock management as well as range resource management and conservation and to provide safe and hygienic poultry. LIMID assists all farmers through several components: animal husbandry and fodder support for communal farmers; borehole or well equipping, drilling, purchase and
55
reticulation to all participating farmers. Three components of LIMID are specially designed to assist resource poor farmers.
5.4.1.3. Department of Veterinary Services (DVS) The mandate of DVS is to develop on a sustainable and competitive basis the livestock industry by improving farmer incomes, generating employment opportunities through the promotion and adoption of appropriate technologies and management practices. The key remit of the DVS is to promote a sustainable livestock industry through prevention and control of animal diseases, effective extension service and provision of top quality veterinary public health service.
5.4.1.4. Department of Extension Services (DES) The mandate of DES is to coordinate all agricultural programmes and projects in the country to enhance the performance of the agricultural sector. It does this by pulling together all professional departments in MOA that provide technical information to the farming community so that they work as one. The main functions of DES are to coordinate agricultural extension services in order to improve agricultural productivity; transfer knowledge and practical skills to various farming entrepreneurs and intensify farm visits by frontline extension workers and subject matter specialists to demonstrate the use of new technologies and increase adoption rates. DES has four divisions: Support Schemes, Farmer Training, Field Service and Young Farmers. The Support Schemes division is responsible for planning, coordinating, advising and administrative support of farmer oriented agricultural programmes meant to raise agricultural productivity. Farmer Training is responsible for providing technical and professional guidance to farmer training institutions in order to provide farmer focused services for the improvement of agricultural sector performance. This division also oversees Rural Training Centre (RTCs). Field Services oversees the implementation of extension programmes. The Young Farmers division plans, coordinates and provides professional and technical direction to prospective and incumbent young farmers to encourage and empower them to venture into agriculture.
5.4.1.5. Department of Agricultural Research (DAR) The mandate of the DAR is to generate through research, improved crop and livestock production technologies to promote the development of a productive and environmentally friendly agricultural sector. It does this through commodity and factor focused programmes in arable, animal and range research. The goals of DAR are as follows: to identify, develop and promote innovative and appropriate technologies that will enable the optimization of production through efficient utilization of agricultural resources; and to promote the use of improved genetic resources and good agricultural management practices. The DAR has three divisions: the Division of Animal Production and Range Research; Division of Arable Crops Research and the Support Services Division. The Animal Production and Range Research Division conducts research on the development and improvement of cattle, sheep, goats, range and pasture while the Division of Crops and Arable Crops Research conducts research on crops important to Botswana’s farming systems as well as those important for diversifying the production base. The division operates through six commodity based programmes and uses an integrated approach to problem solving. Achievements include the release of improved varieties of various crops, management practices and pest and disease control protocols.
5.4.1.6. MOA – PE Challenges and Opportunities The agriculture sector is complex and it is likely that there may be potential for conflicts between agricultural policies and those of other sector ministries. For instance policies to promote vegetation cover to reduce soil erosion around agricultural plots may conflict with health and pest control measures to reduce pests by cutting down vegetation cover. Agricultural subsidies also risk promoting inappropriate agricultural activity in certain ecosystems if not targeted properly. Another key challenge is rangeland degradation caused by overstocking livestock.
56
There is considerable scope for PE interventions to support agricultural productivity and poverty reduction targets as set out in NDP 10 by: • Providing analysis and evidence which demonstrates that investments in sustainable land and water resource management can deliver increased agricultural productivity in an economically viable manner • Effectively integrating and harmonizing PE linkages across agricultural policies to ensure that key environmental assets – land, forests, water resources etc – are more sustainable managed in order to deliver increased agricultural productivity • Resourcing sustainable land and water resources management in MOA budgets. • Ensuring that PE issues are well integrated into government support programs such as NAMPAADD, ISPAAD and LIMID. • Integrating PE issues animal disease control strategies • Providing support to extension services to ensure they are adequately capacitated and technically equipped to assist farmers to adopt and use environmentally friendly and sustainable farming techniques.
5.5.1. Ministry of Local Government (MOLG) MOLG is responsible for implementing government policies, programmes and projects at the local level. It is responsible for providing a variety of social services in the urban and rural areas including: primary education, primary health, water, sanitation, remote area development, tertiary roads and is the lead on local governance issues. The ministry is also responsible for implementing the National Settlements Policy (NSP).
Two planning units link up MOLG to MFDP: the Department of Local Government & Development Planning and the Department of Social Services which is charged with administering and implementing community projects. In each of these departments there is an MDFP officer who is placed to manage the projects that have been approved and budgeted for in the District Development Plan.
5.5.1.1. The Department of Local Government and Development Planning (DLGDP) DLGDP is responsible for funding, implementing, monitoring and evaluating development projects and is currently coming to the end of District Development Plan 6. The Planning Unit at MOLG gets project proposals from local authorities. DDP7 a seven year plan to end in 2016 over the NDP10 period is yet to be finalized
A bottom up approach is followed in coming up with the district development plan. Communities indicate their aspirations so that the projects come from the communities themselves. Budget ceiling are obtained from MFDP. Funds are then channeled to the planning unit. The community projects must fall within the budget ceiling. There are 16 districts in the country and funds are apportioned proportionately to the projects in each district. More often than not Districts exceed the budget and therefore the projects have to be prioritized and some cutting takes place. The DLGDP conducts a project review exercise and compiles projects reports on an annual basis.
5.5.1.2. DLGDP – PE Challenges and Opportunities The projects which are usually the ones to be cut off the list of priorities, and that do not get any funding are projects related to environmental investments. This problem where MOLG finds itself getting a raw deal is not only restricted to environmental investments. In the area of poverty reduction MOLG also gets a raw deal from MFDP because most of the projects have indirect benefits e.g. primary health care. Hence, there is a need to quantify the benefits of health maintenance and investments to make a stronger case to MFDP to get funding for such projects. There is a focus on EIAs at local level as the key tool to manage the environment rather than integrating them across the district plan. The DD6 plans include a section on environment mainstreaming but it is presented separately it rather than in an integrated manner. Areas for PEI support include providing guidance on the production of district development plans; having biannual meetings between Ministry and local government officials and the midterm reviews for DDP7.
57
Currently, there is no local government training institute for training MoLG officers but proposals have been made to have one. Currently MoLG officers sent to the Botswana Institute of Administration and Commerce (BIAC). There is a need to strengthen evidence for environmental investments. Rainwater harvesting, water efficiency and waste water reuse needs to be encouraged in primary schools and primary health care centres. Efforts have been made to mainstream environment in UDP, DDPs so there is some potential for PEI to complement mechanisms already in existence.
5.5.2.1. The Department of Social Services (DSS) DSS is responsible for formulating, administering and monitoring the implementation of social service policies and programs in the country. Emphasis is placed on community projects that empower communities both psychologically and materially. Regular workshops are held by MOLG to empower and build capacity of communities formulate projects that will benefit them the most.
5.5.2.2. DSS ‐ PE Challenges and Opportunities DSS has always put forward issues of poverty and environment in their work. For example, their work on community resilience and related projects ensure that all social service programs are implemented in such a way that they will also empower communities on how best to use the available resources within their communities to improve their livelihoods. However, support is still needed from the PEI on how to better integrate PE into these projects more effectively.
5.6.1. Ministry of Minerals, Energy and Water Resources (MMEWR) MMEWR has the responsibility of coordinating, developing and operating activities in the energy, water and minerals sector. Specific programmes to fulfill these responsibilities are carried out by the Ministry’s departments and parastatals. The Department of Water Affairs (DWA), the North South Carrier Water Project Unit (NSWCPU) the Water Utilities Corporation (WUC) is responsible for water matters and the Energy Affairs Division (EAD) and the Botswana Power Corporation (BPC) are responsible for energy matters. Other departments of the MMEWR include the Department of Geological Survey and the Department of Mines.
MMEWR formulates, directs and coordinates the overall policies and programmes on minerals, energy and water resources. It provides clean water for drinking purposes and for agricultural, commercial and industrial development. The Ministry also provides leadership and liaises with other related sectors within government and other parastatal, private and international agencies working in the field of minerals, energy and water resources. The MMEWR and its Departments or Divisions together with their responsibilities are shown in Fig. 5.6.1. below:

58
Fig. 5.6.1. Ministry of Minerals, Energy & Water Resources & Key Departments
5.6.1.1. The Department of Water Affairs (DWA) DWA is the Government lead on water resources policy and management. It has the responsibilities to provide water and sanitation in the rural areas whilst in the urban areas this service is provided by the Water Utilities Corporation (WUC). The key policy documents for this sector are the National Water Master Plan, Sanitation Master Plan and a draft Water Conservation Policy.
59
According to NDP10 45% of the demand for water had been met in 2008 and the target set for 2016 is 100%. 65% of the population had access to an efficient supply of adequate water and NDP10 will raise access to 100% in 2016. 46% of water was unaccounted for and NDP10 sets a target to reduce the figure to 10% in 2016, while the amount of water supplied that is compliant to set water quality standards will be raised from 20% in 2008 to 100% by 2016.
5.6.1.2. DWA – PE Challenges and Opportunities A key concern in Botswana as a water scarce country is the need to reconcile growing demand for water with a static (and perhaps under climate change, declining) water resource availability. The disposal of waste water in water is a major issue in Botswana. Hence, pollution prevention and minimization is a key focus point for DWA. Water treatment plants are capital intensive making it very costly to maintain and rehabilitate them. The DWA also identifies water for reuse for agriculture. Most of the agriculture in Botswana is rainfed with minimal use of fertilizer, nitrogen, phosphorous and potassium (NKP) in drinking water is not a major problem in Botswana. 70% of water used in the country is from a ground water source and 30% is from surface water (DWA, 2009). Urban areas are provided with water from surface water while the rural areas are provided with water from underground water sources. Areas of institutional overlap exist between WUC and DWA. An example is that WUC has a profit motive; its motto of keep it flowing runs contrary to the water conservation message of DWA. WUC only preaches water conservation when dam levels are low.
Demand for water varies across sectors although agriculture is the predominant user (albeit contributing just 1.9% of GDP) and within agriculture livestock is the main consumer. Under climate change and as population increases, conflict over access to and use of water resources will increase requiring effective water resources management and the promotion of more efficient water usage including re‐use and demand management.
The draft Water Conservation Policy of 2006 is still awaiting GoB approval. It is envisaged that its implementation will address some of these problems where there is conflict with regard to water use. In the area of mining De Beers produces a monthly report on its water use. If it negatively impacts on cattle farmers in the region then they compensate the farmers.
There is a need to take stock of ground water resource and rates of recharge. Recharge takes longer in the Khalahari as opposed to the Eastern part of the country and is likely to be severely affected by climate change. Already, there is anecdotal evidence of boreholes running dry in the Khalahari. Capacity to monitor water resources and analyze data is a key constraint for DWA.
The Water Act and the issuing of licenses by the water apportionment board have a conflict and also suffer from lack of monitoring. For example, the BCL mine is polluting the Motloutse River which supplies drinking water to residents. The DWA has a challenge to get the mines to use all their water and not pollute drinking water sources.
The introduction of fertilizer subsidy under ISPAAD may raise fertilizer use causing pollution of rivers and water sources. DWA needs to establish how can work better with other key sectors like MoA to develop projects that are results based and reduce the costs of dam rehabilitation.
Water and its contribution to the national economy needs to be properly valued. This would assist in articulating DWA projects better to MFDP so they given priority. For example, sanitation is regarded as being secondary to water supply but poor sanitation leads to health problems and greater costs for GoB. The economic rationale for water conservation also needs to be made more clearly especially since Botswana is a water scarce country. Need to establish quantities used by the mines and how this affects communities.
60
The Water Apportionment Board must be empowered to be a regulator because there is serious problem of poor management and monitoring. The Water policy needs to clearly articulate the role of the water developer. Additionally, the DWA needs to consider the issue of water user fees. In a country where water is a scarce commodity should people be taking water freely? Perhaps, equitable water user fees could encourage better water management and use. Areas for PEI support are identified from the above as being support for: water efficiency and demand management, sustainable water consumption and usage and equitable access to water especially for the rural poor. The threat of climate change to water supply strengthens need for sustainable water resource management.
5.6.2.1. The Energy Affairs Division (EAD) EAD has the responsibility of formulating national energy policy. All energy programs in Botswana must undergo EIAs. EAD is charged with energy provision from the following sources electricity, coal and new renewable energy sources. The expansion of Morupule and the construction of the Mmamabule plant will increase CO2 emissions once it is operational. While this is a welcome move as it will mean that there is a greater supply of electricity for the nation, it poses a challenge for Botswana with the move to use emissions per capita as an indicator to determine whether a country is a bad emitter. Botswana is a country with a small population so with the use of emission per capita it means that the country will be classified along with countries like China that generate ten times more CO2 emissions.
EAD is also charged with implementing the Re Botswana program where the aim is to assist households to install PVC systems; highly subsidized and they pay service fee (GEF/GoB). The EAD wants to promote the use of solar energy which is abundant in the country. To this end a Thermal Power Station and a standalone PVC system for rural electrification is to be constructed. Biomass is also considered to be a good alternative renewable energy source and will lead to the reduction of firewood use. The EAD is involved with the promotion of biogass; development of biofuel & bio diesel. EAD ensures that petroleum stocks are maintained in the country.
EAD recognizes that coal has a negative impact on the environment. Therefore, investments have been made in clean technologies. Energy efficient stoves have been developed and tested. The opportunities for benefitting from the carbon financing mechanism from afforestation/tree planting Botswana need to be properly understood. There has to be direct policies to internalize climate change issues. The linkages between EAD and MET need to be strengthened so that MET can educate and inform other key sectors about climate change issues. The EAD has a target to benefit from CC financing by 2010. Another problem or area of concern for the EAD is the problem it has in accessing the government financing system. Jetropha is a candidate for convincing MFDP to invest in results based projects. However, the economic rationale for doing so is needed to justify why a food deficit country like Botswana should grow a biofuel crop.
5.6.2.2. EAD ‐ PE Challenges and Opportunities Sustainable energy provision including the use of renewable energy is a goal which EAD must achieve if development is to be sustainable. Another challenge is to ensure access to energy for the poor including the sustainable use of firewood. The EAD needs to ensure that energy efficiency and demand management is achieved across all sectors of the economy. There is also the challenge of accessing to carbon financing to promote sustainable energy supply. Areas for support include: sustainable energy provision and demand management; sustainable energy provision for the poor; energy efficiency and demand management and making carbon financing accessible.
5.6.3.1. Department of Mines (DOM) DOM’s objectives are to establish and maintain effective organization to administer mineral exploitation legislation and to enhance socio‐economic, financial and other benefits to Botswana arising from the exploitation of mineral resources. The DOM is the lead in the development of national policy on mineral development and operation. Additionally, the department provides professional guidance on all matters
61
pertaining to mine safety and control of pollution arising from mining activities. It formulates and provides technical guidelines, performance standards for mining, mineral processing and metallurgical operations.
5.6.3.2. DOM – PE Challenges and Opportunities There is a conflict that arises because of the conflicting role of DOM as a licensing institution for mining operations and local authorities such as the Land Board when it comes to role and responsibilities on the rehabilitation of extraction sites or mines. DOM often issues licenses to companies to mine in certain areas. In some cases mining (burrow pits) takes place in and around villages with no rehabilitation after the mining is completed. The burrow pits are an eyesore and pose a hazard to human life as they form small dams during the rainy season and people end up drowning in these pits.
5.7.1. Ministry of Health (MOH) MOH has the portfolio responsibility to lead on all health matters. It does this by formulating health policies, ensuring their correct interpretation and implementation throughout the entire health care delivery system. MOH has five departments and 10 divisions. Within the Division of Public Health the Department of Public Health is concerned with or responsible for all health matters pertaining to environmental health.
5.7.1.1. Department of Public Health‐ Environmental Health (DEH) Promoting environmental health is ostensibly about preventing disease and illness. Most health expenditure however is focused upon treatment of disease and environmental health tends, as a preventative measure, to be underfunded. This is despite pressing environmental health problems including water and vector borne diseases, illness caused by poor watse management and respiratory illness caused by indoor air pollution. At present DEH does not have statistics that can capture the severity of these issues and how many people are affected. A consultant is in place to develop environmental health statistics and there is a need to develop indicators which will be used to capture the severity of the problem.
5.7.1.2. DEH – PE Challenges and Opportunities Key PE issues relate to the high burden of environmental health upon the poor – who suffer most due to poor access to clean water and sanitation, indoor air pollution from burning un‐clean fuels, diseases spread by vectors such as malaria etc. whilst the burden upon the poor and indeed, the economy is high the costs of preventing such helath problems tends to be considered high with politicians and decision‐makers preferring to provide funds to tackle a visible problem rater than preventing an unforseen one. In Botswana access to good sanitation is often confused with the provision of water. Many people still do not have access to a toilet. The issue of sanitation often slips through the cracks because clean water is ranked higher on the list of priorities than sanitation. The problem is exacerbated by water scarcity so more often than not pit latrines are used. Conatmination of drinking water from poorly constructed latrines and waste dumps is a major concern and persistent because of high cost of safer alternatives. In 2006, 532 children died from diarrhoea mainly because their driniking water was contaminated by E.coli which means that human watse was found in the drinking water where the prople were living. Another problem is that water hygiene is low in Botswana. People use plastic containers or bottle to store water. These water tanks are not properly covered. At the local level it is Councils that deliver on health related matters and have the mandate on sanitation issues but often have insufficient resources. The funding of environmental investments will become more serious with the 7% budget cut that is required across all ministries for NDP10. The budget for DEH is just P8million as it is. It is important that a whole system is developed to deal with waste management rather than the fragmented way in which it is dealt with. DEH has problem getting assistance from donors because Botswana is regarded as a middle income country. In Botswana 1 person creates 2kg of waste. This figure is very high because Botswana is still developing. Plastics are on the increase.
62
There exists the potential to do an economic study on benefits of investing in EH. But the DEH has no power to convince the people with power that EH is important and must be addressed. Policymakers need to see and undertand that waste is a product of development and that dealing with it is a waste of time. PEI support can come through: advocating for increased investment in sanitation and waste management to improve health outcomes and providing evidence to help decision makers understand the benefits of investments in sanitation alongside the supply of clean water; understanding the risks of climate change upon vector borne diseases including malaria, dengue and FMD.
5.8.1. Ministry of Lands and Housing (MOLH) MOLH is mandated to provide services in management and development of land, as well as facilitation of housing delivery for the citizens. There are seven departments and a corporate services division under the ministry MLH which assist it in executing its mandate. These are: Corporate services; Department of Lands; Department of Surveys and Mapping; Department of Town and Regional Planning; Department of Deeds Registry; Department of Land Board Services; Department of Technical Services and the Department of Housing. The Ministry has two land tribunals being; Gaborone Land Tribunal and the Palapye Land Tribunal. The ministry executes its mandate through the following policies; the 1975 Tribal Grazing Land Policy, the 1998 National Settlement Policy, and the 2000 National Policy on Housing in Botswana.
5.8.2. MOLH ‐ PE Challenges and Opportunities The Tribal Grazing land Policy which was introduced to address range degradation by demarcating and leasing ranches to either individuals or groups. However, it failed since it had some shortcomings such as dual rights that allowed ranchers to graze their cattle both in and outside the ranch resulting in increased land degradation due to overgrazing. Land rights and ownership needs to be clearly stipulated for easy access and understanding by the communities. The policies also conflict with each other and this PEI could assist in the harmonization of these policies.
5.8.1.1. Department of Land Board Services (DLBS) DLBS provides advice on Tribal Land policies, guidelines and regulations and provision of skilled manpower of the Land Board. The department is currently faced with the critical shortage of key personnel in areas of human resource management and development, financial and technical services and manpower planning and management services. The main objective of DLBS is to administer Tribal Land Act in relation to human resources management and development and tribal land management. The specific objectives of the department include providing and serving as the government’s focal point for national policies and operational matters relating to land board service management in areas of human resources management and development, land board finance, manpower planning and utilization and technical services. It also administers land board service related policies and regulations and terms and conditions of service to ensure effective and efficient management of tribal land.
5.8.1.2. DLBS ‐ PE Challenges and Opportunities DLBS needs to develop a reliable statistical base as well as capacity building. The state of the environment and natural resource base needs to be adequately assessed and documented to avoid allocating land in life‐threatening areas such as flood plains. Different land uses should be clearly defined for each and every area to reduce conflicts such as land encroachment which can threaten the environment due to communities’ retaliation. There is currently a serious problem whereby be fertile agricultural land is being sold residential plots by owners. This is a very serious problem as it will exacerbate the poverty and food security situation in Botswana. PEI can provide support by assisting with providing evidence of the PE impacts of continuing with this practice.
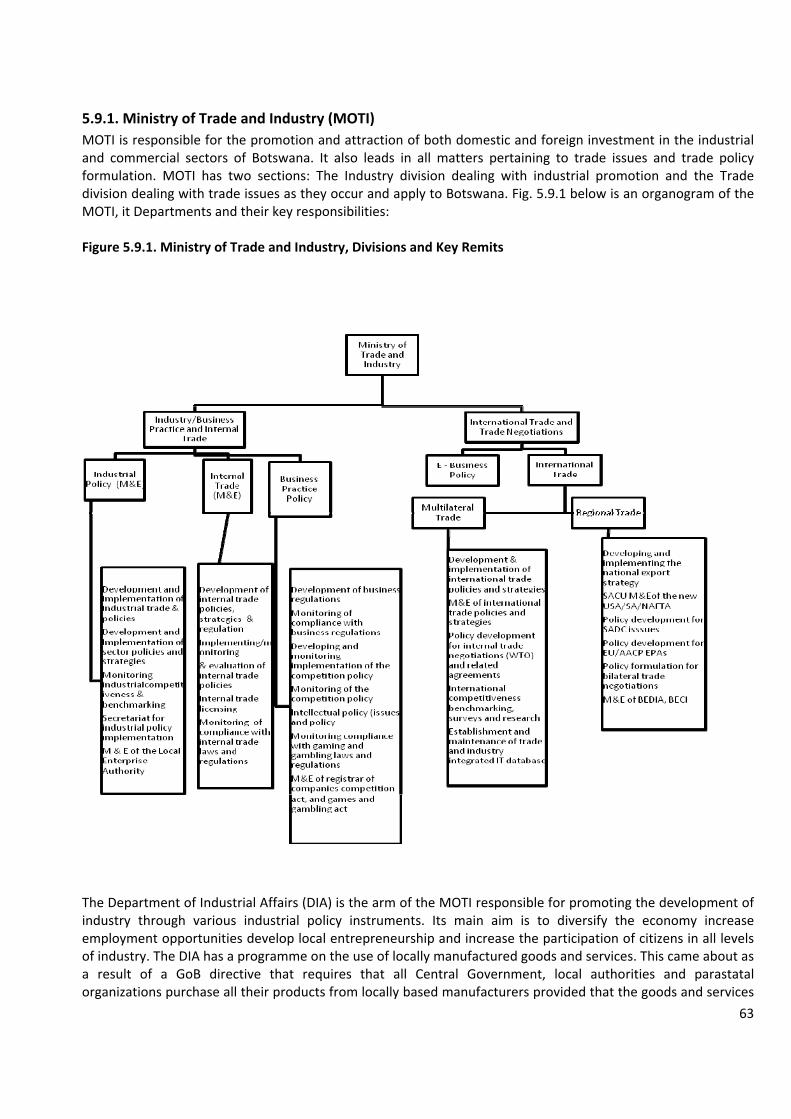
63
5.9.1. Ministry of Trade and Industry (MOTI) MOTI is responsible for the promotion and attraction of both domestic and foreign investment in the industrial and commercial sectors of Botswana. It also leads in all matters pertaining to trade issues and trade policy formulation. MOTI has two sections: The Industry division dealing with industrial promotion and the Trade division dealing with trade issues as they occur and apply to Botswana. Fig. 5.9.1 below is an organogram of the MOTI, it Departments and their key responsibilities: Figure 5.9.1. Ministry of Trade and Industry, Divisions and Key Remits
The Department of Industrial Affairs (DIA) is the arm of the MOTI responsible for promoting the development of industry through various industrial policy instruments. Its main aim is to diversify the economy increase employment opportunities develop local entrepreneurship and increase the participation of citizens in all levels of industry. The DIA has a programme on the use of locally manufactured goods and services. This came about as a result of a GoB directive that requires that all Central Government, local authorities and parastatal organizations purchase all their products from locally based manufacturers provided that the goods and services
64
are locally available, competitively priced and meet tender specifications in terms of the quality and standards as certified by the Botswana Bureau of Standards (BOBS) as well as other requirements. Amongst other activities listed in figure 5.9.1. The Department of International Trade has the mandate to implement and monitor the country’s National Export Strategy (NES). The NES examined product sectors in order to assess their capability and potential for future export growth. The sectors that were identified for export promotion are mainly derived from natural resources e.g. basket work, beef, leather and cereal based products.
5.9.1.2. MOTI – PE Challenges and Opportunities The following PE challenges and opportunities were identified: the focus group of the National Export Strategy (NES) for Botswana which is implemented by MOTI must be part of the reference group for the overall PEI. This will ensure that all PE linkages and related issues are integrated into the implementation process for the NES. It will also serve to raise awareness and dialogue amongst key decision makers (which is currently low) on the links between trade the environment, poverty reduction and economic growth. Several natural resource based sectors are identified in the NES for future export growth. If the natural resource base on which they are dependent is over exploited lower levels of economic growth and higher levels of poverty will result because there will be less income coming from those activities to channel towards poverty reduction. PEI can provide support by creating awareness amongst business people about the importance of the sustainable management of natural resources. This is particularly important for agriculture as the majority of the population is directly or indirectly reliant on this sector. Environmental policies and standards may be perceived to potentially affect competitiveness and export promotion strategies although such standards may facilitate access to new markets. Therefore, careful consideration of the links between trade and the environment is necessary step to the formulation of appropriate trade policies that are pro‐poor and environmentally friendly. The accelerated growth in the production and use of biofuel has attracted interest from policymakers and investors globally. Analytical support to MOTI for understanding the trade offs and risks (economic, environmental and social) for Botswana that will arise may be needed. Support will be needed to develop an appropriate industrial policy framework for implementation to ensure that it is pro‐poor and environmentally friendly. For example, the economic, environmental and social impacts of bio‐energy development must be assessed carefully before deciding on how rapidly to develop the industry and what technologies, policies and investment strategies need to be pursued.
5.10.1. Ministry of Education (MOE) MOE has the responsibility to deliver on one of the key pillars of Vision 2016: to be a well informed and educated nation. In the area of the environment the MOE has established an Environmental Education (EE) Unit. The overall aim of the EE Unit in Botswana is develop a society that is aware of and concerned about the environment and its associated problems; a society which has the knowledge, skills, attitudes, motivation and commitment to work individually and collectively towards solving current problems and preventing new ones. EE has been infused into the education curricula of primary, secondary and tertiary schools. However, it still is yet to be incorporated into the curricula of teacher training and education structures. The Unit has developed environmental education guidelines to be used in primary, secondary schools. The EE national goals are as follows: to provide every learner with the opportunity to develop environmental awareness, acquire knowledge and understanding of the environment and the need for sustainable utilisation of Botswana’s natural resources; to develop desirable attitudes and behavioral patterns in interacting with the environment in a manner that is protective, preserving, and nurturing; to develop critical thinking, problem solving ability, individual initiative,
65
interpersonal and inquiry skills to make informed decisions when dealing with environmental issues and willingness to participate in environmental protection and conservation. As stated above the curriculum development strategy follows an infusion approach to EE at primary and secondary levels while at tertiary levels it is taken as a subject on its own. The curriculum development strategy is also supported by appropriate textbook material and resource development, use of appropriate teaching and learning methods, monitoring and evaluation and the use of support services from other institutions and stakeholders involved in the area of EE. Areas or topics covered by the curricula include: water conservation, soil erosion and conservation, sanitation and waste management, environmental management, pollution, desertification and wood resources, natural resource management, populations and the environment, environment awareness and practice, development and the environment, environmental careers, environmental values, attitudes and ethics. These topics are infused across the curriculum and taught as components of carrier subjects such as Science, Geography, Agriculture, Social Sciences and guidance and counseling in schools. An environmental school calendar promotes awareness amongst learners through key events including: World Wetlands Day, National Water Week, World Day for Water, World Meteorology, World Heath day, Earth Day, Keep Botswana Clean Day, World Desertification Day, National Tree Planting Day to name a few (the calendar lists 29 events that are commemorated throughout the year). During such events schools hold awareness raising activities such as essay competitions amongst others to enhance environmental awareness.
5.10.1.2. MOE – PE Challenges and Opportunities The main challenge that remains with regard to EE is that the focus has been mainly on schools and tertiary institutions. More needs to be done to inculcate EE and awareness particularly at the villages and local community levels. The general public including those in the rural and remote areas need to be more educated and knowledgeable about the importance of the environment and the linkages it has with economic growth and poverty reduction. The current perception needs to be changed so that individuals realize that they can benefit tremendously in the long run, whether it is directly or indirectly, from investing and living in harmony with the environment. Successes from the CBNRM can be used as case studies from which communities can be made to appreciate that natural resources can be appropriately harnessed for community development and poverty reduction. Support for awareness raising activities and for use of existing indigenous knowledge systems and structures within communities to enhance the appreciation; adoption and use of environmentally sustainable ways of engaging in economic activities could be relevant. 6. REVIEW & ANALYSIS OF KEY PARASTATALS WITH PE FOCUS
6.1. Water Utilities Corporation (WUC) WUC was established by the Water Utilities Corporation Act of 1970 with the mandate of providing potable water to Botswana’s urban centres. The WUC operates along commercial lines and must be financially viable. The WUC treats raw water and provides bulk water to the Department of Water Affairs (DWA) for onward distribution to over twenty villages. WUC supplies clean, safe drinking water to 34% of Botswana’s population. The WUC also provides water requirements that support mining, manufacturing, commercial and domestic activities countrywide. WUC is also involved in the complex operational process of treatment, pumping, storage and distribution to customers. WUC’s infrastructure includes five dams namely Gaborone, Nnywane, Shashe, Bokaa, Letsibogo and the North South Carrier Water Scheme.
The quality achieved by the WUC exceeds the set standards of BOBS and WHO. It has an environmental policy framework which covers the following issues: responsible water management, impact on communities and ecology, environmental management and continual improvement, pollution prevention, waste management, legal compliance and communication and training.
66
Under responsible water management the WUC recognizes that water in Botswana is a limited and essential resource, therefore it is committed to reducing negative impacts on both the quality and quantity of water through integrated water resource management. The framework also spells out the need to view water holistically as part of the up and downstream water cycle taking all water needs into consideration. The WUC intends to establish a water use hierarchy which emphasizes efficiency, recycling and treatment of affluent. The integrated strategy has to be aligned with the DWA and NCSA strategies and tourism and amenity strategies. Monitoring and measurement of quality, release rates, abstraction rates and storage levels also have to be undertaken on a continuous basis.
6.1.1. WUC ‐ PE Challenges and Opportunities There is a need for WUC to focus upon demand management (rather than unrestricted supply). The impacts of climate change upon water resources also need to be understood.
6.2. Botswana Power Corporation (BPC) BPC is a parastatal utility which was formed in 1970 has the responsibility to provide electric power throughout the country. Its mission is to facilitate sustainable and diversified development of Botswana by rendering quality electrical energy services that are affordable, efficient, safe and environmentally prudent.
The BPC is a coal based utility and hence, takes a high interest in the environment. The Morupule Power Station which is more technologically advanced and adjacent to the colliery provides approximately 80% of the country’s power requirements. During NDP 10 the Mmamabula project will be expanded to enable BPC to meet anticipated energy demand. Since this will also be coal based emissions are likely to increase and place added pressure on BPC to be environmentally safe.
The BPC has installed sensors at all its power station throughout the country. The country works well with WHO guidelines and ensures that all new power stations meet emission standards. Alternative forms of energy such as solar energy are also encouraged. Despite this the adoption of solar energy has not gone well because of the high financial costs. Regular consultations are held with various stakeholders to minimize the impact of BPC’s operations on heritage sites.
BPC management is aware of opportunities that exist for carbon financing and is currently working with ARI Botswana through the assistance of the British High Commission. At present, an application has been made. BPC is also in contact with MET to implement this. However BPC acknowledges that carbon financing is still a relatively new thing to them and that they would need some assistance in order to understand how to use the facility so that Botswana can benefit from it.
In order to meet the power needs of the nation and to promote rural development, BPC with the government, has introduced various assistance schemes to facilitate the electrification process throughout the country. These assistance schemes support the extensive village electrification programme run by the corporation which electrifies at least seven villages per annum. The electrification schemes and programmes are an integral part of a strategy to achieve BPC’s aim that energy goes to all and all.
The provision of electricity to the rural areas is part of GoB’s initiative to promote rural development to alleviate poverty and improve the quality of life in rural communities. Access to grid based electricity in the rural areas is targeted to reach 70% by the end of NDP10. With the inclusion of off grid electrification the total target by the end of NDP10 will be 85%.
The 100 villages’ electrification project began in 2007 and was expected to take 3 years. Funding came through a loan from two Scandinavian banks. Selected villages were grouped equally over 3 consecutive years. So far 30% of the villages have been electrified with the balance scheduled for the period up to September. In the second project GoB funded the electrification of 30 villages with P115 million. In addition to the electrification of the
67
villages, GoB is also financing network extensions on existing infrastructure in 20 already electrified villages for about P75 million. All projects are in progress but there have been some delays because of material shortages.
Through the Rural Business Unit, BPC has also been appointed as the implementing agent on behalf of GoB for the provision of cost effective electricity through Photovoltaic (PV) systems, to the rural populace that is not able to connect to the grid. The RE Botswana project funded by the government and the Global Environment Fund (GEF) began in 2008. The projects products and services include Solar Electric Systems, rechargeable lanterns, recharging stations for lanterns and batteries, efficient cooking appliances (eg. energy efficient stoves), mini grids, solar water heaters as well as the installation and maintenance of PV facilities for government institutions and large enterprises in rural areas. Four villages were selected to pilot solar energy. BPC has a target of 5000 household initially but eventually plans to scale up the project to 85 000 rural households. BPC Lesedi has been engaged as a strategic partner.
The government also supports a Rural Collective Scheme (RCS) which is administered by the BPC, providing easier access to electricity. Under the RCS, government advances 95% of the costs of connection through deferred repayments over a period of up to 15 years whilst customers pay 5% deposit to be connected. In 2008 about 1591 RCS had been established. By April 2008 access to electricity had increased to 41%.
6.2.1. BPC – PE Challenges and Opportunities The main challenge BPC faces with its programs and projects has to do with sustainability. Currently the government policy is not to subsidize consumption so it is still a challenge to make projects financially sustainable. The other challenge is that the revised energy master plan contains no targets. There is a need to put something that will attract private sector participation in the energy sector. There is also currently no policy on renewable energy and this hampers progress. A potential entry point is for support for the use of a sustainable energy supply; energy demand management and efficiency and assistance with accessing carbon financing.
6.3. Botswana Tourism Board (BTB) BTB is a parastatal body set in 2003. Its mandate is to: promote and market the Botswana tourist product, grade and classify tourist accommodation facilities as well as to promote investment in the tourism sector. BTB was established as a separate institution because functions such as marketing of tourism are best done outside Government.
BTB works in conjunction with DOT and recommends to DOT what must be done with respect to: the grading of facilities; formulation of standards; funding (which is purely done by government at the moment) and the management of concession areas. Previously royalty fees were collected by District Councils (DCs) but they are now being collected by the BTB on behalf of government. It is envisaged that going forward a certain percentage of the royalty fee will go to BTB to finance its operations. Local authorities are comfortable with this new arrangement with regards to the management of the fund.
BTB promotes the linkage between tourism and CBNRM so that communities also derive benefits from tourism. At the same time BTB also recognizes that tourism in Botswana is nature based and that because of this high tourist volumes have implications on the environment. It is for this reason that carrying capacities are set at 24 beds per concession area.
BTB also looks at the viability of these projects and resource provision to do the project. In assessing viability the BTB does not evaluate this component solely on a financial basis but also considers other direct and indirect benefits in terms of the multiplier effect the project will have on the communities where it is located. Moremi Gorge was developed as a partnership with the community. BTB acts as a facilitator of these projects for example if a community wants to enter into a management contract or partnership with an organization to run a
68
project then BTB will assist this to happen. The BTB works in conjunction with the Technical Advisory Committees (TACs) of DWNP in the districts. Specifically, BTB is a member of these TACs.
A key strategy for BTB is diversification of the tourism product. In this regard there is a dam initiative whose aim is to promote tourism across all dams in the country. Several studies have been done with assistance from the European Union (EU) on the Gaborone and Lestibogo Dams. The established of the land bank will also help in this regard by allowing access to land to those willing to invest in tourism. The Ministry of Land and Housing will sublease all then land surrounding the dam to BTB which will subsequently lease this land to the operators. This practice will only apply to all dams that will be constructed in the future. Existing dams will not be affected by this because all land surrounding existing das has already been allocated for agriculture and there would be a conflict if this land were to go to the land bank. New dams that will be constructed will have agriculture downstream so that there will be no conflict between tourism and agricultural activities. Livestock will not access these dams.
BTB is also looking for new and innovative ways to markets and sell the Botswana tourism product. Currently they are looking at ways of developing ecotourism in the country. The Okavango Delta has been declared a Ramsar site and has been handed over to BTB to develop into an ecotourism destination. BTB has developed a best practice manual to exploit ecotourism. It includes grading standards for ecotourism facilities. BTB intends to indentify tourism opportunities in the Okavango Delta and conduct SEAs to make sure that the sites are ready for investment. This is to avoid problems such as those that happened with the congestion of the Chobe Riverfront.
Climate change is not high on the agenda in terms of it being a tourism industry concern. However, operators are aware of environmental issues and health issues that can impact on their businesses. For example, recent flooding led to malaria. Additionally, the Savuti River started flowing again recently after having dried up for many years.
6.3.1. BTB ‐ PE Challenges and Opportunities There are a number of cross sectoral issues that present challenges for BTB in its operations. These include things like whether land should be used for residential land vs agriculture. The current mindset of locals with regards to livestock vs tourists also has to be changed if BTB is to be successful in getting locals to invest in tourism. Locals view tourism as the domain for foreigners and hence when they look for investment opportunities the tendency is for locals to invest in conventional areas like livestock. This mindset has to be changed if the sector is to grow. Others include the promotion of sustainability in all tourism enterprises particularly in light of policies to increase tourism numbers. The SEA is a potential tool to aid tourism planning, to this end PEI could provide support for doing this properly. In addition, PEI can provide support for understanding the impact of CC on Botswana’s biodiversity and tourism industry.
7. REVIEW & ANALYSIS OF LOCAL GOVERNMENT INSTITUTIONS
7.1. The Overview of Local Government in Botswana
7.1.1. The Administrative Setting Each district in Botswana is managed by four local institutions: the District Council, Tribal Administration, Land Board and District Administration. These four institutions form the institutional framework within which local government operates in the Districts. They are charged with rural development and serve as the direct link with local communities in terms of identifying their needs and aspirations.
69
7.1.2. The District Council The District Council is a statutory body composed of elected members and an administrative wing (secretariat) charged with the responsibility to administer Council decisions. The District Council has the formal authority to make policy decisions at the district level. It has the power and discretion to allocate in the district but there is control from MOLG in the form of budget ceilings and funding of approved projects only. The power base of the District Council is the local community and the decisions of Council are supposed to reflect the aspirations of the community. Other government departments work with the Council on developmental issues. The policy decisions made by these departments are essentially at the ministerial level as they represent their respective ministries in the District. The Councils carry out their duties through a system of various standing committees. These include education, health, works, trade and licensing and physical planning to mention a few. The committee system allows for more time for dealing with specialized policy issues that require decision at the level of the full council committees. The system makes use of a pool of experts mainly from various council departments making it possible for more complex issues to be looked at in detail before they are referred to full council for decision.
7.1.3. The Land Board The land board is responsible for the allocation of tribal land including open wells and boreholes. It issues leases and grants and other land use rights in all areas falling under its jurisdiction. Some of the functions of the Land Board include allocating and varying customary rights; describing grazing areas in consultation with the District Council, setting aside land for commonage in consultation with the District Council, leasing land for common law purposes and the granting of land in consultation with the District Council for stated purposes.
7.1.4. The Department of Tribal Administration The functions of this department at the local level mainly comprise tribal administration services which are comprised of secretarial staff, the local police service, customary courts administration, comprising chiefs, sub‐chiefs and headmen. The department has both traditional and development duties. Tribal administration provides critical links between communities and government authorities. One of the core functions is to administer justice through the customary law system and to provide a forum for public consultation for purposes of development.
7.1.5. The Department of District Administration and Food Relief Services The Department of District Administration and Food Relief Services is responsible for district development planning and policies coordination and serves as the link between central and local level planning and development machineries as well as coordinating food relief and deficiency needs as may be dictated by natural disasters and other circumstances. Its objectives are to: provide co‐leadership in district development planning and policies coordination and linkage between national and local level planning and development machineries; to provide central government representation at the district or local level and coordinate and monitor locally based central government departments and extension services; to undertake all relevant ceremonial and statutory responsibilities, to respond effectively to food relief and deficiency needs as dictated by natural disasters and other deserving circumstances, to ensure that district administration authorities are provided with adequate resources and administrative support services and to efficiently and effectively manage resources allocated to the department. The office is headed by the District Commissioner who is charged with the responsibility of coordinating and supervising functions of sectoral ministries.
7.2. The District Development Planning Process The district planning framework closely follows the pattern of the national planning process, which has been in existence since independence. The approach to national planning is based on national preference for openness, consultation and the building of consensus. This is done to ensure that the nation’s limited financial, manpower and natural resource are put to effective use and in accordance to national priorities. To this end, the goals and objectives of the district development plans are based on the long term planning frameworks and strategies
70
(such as Vision 2016, NDP10, NSPR, CBNRM and the National Settlement Policy to name a few) taking into account the principles of bottom up planning or decentralized planning. This notion is sensitive and responsive to the needs, problems and priorities of local communities.
7.2.1. PE Links and Mainstreaming The sixth district development plans are the first to be aligned with the pillars of Vision 2016 outlined in Chapter 4. Planned projects include goals and targets from improved access to education and communication, improved agricultural productivity and the promotion of CBNRM projects which are deemed to promote equitable distribution of resources between people and a fair distribution of resources between current and future generations. The environment is identified as a major concern with increasing land pressure, land scarcity and sub optimal land management, water scarcity, veld fires, depletion of forests due to cutting down trees for fuelwood, and pollution and waste management, natural resource overutilization being identified as major issues of concern. Climate change is briefly touched upon and mainly activities spelt out in the plans point to the monitoring of climate change with a view to taking mitigation measures.
7.2.1.1. PE Challenges and Opportunities The environmental issues are included and planned for however; they are usually the first to be cut out of budgets especially during times when resources are scarce. Currently departments have been requested to cut their budgets by 7% across the board. The prioritization of issues and which projects to finance depend upon the problems that each district faces but inevitably projects concerning environmental investment will be affected as priority is given to income generating projects and those directly linked to poverty reduction. The Council Management Team meets to decide which projects must be cut off. During the process tradeoffs have to be made between important projects and making the decision is not an easy task. For example, should the Council invest in a clinical waste facility or should they in invest in a vehicle that will carry children with disabilities. These are difficult choices to make.
7.3. KEY DISTRICT TEAMS
7.3.1. Objectives Interviews were held with members of various district teams in order to appreciate the reality on the ground in terms of the challenges and opportunities the district teams experience as they carry out their various responsibilities at the district level.
7.3.1. Organization Each district has a team of officers on the administrative side who are responsible for ensuring that projects that have been approved in DD6 are implemented. A District team consists of officers from each departments of each ministry (health, education, agriculture to name a few) depending on the circumstances of that district.
7.3.2. PE Interface Across all districts funding was found to be a major obstacle for undertaking environmental investments or projects. The teams are faced with how best to utilize scarce financial resources in order to achieve the communities’ goals. More often than not the environmental projects suffer. People in the communities see poverty reduction as more of a priority than environmental investment because they do not understand or fully appreciate that making the environmental investment contributes towards poverty reduction. Even when they do, because they are poor, the main aim is to earn a livelihood today so that those projects whose benefits will be reaped in the future (like most environmental investments) get sidelined or cut.
71
7.3.2.1 PE Challenges and Opportunities There was a general consensus amongst the district teams that there main problem when it came to the mainstreaming of poverty and the environment in district planning had nothing to do with the structures of the implementing institutions. The main problem had to do with getting the communities to understand the issues at stake and how they were going to affect them so that they could actively participate in initiatives that were meant to address problems. Greater consultation that would involve sensitization and advocacy at the grassroots level was needed to get communities to own projects so that they would actually take part in addressing issues such as illegal dumping by contractors. The issues that communities face at the local level and the complexities that are involved in addressing the problems compel communities to act in ways that are not good for the environment and themselves in the long term. For example, in the villages it was found that because the system was taking too long to provide dams the communities would connive with contractors and allow them to mine sand in their area because the gaping holes act as small dams. The downside is that the gaping holes are dangerous to human life as they are often deep and people drown in them. The land is left exposed and vulnerable to erosion and degradation because the contractors do not rehabilitate the burrow pits when they leave the area. There is also a need for greater education on environmental issues amongst the communities, policy makers and implementers. The lack of solid waste collection at the household level, lack of incinerators at the local hospital and littering were a major problem. Almost all plant and equipment used to drive better waste management initiatives is too old to do the job effectively yet people are being told to desist from dumping waste in the manner they used to before. Other problems that came out during the interview were that while there is support from MEWT there was problem of building enough landfills to deal with the waste because they are too costly to construct. The sewage system was also expensive to construct. Additionally, little private sector involvement at the district level made outsourcing very difficult. Each district has an Environmental Health Unit but the DEA has not decentralized to all the districts. This creates a problem of enforcing the existing legislation and implementing policies that are related to the environment. At the district level it was also found that politics affected the performance of some projects as all the politicians want the projects to be located in their locality. This affected prioritization as it meant that the most outspoken and influential individuals were able to get the projects located in their area and not necessarily were the project was needed most. With regards to the enforcement of waste management, the Green Scorpions or green police have been hired at the district level. There are 6 in each ward. Their task is to enforce legislation that deals with disposal of waste and also to educate the public on environmental issues and sensitize them about the need to preserve the environment in which they live in. Their ability to carry out their duties effectively is hampered by the fact that they are not properly equipped yet they police vast areas of land. Green Scorpions comprise mainly of the youth and there is a high turnover rate as they leave as soon as they find greener pastures. Additionally, the fines that are charged to punish violators are not high enough to prevent offenders from committing the offence again. All projects require an EIA before they are undertaken. Proper standards needs to be developed for the EIAs and to avoid clustering of projects. It is suggested that the Archaeological Impact Assessment be combined with the EIA because doing so will complement the EIA. With regards to the community resilience projects at the district level, there has been no trickledown effect to the communities. Individuals do not take ownership of these projects and often prefer to receive food rations rather than be part of a community project. The spirit of self interest overrides the community sprit as individuals want to reap the benefits from these projects for themselves immediately and they do not realize that they must invest in the project now for the benefit of the entire community later. This problem has
72
hampered CBNRM from being as successful as it could have been in some areas. Currently districts are on the sixth district development plan which will go on until 2012/13. The monitoring of the district development plan is done halfway through the plan and presents a potential entry point for integration of poverty and environment.
8. REVIEW & ANALYSIS OF NON‐GOVERNMENT INSTITUTIONS
8.1. The Botswana Parliament The Botswana Parliament has several committees these are: the public accounts committee, the parliamentary business advisory committee, the finance and estimates committee, committee on subsidiary legislation, government assurances and motions passed by the national assembly, foreign affairs, trade and security committee, house committee, committee on population and development, law reform committee, labour relations committee, health committee and the special select committee on HIV/AIDS. There Parliament also has five standing committees; three inter parliamentary committees and is part of the commonwealth parliamentary association. The principle purpose of parliamentary committees is to perform functions for the House, which requires expert or detailed consideration. The committee system allows for more thorough study of points of detail or questions of a technical nature and can be of more convenient size than the Assembly. Procedures are flexible allowing for argument and questioning. Committees also provide the public with an opportunity to make representations to the Assembly on certain matters because they allow direct contact with members of the public when engaged in tour programmes. The National Assembly has 4 Departments. Ministry Management, Research and Editorial Services, Policies, Practices and Procedures which facilitates the smooth running of the Parliamentary business and provide procedural and administrative support to members of Ntlo ya Dikgosi, stakeholders and the general public.
All tribes in Botswana are represented in the Ntlo Ya Dikgosi (or House of Chiefs) by their chief. The Functions of Ntlo ya Dikgosi are: to consider any bill that is referred to it under provisions of section 88 (2) of the Constitution of the Republic of Botswana. Specifically, the National Assembly shall not proceed upon any bill (including any amendment to a bill) that, in the opinion of the person presiding, would if enacted, alter any of the provisions of this Constitution or affect: the designation, recognition, removal of powers of Chiefs, Sub‐Chiefs or Headmen; the organization, powers or administration of customary courts; customary law, or the ascertainment or recording of customary law; or tribal organization or tribal property unless: a copy of the bill has been referred to the Ntlo ya Dikgosi after it has been introduced in the National Assembly; and a period of 30 days has elapsed from the date when the copy of the Bill was referred to the Ntlo ya Dikgosi”. To discuss any matter within the executive or legislative authority of Botswana of which it considers it is desirable to take cognizance of the interests of the tribes and tribal organizations it represents and to make representations thereon to the President, or to send messages thereon to the National Assembly.”
8.2. Civil Society
8.2.1. The Botswana Council of Non‐Governmental Organizations (BOCONGO) BOCONGO is the national umbrella body of all NGOs in Botswana. BOCONGO was established in 1955 to assist in establishing an enabling environment for the NGO sector to become a recognized partner in the development process in Botswana and internationally; and to provide a platform for networking, advocacy, capacity building for local NGOs and mobilizing resources for the self‐sustainability of the NGO sector in Botswana. Its specific objectives are: to facilitate capacity building for local NGOs and CBOs and to ensure their full and effective participation in the development process at both the national and international levels, to facilitate
73
networking amongst NGOs and CBOs, Government, the private sector, donor agencies and other development partners, to facilitate a coordinated response by NGOs and CBOs on issues that require consensus building and to play a leading role in policy advocacy and lobbying. Botswana has recently approved an NGO policy however the policy is not yet functional. BOCONGO comprises a wide variety of NGOs in Botswana which are grouped according to their key sectors. The key NGOs considered for interview under the PEI Botswana were those that fall under the agriculture and environment sectors. Specifically the NGOs that were selected for analysis were the Kgalagadi Conservation Society (KCS) and Somarelang Tikologo (ST). BOCONGO itself was also interviewed to get a sense of how NGOs work in the country. It should be noted that the list of NGOs listed here is not exhaustive. Other NGOs in Botswana that are active in the area of agriculture and natural resources are, African Wildlife Foundation Botswana, Birdlife Botswana, Komku Development Trust, Permaculture Trust of Botswana, Thusano Lefatsheng and Trust for Okavango Cultural and Development Initiatives and Veld Product Research and Development.
8.2.2. The Kgalagadi Conservation Society (KCS) KCS deals mainly with biodiversity conservation. KCS work is evidence based and it conducts research on Biodiversity loss or degradation is particular areas of Botswana. In addition KCS also concerns itself with the utilization of CBNRM to improve rural livelihoods and enterprise development such as work it does in the Western Kgalagadi livelihoods programme. KCS has also been involved in elements of transboundary water management in the Okavango program from as far back as 1982. Energy affairs and sanitation issues will be additional areas of focus in the next 4 years. KCS receives funding from UNDP/GEF to develop water efficiency plans and the WWF to make sure CBNRM is done properly. As mentioned earlier the work of KCS is evidence based. This is mainly because KCS has a good capacity to properly conduct research and analysis to better understand issues and operationalize its findings to influence policy. The KCS has strong and intimate linkages with the Government of Botswana and attends all high level consultative committee meetings. Because KCS sits on various GoB boards they are able to can influence decision making. That fact that KCS’s work is evidence based as well as the impressive track record it has in dealing with environmental issues in the past; KCS’s opinion is valued greatly. In fact, KCS was highly consulted on NDP10. KCS is mainly involved in issues of advocacy and sensitization, conflict resolution and it runs a successful lobby. KCS has recognizes that communities lack capacity for enterprise development through CBNRM. To this end it has assisted with various programmes such as replanting of veld products and in 2005 with fish in the Okavango delta. KCS also provides water for animals in all of the nation’s game reserves. Not all the NGOs have been as successful as KCS the challenge then becomes how to make other NGOs just as successful. If the KCS model can be used for collective action toward environment amongst NGOs this would help a great deal. The concern is that NGOs competing for government funds with more pressing issues like HIV/AIDS. The lack of funding from international donors since Botswana was classified as a middle income country also means that NGOs spend their time competing for funds amongst each other and not working together. KCS pointed out that there is a need for an environment liaison group. With regards to the management of the Environmental Bill and Fund KCS is of the opinion that decision makers in government are not practitioners and may not be better placed to manage the fund. To assist in this regard KCS is currently working on paper to assist with the management of the Environmental Fund.
8.2.3. Somarelang Tikologo (ST) ST is an NGO based in Gaborone which deals mainly with waste management, resource management and environmental planning. It carries out its remit through by conducting demonstrations in schools (e‐schools), providing alternative solutions to government landfills that are used for solid waste disposal and providing
74
proper recycling. ST gets its funding through the Corporate Social Responsibility (CSR) of private companies (like Barclays, Debswana, KBL etc). In recognition of the role that the media can play in sensitizing the public about environmental awareness ST has in the past ran environmental journalism awards for a period of two years before running out of funds. ST also has some outreach programmes for remote area dwellers. Additionally, ST has lobbied members of parliament to get them to buy in to their activities. Some of the successful projects that ST has done include a project for greening the city for town planners; training workshops for teachers and the production of an environmental educational documentary. The problem that ST has faced in doing this was that the Ministry of Education has no buy in or ownership of environmental programs. Although the environment was included in the teaching curriculum, the teachers were left out of the curricula so that they get not training. This greatly affects their effectiveness and ability to deliver to learners. One major milestone for ST was successfully getting the regulation of plastic bags legalized. It took ST together with other stakeholders 10years to get the regulation through the Ministry of Trade. The main challenge or obstacle for ST is the lack of funding since Botswana became a middle income country. NGOs spend time competing for scarce funding and this renders them less able to work independently and collectively to deliver on their mandates. It was felt that it was important for Batswana to understand how their day to day activities impacted on the environment. Additionally, it was felt that existing policies needed to be translated to the local dialect to enable the average person to read and understand them. Concerns were raised about the management of the EF. Smaller NGOs felt that they had no voice in the policy making process. In addition, it was observed that the Green Scorpions were effective at policing big companies but not able to police government institutions. In order to make them more effective ST suggested that perhaps a separate regulatory body which could be given more powers and autonomy was needed to serve as the environmental watchdog.
8.3. UN Agencies: Several officers from various UN Agencies working in Botswana were also interviewed to get an idea of their duties and responsibilities to see how they link up with poverty and environment.
8.3.1. UNDP: The UNDP Environment Office is currently working in three areas: climate change, water resources and renewable energy. Under climate change the work involves looking at understanding climate change as well as conducting of sectoral vulnerability assessments with a view to be able to develop mitigation strategies and develop the capacity to adapt and hence, minimize the impacts of climate change. A second project that is currently underway involves the development of an operational plan on water resources management. This involved developing a water efficiency plan; a pilot project on water reuse and rain water harvesting and water reclamation is underway. The third project involves the reduction of carbon emissions by encourage renewable energy utilization. To this end, a rural solar based initiative, under the RE Botswana project is being rolled out via a franchise model. Some examples of the benefits of such a project include the health and education sectors through provision of solar energy.
8.3.1.1. PE ‐ Challenges and Opportunities The UNDP Environmental Office is involved with capacity building at department level within each ministry. There has been limited analysis of the economic implications climate change on the different sectors. For example, not much has been done to assess the vulnerability of the livestock sector to climate change nor has any work been done to look at how the sector will adapt to climate change. Vulnerability and adaptation
75
assessment are needed for water, agriculture and health to name a few key sectors. At present, an institutional analysis of the water sector is being carried out with a view to have it feed into a water conservation policy.
8.3.2. Global Environmental Facility (GEF) This programme funds environmental initiatives for NGOs, trusts and communities. It covers aspects such as biodiversity, persistent organic pollutants (POPS) and water resources. The Facility also works with communities guided by their operational document o develop their plans. They have also work with communities on land reclamation. In this way the communities are the implementing partners.
8.3.3. United Nations Population Fund (UNFPA) This agency deals mainly issues related to population and development, sexual reproductive health and gender. In terms of the environment UNFPA looks at issues that relate to climate change and the health sector. They collect data and information on who is affected and where. To assist Botswana in providing quality reproductive health and family planning services on the basis of individual choice and in implementing population policies in the context of sustainable development. To promote the strategy endorsed by the 1994 International Conference on Population and Development (ICPD) and reviewed by a special session of the United Nations General Assembly in 1999. To promote cooperation and coordination among UNFPA's partners in addressing issues of population and development, reproductive health, gender equality and the empowerment of women. UNFPA believes that meeting these goals will contribute to improving the quality of life and the universally accepted aim of stabilizing world population. UNFPA also believes that these goals are an integral part of economic development that meets human needs, ensures well being and protects the natural resources on which all life depends. UNFPA is working in close partnership with the GoB, all UN agencies in and out of the country, development banks, bilateral aid agencies, NGOs and civil society.
8.3.4. Food Agriculture Organization (FAO) The FAO has assisted the MoA to develop irrigation policy and strategy; National program for Food Security; Land Management and fisheries; conservation. FAO also assists GoB with agricultural policy analysis. FAO’s technical assistance follows a two year support cycle.
8.3.4.1. FAO – PEI Challenges and Opportunities MoA has a problem translating what has been learnt and transferring it to the farmer to increase technology adoption. MoA capacity to deliver at the district level is poor. MoA does not understand the small farmer. They need to build on what the small farmer already knows i.e. MoA needs to utilize existing indigenous knowledge systems that the farers already are using to address environmental issues at the farm level rather than coming up with conflicting remedies that are not understood by farmers. There is also a lack of coordination between the research function and the extension and coordination function. Ministries see themselves as separate entities. Have separate interests; do not work holistically. MoA needs a communication strategy to change mindset of people. There is a need to strengthen the extension delivery system. MoA also needs to develop a coordination strategy that will harmonize all its PE related activities.
8.3.4. Donors: World Bank (WB), European Community (EC) In the past Botswana received support from various donors including the World Bank (WB) and the European Community (EC) but the economy grew, Botswana turned increasingly to its own resources for development financing. As lending was phased out the WB’s engagement in the country shrank and its focus shifted to analytical and advisory work. Some of the WB activities included support for the Investment Climate Assessment
76
in 2007; the 2005 Export Diversifications Study prepared together with Botswana Institute of Development Policy Analysis (BIDPA) and the Livestock development Strategy in 2006. A country partnership strategy for Botswana planned for the period 2009 to 2013 has been developed by the WB in partnership with the Botswana Government which is linked to Vision 2016 and NDP 10. The strategy will focus on four aspects of Botswana’s short term and long term development agenda namely: enhancing public sector effectiveness, fighting HIV/AIDS and improving education outcomes; increased competitiveness – infrastructure and the climate for investment growth and the environment. The EC has provided support in the areas of economic diversification of the mining sector, wildlife conservation and management; support for the tourism sector via the computerisation of manual booking system for the reserves and park, and improvements made to tourism and staff facility infrastructure. Local communities have also benefited through training on how to monitor their wildlife and natural resources within their community areas. The monitoring is now up and running and being further developed to include coordination of regional inputs. Examples of other EC programme results are capacity building at the DWNP, training and awareness raising concerning wildlife/humans conflict, research and monitoring activities. The EC has also produced a Country Environment Profile in 2006 to inform its Country Strategy Paper for Botswana. It is envisaged that with the implementation of the PEI program support in the relevant poverty and environment areas targeted for investment will be continued.
8.4. Research Institutions: University of Botswana (UB), Botswana Institute of Development Policy Analysis (BIDPA)
8.4.1. Department of Environmental Science, UB The Department of Environmental Science, University of Botswana views Environmental Science (ES) as a multidisciplinary subject that facilitates the understanding of the complex interactions involving natural processes, on the one hand, and between the biophysical (or natural) environment and human activities, on the other. Members of staff in the Department of Environmental Science have a wide range of relevant expertise from both the biophysical and social sciences and are able to produce graduates who understand sustainable development as the paradigm that integrates, and is sensitive to, ecological, social and economic concerns. As such sustainable development as a theme permeates all the programmes offered by the Department. This is ensured by making courses in sustainable development (at the undergraduate level) and integrated environmental management and analysis (at the MSc level) compulsory to students of ES. The department has several ongoing research activities on climate change. They also work in collaboration with MET and have established in 2009 a UB/MET link whose purpose is to enable the two institutions work together on several studies on the impact of climate change on several sectors. The Department of Environmental Science has also worked on CBNRM using its USAID and University of Florida link. It has also worked on IVP with the UNDP. The Department has a full complement of qualified staff with various research interests in the following areas: water resource and climate change, human geography, rural livelihoods, CBNRM and natural resource management. Its programmes foster a multi‐disciplinary approach to the understanding of the biophysical and human‐made environments as well as the intimate relationship between the two; impart theoretical and practical skills (GIS, remotes sensing, EIA etc) and methodologies required to assess and manage the environment and introduces the ideas and concepts of rational planning and management pertinent to sustainable utilization of natural resources. The Department’s offers postgraduate training up to doctoral level.
77
Additionally, during the winter months the Department offers executive course on the environment that are geared towards officers and policy makers who may want to learn more about the subject matter.
8.4.1.1. PE Interface The Department provides national environmental NGOs support, student environmental organization support and service to the Botswana Government departments or projects (such as the NCS and the NSSD to name a few). The department also provides in‐service training for public sector employees to promote competency in environmental management within public sector institutions charged with environmental protection. Recently, the Department ran two short courses in Integrated Environmental Assessment Reporting for UNEP with participants coming from Sub‐Saharan African countries.
8.4.1.2. PE Challenges and Opportunities UB is a leading research institution with a strong reputation on research and training in the environment and climate change fields. As such it provides a major resource for efforts to tackle PE issues in Botswana.
8.4.2. The Botswana Institute of Development Policy Analysis (BIDPA) BIDPA is an independent Trust, which was established in 1995 as a non‐governmental policy research institution. BIDPA’s Mission is to inform policy and build capacity through research and consultancy services. Its objectives are: to promote and conduct research, analysis and publication on development policy issues, which are of relevance to Botswana and the Southern African region; to monitor the performance of the Botswana economy and the management of public policy implementation, especially with regard to the implications for economic and social development; to offer advice and consultancy services to agencies of Government and other clients under suitable contractual and other arrangement; to provide technical and financial assistance, directly and indirectly, to individuals and organizations in Botswana as deemed desirable for purposes of facilitating policy analysis; to assist professional training and public education of Botswana citizens in matters relating to policy analysis and to encourage collaboration between expatriates and local professionals in these matters in ways which build, or augment, national capacities for performance and understanding of policy analysis. The research function is specialized in the broad areas of Macroeconomic Forecasting and Planning, Microeconomics, International Trade and Finance Economics, Incomes, Welfare and Poverty Economics, and Public Sector Reforms and is headed by Senior Research Fellows. Since its 9 years of operation BIDPA has completed 350 projects which it has done in partnership with government ministries and other clients/agencies. BIDPA works in collaboration with other partners such as the World Bank, UNDP, USAID and SADC to name a few.
8.4.2.1. PE‐ Challenge and Opportunity BIDPA has conducted many studies in the area of poverty under the auspices of its Poverty Unit. Most of its work does not focus purely on environmental issues alone. In cases where there is a PE linkage in a study that is been undertaken the practice has been to work in collaboration with other institutions such as it did with the Centre of Applied Research (CAR) on the study on the Long Term Viability of the Livestock Sector in Botswana. CAR was responsible for the poverty and environment component of that study. CAR has qualified researchers and analysts that are equipped to undertake poverty and environment and natural resource management related studies. In fact CAR has worked with DEA on a number of projects and was directly involved in developing the multi criteria analysis instrument. BIDPA is open to collaboration with its stakeholders.
8.4.1. Media The Botswana media system consists of: four private radio stations and one government owned radio station, one local television station set up in 2000, and more than five newspapers, one of which is a government publication. When it comes to media and press freedom Botswana is one of the better performers in Africa. In 2006 the country was ranked 53 out of 168 countries (RWB, 2006). The independent private press is made up of
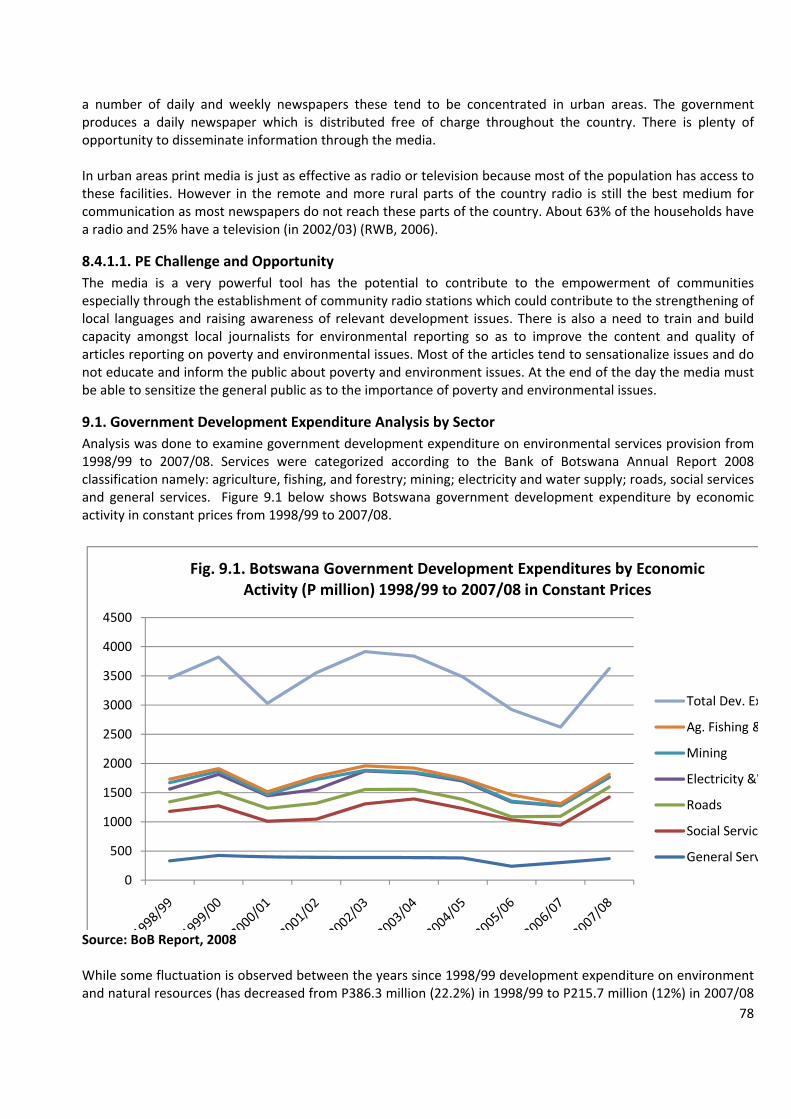
78
a number of daily and weekly newspapers these tend to be concentrated in urban areas. The government produces a daily newspaper which is distributed free of charge throughout the country. There is plenty of opportunity to disseminate information through the media. In urban areas print media is just as effective as radio or television because most of the population has access to these facilities. However in the remote and more rural parts of the country radio is still the best medium for communication as most newspapers do not reach these parts of the country. About 63% of the households have a radio and 25% have a television (in 2002/03) (RWB, 2006).
8.4.1.1. PE Challenge and Opportunity The media is a very powerful tool has the potential to contribute to the empowerment of communities especially through the establishment of community radio stations which could contribute to the strengthening of local languages and raising awareness of relevant development issues. There is also a need to train and build capacity amongst local journalists for environmental reporting so as to improve the content and quality of articles reporting on poverty and environmental issues. Most of the articles tend to sensationalize issues and do not educate and inform the public about poverty and environment issues. At the end of the day the media must be able to sensitize the general public as to the importance of poverty and environmental issues.
9.1. Government Development Expenditure Analysis by Sector Analysis was done to examine government development expenditure on environmental services provision from 1998/99 to 2007/08. Services were categorized according to the Bank of Botswana Annual Report 2008 classification namely: agriculture, fishing, and forestry; mining; electricity and water supply; roads, social services and general services. Figure 9.1 below shows Botswana government development expenditure by economic activity in constant prices from 1998/99 to 2007/08.
0
500
1000
1500
2000
2500
3000
3500
4000
4500
Fig. 9.1. Botswana Government Development Expenditures by Economic Activity (P million) 1998/99 to 2007/08 in Constant Prices
Total Dev. Ex
Ag. Fishing &
Mining
Electricity &W
Roads
Social Servic
General Serv
Source: BoB Report, 2008
While some fluctuation is observed between the years since 1998/99 development expenditure on environment and natural resources (has decreased from P386.3 million (22.2%) in 1998/99 to P215.7 million (12%) in 2007/08

79
in real terms indicating a decline of 10% over the period. In comparison, expenditures on general services, social services and roads which are non‐environment and natural resources sectors but are mainly have a poverty reduction element has risen to 88.1% over the same period. By 2007/08, environment related expenditures comprised only 12% of the total development expenditures. Although there was a downward trend in development expenditure in real terms particularly during the period from 2003/04 to 2006/07; there was an increase in total development expenditure in 2007/08 in real terms. The bulk of development expenditure went to general services (mainly defence) and social services. The bulk of the development expenditure under social services includes development expenditure on: education, health (on HIV/AIDS), food and social welfare programs, housing, urban and regional development and other community services, are investments in areas mainly aimed poverty reduction and improving in social wellbeing or welfare. Generally, Botswana spends a good proportion of its development expenditure on poverty reduction. Figure 12.2 below shows Botswana government development expenditure on environment by economic activity in P million from 1998/99 to 2007/08.
0.0
500.0
1000.0
1500.0
2000.0
2500.0
3000.0
3500.0
1998/991999/002000/012001/022002/032003/042004/052005/062006/072007/08
Fig. 9.2. Botswana Govrnment Development Expenditure on the Environment by Economic Activity (P million) 1998/99 to 2007/08 in Constant Prices
Total Dev Exp.
Ag. Fishing & For.
Mining
Electricity &Water
Source: BoB Annual Report, 2008
Expenditure on agriculture, fishing and forestry, mining, electricity and water rose gradually from 1998/99 to 2004/05 peaking in 2005/06. Since then, there has been a decline in development expenditure allocated to the environment in real terms. The peak may be attributed to developments and expansion projects in agriculture, water and electricity sectors. Nevertheless, the general decline in environment related development expenditure does not auger well for poverty reduction, economic diversification as well as sustainable development goals in the long run. Cutbacks in environment related investments eventually mean more spending on rehabilitating the environment (which could have been avoided from the onset); diverting scarce financial resources from other planned productive activities and restricting further growth.
80
9.2. Findings from Development Expenditure Analysis by Sector While there has been some fluctuation between years, development expenditure on environmental services (agriculture, fishing and forestry, mining, electricity and water supply) has decreased over the period under consideration. Expenditure on environmental services which stood at 12% of total development in 2007/08 is significantly lower than development expenditure for non‐environmental services which stands at 88.1% (BoB Annual Report, 2008). This raises some concern as it means that the proportion of government expenditure that goes towards environmental investments has indeed declined. It should be noted though that development expenditure on general and social services has risen over the same period indicating that government has stood by its commitment to tackle poverty.
9.3. PE Challenge and Opportunity • The case for environmental investment must continue to be emphasized because investments made now may avoid higher costs of rehabilitation in the future. • Expenditure on water, electricity may be reduced by investments in public education, building standards etc for water and energy efficiency. Dam constructions are huge investments and do regularly get compromised by soil erosion in the catchment area. Investments in soil conservation and forest management can help to optimise the dam capacity. • Investments in dam construction have not yielded the optimal poverty reduction opportunities through land (estate) value, tourism, fisheries, etc.
9.4. Key Conclusions of the Institutional Analysis Despite Botswana’s significant development achievements in recent years the recent economic crisis has emphasised the need for diversification to reduce vulnerability to external shocks. In addition to economic shocks this analysis concludes that Botswana is also vulnerable to environmental and climate change shocks which have the potential to reduce economic growth and reverse achievements in reducing poverty. It is also clear that when environmental or climate change occurs that it is the poorest who are hardest hit. Key challenges affecting future performance on growth and poverty reduction include, soil erosion and land degradation, pollution, inadequate water resource management, inadequate solid and waste management, deforestation, and inadequate adaptation and mitigation strategies to deal with climate change. Because the poor are largely dependent on the environment, they are the ones most affected when it gets degraded. A degraded environment translates to fewer assets for the generation of economic growth and income necessary for poverty reduction. These linkages and the inadequate way they are interacted into most national and sectoral development processes led UNDP‐UNEP PEI to embark on a process to assist Botswana to mainstream environmentally sustainable natural resource management in its development plans and processes. Following analysis of key plans, policies, strategies, key sector ministries, departments, district and local level structures this review’s main findings are that: • PE issues are covered in a fragmented way in Vision 2016 and other key plans, policies and strategies. • Responsibility for PE issues is fragmented and spread across a range of sectors making inter‐ministerial coordination difficult. • Existing structures, mechanisms and processes for implementing and coordinating issues that are cross cutting need to be strengthened and capacitated to improve their ability to champion and lead PE issues. • Contradictions and duplication when it comes to remits between ministries need to be harmonized. • Little emphasis on environmental education hampers efforts to promote understanding, awareness, and advocacy for making environmental investments.
81
• Appropriate tools are not consistently used meaning that environmental investments are given low priority. • Civil society with potentially good capacity is fragmented and not united on interventions on PE in policies and plans and under resourced. • There is limited dialogue on PE issues across government and society generally and stories in the media tend to be alarmist spelling doom and gloom scenarios As a result of these findings the analysis concludes that there is a strong case for:‐
• Support for increased evidence, awareness and advocacy on the role of environment in delivering poverty reduction and economic growth; • Support for improved integration of PE issues in key plans and policies and harmonization of approaches across Government institutions; and • Increased capacity for budgeting and financing PE related policies and programmes and for Monitoring and Evaluating the impact of such interventions. Specific PE activities under the three key themes outlined above include: • A need to develop much compelling evidence and analysis that can be easily grasped by decision makers to inform them of the need to more fully consider the role of environmental assets in delivery growth and poverty reduction and to convince them to make funding available for environmental investments • Need to examine more closely how PE linked interventions are financed including how to make a better case for such expenditures • Opportunities for better integration of PE lie in the review of the NSPR and preparations for and actual midterm reviews of NDP10 and DDP9. Additionally, on the review of other key inter‐sectoral policies like the RDP. • Improved PE monitoring and evaluation through use of enhanced PE indicators • More inter and intra dialogue across sectors on PE related issues and; • Support for improved awareness and coordination of climate change issues across government.
82
REFERENCES Bank of Botswana (2005) Annual Report Bank of Botswana (2008) Annual Report BIDPA (2004) The State of Governance in Botswana 2004: BIDPA CAR (2009) Case Studies in Environmental Economics CAR (2006) Final Report: Poverty and Social Impact Assessment of the Livestock (Beef) Sector in Botswana CAR (2008) Natural Resource Management Expenditures in Botswana CSO (2001) Housing and Population Census CSO (2003) Literacy Survey CSO (2004) Household Income Expenditure Survey (2002/03) CSO (2006) Environmental Statistics 2006 CSO (2006) Environmental Statistics Brief 2006 EC (2006) Botswana Country Environmental Profile FAO‐OECD (2008) Agricultural Outlook 2008_2017 Paris and Rome May 2008 GOB (1990) National Conservation Strategy DMS (1996) First Communication to the UNFCC MFDP (2000) National Food Strategy MFDP (2002) Revised National Policy for Rural Development MFDP (2003) National Strategy for Poverty Reduction MFDP (2009) Draft National Development Plan 10 MFDP (2006/07) Annual Poverty Monitoring Report MFDP (2007) Poverty and Food Security Bulletin December 2006 and June 2007 MFDP (2008) Drought and Household Food Security Outlook for the Year 2008 MFDP (2006) State of Poverty and Poverty Reduction Initiatives in Botswana: MOA (2007) Draft Agricultural Sector Performance Report 2007 MEWT (2006) Botswana National Action Programme to Combat Desertification 2006 MEWT (2007) Botswana Biodiversity Strategy and Action Plan 2007 MEWT (2007) Community Based Natural Resource Management Policy MEWT (2008) Okavango Delta Management Plan January 2008 MEWT (2008) Botswana Mineral Accounts 2008 MEWT (2008) Environmental Keynote Paper for National Development Plan 10 Botswana UNDP (2004) Progress Toward Meeting Botswana Millennium Development Goals UNDP (2007) Strengthening Tourism Statistics and Formulation of an Experimental TSA for 2006‐06 UNDP (2008) Botswana Human Development Report 2007/08: UNDP World Bank (2007) Ghana Country Environmental Profile
83
Annex 1: Interviewees: Ministry of Finance and Development Planning: Dr. Teklu: Poverty Policy Advisor Mrs Koketso: Deputy Director: Rural Development Policy Mr. Radibe: Director: Food and Poverty Policy Coordination Mrs. Molefhi: Principal Food Strategy Coordinator I Mr. Baruti: CFPC (CC) Mrs. Rrakgantswane: Principal Food Strategy Coordinator II Mr. Makgwa: Planning Chief Economist Projects Mrs. Malikongwa: Policy CECM C. Maphorisa: PP0 (CMU) Department of Environmental Affairs Ingrid Otukile: Head, Policies and programmes Mike Flyman: Environmental Information Management Arabang Kanego: Environmental Education Tlhokomelo Phuthego: Policies and Programmes Kwashirai Chigodora: Natural Resources Officer Jobe Manga: Assistant Natural Resources Officer Ministry of Agriculture B. Moganane: Chief Land Utilization Officer B. Mthangwane: Chief Ag. Engineer H. Gabaaitse: K. Sebi: Principal Ag. Scientific Officer M. Matsietsa: Principal Ag. Officer D. Keboneilwe: Chief Rural Sociologist Department of Meteorological Services Mr. Phage: Director Mr. Balisi Gopolang Department of Wildlife and National Parks Fisheries Mr. Mmopelwa Mr. Batshabang Mr. Nengu Energy Affairs Division K. Molosiwa: Principal Energy Officer C. Matshameko: Principal Energy Engineer
M. Tautona: Acting Senior Energy Officer B. Ntwaagae: Energy Officer L. Matsuane: Assistant Energy Officer D. Theetsong: Principal Administration Officer J. Setlhare: Engineer M. Mangole: Assistant Energy Engineer S. Sibale: PRO N. Motshwarakgole: Assistant Energy Officer B. Mabowe: Principal Energy Officer A. Mmolawa: Senior Energy Officer Department of Water Affairs O. Serumola: PWE I K. Kalaole PWRE I I. Mannathoko PHGI Ministry of Local Government Ofentse Modisa Ellen Sekgopi Sekgabo Makgosa Unoziba Majore Trinity Mphoeng Lorato Oremeng Department of Tourism Mrs. K. Maselesele: Director Botswana Tourism Board Mr. Tswetla CBNRM Ms. Masilo‐Rakgoasi: Coordinator National Disaster Management Office Mr. N. Moyo Kgalagadi Conservation Society Mr. Felix Monggae: CEO Botswana Power Corporation Mr. A. Motsepe: Director Rural Business Unit Ministry of Health Mr. Matsoga Debswana Mr. Fred Jansen Mr. Mogotsi BOCCIM Mr. Ketlaaleka FAO Mr. David Tibe
UB Environmental Science Prof. Parida: Water Resources & Climate Change Prof. Chanda: Human Geography Dr. Mulale: CBNRM & Rural Livelihoods Prof. Gwebu: Population Issues, Development & Environment Prof. Segosebe: Natural Resource Management Somarelang Tikologo Keneilwe Moseki: Executive Director SADC Mr. A. Banda UN Programme Managers Kabo Maruatona (UNFPA) Mr. Leonard Dikobe (UNDP) Ms. Elsie Mvimi (GEF) District Planning B. Mosarwa South East District B.S. Boitumelo South East District Felicity Nyoni South East District G. B. Rasedibo South East District Brook K. Southern District M. Kitimbele Southern District Mothibi Kweneng District Mtembe Makunya Kweneng District Otimile D. C. Kgatleng District Ramodisa M. Kgatleng District Shatera G.W. Kgatleng District B. Matlhaga P. Ramosweu K. L. Molefhi S.J. Baruti C. Koketso G. Mangole T. Keseabetswe
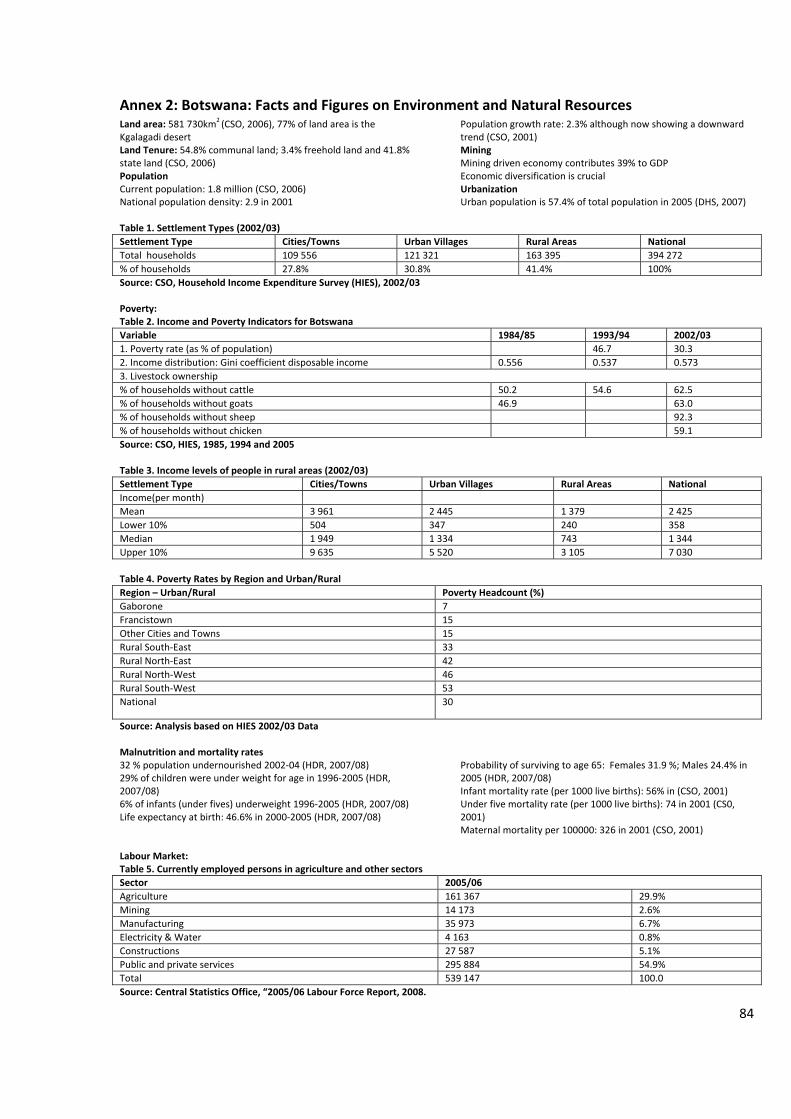
84
Annex 2: Botswana: Facts and Figures on Environment and Natural Resources Land area: 581 730km2 (CSO, 2006), 77% of land area is the Kgalagadi desert Land Tenure: 54.8% communal land; 3.4% freehold land and 41.8% state land (CSO, 2006) Population Current population: 1.8 million (CSO, 2006) National population density: 2.9 in 2001
Population growth rate: 2.3% although now showing a downward trend (CSO, 2001) Mining Mining driven economy contributes 39% to GDP Economic diversification is crucial Urbanization Urban population is 57.4% of total population in 2005 (DHS, 2007)
Table 1. Settlement Types (2002/03) Settlement Type Cities/Towns Urban Villages Rural Areas National Total households 109 556 121 321 163 395 394 272 % of households 27.8% 30.8% 41.4% 100% Source: CSO, Household Income Expenditure Survey (HIES), 2002/03 Poverty: Table 2. Income and Poverty Indicators for Botswana Variable 1984/85 1993/94 2002/03 1. Poverty rate (as % of population) 46.7 30.3 2. Income distribution: Gini coefficient disposable income 0.556 0.537 0.573 3. Livestock ownership % of households without cattle 50.2 54.6 62.5 % of households without goats 46.9 63.0 % of households without sheep 92.3 % of households without chicken 59.1 Source: CSO, HIES, 1985, 1994 and 2005 Table 3. Income levels of people in rural areas (2002/03) Settlement Type Cities/Towns Urban Villages Rural Areas National Income(per month) Mean 3 961 2 445 1 379 2 425 Lower 10% 504 347 240 358 Median 1 949 1 334 743 1 344 Upper 10% 9 635 5 520 3 105 7 030 Table 4. Poverty Rates by Region and Urban/Rural Region – Urban/Rural Poverty Headcount (%) Gaborone 7 Francistown 15 Other Cities and Towns 15 Rural South‐East 33 Rural North‐East 42 Rural North‐West 46 Rural South‐West 53 National 30
Source: Analysis based on HIES 2002/03 Data Malnutrition and mortality rates 32 % population undernourished 2002‐04 (HDR, 2007/08) 29% of children were under weight for age in 1996‐2005 (HDR, 2007/08) 6% of infants (under fives) underweight 1996‐2005 (HDR, 2007/08) Life expectancy at birth: 46.6% in 2000‐2005 (HDR, 2007/08)
Probability of surviving to age 65: Females 31.9 %; Males 24.4% in 2005 (HDR, 2007/08) Infant mortality rate (per 1000 live births): 56% in (CSO, 2001) Under five mortality rate (per 1000 live births): 74 in 2001 (CS0, 2001) Maternal mortality per 100000: 326 in 2001 (CSO, 2001)
Labour Market: Table 5. Currently employed persons in agriculture and other sectors Sector 2005/06 Agriculture 161 367 29.9% Mining 14 173 2.6% Manufacturing 35 973 6.7% Electricity & Water 4 163 0.8% Constructions 27 587 5.1% Public and private services 295 884 54.9% Total 539 147 100.0 Source: Central Statistics Office, “2005/06 Labour Force Report, 2008.
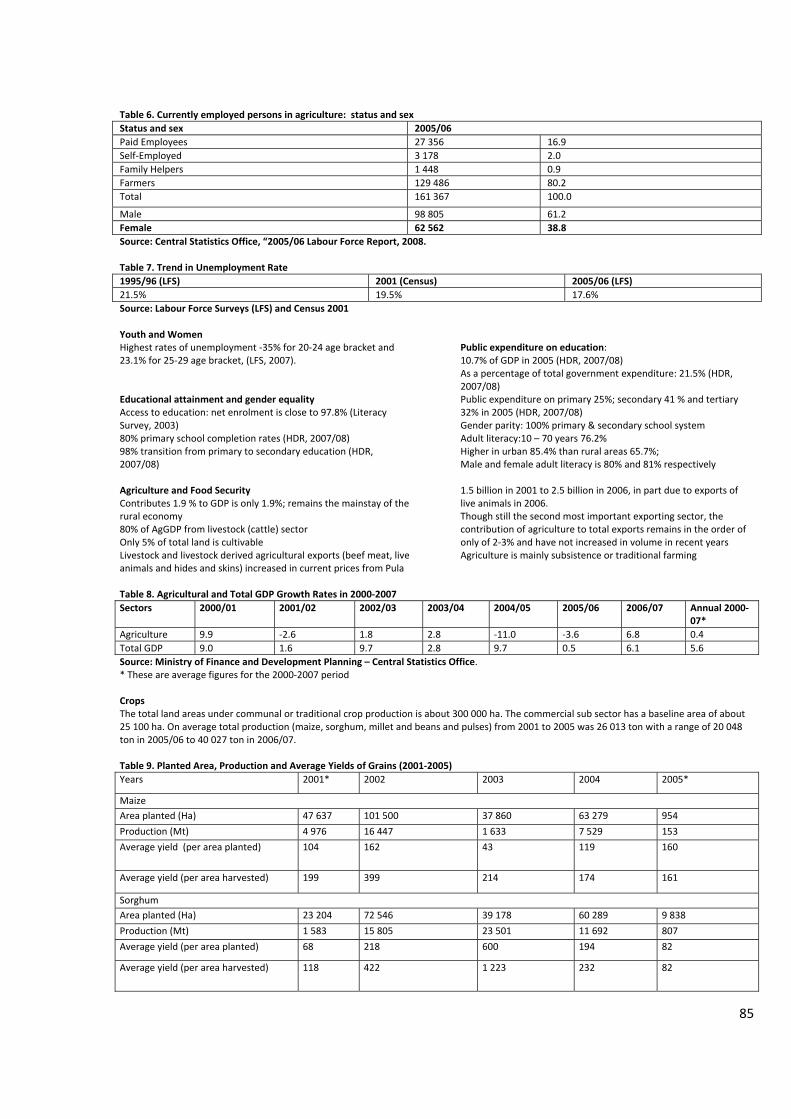
85
Table 6. Currently employed persons in agriculture: status and sex Status and sex 2005/06 Paid Employees 27 356 16.9 Self‐Employed 3 178 2.0 Family Helpers 1 448 0.9 Farmers 129 486 80.2 Total 161 367 100.0
Male 98 805 61.2 Female 62 562 38.8 Source: Central Statistics Office, “2005/06 Labour Force Report, 2008. Table 7. Trend in Unemployment Rate 1995/96 (LFS) 2001 (Census) 2005/06 (LFS) 21.5% 19.5% 17.6% Source: Labour Force Surveys (LFS) and Census 2001 Youth and Women Highest rates of unemployment ‐35% for 20‐24 age bracket and 23.1% for 25‐29 age bracket, (LFS, 2007). Educational attainment and gender equality Access to education: net enrolment is close to 97.8% (Literacy Survey, 2003) 80% primary school completion rates (HDR, 2007/08) 98% transition from primary to secondary education (HDR, 2007/08)
Public expenditure on education: 10.7% of GDP in 2005 (HDR, 2007/08) As a percentage of total government expenditure: 21.5% (HDR, 2007/08) Public expenditure on primary 25%; secondary 41 % and tertiary 32% in 2005 (HDR, 2007/08) Gender parity: 100% primary & secondary school system Adult literacy:10 – 70 years 76.2% Higher in urban 85.4% than rural areas 65.7%; Male and female adult literacy is 80% and 81% respectively
Agriculture and Food Security Contributes 1.9 % to GDP is only 1.9%; remains the mainstay of the rural economy 80% of AgGDP from livestock (cattle) sector Only 5% of total land is cultivable Livestock and livestock derived agricultural exports (beef meat, live animals and hides and skins) increased in current prices from Pula
1.5 billion in 2001 to 2.5 billion in 2006, in part due to exports of live animals in 2006. Though still the second most important exporting sector, the contribution of agriculture to total exports remains in the order of only of 2‐3% and have not increased in volume in recent years Agriculture is mainly subsistence or traditional farming
Table 8. Agricultural and Total GDP Growth Rates in 2000‐2007 Sectors 2000/01 2001/02 2002/03 2003/04 2004/05 2005/06 2006/07 Annual 2000‐
07* Agriculture 9.9 ‐2.6 1.8 2.8 ‐11.0 ‐3.6 6.8 0.4 Total GDP 9.0 1.6 9.7 2.8 9.7 0.5 6.1 5.6 Source: Ministry of Finance and Development Planning – Central Statistics Office. * These are average figures for the 2000‐2007 period Crops The total land areas under communal or traditional crop production is about 300 000 ha. The commercial sub sector has a baseline area of about 25 100 ha. On average total production (maize, sorghum, millet and beans and pulses) from 2001 to 2005 was 26 013 ton with a range of 20 048 ton in 2005/06 to 40 027 ton in 2006/07. Table 9. Planted Area, Production and Average Yields of Grains (2001‐2005) Years 2001* 2002 2003 2004 2005*
Maize Area planted (Ha) 47 637 101 500 37 860 63 279 954
Production (Mt) 4 976 16 447 1 633 7 529 153
Average yield (per area planted) 104 162 43 119 160
Average yield (per area harvested) 199 399 214 174 161
Sorghum Area planted (Ha) 23 204 72 546 39 178 60 289 9 838
Production (Mt) 1 583 15 805 23 501 11 692 807
Average yield (per area planted) 68 218 600 194 82
Average yield (per area harvested) 118 422 1 223 232 82
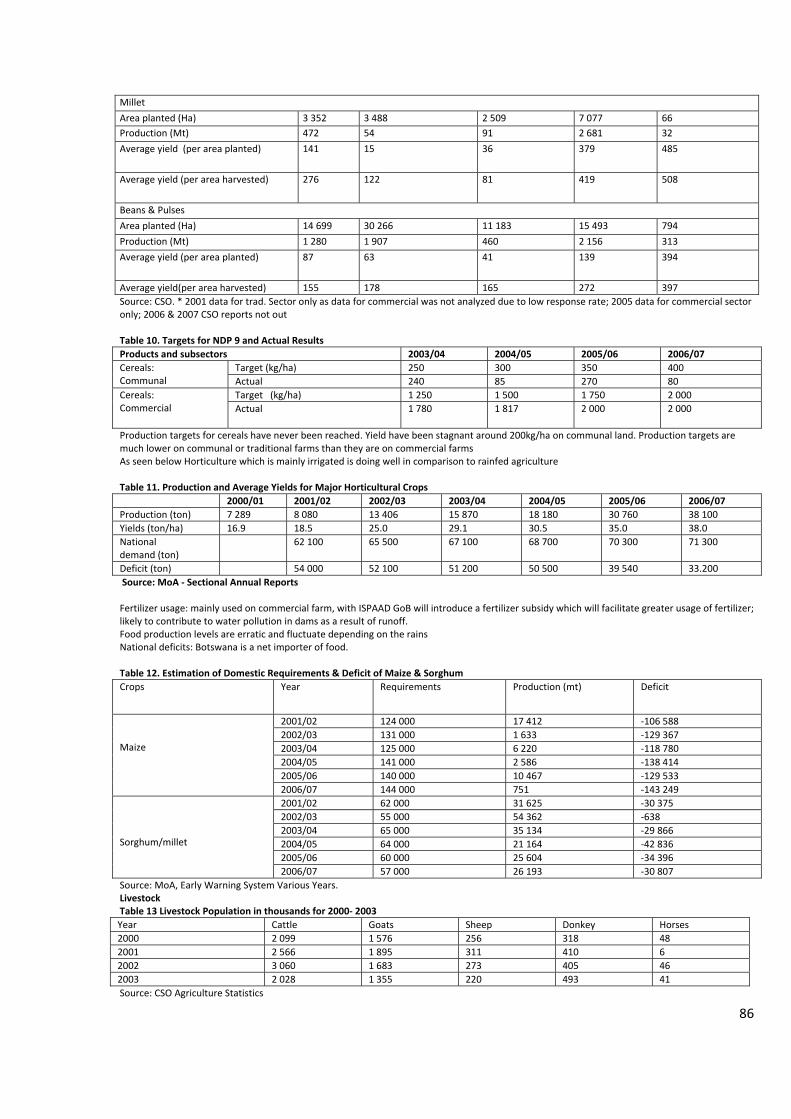
86
Millet
Area planted (Ha) 3 352 3 488 2 509 7 077 66 Production (Mt) 472 54 91 2 681 32
Average yield (per area planted) 141 15 36 379 485
Average yield (per area harvested) 276 122 81 419 508
Beans & Pulses
Area planted (Ha) 14 699 30 266 11 183 15 493 794
Production (Mt) 1 280 1 907 460 2 156 313
Average yield (per area planted) 87 63 41 139 394
Average yield(per area harvested) 155 178 165 272 397 Source: CSO. * 2001 data for trad. Sector only as data for commercial was not analyzed due to low response rate; 2005 data for commercial sector only; 2006 & 2007 CSO reports not out Table 10. Targets for NDP 9 and Actual Results Products and subsectors 2003/04 2004/05 2005/06 2006/07
Target (kg/ha) 250 300 350 400 Cereals: Communal Actual 240 85 270 80
Target (kg/ha) 1 250 1 500 1 750 2 000 Cereals: Commercial
Actual
1 780 1 817 2 000 2 000
Production targets for cereals have never been reached. Yield have been stagnant around 200kg/ha on communal land. Production targets are much lower on communal or traditional farms than they are on commercial farms As seen below Horticulture which is mainly irrigated is doing well in comparison to rainfed agriculture Table 11. Production and Average Yields for Major Horticultural Crops 2000/01 2001/02 2002/03 2003/04 2004/05 2005/06 2006/07 Production (ton) 7 289 8 080 13 406 15 870 18 180 30 760 38 100 Yields (ton/ha) 16.9 18.5 25.0 29.1 30.5 35.0 38.0 National demand (ton)
62 100 65 500 67 100 68 700 70 300 71 300
Deficit (ton) 54 000 52 100 51 200 50 500 39 540 33.200 Source: MoA ‐ Sectional Annual Reports Fertilizer usage: mainly used on commercial farm, with ISPAAD GoB will introduce a fertilizer subsidy which will facilitate greater usage of fertilizer; likely to contribute to water pollution in dams as a result of runoff. Food production levels are erratic and fluctuate depending on the rains National deficits: Botswana is a net importer of food. Table 12. Estimation of Domestic Requirements & Deficit of Maize & Sorghum Crops Year Requirements Production (mt) Deficit
2001/02 124 000 17 412 ‐106 588 2002/03 131 000 1 633 ‐129 367 2003/04 125 000 6 220 ‐118 780 2004/05 141 000 2 586 ‐138 414 2005/06 140 000 10 467 ‐129 533
Maize
2006/07 144 000 751 ‐143 249 2001/02 62 000 31 625 ‐30 375 2002/03 55 000 54 362 ‐638 2003/04 65 000 35 134 ‐29 866 2004/05 64 000 21 164 ‐42 836 2005/06 60 000 25 604 ‐34 396
Sorghum/millet
2006/07 57 000 26 193 ‐30 807 Source: MoA, Early Warning System Various Years. Livestock Table 13 Livestock Population in thousands for 2000‐ 2003 Year Cattle Goats Sheep Donkey Horses 2000 2 099 1 576 256 318 48 2001 2 566 1 895 311 410 6 2002 3 060 1 683 273 405 46 2003 2 028 1 355 220 493 41 Source: CSO Agriculture Statistics
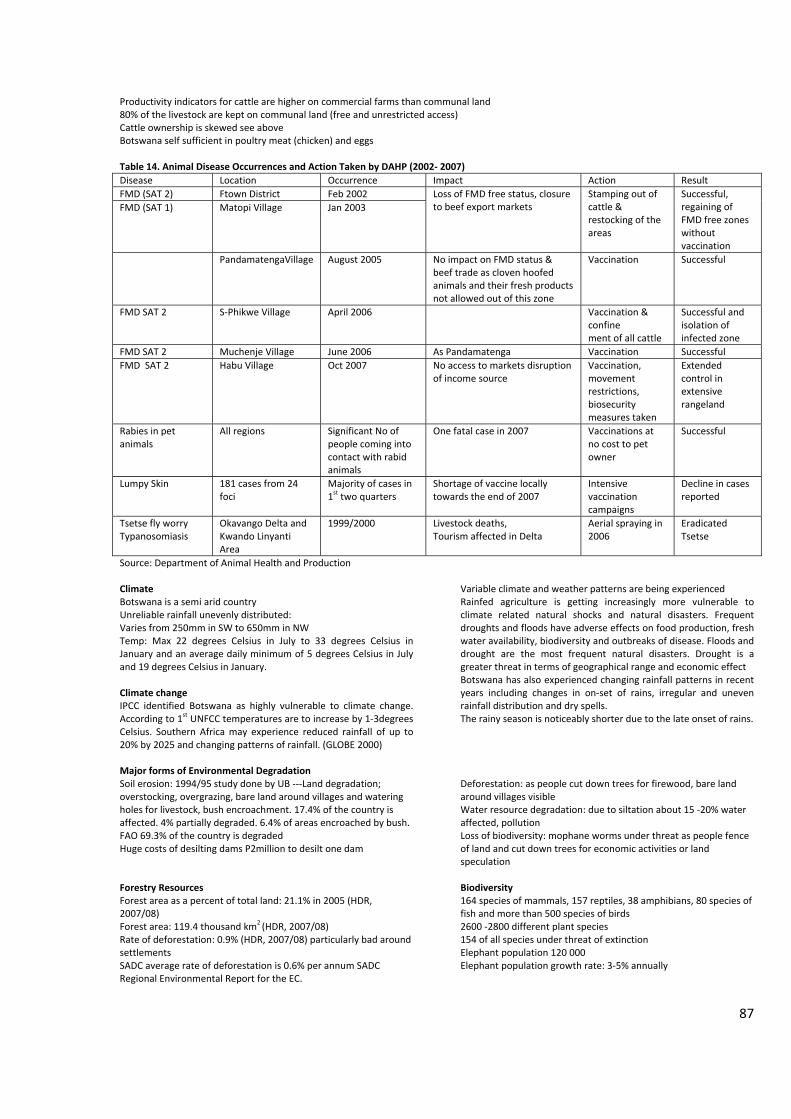
87
Productivity indicators for cattle are higher on commercial farms than communal land 80% of the livestock are kept on communal land (free and unrestricted access) Cattle ownership is skewed see above Botswana self sufficient in poultry meat (chicken) and eggs Table 14. Animal Disease Occurrences and Action Taken by DAHP (2002‐ 2007) Disease Location Occurrence Impact Action Result FMD (SAT 2) Ftown District Feb 2002 FMD (SAT 1) Matopi Village Jan 2003
Loss of FMD free status, closure to beef export markets
Stamping out of cattle & restocking of the areas
Successful, regaining of FMD free zones without vaccination
PandamatengaVillage August 2005 No impact on FMD status & beef trade as cloven hoofed animals and their fresh products not allowed out of this zone
Vaccination Successful
FMD SAT 2 S‐Phikwe Village April 2006 Vaccination & confine ment of all cattle
Successful and isolation of infected zone
FMD SAT 2 Muchenje Village June 2006 As Pandamatenga Vaccination Successful FMD SAT 2 Habu Village Oct 2007 No access to markets disruption
of income source Vaccination, movement restrictions, biosecurity measures taken
Extended control in extensive rangeland
Rabies in pet animals
All regions Significant No of people coming into contact with rabid animals
One fatal case in 2007 Vaccinations at no cost to pet owner
Successful
Lumpy Skin 181 cases from 24 foci
Majority of cases in 1st two quarters
Shortage of vaccine locally towards the end of 2007
Intensive vaccination campaigns
Decline in cases reported
Tsetse fly worry Typanosomiasis
Okavango Delta and Kwando Linyanti Area
1999/2000 Livestock deaths, Tourism affected in Delta
Aerial spraying in 2006
Eradicated Tsetse
Source: Department of Animal Health and Production Climate Botswana is a semi arid country Unreliable rainfall unevenly distributed: Varies from 250mm in SW to 650mm in NW Temp: Max 22 degrees Celsius in July to 33 degrees Celsius in January and an average daily minimum of 5 degrees Celsius in July and 19 degrees Celsius in January. Climate change IPCC identified Botswana as highly vulnerable to climate change. According to 1st UNFCC temperatures are to increase by 1‐3degrees Celsius. Southern Africa may experience reduced rainfall of up to 20% by 2025 and changing patterns of rainfall. (GLOBE 2000)
Variable climate and weather patterns are being experienced Rainfed agriculture is getting increasingly more vulnerable to climate related natural shocks and natural disasters. Frequent droughts and floods have adverse effects on food production, fresh water availability, biodiversity and outbreaks of disease. Floods and drought are the most frequent natural disasters. Drought is a greater threat in terms of geographical range and economic effect Botswana has also experienced changing rainfall patterns in recent years including changes in on‐set of rains, irregular and uneven rainfall distribution and dry spells. The rainy season is noticeably shorter due to the late onset of rains.
Major forms of Environmental Degradation Soil erosion: 1994/95 study done by UB ‐‐‐Land degradation; overstocking, overgrazing, bare land around villages and watering holes for livestock, bush encroachment. 17.4% of the country is affected. 4% partially degraded. 6.4% of areas encroached by bush. FAO 69.3% of the country is degraded Huge costs of desilting dams P2million to desilt one dam
Deforestation: as people cut down trees for firewood, bare land around villages visible Water resource degradation: due to siltation about 15 ‐20% water affected, pollution Loss of biodiversity: mophane worms under threat as people fence of land and cut down trees for economic activities or land speculation
Forestry Resources Forest area as a percent of total land: 21.1% in 2005 (HDR, 2007/08) Forest area: 119.4 thousand km2 (HDR, 2007/08) Rate of deforestation: 0.9% (HDR, 2007/08) particularly bad around settlements SADC average rate of deforestation is 0.6% per annum SADC Regional Environmental Report for the EC.
Biodiversity 164 species of mammals, 157 reptiles, 38 amphibians, 80 species of fish and more than 500 species of birds 2600 ‐2800 different plant species 154 of all species under threat of extinction Elephant population 120 000 Elephant population growth rate: 3‐5% annually
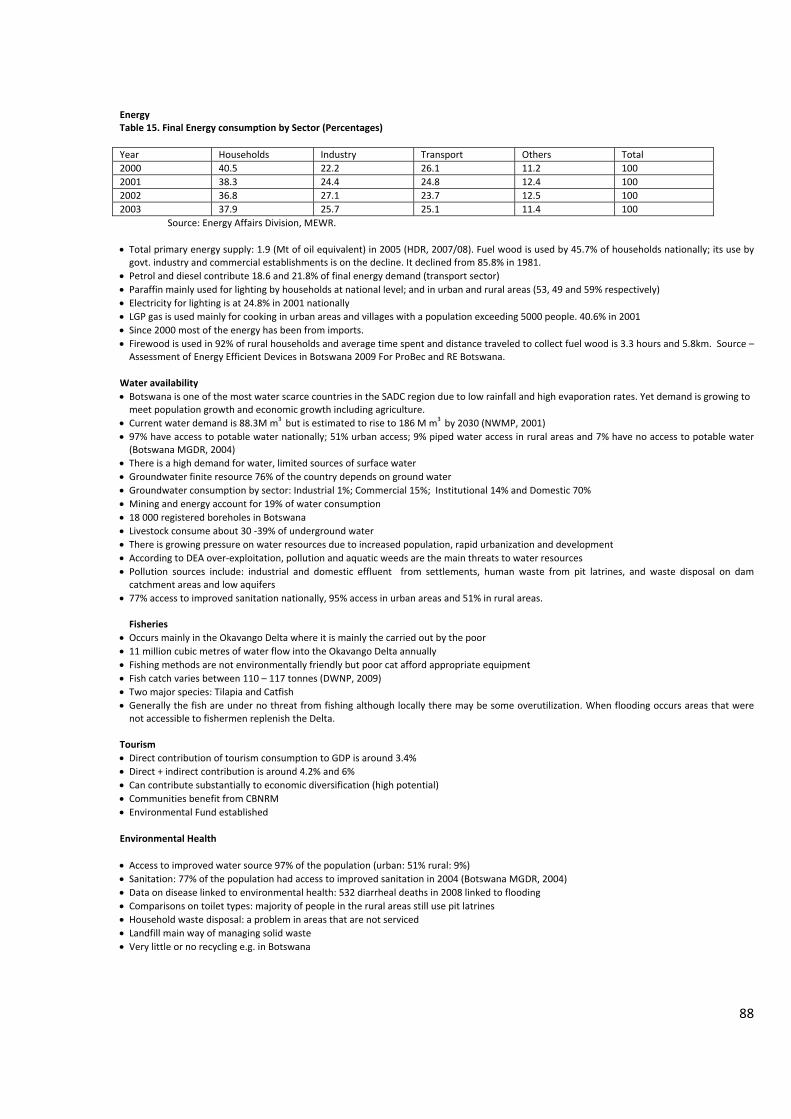
88
Energy Table 15. Final Energy consumption by Sector (Percentages)
Year Households Industry Transport Others Total 2000 40.5 22.2 26.1 11.2 100 2001 38.3 24.4 24.8 12.4 100 2002 36.8 27.1 23.7 12.5 100 2003 37.9 25.7 25.1 11.4 100
Source: Energy Affairs Division, MEWR.
• Total primary energy supply: 1.9 (Mt of oil equivalent) in 2005 (HDR, 2007/08). Fuel wood is used by 45.7% of households nationally; its use by govt. industry and commercial establishments is on the decline. It declined from 85.8% in 1981.
• Petrol and diesel contribute 18.6 and 21.8% of final energy demand (transport sector) • Paraffin mainly used for lighting by households at national level; and in urban and rural areas (53, 49 and 59% respectively) • Electricity for lighting is at 24.8% in 2001 nationally • LGP gas is used mainly for cooking in urban areas and villages with a population exceeding 5000 people. 40.6% in 2001 • Since 2000 most of the energy has been from imports. • Firewood is used in 92% of rural households and average time spent and distance traveled to collect fuel wood is 3.3 hours and 5.8km. Source – Assessment of Energy Efficient Devices in Botswana 2009 For ProBec and RE Botswana.
Water availability • Botswana is one of the most water scarce countries in the SADC region due to low rainfall and high evaporation rates. Yet demand is growing to meet population growth and economic growth including agriculture.
• Current water demand is 88.3M m3 but is estimated to rise to 186 M m3 by 2030 (NWMP, 2001) • 97% have access to potable water nationally; 51% urban access; 9% piped water access in rural areas and 7% have no access to potable water (Botswana MGDR, 2004)
• There is a high demand for water, limited sources of surface water • Groundwater finite resource 76% of the country depends on ground water • Groundwater consumption by sector: Industrial 1%; Commercial 15%; Institutional 14% and Domestic 70% • Mining and energy account for 19% of water consumption • 18 000 registered boreholes in Botswana • Livestock consume about 30 ‐39% of underground water • There is growing pressure on water resources due to increased population, rapid urbanization and development • According to DEA over‐exploitation, pollution and aquatic weeds are the main threats to water resources • Pollution sources include: industrial and domestic effluent from settlements, human waste from pit latrines, and waste disposal on dam catchment areas and low aquifers
• 77% access to improved sanitation nationally, 95% access in urban areas and 51% in rural areas. Fisheries
• Occurs mainly in the Okavango Delta where it is mainly the carried out by the poor • 11 million cubic metres of water flow into the Okavango Delta annually • Fishing methods are not environmentally friendly but poor cat afford appropriate equipment • Fish catch varies between 110 – 117 tonnes (DWNP, 2009) • Two major species: Tilapia and Catfish • Generally the fish are under no threat from fishing although locally there may be some overutilization. When flooding occurs areas that were not accessible to fishermen replenish the Delta.
Tourism • Direct contribution of tourism consumption to GDP is around 3.4% • Direct + indirect contribution is around 4.2% and 6% • Can contribute substantially to economic diversification (high potential) • Communities benefit from CBNRM • Environmental Fund established
Environmental Health
• Access to improved water source 97% of the population (urban: 51% rural: 9%) • Sanitation: 77% of the population had access to improved sanitation in 2004 (Botswana MGDR, 2004) • Data on disease linked to environmental health: 532 diarrheal deaths in 2008 linked to flooding • Comparisons on toilet types: majority of people in the rural areas still use pit latrines • Household waste disposal: a problem in areas that are not serviced • Landfill main way of managing solid waste • Very little or no recycling e.g. in Botswana

89