insights from imaging the implanting embryo and the
TRANSCRIPT

© 2016. Published by The Company of Biologists Ltd.
Insights from imaging the implanting embryo and the uterine
environment in three-dimensions
Ripla Arora1,2
, Adam Fries3, Karina Oelerich
1, Kyle Marchuk
3, Khalida Sabeur
1, Linda
C Giudice2, Diana J Laird
1,2, #
1Eli and Edythe Broad Center of Regeneration Medicine and Stem Cell Research, University of
California San Francisco, San Francisco, California 2Department of Obstetrics, Gynecology and Reproductive Sciences and the Center for Reproductive
Sciences, University of California, San Francisco, San Francisco, California 3Biological Imaging Development Center, University of California, San Francisco, California
#Correspondence to [email protected]
Keywords:
Implantation, Receptivity, Uterus, Blastocyst, Embryo, Confocal Imaging, Surface curvature,
Wnt5a
Summary Statement: 3D imaging of the uterine lumen and glands reveals dynamic changes
in their architecture in preparation for embryo implantation.
Dev
elo
pmen
t • A
dvan
ce a
rtic
le
http://dev.biologists.org/lookup/doi/10.1242/dev.144386Access the most recent version at Development Advance Online Articles. First posted online on 11 November 2016 as 10.1242/dev.144386
Abstract
Although much is known about the embryo during implantation, the architecture of the
uterine environment in which the early embryo develops is not well understood. We
employed confocal imaging in combination with 3D analysis to identify and quantify
dynamic changes to the luminal structure of murine uterus in preparation for implantation.
When applied to mouse mutants with known implantation defects, this method detected
striking peri-implantation abnormalities in uterine morphology that cannot be visualized by
histology. We revealed 3D organization of uterine glands and found that they undergo a
stereotypical reorientation concurrent with implantation. Furthermore, we extended this
technique to generate a 3D rendering of the cycling human endometrium. Analyzing the
uterine and embryo structure in 3D for different genetic mutants and pathological conditions
will help uncover novel molecular pathways and global structural changes contributing to
successful implantation of an embryo.
Dev
elo
pmen
t • A
dvan
ce a
rtic
le
INTRODUCTION
The uterus is the prerequisite for propagating mammalian species, as implantation in this tissue
establishes pregnancy and protects the developing embryo throughout gestation. The window of
uterine receptivity for embryo implantation is precisely timed (Ma et al., 2003). Rising levels of
luteinizing hormone in concert with Estradiol (E2) lead to ovulation and fertilization, termed
gestational day (GD) 0 of murine pregnancy (reviewed in Cha et al., 2012; Wang and Dey,
2006). Formation of the corpus lutea at the site of ovulation releases progesterone (P4), which
peaks at GD3 of pregnancy. Receptivity is achieved between GD3 and GD4 by the concurrence
of high levels of P4 with a transient increase in E2 (Wang and Dey, 2006). Similarly, following
human ovulation and corpus luteum formation, an increase in P4 during the secretory phase
prepares the uterus for embryo implantation (Cha et al., 2012). In the mouse, blastocysts home
and attach in the anti-mesometrial region of slit-like structures termed uterine crypts (Daikoku et
al., 2011). The existence of crypts in the human uterus remains unknown. It stands to reason that
ovarian hormones that coordinate uterine receptivity must also regulate uterine crypt formation,
however the underlying mechanisms are not defined.
In preparation for implantation, uterine epithelial cells undergo morphological changes
termed plasma membrane transformation (PMT) (Murphy, 2004). In the presence of E2,
epithelial cells possess microvilli on their apical surfaces and short tight junctions on the lateral
plasma membrane, whereas they lose microvilli, acquire flattened morphology, and increase their
number of tight junctions upon concurrent exposure to E2 and P4. PMT is observed at the time
of implantation in eutherian mammals (Murphy, 2004), viviparous squamate reptiles (Hosie et
al., 2003) as well as in marsupials (Laird et al., 2014). These dramatic changes at the cellular
level are accompanied by changes in the organization of the uterine lumen as suggested by
Dev
elo
pmen
t • A
dvan
ce a
rtic
le

scanning electron microscopy studies (Winkelmann and Spornitz, 1997), however, the three-
dimensional uterine architectural changes remain unknown.
Establishment of pregnancy also depends upon specialized uterine glands, which provide
nourishment to the embryo before the placenta forms (Filant and Spencer, 2014). A key factor
secreted by the glands, Leukemia inhibitory factor (LIF), is required for uterine receptivity
(Daikoku et al., 2004; Stewart et al., 1992). The importance of uterine glands and their secretions
is demonstrated by the drastic impact of their depletion on fertility (Filant et al., 2012). Studies
involving uterine glands have been limited to histological analysis and currently there is no
information on the 3D branching morphogenesis or structural organization of these glands during
development, estrous or implantation.
In the past, localizing embryos and studying their interactions with the uterine lining
required generating numerous tissue sections. This process is labor-intensive and generates only
2-dimensional images. We now combine the capabilities of confocal imaging with quantitative
image analysis to enable visualization of the intact uterus in three-dimensions. We observe
dynamic changes in the architecture of the uterine lumen surrounding implantation. We highlight
the utility of this method by studying implantation defective Wnt5a mutants, as previously
characterized by molecular marker expression, defective crypt formation and embryonic lethality
(Cha et al., 2014). Our method reveals defects in the folding pattern of Wnt5a mutant uteri that
cannot be discerned by traditional histology. Furthermore we define the organization of the
uterine glands in three dimensions and large-scale changes that coincide with implantation. This
methodology will help to elucidate long-standing structural questions in the field such as
determinants of embryo spacing, closure of the uterine lumen, and the regulation as well as
function of the poorly-studied uterine glands.
Dev
elo
pmen
t • A
dvan
ce a
rtic
le

RESULTS AND DISCUSSION
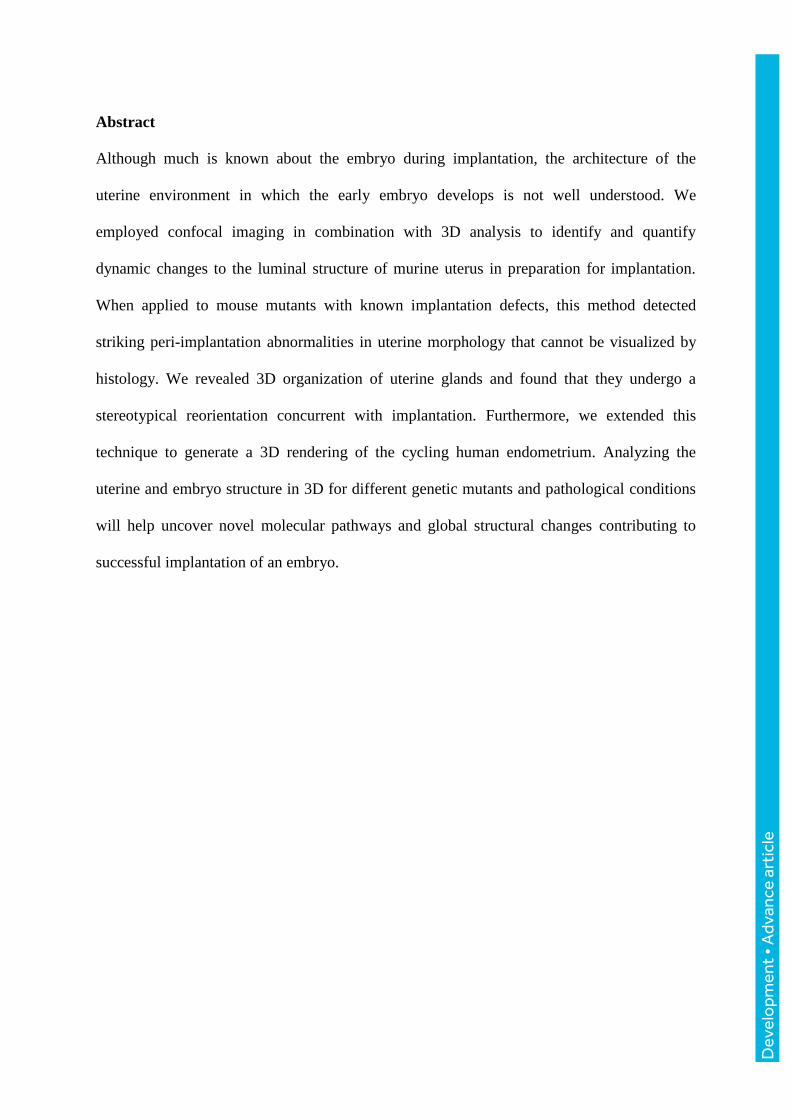
Confocal imaging of the mouse and human endometrium
We used whole mount immunofluorescence and confocal imaging (Faire et al., 2015) to
visualize and characterize changes in the mouse endometrium from fertilization through
implantation. Luminal and glandular epithelium in the uterus were identified using the epithelial
marker E-cadherin (E-CAD) (Reardon et al., 2012) whereas FOXA2 (Besnard et al., 2004) was
used to distinguish glandular epithelium throughout the length and depth of the uterine horn (Fig.
1A; Movie S1). Developing embryos at the blastocyst and epiblast stages were identified within
the uterine horns by E-CAD along with the nuclear stain Hoechst (Fig. 1B-E). We applied
similar methodology to image a full thickness biopsy of the proliferative phase human uterus
obtained by hysterectomy (Fig. 1F; Movie S2). As expected, 3D renderings of the E-CAD+
endometrial lumen and glands revealed increased glandular complexity of the human uterus
compared to mouse (Fig. 1G; Movie S3).
Uterine crypts are folds in the uterine epithelium
To visualize the structure of the mouse uterine lumen, we computationally subtracted the
FOXA2+ glandular signal from E-CAD+ total epithelium (Fig. 2A, B; Movie S4, S5). After
separating lumen and glands, generation of 3D surfaces through the length of the uterine horn
permitted analysis of luminal structure and glandular organization (Movie S6, S7). At GD 4.25,
2D optical sections revealed overlap of 3D surface luminal folds with potential uterine crypts or
chambers (Fig. 2C, D), which home the incoming embryo (Daikoku et al., 2011).
Dev
elo
pmen
t • A
dvan
ce a
rtic
le

Uterine architecture changes dynamically from fertilization to implantation
We observed that the murine uterine lumen undergoes dynamic changes in topology on the day
preceding implantation (Fig. 3A-D). 3D imaging revealed an increase in the number of folds at
gestational day (GD) 3.5-3.75, specifically along the mesometrial-anti mesometrial (M-AM)
axis, which lies perpendicular to both the oviductal-cervical axis and the dorsal-ventral axis of
the uterine horn (Fig. 3C). Luminal closure ensues at GD4.25 to lock the embryo into position
(Chen et al., 2013; Yoshinaga, 2013). Concomitant with closure, we observed that the lumen
flanking the embryo, the peri-implantation region, becomes entirely devoid of folds in the M-
AM axis; folds also grow more shallow along the oviductal-cervical axis, while folding along the
M-AM axis is retained in the inter-implantation region (Fig. 3D, D’; Movie S6). This is
consistent with uterine folding changes first described by scanning electron microscopy of
epithelial cells (Winkelmann and Spornitz, 1997). We developed an algorithm to quantify
topological changes in the E-CAD+ FOXA2- luminal epithelium by measuring curvature. The
Surface Curvature algorithm splits the 3D surface into vertices and estimates the radius of the
curve formed by connecting neighbor vertices. Radii calculated with multiple neighbor vertices
are averaged to obtain curvature mean (Cmean). Topology of uterine luminal segments is
expressed as the folding factor (f), which is the ratio of the Cmean for the most highly curved
luminal epithelium (0.125<Cmean>0.3), to the least curved luminal epithelium regions
(0<Cmean>0.05); (Fig. S1A-C). An increase in the depth of folds was observed from GD2.5
(Fig. 3B, f= 0.55) to GD3.5-GD3.75 (Fig. 3C, f=0.75). At GD 4.25, when embryo attachment has
occurred, folds in the uterine lumen resolved specifically at implantation sites but were retained
in intervening inter-implantation regions (Fig. 3D”, f=0.66; Movie S6). These quantitative
Dev
elo
pmen
t • A
dvan
ce a
rtic
le

descriptions of endometrial topology will advance understanding of mutants in uterine epithelial
organization as well as luminal closure.
Wnt5a deficient uteri have altered fold morphology
Conditional deletion of Wnt5a (Wnt5acKO
) in the uterine luminal epithelium and mesenchyme
using the postnatally expressed Pgrcre
, leads to defective crypt formation, aberrant gene
expression at implantation sites and mid-gestation lethality (Cha et al., 2014). When the Surface
Curvature algorithm was applied to the Wnt5acKO
uteri at GD3.75, we observed multiple folding
defects (Fig. 3E,F). Lumens appeared flatter and orientation of folds was altered, as ridges
increasingly ran along the oviductal-cervical axis instead of the M-AM axis. Owing to resolution
of folds at the implantation site at GD4.25 in wild-type (Fig. 3D), we asked whether aberrant
folding was retained in inter-implantation regions in the Wnt5acKO
uteri. At GD4.25, folds were
still misoriented along the oviductal-cervical axis in the inter-implantation regions (Fig. 3G,H) of
the Wnt5acKO
uteri. Orientation of folding along the incorrect axis is reminiscent of planar cell
polarity phenotypes such as incorrect orientation of cochlear cilia in Wnt5a-deficient mutants
(Qian et al., 2007). Defects in folding pattern as observed are very difficult to visualize using 2D
histology, thus demonstrating the application of the 3D imaging technique.
Uterine glands reorient towards site of implantation
While visualizing the uterine glands by FOXA2 immunofluorescence, we observed that the
glandular ducts bend, elongate and coil with increasing gestational age (Fig. 4). Generating
separate surfaces of each glandular tree revealed large-scale changes in their morphology during
Dev
elo
pmen
t • A
dvan
ce a
rtic
le

early pregnancy, which culminates in bending of the flanking glands towards the site of
implantation (Fig. 4A-D, Fig. S2A; Movies S6, S7). We measured the angle between the ducts of
the glands and luminal epithelial plane perpendicular to the M-AM axis (Fig. S2B). This
revealed a drastic decrease in the ductal angle at the time of implantation (GD 4.5, ~28o) as
compared to the ~54° inclination at GD2.5 or in a non-pregnant mouse (Fig. 4E). We also
observed a qualitative increase in coiling and ductal length when comparing non-pregnant and
GD4.25 glandular trees (Fig. 4F,G; Figs S3, S4). Spatially, the elongation of glandular ducts and
bending of the uterine glands positions the glandular epithelium in close proximity with stroma
surrounding the implantation site. This reorganization can help explain mechanisms behind
emerging evidence implicating uterine glands in decidualization and placentation post
implantation (Filant and Spencer, 2014).
This new methodology allows observations in an intact organ, quantification of structure
and morphological changes, and still permits optical sectioning in any desired plane comparable
with traditional histological views. Our analysis integrates surface curvature measurements with
confocal 3D imaging. The algorithm developed for Surface Curvature can easily be modified to
account for object size and complexity for broader application in other organ systems.
We expect that this technique will reveal novel aspects of uterine architecture during
development, estrus and pregnancy. The understudied uterine glands that are key to the
development of the embryo until the formation of the placenta are now accessible for studies of
branching morphogenesis. This technique will allow for detailed investigation of the roles of
different signaling pathways in development of the uterine lining and implantation. Elucidating
contributions of different signaling pathways to the spatial uterine environment will aid in: a)
better understanding of pregnancy failures due to implantation defects, b) improving
Dev
elo
pmen
t • A
dvan
ce a
rtic
le
implantation rates when using assisted reproductive technologies like in vitro fertilization, c)
opening doors for novel contraceptive targets and d) better understanding diseases such as
uterine hyperplasia and endometrial cancer.
MATERIALS AND METHODS
Mice
CD1 mice were purchased from Charles River. Wnt5acKO
(PgrCre;Wnt5aflox/flox
, mixed 129SvX
C57BL/6 background) pregnant uteri were obtained from S.K. Dey (Cha et al., 2014). Uteri were
dissected from timed matings. The dark period was 19.00 to 05.00 hr and day of mating plug was
identified as gestational day (GD) 0.5. All mouse work was carried out under University of
California San Francisco Institutional Animal Care and Use Committee guidelines, in an
AAALAC approved facility.
Whole mount immunofluorescence
Uteri were fixed in DMSO: Methanol (1:4), blocked (PBS+1%Triton+2%powdered milk) for 2
hours at room temperature. Primary antibodies for mouse E-CAD (M108, Clontech), human E-
cad (ab1416, Abcam) and FOXA2 (NBP1-95426, Novus Biologicals) were diluted (1:200) in
block and uteri were incubated for 5 nights at 4°C. Uteri were washed (PBS+1%Triton) 6 times,
30 minutes each and incubated with secondary antibodies (fluorescently conjugated Alexa Fluor
IgGs (Invitrogen)) for 2 nights at 4°C. Uteri were washed (PBS+1%Triton) 6 times, 30 minutes
each, dehydrated in methanol and incubated overnight in 3% H2O2 diluted in Methanol. Uteri
were washed in 100% Methanol twice for 15 minutes and cleared overnight using BABB
(Benzyl alcohol: Benzyl Benzoate, 1:2). Uteri were imaged on Leica SP5 TCS confocal
microscope with white light laser, using a 10X air objective with Z stacks that were 7µ apart.
Dev
elo
pmen
t • A
dvan
ce a
rtic
le

Full uterine horns were imaged using 18X2 tile scans and tiles merged using the mosaic merge
function of the Leica software.
Image analysis
LIF files (Leica software) were analyzed using Imaris v8.1 (Bitplane). Using the channel
arithmetic function the glandular FOXA2+ signal was removed from the E-CAD+ signal to
create lumen only signal. Surfaces were created in surpass 3D mode for the luminal signal and
the FOXA2+ glandular signal. Images and videos were captured using the snapshot function and
the animation function respectively.
Determination of folding using Surface Curvature
Folding measurements were generated by modifying an existing Matlab script made available by
Imaris Open (Bitplane), originally intended to calculate localized, small area, curvature. The
script was modified to calculate the curvature in larger objects, such as the uterus (Matlab Script
for Surface Curvature). The analysis is done using the vertices generated in the Surface mode in
Imaris. Surface complexity is reduced by evenly reducing the number of vertices to a tenth of the
original number. Using the normals in each axis at each vertex the radius of the curve formed by
connecting neighbor vertices is calculated. Radii calculated with 6 neighbor vertices are
averaged to obtain curvature mean, and multiplied by 10 to get Cmean. Cmean is displayed as a
heat map where value of 0-0.05 is blue/purple and curvature values above 0.200 are displayed by
red coloration. Morphology of uterine luminal segments is expressed as the folding factor (f),
which is the ratio of the Cmean for the highly curved luminal epithelium (0.125<Cmean>0.3), to
the least curved luminal epithelium regions (0<Cmean>0.05), (Fig. S1A-C).
Folding factor f = # of vertices (Cmean 0.125-0.3)
# of vertices (Cmean 0.0-0.05)
Dev
elo
pmen
t • A
dvan
ce a
rtic
le

Cmean values above 0.3 were attributed to remnants of glandular ducts after subtraction and
accordingly excluded from lumen curvature analysis.
Determination of bending angle for glandular ducts
The angle of glandular duct bending towards the implantation site was measured using the Imaris
function measurement points. Three planes along the XY/YZ and ZX axes can be displayed
using the orthogonal slicer. The three planes separate along the dorsal/ventral, anterior/posterior,
and mesometrial/antimesometrial axis respectively. Using both the confocal Z slices of the uterus
and glandular surfaces, the three planes can be positioned to define four standardized
measurement points. The first point is placed at the duct of the gland (where it branches from the
luminal epithelium) and the intersection of the anterior/posterior axis and the dorsal/ventral axis.
The second measurement point is placed at the farthest branched tip of the gland along the
intersection of the dorsal/ventral axis and the mesometrial/antimesometrial axis. The third
measurement point is placed at the intersection of the mesometrial/antimesometrial plane, the
anterior/posterior (luminal) plane and the dorsal/ventral axis. The fourth measurement point is
placed at the starting position which creates a right angled triangle that dictates the degree to
which the glandular duct is bending, with the luminal epithelium always being the standard
comparison point.
For additional methods see Supplementary methods.
Dev
elo
pmen
t • A
dvan
ce a
rtic
le

Acknowledgements
We thank S.K. Dey and Jeeyeon Cha for the Wnt5acKO
uteri, David Rowitch and Matthew
Krummel for oversight and support of K.S., A.F. and K.M., and Zev Gartner for feedback on the
manuscript.
Competing interests
The authors declare no competing interests.
Author Contributions
RA and DJL conceived the project; RA, KS and KO performed the experiments; RA, AF and
KM performed the image analysis; RA, LCG and DJL analyzed the data and wrote the
manuscript.
Funding
We acknowledge support from CIRM TG2-01153, the UCSF Program for Breakthrough
Biomedical Research (PBBR) and NIH 5T32HD007263-32 to R.A., P50HD055764 to L.C.G.,
and the UCSF PBBR, and NIH grants DP2OD007420 and 1R21ES023297 to D.J.L.
Dev
elo
pmen
t • A
dvan
ce a
rtic
le

REFERENCES
Besnard, V., Wert, S. E., Hull, W. M. and Whitsett, J. A. (2004). Immunohistochemical
localization of Foxa1 and Foxa2 in mouse embryos and adult tissues. Gene Expr
Patterns 2, 193-208
Cha, J., Bartos, A., Park, C., Sun, X., Li, Y., Cha, S. W., Ajima, R., Ho, H. Y., Yamaguchi,
T. P. and Dey, S. K. (2014). Appropriate crypt formation in the uterus for embryo
homing and implantation requires Wnt5a-ROR signaling. Cell Rep 8, 382-392.
Cha, J., Sun, X. and Dey, S. K. (2012). Mechanisms of implantation: strategies for successful
pregnancy. Nat Med 18, 1754-1767.
Chen, Q., Zhang, Y., Elad, D., Jaffa, A. J., Cao, Y., Ye, X. and Duan, E. (2013). Navigating
the site for embryo implantation: biomechanical and molecular regulation of intrauterine
embryo distribution. Mol Aspects Med 34, 1024-1042.
Daikoku, T., Cha, J., Sun, X., Tranguch, S., Xie, H., Fujita, T., Hirota, Y., Lydon, J.,
DeMayo, F., Maxson, R., et al. (2011). Conditional deletion of Msx homeobox genes in
the uterus inhibits blastocyst implantation by altering uterine receptivity. Dev Cell 21,
1014-1025.
Daikoku, T., Song, H., Guo, Y., Riesewijk, A., Mosselman, S., Das, S. K. and Dey, S. K.
(2004). Uterine Msx-1 and Wnt4 signaling becomes aberrant in mice with the loss of
leukemia inhibitory factor or Hoxa-10: evidence for a novel cytokine-homeobox-Wnt
signaling in implantation. Mol Endocrinol 18, 1238-1250.
Faire, M., Skillern, A., Arora, R., Nguyen, D. H., Wang, J., Chamberlain, C., German, M.
S., Fung, J. C. and Laird, D. J. (2015). Follicle dynamics and global organization in the
intact mouse ovary. Dev Biol 403, 69-79.
Filant, J. and Spencer, T. E. (2014). Uterine glands: biological roles in conceptus implantation,
uterine receptivity and decidualization. Int J Dev Biol 58, 107-116.
Filant, J., Zhou, H. and Spencer, T. E. (2012). Progesterone inhibits uterine gland
development in the neonatal mouse uterus. Biol Reprod 86, 146, 141-149.
Hosie, M. J., Adams, S. M., Thompson, M. B. and Murphy, C. R. (2003). Viviparous lizard,
Eulamprus tympanum, shows changes in the uterine surface epithelium during early
pregnancy that are similar to the plasma membrane transformation of mammals. J
Morphol 258, 346-357.
Laird, M. K., Thompson, M. B., Murphy, C. R. and McAllan, B. M. (2014). Uterine
epithelial cell changes during pregnancy in a marsupial (Sminthopsis crassicaudata;
Dasyuridae). J Morphol 275, 1081-1092.
Ma, W. G., Song, H., Das, S. K., Paria, B. C. and Dey, S. K. (2003). Estrogen is a critical
determinant that specifies the duration of the window of uterine receptivity for
implantation. Proc Natl Acad Sci U S A 100, 2963-2968.
Murphy, C. R. (2004). Uterine receptivity and the plasma membrane transformation. Cell Res
14, 259-267.
Qian, D., Jones, C., Rzadzinska, A., Mark, S., Zhang, X., Steel, K. P., Dai, X. and Chen, P.
(2007). Wnt5a functions in planar cell polarity regulation in mice. Dev Biol 306, 121-
133.
Reardon, S. N., King, M. L., MacLean II, J. A., Mann, J. L., DeMayo, F. J., Lydon, J. P.
and Hayashi, K. (2012). Cdh1 Is essential for endometrial differentiation, gland
development, and adult function in the mouse uterus. Biol Reprod 86, 141, 1-10
Dev
elo
pmen
t • A
dvan
ce a
rtic
le

Stewart, C. L., Kaspar, P., Brunet, L. J., Bhatt, H., Gadi, I., Kontgen, F. and Abbondanzo,
S. J. (1992). Blastocyst implantation depends on maternal expression of leukaemia
inhibitory factor. Nature 359, 76-79.
Wang, H. and Dey, S. K. (2006). Roadmap to embryo implantation: clues from mouse models.
Nat Rev Genet 7, 185-199.
Winkelmann, A. and Spornitz, U. M. (1997). Alkaline phosphatase distribution in rat
endometrial epithelium during early pregnancy: a scanning electron-microscopic study.
Acta Anat (Basel) 158, 237-246.
Yoshinaga, K. (2013). A sequence of events in the uterus prior to implantation in the mouse. J
Assist Reprod Genet 30, 1017-1022.
Dev
elo
pmen
t • A
dvan
ce a
rtic
le
Figures
Figure 1: Confocal imaging of pregnant mouse uterus and cycling human endometrium.
(A) Optical Z slice showing 2/3 of both horns of a day 4.25 mouse uterus attached at the cervix
(yellow arrow) stained with nuclear marker Hoechst (grey), epithelial marker E-CAD (red) and
glandular marker (FOXA2). Identification of blastocysts (white arrows) in optical slices of intact
uteri at the following days of pregnancy: GD3.25 (B), GD3.75 (C), GD4.25 (D) and epiblast at
GD5.75 (E). (F) Three Z slices through a full-thickness segment of human endometrium stained
Dev
elo
pmen
t • A
dvan
ce a
rtic
le

with E-CAD (red) and FOXA2 (green) and corresponding surface rendering of the same
specimen based on E-CAD staining (G). Scale bars in A, F, G = 500 μm; B-E = 50μm. Lat:
lateral; Med: medial; A: anterior; P: posterior; SM: smooth muscle.
Dev
elo
pmen
t • A
dvan
ce a
rtic
le

Dev
elo
pmen
t • A
dvan
ce a
rtic
le

Figure 2: Uterine crypts are generated by folding of the luminal epithelium (A) Optical
slices through a segment of the uterus at GD4.25 immunolabeled with FOXA2 signal (green) and
ECAD signal (red) and (B) the resulting subtraction of FOXA2 from ECAD signal to obtain the
uterine lumen (yellow). (C) Optical slice showing uterine crypts (arrowheads) revealed by
luminal epithelial staining at GD4.25. (D) Luminal folds in the 3D surface model of the uterus
coincide with crypts in the optical slice. Scale bars in A, B = 500 μm and C, D = 200 μm. M:
mesometrial; AM: anti-mesometrial.
Dev
elo
pmen
t • A
dvan
ce a
rtic
le

Dev
elo
pmen
t • A
dvan
ce a
rtic
le

Figure 3: Dynamic folding of the mouse uterine lumen along the mesometrial-anti
mesometrial axis and aberrant folding in Wnt5acKO
uteri: (A-D) Uterine luminal surfaces on
left and folding heat maps on right. (A) Luminal structure of non-pregnant mouse uterus.
Luminal folds appear at GD2.5 (B) and become predominant at GD3.75 (C). (D) Surface model
of a GD4.25 luminal segment containing an embryo. (D’) Increased translucence reveals the site
where the embryo is present (orange arrow, embryo surface). (D”) Curvature analysis in the
same uterine horn measured by Cmean shows flatness in the peri-implantation region (Cmean
values primarily <0.05, blue/purple) whereas higher values indicated by green yellow and red are
found distant from the implantation site in the inter-implantation region. While wild-type uteri
show folding along the M-AM axis (E,G), Wnt5acKO
uterine lumens fold along the oviductal-
cervical axis throughout the lumen at GD 3.75 (F) and at inter-implantation sites at GD4.25 (H).
Scale bars in A-C = 500 μm, D = 300 μm, E-H = 200 μm. M: mesometrial; AM: anti-
mesometrial; IS: implantation site.
Dev
elo
pmen
t • A
dvan
ce a
rtic
le

Dev
elo
pmen
t • A
dvan
ce a
rtic
le

Figure 4: Glandular ducts reorient toward the site of implantation: (A-D) 3D image and
surface renderings of luminal segments and uterine glands, with separate glandular structures
randomly pseudocolored for easy visualization. View from ventral side (A,A’) and mesometrial
side (B,B’) for non-pregnant uterine segment. View from ventral side (C,C’) and mesometrial
side (D,D’) for GD4.5 uterine segment. Dotted box in (B,D) represent magnified regions (B’,D’)
respectively. (E) The glandular ducts in non-pregnant uteri (B,B’) make an angle of ~54o
towards the uterine oviductal-cervical axis. With the introduction of the embryo (Orange arrow)
at the anti-mesometrial pole at GD4.5 (D,D’), the glandular ducts bend drastically and make an
angle of ~28o with the oviductal-cervical axis towards the site of implantation. Total 70-80 ducts
were measured from 2 different mice and around three embryos for GD4.5 . ttest was used for
statistical analysis and significance was defined as p<0.001. **** signifies P value <10-12
. ns:
not significant. (F,G) Representative examples of glandular branching in non-pregnant uteri (F)
and glandular branching, coiling and duct elongation in GD4.5 uteri (G). Scale bars in A-D =
500 μm. M: mesometrial; AM: anti-mesometrial; Ov: ovary; Cx: cervix; IS: implantation site.
Dev
elo
pmen
t • A
dvan
ce a
rtic
le
Supplementary Figure 1
B
A
C
Cmean: 0-0.05, 0.05-0.125, 0.125-0.3, >0.3
Lumen
Glands
Cmean 0.0 0.2
Cmean 0.000 0.200 Cmean 0.300 0.675
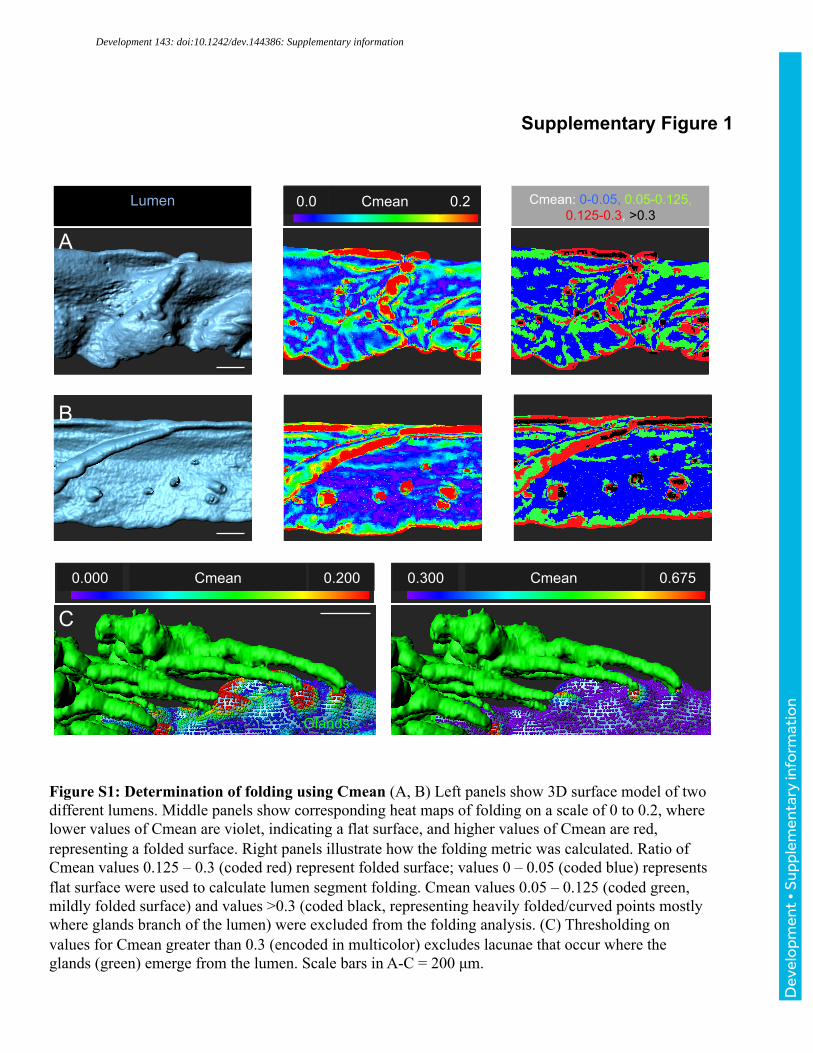
Figure S1: Determination of folding using Cmean (A, B) Left panels show 3D surface model of two different lumens. Middle panels show corresponding heat maps of folding on a scale of 0 to 0.2, where lower values of Cmean are violet, indicating a flat surface, and higher values of Cmean are red, representing a folded surface. Right panels illustrate how the folding metric was calculated. Ratio of Cmean values 0.125 – 0.3 (coded red) represent folded surface; values 0 – 0.05 (coded blue) represents flat surface were used to calculate lumen segment folding. Cmean values 0.05 – 0.125 (coded green, mildly folded surface) and values >0.3 (coded black, representing heavily folded/curved points mostly where glands branch of the lumen) were excluded from the folding analysis. (C) Thresholding on values for Cmean greater than 0.3 (encoded in multicolor) excludes lacunae that occur where the glands (green) emerge from the lumen. Scale bars in A-C = 200 µm.
Development 143: doi:10.1242/dev.144386: Supplementary information
Dev
elo
pmen
t • S
uppl
emen
tary
info
rmat
ion

M
AM Lateral
Medial
Cervix Ovary M
AM
Supplementary Figure 2
Angle of duct
Figure S2: 3D image (A) and surface renderings of luminal segments and uterine glands at GD2.5, with separate glandular structures randomly pseudocolored for easy visualization in A’. View from the mesometrial pole (A”). (B) Scheme defining how duct angles were measured at GD4.25 against the Oviductal-Cervical axis. Scale bar in A = 500μm, B = 200 μm. M: mesometrial; AM: anti-mesometrial.
A
GD2.5
A’
A’’
M
AM Cervix Ovary
AM
M
Cervix Ovary
B
GD 4.25
Development 143: doi:10.1242/dev.144386: Supplementary information
Dev
elo
pmen
t • S
uppl
emen
tary
info
rmat
ion

Supplementary Figure 3
Figure S3: Imaris vantage plot showing branching patterns of randomly colored 36 uterine glands from a non-pregnant uterus.
Development 143: doi:10.1242/dev.144386: Supplementary information
Dev
elo
pmen
t • S
uppl
emen
tary
info
rmat
ion

Supplementary Figure 4
Figure S4: Imaris vantage plot showing branching patterns of randomly colored 36 uterine glands from a GD4.5 uterus.
Development 143: doi:10.1242/dev.144386: Supplementary information
Dev
elo
pmen
t • S
uppl
emen
tary
info
rmat
ion

Supplementary Movie 1 (Movie S1): Confocal Z stacks of pregnant GD4.25 mouse uteri stained with Hoechst (grey), ECAD (red) and FOXA2 (green).
Supplementary Movie 2 (Movie S2): Confocal Z stacks of proliferative phase full thickness human endometrial biopsy stained with ECAD (red) and FOXA2 (green).
Supplementary Movies:
Development 143: doi:10.1242/dev.144386: Supplementary information
Dev
elo
pmen
t • S
uppl
emen
tary
info
rmat
ion

Supplementary Movie 3 (Movie S3): 3D extended focus and surface rendering of full thickness human endometrium in Movie S2.
Development 143: doi:10.1242/dev.144386: Supplementary information
Dev
elo
pmen
t • S
uppl
emen
tary
info
rmat
ion
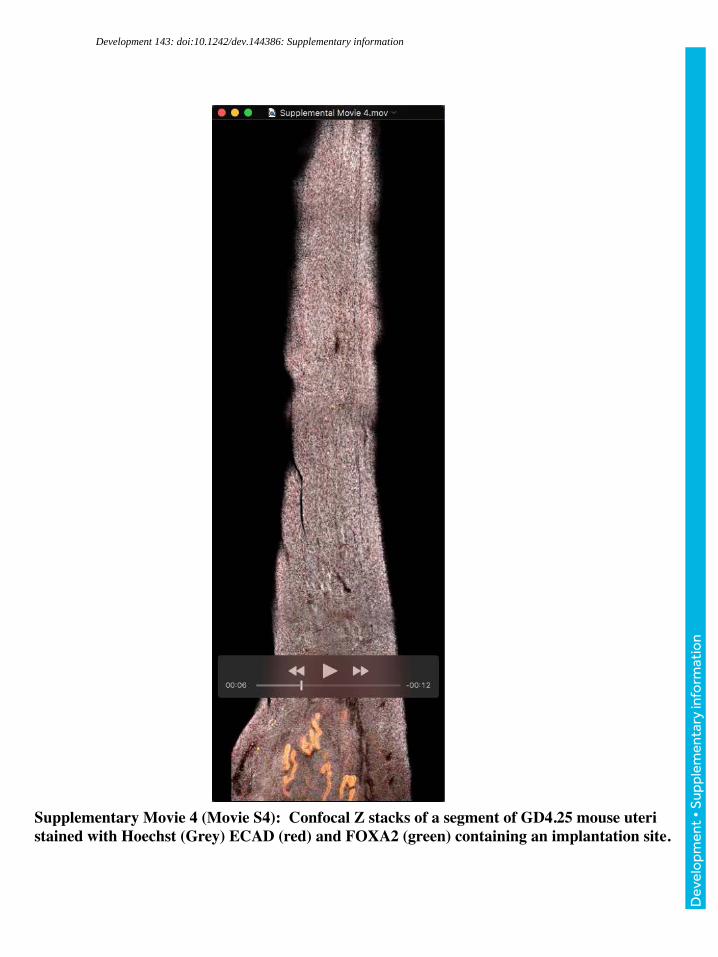
Supplementary Movie 4 (Movie S4): Confocal Z stacks of a segment of GD4.25 mouse uteri stained with Hoechst (Grey) ECAD (red) and FOXA2 (green) containing an implantation site.
Development 143: doi:10.1242/dev.144386: Supplementary information
Dev
elo
pmen
t • S
uppl
emen
tary
info
rmat
ion

Supplementary Movie 5 (Movie S5): Subtraction of FOXA2 intensity from ECAD intensity from uterine segment in Movie S4 to generate a new channel with only luminal ECAD intensity (yellow).
Development 143: doi:10.1242/dev.144386: Supplementary information
Dev
elo
pmen
t • S
uppl
emen
tary
info
rmat
ion

Supplementary Movie 6 (Movie S6): 3D extended focus, surface rendering of lumen and glands and curvature of lumen from uterine segment in Movie S5.
Supplementary Movie 7 (Movie S7): 3D extended focus, surface rendering of lumen and glands and curvature of lumen from uterine segment of a non-pregnant mouse.
Development 143: doi:10.1242/dev.144386: Supplementary information
Dev
elo
pmen
t • S
uppl
emen
tary
info
rmat
ion

Supplementary Methods:
Uteri collection
Uteri were collected from adult non-pregnant females or from pregnant females at
GD2.5, GD3.5 and GD4.5 between 1200 and 1500 hours, GD4.25 at 0900 hours and
GD3.75 between 1900 and 2100 hours on the day of dissection.
Human sample collection
Human adult uterine samples were obtained from the NIH UCSF Human Endometrial
Tissue and DNA Bank, which contains samples of women undergoing endometrial
biopsy or hysterectomy for nonmalignant indications. The samples were collected under
approved Institutional Review Board protocols and informed consent to participate in the
study was obtained from the patients.
Step by Step protocol for whole mount immunofluorescence
Dissection of the uterine horns
1) Pregnant females from timed matings are euthanized and dissected carefully to
retain the original length of the uterine horns.
2) Contraction by muscle is avoided by holding the ovarian and cervical ends of the
horn with forceps and fixing immediately in DMSO: Methanol (1:4) in a
petridish. Once the tissue is fixed, excess fat and vasculature is dissected off the
uterine horns.
3) When the tissue is fixed and cleaned, the horns are transferred into 15 ml Falcon
tubes with ~ 5ml fixative (enough to cover the length of the horn) for storage at -
Development 143: doi:10.1242/dev.144386: Supplementary information
Dev
elo
pmen
t • S
uppl
emen
tary
info
rmat
ion

20oC. Fixed tissue is kept at -20oC for atleast one night before beginning whole
mount immunofluorescence but tissue can be stored long term (upto a year) in this
fixative at -20oC.
Whole mount immunostaining
1) Fixed uterine horns are transferred from the fixative (DMSO:Methanol, 1:4), to a
1:1, Methanol:PBT (PBS + 1% Triton) solution for 15 minutes at room
temperature while rocking on a nutator.
2) Tissue is then transferred to 100% PBT for 15 minutes at room temperature while
rocking on a nutator.
3) Tissue is then blocked in PBSMT (PBS+1%Triton+2%powdered milk) for 2
hours at room temperature while rocking on a nutator.
4) Primary antibodies are diluted in block PBSMT (cooled at 4oC) and the tissue is
incubated for 5 nights at 4oC while rocking on a nutator.
5) Uterine tissue is washed 6 times with PBSMT for 30 minutes each while rocking
on a nutator at room temperature.
6) Secondary antibodies are diluted in PBSMT and the tissue is incubated for 2
nights at 4oC while rocking on a nutator. After this step the tissue is always
covered in aluminium foil to prevent bleaching of fluorescence signal.
7) Uterine tissue is washed 6 times with PBSMT for 30 minutes each at room
temperature while rocking on a nutator.
Development 143: doi:10.1242/dev.144386: Supplementary information
Dev
elo
pmen
t • S
uppl
emen
tary
info
rmat
ion

8) Uterine tissue is transferred to 1:1, Methanol:PBT (PBS + 1% Triton) solution in
a petridish by holding the cervical and oviductal end of the horn to ensure the
length of the uterine horns is retained.
9) Uterine tissue is transferred to a 100% Methanol solution in a petridish by holding
the cervical and oviductal end of the horn to ensure the length of the uterine horns
is retained.
10) The uterine tissue is transferred to a tube with ~ 5ml Methanol for 30 minutes at
room temperature while rocking on a nutator.
11) The uterine tissue is transferred to a 3% H2O2 solution (by diluting 30% H2O2
diluted in Methanol) and incubated overnight at 4oC while rocking on a nutator.
12) Tissue is then transferred to 100% Methanol for 30 minutes at room temperature
while rocking on a nutator.
13) Tissue is transferred to petridish, methanol is completely removed and uterine
horns are transferred to amber glass tubes containing BABB (Benzyl alcohol:
Benzyl Benzoate, 1:2) overnight to allow clearing of tissue.
Confocal imaging
Tissue is imaged on Leica SP5 TCS confocal microscope with white light laser, using a
10X air objective. Cleared uterine horns are placed on coverslips and enough BABB is
added to cover the tissue by surface tension of the liquid. Z stacks are set to 7µ apart. Full
uterine horns are imaged using about 18X2 tile scans and tiles are merged using the
mosaic merge function of the Leica software.
Development 143: doi:10.1242/dev.144386: Supplementary information
Dev
elo
pmen
t • S
uppl
emen
tary
info
rmat
ion

Image analysis
Image analysis is performed using Imaris v8.1 (Bitplane). Confocal LIF files (from the
Leica software) are imported into the Surpass mode of Imaris. Due to computation
limitations, entire files cannot be processed at once. The files are cropped to a region of
interest using the 3D Crop function. Background is removed using Gaussian filter
smoothening function with a diameter of 1.5µ. Using the channel arithmetic function the
glandular FOXA2+ signal is removed from the E-CAD+ signal to create a channel with
lumen only signal. 3D reconstruction for the lumen and glands is performed using the
Surface module with the newly created luminal signal and the FOXA2+ glandular signal.
The lumen is assigned a color as a single unit. When 3D reconstructions are made in the
Imaris software, disconnected components can be pseudocolored as individual units.
Thus each glandular branched tree is pseudocolored individually. Images and videos are
captured using the snapshot function and the animation function respectively.
Description of Matlab Script and calculation of Cmean
The Matlab function calculates the principal curvature directions and values of the
triangulated mesh of the luminal surface. The function first rotates the data so the normal
of the current vertex becomes [-1 0 0], so we can describe the data by XY instead of
XYZ. Secondly it fits a least-squares quadratic patch to the local neighborhood of a
vertex "f(x,y) = ax^2 + by^2 + cxy + dx + ey + f". Then the eigenvectors and eigenvalues
of the hessian are used to calculate the mean curvature. For large objects such as the
uterus the value of mean curvature is multiplied by 10 to get Cmean and is represented as
a heat map of folding.
Development 143: doi:10.1242/dev.144386: Supplementary information
Dev
elo
pmen
t • S
uppl
emen
tary
info
rmat
ion

(http://www.mathworks.com/matlabcentral/fileexchange/32573-patch-curvature)
Calculation of Mean Curvature using eigenvalues:
Development 143: doi:10.1242/dev.144386: Supplementary information
Dev
elo
pmen
t • S
uppl
emen
tary
info
rmat
ion