inrix congestion report 2008
TRANSCRIPT
INRIX® National Traffic Scorecard2008 Annual Report
THE LEADING PROVIDER OF TRAFFIC INFORMATION
THE LEADING PROVIDER OF TRAFFIC INFORMATION
INRIX® National Traffic Scorecard2008 Annual Report
Copyright © 2009 INRIX, Inc. All rights reserved. INRIX® is a registered trademark of INRIX, Inc.
February 2009
National Traffic Scorecard 2008 Annual Report
National Traffic Scorecard 2008 Annual Report
ES-1
Executive Summary
In June 2008, INRIX published the groundbreaking INRIX National Traffic Scorecard (available at http://scorecard.
inrix.com). Using data from 2007, the initial Scorecard provided a comprehensive and consistent overview
of where and when congestion exists on the major roads in America’s top 100 metropolitan areas. This 2008
Scorecard, available less than 60 days after the end of 2008, summarizes the state of congestion in 2008 across
the America and how it changed versus 2007.
Like most other aspects of society, 2008 was no ordinary year in terms of traffic or congestion, for several high
profile reasons:
Fuel prices.• 2008 brought unprecedented fuel price volatility, with a massive and consistent increase
through the first half of 2008 followed by an even greater plunge in prices during the second half of 2008.
Overall, average fuel costs in 2008 were up nearly 20% from 2007.
Unemployment.• Peak hour traffic is largely associated with commuter traffic, people traveling to and from
jobs. 2008 saw a steady increase in the nation’s unemployment rate, with every month being higher than the
comparable month in 2007.
Traffic Volume.• The combination of higher fuel prices and a struggling economy yielded a consistent
decline in overall traffic volume. Official figures from the Federal Highway Administration (FHWA) show that
the first eleven months of 2008 were substantially below 2007 levels, with percentage reductions never
before recorded. Overall, FHWA reported a 3% reduction in vehicle miles traveled on the types of roads
analyzed in this Scorecard.
Leveraging tens of billions of data points from 2006, 2007 and 2008 collected and archived by the INRIX Smart
Dust Network, this Scorecard publishes the most up-to-date information regarding overall congestion and
specific bottlenecks on the major roadways of urban America. By analyzing over 30,000 road segments on more
than 47,000 miles of the major highways in the nation’s 100 largest metropolitan areas, this report informs the
ongoing debate of one of the nation’s most frustrating and intractable issues: urban traffic congestion. How bad
is congestion? Where is it worst? How has it changed? What can be done about it? This Scorecard provides the
most comprehensive and timely national scale glimpse of the answers to these questions.
National Congestion Results and Trends
Overall, the nation’s peak period time Travel Time Index (TTI) for 2008 was 1.09. This means that during peak
driving times a random traveler on a random trip on the roads analyzed took 9% extra time, on average, than
National Traffic Scorecard 2008 Annual Report
ES-2
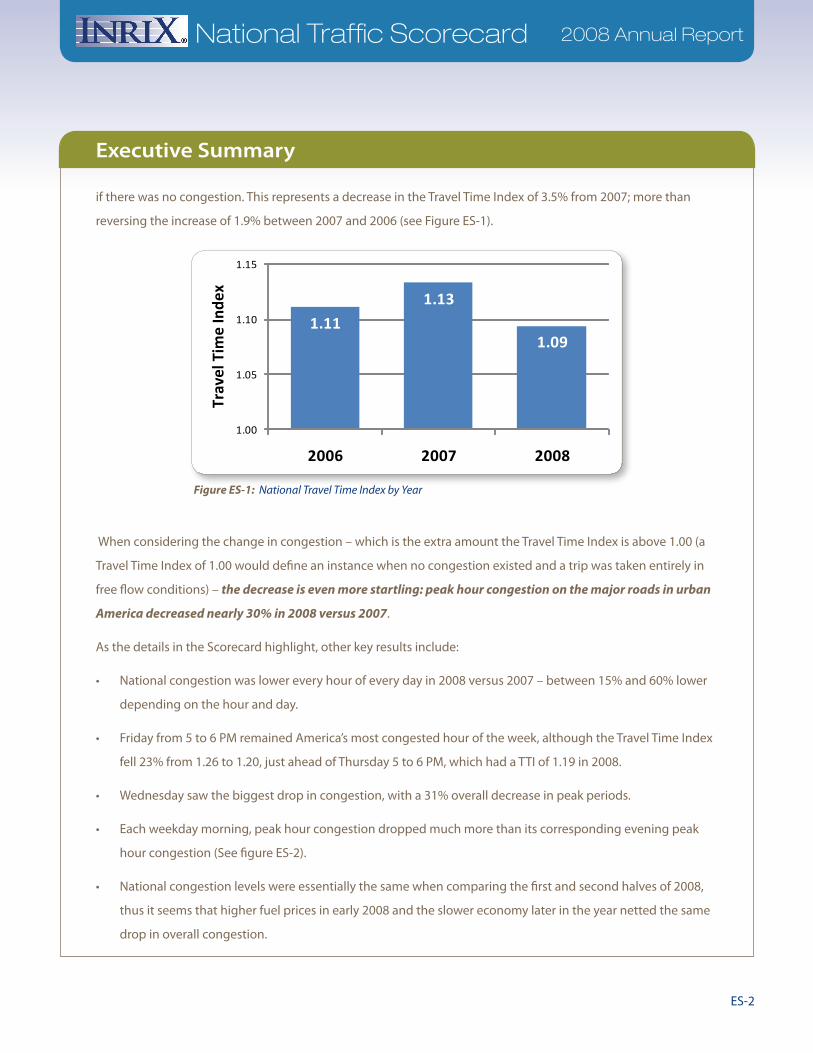
if there was no congestion. This represents a decrease in the Travel Time Index of 3.5% from 2007; more than
reversing the increase of 1.9% between 2007 and 2006 (see Figure ES-1).
When considering the change in congestion – which is the extra amount the Travel Time Index is above 1.00 (a
Travel Time Index of 1.00 would define an instance when no congestion existed and a trip was taken entirely in
free flow conditions) – the decrease is even more startling: peak hour congestion on the major roads in urban
America decreased nearly 30% in 2008 versus 2007.
As the details in the Scorecard highlight, other key results include:
National congestion was lower every hour of every day in 2008 versus 2007 – between 15% and 60% lower •
depending on the hour and day.
Friday from 5 to 6 PM remained America’s most congested hour of the week, although the Travel Time Index •
fell 23% from 1.26 to 1.20, just ahead of Thursday 5 to 6 PM, which had a TTI of 1.19 in 2008.
Wednesday saw the biggest drop in congestion, with a 31% overall decrease in peak periods.•
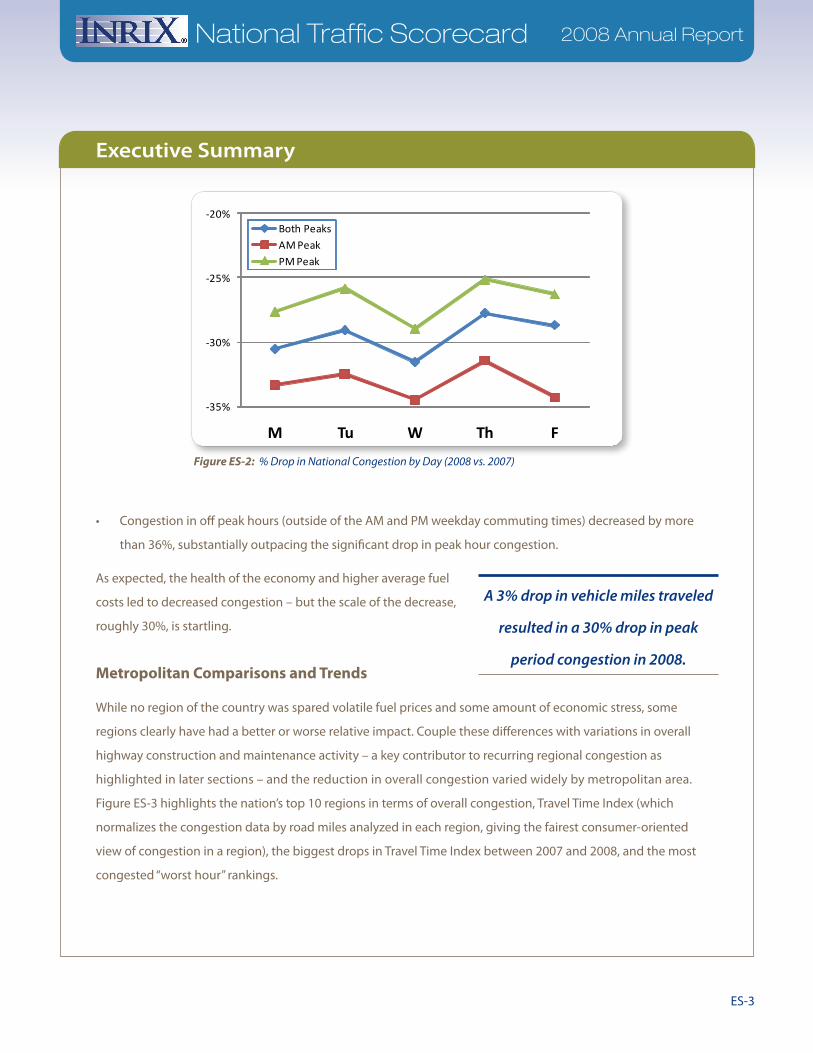
Each weekday morning, peak hour congestion dropped much more than its corresponding evening peak •
hour congestion (See figure ES-2).
National congestion levels were essentially the same when comparing the first and second halves of 2008, •
thus it seems that higher fuel prices in early 2008 and the slower economy later in the year netted the same
drop in overall congestion.
Executive Summary
1.11
1.13
1.09
1.00
1.05
1.10
1.15
2006 2007 2008
Trav
el T
ime
Inde
x
Figure ES-1: National Travel Time Index by Year
National Traffic Scorecard 2008 Annual Report
ES-3
Congestion in off peak hours (outside of the AM and PM weekday commuting times) decreased by more •
than 36%, substantially outpacing the significant drop in peak hour congestion.
As expected, the health of the economy and higher average fuel
costs led to decreased congestion – but the scale of the decrease,
roughly 30%, is startling.
Metropolitan Comparisons and Trends
While no region of the country was spared volatile fuel prices and some amount of economic stress, some
regions clearly have had a better or worse relative impact. Couple these differences with variations in overall
highway construction and maintenance activity – a key contributor to recurring regional congestion as
highlighted in later sections – and the reduction in overall congestion varied widely by metropolitan area.
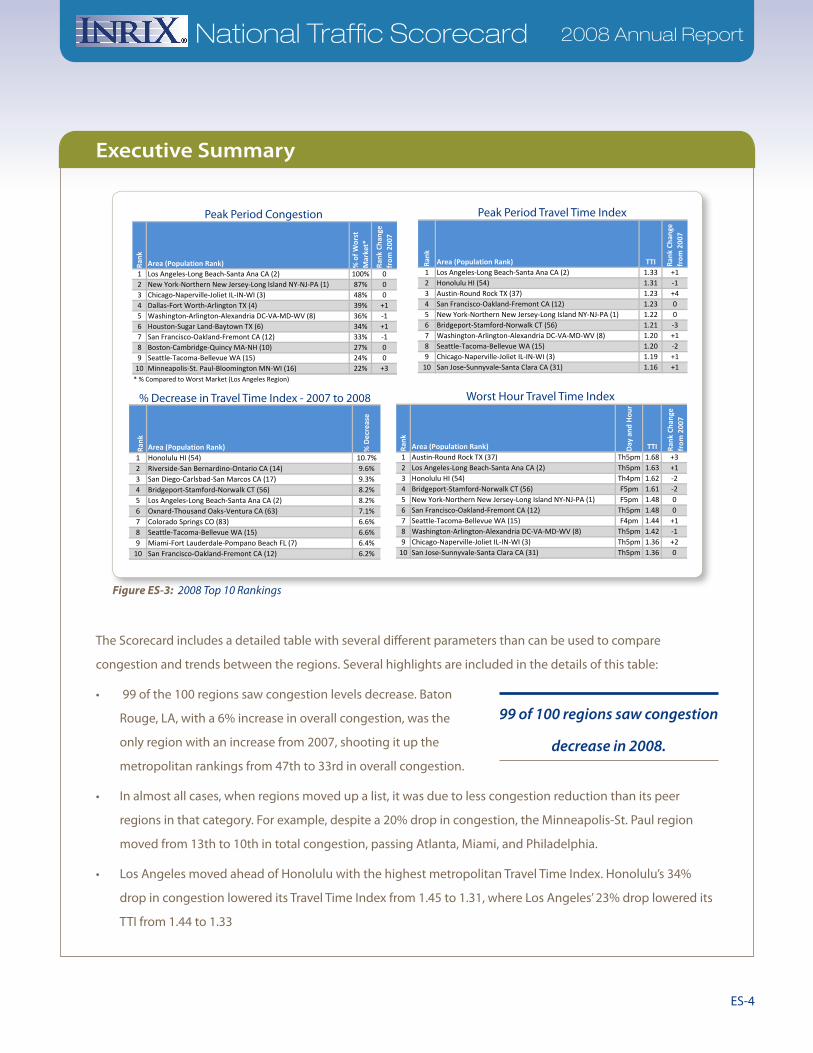
Figure ES-3 highlights the nation’s top 10 regions in terms of overall congestion, Travel Time Index (which
normalizes the congestion data by road miles analyzed in each region, giving the fairest consumer-oriented
view of congestion in a region), the biggest drops in Travel Time Index between 2007 and 2008, and the most
congested “worst hour” rankings.
A 3% drop in vehicle miles traveled
resulted in a 30% drop in peak
period congestion in 2008.
Executive Summary
-35%
-30%
-25%
-20%
M Tu W Th F
Both Peaks
AM Peak
PM Peak
Figure ES-2: % Drop in National Congestion by Day (2008 vs. 2007)
National Traffic Scorecard 2008 Annual Report
ES-4
The Scorecard includes a detailed table with several different parameters than can be used to compare
congestion and trends between the regions. Several highlights are included in the details of this table:
99 of the 100 regions saw congestion levels decrease. Baton •
Rouge, LA, with a 6% increase in overall congestion, was the
only region with an increase from 2007, shooting it up the
metropolitan rankings from 47th to 33rd in overall congestion.
In almost all cases, when regions moved up a list, it was due to less congestion reduction than its peer •
regions in that category. For example, despite a 20% drop in congestion, the Minneapolis-St. Paul region
moved from 13th to 10th in total congestion, passing Atlanta, Miami, and Philadelphia.
Los Angeles moved ahead of Honolulu with the highest metropolitan Travel Time Index. Honolulu’s 34% •
drop in congestion lowered its Travel Time Index from 1.45 to 1.31, where Los Angeles’ 23% drop lowered its
TTI from 1.44 to 1.33
99 of 100 regions saw congestion
decrease in 2008.
Executive SummaryRa
nk
Area (Population Rank) % o
f Wor
st
Mar
ket*
Rank
Cha
nge
from
200
7
1 Los Angeles-Long Beach-Santa Ana CA (2) 100% 02 New York-Northern New Jersey-Long Island NY-NJ-PA (1) 87% 03 Chicago-Naperville-Joliet IL-IN-WI (3) 48% 04 Dallas-Fort Worth-Arlington TX (4) 39% +15 Washington-Arlington-Alexandria DC-VA-MD-WV (8) 36% -16 Houston-Sugar Land-Baytown TX (6) 34% +17 San Francisco-Oakland-Fremont CA (12) 33% -18 Boston-Cambridge-Quincy MA-NH (10) 27% 09 Seattle-Tacoma-Bellevue WA (15) 24% 0
10 Minneapolis-St. Paul-Bloomington MN-WI (16) 22% +3* % Compared to Worst Market (Los Angeles Region)
Peak Period Congestion
Rank
Area (Population Rank) TTI Rank
Cha
nge
from
200
7
1 Los Angeles-Long Beach-Santa Ana CA (2) 1.33 +12 Honolulu HI (54) 1.31 -13 Austin-Round Rock TX (37) 1.23 +44 San Francisco-Oakland-Fremont CA (12) 1.23 05 New York-Northern New Jersey-Long Island NY-NJ-PA (1) 1.22 06 Bridgeport-Stamford-Norwalk CT (56) 1.21 -37 Washington-Arlington-Alexandria DC-VA-MD-WV (8) 1.20 +18 Seattle-Tacoma-Bellevue WA (15) 1.20 -29 Chicago-Naperville-Joliet IL-IN-WI (3) 1.19 +1
10 San Jose-Sunnyvale-Santa Clara CA (31) 1.16 +1
Peak Period Travel Time Index
Rank
Area (Population Rank) Day
and
Hou
r
TTI Rank
Cha
nge
from
200
7
1 Austin-Round Rock TX (37) Th5pm 1.68 +32 Los Angeles-Long Beach-Santa Ana CA (2) Th5pm 1.63 +13 Honolulu HI (54) Th4pm 1.62 -24 Bridgeport-Stamford-Norwalk CT (56) F5pm 1.61 -25 New York-Northern New Jersey-Long Island NY-NJ-PA (1) F5pm 1.48 06 San Francisco-Oakland-Fremont CA (12) Th5pm 1.48 07 Seattle-Tacoma-Bellevue WA (15) F4pm 1.44 +18 Washington-Arlington-Alexandria DC-VA-MD-WV (8) Th5pm 1.42 -19 Chicago-Naperville-Joliet IL-IN-WI (3) Th5pm 1.36 +2
10 San Jose-Sunnyvale-Santa Clara CA (31) Th5pm 1.36 0
Worst Hour Travel Time Index
Figure ES-3: 2008 Top 10 Rankings
Rank
Area (Population Rank) % D
ecre
ase
1 Honolulu HI (54) 10.7%2 Riverside-San Bernardino-Ontario CA (14) 9.6%3 San Diego-Carlsbad-San Marcos CA (17) 9.3%4 Bridgeport-Stamford-Norwalk CT (56) 8.2%5 Los Angeles-Long Beach-Santa Ana CA (2) 8.2%6 Oxnard-Thousand Oaks-Ventura CA (63) 7.1%7 Colorado Springs CO (83) 6.6%8 Seattle-Tacoma-Bellevue WA (15) 6.6%9 Miami-Fort Lauderdale-Pompano Beach FL (7) 6.4%
10 San Francisco-Oakland-Fremont CA (12) 6.2%
% Decrease in Travel Time Index - 2007 to 2008

National Traffic Scorecard 2008 Annual Report
ES-5
Executive Summary
Bottlenecks
Nearly 31,000 individual road segments were analyzed to determine the extent and amount of average
congestion each had in 2008. More than 6000 segments registered at least one hour of the week when one
can expect to travel at less than half the free flow or uncongested speed. As expected based on the overall
congestion data, the number and intensity of bottlenecks were down considerably from 2007. Overall 28% fewer
segments had at least one hour of congestion in 2008. Figure ES-4 details the drop for each threshold.
The nation’s worst bottleneck remained the same, a westbound stretch of the Cross Bronx Expressway/I-95 leading
up to and including the Bronx River Parkway exit 4B interchange. As in 2007, it was congested an astounding 94
hours of the week, but the average speed while congested rose in 2008 to 11.2 MPH from 9.8 MPH.
Figure ES-4: Drop in Bottlenecks from 2007 to 2008
2007
Total Analyzed
Congested 1 Hr or more
2008# of Segments
Congested 5 Hrs or more
Congested 10 Hrs or more
20 Hrs or more
40 Hrs or more
30,909 30,909
5,983
8,259
4,882
3,578
2,0462,977
1,094 715
227 147
Decrease
28%
27%
31%35%
35%
National Traffic Scorecard 2008 Annual Report
ES-6
Executive Summary
One third of the top 100 bottlenecks in 2007 were not in the top 100 in 2008. Five of the road segments that
dropped out of the top 100 fell outside of the Top 1000 – four of these were on the Dan Ryan Expressway in
Chicago, which was part of a multi-year construction project that ended in 2007.
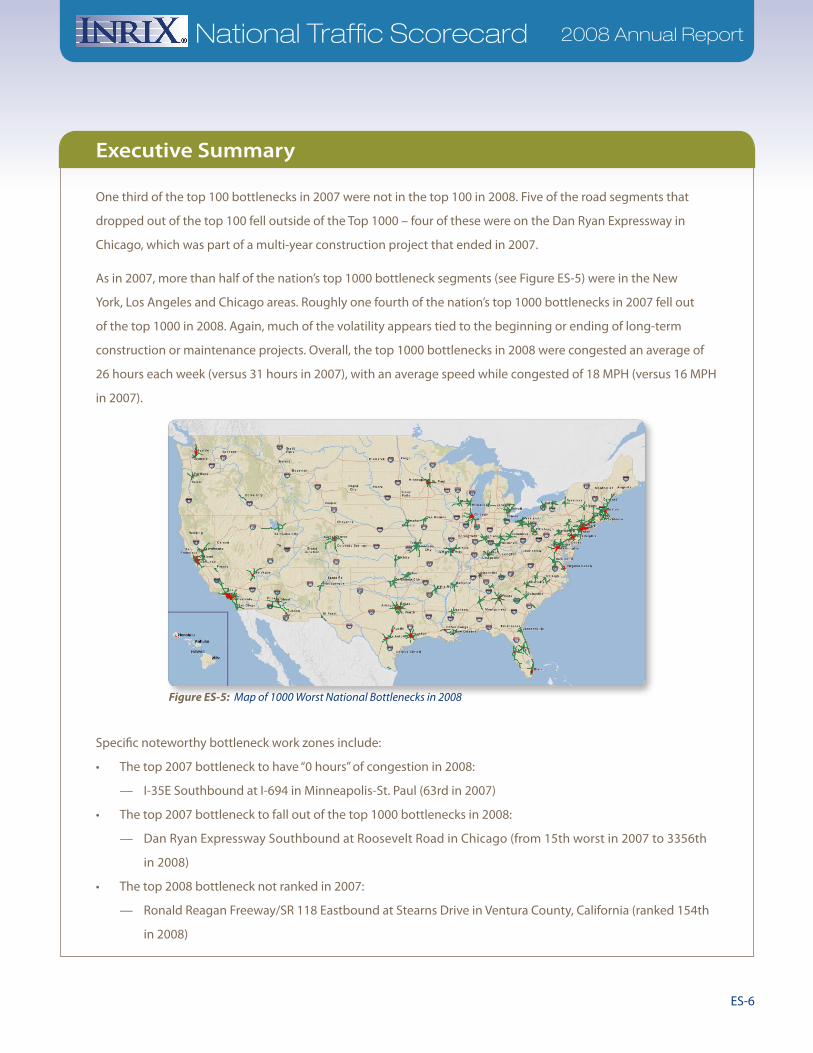
As in 2007, more than half of the nation’s top 1000 bottleneck segments (see Figure ES-5) were in the New
York, Los Angeles and Chicago areas. Roughly one fourth of the nation’s top 1000 bottlenecks in 2007 fell out
of the top 1000 in 2008. Again, much of the volatility appears tied to the beginning or ending of long-term
construction or maintenance projects. Overall, the top 1000 bottlenecks in 2008 were congested an average of
26 hours each week (versus 31 hours in 2007), with an average speed while congested of 18 MPH (versus 16 MPH
in 2007).
Specific noteworthy bottleneck work zones include:
The top 2007 bottleneck to have “0 hours” of congestion in 2008: •
I-35E Southbound at I-694 in Minneapolis-St. Paul (63rd in 2007) —
The top 2007 bottleneck to fall out of the top 1000 bottlenecks in 2008: •
Dan Ryan Expressway Southbound at Roosevelt Road in Chicago (from 15th worst in 2007 to 3356th —
in 2008)
The top 2008 bottleneck not ranked in 2007: •
Ronald Reagan Freeway/SR 118 Eastbound at Stearns Drive in Ventura County, California (ranked 154th —
in 2008)
Figure ES-5: Map of 1000 Worst National Bottlenecks in 2008
National Traffic Scorecard 2008 Annual Report
ES-7
Executive Summary
Conclusions
With a new presidential administration, the just-passed stimulus package, and the upcoming expiration of
SAFETEA-LU, this is an important year for transportation issues. The Scorecard has generated some relevant
findings to assist in both national and regional debates, including:
Volume changes have much bigger impacts under congested conditions. • FHWA data shows that in
2008, traffic on “urban interstates” was down 3% nationwide compared to 2007. This has translated to a
nearly 30% reduction in peak hour congestion and an even larger 36% drop in off-peak congestion. This
illustrates multiple issues:
Demand management can have sizeable impact on congestion, even if total volume changes are —
modest. Massive increases in fuel prices had effects similar to policy initiatives under consideration such
as variable pricing, managed lane strategies and better travel information. When a road network is at
capacity, adding or subtracting even a single vehicle has disproportionate effects for the network. This
phenomenon has been well known for a long time, but this data illustrates it in real-world terms on a
nationwide basis.
While the drop in congestion is welcomed in general, the primary root causes – high fuel costs —
and lagging economic activity – are not. Ideally, the nation’s economy will turn around in short order
and fuel prices will remain moderate. If so, we can expect congestion to largely snap back to levels
comparable to 2007 levels or worse. While we all should cheer the reduction in congestion in 2008, we
should be under no illusion that this is permanent. We must still continue to focus energies on policies
and methods to tackle congestion. When the economy is growing again, congestion will likely move to
the front and center again as the nation’s primary surface transportation problem.
The linkage between work zones and bottlenecks.• The significant percentage of bottlenecks that
appear to be related to work zones underscores the need to focus on managing work zones in ways that
mitigate congestion. With the upcoming stimulus spending, the amount of work zones is likely to grow to
numbers never before seen. Further, there is strong desire to move as quickly as possible in getting highway
projects underway. Proper work zone planning will be essential if we are to keep the nation’s highways from
becoming a parking lot.

National Traffic Scorecard 2008 Annual Report
National Traffic Scorecard 2008 Annual Report
1 – 2 Introduction
3 – 6 Methodology Provides background on the raw data that is the basis for the Scorecard
and the processes used to analyze the data to create the various results.
7 – 12 National Congestion Results and Trends Provides overall national congestion metrics, by hour, by morning and
evening drive times, by day and overall, comparing 2008 to 2007.
13 – 17 Metropolitan Rankings Compares and ranks metropolitan areas in terms of overall congestion
and travel times.
18 – 24 Bottlenecks Highlights the nation’s worst traffic bottlenecks including trends from
2007 to 2008.
25 Metropolitan Summaries Describes the detailed one-page summary information located in
Appendix A for all 100 metropolitan areas.
26 – 27 Scorecard Relationship with Other Studies Describes what makes this report different and complementary to other
recent studies assessing congestion.
28 – 31 Acknowledgements and Contact Information
A-1 – 100 Appendix A – Top 100 Metropolitan Scorecards Showcases the one page per metropolitan area Scorecards.
Table of Contents
1
National Traffic Scorecard 2008 Annual Report
National Traffic Scorecard 2008 Annual Report
1 See http://scorecard.inrix.com/scorecard/2007 for the report.2 The Impact of Fuel Prices on Consumer Behavior and Traffic Congestion, published October 2008, see
http://scorecard.inrix.com/scorecard/fuel for the report.
In June 2008, INRIX published the groundbreaking INRIX National Traffic Scorecard.1 Using data from 2007, the
initial Scorecard provided a comprehensive and consistent overview of where and when congestion existed on
the major roads in America’s top 100 metropolitan areas. This 2008 Annual Report of the Scorecard, available less
than 60 days after the end of 2008, summarizes the state of congestion in 2008 across the U.S.
2008: A Blip or a Trend?
Historically, traffic volumes and congestion, like the size of the economy and the population have tended to
consistently rise year after year. While the occasional recession or fuel price spike may halt the upward march of
traffic, it has almost always been only a small and temporary pause. 2008 was different. As one might expect, in
terms of traffic and congestion, 2008 was no ordinary year, on several fronts:
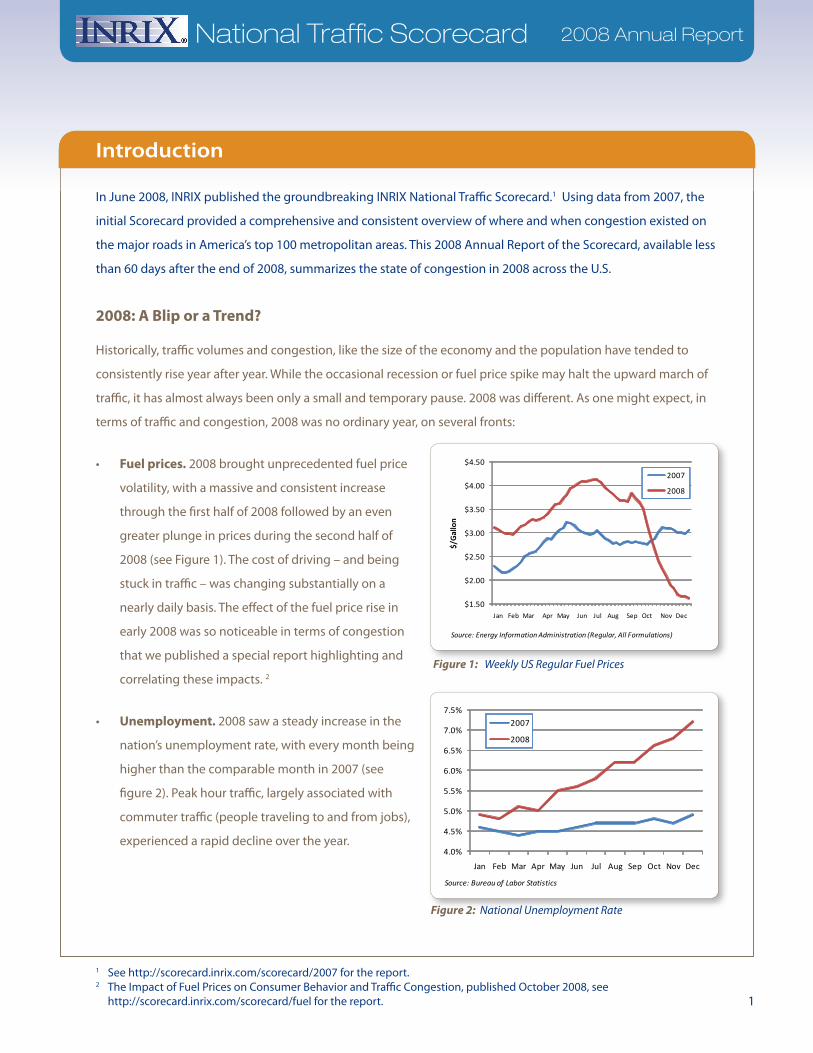
Fuel prices.• 2008 brought unprecedented fuel price
volatility, with a massive and consistent increase
through the first half of 2008 followed by an even
greater plunge in prices during the second half of
2008 (see Figure 1). The cost of driving – and being
stuck in traffic – was changing substantially on a
nearly daily basis. The effect of the fuel price rise in
early 2008 was so noticeable in terms of congestion
that we published a special report highlighting and
correlating these impacts. 2
Unemployment. • 2008 saw a steady increase in the
nation’s unemployment rate, with every month being
higher than the comparable month in 2007 (see
figure 2). Peak hour traffic, largely associated with
commuter traffic (people traveling to and from jobs),
experienced a rapid decline over the year.
Introduction
Figure 1: Weekly US Regular Fuel Prices
$1.50
$2.00
$2.50
$3.00
$3.50
$4.00
$4.50
Jan Feb Mar Apr May Jun Jul Aug Sep Oct Nov Dec
$/G
allo
n
2007
2008
Source: Energy Information Administration (Regular, All Formulations)
Figure 2: National Unemployment Rate
4.0%
4.5%
5.0%
5.5%
6.0%
6.5%
7.0%
7.5%
Jan Feb Mar Apr May Jun Jul Aug Sep Oct Nov Dec
2007
2008
Source: Bureau of Labor Statistics

2
National Traffic Scorecard 2008 Annual Report
Traffic Volume.• The combination of higher fuel
prices and a struggling economy yielded a consistent
decline in overall traffic volume. While month to
month changes moved both up and down, each
month from January to November in 2008 was
consistently below 2007 levels. This is true for overall
volumes and the specific category of roads – “Urban
Interstates” – the category that most closely aligns
to the roadway network analyzed in the Scorecard
(see Figure 3). Overall, urban interstate traffic volume
dropped 3% in 2008.
So, 2008 wasn’t just another year where things generally get somewhat worse in terms of congestion. Having the
nation’s most extensive traffic data repository, with more than three times the data points to leverage in 2008
versus 2007, has enabled INRIX to provide this unique, timely and important report summarizing how these
unprecedented circumstances affected traffic congestion in 2008.
INRIX’s Unique and Timely Traffic Data Archive
In 2006, INRIX introduced the Smart Dust Network, the first truly national traffic data collection network. The
Scorecard has established an equally revolutionary approach to measuring the nation’s traffic congestion
problem. Leveraging tens of billions of data points from 2006, 2007 and 2008 collected and archived by the
Smart Dust Network, this report publishes the most up-to-date information regarding overall congestion and
specific bottlenecks on the major roadways of urban America.
By analyzing over 30,000 road segments on more than 47,000 miles of the major highways in the nation’s 100
largest metropolitan areas, this report informs the ongoing debate of one of the nation’s most frustrating and
intractable issues: urban traffic congestion. How bad is congestion? Where is it worst? How has it changed? What
can be done about it? This Scorecard provides the most comprehensive and timely national scale glimpse of the
answers to these questions.
Introduction
Figure 3: Monthly Vehicle Miles Traveled, Urban Interstates
90.0
95.0
100.0
105.0
110.0
115.0
120.0
Jan Feb Mar Apr May Jun Jul Aug Sep Oct Nov Dec
2007
2008
Source: Federal Highway Administration Traffic Volume TrendsJanuary 2007 = 100; scale is % up or down vs. January 2007
3
National Traffic Scorecard 2008 Annual Report
National Traffic Scorecard 2008 Annual Report
3 http://www.census.gov/population/www/estimates/aboutmetro.html
4 http://www.census.gov/population/www/estimates/CBSA-est2007-pop-chg.html
Methodology
The INRIX National Traffic Scorecard draws from several existing approaches to calculating traffic congestion and
leverages new methods made possible by INRIX’s proprietary data. This section provides background on the raw
data and the processes used.
Source Data
The raw data comes from the historical traffic data warehouse of the INRIX Smart Dust Network. Since 2006,
INRIX has acquired tens of billions of discrete “GPS-enabled probe vehicle” reports from vehicles traveling the
nation’s roads – including taxis, airport shuttles, service delivery vans, long haul trucks, and consumer vehicles.
Each data report from these GPS-equipped vehicles includes the speed, location and heading of a particular
vehicle at a reported date and time.
INRIX has developed efficient methods for interpreting probe vehicle reports that are provided in real-time
to establish a current estimate of travel patterns in all major cities in the United States. These same methods
can aggregate data over periods of time (annually in this report) to provide reliable information on speeds
and congestion levels for segments of roads. With the nation’s largest probe vehicle network, INRIX has the
ability to generate the most comprehensive congestion analysis to date, covering the nation’s largest 100
metropolitan areas.
Metropolitan Area
The US Census Bureau definition of Core Based Statistical Areas (CBSA)3 is used to define metropolitan areas. This
report uses the latest 2007 census estimates4 to identify the top 100 areas.
Roads/Segments Analyzed
This report focuses on the major limited access roads in the top metropolitan areas in the United States. In all of
its products, INRIX utilizes an industry convention known as “TMC location codes” developed and maintained
by the nation’s leading electronic map database vendors to uniquely define road segments. The typical road
segment is the interchange and the portion of linear road leading up to the interchange across all lanes in
a single direction of travel. The length of a segment will depend upon the length of the distance between
interchanges. For this report, over 47,000 road miles in nearly 31,000 discrete road segments have been analyzed
(see Figure 4).

4
National Traffic Scorecard 2008 Annual Report
Methodology
Analysis Time Period
The focus of this report is the calendar year 2008. In some cases, calendar year 2006 and 2007 data is utilized to
enable year over year comparisons.
Road Segment Data
There are two key building blocks for the different analyses included in this report:
Reference speed (RS):• For each road segment, all probe vehicle reports obtained in overnight hours (where
congestion is usually unlikely) in 2008 are analyzed. The 85th percentile of those data points is identified as
the “reference speed” for that particular road segment. This is typically the speed of “free flow” traffic if and
when no congestion exists. Each segment has a single reference speed.
Hourly average speed (HS): • All probe vehicle reports for each road segment are grouped by hour of day,
day of week (e.g. Monday from 3 to 4pm) and an “average speed” for each time slot is established for each
road segment. Thus, each segment has 168 corresponding hourly average speed values – representing 24
hours of each day muliplied by the seven days in a week.
Figure 4: Roads Analyzed in Scorecard Are Indicated in Green
5
National Traffic Scorecard 2008 Annual Report
5 See note at bottom of this link: http://www.bts.gov/publications/national_transportation_statistics/html/table_01_64.html
Methodology
Overall Congestion Metrics – Regional and National
To assess congestion for a CBSA, INRIX utilizes several concepts that have been used in similar studies.
Travel Time Index (TTI):• TTI is the ratio of peak period travel time to free flow travel time. The TTI expresses
the average amount of extra time it takes to travel in the peak relative to free-flow travel. A TTI of 1.3, for
example, indicates a 20-minute free-flow trip will take 26 minutes during the peak travel time periods, a
6-minute (30 percent) travel time penalty.5 For each road segment, a TTI is calculated for each hour of the
week, using the formula TTI = RS/HS.
“Peak Hour” Congestion:• To assess and compare congestion levels year to year and between CBSAs, only
“peak hours” are analyzed. Consistent with similar studies, peak hours are defined as the hours from 6 to 10
AM and 3 to 7 PM, Monday through Friday – 40 of the 168 hours of a week.
For each Metropolitan Area, an overall level of congestion is determined for each of the 40 peak hours by
determining the extent and amount of average congestion on the analyzed road network. This is easy to
compute once TTI’s are calculated for each segment:
STEP 1: For each of the 40 peak hours, all road segments analyzed in the CBSA are checked. Each segment
where the TTI > 1 is contributing congestion, and it is analyzed further.
STEP 2: For each segment contributing congestion, the amount the TTI is greater than 1 is multiplied by the
length of the segment, resulting in a congestion factor.
STEP 3: For a given hour, the overall metropolitan congestion factor is the sum of the congestion factors
calculated in STEP 2.
STEP 4: To establish the Metropolitan Travel Time Index for a given hour, the metropolitan congestion factor
from STEP 3 is divided by the number of road miles analyzed.
STEP 5: A peak period Metropolitan Travel Time Index is determined by averaging the hourly Metropolitan
Travel Time Indices from STEP 4.
New for this 2008 Annual Update, monthly Travel Time Index values have been calculated for each CBSA and
nationally as well and are included in subsequent sections.
6
National Traffic Scorecard 2008 Annual Report
6 From the Federal Highway Administration: Traffic Bottleneck: (Simple definition) A localized constriction of traffic flow. (Expanded definition) A localized section of highway that experiences reduced speeds and inherent delays due to a recurring operational influence or a nonrecurring impacting event.
Methodology
Bottlenecks
With the unique ability to examine in detail nearly 31,000 urban highway road segments, INRIX identifies
the specific locations in each metropolitan area – and can compare locations across the country – that are
consistently congested. These are “bottlenecks.” 6
Congestion – and how to measure it – can be in the eye of the beholder. Is congestion defined as how bad a road
segment is at its worst or is it how often the segment gets “congested” (and what is the threshold for “congestion”
anyways – tapping the brakes, stop and go conditions, etc.)? INRIX has developed a method that combines both
the amount of time a road segment is congested with the intensity of congestion during those periods. The
process used to analyze each of the nearly 31,000 road segments is as follows:
The same RS and HS values are utilized as in the overall congestion by metropolitan area portion of the study;•
All 168 hours of the week are considered, not just the 40 “peak hours.” As will be evident in the data, severe •
bottlenecks aren’t just limited to peak hours;
For each hour of the week that the average speed is less than 50% of the reference speed (RS), the hour is •
considered “congested;”
For all “congested” hours, the average intensity of the congestion is determined by establishing an average •
travel time ratio;
The total bottleneck factor equals the number of hours of congested by the average travel time ratio.•
Each road segment’s bottleneck factor can be compared with others in a metropolitan area and against all •
bottlenecks nationally. It can also be compared year-to-year, as we have in this Scorecard.
7
National Traffic Scorecard 2008 Annual Report
National Traffic Scorecard 2008 Annual Report
7 Peak period drive time hours are 6 – 10 AM and 3 – 7 PM, Monday through Friday. 8 See Texas Transportation Institute’s 2007 Urban Mobility Report, where the average annual delay per
travel in 2005 in the 85 “large areas” studied was 44 hours (http://mobility.tamu.edu/ums/).
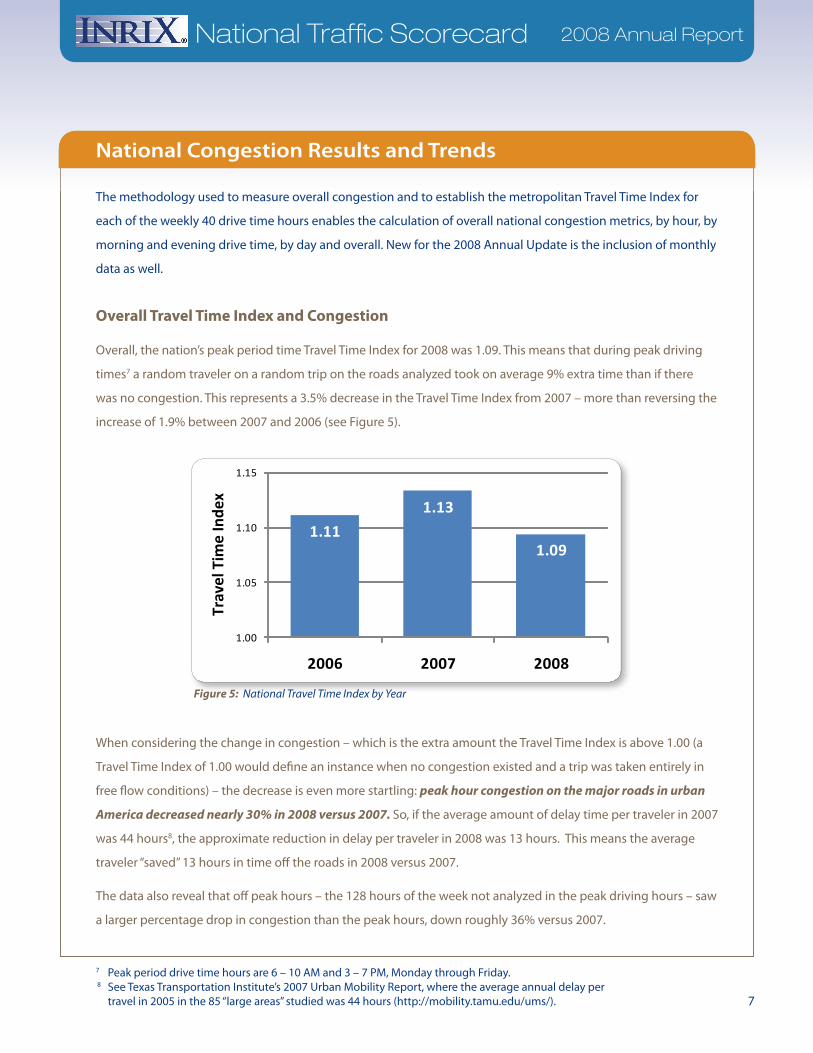
The methodology used to measure overall congestion and to establish the metropolitan Travel Time Index for
each of the weekly 40 drive time hours enables the calculation of overall national congestion metrics, by hour, by
morning and evening drive time, by day and overall. New for the 2008 Annual Update is the inclusion of monthly
data as well.
Overall Travel Time Index and Congestion
Overall, the nation’s peak period time Travel Time Index for 2008 was 1.09. This means that during peak driving
times7 a random traveler on a random trip on the roads analyzed took on average 9% extra time than if there
was no congestion. This represents a 3.5% decrease in the Travel Time Index from 2007 – more than reversing the
increase of 1.9% between 2007 and 2006 (see Figure 5).
When considering the change in congestion – which is the extra amount the Travel Time Index is above 1.00 (a
Travel Time Index of 1.00 would define an instance when no congestion existed and a trip was taken entirely in
free flow conditions) – the decrease is even more startling: peak hour congestion on the major roads in urban
America decreased nearly 30% in 2008 versus 2007. So, if the average amount of delay time per traveler in 2007
was 44 hours8, the approximate reduction in delay per traveler in 2008 was 13 hours. This means the average
traveler “saved” 13 hours in time off the roads in 2008 versus 2007.
The data also reveal that off peak hours – the 128 hours of the week not analyzed in the peak driving hours – saw
a larger percentage drop in congestion than the peak hours, down roughly 36% versus 2007.
National Congestion Results and Trends
1.11
1.13
1.09
1.00
1.05
1.10
1.15
2006 2007 2008
Trav
el T
ime
Inde
x
Figure 5: National Travel Time Index by Year
8
National Traffic Scorecard 2008 Annual Report
National Congestion Results and Trends
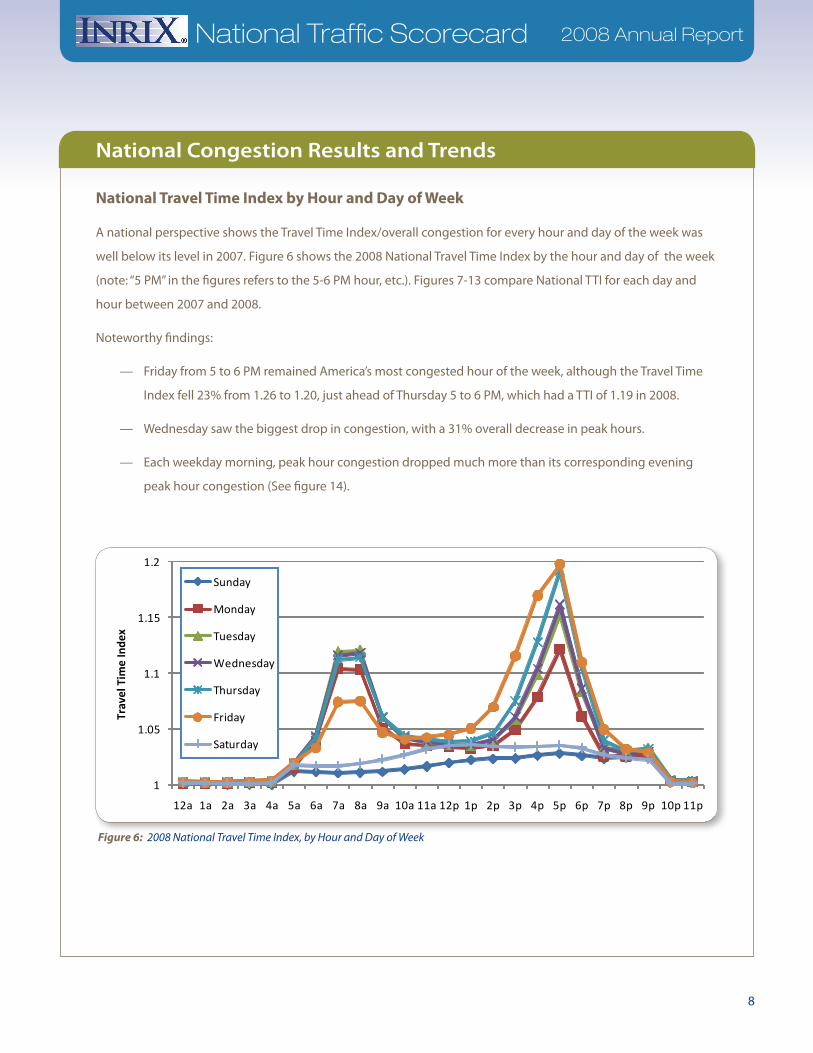
National Travel Time Index by Hour and Day of Week
A national perspective shows the Travel Time Index/overall congestion for every hour and day of the week was
well below its level in 2007. Figure 6 shows the 2008 National Travel Time Index by the hour and day of the week
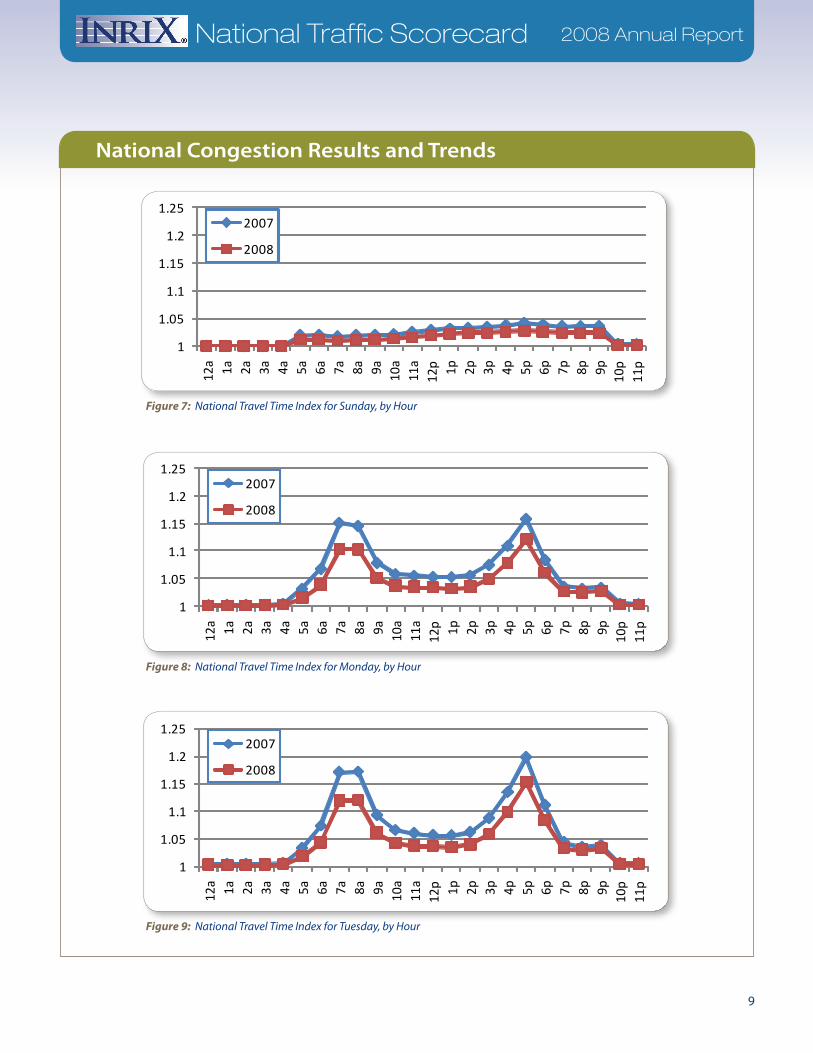
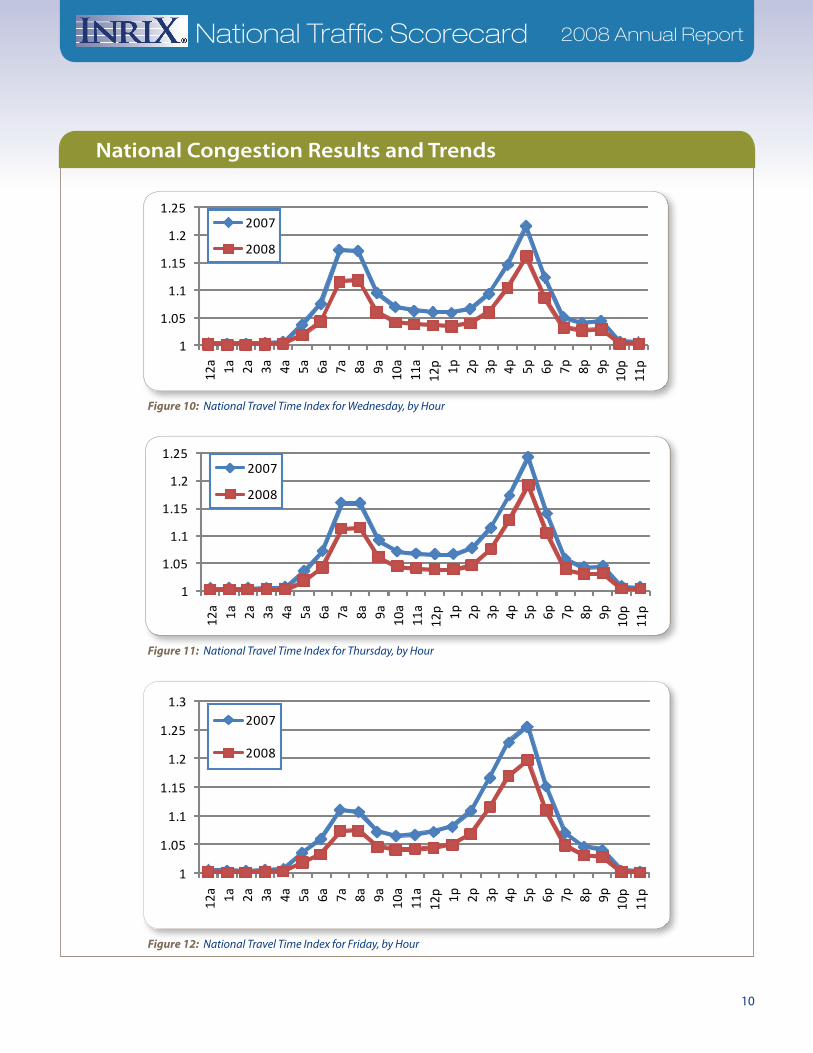
(note: “5 PM” in the figures refers to the 5-6 PM hour, etc.). Figures 7-13 compare National TTI for each day and
hour between 2007 and 2008.
Noteworthy findings:
Friday from 5 to 6 PM remained America’s most congested hour of the week, although the Travel Time —
Index fell 23% from 1.26 to 1.20, just ahead of Thursday 5 to 6 PM, which had a TTI of 1.19 in 2008.
Wednesday saw the biggest drop in congestion, with a 31% overall decrease in peak hours. —
Each weekday morning, peak hour congestion dropped much more than its corresponding evening —
peak hour congestion (See figure 14).
1
1.05
1.1
1.15
1.2
12a 1a 2a 3a 4a 5a 6a 7a 8a 9a 10a 11a 12p 1p 2p 3p 4p 5p 6p 7p 8p 9p 10p 11p
Trav
el T
ime
Inde
x
Sunday
Monday
Tuesday
Wednesday
Thursday
Friday
Saturday
Figure 6: 2008 National Travel Time Index, by Hour and Day of Week
9
National Traffic Scorecard 2008 Annual Report
National Congestion Results and Trends
Figure 7: National Travel Time Index for Sunday, by Hour
1
1.05
1.1
1.15
1.2
1.25
12a 1a 2a 3a 4a 5a 6a 7a 8a 9a 10a
11a
12p 1p 2p 3p 4p 5p 6p 7p 8p 9p 10p
11p
2007
2008
Figure 8: National Travel Time Index for Monday, by Hour
1
1.05
1.1
1.15
1.2
1.25
12a 1a 2a 3a 4a 5a 6a 7a 8a 9a 10a
11a
12p 1p 2p 3p 4p 5p 6p 7p 8p 9p 10p
11p
2007
2008
Figure 9: National Travel Time Index for Tuesday, by Hour
1
1.05
1.1
1.15
1.2
1.2512
a 1a 2a 3a 4a 5a 6a 7a 8a 9a 10a
11a
12p 1p 2p 3p 4p 5p 6p 7p 8p 9p 10p
11p
2007
2008
10
National Traffic Scorecard 2008 Annual Report
National Congestion Results and Trends
Figure 10: National Travel Time Index for Wednesday, by Hour
1
1.05
1.1
1.15
1.2
1.25
12a 1a 2a 3a 4a 5a 6a 7a 8a 9a 10a
11a
12p 1p 2p 3p 4p 5p 6p 7p 8p 9p 10p
11p
2007
2008
Figure 11: National Travel Time Index for Thursday, by Hour
Figure 12: National Travel Time Index for Friday, by Hour
1
1.05
1.1
1.15
1.2
1.2512
a 1a 2a 3a 4a 5a 6a 7a 8a 9a 10a
11a
12p 1p 2p 3p 4p 5p 6p 7p 8p 9p 10p
11p
2007
2008
1
1.05
1.1
1.15
1.2
1.25
1.3
12a 1a 2a 3a 4a 5a 6a 7a 8a 9a 10a
11a
12p 1p 2p 3p 4p 5p 6p 7p 8p 9p 10p
11p
2007
2008
11
National Traffic Scorecard 2008 Annual Report
National Congestion Results and Trends
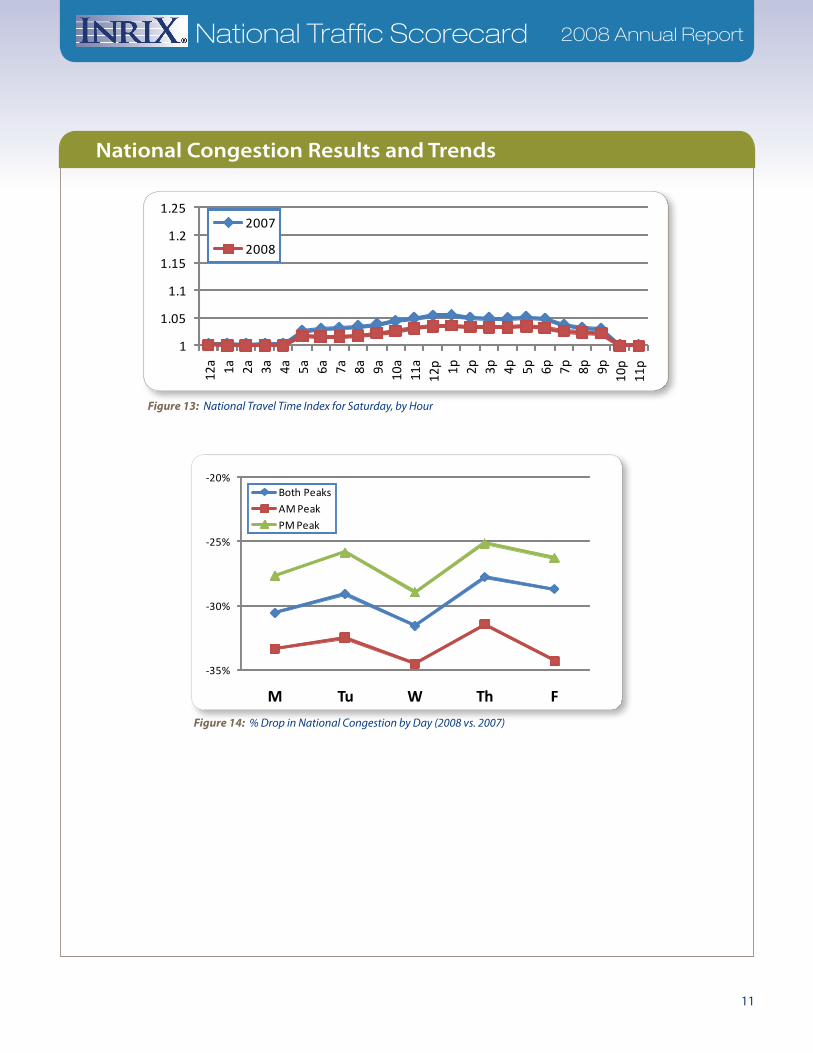
-35%
-30%
-25%
-20%
M Tu W Th F
Both Peaks
AM Peak
PM Peak
Figure 14: % Drop in National Congestion by Day (2008 vs. 2007)
Figure 13: National Travel Time Index for Saturday, by Hour
1
1.05
1.1
1.15
1.2
1.2512
a 1a 2a 3a 4a 5a 6a 7a 8a 9a 10a
11a
12p 1p 2p 3p 4p 5p 6p 7p 8p 9p 10p
11p
2007
2008

12
National Traffic Scorecard 2008 Annual Report
Travel Time Index by Month
New for this update is the inclusion of monthly Travel Time Index calculations. Each metropolitan area summary
page now includes the region’s TTI by month. This also allows the calculation of a national TTI for each month.
Figure 15 shows the changes in national TTI from month-to-month.
It should be noted that traffic volumes have historically varied significantly from month-to-month over the
course of a calendar year. It is anticipated that monthly TTI – both nationally and in each region – will exhibit
similar characteristics, meaning that over time, it will be more meaningful to compare the same month from year
to year, than the current month to the last month.
In 2008 however, given the dramatic change in circumstances from the first half to the second half of the year, it
is meaningful to compare the average Travel Time Index from the first 6 months to the second 6 months of 2008.
Interestingly, likely for very different reasons, the Travel Time Index for each half of 2008 is virtually identical:
1.093 for 1H 2008 versus 1.095 for 2H 2008.
National Congestion Results and Trends
1.07
1.08
1.09
1.10
1.11
1.12
J F M A M J J A S O N D
Figure 15: 2008 National Travel Time Index by Month
13
National Traffic Scorecard 2008 Annual ReportNational Traffic Scorecard 2008 Annual Report
9 Peak period drive time hours are 6 – 10 AM and 3 – 7 PM, Monday through Friday.
Metropolitan Rankings
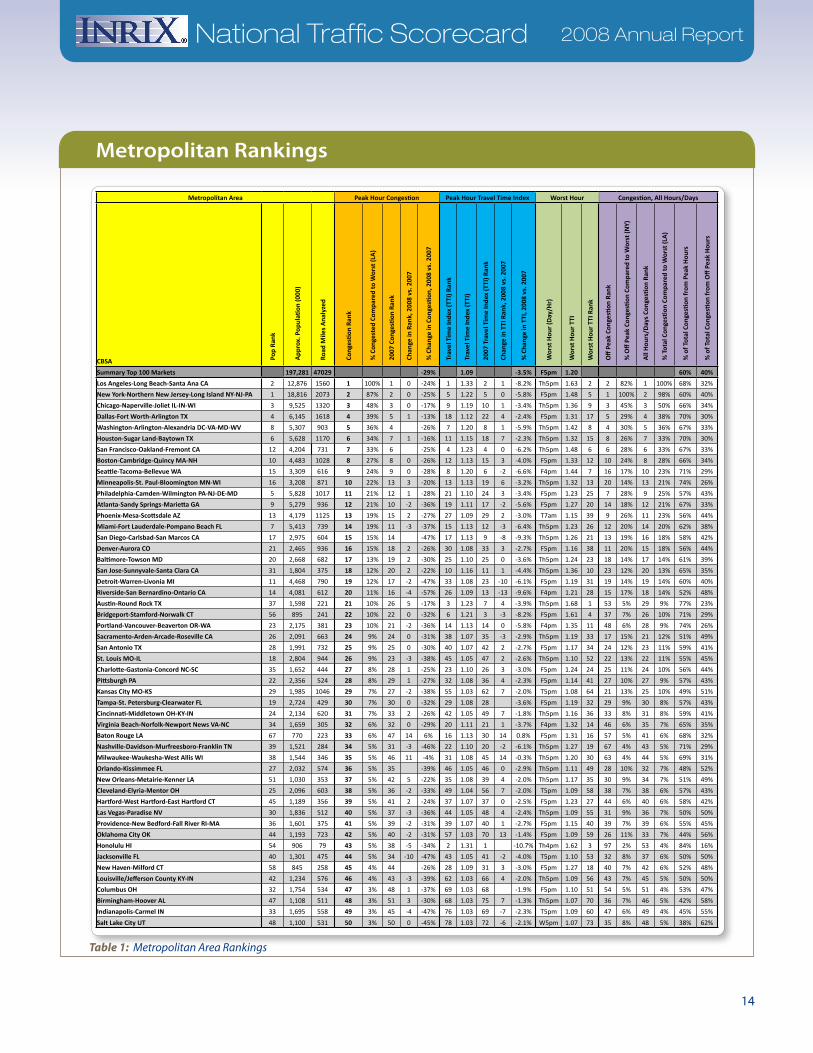
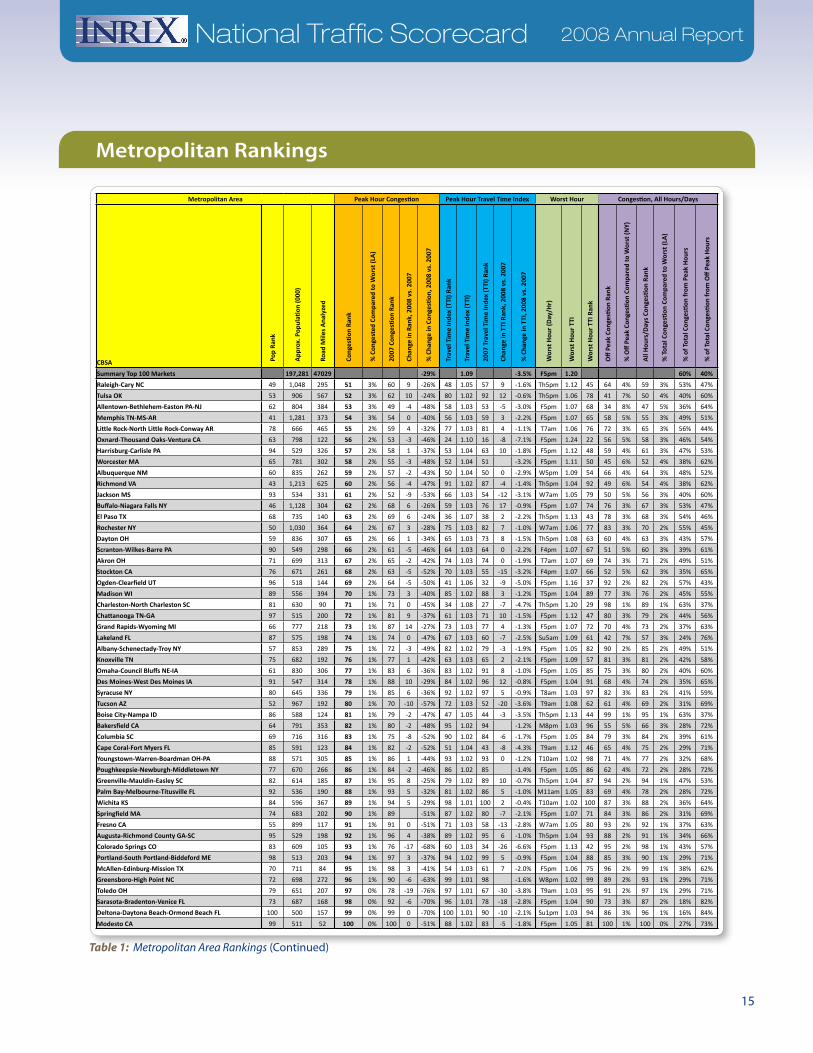
Table 1 provides market to market comparisons of metropolitan areas. As there are several different ways
to quantify congestion, the table has many columns. The print version of the table is sorted on Peak Hour
Congestion. The online version of this table, located at http://scorecard.inrix.com, can be sorted by all columns to
show rankings based on each parameter.
Included in Table 1 are:
Metropolitan Area details• , including the official CBSA name, the total population and national rank and
the number of road miles analyzed (which varies based on the size of the region and the extent of its limited
access road network).
Peak Hour• 9 Congestion results and rankings, including the 2008 ranking and congestion level, referenced
in terms of the percentage of the nation’s worst overall congestion (Los Angeles), the 2007 ranking, the
change in regional ranking and the percentage change in overall congestion from 2007 to 2008.
Peak Hour Travel Time Index results and rankings• , including the 2008 Travel Time Index and ranking, the
2007 ranking and the change in regional ranking and the percentage change in TTI from 2007 to 2008.
“Worst Hour” results• , including worst day/time for congestion in the region for 2008, the Travel Time Index
during that hour and the comparison rank of the Travel Time Index to the worst hour TTI of other regions.
Off-Peak and Total Congestion• , including the 2008 ranking and congestion level, compared to the worst
region for off peak hours (the 128 non-peak hours each week) and all hours/days (peak hours and off peak
hours), and the percentage of overall congestion that occurred in peak versus off peak hours in 2008.
Figure 16 shows several “top 10” lists derived from the data in Table 1.
14
National Traffic Scorecard 2008 Annual Report
Metropolitan Rankings
Table 1: Metropolitan Area Rankings
Metropolitan Area Peak Hour Congestion Peak Hour Travel Time Index Worst Hour Congestion, All Hours/Days
CBSA Pop
Ran
k
App
rox.
Pop
ulati
on (0
00)
Roa
d M
iles
Ana
lyze
d
Con
gesti
on R
ank
% C
onge
sted
Com
pare
d to
Wor
st (L
A)
200
7 Co
nges
tion
Ran
k
Cha
nge
in R
ank,
200
8 vs
. 200
7
% C
hang
e in
Con
gesti
on, 2
008
vs. 2
007
Tra
vel T
ime
Inde
x (T
TI) R
ank
Tra
vel T
ime
Inde
x (T
TI)
200
7 Tr
avel
Tim
e In
dex
(TTI
) Ran
k
Cha
nge
in T
TI R
ank,
200
8 vs
. 200
7
% C
hang
e in
TTI
, 200
8 vs
. 200
7
Wor
st H
our
(Day
/Hr)
Wor
st H
our
TTI
Wor
st H
our
TTI R
ank
Off
Pea
k Co
nges
tion
Ran
k
% O
ff P
eak
Cong
esti
on C
ompa
red
to W
orst
(NY)
All
Hou
rs/D
ays
Cong
esti
on R
ank
% T
otal
Con
gesti
on C
ompa
red
to W
orst
(LA
)
% o
f Tot
al C
onge
stion
from
Pea
k H
ours
% o
f Tot
al C
onge
stion
from
Off
Pea
k H
ours
Summary Top 100 Markets 197,281 47029 -29% 1.09 -3.5% F5pm 1.20 60% 40%
Los Angeles-Long Beach-Santa Ana CA 2 12,876 1560 1 100% 1 0 -24% 1 1.33 2 1 -8.2% Th5pm 1.63 2 2 82% 1 100% 68% 32%
New York-Northern New Jersey-Long Island NY-NJ-PA 1 18,816 2073 2 87% 2 0 -25% 5 1.22 5 0 -5.8% F5pm 1.48 5 1 100% 2 98% 60% 40%
Chicago-Naperville-Joliet IL-IN-WI 3 9,525 1320 3 48% 3 0 -17% 9 1.19 10 1 -3.4% Th5pm 1.36 9 3 45% 3 50% 66% 34%
Dallas-Fort Worth-Arlington TX 4 6,145 1618 4 39% 5 1 -13% 18 1.12 22 4 -2.4% F5pm 1.31 17 5 29% 4 38% 70% 30%
Washington-Arlington-Alexandria DC-VA-MD-WV 8 5,307 903 5 36% 4 -26% 7 1.20 8 1 -5.9% Th5pm 1.42 8 4 30% 5 36% 67% 33%
Houston-Sugar Land-Baytown TX 6 5,628 1170 6 34% 7 1 -16% 11 1.15 18 7 -2.3% Th5pm 1.32 15 8 26% 7 33% 70% 30%
San Francisco-Oakland-Fremont CA 12 4,204 731 7 33% 6 -25% 4 1.23 4 0 -6.2% Th5pm 1.48 6 6 28% 6 33% 67% 33%
Boston-Cambridge-Quincy MA-NH 10 4,483 1028 8 27% 8 0 -26% 12 1.13 15 3 -4.0% F5pm 1.33 12 10 24% 8 28% 66% 34%
Seattle-Tacoma-Bellevue WA 15 3,309 616 9 24% 9 0 -28% 8 1.20 6 -2 -6.6% F4pm 1.44 7 16 17% 10 23% 71% 29%
Minneapolis-St. Paul-Bloomington MN-WI 16 3,208 871 10 22% 13 3 -20% 13 1.13 19 6 -3.2% Th5pm 1.32 13 20 14% 13 21% 74% 26%
Philadelphia-Camden-Wilmington PA-NJ-DE-MD 5 5,828 1017 11 21% 12 1 -28% 21 1.10 24 3 -3.4% F5pm 1.23 25 7 28% 9 25% 57% 43%
Atlanta-Sandy Springs-Marietta GA 9 5,279 936 12 21% 10 -2 -36% 19 1.11 17 -2 -5.6% F5pm 1.27 20 14 18% 12 21% 67% 33%
Phoenix-Mesa-Scottsdale AZ 13 4,179 1125 13 19% 15 2 -27% 27 1.09 29 2 -3.0% T7am 1.15 39 9 26% 11 23% 56% 44%
Miami-Fort Lauderdale-Pompano Beach FL 7 5,413 739 14 19% 11 -3 -37% 15 1.13 12 -3 -6.4% Th5pm 1.23 26 12 20% 14 20% 62% 38%
San Diego-Carlsbad-San Marcos CA 17 2,975 604 15 15% 14 -47% 17 1.13 9 -8 -9.3% Th5pm 1.26 21 13 19% 16 18% 58% 42%
Denver-Aurora CO 21 2,465 936 16 15% 18 2 -26% 30 1.08 33 3 -2.7% F5pm 1.16 38 11 20% 15 18% 56% 44%
Baltimore-Towson MD 20 2,668 682 17 13% 19 2 -30% 25 1.10 25 0 -3.6% Th5pm 1.24 23 18 14% 17 14% 61% 39%
San Jose-Sunnyvale-Santa Clara CA 31 1,804 375 18 12% 20 2 -22% 10 1.16 11 1 -4.4% Th5pm 1.36 10 23 12% 20 13% 65% 35%
Detroit-Warren-Livonia MI 11 4,468 790 19 12% 17 -2 -47% 33 1.08 23 -10 -6.1% F5pm 1.19 31 19 14% 19 14% 60% 40%
Riverside-San Bernardino-Ontario CA 14 4,081 612 20 11% 16 -4 -57% 26 1.09 13 -13 -9.6% F4pm 1.21 28 15 17% 18 14% 52% 48%
Austin-Round Rock TX 37 1,598 221 21 10% 26 5 -17% 3 1.23 7 4 -3.9% Th5pm 1.68 1 53 5% 29 9% 77% 23%
Bridgeport-Stamford-Norwalk CT 56 895 241 22 10% 22 0 -32% 6 1.21 3 -3 -8.2% F5pm 1.61 4 37 7% 26 10% 71% 29%
Portland-Vancouver-Beaverton OR-WA 23 2,175 381 23 10% 21 -2 -36% 14 1.13 14 0 -5.8% F4pm 1.35 11 48 6% 28 9% 74% 26%
Sacramento-Arden-Arcade-Roseville CA 26 2,091 663 24 9% 24 0 -31% 38 1.07 35 -3 -2.9% Th5pm 1.19 33 17 15% 21 12% 51% 49%
San Antonio TX 28 1,991 732 25 9% 25 0 -30% 40 1.07 42 2 -2.7% F5pm 1.17 34 24 12% 23 11% 59% 41%
St. Louis MO-IL 18 2,804 944 26 9% 23 -3 -38% 45 1.05 47 2 -2.6% Th5pm 1.10 52 22 13% 22 11% 55% 45%
Charlotte-Gastonia-Concord NC-SC 35 1,652 444 27 8% 28 1 -25% 23 1.10 26 3 -3.0% F5pm 1.24 24 25 11% 24 10% 56% 44%
Pittsburgh PA 22 2,356 524 28 8% 29 1 -27% 32 1.08 36 4 -2.3% F5pm 1.14 41 27 10% 27 9% 57% 43%
Kansas City MO-KS 29 1,985 1046 29 7% 27 -2 -38% 55 1.03 62 7 -2.0% T5pm 1.08 64 21 13% 25 10% 49% 51%
Tampa-St. Petersburg-Clearwater FL 19 2,724 429 30 7% 30 0 -32% 29 1.08 28 -3.6% F5pm 1.19 32 29 9% 30 8% 57% 43%
Cincinnati-Middletown OH-KY-IN 24 2,134 620 31 7% 33 2 -26% 42 1.05 49 7 -1.8% Th5pm 1.16 36 33 8% 31 8% 59% 41%
Virginia Beach-Norfolk-Newport News VA-NC 34 1,659 305 32 6% 32 0 -29% 20 1.11 21 1 -3.7% F4pm 1.32 14 46 6% 35 7% 65% 35%
Baton Rouge LA 67 770 223 33 6% 47 14 6% 16 1.13 30 14 0.8% F5pm 1.31 16 57 5% 41 6% 68% 32%
Nashville-Davidson-Murfreesboro-Franklin TN 39 1,521 284 34 5% 31 -3 -46% 22 1.10 20 -2 -6.1% Th5pm 1.27 19 67 4% 43 5% 71% 29%
Milwaukee-Waukesha-West Allis WI 38 1,544 346 35 5% 46 11 -4% 31 1.08 45 14 -0.3% Th5pm 1.20 30 63 4% 44 5% 69% 31%
Orlando-Kissimmee FL 27 2,032 574 36 5% 35 -39% 46 1.05 46 0 -2.9% Th5pm 1.11 49 28 10% 32 7% 48% 52%
New Orleans-Metairie-Kenner LA 51 1,030 353 37 5% 42 5 -22% 35 1.08 39 4 -2.0% Th5pm 1.17 35 30 9% 34 7% 51% 49%
Cleveland-Elyria-Mentor OH 25 2,096 603 38 5% 36 -2 -33% 49 1.04 56 7 -2.0% T5pm 1.09 58 38 7% 38 6% 57% 43%
Hartford-West Hartford-East Hartford CT 45 1,189 356 39 5% 41 2 -24% 37 1.07 37 0 -2.5% F5pm 1.23 27 44 6% 40 6% 58% 42%
Las Vegas-Paradise NV 30 1,836 512 40 5% 37 -3 -36% 44 1.05 48 4 -2.4% Th5pm 1.09 55 31 9% 36 7% 50% 50%
Providence-New Bedford-Fall River RI-MA 36 1,601 375 41 5% 39 -2 -31% 39 1.07 40 1 -2.7% F5pm 1.15 40 39 7% 39 6% 55% 45%
Oklahoma City OK 44 1,193 723 42 5% 40 -2 -31% 57 1.03 70 13 -1.4% F5pm 1.09 59 26 11% 33 7% 44% 56%
Honolulu HI 54 906 79 43 5% 38 -5 -34% 2 1.31 1 -10.7% Th4pm 1.62 3 97 2% 53 4% 84% 16%
Jacksonville FL 40 1,301 475 44 5% 34 -10 -47% 43 1.05 41 -2 -4.0% T5pm 1.10 53 32 8% 37 6% 50% 50%
New Haven-Milford CT 58 845 258 45 4% 44 -26% 28 1.09 31 3 -3.0% F5pm 1.27 18 40 7% 42 6% 52% 48%
Louisville/Jefferson County KY-IN 42 1,234 576 46 4% 43 -3 -39% 62 1.03 66 4 -2.0% Th5pm 1.09 56 43 7% 45 5% 50% 50%
Columbus OH 32 1,754 534 47 3% 48 1 -37% 69 1.03 68 -1.9% F5pm 1.10 51 54 5% 51 4% 53% 47%
Birmingham-Hoover AL 47 1,108 511 48 3% 51 3 -30% 68 1.03 75 7 -1.3% Th5pm 1.07 70 36 7% 46 5% 42% 58%
Indianapolis-Carmel IN 33 1,695 558 49 3% 45 -4 -47% 76 1.03 69 -7 -2.3% T5pm 1.09 60 47 6% 49 4% 45% 55%
Salt Lake City UT 48 1,100 531 50 3% 50 0 -45% 78 1.03 72 -6 -2.1% W5pm 1.07 73 35 8% 48 5% 38% 62%
15
National Traffic Scorecard 2008 Annual Report
Metropolitan Rankings
Table 1: Metropolitan Area Rankings (Continued)
Metropolitan Area Peak Hour Congestion Peak Hour Travel Time Index Worst Hour Congestion, All Hours/Days
CBSA Pop
Ran
k
App
rox.
Pop
ulati
on (0
00)
Roa
d M
iles
Ana
lyze
d
Con
gesti
on R
ank
% C
onge
sted
Com
pare
d to
Wor
st (L
A)
200
7 Co
nges
tion
Ran
k
Cha
nge
in R
ank,
200
8 vs
. 200
7
% C
hang
e in
Con
gesti
on, 2
008
vs. 2
007
Tra
vel T
ime
Inde
x (T
TI) R
ank
Tra
vel T
ime
Inde
x (T
TI)
200
7 Tr
avel
Tim
e In
dex
(TTI
) Ran
k
Cha
nge
in T
TI R
ank,
200
8 vs
. 200
7
% C
hang
e in
TTI
, 200
8 vs
. 200
7
Wor
st H
our
(Day
/Hr)
Wor
st H
our
TTI
Wor
st H
our
TTI R
ank
Off
Pea
k Co
nges
tion
Ran
k
% O
ff P
eak
Cong
esti
on C
ompa
red
to W
orst
(NY)
All
Hou
rs/D
ays
Cong
esti
on R
ank
% T
otal
Con
gesti
on C
ompa
red
to W
orst
(LA
)
% o
f Tot
al C
onge
stion
from
Pea
k H
ours
% o
f Tot
al C
onge
stion
from
Off
Pea
k H
ours
Summary Top 100 Markets 197,281 47029 -29% 1.09 -3.5% F5pm 1.20 60% 40%
Raleigh-Cary NC 49 1,048 295 51 3% 60 9 -26% 48 1.05 57 9 -1.6% Th5pm 1.12 45 64 4% 59 3% 53% 47%
Tulsa OK 53 906 567 52 3% 62 10 -24% 80 1.02 92 12 -0.6% Th5pm 1.06 78 41 7% 50 4% 40% 60%
Allentown-Bethlehem-Easton PA-NJ 62 804 384 53 3% 49 -4 -48% 58 1.03 53 -5 -3.0% F5pm 1.07 68 34 8% 47 5% 36% 64%
Memphis TN-MS-AR 41 1,281 373 54 3% 54 0 -40% 56 1.03 59 3 -2.2% F5pm 1.07 65 58 5% 55 3% 49% 51%
Little Rock-North Little Rock-Conway AR 78 666 465 55 2% 59 4 -32% 77 1.03 81 4 -1.1% T7am 1.06 76 72 3% 65 3% 56% 44%
Oxnard-Thousand Oaks-Ventura CA 63 798 122 56 2% 53 -3 -46% 24 1.10 16 -8 -7.1% F5pm 1.24 22 56 5% 58 3% 46% 54%
Harrisburg-Carlisle PA 94 529 326 57 2% 58 1 -37% 53 1.04 63 10 -1.8% F5pm 1.12 48 59 4% 61 3% 47% 53%
Worcester MA 65 781 302 58 2% 55 -3 -48% 52 1.04 51 -3.2% F5pm 1.11 50 45 6% 52 4% 38% 62%
Albuquerque NM 60 835 262 59 2% 57 -2 -43% 50 1.04 50 0 -2.9% W5pm 1.09 54 66 4% 64 3% 48% 52%
Richmond VA 43 1,213 625 60 2% 56 -4 -47% 91 1.02 87 -4 -1.4% Th5pm 1.04 92 49 6% 54 4% 38% 62%
Jackson MS 93 534 331 61 2% 52 -9 -53% 66 1.03 54 -12 -3.1% W7am 1.05 79 50 5% 56 3% 40% 60%
Buffalo-Niagara Falls NY 46 1,128 304 62 2% 68 6 -26% 59 1.03 76 17 -0.9% F5pm 1.07 74 76 3% 67 3% 53% 47%
El Paso TX 68 735 140 63 2% 69 6 -24% 36 1.07 38 2 -2.2% Th5pm 1.13 43 78 3% 68 3% 54% 46%
Rochester NY 50 1,030 364 64 2% 67 3 -28% 75 1.03 82 7 -1.0% W7am 1.06 77 83 3% 70 2% 55% 45%
Dayton OH 59 836 307 65 2% 66 1 -34% 65 1.03 73 8 -1.5% Th5pm 1.08 63 60 4% 63 3% 43% 57%
Scranton-Wilkes-Barre PA 90 549 298 66 2% 61 -5 -46% 64 1.03 64 0 -2.2% F4pm 1.07 67 51 5% 60 3% 39% 61%
Akron OH 71 699 313 67 2% 65 -2 -42% 74 1.03 74 0 -1.9% T7am 1.07 69 74 3% 71 2% 49% 51%
Stockton CA 76 671 261 68 2% 63 -5 -52% 70 1.03 55 -15 -3.2% F4pm 1.07 66 52 5% 62 3% 35% 65%
Ogden-Clearfield UT 96 518 144 69 2% 64 -5 -50% 41 1.06 32 -9 -5.0% F5pm 1.16 37 92 2% 82 2% 57% 43%
Madison WI 89 556 394 70 1% 73 3 -40% 85 1.02 88 3 -1.2% T5pm 1.04 89 77 3% 76 2% 45% 55%
Charleston-North Charleston SC 81 630 90 71 1% 71 0 -45% 34 1.08 27 -7 -4.7% Th5pm 1.20 29 98 1% 89 1% 63% 37%
Chattanooga TN-GA 97 515 200 72 1% 81 9 -37% 61 1.03 71 10 -1.5% F5pm 1.12 47 80 3% 79 2% 44% 56%
Grand Rapids-Wyoming MI 66 777 218 73 1% 87 14 -27% 73 1.03 77 4 -1.3% F5pm 1.07 72 70 4% 73 2% 37% 63%
Lakeland FL 87 575 198 74 1% 74 0 -47% 67 1.03 60 -7 -2.5% Su5am 1.09 61 42 7% 57 3% 24% 76%
Albany-Schenectady-Troy NY 57 853 289 75 1% 72 -3 -49% 82 1.02 79 -3 -1.9% F5pm 1.05 82 90 2% 85 2% 49% 51%
Knoxville TN 75 682 192 76 1% 77 1 -42% 63 1.03 65 2 -2.1% F5pm 1.09 57 81 3% 81 2% 42% 58%
Omaha-Council Bluffs NE-IA 61 830 306 77 1% 83 6 -36% 83 1.02 91 8 -1.0% F5pm 1.05 85 75 3% 80 2% 40% 60%
Des Moines-West Des Moines IA 91 547 314 78 1% 88 10 -29% 84 1.02 96 12 -0.8% F5pm 1.04 91 68 4% 74 2% 35% 65%
Syracuse NY 80 645 336 79 1% 85 6 -36% 92 1.02 97 5 -0.9% T8am 1.03 97 82 3% 83 2% 41% 59%
Tucson AZ 52 967 192 80 1% 70 -10 -57% 72 1.03 52 -20 -3.6% T9am 1.08 62 61 4% 69 2% 31% 69%
Boise City-Nampa ID 86 588 124 81 1% 79 -2 -47% 47 1.05 44 -3 -3.5% Th5pm 1.13 44 99 1% 95 1% 63% 37%
Bakersfield CA 64 791 353 82 1% 80 -2 -48% 95 1.02 94 -1.2% M8pm 1.03 96 55 5% 66 3% 28% 72%
Columbia SC 69 716 316 83 1% 75 -8 -52% 90 1.02 84 -6 -1.7% F5pm 1.05 84 79 3% 84 2% 39% 61%
Cape Coral-Fort Myers FL 85 591 123 84 1% 82 -2 -52% 51 1.04 43 -8 -4.3% T9am 1.12 46 65 4% 75 2% 29% 71%
Youngstown-Warren-Boardman OH-PA 88 571 305 85 1% 86 1 -44% 93 1.02 93 0 -1.2% T10am 1.02 98 71 4% 77 2% 32% 68%
Poughkeepsie-Newburgh-Middletown NY 77 670 266 86 1% 84 -2 -46% 86 1.02 85 -1.4% F5pm 1.05 86 62 4% 72 2% 28% 72%
Greenville-Mauldin-Easley SC 82 614 185 87 1% 95 8 -25% 79 1.02 89 10 -0.7% Th5pm 1.04 87 94 2% 94 1% 47% 53%
Palm Bay-Melbourne-Titusville FL 92 536 190 88 1% 93 5 -32% 81 1.02 86 5 -1.0% M11am 1.05 83 69 4% 78 2% 28% 72%
Wichita KS 84 596 367 89 1% 94 5 -29% 98 1.01 100 2 -0.4% T10am 1.02 100 87 3% 88 2% 36% 64%
Springfield MA 74 683 202 90 1% 89 -51% 87 1.02 80 -7 -2.1% F5pm 1.07 71 84 3% 86 2% 31% 69%
Fresno CA 55 899 117 91 1% 91 0 -51% 71 1.03 58 -13 -2.8% W7am 1.05 80 93 2% 92 1% 37% 63%
Augusta-Richmond County GA-SC 95 529 198 92 1% 96 4 -38% 89 1.02 95 6 -1.0% Th5pm 1.04 93 88 2% 91 1% 34% 66%
Colorado Springs CO 83 609 105 93 1% 76 -17 -68% 60 1.03 34 -26 -6.6% F5pm 1.13 42 95 2% 98 1% 43% 57%
Portland-South Portland-Biddeford ME 98 513 203 94 1% 97 3 -37% 94 1.02 99 5 -0.9% F5pm 1.04 88 85 3% 90 1% 29% 71%
McAllen-Edinburg-Mission TX 70 711 84 95 1% 98 3 -41% 54 1.03 61 7 -2.0% F5pm 1.06 75 96 2% 99 1% 38% 62%
Greensboro-High Point NC 72 698 272 96 1% 90 -6 -63% 99 1.01 98 -1.6% W8pm 1.02 99 89 2% 93 1% 29% 71%
Toledo OH 79 651 207 97 0% 78 -19 -76% 97 1.01 67 -30 -3.8% T9am 1.03 95 91 2% 97 1% 29% 71%
Sarasota-Bradenton-Venice FL 73 687 168 98 0% 92 -6 -70% 96 1.01 78 -18 -2.8% F5pm 1.04 90 73 3% 87 2% 18% 82%
Deltona-Daytona Beach-Ormond Beach FL 100 500 157 99 0% 99 0 -70% 100 1.01 90 -10 -2.1% Su1pm 1.03 94 86 3% 96 1% 16% 84%
Modesto CA 99 511 52 100 0% 100 0 -51% 88 1.02 83 -5 -1.8% F5pm 1.05 81 100 1% 100 0% 27% 73%
16
National Traffic Scorecard 2008 Annual Report
Metropolitan Rankings
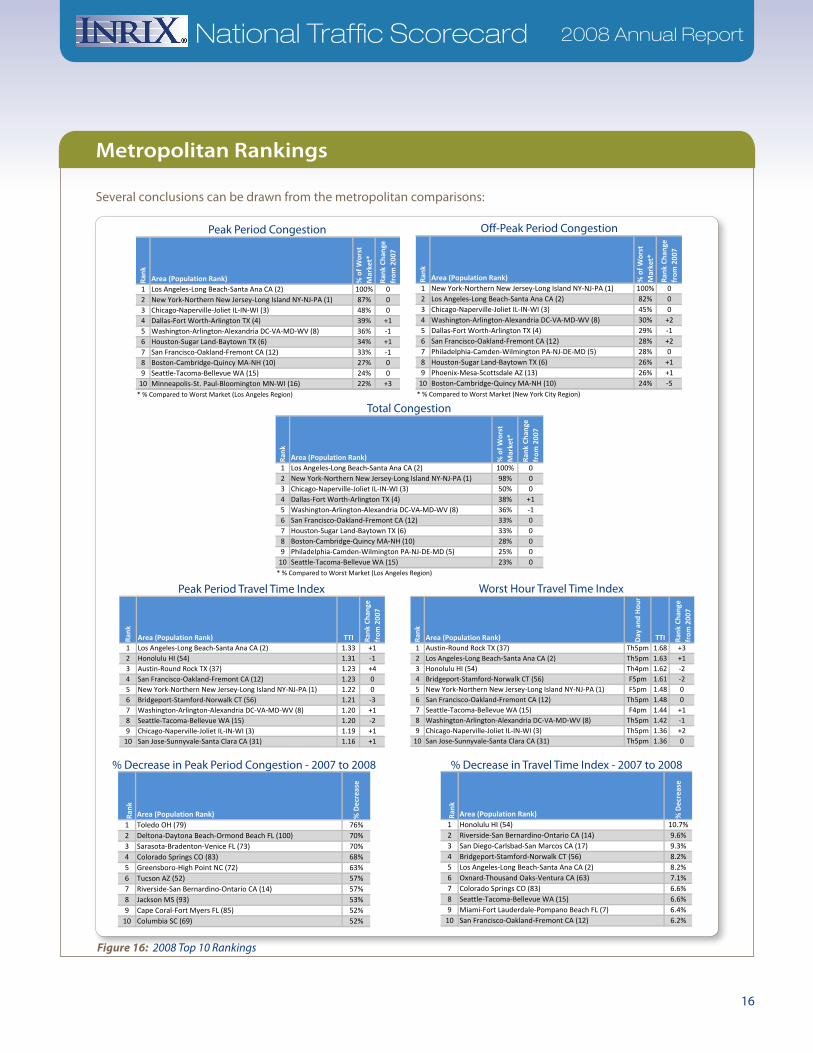
Several conclusions can be drawn from the metropolitan comparisons:
Rank
Area (Population Rank) % o
f Wor
st
Mar
ket*
Rank
Cha
nge
from
200
7
1 Los Angeles-Long Beach-Santa Ana CA (2) 100% 02 New York-Northern New Jersey-Long Island NY-NJ-PA (1) 87% 03 Chicago-Naperville-Joliet IL-IN-WI (3) 48% 04 Dallas-Fort Worth-Arlington TX (4) 39% +15 Washington-Arlington-Alexandria DC-VA-MD-WV (8) 36% -16 Houston-Sugar Land-Baytown TX (6) 34% +17 San Francisco-Oakland-Fremont CA (12) 33% -18 Boston-Cambridge-Quincy MA-NH (10) 27% 09 Seattle-Tacoma-Bellevue WA (15) 24% 0
10 Minneapolis-St. Paul-Bloomington MN-WI (16) 22% +3* % Compared to Worst Market (Los Angeles Region)
Peak Period Congestion
Rank
Area (Population Rank) % o
f Wor
st
Mar
ket*
Rank
Cha
nge
from
200
7
1 New York-Northern New Jersey-Long Island NY-NJ-PA (1) 100% 02 Los Angeles-Long Beach-Santa Ana CA (2) 82% 03 Chicago-Naperville-Joliet IL-IN-WI (3) 45% 04 Washington-Arlington-Alexandria DC-VA-MD-WV (8) 30% +25 Dallas-Fort Worth-Arlington TX (4) 29% -16 San Francisco-Oakland-Fremont CA (12) 28% +27 Philadelphia-Camden-Wilmington PA-NJ-DE-MD (5) 28% 08 Houston-Sugar Land-Baytown TX (6) 26% +19 Phoenix-Mesa-Scottsdale AZ (13) 26% +1
10 Boston-Cambridge-Quincy MA-NH (10) 24% -5* % Compared to Worst Market (New York City Region)
Off-Peak Period Congestion
Rank
Area (Population Rank) % o
f Wor
st
Mar
ket*
Rank
Cha
nge
from
200
7
1 Los Angeles-Long Beach-Santa Ana CA (2) 100% 02 New York-Northern New Jersey-Long Island NY-NJ-PA (1) 98% 03 Chicago-Naperville-Joliet IL-IN-WI (3) 50% 04 Dallas-Fort Worth-Arlington TX (4) 38% +15 Washington-Arlington-Alexandria DC-VA-MD-WV (8) 36% -16 San Francisco-Oakland-Fremont CA (12) 33% 07 Houston-Sugar Land-Baytown TX (6) 33% 08 Boston-Cambridge-Quincy MA-NH (10) 28% 09 Philadelphia-Camden-Wilmington PA-NJ-DE-MD (5) 25% 0
10 Seattle-Tacoma-Bellevue WA (15) 23% 0* % Compared to Worst Market (Los Angeles Region)
Total Congestion
Rank
Area (Population Rank) TTI Rank
Cha
nge
from
200
7
1 Los Angeles-Long Beach-Santa Ana CA (2) 1.33 +12 Honolulu HI (54) 1.31 -13 Austin-Round Rock TX (37) 1.23 +44 San Francisco-Oakland-Fremont CA (12) 1.23 05 New York-Northern New Jersey-Long Island NY-NJ-PA (1) 1.22 06 Bridgeport-Stamford-Norwalk CT (56) 1.21 -37 Washington-Arlington-Alexandria DC-VA-MD-WV (8) 1.20 +18 Seattle-Tacoma-Bellevue WA (15) 1.20 -29 Chicago-Naperville-Joliet IL-IN-WI (3) 1.19 +1
10 San Jose-Sunnyvale-Santa Clara CA (31) 1.16 +1
Peak Period Travel Time Index
Rank
Area (Population Rank) Day
and
Hou
rTTI Ra
nk C
hang
e fr
om 2
007
1 Austin-Round Rock TX (37) Th5pm 1.68 +32 Los Angeles-Long Beach-Santa Ana CA (2) Th5pm 1.63 +13 Honolulu HI (54) Th4pm 1.62 -24 Bridgeport-Stamford-Norwalk CT (56) F5pm 1.61 -25 New York-Northern New Jersey-Long Island NY-NJ-PA (1) F5pm 1.48 06 San Francisco-Oakland-Fremont CA (12) Th5pm 1.48 07 Seattle-Tacoma-Bellevue WA (15) F4pm 1.44 +18 Washington-Arlington-Alexandria DC-VA-MD-WV (8) Th5pm 1.42 -19 Chicago-Naperville-Joliet IL-IN-WI (3) Th5pm 1.36 +2
10 San Jose-Sunnyvale-Santa Clara CA (31) Th5pm 1.36 0
Worst Hour Travel Time Index
Figure 16: 2008 Top 10 Rankings
Rank
Area (Population Rank) % D
ecre
ase
1 Honolulu HI (54) 10.7%2 Riverside-San Bernardino-Ontario CA (14) 9.6%3 San Diego-Carlsbad-San Marcos CA (17) 9.3%4 Bridgeport-Stamford-Norwalk CT (56) 8.2%5 Los Angeles-Long Beach-Santa Ana CA (2) 8.2%6 Oxnard-Thousand Oaks-Ventura CA (63) 7.1%7 Colorado Springs CO (83) 6.6%8 Seattle-Tacoma-Bellevue WA (15) 6.6%9 Miami-Fort Lauderdale-Pompano Beach FL (7) 6.4%
10 San Francisco-Oakland-Fremont CA (12) 6.2%
% Decrease in Travel Time Index - 2007 to 2008
Rank
Area (Population Rank) % D
ecre
ase
1 Toledo OH (79) 76%2 Deltona-Daytona Beach-Ormond Beach FL (100) 70%3 Sarasota-Bradenton-Venice FL (73) 70%4 Colorado Springs CO (83) 68%5 Greensboro-High Point NC (72) 63%6 Tucson AZ (52) 57%7 Riverside-San Bernardino-Ontario CA (14) 57%8 Jackson MS (93) 53%9 Cape Coral-Fort Myers FL (85) 52%
10 Columbia SC (69) 52%
% Decrease in Peak Period Congestion - 2007 to 2008
17
National Traffic Scorecard 2008 Annual Report
Metropolitan Rankings
In almost all cases, when a region moved up a list, it was due to less congestion reduction than its peer •
regions in that category. For example, despite a 20% drop in congestion, the Minneapolis-St. Paul region
moved from 13th to 10th in total congestion, passing Atlanta, Miami, and Philadelphia.
99 of the 100 regions saw congestion levels decrease. Baton Rouge, LA, with a 6% increase in overall •
congestion, was the only region with an increase from 2007, shooting it up the metropolitan rankings from
47th to 33rd in overall congestion.
Los Angeles moved ahead of Honolulu with the highest metropolitan Travel Time Index. Honolulu’s 34% •
drop in congestion lowered its Travel Time Index from 1.45 to 1.31, while Los Angeles’ 23% drop lowered its
TTI from 1.44 to 1.33.
The largest drops in congestion by percentage are dominated by metropolitan areas of less than 1 million •
people. Many had modest congestion in 2007 when compared to larger regions, so modest drops in
congestion resulted in larger percentage drops than the larger areas.
The largest drops in congestion and rankings of the “big cities” included the Atlanta, Miami, Detroit, San •
Diego and the “Inland Empire” (Riverside-San Bernardino-Ontario) region of California, all having drops in
peak hour congestion of at least 36% from 2007.
Overall, while congestion clearly dropped across the country, this drop was not uniform across all regions, and
depending upon where one lives or when they travel, congestion – though likely better than in 2007 – was still
substantial.
18
National Traffic Scorecard 2008 Annual Report
National Traffic Scorecard 2008 Annual Report
Bottlenecks
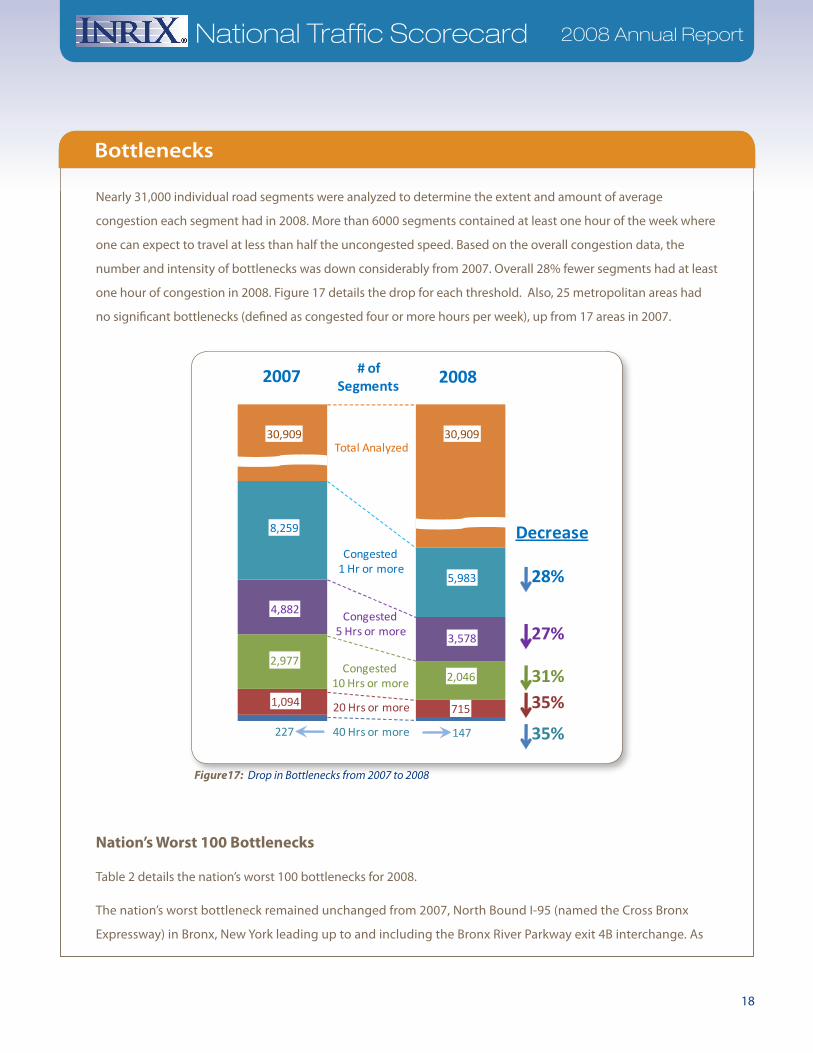
Nearly 31,000 individual road segments were analyzed to determine the extent and amount of average
congestion each segment had in 2008. More than 6000 segments contained at least one hour of the week where
one can expect to travel at less than half the uncongested speed. Based on the overall congestion data, the
number and intensity of bottlenecks was down considerably from 2007. Overall 28% fewer segments had at least
one hour of congestion in 2008. Figure 17 details the drop for each threshold. Also, 25 metropolitan areas had
no significant bottlenecks (defined as congested four or more hours per week), up from 17 areas in 2007.
Nation’s Worst 100 Bottlenecks
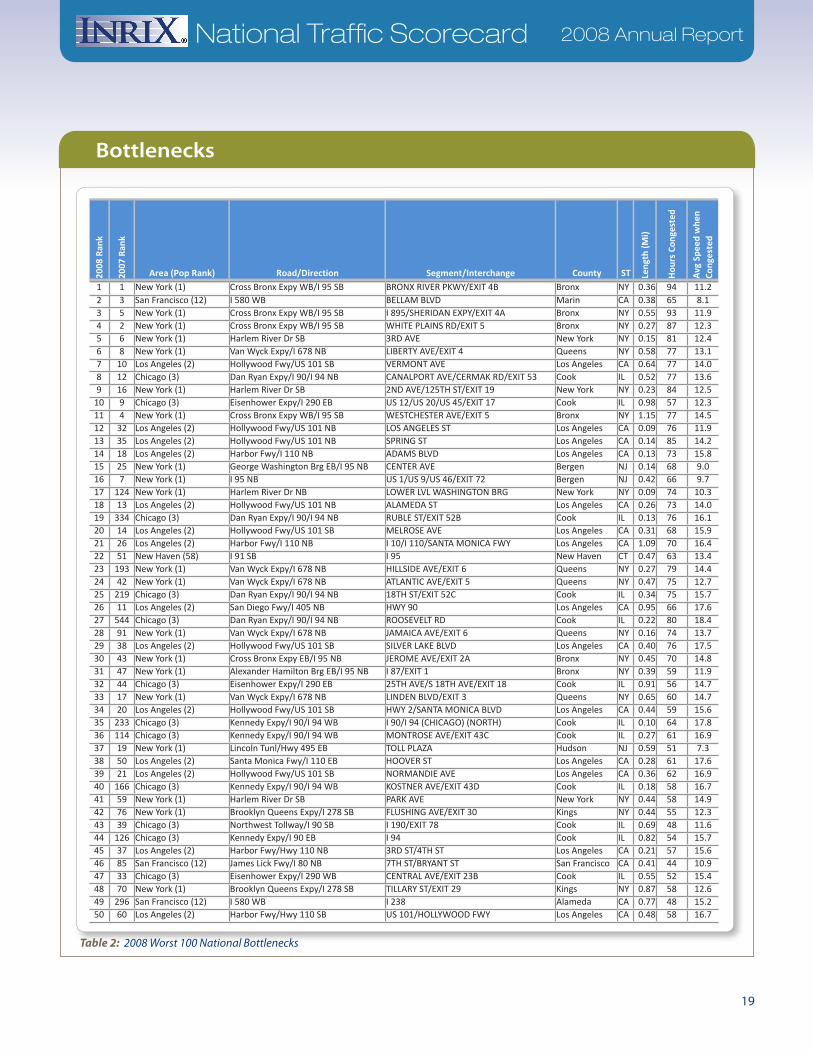
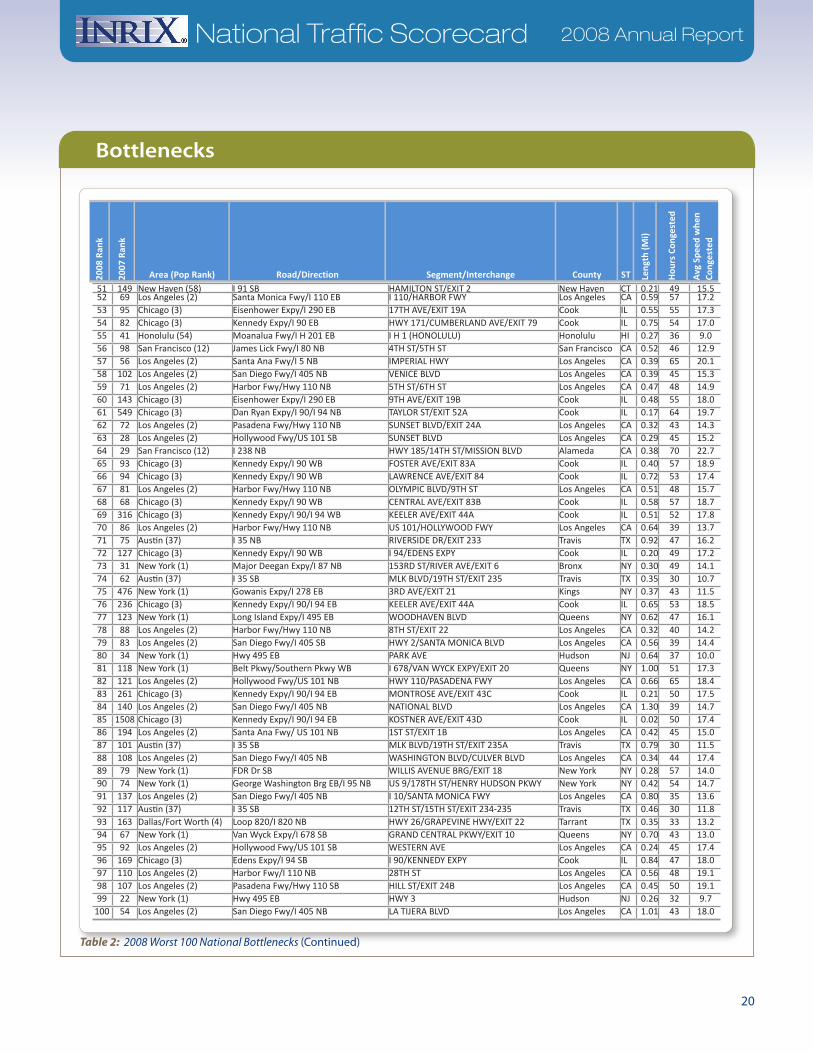
Table 2 details the nation’s worst 100 bottlenecks for 2008.
The nation’s worst bottleneck remained unchanged from 2007, North Bound I-95 (named the Cross Bronx
Expressway) in Bronx, New York leading up to and including the Bronx River Parkway exit 4B interchange. As
Figure17: Drop in Bottlenecks from 2007 to 2008
2007
Total Analyzed
Congested 1 Hr or more
2008# of Segments
Congested 5 Hrs or more
Congested 10 Hrs or more
20 Hrs or more
40 Hrs or more
30,909 30,909
5,983
8,259
4,882
3,578
2,0462,977
1,094 715
227 147
Decrease
28%
27%
31%35%
35%
19
National Traffic Scorecard 2008 Annual Report
Bottlenecks
Table 2: 2008 Worst 100 National Bottlenecks
1 1 New York (1) Cross Bronx Expy WB/I 95 SB BRONX RIVER PKWY/EXIT 4B Bronx NY 0.36 94 11.22 3 San Francisco (12) I 580 WB BELLAM BLVD Marin CA 0.38 65 8.13 5 New York (1) Cross Bronx Expy WB/I 95 SB I 895/SHERIDAN EXPY/EXIT 4A Bronx NY 0.55 93 11.94 2 New York (1) Cross Bronx Expy WB/I 95 SB WHITE PLAINS RD/EXIT 5 Bronx NY 0.27 87 12.35 6 New York (1) Harlem River Dr SB 3RD AVE New York NY 0.15 81 12.46 8 New York (1) Van Wyck Expy/I 678 NB LIBERTY AVE/EXIT 4 Queens NY 0.58 77 13.17 10 Los Angeles (2) Hollywood Fwy/US 101 SB VERMONT AVE Los Angeles CA 0.64 77 14.08 12 Chicago (3) Dan Ryan Expy/I 90/I 94 NB CANALPORT AVE/CERMAK RD/EXIT 53 Cook IL 0.52 77 13.69 16 New York (1) Harlem River Dr SB 2ND AVE/125TH ST/EXIT 19 New York NY 0.23 84 12.5
10 9 Chicago (3) Eisenhower Expy/I 290 EB US 12/US 20/US 45/EXIT 17 Cook IL 0.98 57 12.311 4 New York (1) Cross Bronx Expy WB/I 95 SB WESTCHESTER AVE/EXIT 5 Bronx NY 1.15 77 14.512 32 Los Angeles (2) Hollywood Fwy/US 101 NB LOS ANGELES ST Los Angeles CA 0.09 76 11.913 35 Los Angeles (2) Hollywood Fwy/US 101 NB SPRING ST Los Angeles CA 0.14 85 14.214 18 Los Angeles (2) Harbor Fwy/I 110 NB ADAMS BLVD Los Angeles CA 0.13 73 15.815 25 New York (1) George Washington Brg EB/I 95 NB CENTER AVE Bergen NJ 0.14 68 9.016 7 New York (1) I 95 NB US 1/US 9/US 46/EXIT 72 Bergen NJ 0.42 66 9.717 124 New York (1) Harlem River Dr NB LOWER LVL WASHINGTON BRG New York NY 0.09 74 10.318 13 Los Angeles (2) Hollywood Fwy/US 101 NB ALAMEDA ST Los Angeles CA 0.26 73 14.019 334 Chicago (3) Dan Ryan Expy/I 90/I 94 NB RUBLE ST/EXIT 52B Cook IL 0.13 76 16.120 14 Los Angeles (2) Hollywood Fwy/US 101 SB MELROSE AVE Los Angeles CA 0.31 68 15.921 26 Los Angeles (2) Harbor Fwy/I 110 NB I 10/I 110/SANTA MONICA FWY Los Angeles CA 1.09 70 16.422 51 New Haven (58) I 91 SB I 95 New Haven CT 0.47 63 13.423 193 New York (1) Van Wyck Expy/I 678 NB HILLSIDE AVE/EXIT 6 Queens NY 0.27 79 14.424 42 New York (1) Van Wyck Expy/I 678 NB ATLANTIC AVE/EXIT 5 Queens NY 0.47 75 12.725 219 Chicago (3) Dan Ryan Expy/I 90/I 94 NB 18TH ST/EXIT 52C Cook IL 0.34 75 15.726 11 Los Angeles (2) San Diego Fwy/I 405 NB HWY 90 Los Angeles CA 0.95 66 17.627 544 Chicago (3) Dan Ryan Expy/I 90/I 94 NB ROOSEVELT RD Cook IL 0.22 80 18.428 91 New York (1) Van Wyck Expy/I 678 NB JAMAICA AVE/EXIT 6 Queens NY 0.16 74 13.729 38 Los Angeles (2) Hollywood Fwy/US 101 SB SILVER LAKE BLVD Los Angeles CA 0.40 76 17.530 43 New York (1) Cross Bronx Expy EB/I 95 NB JEROME AVE/EXIT 2A Bronx NY 0.45 70 14.831 47 New York (1) Alexander Hamilton Brg EB/I 95 NB I 87/EXIT 1 Bronx NY 0.39 59 11.932 44 Chicago (3) Eisenhower Expy/I 290 EB 25TH AVE/S 18TH AVE/EXIT 18 Cook IL 0.91 56 14.733 17 New York (1) Van Wyck Expy/I 678 NB LINDEN BLVD/EXIT 3 Queens NY 0.65 60 14.734 20 Los Angeles (2) Hollywood Fwy/US 101 SB HWY 2/SANTA MONICA BLVD Los Angeles CA 0.44 59 15.635 233 Chicago (3) Kennedy Expy/I 90/I 94 WB I 90/I 94 (CHICAGO) (NORTH) Cook IL 0.10 64 17.836 114 Chicago (3) Kennedy Expy/I 90/I 94 WB MONTROSE AVE/EXIT 43C Cook IL 0.27 61 16.937 19 New York (1) Lincoln Tunl/Hwy 495 EB TOLL PLAZA Hudson NJ 0.59 51 7.338 50 Los Angeles (2) Santa Monica Fwy/I 110 EB HOOVER ST Los Angeles CA 0.28 61 17.639 21 Los Angeles (2) Hollywood Fwy/US 101 SB NORMANDIE AVE Los Angeles CA 0.36 62 16.940 166 Chicago (3) Kennedy Expy/I 90/I 94 WB KOSTNER AVE/EXIT 43D Cook IL 0.18 58 16.741 59 New York (1) Harlem River Dr SB PARK AVE New York NY 0.44 58 14.942 76 New York (1) Brooklyn Queens Expy/I 278 SB FLUSHING AVE/EXIT 30 Kings NY 0.44 55 12.343 39 Chicago (3) Northwest Tollway/I 90 SB I 190/EXIT 78 Cook IL 0.69 48 11.644 126 Chicago (3) Kennedy Expy/I 90 EB I 94 Cook IL 0.82 54 15.745 37 Los Angeles (2) Harbor Fwy/Hwy 110 NB 3RD ST/4TH ST Los Angeles CA 0.21 57 15.646 85 San Francisco (12) James Lick Fwy/I 80 NB 7TH ST/BRYANT ST San Francisco CA 0.41 44 10.947 33 Chicago (3) Eisenhower Expy/I 290 WB CENTRAL AVE/EXIT 23B Cook IL 0.55 52 15.448 70 New York (1) Brooklyn Queens Expy/I 278 SB TILLARY ST/EXIT 29 Kings NY 0.87 58 12.649 296 San Francisco (12) I 580 WB I 238 Alameda CA 0.77 48 15.250 60 Los Angeles (2) Harbor Fwy/Hwy 110 SB US 101/HOLLYWOOD FWY Los Angeles CA 0.48 58 16.7
2008
Ran
k
2007
Ran
k
Area (Pop Rank) Road/Direction Segment/Interchange County ST Leng
th (M
i)
Hou
rs C
onge
sted
Avg
Spe
ed w
hen
Cong
este
d
20
National Traffic Scorecard 2008 Annual Report
Bottlenecks
Table 2: 2008 Worst 100 National Bottlenecks (Continued)
51 149 New Haven (58) I 91 SB HAMILTON ST/EXIT 2 New Haven CT 0.21 49 15.552 69 Los Angeles (2) Santa Monica Fwy/I 110 EB I 110/HARBOR FWY Los Angeles CA 0.59 57 17.253 95 Chicago (3) Eisenhower Expy/I 290 EB 17TH AVE/EXIT 19A Cook IL 0.55 55 17.354 82 Chicago (3) Kennedy Expy/I 90 EB HWY 171/CUMBERLAND AVE/EXIT 79 Cook IL 0.75 54 17.055 41 Honolulu (54) Moanalua Fwy/I H 201 EB I H 1 (HONOLULU) Honolulu HI 0.27 36 9.056 98 San Francisco (12) James Lick Fwy/I 80 NB 4TH ST/5TH ST San Francisco CA 0.52 46 12.957 56 Los Angeles (2) Santa Ana Fwy/I 5 NB IMPERIAL HWY Los Angeles CA 0.39 65 20.158 102 Los Angeles (2) San Diego Fwy/I 405 NB VENICE BLVD Los Angeles CA 0.39 45 15.359 71 Los Angeles (2) Harbor Fwy/Hwy 110 NB 5TH ST/6TH ST Los Angeles CA 0.47 48 14.960 143 Chicago (3) Eisenhower Expy/I 290 EB 9TH AVE/EXIT 19B Cook IL 0.48 55 18.061 549 Chicago (3) Dan Ryan Expy/I 90/I 94 NB TAYLOR ST/EXIT 52A Cook IL 0.17 64 19.762 72 Los Angeles (2) Pasadena Fwy/Hwy 110 NB SUNSET BLVD/EXIT 24A Los Angeles CA 0.32 43 14.363 28 Los Angeles (2) Hollywood Fwy/US 101 SB SUNSET BLVD Los Angeles CA 0.29 45 15.264 29 San Francisco (12) I 238 NB HWY 185/14TH ST/MISSION BLVD Alameda CA 0.38 70 22.765 93 Chicago (3) Kennedy Expy/I 90 WB FOSTER AVE/EXIT 83A Cook IL 0.40 57 18.966 94 Chicago (3) Kennedy Expy/I 90 WB LAWRENCE AVE/EXIT 84 Cook IL 0.72 53 17.467 81 Los Angeles (2) Harbor Fwy/Hwy 110 NB OLYMPIC BLVD/9TH ST Los Angeles CA 0.51 48 15.768 68 Chicago (3) Kennedy Expy/I 90 WB CENTRAL AVE/EXIT 83B Cook IL 0.58 57 18.769 316 Chicago (3) Kennedy Expy/I 90/I 94 WB KEELER AVE/EXIT 44A Cook IL 0.51 52 17.870 86 Los Angeles (2) Harbor Fwy/Hwy 110 NB US 101/HOLLYWOOD FWY Los Angeles CA 0.64 39 13.771 75 Austin (37) I 35 NB RIVERSIDE DR/EXIT 233 Travis TX 0.92 47 16.272 127 Chicago (3) Kennedy Expy/I 90 WB I 94/EDENS EXPY Cook IL 0.20 49 17.273 31 New York (1) Major Deegan Expy/I 87 NB 153RD ST/RIVER AVE/EXIT 6 Bronx NY 0.30 49 14.174 62 Austin (37) I 35 SB MLK BLVD/19TH ST/EXIT 235 Travis TX 0.35 30 10.775 476 New York (1) Gowanis Expy/I 278 EB 3RD AVE/EXIT 21 Kings NY 0.37 43 11.576 236 Chicago (3) Kennedy Expy/I 90/I 94 EB KEELER AVE/EXIT 44A Cook IL 0.65 53 18.577 123 New York (1) Long Island Expy/I 495 EB WOODHAVEN BLVD Queens NY 0.62 47 16.178 88 Los Angeles (2) Harbor Fwy/Hwy 110 NB 8TH ST/EXIT 22 Los Angeles CA 0.32 40 14.279 83 Los Angeles (2) San Diego Fwy/I 405 SB HWY 2/SANTA MONICA BLVD Los Angeles CA 0.56 39 14.480 34 New York (1) Hwy 495 EB PARK AVE Hudson NJ 0.64 37 10.081 118 New York (1) Belt Pkwy/Southern Pkwy WB I 678/VAN WYCK EXPY/EXIT 20 Queens NY 1.00 51 17.382 121 Los Angeles (2) Hollywood Fwy/US 101 NB HWY 110/PASADENA FWY Los Angeles CA 0.66 65 18.483 261 Chicago (3) Kennedy Expy/I 90/I 94 EB MONTROSE AVE/EXIT 43C Cook IL 0.21 50 17.584 140 Los Angeles (2) San Diego Fwy/I 405 NB NATIONAL BLVD Los Angeles CA 1.30 39 14.785 1508 Chicago (3) Kennedy Expy/I 90/I 94 EB KOSTNER AVE/EXIT 43D Cook IL 0.02 50 17.486 194 Los Angeles (2) Santa Ana Fwy/ US 101 NB 1ST ST/EXIT 1B Los Angeles CA 0.42 45 15.087 101 Austin (37) I 35 SB MLK BLVD/19TH ST/EXIT 235A Travis TX 0.79 30 11.588 108 Los Angeles (2) San Diego Fwy/I 405 NB WASHINGTON BLVD/CULVER BLVD Los Angeles CA 0.34 44 17.489 79 New York (1) FDR Dr SB WILLIS AVENUE BRG/EXIT 18 New York NY 0.28 57 14.090 74 New York (1) George Washington Brg EB/I 95 NB US 9/178TH ST/HENRY HUDSON PKWY New York NY 0.42 54 14.791 137 Los Angeles (2) San Diego Fwy/I 405 NB I 10/SANTA MONICA FWY Los Angeles CA 0.80 35 13.692 117 Austin (37) I 35 SB 12TH ST/15TH ST/EXIT 234-235 Travis TX 0.46 30 11.893 163 Dallas/Fort Worth (4) Loop 820/I 820 NB HWY 26/GRAPEVINE HWY/EXIT 22 Tarrant TX 0.35 33 13.294 67 New York (1) Van Wyck Expy/I 678 SB GRAND CENTRAL PKWY/EXIT 10 Queens NY 0.70 43 13.095 92 Los Angeles (2) Hollywood Fwy/US 101 SB WESTERN AVE Los Angeles CA 0.24 45 17.496 169 Chicago (3) Edens Expy/I 94 SB I 90/KENNEDY EXPY Cook IL 0.84 47 18.097 110 Los Angeles (2) Harbor Fwy/I 110 NB 28TH ST Los Angeles CA 0.56 48 19.198 107 Los Angeles (2) Pasadena Fwy/Hwy 110 SB HILL ST/EXIT 24B Los Angeles CA 0.45 50 19.199 22 New York (1) Hwy 495 EB HWY 3 Hudson NJ 0.26 32 9.7
100 54 Los Angeles (2) San Diego Fwy/I 405 NB LA TIJERA BLVD Los Angeles CA 1.01 43 18.0
2008
Ran
k
2007
Ran
k
Area (Pop Rank) Road/Direction Segment/Interchange County ST Leng
th (M
i)
Hou
rs C
onge
sted
Avg
Spe
ed w
hen
Cong
este
d
21
National Traffic Scorecard 2008 Annual Report
10 http://www.dot.state.mn.us/metro/projects/unweave/ 11 http://www.dot.state.il.us/press/GOVDan%20Ryan.pdf
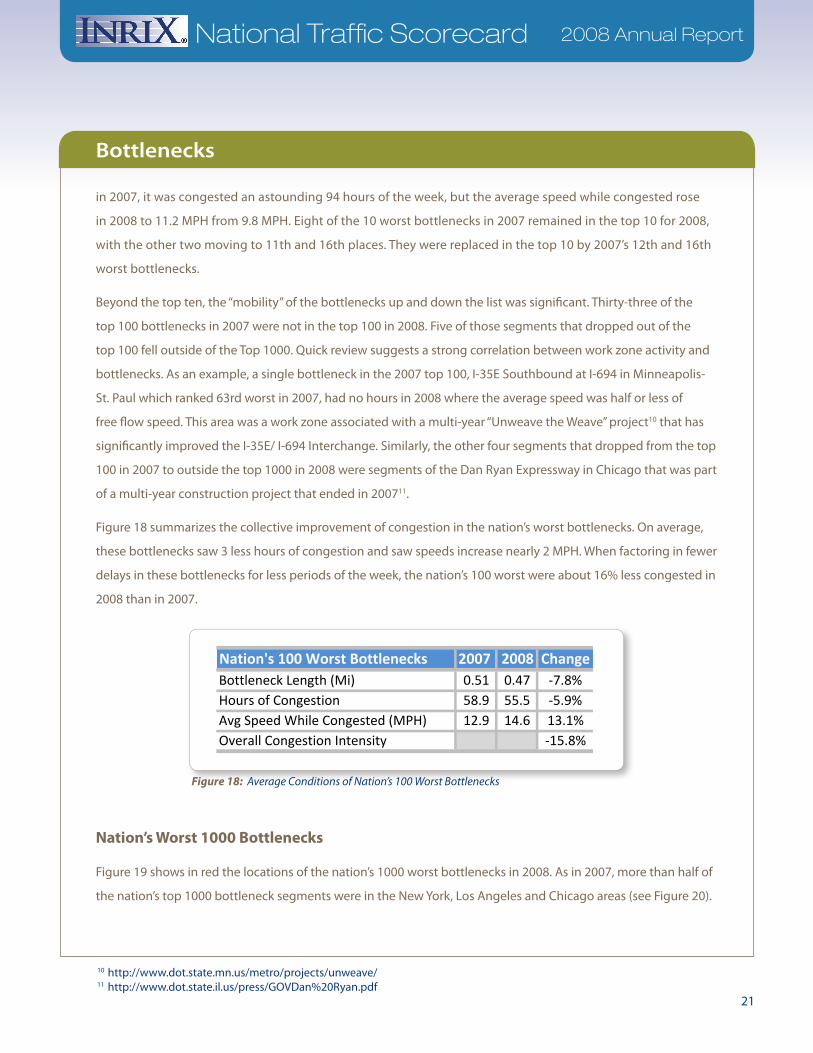
in 2007, it was congested an astounding 94 hours of the week, but the average speed while congested rose
in 2008 to 11.2 MPH from 9.8 MPH. Eight of the 10 worst bottlenecks in 2007 remained in the top 10 for 2008,
with the other two moving to 11th and 16th places. They were replaced in the top 10 by 2007’s 12th and 16th
worst bottlenecks.
Beyond the top ten, the “mobility” of the bottlenecks up and down the list was significant. Thirty-three of the
top 100 bottlenecks in 2007 were not in the top 100 in 2008. Five of those segments that dropped out of the
top 100 fell outside of the Top 1000. Quick review suggests a strong correlation between work zone activity and
bottlenecks. As an example, a single bottleneck in the 2007 top 100, I-35E Southbound at I-694 in Minneapolis-
St. Paul which ranked 63rd worst in 2007, had no hours in 2008 where the average speed was half or less of
free flow speed. This area was a work zone associated with a multi-year “Unweave the Weave” project10 that has
significantly improved the I-35E/ I-694 Interchange. Similarly, the other four segments that dropped from the top
100 in 2007 to outside the top 1000 in 2008 were segments of the Dan Ryan Expressway in Chicago that was part
of a multi-year construction project that ended in 200711.
Figure 18 summarizes the collective improvement of congestion in the nation’s worst bottlenecks. On average,
these bottlenecks saw 3 less hours of congestion and saw speeds increase nearly 2 MPH. When factoring in fewer
delays in these bottlenecks for less periods of the week, the nation’s 100 worst were about 16% less congested in
2008 than in 2007.
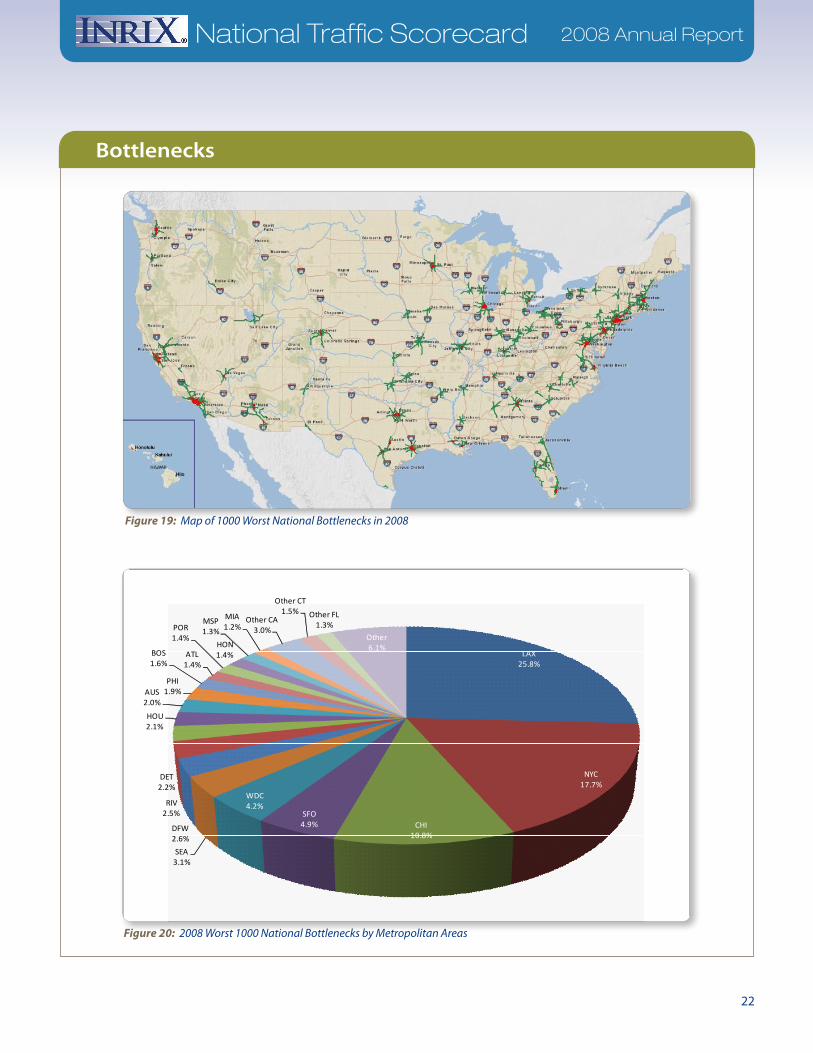
Nation’s Worst 1000 Bottlenecks
Figure 19 shows in red the locations of the nation’s 1000 worst bottlenecks in 2008. As in 2007, more than half of
the nation’s top 1000 bottleneck segments were in the New York, Los Angeles and Chicago areas (see Figure 20).
Bottlenecks
Figure 18: Average Conditions of Nation’s 100 Worst Bottlenecks
Nation's 100 Worst Bottlenecks 2007 2008 ChangeBottleneck Length (Mi) 0.51 0.47 -7.8%Hours of Congestion 58.9 55.5 -5.9%Avg Speed While Congested (MPH) 12.9 14.6 13.1%Overall Congestion Intensity -15.8%
22
National Traffic Scorecard 2008 Annual Report
Bottlenecks
LAX25.8%
NYC17.7%
CHI10.8%
SFO4.9%
WDC4.2%
SEA3.1%
DFW2.6%
RIV2.5%
DET2.2%
HOU2.1%
AUS2.0%
PHI1.9%
BOS1.6%
ATL1.4%
POR1.4%
HON1.4%
MSP1.3%
MIA1.2%
Other CA3.0%
Other CT1.5% Other FL
1.3%
Other6.1%
Figure 20: 2008 Worst 1000 National Bottlenecks by Metropolitan Areas
Figure 19: Map of 1000 Worst National Bottlenecks in 2008
23
National Traffic Scorecard 2008 Annual Report
12 http://www.dot.ca.gov/dist07/Publications/Inside7/story.php?id=99
Bottlenecks
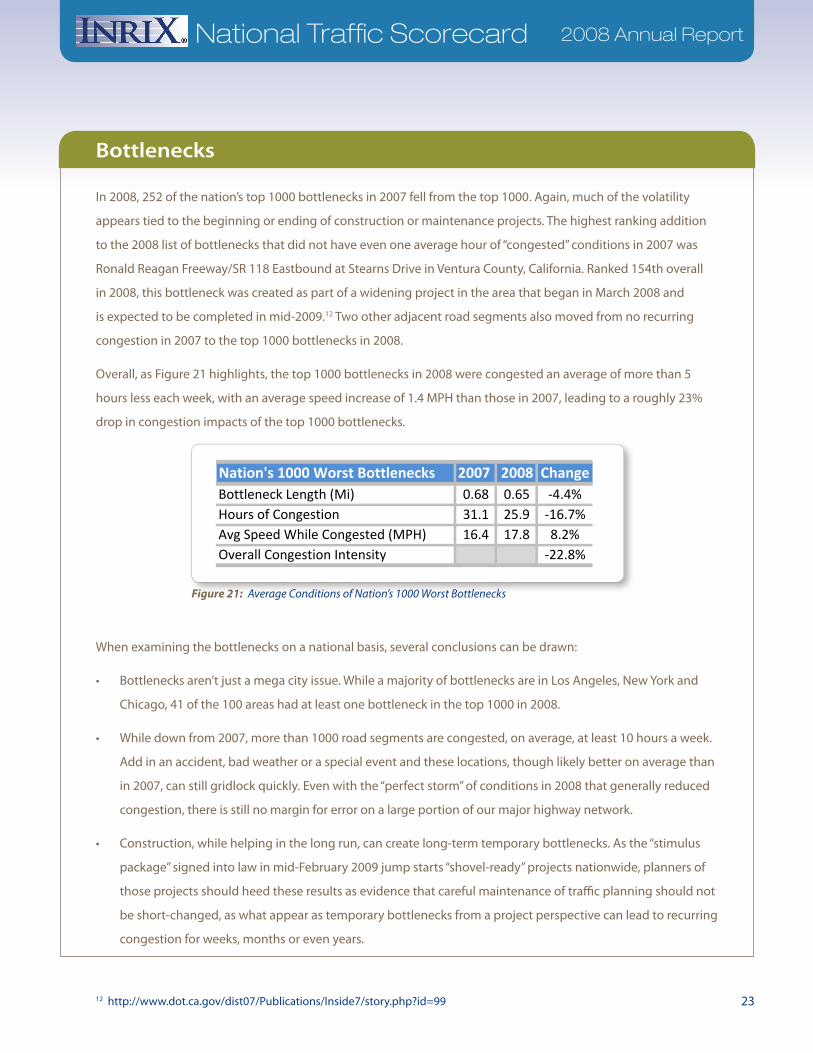
In 2008, 252 of the nation’s top 1000 bottlenecks in 2007 fell from the top 1000. Again, much of the volatility
appears tied to the beginning or ending of construction or maintenance projects. The highest ranking addition
to the 2008 list of bottlenecks that did not have even one average hour of “congested” conditions in 2007 was
Ronald Reagan Freeway/SR 118 Eastbound at Stearns Drive in Ventura County, California. Ranked 154th overall
in 2008, this bottleneck was created as part of a widening project in the area that began in March 2008 and
is expected to be completed in mid-2009.12 Two other adjacent road segments also moved from no recurring
congestion in 2007 to the top 1000 bottlenecks in 2008.
Overall, as Figure 21 highlights, the top 1000 bottlenecks in 2008 were congested an average of more than 5
hours less each week, with an average speed increase of 1.4 MPH than those in 2007, leading to a roughly 23%
drop in congestion impacts of the top 1000 bottlenecks.
When examining the bottlenecks on a national basis, several conclusions can be drawn:
Bottlenecks aren’t just a mega city issue. While a majority of bottlenecks are in Los Angeles, New York and •
Chicago, 41 of the 100 areas had at least one bottleneck in the top 1000 in 2008.
While down from 2007, more than 1000 road segments are congested, on average, at least 10 hours a week. •
Add in an accident, bad weather or a special event and these locations, though likely better on average than
in 2007, can still gridlock quickly. Even with the “perfect storm” of conditions in 2008 that generally reduced
congestion, there is still no margin for error on a large portion of our major highway network.
Construction, while helping in the long run, can create long-term temporary bottlenecks. As the “stimulus •
package” signed into law in mid-February 2009 jump starts “shovel-ready” projects nationwide, planners of
those projects should heed these results as evidence that careful maintenance of traffic planning should not
be short-changed, as what appear as temporary bottlenecks from a project perspective can lead to recurring
congestion for weeks, months or even years.
Figure 21: Average Conditions of Nation’s 1000 Worst Bottlenecks
Nation's 1000 Worst Bottlenecks 2007 2008 ChangeBottleneck Length (Mi) 0.68 0.65 -4.4%Hours of Congestion 31.1 25.9 -16.7%Avg Speed While Congested (MPH) 16.4 17.8 8.2%Overall Congestion Intensity -22.8%
24
National Traffic Scorecard 2008 Annual Report
Bottlenecks
Several of the individual road segments identified as bottlenecks are connected to other segments also •
identified as bottlenecks – basically corridor bottlenecks. While these may be associated with an upstream
interchange or geometric configuration issue, the length of these bottlenecks can be long and troubling
for drivers.
Moderate congestion can and does disappear. Perhaps since the birth of the interstate system, the national •
psyche has been conditioned to accept that congestion is bad, getting worse with little or no chance to stop
it. More than 2000 road segments that had at least one hour of congestion in 2007 had no identified recurring
congestion in 2008, clearly demonstrating that the march towards gridlock can be reversed. While the causes
of the decline in 2008 – lower demand due to fuel prices and lower economic activity – aren’t the most desired
ways to achieve these reductions, it does show that it is possible reverse the trend. Policies that can influence
demand at the right places and times may be able to show the same benefits.
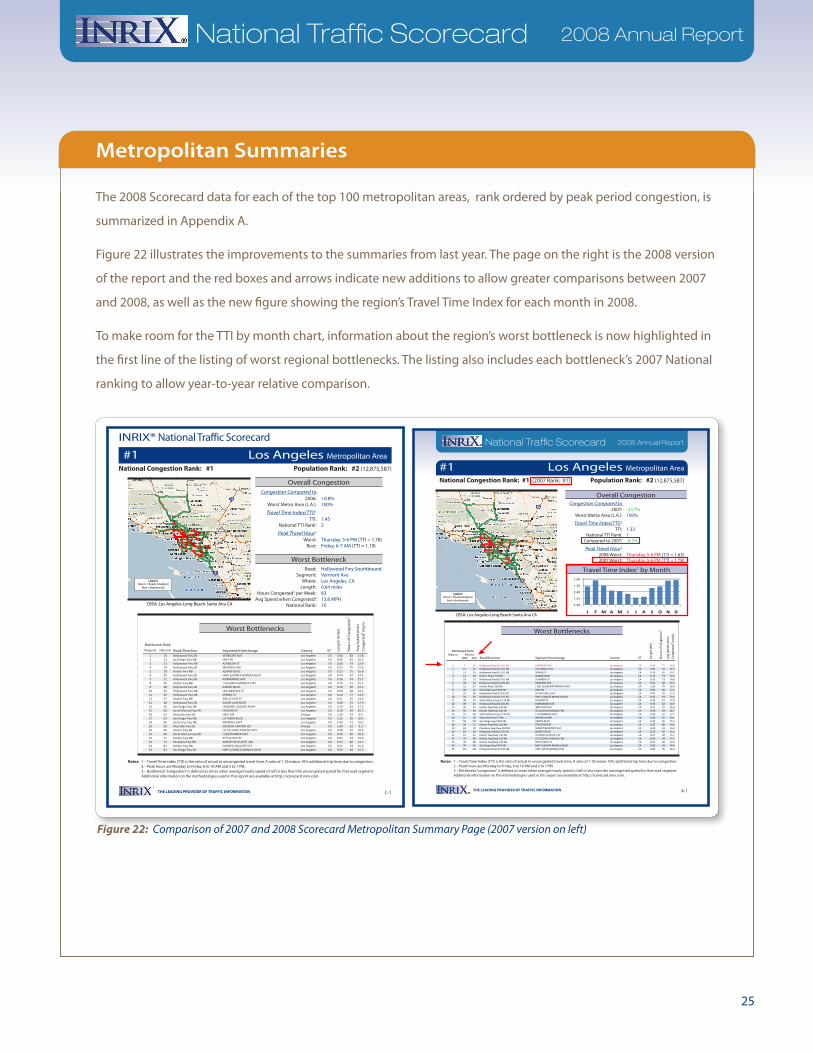
25
National Traffic Scorecard 2008 Annual Report
National Traffic Scorecard 2008 Annual Report
The 2008 Scorecard data for each of the top 100 metropolitan areas, rank ordered by peak period congestion, is
summarized in Appendix A.
Figure 22 illustrates the improvements to the summaries from last year. The page on the right is the 2008 version
of the report and the red boxes and arrows indicate new additions to allow greater comparisons between 2007
and 2008, as well as the new figure showing the region’s Travel Time Index for each month in 2008.
To make room for the TTI by month chart, information about the region’s worst bottleneck is now highlighted in
the first line of the listing of worst regional bottlenecks. The listing also includes each bottleneck’s 2007 National
ranking to allow year-to-year relative comparison.
Metropolitan Summaries
Figure 22: Comparison of 2007 and 2008 Scorecard Metropolitan Summary Page (2007 version on left)
THE LEADING PROVIDER OF TRAFFIC INFORMATION A-1
National Traffic Scorecard 2008 Annual Report
Notes: 1 – Travel Time Index (TTI) is the ratio of actual to uncongested travel time. A ratio of 1.10 means 10% additional trip time due to congestion. 2 – Peak hours are Monday to Friday, 6 to 10 AM and 3 to 7 PM. 3 – Bottleneck “congestion” is de�ned as times when average hourly speed is half or less than the uncongested speed for that road segment. Additional information on the methodologies used in this report are available at http://scorecard.inrix.com.
#1 Los Angeles Metropolitan Area
CBSA: Los Angeles-Long Beach-Santa Ana CA
National Congestion Rank: #1 (2007 Rank: #1) Population Rank: #2 (12,875,587)
Congestion Compared to 2007: -23.7% Worst Metro Area (L.A.): 100%
Travel Time Index(TTI)1
TTI: 1.33 National TTI Rank: 1 Compared to 2007: -8.2%
Peak Travel Hour2
2008 Worst: Thursday, 5-6 PM (TTI = 1.63) 2007 Worst: Thursday, 5-6 PM (TTI = 1.78)
1.20
1.25
1.30
1.35
1.40
J F M A M J J A S O N D
Regional 2008 2007 Road/Direction Segment/Interchange County ST
Bottleneck Rank L
engt
h (M
i)
Hou
rs o
f Con
gest
ion3
Avg
Spe
ed w
hen
Con
gest
ed3 (m
ph)
National
1 7 10 Hollywood Fwy/US 101 SB VERMONT AVE Los Angeles CA 0.64 77 14.02 12 32 Hollywood Fwy/US 101 NB LOS ANGELES ST Los Angeles CA 0.09 76 11.93 13 35 Hollywood Fwy/US 101 NB SPRING ST Los Angeles CA 0.14 85 14.24 14 18 Harbor Fwy/I 110 NB ADAMS BLVD Los Angeles CA 0.13 73 15.85 18 13 Hollywood Fwy/US 101 NB ALAMEDA ST Los Angeles CA 0.26 73 14.06 20 14 Hollywood Fwy/US 101 SB MELROSE AVE Los Angeles CA 0.31 68 15.97 21 27 Harbor Fwy/I 110 NB I 10/I 110/SANTA MONICA FWY Los Angeles CA 1.09 70 16.48 26 11 San Diego Fwy/I 405 NB HWY 90 Los Angeles CA 0.95 66 17.69 29 38 Hollywood Fwy/US 101 SB SILVER LAKE BLVD Los Angeles CA 0.40 76 17.5
10 34 20 Hollywood Fwy/US 101 SB HWY 2/SANTA MONICA BLVD Los Angeles CA 0.44 59 15.611 38 50 Santa Monica Fwy/I 110 EB HOOVER ST Los Angeles CA 0.28 61 17.612 39 21 Hollywood Fwy/US 101 SB NORMANDIE AVE Los Angeles CA 0.36 62 16.913 45 37 Harbor Fwy/Hwy 110 NB 3RD ST/4TH ST Los Angeles CA 0.21 57 15.614 50 60 Harbor Fwy/Hwy 110 SB US 101/HOLLYWOOD FWY Los Angeles CA 0.48 58 16.715 52 69 Santa Monica Fwy/I 110 EB I 110/HARBOR FWY Los Angeles CA 0.59 57 17.216 57 56 Santa Ana Fwy/I 5 NB IMPERIAL HWY Los Angeles CA 0.39 65 20.117 58 102 San Diego Fwy/I 405 NB VENICE BLVD Los Angeles CA 0.39 45 15.318 59 71 Harbor Fwy/Hwy 110 NB 5TH ST/6TH ST Los Angeles CA 0.47 48 14.919 62 72 Pasadena Fwy/Hwy 110 NB SUNSET BLVD/EXIT 24A Los Angeles CA 0.32 43 14.320 63 28 Hollywood Fwy/US 101 SB SUNSET BLVD Los Angeles CA 0.29 45 15.221 67 81 Harbor Fwy/Hwy 110 NB OLYMPIC BLVD/9TH ST Los Angeles CA 0.51 48 15.722 70 86 Harbor Fwy/Hwy 110 NB US 101/HOLLYWOOD FWY Los Angeles CA 0.64 39 13.723 78 88 Harbor Fwy/Hwy 110 NB 8TH ST/EXIT 22 Los Angeles CA 0.32 40 14.224 79 83 San Diego Fwy/I 405 SB HWY 2/SANTA MONICA BLVD Los Angeles CA 0.56 39 14.425 82 121 Hollywood Fwy/US 101 NB HWY 110/PASADENA FWY Los Angeles CA 0.66 65 18.4
Worst Bottlenecks
Overall Congestion
Travel Time Index1 by Month
LegendGreen = Roads Analyzed
Red = Bottlenecks
INRIX® National Traffic Scorecard
THE LEADING PROVIDER OF TRAFFIC INFORMATION
Notes: 1 – Travel Time Index (TTI) is the ratio of actual to uncongested travel time. A ratio of 1.10 means 10% additional trip time due to congestion.2 – Peak hours are Monday to Friday, 6 to 10 AM and 3 to 7 PM.3 – Bottleneck “congestion” is defined as times when average hourly speed is half or less than the uncongested speed for that road segment.Additional information on the methodologies used in this report are available at http://scorecard.inrix.com.
C-1
Regional National Road/Direction Segment/Interchange County ST
Bottleneck Rank
Len
gth
(mile
s)
Hou
rs o
f Con
gest
ion3
Avg
Spe
ed w
hen
Con
gest
ed3 (m
ph)
1 10 Hollywood Fwy SB VERMONT AVE Los Angeles CA 0.64 83 13.8
2 11 San Diego Fwy NB HWY 90 Los Angeles CA 0.95 81 16.5
3 13 Hollywood Fwy NB ALAMEDA ST Los Angeles CA 0.26 79 12.9
4 14 Hollywood Fwy SB MELROSE AVE Los Angeles CA 0.31 75 15.0
5 18 Harbor Fwy NB ADAMS BLVD Los Angeles CA 0.13 75 15.6
6 20 Hollywood Fwy SB HWY 2/SANTA MONICA BLVD Los Angeles CA 0.44 67 14.5
7 21 Hollywood Fwy SB NORMANDIE AVE Los Angeles CA 0.36 74 15.7
8 26 Harbor Fwy NB I 10/SANTA MONICA FWY Los Angeles CA 0.79 71 15.7
9 28 Hollywood Fwy SB SUNSET BLVD Los Angeles CA 0.29 56 13.1
10 32 Hollywood Fwy NB LOS ANGELES ST Los Angeles CA 0.09 68 12.2
11 35 Hollywood Fwy NB SPRING ST Los Angeles CA 0.14 77 14.5
12 37 Harbor Fwy NB 3RD ST/4TH ST Los Angeles CA 0.21 63 14.6
13 38 Hollywood Fwy SB SILVER LAKE BLVD Los Angeles CA 0.40 79 17.9
14 46 San Diego Fwy NB HOWARD HUGHES PKWY Los Angeles CA 0.73 61 17.2
15 50 Santa Monica Fwy EB HOOVER ST Los Angeles CA 0.28 59 16.7
16 53 Riverside Fwy EB HWY 241 Orange CA 2.26 33 9.4
17 54 San Diego Fwy NB LA TIJERA BLVD Los Angeles CA 1.01 56 16.4
18 56 Santa Ana Fwy NB IMPERIAL HWY Los Angeles CA 0.39 73 19.3
19 58 Riverside Fwy EB GYPSUM CANYON RD Orange CA 1.44 32 9.3
20 60 Harbor Fwy SB US 101/HOLLYWOOD FWY Los Angeles CA 0.48 62 16.4
21 69 Santa Monica Fwy EB I 110/HARBOR FWY Los Angeles CA 0.59 60 16.9
22 71 Harbor Fwy NB 5TH ST/6TH ST Los Angeles CA 0.47 54 15.0
23 72 Pasadena Fwy NB SUNSET BLVD/EXIT 24A Los Angeles CA 0.32 48 14.1
24 81 Harbor Fwy NB OLYMPIC BLVD/9TH ST Los Angeles CA 0.51 53 15.6
25 83 San Diego Fwy SB HWY 2/SANTA MONICA BLVD Los Angeles CA 0.56 48 15.2
#1 Los Angeles Metropolitan Area
Worst BottleneckRoad: Hollywood Fwy Southbound
Segment: Vermont AveWhere: Los Angeles, CA
Length: 0.64 milesHours Congested3 per Week: 83
Avg Speed when Congested3: 13.8 MPHNational Rank: 10
National Congestion Rank: #1 Population Rank: #2 (12,875,587)
Overall CongestionCongestion Compared to
2006: +0.8%Worst Metro Area (L.A.): 100%
Travel Time Index(TTI)1
TTI: 1.45National TTI Rank: 2
Peak Travel Hour2
Worst: Thursday, 5-6 PM (TTI = 1.78)Best: Friday, 6-7 AM (TTI = 1.19)
LegendGreen = Roads Analyzed
Red = Bottlenecks
CBSA: Los Angeles-Long Beach-Santa Ana CA
Worst Bottlenecks

26
National Traffic Scorecard 2008 Annual Report
National Traffic Scorecard 2008 Annual Report
Scorecard Relationship with Other Studies
As one would expect for an issue as relevant to our daily lives and economic system as traffic congestion, there
are many recently published studies on the issue. This Scorecard expands upon and complements these reports.
The following list is but a few of the notable recent reports:
2007 Annual Urban Mobility Report — (Texas Transportation Institute): http://mobility.tamu.edu/ums/
Unclogging America’s Arteries — : Effective Relief for Highway Bottlenecks 1999-2004 (American Highway
Users Alliance): http://www.highways.org/pdfs/bottleneck2004.pdf
Building Roads to Reduce Traffic Congestion in America’s Cities: How Much and at What Cost? — (Reason
Foundation): http://www.reason.org/ps346/state_by_state_congestion.pdf
Freight Performance Measurement: Travel Time in Freight-Significant Corridors — (Federal Highway
Administration): http://ops.fhwa.dot.gov/freight/freight_analysis/perform_meas/fpmtraveltime/index.htm
America’s Most Congested Cities — (Forbes Life Magazine): http://www.forbes.com/2008/04/10/congested-
commute-cities-forbeslife-cx_mw_0410realestate.html
Where the Commuting Nightmares Are — (bizjournals): http://www.bizjournals.com/edit_special/56.html
The Road…Less Traveled: An Analysis of Vehicle Miles Traveled Trends in the U.S. — : http://www.brookings.
edu/reports/2008/~/media/Files/rc/reports/2008/1216_transportation_tomer_puentes/vehicle_miles_
traveled_report.pdf
While the Scorecard shares some common elements with these reports, it also has several unique features.
Common elements•
The Scorecard adopts the common convention of peak period drive time hours of 6 – 10 AM and 3 – 7 PM, —
Monday through Friday.
The Travel Time Index concept is now a standard metric to measure conditions relative to uncongested, —
free flow situations.
Unique features•
This report is based on data, technology and processes that have been designed to optimize very quick —
turnaround times between the end of the data collection period and the publishing of the Scorecard.
Many of the reports utilize data that is many months or years old when published.
The Scorecard is completely based upon real data – tens of billions of data points from real consumer —
and commercial vehicles traveling on real road segments. It is not limited by sensor coverage nor is it an
interpolation of data.
27
National Traffic Scorecard 2008 Annual Report
Scorecard Relationship with Other Studies
This is the first analysis to go to the detailed road segment level nationwide; it is also the first to look in —
depth by hour and day nationwide. Further, this report offers a unique opportunity to see trending by
time, region or specific road segment.
Given the myriad of ways to calculate congestion and the wide range of raw data that is utilized, it is natural that
different reports can have different results, rankings and indexes. When comparing differences between the
Scorecard and other reports, it could be due to one or more of the following reasons:
Many of the reports weight results by traffic volume and/or factor in the number of lanes on roadways; the •
Scorecard does not.
Travel Time Index calculations are from a road user perspective based on complete random trips, not •
weighted by volumes, lane miles, or origin/destination weighting.
Travel Time Index values in the Scorecard seem lower than some other studies. This is likely for two reasons:•
By using a data driven reference speed instead of a flat speed for free flow, such as 60 mph, results in —
lower uncongested speeds in most cases, meaning less congestion is calculated for the same average
speeds; and
INRIX coverage extends throughout entire metropolitan areas including highways and commuting —
corridors far away from city centers that may contribute less to congestion than roads in the urban core,
lowering the index.
Studies may have different metropolitan areas, or aggregate some regions such as Washington, D.C. and •
Baltimore. The Scorecard approach could easily adjust market boundaries to aggregate results differently,
but is presently based on the standardized, Census CBSA definition.
The Scorecard is focused on mainline lanes of limited access highways; other studies may include ramps, •
interchanges and arterials.
28
National Traffic Scorecard 2008 Annual Report
National Traffic Scorecard 2008 Annual Report
Acknowledgements and Contact Information
Acknowledgements
Rick Schuman, INRIX vice president of public sector, is the author of the INRIX National Traffic Scorecard and the
driver behind the primary analysis of the metropolitan and bottleneck data.
INRIX historically works with data providers, technology partners, experts and our customers to address traffic
issues in North America and Europe. Collaborating to create unique and important products is key to INRIX’s
success. This Scorecard is no different. INRIX would like to thank several organizations and individuals who
have assisted in one way or another in creating the approaches used in the initial 2007 Scorecard, that are also
used in this 2008 update. Tim Lomax and Shawn Turner of the Texas Transportation Institute, Rich Margiotta
of Cambridge Systematics and Mark Hallenbeck of the University of Washington aided in development of the
original Scorecard methodology. Kevin Loftus of INRIX’s partner Clear Channel Total Traffic Network provided
local market knowledge and assistance.
Future Updates
Leveraging the nation’s most robust historical traffic data warehouse, INRIX is committed to publishing this
report on an annual basis. Based on input and feedback, INRIX will continue to improve and expand the report in
areas such as additional road coverage (the interstate network, arterials, additional metropolitan areas, etc.) and
adding metrics, such as travel reliability and trending analysis.
There are many possible extensions and expansions to the information provided in this report. We welcome
inquiries from public agencies and transportation data analysts to conduct more in-depth regional or national
analyses based upon our traffic data archive and look forward to partnering to tap local knowledge and domain
expertise to take full advantage of our data, and to incorporate and correlate with additional data sets (i.e.,
construction, incidents, weather, etc.).
INRIX will also continue to publish Scorecard Special Reports on key topics, similar to The Impact of Fuel Prices on
Consumer Behavior and Traffic Congestion released in Fall, 2008.
About Us
INRIX is a leading innovator of real-time, historical and predictive traffic information, offering the broadest
coverage, exceptional accuracy and innovative technologies to ensure the success of our customers’ navigation
and traffic-enabled solutions. INRIX provides traffic, navigation, and location-based services to more than 65
industry-leading customers.
29
National Traffic Scorecard 2008 Annual Report
Acknowledgements and Contact Information
INRIX is different from other traffic information providers, with the broadest coverage in the most locations:
145 metropolitan areas and more than 120,000 miles of roads in the U.S., Canada, and Europe. With its unique
fusion of traditional sensors and nearly a million GPS-enabled vehicles, INRIX ensures the highest accuracy of
its traffic data. And, with the launch of INRIX Connected Services in mid-2008, INRIX is now aggregating and
delivering new in-car solutions featuring third generation routing and other innovative dynamic content such
as safety and weather alerts, fuel prices, news/stocks/weather/sports, business and category search, movie
times, and travel information.
Highest Quality —
INRIX has consistently introduced breakthrough solutions including predictive traffic technologies,
Total Fusion and Connected Services. In a further industry effort to demystify the quality analysis
of traffic information, INRIX also recently published Benchmarking Traffic Data Quality: Best Practices
for Analyzing the Quality of Traffic Information
(see Figure 23), which is available at www.inrix.
com. This 60-page technical primer on traffic
data quality provides a benchmark from which to
evaluate the many components that make up the
quality of traffic information. With respect to data
integrity and quality, INRIX leads the industry
with its sharp focus on quality using intelligent
data fusion, advanced analytics and extensive
quality processes.
Broadest Coverage—
INRIX provides coverage in more markets and more roadways within markets than any other
company. Leveraging its unique Smart Dust Network, INRIX provides accurate real-time, historical
and traffic fusion speed information for major freeways, highways and arterials in every major
metropolitan area in the U.S. and Canada. Additionally, INRIX recently introduced real-time flow
coverage for roadways throughout the entire U.K. and the Netherlands, and real-time incident
coverage for 16 countries in Europe.
Figure 23: Benchmarking Trafiic Data Quality Technical Primer
30
National Traffic Scorecard 2008 Annual Report
Acknowledgements and Contact Information
Smart Dust Network—
The INRIX Smart Dust Network is a breakthrough in traffic technology that dramatically advances the
accuracy, coverage and quality of INRIX services. It collects more data about traffic conditions than
any solution on the market today, acquiring real-time and historical data from hundreds of public and
private sources – including anonymous, real-time GPS probe data from nearly a million commercial
fleet, delivery and taxi vehicles; toll tag data from systems such as California’s FasTrak system; and road
occupancy and speed measurements from Departments of Transportation around the country. INRIX
is the first company in the industry to make use of all these valuable data sources.
The INRIX Smart Dust Network also factors in real-time incident data from across around the United
States, as well as hundreds of market-specific criteria that affect traffic, such as construction and road
closures, sports games and entertainment events, school schedules and weather forecasts.
While some traffic solutions rely entirely on road sensors – which are expensive and often error-prone
– INRIX’s wide range of data sources enables it to provide high-quality information in cities and states
where accurate traffic data was not previously available – such as Miami, Las Vegas, New York, Tampa,
San Antonio and Providence, R.I. In fact, recent ground truth testing shows that INRIX technology was
able to deliver an 8-15% accuracy advantage over traditional embedded road sensors.
Innovative Technologies—
INRIX innovations in predictive, historical and real-time traffic technologies and solutions enable our
customers to introduce enhanced products and services using accurate time estimation and dynamic
route guidance capabilities – all critical for the next generation of navigation solutions.
Additionally, INRIX’s innovations in business strategy have further enabled the company to scale
through key strategic partnerships, business models, and its focus on the needs of customers.
INRIX Connected Services—
The INRIX Connected Services platform offers an unparalleled suite of content services providing
navigation OEMs and location-based service application developers with private label, go-to-
market solutions for in-vehicle, personal navigation device (PND), wireless phone and other
connected devices. The INRIX Connected Services platform encompasses the world’s first ‘third
generation’ routing engine, dynamic traffic data covering 800,000 miles of roadways in North
America, additional location-relevant content, and a developer zone designed to greatly simplify
creation of location-based service applications.
31
National Traffic Scorecard 2008 Annual Report
Acknowledgements and Contact Information
Public Sector Solutions
Leading transportation agencies, consultants, integrators, and academic institutions are using INRIX data
today to support their operations, applications and analyses. INRIX real-time traffic information is available
to the I-95 Corridor Coalition and government transportation agencies under contract in 11 states including
Alabama, Delaware, Florida, Maryland, New Jersey, North Carolina, Pennsylvania, South Carolina, Virginia,
Washington, D.C., and Wisconsin. Collaborating with these early adopters, INRIX has been able to refine and
hone our product offerings, pricing and licensing terms, as well as demonstrate the value of our data to the
public sector. Real-time, fusion and historical traffic services are available today covering all major roadways
in your state/region.
Contact Us
Business Contact
Inquiries from public agencies and potential industry partners to build upon this Scorecard should contact:
Rick Schuman, Vice President of Public Sector, INRIX
Media Contacts
Press inquiries related to this Scorecard should contact:
Maggie Miller, Weber Shandwick
310-854-8385
Scorecard Input
Your feedback on the Scorecard is important to us. To provide comments on the Scorecard, including how we
can improve future versions, please use the feedback form provided on http://scorecard.inrix.com.
National Traffic Scorecard 2008 Annual Report
National Traffic Scorecard 2008 Annual Report
A
This Appendix contains the 100 Metropolitan Scorecard Summary sheets in national congestion rank order.
Each metropolitan Scorecard features information related to the overall congestion metrics, a map of the roads
analyzed and the locations of bottlenecks, and details of the top bottlenecks.
Appendix A | Top 100 Metropolitan Scorecards
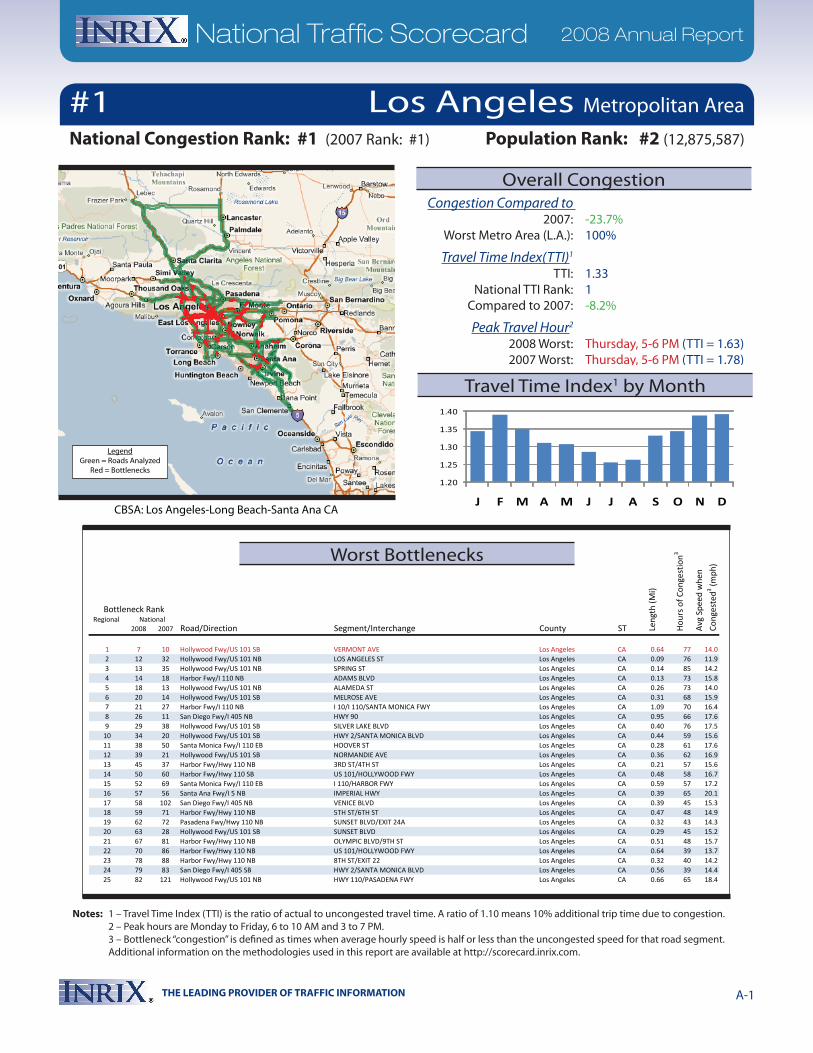
THE LEADING PROVIDER OF TRAFFIC INFORMATION A-1
National Traffic Scorecard 2008 Annual Report
Notes: 1 – Travel Time Index (TTI) is the ratio of actual to uncongested travel time. A ratio of 1.10 means 10% additional trip time due to congestion. 2 – Peak hours are Monday to Friday, 6 to 10 AM and 3 to 7 PM. 3 – Bottleneck “congestion” is defined as times when average hourly speed is half or less than the uncongested speed for that road segment. Additional information on the methodologies used in this report are available at http://scorecard.inrix.com.
#1 Los Angeles Metropolitan Area
CBSA: Los Angeles-Long Beach-Santa Ana CA
National Congestion Rank: #1 (2007 Rank: #1) Population Rank: #2 (12,875,587)
Congestion Compared to 2007: -23.7% Worst Metro Area (L.A.): 100%
Travel Time Index(TTI)1
TTI: 1.33 National TTI Rank: 1 Compared to 2007: -8.2%
Peak Travel Hour2
2008 Worst: Thursday, 5-6 PM (TTI = 1.63) 2007 Worst: Thursday, 5-6 PM (TTI = 1.78)
1.20
1.25
1.30
1.35
1.40
J F M A M J J A S O N D
Regional 2008 2007 Road/Direction Segment/Interchange County ST
Bottleneck Rank
Len
gth
(Mi)
Hou
rs o
f Con
gest
ion3
Avg
Spe
ed w
hen
Con
gest
ed3 (m
ph)
National
1 7 10 Hollywood Fwy/US 101 SB VERMONT AVE Los Angeles CA 0.64 77 14.02 12 32 Hollywood Fwy/US 101 NB LOS ANGELES ST Los Angeles CA 0.09 76 11.93 13 35 Hollywood Fwy/US 101 NB SPRING ST Los Angeles CA 0.14 85 14.24 14 18 Harbor Fwy/I 110 NB ADAMS BLVD Los Angeles CA 0.13 73 15.85 18 13 Hollywood Fwy/US 101 NB ALAMEDA ST Los Angeles CA 0.26 73 14.06 20 14 Hollywood Fwy/US 101 SB MELROSE AVE Los Angeles CA 0.31 68 15.97 21 27 Harbor Fwy/I 110 NB I 10/I 110/SANTA MONICA FWY Los Angeles CA 1.09 70 16.48 26 11 San Diego Fwy/I 405 NB HWY 90 Los Angeles CA 0.95 66 17.69 29 38 Hollywood Fwy/US 101 SB SILVER LAKE BLVD Los Angeles CA 0.40 76 17.5
10 34 20 Hollywood Fwy/US 101 SB HWY 2/SANTA MONICA BLVD Los Angeles CA 0.44 59 15.611 38 50 Santa Monica Fwy/I 110 EB HOOVER ST Los Angeles CA 0.28 61 17.612 39 21 Hollywood Fwy/US 101 SB NORMANDIE AVE Los Angeles CA 0.36 62 16.913 45 37 Harbor Fwy/Hwy 110 NB 3RD ST/4TH ST Los Angeles CA 0.21 57 15.614 50 60 Harbor Fwy/Hwy 110 SB US 101/HOLLYWOOD FWY Los Angeles CA 0.48 58 16.715 52 69 Santa Monica Fwy/I 110 EB I 110/HARBOR FWY Los Angeles CA 0.59 57 17.216 57 56 Santa Ana Fwy/I 5 NB IMPERIAL HWY Los Angeles CA 0.39 65 20.117 58 102 San Diego Fwy/I 405 NB VENICE BLVD Los Angeles CA 0.39 45 15.318 59 71 Harbor Fwy/Hwy 110 NB 5TH ST/6TH ST Los Angeles CA 0.47 48 14.919 62 72 Pasadena Fwy/Hwy 110 NB SUNSET BLVD/EXIT 24A Los Angeles CA 0.32 43 14.320 63 28 Hollywood Fwy/US 101 SB SUNSET BLVD Los Angeles CA 0.29 45 15.221 67 81 Harbor Fwy/Hwy 110 NB OLYMPIC BLVD/9TH ST Los Angeles CA 0.51 48 15.722 70 86 Harbor Fwy/Hwy 110 NB US 101/HOLLYWOOD FWY Los Angeles CA 0.64 39 13.723 78 88 Harbor Fwy/Hwy 110 NB 8TH ST/EXIT 22 Los Angeles CA 0.32 40 14.224 79 83 San Diego Fwy/I 405 SB HWY 2/SANTA MONICA BLVD Los Angeles CA 0.56 39 14.425 82 121 Hollywood Fwy/US 101 NB HWY 110/PASADENA FWY Los Angeles CA 0.66 65 18.4
Worst Bottlenecks
Overall Congestion
Travel Time Index1 by Month
LegendGreen = Roads Analyzed
Red = Bottlenecks

THE LEADING PROVIDER OF TRAFFIC INFORMATION A-2
National Traffic Scorecard 2008 Annual Report
Notes: 1 – Travel Time Index (TTI) is the ratio of actual to uncongested travel time. A ratio of 1.10 means 10% additional trip time due to congestion. 2 – Peak hours are Monday to Friday, 6 to 10 AM and 3 to 7 PM. 3 – Bottleneck “congestion” is defined as times when average hourly speed is half or less than the uncongested speed for that road segment. Additional information on the methodologies used in this report are available at http://scorecard.inrix.com.
Regional 2008 2007 Road/Direction Segment/Interchange County ST
1 1 1 Cross Bronx Expy WB/I 95 SB BRONX RIVER PKWY/EXIT 4B Bronx NY 0.36 94 11.22 3 5 Cross Bronx Expy WB/I 95 SB I 895/SHERIDAN EXPY/EXIT 4A Bronx NY 0.55 93 11.93 4 2 Cross Bronx Expy WB/I 95 SB WHITE PLAINS RD/EXIT 5 Bronx NY 0.27 87 12.34 5 6 Harlem River Dr SB 3RD AVE New York NY 0.15 81 12.45 6 8 Van Wyck Expy/I 678 NB LIBERTY AVE/EXIT 4 Queens NY 0.58 77 13.16 9 16 Harlem River Dr SB 2ND AVE/125TH ST/EXIT 19 New York NY 0.23 84 12.57 11 4 Cross Bronx Expy WB/I 95 SB WESTCHESTER AVE/EXIT 5 Bronx NY 1.15 77 14.58 15 25 George Washington Brg EB/I 95 NB CENTER AVE Bergen NJ 0.14 68 9.09 16 7 I 95 NB US 1/US 9/US 46/EXIT 72 Bergen NJ 0.42 66 9.7
10 17 124 Harlem River Dr NB LOWER LVL WASHINGTON BRG New York NY 0.09 74 10.311 23 193 Van Wyck Expy/I 678 NB HILLSIDE AVE/EXIT 6 Queens NY 0.27 79 14.412 24 42 Van Wyck Expy/I 678 NB ATLANTIC AVE/EXIT 5 Queens NY 0.47 75 12.713 28 91 Van Wyck Expy/I 678 NB JAMAICA AVE/EXIT 6 Queens NY 0.16 74 13.714 30 43 Cross Bronx Expy EB/I 95 NB JEROME AVE/EXIT 2A Bronx NY 0.45 70 14.815 31 47 Alexander Hamilton Brg EB/I 95 NB I 87/EXIT 1 Bronx NY 0.39 59 11.916 33 17 Van Wyck Expy/I 678 NB LINDEN BLVD/EXIT 3 Queens NY 0.65 60 14.717 37 19 Lincoln Tunl/Hwy 495 EB TOLL PLAZA Hudson NJ 0.59 51 7.318 41 59 Harlem River Dr SB PARK AVE New York NY 0.44 58 14.919 42 76 Brooklyn Queens Expy/I 278 SB FLUSHING AVE/EXIT 30 Kings NY 0.44 55 12.320 48 70 Brooklyn Queens Expy/I 278 SB TILLARY ST/EXIT 29 Kings NY 0.87 58 12.621 73 31 Major Deegan Expy/I 87 NB 153RD ST/RIVER AVE/EXIT 6 Bronx NY 0.30 49 14.122 75 476 Gowanis Expy/I 278 EB 3RD AVE/EXIT 21 Kings NY 0.37 43 11.523 77 123 Long Island Expy/I 495 EB WOODHAVEN BLVD Queens NY 0.62 47 16.124 80 34 Hwy 495 EB PARK AVE Hudson NJ 0.64 37 10.025 81 118 Belt Pkwy/Southern Pkwy WB I 678/VAN WYCK EXPY/EXIT 20 Queens NY 1.00 51 17.3
Bottleneck Rank
Len
gth
(Mi)
Hou
rs o
f Con
gest
ion3
Avg
Spe
ed w
hen
Con
gest
ed3 (m
ph)
National
1.10
1.15
1.20
1.25
1.30
J F M A M J J A S O N D
Congestion Compared to 2007: -25.2% Worst Metro Area (L.A.): 87%
Travel Time Index(TTI)1
TTI: 1.22 National TTI Rank: 5 Compared to 2007: -5.8%
Peak Travel Hour2
2008 Worst: Friday, 5-6 PM (TTI = 1.48) 2007 Worst: Friday, 5-6 PM (TTI = 1.64)
CBSA: New York-Northern New Jersey-Long Island NY-NJ-PA
Population Rank: #1 (18,815,988)
New York City Metropolitan Area
National Congestion Rank: #2 (2007 Rank: #2)
#2
Worst Bottlenecks
Overall Congestion
Travel Time Index1 by Month
LegendGreen = Roads Analyzed
Red = Bottlenecks
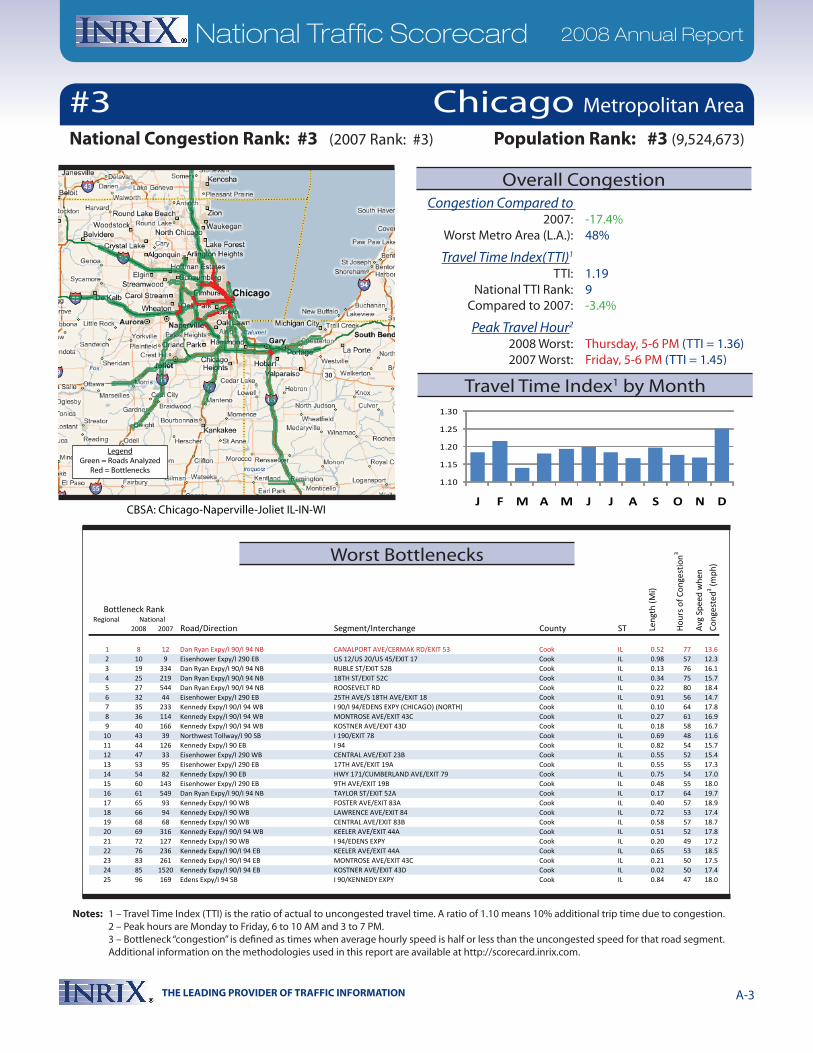
THE LEADING PROVIDER OF TRAFFIC INFORMATION A-3
National Traffic Scorecard 2008 Annual Report
Notes: 1 – Travel Time Index (TTI) is the ratio of actual to uncongested travel time. A ratio of 1.10 means 10% additional trip time due to congestion. 2 – Peak hours are Monday to Friday, 6 to 10 AM and 3 to 7 PM. 3 – Bottleneck “congestion” is defined as times when average hourly speed is half or less than the uncongested speed for that road segment. Additional information on the methodologies used in this report are available at http://scorecard.inrix.com.
Regional 2008 2007 Road/Direction Segment/Interchange County ST
Bottleneck Rank
Len
gth
(Mi)
Hou
rs o
f Con
gest
ion3
Avg
Spe
ed w
hen
Con
gest
ed3 (m
ph)
National
1 8 12 Dan Ryan Expy/I 90/I 94 NB CANALPORT AVE/CERMAK RD/EXIT 53 Cook IL 0.52 77 13.62 10 9 Eisenhower Expy/I 290 EB US 12/US 20/US 45/EXIT 17 Cook IL 0.98 57 12.33 19 334 Dan Ryan Expy/I 90/I 94 NB RUBLE ST/EXIT 52B Cook IL 0.13 76 16.14 25 219 Dan Ryan Expy/I 90/I 94 NB 18TH ST/EXIT 52C Cook IL 0.34 75 15.75 27 544 Dan Ryan Expy/I 90/I 94 NB ROOSEVELT RD Cook IL 0.22 80 18.46 32 44 Eisenhower Expy/I 290 EB 25TH AVE/S 18TH AVE/EXIT 18 Cook IL 0.91 56 14.77 35 233 Kennedy Expy/I 90/I 94 WB I 90/I 94/EDENS EXPY (CHICAGO) (NORTH) Cook IL 0.10 64 17.88 36 114 Kennedy Expy/I 90/I 94 WB MONTROSE AVE/EXIT 43C Cook IL 0.27 61 16.99 40 166 Kennedy Expy/I 90/I 94 WB KOSTNER AVE/EXIT 43D Cook IL 0.18 58 16.7
10 43 39 Northwest Tollway/I 90 SB I 190/EXIT 78 Cook IL 0.69 48 11.611 44 126 Kennedy Expy/I 90 EB I 94 Cook IL 0.82 54 15.712 47 33 Eisenhower Expy/I 290 WB CENTRAL AVE/EXIT 23B Cook IL 0.55 52 15.413 53 95 Eisenhower Expy/I 290 EB 17TH AVE/EXIT 19A Cook IL 0.55 55 17.314 54 82 Kennedy Expy/I 90 EB HWY 171/CUMBERLAND AVE/EXIT 79 Cook IL 0.75 54 17.015 60 143 Eisenhower Expy/I 290 EB 9TH AVE/EXIT 19B Cook IL 0.48 55 18.016 61 549 Dan Ryan Expy/I 90/I 94 NB TAYLOR ST/EXIT 52A Cook IL 0.17 64 19.717 65 93 Kennedy Expy/I 90 WB FOSTER AVE/EXIT 83A Cook IL 0.40 57 18.918 66 94 Kennedy Expy/I 90 WB LAWRENCE AVE/EXIT 84 Cook IL 0.72 53 17.419 68 68 Kennedy Expy/I 90 WB CENTRAL AVE/EXIT 83B Cook IL 0.58 57 18.720 69 316 Kennedy Expy/I 90/I 94 WB KEELER AVE/EXIT 44A Cook IL 0.51 52 17.821 72 127 Kennedy Expy/I 90 WB I 94/EDENS EXPY Cook IL 0.20 49 17.222 76 236 Kennedy Expy/I 90/I 94 EB KEELER AVE/EXIT 44A Cook IL 0.65 53 18.523 83 261 Kennedy Expy/I 90/I 94 EB MONTROSE AVE/EXIT 43C Cook IL 0.21 50 17.524 85 1520 Kennedy Expy/I 90/I 94 EB KOSTNER AVE/EXIT 43D Cook IL 0.02 50 17.425 96 169 Edens Expy/I 94 SB I 90/KENNEDY EXPY Cook IL 0.84 47 18.0
1.10
1.15
1.20
1.25
1.30
J F M A M J J A S O N D
Congestion Compared to 2007: -17.4% Worst Metro Area (L.A.): 48%
Travel Time Index(TTI)1
TTI: 1.19 National TTI Rank: 9 Compared to 2007: -3.4%
Peak Travel Hour2
2008 Worst: Thursday, 5-6 PM (TTI = 1.36) 2007 Worst: Friday, 5-6 PM (TTI = 1.45)
CBSA: Chicago-Naperville-Joliet IL-IN-WI
Population Rank: #3 (9,524,673)National Congestion Rank: #3 (2007 Rank: #3)
#3 Chicago Metropolitan Area
Worst Bottlenecks
Overall Congestion
Travel Time Index1 by Month
LegendGreen = Roads Analyzed
Red = Bottlenecks

THE LEADING PROVIDER OF TRAFFIC INFORMATION A-4
National Traffic Scorecard 2008 Annual Report
Notes: 1 – Travel Time Index (TTI) is the ratio of actual to uncongested travel time. A ratio of 1.10 means 10% additional trip time due to congestion. 2 – Peak hours are Monday to Friday, 6 to 10 AM and 3 to 7 PM. 3 – Bottleneck “congestion” is defined as times when average hourly speed is half or less than the uncongested speed for that road segment. Additional information on the methodologies used in this report are available at http://scorecard.inrix.com.
Regional 2008 2007 Road/Direction Segment/Interchange County ST
Bottleneck Rank
Len
gth
(Mi)
Hou
rs o
f Con
gest
ion3
Avg
Spe
ed w
hen
Con
gest
ed3 (m
ph)
National
1 93 163 Loop 820/I 820 NB HWY 26/GRAPEVINE HWY/EXIT 22 Tarrant TX 0.35 33 13.22 163 230 Loop 820/I 820 WB RUFE SNOW DR/EXIT 20 Tarrant TX 0.85 41 20.13 210 259 I 35W SB HWY 121/EXIT 52 Tarrant TX 1.30 41 21.34 214 201 Loop 820/I 820 EB US 377/DENTON HWY/EXIT 19 Tarrant TX 0.72 37 20.85 280 333 Stemmons Fwy/I 35E SB WOODALL RODGERS FWY Dallas TX 0.45 24 14.96 282 373 Loop 820/I 820 WB HOLIDAY LN/EXIT 21 Tarrant TX 0.66 32 19.77 351 449 Stemmons Fwy/I 35E SB CONTINENTAL AVE/EXIT 429B Dallas TX 0.77 24 16.68 359 594 I 35W NB WESTERN CENTER BLVD/EXIT 58 Tarrant TX 1.53 26 18.79 366 429 Stemmons Fwy/I 35E SB COMMERCE ST/REUNION BLVD/EXIT428E Dallas TX 0.50 27 17.4
10 387 769 Woodall Rodgers Fwy/State Spur 366 SB FIELD ST Dallas TX 0.19 25 17.811 407 475 Loop 820/I 820 EB HALTOM RD/EXIT 18 Tarrant TX 0.75 29 22.412 439 565 Stemmons Fwy/I 35E SB EXIT 429D Dallas TX 0.46 22 16.413 445 511 Stemmons Fwy/I 35E SB OAK LAWN AVE/EXIT 430A Dallas TX 0.71 20 15.714 456 584 Stemmons Fwy/I 35E SB HI LINE DR/EXIT 429C Dallas TX 0.26 22 17.215 489 681 I 35W SB NORTH FWY/EXIT 53 Tarrant TX 0.94 23 18.916 542 811 Hwy 360 SB LAMAR BLVD Tarrant TX 0.73 18 16.117 579 805 Hwy 360 SB SIX FLAGS DR Tarrant TX 0.51 20 18.118 592 3007 Woodall Rodgers Fwy/State Spur 366 SB I 35E Dallas TX 0.54 24 17.519 602 1032 Hwy 360 SB W NORTH CARRIER PKWY/GREEN OAKS BLVD Tarrant TX 0.32 17 16.020 609 1104 I 35W SB WESTERN CENTER BLVD/EXIT 58 Tarrant TX 1.32 24 22.821 679 691 R L Thornton Fwy/I 45 WB 1ST AVE/EXIT 47 Dallas TX 0.45 25 23.722 701 808 R L Thornton Fwy/I 45 WB 2ND AVE/EXIT 47 Dallas TX 0.14 25 23.323 729 1108 I 35W SB EXIT 59 Tarrant TX 1.53 21 22.524 742 956 R L Thornton Fwy/I 45 WB CENTRAL EXPY/EXIT 46 Dallas TX 0.61 20 19.125 750 913 Hwy 183/Hwy 121/Airport Fwy SB CENTRAL DR Tarrant TX 0.66 19 19.9
1.05
1.10
1.15
1.20
J F M A M J J A S O N DCBSA: Dallas-Fort Worth-Arlington TX
Congestion Compared to 2007: -13.3% Worst Metro Area (L.A.): 39%
Travel Time Index(TTI)1
TTI: 1.12 National TTI Rank: 18 Compared to 2007: -2.4%
Peak Travel Hour2
2008 Worst: Friday, 5-6 PM (TTI = 1.31) 2007 Worst: Friday, 5-6 PM (TTI = 1.34)
National Congestion Rank: #4 (2007 Rank: #5) Population Rank: #4 (6,145,037)
Dallas/Fort Worth Metropolitan Area#4
Worst Bottlenecks
Overall Congestion
Travel Time Index1 by Month
LegendGreen = Roads Analyzed
Red = Bottlenecks
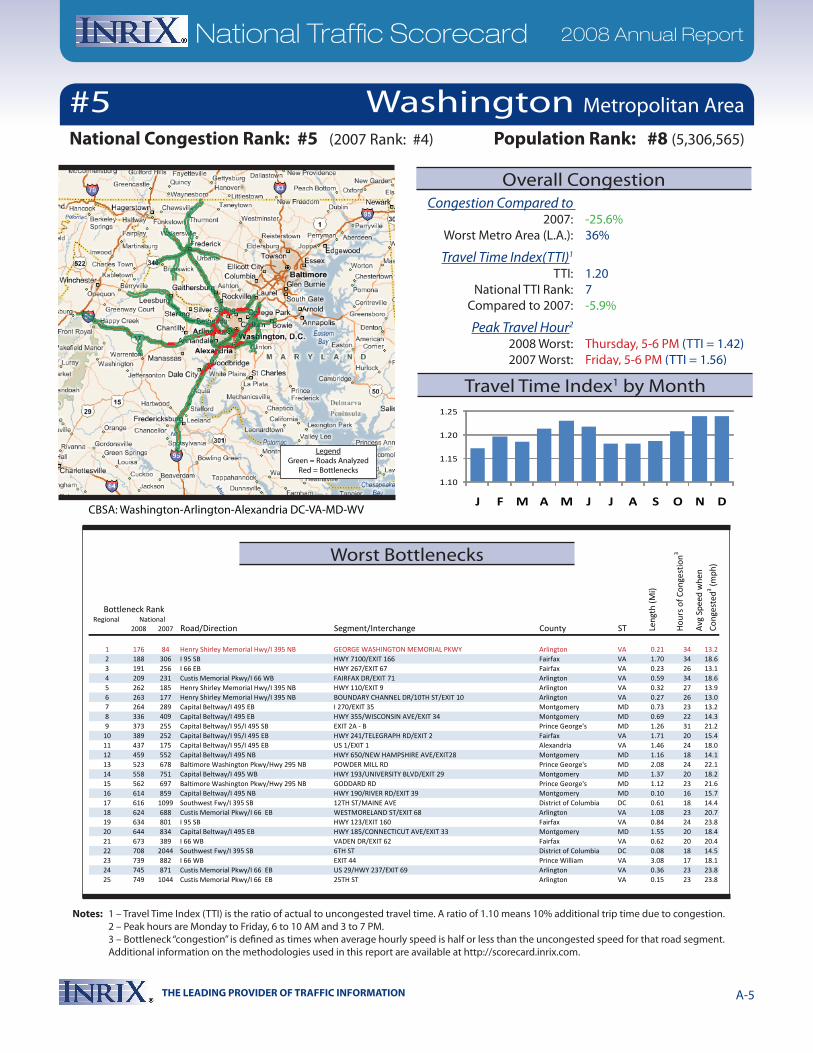
THE LEADING PROVIDER OF TRAFFIC INFORMATION A-5
National Traffic Scorecard 2008 Annual Report
Notes: 1 – Travel Time Index (TTI) is the ratio of actual to uncongested travel time. A ratio of 1.10 means 10% additional trip time due to congestion. 2 – Peak hours are Monday to Friday, 6 to 10 AM and 3 to 7 PM. 3 – Bottleneck “congestion” is defined as times when average hourly speed is half or less than the uncongested speed for that road segment. Additional information on the methodologies used in this report are available at http://scorecard.inrix.com.
Regional 2008 2007 Road/Direction Segment/Interchange County ST
Bottleneck Rank
Len
gth
(Mi)
Hou
rs o
f Con
gest
ion3
Avg
Spe
ed w
hen
Con
gest
ed3 (m
ph)
National
1 176 84 Henry Shirley Memorial Hwy/I 395 NB GEORGE WASHINGTON MEMORIAL PKWY Arlington VA 0.21 34 13.22 188 306 I 95 SB HWY 7100/EXIT 166 Fairfax VA 1.70 34 18.63 191 256 I 66 EB HWY 267/EXIT 67 Fairfax VA 0.23 26 13.14 209 231 Custis Memorial Pkwy/I 66 WB FAIRFAX DR/EXIT 71 Arlington VA 0.59 34 18.65 262 185 Henry Shirley Memorial Hwy/I 395 NB HWY 110/EXIT 9 Arlington VA 0.32 27 13.96 263 177 Henry Shirley Memorial Hwy/I 395 NB BOUNDARY CHANNEL DR/10TH ST/EXIT 10 Arlington VA 0.27 26 13.07 264 289 Capital Beltway/I 495 EB I 270/EXIT 35 Montgomery MD 0.73 23 13.28 336 409 Capital Beltway/I 495 EB HWY 355/WISCONSIN AVE/EXIT 34 Montgomery MD 0.69 22 14.39 373 255 Capital Beltway/I 95/I 495 SB EXIT 2A - B Prince George's MD 1.26 31 21.2
10 389 252 Capital Beltway/I 95/I 495 EB HWY 241/TELEGRAPH RD/EXIT 2 Fairfax VA 1.71 20 15.411 437 175 Capital Beltway/I 95/I 495 EB US 1/EXIT 1 Alexandria VA 1.46 24 18.012 459 552 Capital Beltway/I 495 NB HWY 650/NEW HAMPSHIRE AVE/EXIT28 Montgomery MD 1.16 18 14.113 523 678 Baltimore Washington Pkwy/Hwy 295 NB POWDER MILL RD Prince George's MD 2.08 24 22.114 558 751 Capital Beltway/I 495 WB HWY 193/UNIVERSITY BLVD/EXIT 29 Montgomery MD 1.37 20 18.215 562 697 Baltimore Washington Pkwy/Hwy 295 NB GODDARD RD Prince George's MD 1.12 23 21.616 614 859 Capital Beltway/I 495 NB HWY 190/RIVER RD/EXIT 39 Montgomery MD 0.10 16 15.717 616 1099 Southwest Fwy/I 395 SB 12TH ST/MAINE AVE District of Columbia DC 0.61 18 14.418 624 688 Custis Memorial Pkwy/I 66 EB WESTMORELAND ST/EXIT 68 Arlington VA 1.08 23 20.719 634 801 I 95 SB HWY 123/EXIT 160 Fairfax VA 0.84 24 23.820 644 834 Capital Beltway/I 495 EB HWY 185/CONNECTICUT AVE/EXIT 33 Montgomery MD 1.55 20 18.421 673 389 I 66 WB VADEN DR/EXIT 62 Fairfax VA 0.62 20 20.422 708 2044 Southwest Fwy/I 395 SB 6TH ST District of Columbia DC 0.08 18 14.523 739 882 I 66 WB EXIT 44 Prince William VA 3.08 17 18.124 745 871 Custis Memorial Pkwy/I 66 EB US 29/HWY 237/EXIT 69 Arlington VA 0.36 23 23.825 749 1044 Custis Memorial Pkwy/I 66 EB 25TH ST Arlington VA 0.15 23 23.8
1.10
1.15
1.20
1.25
J F M A M J J A S O N D
Congestion Compared to 2007: -25.6% Worst Metro Area (L.A.): 36%
Travel Time Index(TTI)1
TTI: 1.20 National TTI Rank: 7 Compared to 2007: -5.9%
Peak Travel Hour2
2008 Worst: Thursday, 5-6 PM (TTI = 1.42) 2007 Worst: Friday, 5-6 PM (TTI = 1.56)
CBSA: Washington-Arlington-Alexandria DC-VA-MD-WV
Population Rank: #8 (5,306,565)National Congestion Rank: #5 (2007 Rank: #4)
#5 Washington Metropolitan Area
Worst Bottlenecks
Overall Congestion
Travel Time Index1 by Month
LegendGreen = Roads Analyzed
Red = Bottlenecks
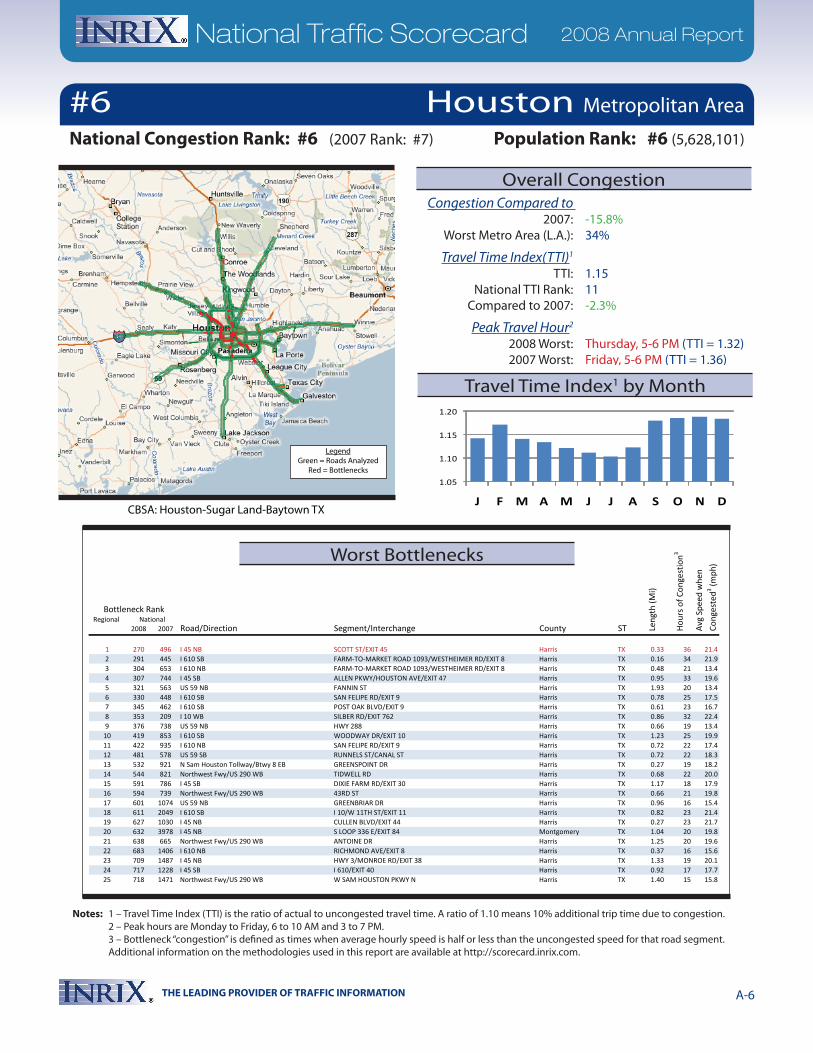
THE LEADING PROVIDER OF TRAFFIC INFORMATION A-6
National Traffic Scorecard 2008 Annual Report
Notes: 1 – Travel Time Index (TTI) is the ratio of actual to uncongested travel time. A ratio of 1.10 means 10% additional trip time due to congestion. 2 – Peak hours are Monday to Friday, 6 to 10 AM and 3 to 7 PM. 3 – Bottleneck “congestion” is defined as times when average hourly speed is half or less than the uncongested speed for that road segment. Additional information on the methodologies used in this report are available at http://scorecard.inrix.com.
Regional 2008 2007 Road/Direction Segment/Interchange County ST
Bottleneck Rank
Len
gth
(Mi)
Hou
rs o
f Con
gest
ion3
Avg
Spe
ed w
hen
Con
gest
ed3 (m
ph)
National
1 270 496 I 45 NB SCOTT ST/EXIT 45 Harris TX 0.33 36 21.42 291 445 I 610 SB FARM-TO-MARKET ROAD 1093/WESTHEIMER RD/EXIT 8 Harris TX 0.16 34 21.93 304 653 I 610 NB FARM-TO-MARKET ROAD 1093/WESTHEIMER RD/EXIT 8 Harris TX 0.48 21 13.44 307 744 I 45 SB ALLEN PKWY/HOUSTON AVE/EXIT 47 Harris TX 0.95 33 19.65 321 563 US 59 NB FANNIN ST Harris TX 1.93 20 13.46 330 448 I 610 SB SAN FELIPE RD/EXIT 9 Harris TX 0.78 25 17.57 345 462 I 610 SB POST OAK BLVD/EXIT 9 Harris TX 0.61 23 16.78 353 209 I 10 WB SILBER RD/EXIT 762 Harris TX 0.86 32 22.49 376 738 US 59 NB HWY 288 Harris TX 0.66 19 13.4
10 419 853 I 610 SB WOODWAY DR/EXIT 10 Harris TX 1.23 25 19.911 422 935 I 610 NB SAN FELIPE RD/EXIT 9 Harris TX 0.72 22 17.412 481 578 US 59 SB RUNNELS ST/CANAL ST Harris TX 0.72 22 18.313 532 921 N Sam Houston Tollway/Btwy 8 EB GREENSPOINT DR Harris TX 0.27 19 18.214 544 821 Northwest Fwy/US 290 WB TIDWELL RD Harris TX 0.68 22 20.015 591 786 I 45 SB DIXIE FARM RD/EXIT 30 Harris TX 1.17 18 17.916 594 739 Northwest Fwy/US 290 WB 43RD ST Harris TX 0.66 21 19.817 601 1074 US 59 NB GREENBRIAR DR Harris TX 0.96 16 15.418 611 2049 I 610 SB I 10/W 11TH ST/EXIT 11 Harris TX 0.82 23 21.419 627 1030 I 45 NB CULLEN BLVD/EXIT 44 Harris TX 0.27 23 21.720 632 3978 I 45 NB S LOOP 336 E/EXIT 84 Montgomery TX 1.04 20 19.821 638 665 Northwest Fwy/US 290 WB ANTOINE DR Harris TX 1.25 20 19.622 683 1406 I 610 NB RICHMOND AVE/EXIT 8 Harris TX 0.37 16 15.623 709 1487 I 45 NB HWY 3/MONROE RD/EXIT 38 Harris TX 1.33 19 20.124 717 1228 I 45 SB I 610/EXIT 40 Harris TX 0.92 17 17.725 718 1471 Northwest Fwy/US 290 WB W SAM HOUSTON PKWY N Harris TX 1.40 15 15.8
1.05
1.10
1.15
1.20
J F M A M J J A S O N D
Congestion Compared to 2007: -15.8% Worst Metro Area (L.A.): 34%
Travel Time Index(TTI)1
TTI: 1.15 National TTI Rank: 11 Compared to 2007: -2.3%
Peak Travel Hour2
2008 Worst: Thursday, 5-6 PM (TTI = 1.32) 2007 Worst: Friday, 5-6 PM (TTI = 1.36)
CBSA: Houston-Sugar Land-Baytown TX
Population Rank: #6 (5,628,101)National Congestion Rank: #6 (2007 Rank: #7)
#6 Houston Metropolitan Area
Worst Bottlenecks
Overall Congestion
Travel Time Index1 by Month
LegendGreen = Roads Analyzed
Red = Bottlenecks
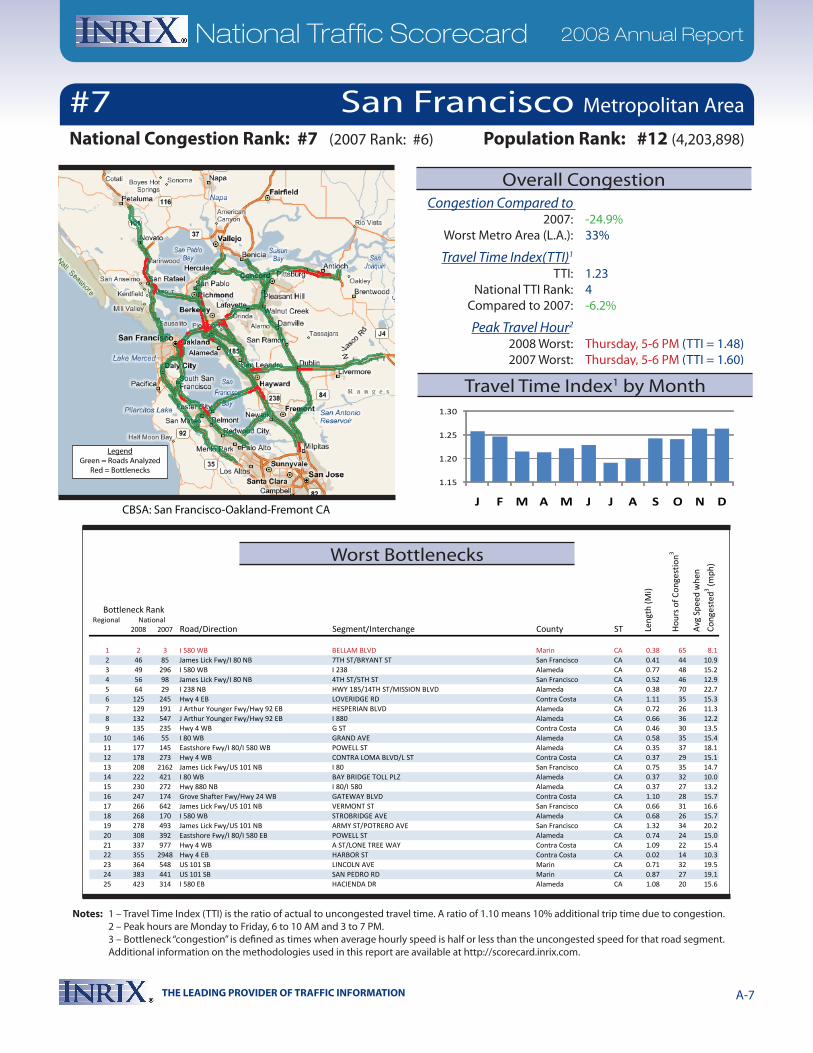
THE LEADING PROVIDER OF TRAFFIC INFORMATION A-7
National Traffic Scorecard 2008 Annual Report
Notes: 1 – Travel Time Index (TTI) is the ratio of actual to uncongested travel time. A ratio of 1.10 means 10% additional trip time due to congestion. 2 – Peak hours are Monday to Friday, 6 to 10 AM and 3 to 7 PM. 3 – Bottleneck “congestion” is defined as times when average hourly speed is half or less than the uncongested speed for that road segment. Additional information on the methodologies used in this report are available at http://scorecard.inrix.com.
Regional 2008 2007 Road/Direction Segment/Interchange County ST
Bottleneck Rank
Len
gth
(Mi)
Hou
rs o
f Con
gest
ion3
Avg
Spe
ed w
hen
Con
gest
ed3 (m
ph)
National
1 2 3 I 580 WB BELLAM BLVD Marin CA 0.38 65 8.12 46 85 James Lick Fwy/I 80 NB 7TH ST/BRYANT ST San Francisco CA 0.41 44 10.93 49 296 I 580 WB I 238 Alameda CA 0.77 48 15.24 56 98 James Lick Fwy/I 80 NB 4TH ST/5TH ST San Francisco CA 0.52 46 12.95 64 29 I 238 NB HWY 185/14TH ST/MISSION BLVD Alameda CA 0.38 70 22.76 125 245 Hwy 4 EB LOVERIDGE RD Contra Costa CA 1.11 35 15.37 129 191 J Arthur Younger Fwy/Hwy 92 EB HESPERIAN BLVD Alameda CA 0.72 26 11.38 132 547 J Arthur Younger Fwy/Hwy 92 EB I 880 Alameda CA 0.66 36 12.29 135 235 Hwy 4 WB G ST Contra Costa CA 0.46 30 13.5
10 146 55 I 80 WB GRAND AVE Alameda CA 0.58 35 15.411 177 145 Eastshore Fwy/I 80/I 580 WB POWELL ST Alameda CA 0.35 37 18.112 178 273 Hwy 4 WB CONTRA LOMA BLVD/L ST Contra Costa CA 0.37 29 15.113 208 2162 James Lick Fwy/US 101 NB I 80 San Francisco CA 0.75 35 14.714 222 421 I 80 WB BAY BRIDGE TOLL PLZ Alameda CA 0.37 32 10.015 230 272 Hwy 880 NB I 80/I 580 Alameda CA 0.37 27 13.216 247 174 Grove Shafter Fwy/Hwy 24 WB GATEWAY BLVD Contra Costa CA 1.10 28 15.717 266 642 James Lick Fwy/US 101 NB VERMONT ST San Francisco CA 0.66 31 16.618 268 170 I 580 WB STROBRIDGE AVE Alameda CA 0.68 26 15.719 278 493 James Lick Fwy/US 101 NB ARMY ST/POTRERO AVE San Francisco CA 1.32 34 20.220 308 392 Eastshore Fwy/I 80/I 580 EB POWELL ST Alameda CA 0.74 24 15.021 337 977 Hwy 4 WB A ST/LONE TREE WAY Contra Costa CA 1.09 22 15.422 355 2948 Hwy 4 EB HARBOR ST Contra Costa CA 0.02 14 10.323 364 548 US 101 SB LINCOLN AVE Marin CA 0.71 32 19.524 383 441 US 101 SB SAN PEDRO RD Marin CA 0.87 27 19.125 423 314 I 580 EB HACIENDA DR Alameda CA 1.08 20 15.6
1.15
1.20
1.25
1.30
J F M A M J J A S O N D
Congestion Compared to 2007: -24.9% Worst Metro Area (L.A.): 33%
Travel Time Index(TTI)1
TTI: 1.23 National TTI Rank: 4 Compared to 2007: -6.2%
Peak Travel Hour2
2008 Worst: Thursday, 5-6 PM (TTI = 1.48) 2007 Worst: Thursday, 5-6 PM (TTI = 1.60)
CBSA: San Francisco-Oakland-Fremont CA
Population Rank: #12 (4,203,898)
San Francisco Metropolitan Area
National Congestion Rank: #7 (2007 Rank: #6)
#7
Worst Bottlenecks
Overall Congestion
Travel Time Index1 by Month
LegendGreen = Roads Analyzed
Red = Bottlenecks
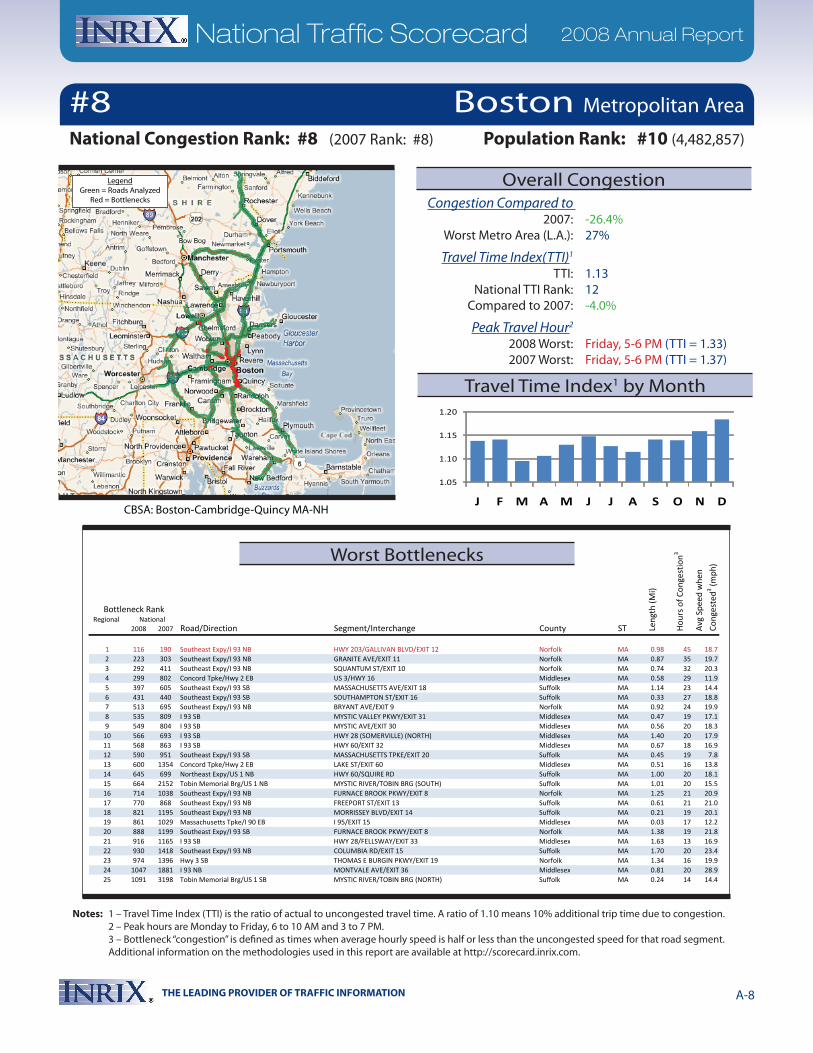
THE LEADING PROVIDER OF TRAFFIC INFORMATION A-8
National Traffic Scorecard 2008 Annual Report
Notes: 1 – Travel Time Index (TTI) is the ratio of actual to uncongested travel time. A ratio of 1.10 means 10% additional trip time due to congestion. 2 – Peak hours are Monday to Friday, 6 to 10 AM and 3 to 7 PM. 3 – Bottleneck “congestion” is defined as times when average hourly speed is half or less than the uncongested speed for that road segment. Additional information on the methodologies used in this report are available at http://scorecard.inrix.com.
Regional 2008 2007 Road/Direction Segment/Interchange County ST
Bottleneck Rank
Len
gth
(Mi)
Hou
rs o
f Con
gest
ion3
Avg
Spe
ed w
hen
Con
gest
ed3 (m
ph)
National
1 116 190 Southeast Expy/I 93 NB HWY 203/GALLIVAN BLVD/EXIT 12 Norfolk MA 0.98 45 18.72 223 303 Southeast Expy/I 93 NB GRANITE AVE/EXIT 11 Norfolk MA 0.87 35 19.73 292 411 Southeast Expy/I 93 NB SQUANTUM ST/EXIT 10 Norfolk MA 0.74 32 20.34 299 802 Concord Tpke/Hwy 2 EB US 3/HWY 16 Middlesex MA 0.58 29 11.95 397 605 Southeast Expy/I 93 SB MASSACHUSETTS AVE/EXIT 18 Suffolk MA 1.14 23 14.46 431 440 Southeast Expy/I 93 SB SOUTHAMPTON ST/EXIT 16 Suffolk MA 0.33 27 18.87 513 695 Southeast Expy/I 93 NB BRYANT AVE/EXIT 9 Norfolk MA 0.92 24 19.98 535 809 I 93 SB MYSTIC VALLEY PKWY/EXIT 31 Middlesex MA 0.47 19 17.19 549 804 I 93 SB MYSTIC AVE/EXIT 30 Middlesex MA 0.56 20 18.3
10 566 693 I 93 SB HWY 28 (SOMERVILLE) (NORTH) Middlesex MA 1.40 20 17.911 568 863 I 93 SB HWY 60/EXIT 32 Middlesex MA 0.67 18 16.912 590 951 Southeast Expy/I 93 SB MASSACHUSETTS TPKE/EXIT 20 Suffolk MA 0.45 19 7.813 600 1354 Concord Tpke/Hwy 2 EB LAKE ST/EXIT 60 Middlesex MA 0.51 16 13.814 645 699 Northeast Expy/US 1 NB HWY 60/SQUIRE RD Suffolk MA 1.00 20 18.115 664 2152 Tobin Memorial Brg/US 1 NB MYSTIC RIVER/TOBIN BRG (SOUTH) Suffolk MA 1.01 20 15.516 714 1038 Southeast Expy/I 93 NB FURNACE BROOK PKWY/EXIT 8 Norfolk MA 1.25 21 20.917 770 868 Southeast Expy/I 93 NB FREEPORT ST/EXIT 13 Suffolk MA 0.61 21 21.018 821 1195 Southeast Expy/I 93 NB MORRISSEY BLVD/EXIT 14 Suffolk MA 0.21 19 20.119 861 1029 Massachusetts Tpke/I 90 EB I 95/EXIT 15 Middlesex MA 0.03 17 12.220 888 1199 Southeast Expy/I 93 SB FURNACE BROOK PKWY/EXIT 8 Norfolk MA 1.38 19 21.821 916 1165 I 93 SB HWY 28/FELLSWAY/EXIT 33 Middlesex MA 1.63 13 16.922 930 1418 Southeast Expy/I 93 NB COLUMBIA RD/EXIT 15 Suffolk MA 1.70 20 23.423 974 1396 Hwy 3 SB THOMAS E BURGIN PKWY/EXIT 19 Norfolk MA 1.34 16 19.924 1047 1881 I 93 NB MONTVALE AVE/EXIT 36 Middlesex MA 0.81 20 28.925 1091 3198 Tobin Memorial Brg/US 1 SB MYSTIC RIVER/TOBIN BRG (NORTH) Suffolk MA 0.24 14 14.4
1.05
1.10
1.15
1.20
J F M A M J J A S O N D
Congestion Compared to 2007: -26.4% Worst Metro Area (L.A.): 27%
Travel Time Index(TTI)1
TTI: 1.13 National TTI Rank: 12 Compared to 2007: -4.0%
Peak Travel Hour2
2008 Worst: Friday, 5-6 PM (TTI = 1.33) 2007 Worst: Friday, 5-6 PM (TTI = 1.37)
CBSA: Boston-Cambridge-Quincy MA-NH
Population Rank: #10 (4,482,857)
Boston Metropolitan Area
National Congestion Rank: #8 (2007 Rank: #8)
#8
Worst Bottlenecks
Overall Congestion
Travel Time Index1 by Month
LegendGreen = Roads Analyzed
Red = Bottlenecks
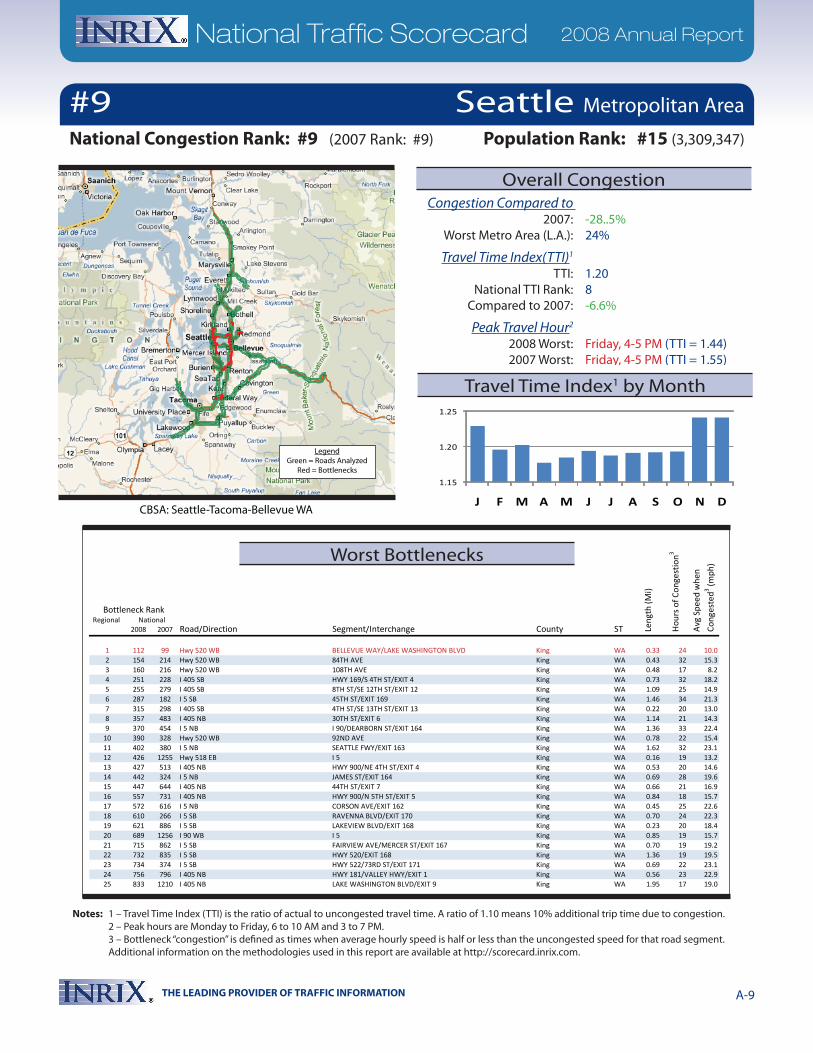
THE LEADING PROVIDER OF TRAFFIC INFORMATION A-9
National Traffic Scorecard 2008 Annual Report
Notes: 1 – Travel Time Index (TTI) is the ratio of actual to uncongested travel time. A ratio of 1.10 means 10% additional trip time due to congestion. 2 – Peak hours are Monday to Friday, 6 to 10 AM and 3 to 7 PM. 3 – Bottleneck “congestion” is defined as times when average hourly speed is half or less than the uncongested speed for that road segment. Additional information on the methodologies used in this report are available at http://scorecard.inrix.com.
Regional 2008 2007 Road/Direction Segment/Interchange County ST
Bottleneck Rank
Len
gth
(Mi)
Hou
rs o
f Con
gest
ion3
Avg
Spe
ed w
hen
Con
gest
ed3 (m
ph)
National
1 112 99 Hwy 520 WB BELLEVUE WAY/LAKE WASHINGTON BLVD King WA 0.33 24 10.02 154 214 Hwy 520 WB 84TH AVE King WA 0.43 32 15.33 160 216 Hwy 520 WB 108TH AVE King WA 0.48 17 8.24 251 228 I 405 SB HWY 169/S 4TH ST/EXIT 4 King WA 0.73 32 18.25 255 279 I 405 SB 8TH ST/SE 12TH ST/EXIT 12 King WA 1.09 25 14.96 287 182 I 5 SB 45TH ST/EXIT 169 King WA 1.46 34 21.37 315 298 I 405 SB 4TH ST/SE 13TH ST/EXIT 13 King WA 0.22 20 13.08 357 483 I 405 NB 30TH ST/EXIT 6 King WA 1.14 21 14.39 370 454 I 5 NB I 90/DEARBORN ST/EXIT 164 King WA 1.36 33 22.4
10 390 328 Hwy 520 WB 92ND AVE King WA 0.78 22 15.411 402 380 I 5 NB SEATTLE FWY/EXIT 163 King WA 1.62 32 23.112 426 1255 Hwy 518 EB I 5 King WA 0.16 19 13.213 427 513 I 405 NB HWY 900/NE 4TH ST/EXIT 4 King WA 0.53 20 14.614 442 324 I 5 NB JAMES ST/EXIT 164 King WA 0.69 28 19.615 447 644 I 405 NB 44TH ST/EXIT 7 King WA 0.66 21 16.916 557 731 I 405 NB HWY 900/N 5TH ST/EXIT 5 King WA 0.84 18 15.717 572 616 I 5 NB CORSON AVE/EXIT 162 King WA 0.45 25 22.618 610 266 I 5 SB RAVENNA BLVD/EXIT 170 King WA 0.70 24 22.319 621 886 I 5 SB LAKEVIEW BLVD/EXIT 168 King WA 0.23 20 18.420 689 1256 I 90 WB I 5 King WA 0.85 19 15.721 715 862 I 5 SB FAIRVIEW AVE/MERCER ST/EXIT 167 King WA 0.70 19 19.222 732 835 I 5 SB HWY 520/EXIT 168 King WA 1.36 19 19.523 734 374 I 5 SB HWY 522/73RD ST/EXIT 171 King WA 0.69 22 23.124 756 796 I 405 NB HWY 181/VALLEY HWY/EXIT 1 King WA 0.56 23 22.925 833 1210 I 405 NB LAKE WASHINGTON BLVD/EXIT 9 King WA 1.95 17 19.0
1.15
1.20
1.25
J F M A M J J A S O N DCBSA: Seattle-Tacoma-Bellevue WA
Congestion Compared to 2007: -28..5% Worst Metro Area (L.A.): 24%
Travel Time Index(TTI)1
TTI: 1.20 National TTI Rank: 8 Compared to 2007: -6.6%
Peak Travel Hour2
2008 Worst: Friday, 4-5 PM (TTI = 1.44) 2007 Worst: Friday, 4-5 PM (TTI = 1.55)
Population Rank: #15 (3,309,347)
Seattle Metropolitan Area
National Congestion Rank: #9 (2007 Rank: #9)
#9
Worst Bottlenecks
Overall Congestion
Travel Time Index1 by Month
LegendGreen = Roads Analyzed
Red = Bottlenecks

THE LEADING PROVIDER OF TRAFFIC INFORMATION A-10
National Traffic Scorecard 2008 Annual Report
Notes: 1 – Travel Time Index (TTI) is the ratio of actual to uncongested travel time. A ratio of 1.10 means 10% additional trip time due to congestion. 2 – Peak hours are Monday to Friday, 6 to 10 AM and 3 to 7 PM. 3 – Bottleneck “congestion” is defined as times when average hourly speed is half or less than the uncongested speed for that road segment. Additional information on the methodologies used in this report are available at http://scorecard.inrix.com.
Regional 2008 2007 Road/Direction Segment/Interchange County ST
Bottleneck Rank
Len
gth
(Mi)
Hou
rs o
f Con
gest
ion3
Avg
Spe
ed w
hen
Con
gest
ed3 (m
ph)
National
1 147 270 US 169 SB I 494/HWY 5 Hennepin MN 0.81 20 7.72 273 384 I 494 EB HWY 100/CO HWY 34/EXIT 7 Hennepin MN 0.57 25 15.53 279 768 I 494 WB LYNDALE AVE/EXIT 4 Hennepin MN 0.49 32 19.84 347 619 I 494 EB CO HWY 17/FRANCE AVE/EXIT 6 Hennepin MN 0.99 24 16.95 399 6994 I 35W SB I 94/11TH AVE/17TH AVE/EXIT 17B Hennepin MN 0.96 14 10.06 429 1292 Crosstown Hwy/Hwy 62 EB FRANCE AVE Hennepin MN 0.44 15 10.87 430 1048 I 494 WB NICOLLET AVE/4TH AVE/EXIT 4 Hennepin MN 1.24 24 18.58 450 1010 I 494 WB 12TH AVE/EXIT 3 Hennepin MN 0.26 20 16.19 453 2690 I 35W NB WASHINGTON AVE/EXIT 17C Hennepin MN 0.80 10 7.4
10 454 NR I 35W SB WASHINGTON AVE/EXIT 17C Hennepin MN 0.24 12 8.911 589 899 Crosstown Hwy/Hwy 62 EB CO HWY 32/PENN AVE Hennepin MN 0.51 23 19.512 607 696 I 494 EB BUSH LAKE RD/EXIT 8 Hennepin MN 1.61 20 19.513 628 2283 I 35W SB 36TH ST/EXIT 14 Hennepin MN 0.76 20 19.514 646 1371 Crosstown Hwy/Hwy 62 EB CO HWY 31/XERXES AVE Hennepin MN 0.54 18 15.715 788 1208 I 494 WB HWY 77/EXIT 2 Hennepin MN 0.68 17 18.716 827 2477 I 394 EB HWY 100/EXIT 5 Hennepin MN 0.84 17 18.717 841 1034 I 494 WB I 35W/HWY 5/EXIT 5 Hennepin MN 0.50 22 23.918 872 1401 US 169 NB I 394 Hennepin MN 0.63 13 14.719 877 734 Highway 169 N CO HWY 81 Hennepin MN 0.78 18 16.820 883 2271 I 35E NB I 94/EXIT 107B Ramsey MN 0.27 14 15.121 885 1181 I 94 EB 5TH ST/MARION ST/EXIT 241 Ramsey MN 0.85 12 13.822 980 2615 I 94 WB CAPPELEN MEMORIAL BRG Hennepin MN 0.08 13 15.223 1042 2998 Hwy 65 I 94 Hennepin MN 0.50 15 18.124 1045 1623 US 52 NB LAFAYETTE BRG Ramsey MN 0.05 14 15.825 1078 1384 I 94 WB I 35W/11TH ST/EXIT 233 Hennepin MN 0.70 14 17.0
1.10
1.15
1.20
J F M A M J J A S O N DCBSA: Minneapolis-St. Paul-Bloomington MN-WI
Congestion Compared to 2007: -20.5% Worst Metro Area (L.A.): 22%
Travel Time Index(TTI)1
TTI: 1.13 National TTI Rank: 13 Compared to 2007: -3.2%
Peak Travel Hour2
2008 Worst: Thursday, 5-6 PM (TTI = 1.32) 2007 Worst: Thursday, 5-6 PM (TTI = 1.41)
Population Rank: #16 (3,208,212)
Minneapolis/St. Paul Metropolitan Area
National Congestion Rank: #10 (2007 Rank: #13)
#10
Worst Bottlenecks
Overall Congestion
Travel Time Index1 by Month
LegendGreen = Roads Analyzed
Red = Bottlenecks
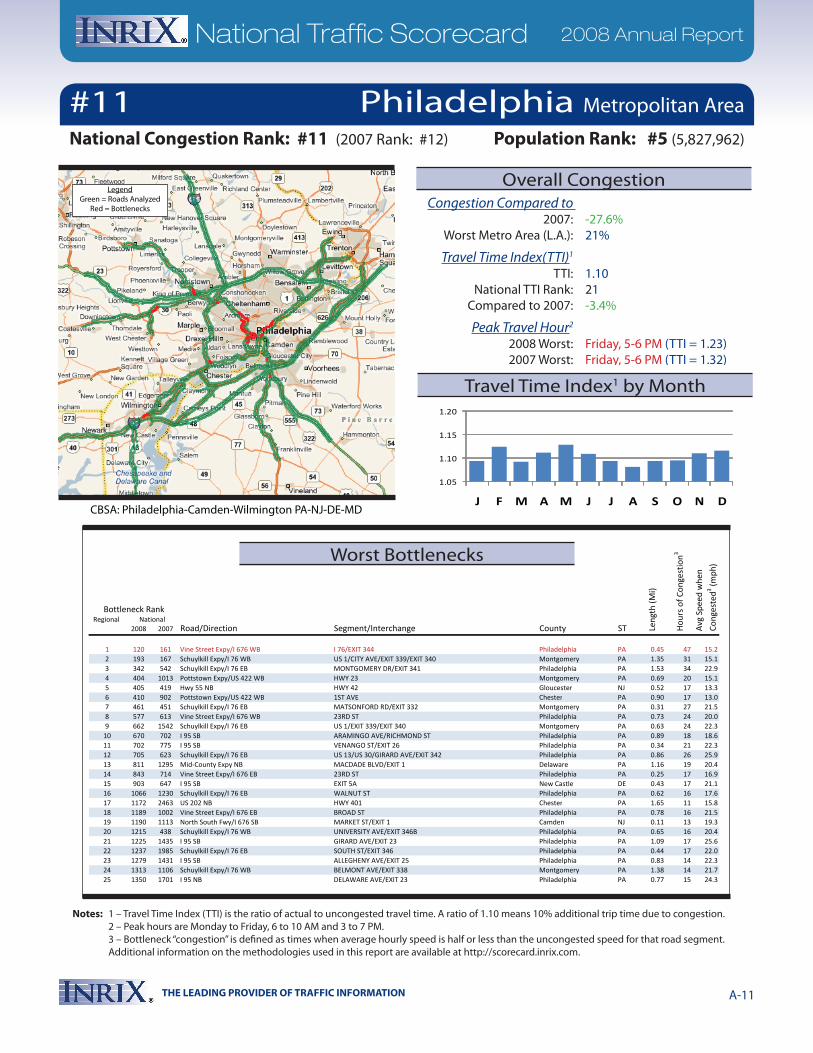
THE LEADING PROVIDER OF TRAFFIC INFORMATION A-11
National Traffic Scorecard 2008 Annual Report
Notes: 1 – Travel Time Index (TTI) is the ratio of actual to uncongested travel time. A ratio of 1.10 means 10% additional trip time due to congestion. 2 – Peak hours are Monday to Friday, 6 to 10 AM and 3 to 7 PM. 3 – Bottleneck “congestion” is defined as times when average hourly speed is half or less than the uncongested speed for that road segment. Additional information on the methodologies used in this report are available at http://scorecard.inrix.com.
Regional 2008 2007 Road/Direction Segment/Interchange County ST
Bottleneck Rank
Len
gth
(Mi)
Hou
rs o
f Con
gest
ion3
Avg
Spe
ed w
hen
Con
gest
ed3 (m
ph)
National
1 120 161 Vine Street Expy/I 676 WB I 76/EXIT 344 Philadelphia PA 0.45 47 15.22 193 167 Schuylkill Expy/I 76 WB US 1/CITY AVE/EXIT 339/EXIT 340 Montgomery PA 1.35 31 15.13 342 542 Schuylkill Expy/I 76 EB MONTGOMERY DR/EXIT 341 Philadelphia PA 1.53 34 22.94 404 1013 Pottstown Expy/US 422 WB HWY 23 Montgomery PA 0.69 20 15.15 405 419 Hwy 55 NB HWY 42 Gloucester NJ 0.52 17 13.36 410 902 Pottstown Expy/US 422 WB 1ST AVE Chester PA 0.90 17 13.07 461 451 Schuylkill Expy/I 76 EB MATSONFORD RD/EXIT 332 Montgomery PA 0.31 27 21.58 577 613 Vine Street Expy/I 676 WB 23RD ST Philadelphia PA 0.73 24 20.09 662 1542 Schuylkill Expy/I 76 EB US 1/EXIT 339/EXIT 340 Montgomery PA 0.63 24 22.3
10 670 702 I 95 SB ARAMINGO AVE/RICHMOND ST Philadelphia PA 0.89 18 18.611 702 775 I 95 SB VENANGO ST/EXIT 26 Philadelphia PA 0.34 21 22.312 705 623 Schuylkill Expy/I 76 EB US 13/US 30/GIRARD AVE/EXIT 342 Philadelphia PA 0.86 26 25.913 811 1295 Mid-County Expy NB MACDADE BLVD/EXIT 1 Delaware PA 1.16 19 20.414 843 714 Vine Street Expy/I 676 EB 23RD ST Philadelphia PA 0.25 17 16.915 903 647 I 95 SB EXIT 5A New Castle DE 0.43 17 21.116 1066 1230 Schuylkill Expy/I 76 EB WALNUT ST Philadelphia PA 0.62 16 17.617 1172 2463 US 202 NB HWY 401 Chester PA 1.65 11 15.818 1189 1002 Vine Street Expy/I 676 EB BROAD ST Philadelphia PA 0.78 16 21.519 1190 1113 North South Fwy/I 676 SB MARKET ST/EXIT 1 Camden NJ 0.11 13 19.320 1215 438 Schuylkill Expy/I 76 WB UNIVERSITY AVE/EXIT 346B Philadelphia PA 0.65 16 20.421 1225 1435 I 95 SB GIRARD AVE/EXIT 23 Philadelphia PA 1.09 17 25.622 1237 1985 Schuylkill Expy/I 76 EB SOUTH ST/EXIT 346 Philadelphia PA 0.44 17 22.023 1279 1431 I 95 SB ALLEGHENY AVE/EXIT 25 Philadelphia PA 0.83 14 22.324 1313 1106 Schuylkill Expy/I 76 WB BELMONT AVE/EXIT 338 Montgomery PA 1.38 14 21.725 1350 1701 I 95 NB DELAWARE AVE/EXIT 23 Philadelphia PA 0.77 15 24.3
1.05
1.10
1.15
1.20
J F M A M J J A S O N DCBSA: Philadelphia-Camden-Wilmington PA-NJ-DE-MD
Congestion Compared to 2007: -27.6% Worst Metro Area (L.A.): 21%
Travel Time Index(TTI)1
TTI: 1.10 National TTI Rank: 21 Compared to 2007: -3.4%
Peak Travel Hour2
2008 Worst: Friday, 5-6 PM (TTI = 1.23) 2007 Worst: Friday, 5-6 PM (TTI = 1.32)
Population Rank: #5 (5,827,962)National Congestion Rank: #11 (2007 Rank: #12)
#11 Philadelphia Metropolitan Area
Worst Bottlenecks
Overall Congestion
Travel Time Index1 by Month
LegendGreen = Roads Analyzed
Red = Bottlenecks
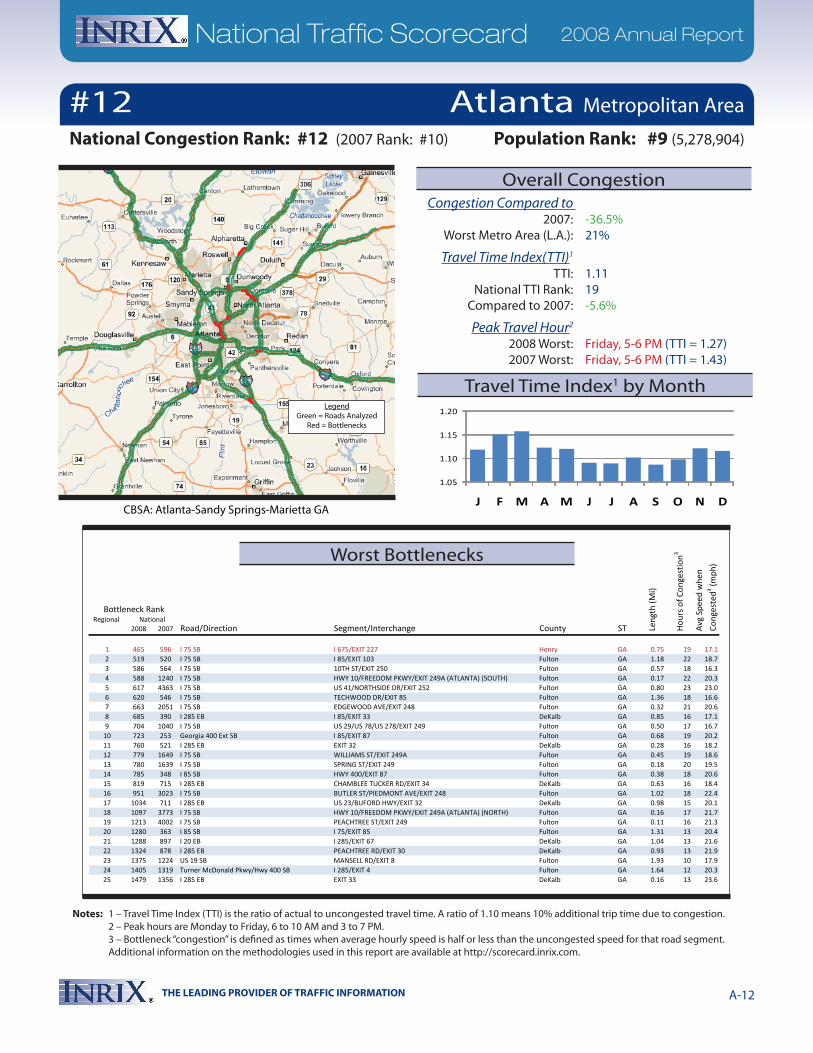
THE LEADING PROVIDER OF TRAFFIC INFORMATION A-12
National Traffic Scorecard 2008 Annual Report
Notes: 1 – Travel Time Index (TTI) is the ratio of actual to uncongested travel time. A ratio of 1.10 means 10% additional trip time due to congestion. 2 – Peak hours are Monday to Friday, 6 to 10 AM and 3 to 7 PM. 3 – Bottleneck “congestion” is defined as times when average hourly speed is half or less than the uncongested speed for that road segment. Additional information on the methodologies used in this report are available at http://scorecard.inrix.com.
Regional 2008 2007 Road/Direction Segment/Interchange County ST
Bottleneck Rank
Len
gth
(Mi)
Hou
rs o
f Con
gest
ion3
Avg
Spe
ed w
hen
Con
gest
ed3 (m
ph)
National
1 465 596 I 75 SB I 675/EXIT 227 Henry GA 0.75 19 17.12 519 520 I 75 SB I 85/EXIT 103 Fulton GA 1.18 22 18.73 586 564 I 75 SB 10TH ST/EXIT 250 Fulton GA 0.57 18 16.34 588 1240 I 75 SB HWY 10/FREEDOM PKWY/EXIT 249A (ATLANTA) (SOUTH) Fulton GA 0.17 22 20.35 617 4363 I 75 SB US 41/NORTHSIDE DR/EXIT 252 Fulton GA 0.80 23 23.06 620 546 I 75 SB TECHWOOD DR/EXIT 85 Fulton GA 1.36 18 16.67 663 2051 I 75 SB EDGEWOOD AVE/EXIT 248 Fulton GA 0.32 21 20.68 685 390 I 285 EB I 85/EXIT 33 DeKalb GA 0.85 16 17.19 704 1040 I 75 SB US 29/US 78/US 278/EXIT 249 Fulton GA 0.50 17 16.7
10 723 253 Georgia 400 Ext SB I 85/EXIT 87 Fulton GA 0.68 19 20.211 760 521 I 285 EB EXIT 32 DeKalb GA 0.28 16 18.212 779 1649 I 75 SB WILLIAMS ST/EXIT 249A Fulton GA 0.45 19 18.613 780 1639 I 75 SB SPRING ST/EXIT 249 Fulton GA 0.18 20 19.514 785 348 I 85 SB HWY 400/EXIT 87 Fulton GA 0.38 18 20.615 819 715 I 285 EB CHAMBLEE TUCKER RD/EXIT 34 DeKalb GA 0.63 16 18.416 951 3023 I 75 SB BUTLER ST/PIEDMONT AVE/EXIT 248 Fulton GA 1.02 18 22.417 1034 711 I 285 EB US 23/BUFORD HWY/EXIT 32 DeKalb GA 0.98 15 20.118 1097 3773 I 75 SB HWY 10/FREEDOM PKWY/EXIT 249A (ATLANTA) (NORTH) Fulton GA 0.16 17 21.719 1213 4002 I 75 SB PEACHTREE ST/EXIT 249 Fulton GA 0.11 16 21.320 1280 363 I 85 SB I 75/EXIT 85 Fulton GA 1.31 13 20.421 1288 897 I 20 EB I 285/EXIT 67 DeKalb GA 1.04 13 21.622 1324 878 I 285 EB PEACHTREE RD/EXIT 30 DeKalb GA 0.93 13 21.923 1375 1224 US 19 SB MANSELL RD/EXIT 8 Fulton GA 1.93 10 17.924 1405 1319 Turner McDonald Pkwy/Hwy 400 SB I 285/EXIT 4 Fulton GA 1.64 12 20.325 1479 1356 I 285 EB EXIT 33 DeKalb GA 0.16 13 23.6
1.05
1.10
1.15
1.20
J F M A M J J A S O N DCBSA: Atlanta-Sandy Springs-Marietta GA
Congestion Compared to 2007: -36.5% Worst Metro Area (L.A.): 21%
Travel Time Index(TTI)1
TTI: 1.11 National TTI Rank: 19 Compared to 2007: -5.6%
Peak Travel Hour2
2008 Worst: Friday, 5-6 PM (TTI = 1.27) 2007 Worst: Friday, 5-6 PM (TTI = 1.43)
National Congestion Rank: #12 (2007 Rank: #10) Population Rank: #9 (5,278,904)
Atlanta Metropolitan Area#12
Worst Bottlenecks
Overall Congestion
Travel Time Index1 by MonthLegend
Green = Roads AnalyzedRed = Bottlenecks
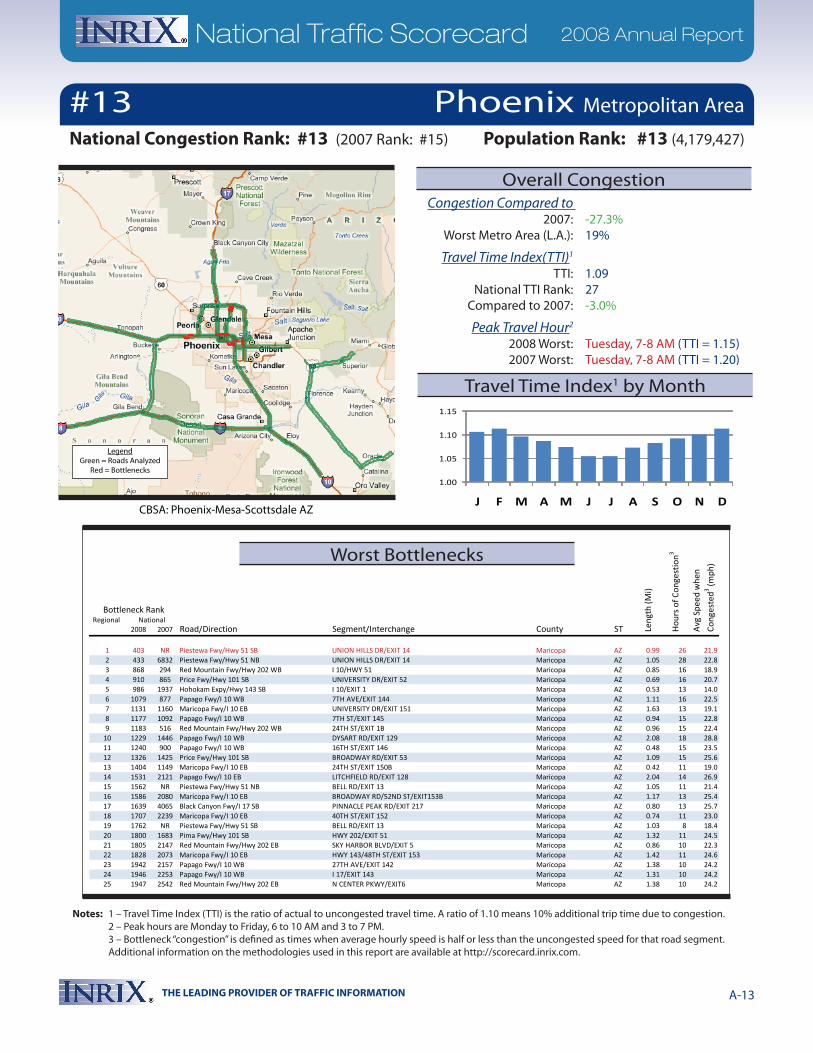
THE LEADING PROVIDER OF TRAFFIC INFORMATION A-13
National Traffic Scorecard 2008 Annual Report
Notes: 1 – Travel Time Index (TTI) is the ratio of actual to uncongested travel time. A ratio of 1.10 means 10% additional trip time due to congestion. 2 – Peak hours are Monday to Friday, 6 to 10 AM and 3 to 7 PM. 3 – Bottleneck “congestion” is defined as times when average hourly speed is half or less than the uncongested speed for that road segment. Additional information on the methodologies used in this report are available at http://scorecard.inrix.com.
Regional 2008 2007 Road/Direction Segment/Interchange County ST
Bottleneck Rank
Len
gth
(Mi)
Hou
rs o
f Con
gest
ion3
Avg
Spe
ed w
hen
Con
gest
ed3 (m
ph)
National
1 403 NR Piestewa Fwy/Hwy 51 SB UNION HILLS DR/EXIT 14 Maricopa AZ 0.99 26 21.92 433 6832 Piestewa Fwy/Hwy 51 NB UNION HILLS DR/EXIT 14 Maricopa AZ 1.05 28 22.83 868 294 Red Mountain Fwy/Hwy 202 WB I 10/HWY 51 Maricopa AZ 0.85 16 18.94 910 865 Price Fwy/Hwy 101 SB UNIVERSITY DR/EXIT 52 Maricopa AZ 0.69 16 20.75 986 1937 Hohokam Expy/Hwy 143 SB I 10/EXIT 1 Maricopa AZ 0.53 13 14.06 1079 877 Papago Fwy/I 10 WB 7TH AVE/EXIT 144 Maricopa AZ 1.11 16 22.57 1131 1160 Maricopa Fwy/I 10 EB UNIVERSITY DR/EXIT 151 Maricopa AZ 1.63 13 19.18 1177 1092 Papago Fwy/I 10 WB 7TH ST/EXIT 145 Maricopa AZ 0.94 15 22.89 1183 516 Red Mountain Fwy/Hwy 202 WB 24TH ST/EXIT 1B Maricopa AZ 0.96 15 22.4
10 1229 1446 Papago Fwy/I 10 WB DYSART RD/EXIT 129 Maricopa AZ 2.08 18 28.811 1240 900 Papago Fwy/I 10 WB 16TH ST/EXIT 146 Maricopa AZ 0.48 15 23.512 1326 1425 Price Fwy/Hwy 101 SB BROADWAY RD/EXIT 53 Maricopa AZ 1.09 15 25.613 1404 1149 Maricopa Fwy/I 10 EB 24TH ST/EXIT 150B Maricopa AZ 0.42 11 19.014 1531 2121 Papago Fwy/I 10 EB LITCHFIELD RD/EXIT 128 Maricopa AZ 2.04 14 26.915 1562 NR Piestewa Fwy/Hwy 51 NB BELL RD/EXIT 13 Maricopa AZ 1.05 11 21.416 1586 2080 Maricopa Fwy/I 10 EB BROADWAY RD/52ND ST/EXIT153B Maricopa AZ 1.17 13 25.417 1639 4065 Black Canyon Fwy/I 17 SB PINNACLE PEAK RD/EXIT 217 Maricopa AZ 0.80 13 25.718 1707 2239 Maricopa Fwy/I 10 EB 40TH ST/EXIT 152 Maricopa AZ 0.74 11 23.019 1762 NR Piestewa Fwy/Hwy 51 SB BELL RD/EXIT 13 Maricopa AZ 1.03 8 18.420 1800 1683 Pima Fwy/Hwy 101 SB HWY 202/EXIT 51 Maricopa AZ 1.32 11 24.521 1805 2147 Red Mountain Fwy/Hwy 202 EB SKY HARBOR BLVD/EXIT 5 Maricopa AZ 0.86 10 22.322 1828 2073 Maricopa Fwy/I 10 EB HWY 143/48TH ST/EXIT 153 Maricopa AZ 1.42 11 24.623 1942 2157 Papago Fwy/I 10 WB 27TH AVE/EXIT 142 Maricopa AZ 1.38 10 24.224 1946 2253 Papago Fwy/I 10 WB I 17/EXIT 143 Maricopa AZ 1.31 10 24.225 1947 2542 Red Mountain Fwy/Hwy 202 EB N CENTER PKWY/EXIT6 Maricopa AZ 1.38 10 24.2
1.00
1.05
1.10
1.15
J F M A M J J A S O N DCBSA: Phoenix-Mesa-Scottsdale AZ
Congestion Compared to 2007: -27.3% Worst Metro Area (L.A.): 19%
Travel Time Index(TTI)1
TTI: 1.09 National TTI Rank: 27 Compared to 2007: -3.0%
Peak Travel Hour2
2008 Worst: Tuesday, 7-8 AM (TTI = 1.15) 2007 Worst: Tuesday, 7-8 AM (TTI = 1.20)
Population Rank: #13 (4,179,427)
Phoenix Metropolitan Area
National Congestion Rank: #13 (2007 Rank: #15)
#13
Worst Bottlenecks
Overall Congestion
Travel Time Index1 by Month
LegendGreen = Roads Analyzed
Red = Bottlenecks
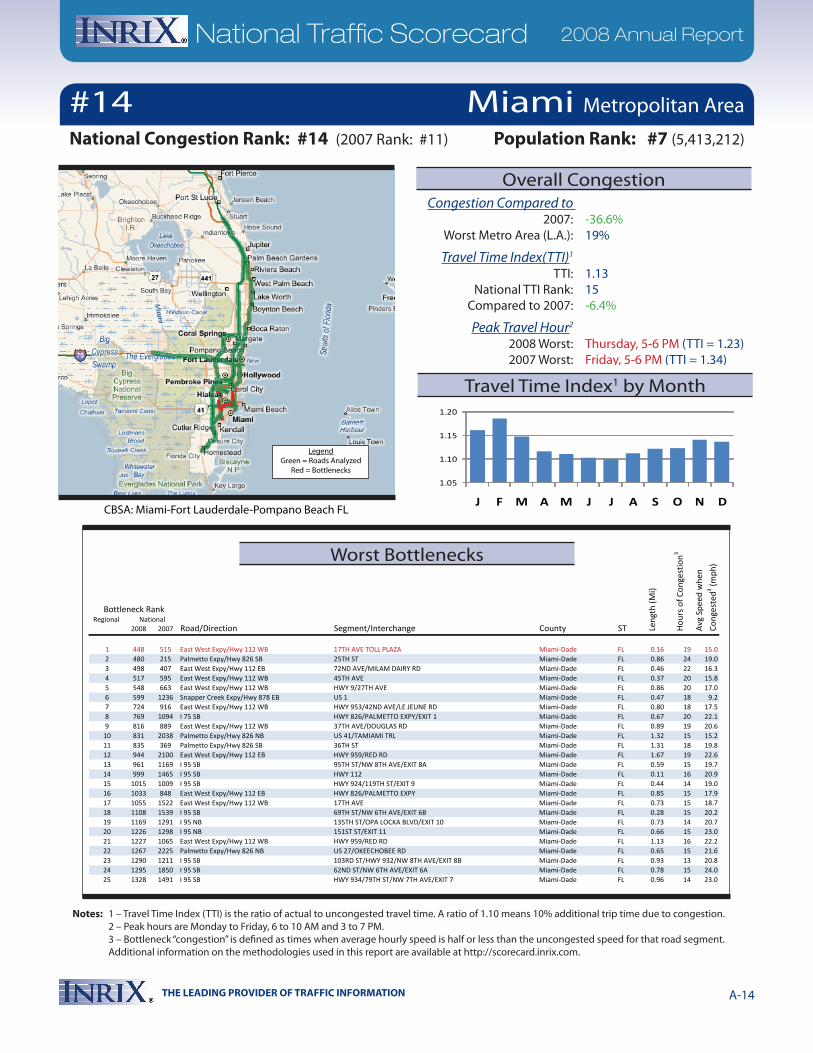
THE LEADING PROVIDER OF TRAFFIC INFORMATION A-14
National Traffic Scorecard 2008 Annual Report
Notes: 1 – Travel Time Index (TTI) is the ratio of actual to uncongested travel time. A ratio of 1.10 means 10% additional trip time due to congestion. 2 – Peak hours are Monday to Friday, 6 to 10 AM and 3 to 7 PM. 3 – Bottleneck “congestion” is defined as times when average hourly speed is half or less than the uncongested speed for that road segment. Additional information on the methodologies used in this report are available at http://scorecard.inrix.com.
Regional 2008 2007 Road/Direction Segment/Interchange County ST
Bottleneck Rank
Len
gth
(Mi)
Hou
rs o
f Con
gest
ion3
Avg
Spe
ed w
hen
Con
gest
ed3 (m
ph)
National
1 448 515 East West Expy/Hwy 112 WB 17TH AVE TOLL PLAZA Miami-Dade FL 0.16 19 15.02 480 215 Palmetto Expy/Hwy 826 SB 25TH ST Miami-Dade FL 0.86 24 19.03 498 407 East West Expy/Hwy 112 EB 72ND AVE/MILAM DAIRY RD Miami-Dade FL 0.46 22 16.34 517 595 East West Expy/Hwy 112 WB 45TH AVE Miami-Dade FL 0.37 20 15.85 548 663 East West Expy/Hwy 112 WB HWY 9/27TH AVE Miami-Dade FL 0.86 20 17.06 599 1236 Snapper Creek Expy/Hwy 878 EB US 1 Miami-Dade FL 0.47 18 9.27 724 916 East West Expy/Hwy 112 WB HWY 953/42ND AVE/LE JEUNE RD Miami-Dade FL 0.80 18 17.58 769 1094 I 75 SB HWY 826/PALMETTO EXPY/EXIT 1 Miami-Dade FL 0.67 20 22.19 816 889 East West Expy/Hwy 112 WB 37TH AVE/DOUGLAS RD Miami-Dade FL 0.89 19 20.6
10 831 2038 Palmetto Expy/Hwy 826 NB US 41/TAMIAMI TRL Miami-Dade FL 1.32 15 15.211 835 369 Palmetto Expy/Hwy 826 SB 36TH ST Miami-Dade FL 1.31 18 19.812 944 2100 East West Expy/Hwy 112 EB HWY 959/RED RD Miami-Dade FL 1.67 19 22.613 961 1169 I 95 SB 95TH ST/NW 8TH AVE/EXIT 8A Miami-Dade FL 0.59 15 19.714 999 1465 I 95 SB HWY 112 Miami-Dade FL 0.11 16 20.915 1015 1009 I 95 SB HWY 924/119TH ST/EXIT 9 Miami-Dade FL 0.44 14 19.016 1033 848 East West Expy/Hwy 112 EB HWY 826/PALMETTO EXPY Miami-Dade FL 0.85 15 17.917 1055 1522 East West Expy/Hwy 112 WB 17TH AVE Miami-Dade FL 0.73 15 18.718 1108 1539 I 95 SB 69TH ST/NW 6TH AVE/EXIT 6B Miami-Dade FL 0.28 15 20.219 1169 1291 I 95 NB 135TH ST/OPA LOCKA BLVD/EXIT 10 Miami-Dade FL 0.73 14 20.720 1226 1298 I 95 NB 151ST ST/EXIT 11 Miami-Dade FL 0.66 15 23.021 1227 1065 East West Expy/Hwy 112 WB HWY 959/RED RD Miami-Dade FL 1.13 16 22.222 1267 2225 Palmetto Expy/Hwy 826 NB US 27/OKEECHOBEE RD Miami-Dade FL 0.65 15 21.623 1290 1211 I 95 SB 103RD ST/HWY 932/NW 8TH AVE/EXIT 8B Miami-Dade FL 0.93 13 20.824 1295 1850 I 95 SB 62ND ST/NW 6TH AVE/EXIT 6A Miami-Dade FL 0.78 15 24.025 1328 1491 I 95 SB HWY 934/79TH ST/NW 7TH AVE/EXIT 7 Miami-Dade FL 0.96 14 23.0
1.05
1.10
1.15
1.20
J F M A M J J A S O N DCBSA: Miami-Fort Lauderdale-Pompano Beach FL
Congestion Compared to 2007: -36.6% Worst Metro Area (L.A.): 19%
Travel Time Index(TTI)1
TTI: 1.13 National TTI Rank: 15 Compared to 2007: -6.4%
Peak Travel Hour2
2008 Worst: Thursday, 5 -6 PM (TTI = 1.23) 2007 Worst: Friday, 5-6 PM (TTI = 1.34)
Population Rank: #7 (5,413,212)
Miami Metropolitan Area
National Congestion Rank: #14 (2007 Rank: #11)
#14
Worst Bottlenecks
Overall Congestion
Travel Time Index1 by Month
LegendGreen = Roads Analyzed
Red = Bottlenecks
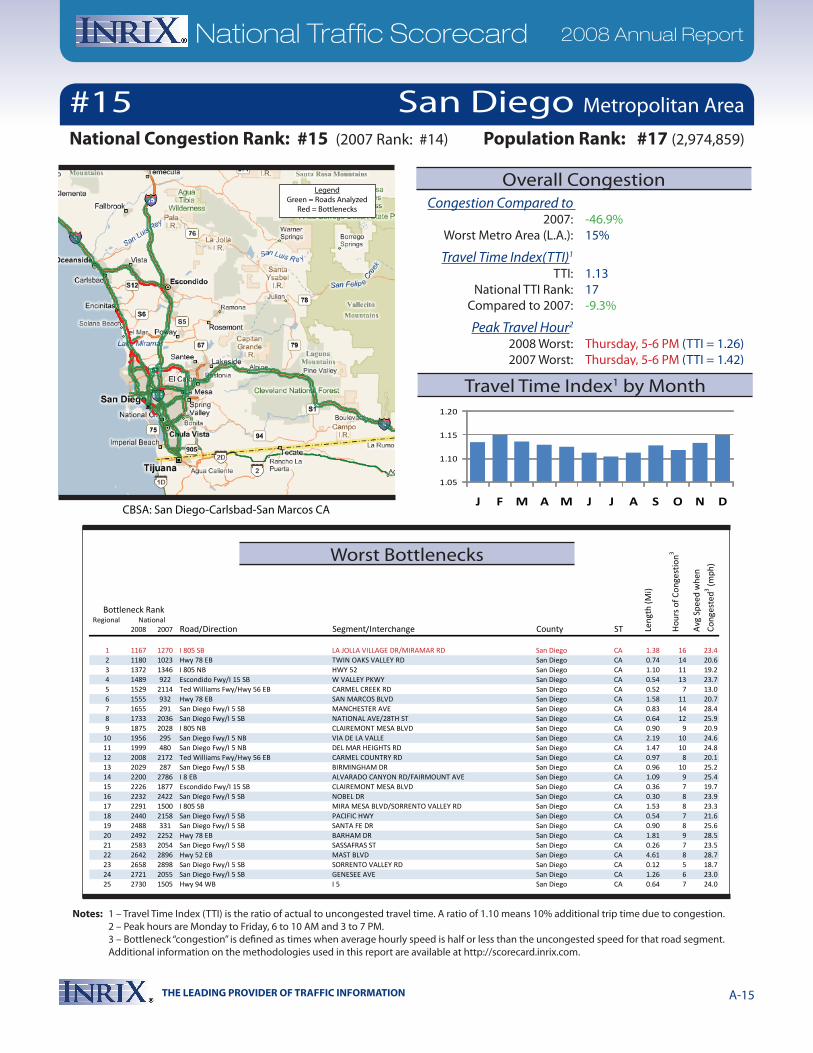
THE LEADING PROVIDER OF TRAFFIC INFORMATION A-15
National Traffic Scorecard 2008 Annual Report
Notes: 1 – Travel Time Index (TTI) is the ratio of actual to uncongested travel time. A ratio of 1.10 means 10% additional trip time due to congestion. 2 – Peak hours are Monday to Friday, 6 to 10 AM and 3 to 7 PM. 3 – Bottleneck “congestion” is defined as times when average hourly speed is half or less than the uncongested speed for that road segment. Additional information on the methodologies used in this report are available at http://scorecard.inrix.com.
Regional 2008 2007 Road/Direction Segment/Interchange County ST
Bottleneck Rank
Len
gth
(Mi)
Hou
rs o
f Con
gest
ion3
Avg
Spe
ed w
hen
Con
gest
ed3 (m
ph)
National
1 1167 1270 I 805 SB LA JOLLA VILLAGE DR/MIRAMAR RD San Diego CA 1.38 16 23.42 1180 1023 Hwy 78 EB TWIN OAKS VALLEY RD San Diego CA 0.74 14 20.63 1372 1346 I 805 NB HWY 52 San Diego CA 1.10 11 19.24 1489 922 Escondido Fwy/I 15 SB W VALLEY PKWY San Diego CA 0.54 13 23.75 1529 2114 Ted Williams Fwy/Hwy 56 EB CARMEL CREEK RD San Diego CA 0.52 7 13.06 1555 932 Hwy 78 EB SAN MARCOS BLVD San Diego CA 1.58 11 20.77 1655 291 San Diego Fwy/I 5 SB MANCHESTER AVE San Diego CA 0.83 14 28.48 1733 2036 San Diego Fwy/I 5 SB NATIONAL AVE/28TH ST San Diego CA 0.64 12 25.99 1875 2028 I 805 NB CLAIREMONT MESA BLVD San Diego CA 0.90 9 20.9
10 1956 295 San Diego Fwy/I 5 NB VIA DE LA VALLE San Diego CA 2.19 10 24.611 1999 480 San Diego Fwy/I 5 NB DEL MAR HEIGHTS RD San Diego CA 1.47 10 24.812 2008 2172 Ted Williams Fwy/Hwy 56 EB CARMEL COUNTRY RD San Diego CA 0.97 8 20.113 2029 287 San Diego Fwy/I 5 SB BIRMINGHAM DR San Diego CA 0.96 10 25.214 2200 2786 I 8 EB ALVARADO CANYON RD/FAIRMOUNT AVE San Diego CA 1.09 9 25.415 2226 1877 Escondido Fwy/I 15 SB CLAIREMONT MESA BLVD San Diego CA 0.36 7 19.716 2232 2422 San Diego Fwy/I 5 SB NOBEL DR San Diego CA 0.30 8 23.917 2291 1500 I 805 SB MIRA MESA BLVD/SORRENTO VALLEY RD San Diego CA 1.53 8 23.318 2440 2158 San Diego Fwy/I 5 SB PACIFIC HWY San Diego CA 0.54 7 21.619 2488 331 San Diego Fwy/I 5 SB SANTA FE DR San Diego CA 0.90 8 25.620 2492 2252 Hwy 78 EB BARHAM DR San Diego CA 1.81 9 28.521 2583 2054 San Diego Fwy/I 5 SB SASSAFRAS ST San Diego CA 0.26 7 23.522 2642 2896 Hwy 52 EB MAST BLVD San Diego CA 4.61 8 28.723 2658 2898 San Diego Fwy/I 5 SB SORRENTO VALLEY RD San Diego CA 0.12 5 18.724 2721 2055 San Diego Fwy/I 5 SB GENESEE AVE San Diego CA 1.26 6 23.025 2730 1505 Hwy 94 WB I 5 San Diego CA 0.64 7 24.0
1.05
1.10
1.15
1.20
J F M A M J J A S O N DCBSA: San Diego-Carlsbad-San Marcos CA
Congestion Compared to 2007: -46.9% Worst Metro Area (L.A.): 15%
Travel Time Index(TTI)1
TTI: 1.13 National TTI Rank: 17 Compared to 2007: -9.3%
Peak Travel Hour2
2008 Worst: Thursday, 5 -6 PM (TTI = 1.26) 2007 Worst: Thursday, 5 -6 PM (TTI = 1.42)
Population Rank: #17 (2,974,859)
San Diego Metropolitan Area
National Congestion Rank: #15 (2007 Rank: #14)
#15
Worst Bottlenecks
Overall Congestion
Travel Time Index1 by Month
LegendGreen = Roads Analyzed
Red = Bottlenecks
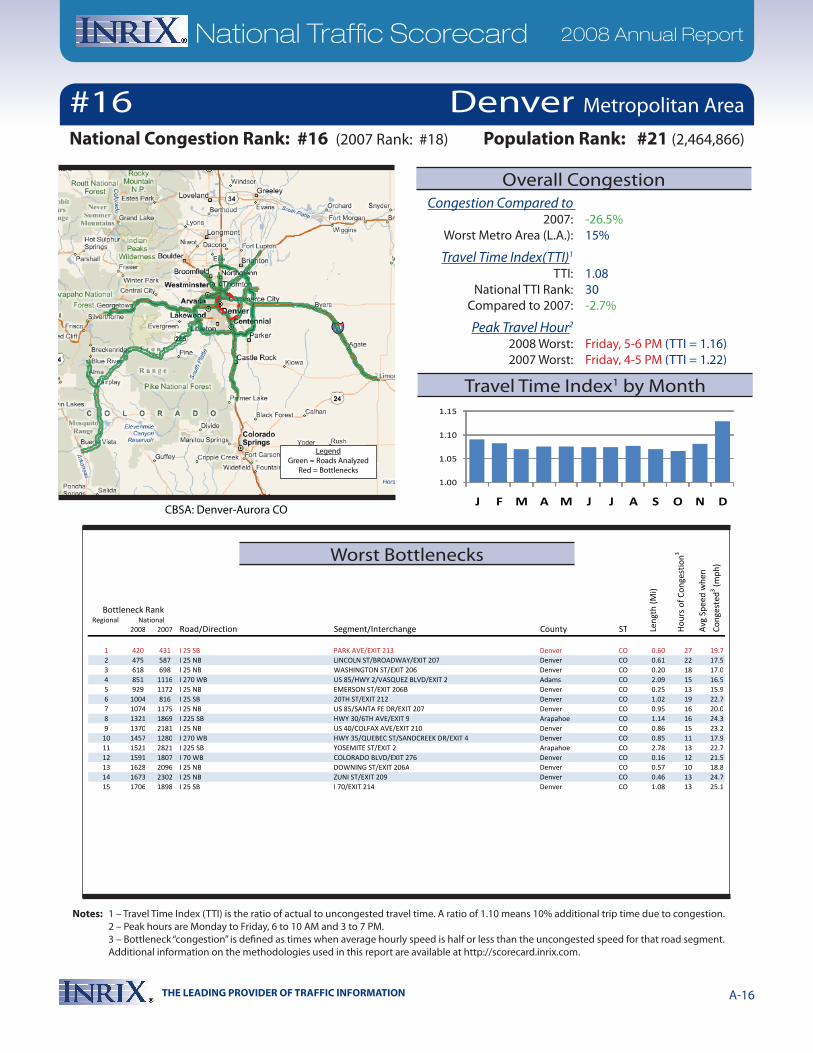
THE LEADING PROVIDER OF TRAFFIC INFORMATION A-16
National Traffic Scorecard 2008 Annual Report
Notes: 1 – Travel Time Index (TTI) is the ratio of actual to uncongested travel time. A ratio of 1.10 means 10% additional trip time due to congestion. 2 – Peak hours are Monday to Friday, 6 to 10 AM and 3 to 7 PM. 3 – Bottleneck “congestion” is defined as times when average hourly speed is half or less than the uncongested speed for that road segment. Additional information on the methodologies used in this report are available at http://scorecard.inrix.com.
Regional 2008 2007 Road/Direction Segment/Interchange County ST
1 420 431 I 25 SB PARK AVE/EXIT 213 Denver CO 0.60 27 19.72 475 587 I 25 NB LINCOLN ST/BROADWAY/EXIT 207 Denver CO 0.61 22 17.53 618 698 I 25 NB WASHINGTON ST/EXIT 206 Denver CO 0.20 18 17.04 851 1116 I 270 WB US 85/HWY 2/VASQUEZ BLVD/EXIT 2 Adams CO 2.09 15 16.55 929 1172 I 25 NB EMERSON ST/EXIT 206B Denver CO 0.25 13 15.96 1004 816 I 25 SB 20TH ST/EXIT 212 Denver CO 1.02 19 22.77 1074 1175 I 25 NB US 85/SANTA FE DR/EXIT 207 Denver CO 0.95 16 20.08 1321 1869 I 225 SB HWY 30/6TH AVE/EXIT 9 Arapahoe CO 1.14 16 24.39 1370 2181 I 25 NB US 40/COLFAX AVE/EXIT 210 Denver CO 0.86 15 23.2
10 1457 1280 I 270 WB HWY 35/QUEBEC ST/SANDCREEK DR/EXIT 4 Denver CO 0.85 11 17.911 1521 2821 I 225 SB YOSEMITE ST/EXIT 2 Arapahoe CO 2.78 13 22.712 1591 1807 I 70 WB COLORADO BLVD/EXIT 276 Denver CO 0.16 12 21.513 1628 2096 I 25 NB DOWNING ST/EXIT 206A Denver CO 0.57 10 18.814 1673 2302 I 25 NB ZUNI ST/EXIT 209 Denver CO 0.46 13 24.715 1706 1898 I 25 SB I 70/EXIT 214 Denver CO 1.08 13 25.1
Bottleneck Rank
Len
gth
(Mi)
Hou
rs o
f Con
gest
ion3
Avg
Spe
ed w
hen
Con
gest
ed3 (m
ph)
National
1.00
1.05
1.10
1.15
J F M A M J J A S O N DCBSA: Denver-Aurora CO
Congestion Compared to 2007: -26.5% Worst Metro Area (L.A.): 15%
Travel Time Index(TTI)1
TTI: 1.08 National TTI Rank: 30 Compared to 2007: -2.7%
Peak Travel Hour2
2008 Worst: Friday, 5-6 PM (TTI = 1.16) 2007 Worst: Friday, 4-5 PM (TTI = 1.22)
Population Rank: #21 (2,464,866)
Denver Metropolitan Area
National Congestion Rank: #16 (2007 Rank: #18)
#16
Worst Bottlenecks
Overall Congestion
Travel Time Index1 by Month
LegendGreen = Roads Analyzed
Red = Bottlenecks
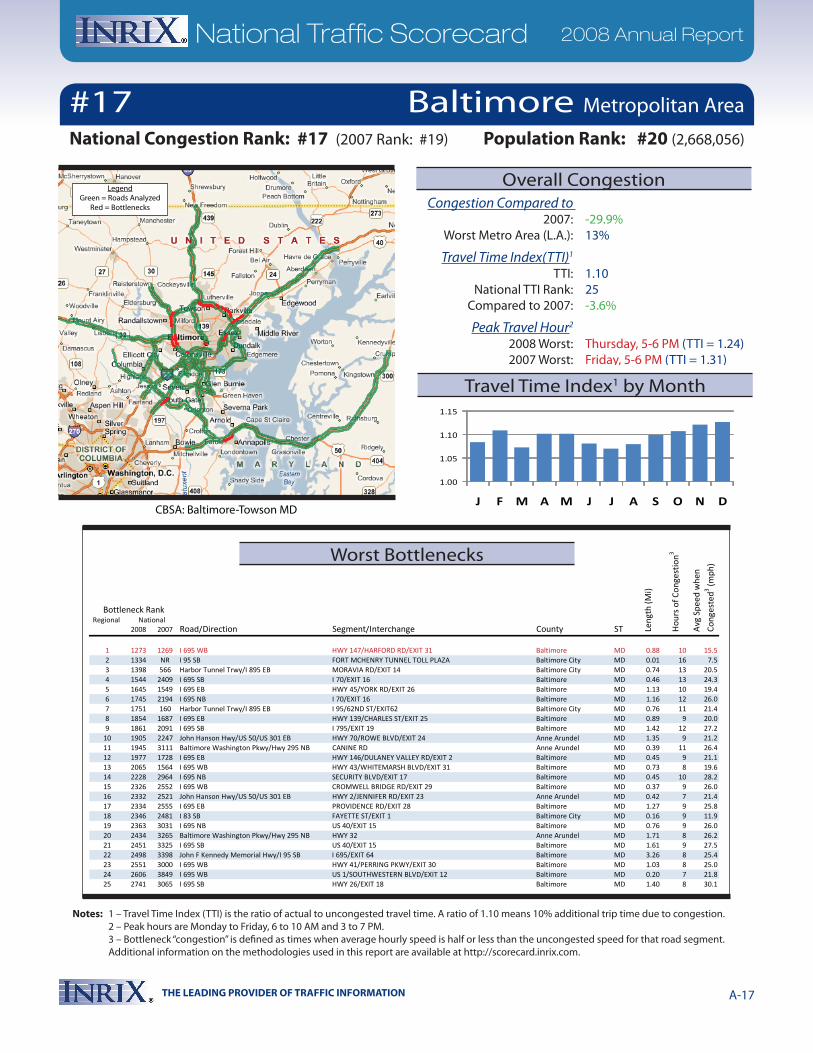
THE LEADING PROVIDER OF TRAFFIC INFORMATION A-17
National Traffic Scorecard 2008 Annual Report
Notes: 1 – Travel Time Index (TTI) is the ratio of actual to uncongested travel time. A ratio of 1.10 means 10% additional trip time due to congestion. 2 – Peak hours are Monday to Friday, 6 to 10 AM and 3 to 7 PM. 3 – Bottleneck “congestion” is defined as times when average hourly speed is half or less than the uncongested speed for that road segment. Additional information on the methodologies used in this report are available at http://scorecard.inrix.com.
Regional 2008 2007 Road/Direction Segment/Interchange County ST
Bottleneck Rank
Len
gth
(Mi)
Hou
rs o
f Con
gest
ion3
Avg
Spe
ed w
hen
Con
gest
ed3 (m
ph)
National
1 1273 1269 I 695 WB HWY 147/HARFORD RD/EXIT 31 Baltimore MD 0.88 10 15.52 1334 NR I 95 SB FORT MCHENRY TUNNEL TOLL PLAZA Baltimore City MD 0.01 16 7.53 1398 566 Harbor Tunnel Trwy/I 895 EB MORAVIA RD/EXIT 14 Baltimore City MD 0.74 13 20.54 1544 2409 I 695 SB I 70/EXIT 16 Baltimore MD 0.46 13 24.35 1645 1549 I 695 EB HWY 45/YORK RD/EXIT 26 Baltimore MD 1.13 10 19.46 1745 2194 I 695 NB I 70/EXIT 16 Baltimore MD 1.16 12 26.07 1751 160 Harbor Tunnel Trwy/I 895 EB I 95/62ND ST/EXIT62 Baltimore City MD 0.76 11 21.48 1854 1687 I 695 EB HWY 139/CHARLES ST/EXIT 25 Baltimore MD 0.89 9 20.09 1861 2091 I 695 SB I 795/EXIT 19 Baltimore MD 1.42 12 27.2
10 1905 2247 John Hanson Hwy/US 50/US 301 EB HWY 70/ROWE BLVD/EXIT 24 Anne Arundel MD 1.35 9 21.211 1945 3111 Baltimore Washington Pkwy/Hwy 295 NB CANINE RD Anne Arundel MD 0.39 11 26.412 1977 1728 I 695 EB HWY 146/DULANEY VALLEY RD/EXIT 2 Baltimore MD 0.45 9 21.113 2065 1564 I 695 WB HWY 43/WHITEMARSH BLVD/EXIT 31 Baltimore MD 0.73 8 19.614 2228 2964 I 695 NB SECURITY BLVD/EXIT 17 Baltimore MD 0.45 10 28.215 2326 2552 I 695 WB CROMWELL BRIDGE RD/EXIT 29 Baltimore MD 0.37 9 26.016 2332 2521 John Hanson Hwy/US 50/US 301 EB HWY 2/JENNIFER RD/EXIT 23 Anne Arundel MD 0.42 7 21.417 2334 2555 I 695 EB PROVIDENCE RD/EXIT 28 Baltimore MD 1.27 9 25.818 2346 2481 I 83 SB FAYETTE ST/EXIT 1 Baltimore City MD 0.16 9 11.919 2363 3031 I 695 NB US 40/EXIT 15 Baltimore MD 0.76 9 26.020 2434 3265 Baltimore Washington Pkwy/Hwy 295 NB HWY 32 Anne Arundel MD 1.71 8 26.221 2451 3325 I 695 SB US 40/EXIT 15 Baltimore MD 1.61 9 27.522 2498 3398 John F Kennedy Memorial Hwy/I 95 SB I 695/EXIT 64 Baltimore MD 3.26 8 25.423 2551 3000 I 695 WB HWY 41/PERRING PKWY/EXIT 30 Baltimore MD 1.03 8 25.024 2606 3849 I 695 WB US 1/SOUTHWESTERN BLVD/EXIT 12 Baltimore MD 0.20 7 21.825 2741 3065 I 695 SB HWY 26/EXIT 18 Baltimore MD 1.40 8 30.1
1.00
1.05
1.10
1.15
J F M A M J J A S O N DCBSA: Baltimore-Towson MD
Congestion Compared to 2007: -29.9% Worst Metro Area (L.A.): 13%
Travel Time Index(TTI)1
TTI: 1.10 National TTI Rank: 25 Compared to 2007: -3.6%
Peak Travel Hour2
2008 Worst: Thursday, 5 -6 PM (TTI = 1.24) 2007 Worst: Friday, 5-6 PM (TTI = 1.31)
Population Rank: #20 (2,668,056)
Baltimore Metropolitan Area
National Congestion Rank: #17 (2007 Rank: #19)
#17
Worst Bottlenecks
Overall Congestion
Travel Time Index1 by Month
LegendGreen = Roads Analyzed
Red = Bottlenecks
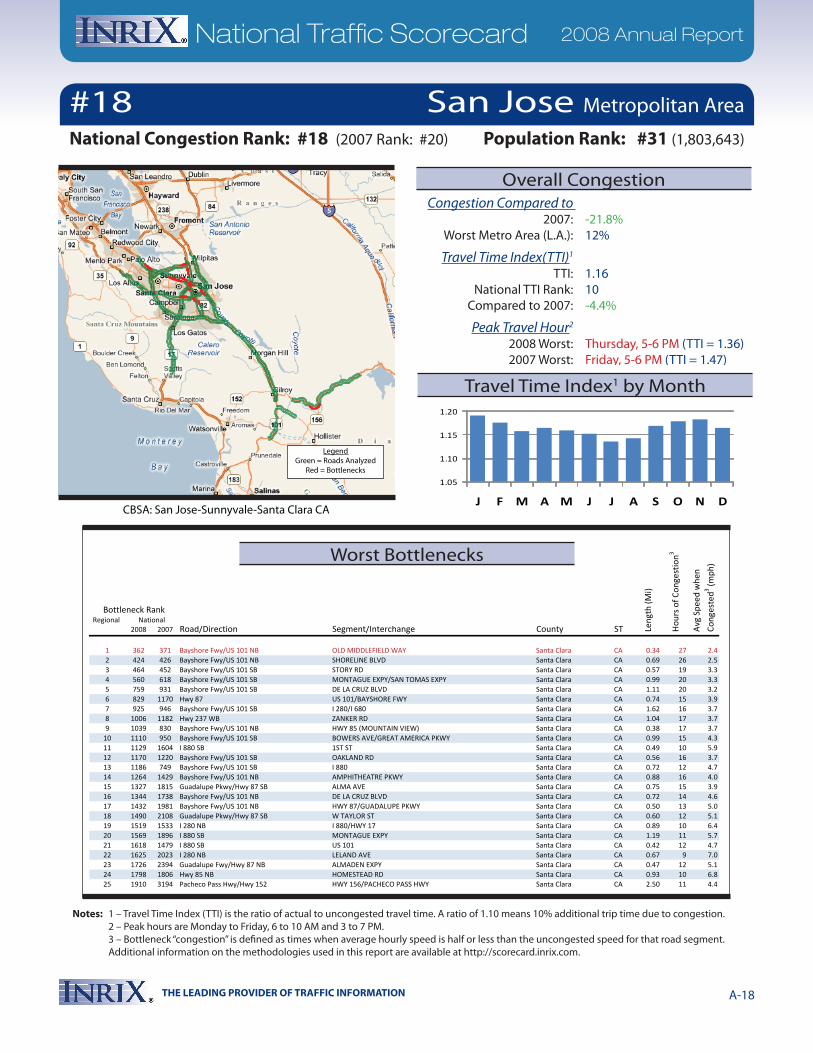
THE LEADING PROVIDER OF TRAFFIC INFORMATION A-18
National Traffic Scorecard 2008 Annual Report
Notes: 1 – Travel Time Index (TTI) is the ratio of actual to uncongested travel time. A ratio of 1.10 means 10% additional trip time due to congestion. 2 – Peak hours are Monday to Friday, 6 to 10 AM and 3 to 7 PM. 3 – Bottleneck “congestion” is defined as times when average hourly speed is half or less than the uncongested speed for that road segment. Additional information on the methodologies used in this report are available at http://scorecard.inrix.com.
Regional 2008 2007 Road/Direction Segment/Interchange County ST
1 362 371 Bayshore Fwy/US 101 NB OLD MIDDLEFIELD WAY Santa Clara CA 0.34 27 2.42 424 426 Bayshore Fwy/US 101 NB SHORELINE BLVD Santa Clara CA 0.69 26 2.53 464 452 Bayshore Fwy/US 101 SB STORY RD Santa Clara CA 0.57 19 3.34 560 618 Bayshore Fwy/US 101 SB MONTAGUE EXPY/SAN TOMAS EXPY Santa Clara CA 0.99 20 3.35 759 931 Bayshore Fwy/US 101 SB DE LA CRUZ BLVD Santa Clara CA 1.11 20 3.26 829 1170 Hwy 87 US 101/BAYSHORE FWY Santa Clara CA 0.74 15 3.97 925 946 Bayshore Fwy/US 101 SB I 280/I 680 Santa Clara CA 1.62 16 3.78 1006 1182 Hwy 237 WB ZANKER RD Santa Clara CA 1.04 17 3.79 1039 830 Bayshore Fwy/US 101 NB HWY 85 (MOUNTAIN VIEW) Santa Clara CA 0.38 17 3.7
10 1110 950 Bayshore Fwy/US 101 SB BOWERS AVE/GREAT AMERICA PKWY Santa Clara CA 0.99 15 4.311 1129 1604 I 880 SB 1ST ST Santa Clara CA 0.49 10 5.912 1170 1220 Bayshore Fwy/US 101 SB OAKLAND RD Santa Clara CA 0.56 16 3.713 1186 749 Bayshore Fwy/US 101 SB I 880 Santa Clara CA 0.72 12 4.714 1264 1429 Bayshore Fwy/US 101 NB AMPHITHEATRE PKWY Santa Clara CA 0.88 16 4.015 1327 1815 Guadalupe Pkwy/Hwy 87 SB ALMA AVE Santa Clara CA 0.75 15 3.916 1344 1738 Bayshore Fwy/US 101 NB DE LA CRUZ BLVD Santa Clara CA 0.72 14 4.617 1432 1981 Bayshore Fwy/US 101 NB HWY 87/GUADALUPE PKWY Santa Clara CA 0.50 13 5.018 1490 2108 Guadalupe Pkwy/Hwy 87 SB W TAYLOR ST Santa Clara CA 0.60 12 5.119 1519 1533 I 280 NB I 880/HWY 17 Santa Clara CA 0.89 10 6.420 1569 1896 I 880 SB MONTAGUE EXPY Santa Clara CA 1.19 11 5.721 1618 1479 I 880 SB US 101 Santa Clara CA 0.42 12 4.722 1625 2023 I 280 NB LELAND AVE Santa Clara CA 0.67 9 7.023 1726 2394 Guadalupe Fwy/Hwy 87 NB ALMADEN EXPY Santa Clara CA 0.47 12 5.124 1798 1806 Hwy 85 NB HOMESTEAD RD Santa Clara CA 0.93 10 6.825 1910 3194 Pacheco Pass Hwy/Hwy 152 HWY 156/PACHECO PASS HWY Santa Clara CA 2.50 11 4.4
Bottleneck Rank
Len
gth
(Mi)
Hou
rs o
f Con
gest
ion3
Avg
Spe
ed w
hen
Con
gest
ed3 (m
ph)
National
1.05
1.10
1.15
1.20
J F M A M J J A S O N DCBSA: San Jose-Sunnyvale-Santa Clara CA
Congestion Compared to 2007: -21.8% Worst Metro Area (L.A.): 12%
Travel Time Index(TTI)1
TTI: 1.16 National TTI Rank: 10 Compared to 2007: -4.4%
Peak Travel Hour2
2008 Worst: Thursday, 5 -6 PM (TTI = 1.36) 2007 Worst: Friday, 5-6 PM (TTI = 1.47)
Population Rank: #31 (1,803,643)
San Jose Metropolitan Area
National Congestion Rank: #18 (2007 Rank: #20)
#18
Worst Bottlenecks
Overall Congestion
Travel Time Index1 by Month
LegendGreen = Roads Analyzed
Red = Bottlenecks

THE LEADING PROVIDER OF TRAFFIC INFORMATION A-19
National Traffic Scorecard 2008 Annual Report
Notes: 1 – Travel Time Index (TTI) is the ratio of actual to uncongested travel time. A ratio of 1.10 means 10% additional trip time due to congestion. 2 – Peak hours are Monday to Friday, 6 to 10 AM and 3 to 7 PM. 3 – Bottleneck “congestion” is defined as times when average hourly speed is half or less than the uncongested speed for that road segment. Additional information on the methodologies used in this report are available at http://scorecard.inrix.com.
Regional 2008 2007 Road/Direction Segment/Interchange County ST
1 516 907 Edsel Ford Fwy/I 94 WB HWY 10/JOHN C LODGE FWY/EXIT 215 Wayne MI 0.65 20 16.82 695 1121 Edsel Ford Fwy/I 94 WB TRUMBULL ST/EXIT 214 Wayne MI 0.24 19 18.83 758 NR Fisher Fwy/I 75 NB I 96/PORTER ST/EXIT 48 Wayne MI 0.39 19 19.14 897 1905 Edsel Ford Fwy/I 94 WB EDSEL FORD FWY/EXIT 215C Wayne MI 0.73 16 18.45 907 NR Fisher Fwy/I 75 SB LAFAYETTE BLVD/EXIT 47 Wayne MI 0.38 21 24.76 915 1028 Edsel Ford Fwy/I 94 EB LINWOOD ST/EXIT 214 Wayne MI 0.34 21 24.07 955 NR Fisher Fwy/I 75 SB I 96/PORTER ST/EXIT 48 Wayne MI 0.81 22 26.38 1242 NR Fisher Fwy/I 75 NB LAFAYETTE BLVD/EXIT 47 Wayne MI 0.36 18 25.09 1514 1273 Edsel Ford Fwy/I 94 EB I 96/EXIT 213 Wayne MI 0.54 14 24.5
10 1607 6863 Edsel Ford Fwy/I 94 WB I 75/CHRYSLER FWY/EXIT 216 Wayne MI 0.77 13 23.111 1699 2869 Southfield Fwy/Hwy 39 NB JOY RD/EXIT 9 Wayne MI 0.97 13 25.112 1735 1776 Edsel Ford Fwy/I 94 EB I 75/CHRYSLER FWY/EXIT 216 Wayne MI 0.62 10 19.513 1759 2934 Southfield Fwy/Hwy 39 NB WARREN AVE/EXIT 8 Wayne MI 0.83 11 21.414 1773 NR Detroit Industrial Fwy EB WYOMING AVE Wayne MI 0.40 13 27.015 2091 5260 Southfield Fwy/Hwy 39 NB FORD RD/EXIT 7 Wayne MI 1.18 9 21.416 2165 NR Edsel Ford Fwy/I 94 EB WEIR ST Wayne MI 0.29 10 25.417 2318 NR Edsel Ford Fwy/I 94 EB LIVERNOIS AVE/EXIT 212 Wayne MI 0.57 10 27.518 2384 2967 Edsel Ford Fwy/I 94 EB EDSEL FORD FWY/EXIT 215C Wayne MI 0.83 9 24.919 2409 NR Edsel Ford Fwy/I 94 EB ADDISON ST/EXIT 210 Wayne MI 0.14 9 25.320 2427 5636 Chrysler Fwy/I 75 NB UNIVERSITY DR/EXIT 79 Oakland MI 1.40 8 25.921 2466 5642 Chrysler Fwy/I 75 NB CHRYSLER DR/EXIT 78 Oakland MI 1.57 8 26.422 2470 1466 I 696 EB HWY 10/EXIT 10 Oakland MI 0.59 7 22.423 2497 2889 Edsel Ford Fwy/I 94 EB CHENE ST/EXIT 217 Wayne MI 0.74 8 24.124 2522 1341 Edsel Ford Fwy/I 94 EB HWY 10/JOHN C LODGE FWY/EXIT 215 Wayne MI 0.54 7 21.025 2618 NR Edsel Ford Fwy/I 94 EB CECIL ST/EXIT 211 Wayne MI 0.57 8 26.0
Bottleneck Rank
Len
gth
(Mi)
Hou
rs o
f Con
gest
ion3
Avg
Spe
ed w
hen
Con
gest
ed3 (m
ph)
National
1.00
1.05
1.10
1.15
J F M A M J J A S O N DCBSA: Detroit-Warren-Livonia MI
Congestion Compared to 2007: -46.9% Worst Metro Area (L.A.): 12%
Travel Time Index(TTI)1
TTI: 1.08 National TTI Rank: 33 Compared to 2007: -6.1%
Peak Travel Hour2
2008 Worst: Friday, 5-6 PM (TTI = 1.19) 2007 Worst: Friday, 5-6 PM (TTI = 1.26)
Population Rank: #11 (4,467,592)
Detroit Metropolitan Area
National Congestion Rank: #19 (2007 Rank: #17)
#19
Worst Bottlenecks
Overall Congestion
Travel Time Index1 by Month
LegendGreen = Roads Analyzed
Red = Bottlenecks
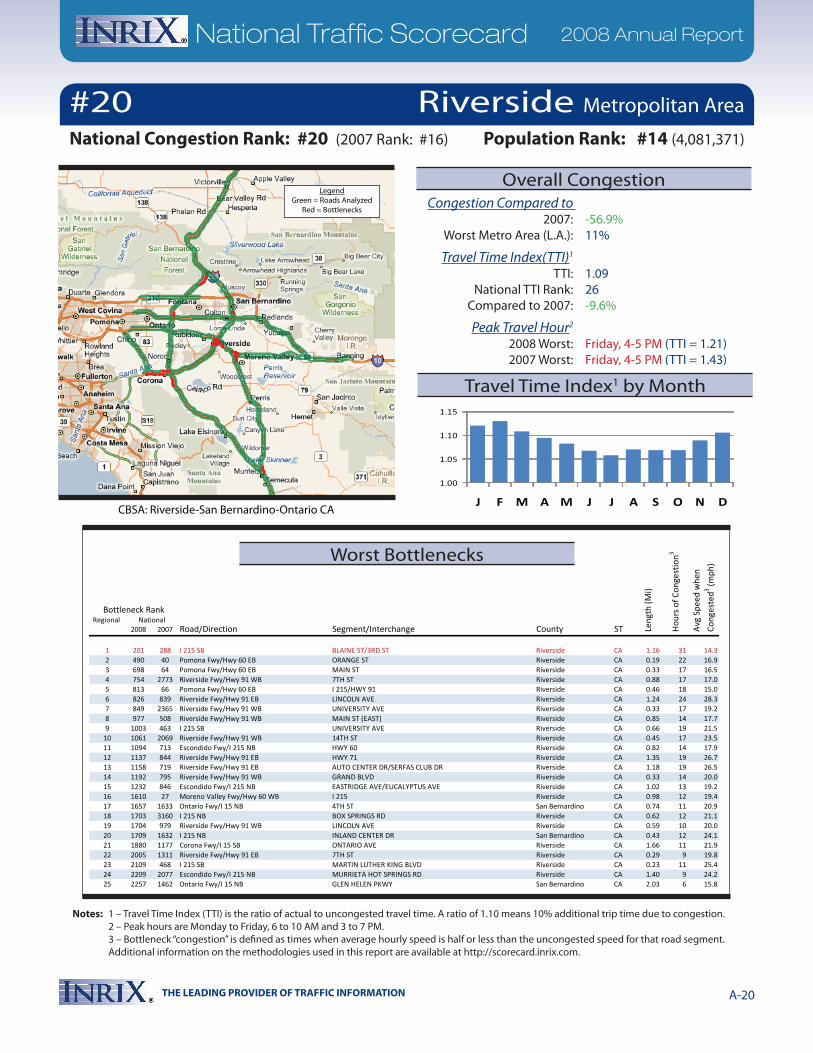
THE LEADING PROVIDER OF TRAFFIC INFORMATION A-20
National Traffic Scorecard 2008 Annual Report
Notes: 1 – Travel Time Index (TTI) is the ratio of actual to uncongested travel time. A ratio of 1.10 means 10% additional trip time due to congestion. 2 – Peak hours are Monday to Friday, 6 to 10 AM and 3 to 7 PM. 3 – Bottleneck “congestion” is defined as times when average hourly speed is half or less than the uncongested speed for that road segment. Additional information on the methodologies used in this report are available at http://scorecard.inrix.com.
Regional 2008 2007 Road/Direction Segment/Interchange County ST
Bottleneck Rank
Len
gth
(Mi)
Hou
rs o
f Con
gest
ion3
Avg
Spe
ed w
hen
Con
gest
ed3 (m
ph)
National
1 201 288 I 215 SB BLAINE ST/3RD ST Riverside CA 1.16 31 14.32 490 40 Pomona Fwy/Hwy 60 EB ORANGE ST Riverside CA 0.19 22 16.93 698 64 Pomona Fwy/Hwy 60 EB MAIN ST Riverside CA 0.33 17 16.54 754 2773 Riverside Fwy/Hwy 91 WB 7TH ST Riverside CA 0.88 17 17.05 813 66 Pomona Fwy/Hwy 60 EB I 215/HWY 91 Riverside CA 0.46 18 15.06 826 839 Riverside Fwy/Hwy 91 EB LINCOLN AVE Riverside CA 1.24 24 28.37 849 2365 Riverside Fwy/Hwy 91 WB UNIVERSITY AVE Riverside CA 0.33 17 19.28 977 508 Riverside Fwy/Hwy 91 WB MAIN ST (EAST) Riverside CA 0.85 14 17.79 1003 463 I 215 SB UNIVERSITY AVE Riverside CA 0.66 19 21.5
10 1061 2069 Riverside Fwy/Hwy 91 WB 14TH ST Riverside CA 0.45 17 23.511 1094 713 Escondido Fwy/I 215 NB HWY 60 Riverside CA 0.82 14 17.912 1137 844 Riverside Fwy/Hwy 91 EB HWY 71 Riverside CA 1.35 19 26.713 1158 719 Riverside Fwy/Hwy 91 EB AUTO CENTER DR/SERFAS CLUB DR Riverside CA 1.18 19 26.514 1192 795 Riverside Fwy/Hwy 91 WB GRAND BLVD Riverside CA 0.33 14 20.015 1232 846 Escondido Fwy/I 215 NB EASTRIDGE AVE/EUCALYPTUS AVE Riverside CA 1.02 13 19.216 1610 27 Moreno Valley Fwy/Hwy 60 WB I 215 Riverside CA 0.98 12 19.417 1657 1633 Ontario Fwy/I 15 NB 4TH ST San Bernardino CA 0.74 11 20.918 1703 3160 I 215 NB BOX SPRINGS RD Riverside CA 0.62 12 21.119 1704 979 Riverside Fwy/Hwy 91 WB LINCOLN AVE Riverside CA 0.59 10 20.020 1709 1632 I 215 NB INLAND CENTER DR San Bernardino CA 0.43 12 24.121 1880 1177 Corona Fwy/I 15 SB ONTARIO AVE Riverside CA 1.66 11 21.922 2005 1311 Riverside Fwy/Hwy 91 EB 7TH ST Riverside CA 0.29 9 19.823 2109 468 I 215 SB MARTIN LUTHER KING BLVD Riverside CA 0.23 11 25.424 2209 2077 Escondido Fwy/I 215 NB MURRIETA HOT SPRINGS RD Riverside CA 1.40 9 24.225 2257 1462 Ontario Fwy/I 15 NB GLEN HELEN PKWY San Bernardino CA 2.03 6 15.8
1.00
1.05
1.10
1.15
J F M A M J J A S O N DCBSA: Riverside-San Bernardino-Ontario CA
Congestion Compared to 2007: -56.9% Worst Metro Area (L.A.): 11%
Travel Time Index(TTI)1
TTI: 1.09 National TTI Rank: 26 Compared to 2007: -9.6%
Peak Travel Hour2
2008 Worst: Friday, 4-5 PM (TTI = 1.21) 2007 Worst: Friday, 4-5 PM (TTI = 1.43)
Population Rank: #14 (4,081,371)
Riverside Metropolitan Area
National Congestion Rank: #20 (2007 Rank: #16)
#20
Worst Bottlenecks
Overall Congestion
Travel Time Index1 by Month
LegendGreen = Roads Analyzed
Red = Bottlenecks
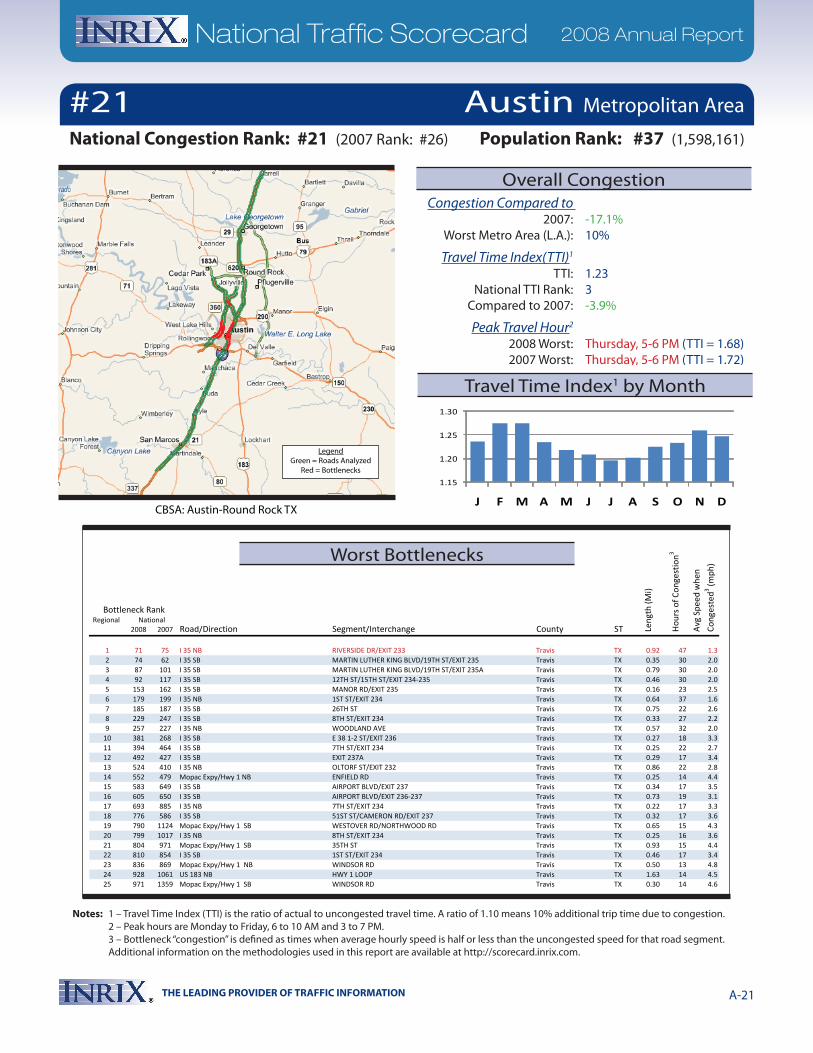
THE LEADING PROVIDER OF TRAFFIC INFORMATION A-21
National Traffic Scorecard 2008 Annual Report
Notes: 1 – Travel Time Index (TTI) is the ratio of actual to uncongested travel time. A ratio of 1.10 means 10% additional trip time due to congestion. 2 – Peak hours are Monday to Friday, 6 to 10 AM and 3 to 7 PM. 3 – Bottleneck “congestion” is defined as times when average hourly speed is half or less than the uncongested speed for that road segment. Additional information on the methodologies used in this report are available at http://scorecard.inrix.com.
1.15
1.20
1.25
1.30
J F M A M J J A S O N DCBSA: Austin-Round Rock TX
Congestion Compared to 2007: -17.1% Worst Metro Area (L.A.): 10%
Travel Time Index(TTI)1
TTI: 1.23 National TTI Rank: 3 Compared to 2007: -3.9%
Peak Travel Hour2
2008 Worst: Thursday, 5-6 PM (TTI = 1.68) 2007 Worst: Thursday, 5-6 PM (TTI = 1.72)
Population Rank: #37 (1,598,161)
Austin Metropolitan Area
National Congestion Rank: #21 (2007 Rank: #26)
#21
Regional 2008 2007 Road/Direction Segment/Interchange County ST
Bottleneck Rank
Len
gth
(Mi)
Hou
rs o
f Con
gest
ion3
Avg
Spe
ed w
hen
Con
gest
ed3 (m
ph)
National
1 71 75 I 35 NB RIVERSIDE DR/EXIT 233 Travis TX 0.92 47 1.32 74 62 I 35 SB MARTIN LUTHER KING BLVD/19TH ST/EXIT 235 Travis TX 0.35 30 2.03 87 101 I 35 SB MARTIN LUTHER KING BLVD/19TH ST/EXIT 235A Travis TX 0.79 30 2.04 92 117 I 35 SB 12TH ST/15TH ST/EXIT 234-235 Travis TX 0.46 30 2.05 153 162 I 35 SB MANOR RD/EXIT 235 Travis TX 0.16 23 2.56 179 199 I 35 NB 1ST ST/EXIT 234 Travis TX 0.64 37 1.67 185 187 I 35 SB 26TH ST Travis TX 0.75 22 2.68 229 247 I 35 SB 8TH ST/EXIT 234 Travis TX 0.33 27 2.29 257 227 I 35 NB WOODLAND AVE Travis TX 0.57 32 2.0
10 381 268 I 35 SB E 38 1-2 ST/EXIT 236 Travis TX 0.27 18 3.311 394 464 I 35 SB 7TH ST/EXIT 234 Travis TX 0.25 22 2.712 492 427 I 35 SB EXIT 237A Travis TX 0.29 17 3.413 524 410 I 35 NB OLTORF ST/EXIT 232 Travis TX 0.86 22 2.814 552 479 Mopac Expy/Hwy 1 NB ENFIELD RD Travis TX 0.25 14 4.415 583 649 I 35 SB AIRPORT BLVD/EXIT 237 Travis TX 0.34 17 3.516 605 650 I 35 SB AIRPORT BLVD/EXIT 236-237 Travis TX 0.73 19 3.117 693 885 I 35 NB 7TH ST/EXIT 234 Travis TX 0.22 17 3.318 776 586 I 35 SB 51ST ST/CAMERON RD/EXIT 237 Travis TX 0.32 17 3.619 790 1124 Mopac Expy/Hwy 1 SB WESTOVER RD/NORTHWOOD RD Travis TX 0.65 15 4.320 799 1017 I 35 NB 8TH ST/EXIT 234 Travis TX 0.25 16 3.621 804 971 Mopac Expy/Hwy 1 SB 35TH ST Travis TX 0.93 15 4.422 810 854 I 35 SB 1ST ST/EXIT 234 Travis TX 0.46 17 3.423 836 869 Mopac Expy/Hwy 1 NB WINDSOR RD Travis TX 0.50 13 4.824 928 1061 US 183 NB HWY 1 LOOP Travis TX 1.63 14 4.525 971 1359 Mopac Expy/Hwy 1 SB WINDSOR RD Travis TX 0.30 14 4.6
Worst Bottlenecks
Overall Congestion
Travel Time Index1 by Month
LegendGreen = Roads Analyzed
Red = Bottlenecks
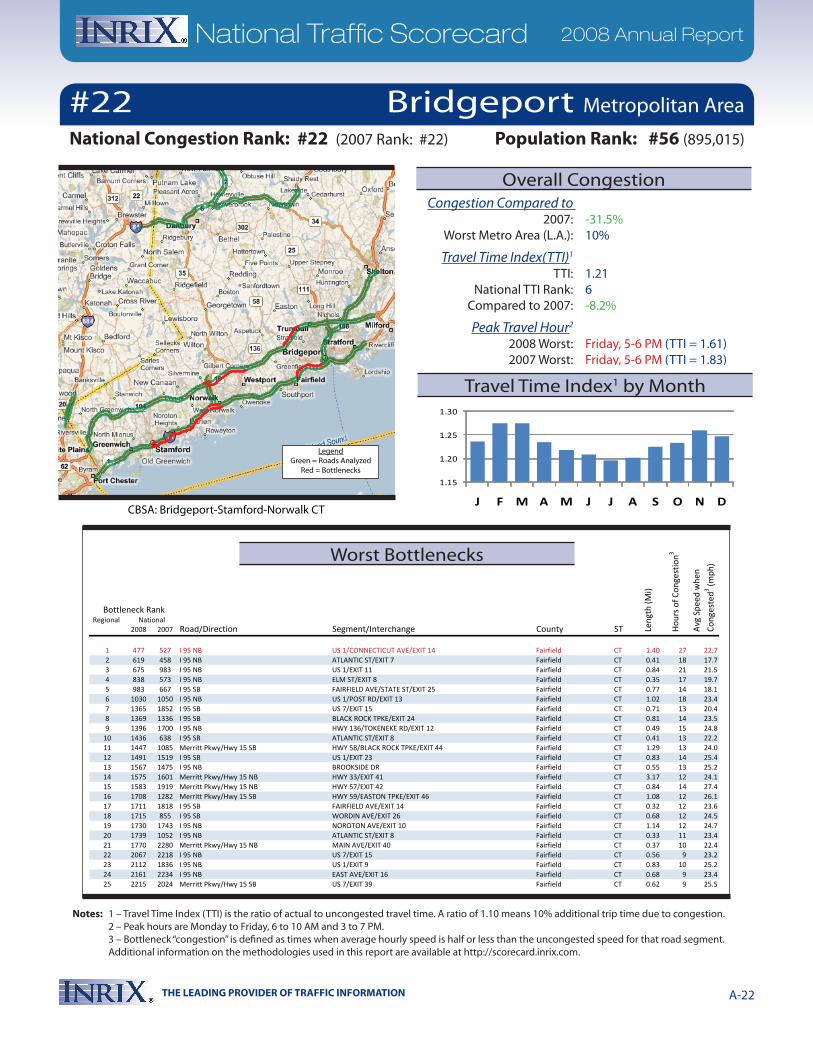
THE LEADING PROVIDER OF TRAFFIC INFORMATION A-22
National Traffic Scorecard 2008 Annual Report
Notes: 1 – Travel Time Index (TTI) is the ratio of actual to uncongested travel time. A ratio of 1.10 means 10% additional trip time due to congestion. 2 – Peak hours are Monday to Friday, 6 to 10 AM and 3 to 7 PM. 3 – Bottleneck “congestion” is defined as times when average hourly speed is half or less than the uncongested speed for that road segment. Additional information on the methodologies used in this report are available at http://scorecard.inrix.com.
Regional 2008 2007 Road/Direction Segment/Interchange County ST
Bottleneck Rank
Len
gth
(Mi)
Hou
rs o
f Con
gest
ion3
Avg
Spe
ed w
hen
Con
gest
ed3 (m
ph)
National
1 477 527 I 95 NB US 1/CONNECTICUT AVE/EXIT 14 Fairfield CT 1.40 27 22.72 619 458 I 95 NB ATLANTIC ST/EXIT 7 Fairfield CT 0.41 18 17.73 675 983 I 95 NB US 1/EXIT 11 Fairfield CT 0.84 21 21.54 838 573 I 95 NB ELM ST/EXIT 8 Fairfield CT 0.35 17 19.75 983 667 I 95 SB FAIRFIELD AVE/STATE ST/EXIT 25 Fairfield CT 0.77 14 18.16 1030 1050 I 95 NB US 1/POST RD/EXIT 13 Fairfield CT 1.02 18 23.47 1365 1852 I 95 SB US 7/EXIT 15 Fairfield CT 0.71 13 20.48 1369 1336 I 95 SB BLACK ROCK TPKE/EXIT 24 Fairfield CT 0.81 14 23.59 1396 1700 I 95 NB HWY 136/TOKENEKE RD/EXIT 12 Fairfield CT 0.49 15 24.8
10 1436 638 I 95 SB ATLANTIC ST/EXIT 8 Fairfield CT 0.41 13 22.211 1447 1085 Merritt Pkwy/Hwy 15 SB HWY 58/BLACK ROCK TPKE/EXIT 44 Fairfield CT 1.29 13 24.012 1491 1519 I 95 SB US 1/EXIT 23 Fairfield CT 0.83 14 25.413 1567 1475 I 95 NB BROOKSIDE DR Fairfield CT 0.55 13 25.214 1575 1601 Merritt Pkwy/Hwy 15 NB HWY 33/EXIT 41 Fairfield CT 3.17 12 24.115 1583 1919 Merritt Pkwy/Hwy 15 NB HWY 57/EXIT 42 Fairfield CT 0.84 14 27.416 1708 1282 Merritt Pkwy/Hwy 15 SB HWY 59/EASTON TPKE/EXIT 46 Fairfield CT 1.08 12 26.117 1711 1818 I 95 SB FAIRFIELD AVE/EXIT 14 Fairfield CT 0.32 12 23.618 1715 855 I 95 SB WORDIN AVE/EXIT 26 Fairfield CT 0.68 12 24.519 1730 1743 I 95 NB NOROTON AVE/EXIT 10 Fairfield CT 1.14 12 24.720 1739 1052 I 95 NB ATLANTIC ST/EXIT 8 Fairfield CT 0.33 11 23.421 1770 2280 Merritt Pkwy/Hwy 15 NB MAIN AVE/EXIT 40 Fairfield CT 0.37 10 22.422 2067 2218 I 95 NB US 7/EXIT 15 Fairfield CT 0.56 9 23.223 2112 1836 I 95 NB US 1/EXIT 9 Fairfield CT 0.83 10 25.224 2161 2234 I 95 NB EAST AVE/EXIT 16 Fairfield CT 0.68 9 23.425 2215 2024 Merritt Pkwy/Hwy 15 SB US 7/EXIT 39 Fairfield CT 0.62 9 25.5
1.15
1.20
1.25
1.30
J F M A M J J A S O N DCBSA: Bridgeport-Stamford-Norwalk CT
Congestion Compared to 2007: -31.5% Worst Metro Area (L.A.): 10%
Travel Time Index(TTI)1
TTI: 1.21 National TTI Rank: 6 Compared to 2007: -8.2%
Peak Travel Hour2
2008 Worst: Friday, 5-6 PM (TTI = 1.61) 2007 Worst: Friday, 5-6 PM (TTI = 1.83)
National Congestion Rank: #22 (2007 Rank: #22) Population Rank: #56 (895,015)
Bridgeport Metropolitan Area#22
Worst Bottlenecks
Overall Congestion
Travel Time Index1 by Month
LegendGreen = Roads Analyzed
Red = Bottlenecks
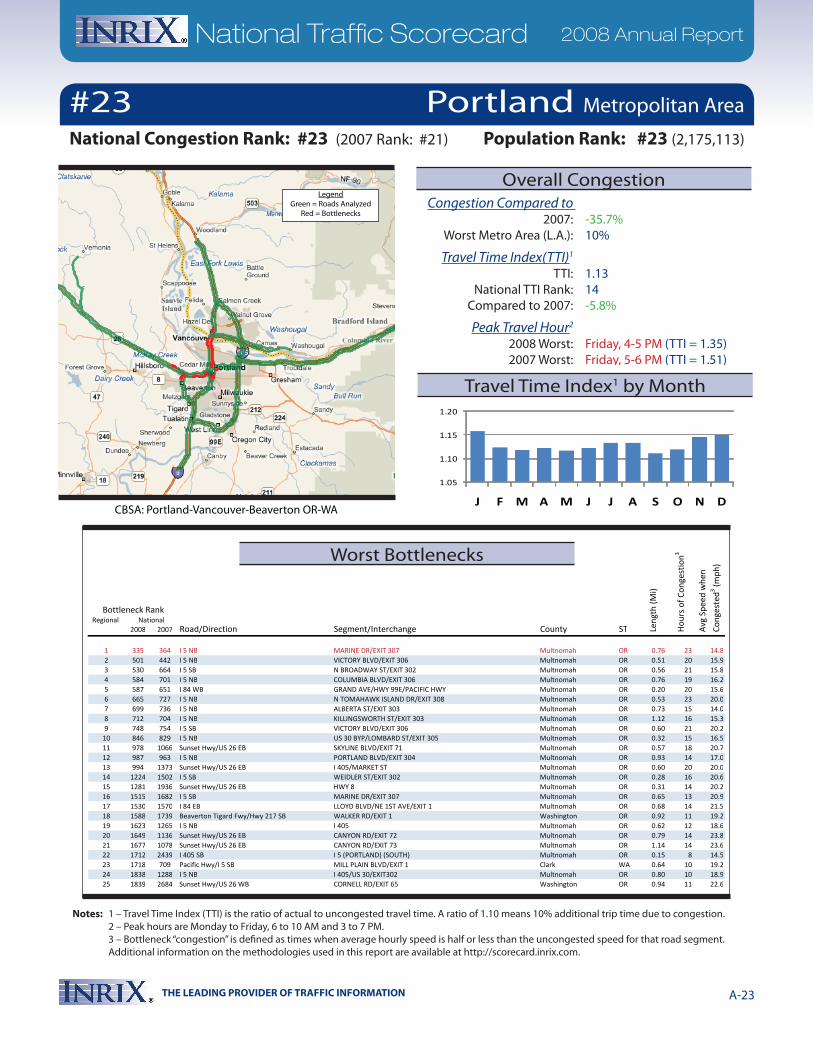
THE LEADING PROVIDER OF TRAFFIC INFORMATION A-23
National Traffic Scorecard 2008 Annual Report
Notes: 1 – Travel Time Index (TTI) is the ratio of actual to uncongested travel time. A ratio of 1.10 means 10% additional trip time due to congestion. 2 – Peak hours are Monday to Friday, 6 to 10 AM and 3 to 7 PM. 3 – Bottleneck “congestion” is defined as times when average hourly speed is half or less than the uncongested speed for that road segment. Additional information on the methodologies used in this report are available at http://scorecard.inrix.com.
Regional 2008 2007 Road/Direction Segment/Interchange County ST
Bottleneck Rank
Len
gth
(Mi)
Hou
rs o
f Con
gest
ion3
Avg
Spe
ed w
hen
Con
gest
ed3 (m
ph)
National
1 335 364 I 5 NB MARINE DR/EXIT 307 Multnomah OR 0.76 23 14.82 501 442 I 5 NB VICTORY BLVD/EXIT 306 Multnomah OR 0.51 20 15.93 530 664 I 5 SB N BROADWAY ST/EXIT 302 Multnomah OR 0.56 21 15.84 584 701 I 5 NB COLUMBIA BLVD/EXIT 306 Multnomah OR 0.76 19 16.25 587 651 I 84 WB GRAND AVE/HWY 99E/PACIFIC HWY Multnomah OR 0.20 20 15.66 665 727 I 5 NB N TOMAHAWK ISLAND DR/EXIT 308 Multnomah OR 0.53 23 20.07 699 736 I 5 NB ALBERTA ST/EXIT 303 Multnomah OR 0.73 15 14.08 712 704 I 5 NB KILLINGSWORTH ST/EXIT 303 Multnomah OR 1.12 16 15.39 748 754 I 5 SB VICTORY BLVD/EXIT 306 Multnomah OR 0.60 21 20.2
10 846 829 I 5 NB US 30 BYP/LOMBARD ST/EXIT 305 Multnomah OR 0.32 15 16.511 978 1066 Sunset Hwy/US 26 EB SKYLINE BLVD/EXIT 71 Multnomah OR 0.57 18 20.712 987 963 I 5 NB PORTLAND BLVD/EXIT 304 Multnomah OR 0.93 14 17.013 994 1373 Sunset Hwy/US 26 EB I 405/MARKET ST Multnomah OR 0.60 20 20.014 1224 1502 I 5 SB WEIDLER ST/EXIT 302 Multnomah OR 0.28 16 20.615 1281 1936 Sunset Hwy/US 26 EB HWY 8 Multnomah OR 0.31 14 20.216 1515 1682 I 5 SB MARINE DR/EXIT 307 Multnomah OR 0.65 13 20.917 1530 1570 I 84 EB LLOYD BLVD/NE 1ST AVE/EXIT 1 Multnomah OR 0.68 14 21.518 1588 1739 Beaverton Tigard Fwy/Hwy 217 SB WALKER RD/EXIT 1 Washington OR 0.92 11 19.219 1623 1265 I 5 NB I 405 Multnomah OR 0.62 12 18.620 1649 1136 Sunset Hwy/US 26 EB CANYON RD/EXIT 72 Multnomah OR 0.79 14 23.821 1677 1078 Sunset Hwy/US 26 EB CANYON RD/EXIT 73 Multnomah OR 1.14 14 23.622 1712 2439 I 405 SB I 5 (PORTLAND) (SOUTH) Multnomah OR 0.15 8 14.523 1718 709 Pacific Hwy/I 5 SB MILL PLAIN BLVD/EXIT 1 Clark WA 0.64 10 19.224 1838 1288 I 5 NB I 405/US 30/EXIT302 Multnomah OR 0.80 10 18.925 1839 2684 Sunset Hwy/US 26 WB CORNELL RD/EXIT 65 Washington OR 0.94 11 22.6
1.05
1.10
1.15
1.20
J F M A M J J A S O N DCBSA: Portland-Vancouver-Beaverton OR-WA
Congestion Compared to 2007: -35.7% Worst Metro Area (L.A.): 10%
Travel Time Index(TTI)1
TTI: 1.13 National TTI Rank: 14 Compared to 2007: -5.8%
Peak Travel Hour2
2008 Worst: Friday, 4-5 PM (TTI = 1.35) 2007 Worst: Friday, 5-6 PM (TTI = 1.51)
#23Population Rank: #23 (2,175,113)
Portland Metropolitan Area
National Congestion Rank: #23 (2007 Rank: #21)
Worst Bottlenecks
Overall Congestion
Travel Time Index1 by Month
LegendGreen = Roads Analyzed
Red = Bottlenecks
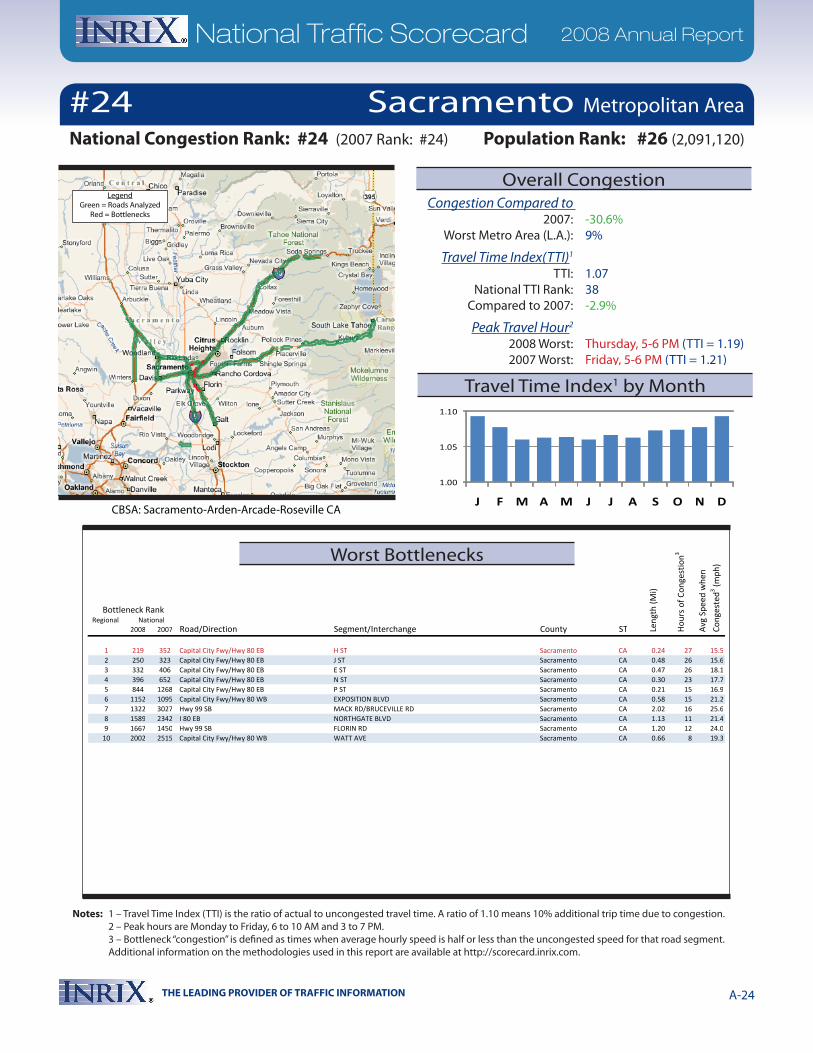
THE LEADING PROVIDER OF TRAFFIC INFORMATION A-24
National Traffic Scorecard 2008 Annual Report
Notes: 1 – Travel Time Index (TTI) is the ratio of actual to uncongested travel time. A ratio of 1.10 means 10% additional trip time due to congestion. 2 – Peak hours are Monday to Friday, 6 to 10 AM and 3 to 7 PM. 3 – Bottleneck “congestion” is defined as times when average hourly speed is half or less than the uncongested speed for that road segment. Additional information on the methodologies used in this report are available at http://scorecard.inrix.com.
Regional 2008 2007 Road/Direction Segment/Interchange County ST
Bottleneck Rank
Len
gth
(Mi)
Hou
rs o
f Con
gest
ion3
Avg
Spe
ed w
hen
Con
gest
ed3 (m
ph)
National
1 219 352 Capital City Fwy/Hwy 80 EB H ST Sacramento CA 0.24 27 15.52 250 323 Capital City Fwy/Hwy 80 EB J ST Sacramento CA 0.48 26 15.63 332 406 Capital City Fwy/Hwy 80 EB E ST Sacramento CA 0.47 26 18.14 396 652 Capital City Fwy/Hwy 80 EB N ST Sacramento CA 0.30 23 17.75 844 1268 Capital City Fwy/Hwy 80 EB P ST Sacramento CA 0.21 15 16.96 1152 1095 Capital City Fwy/Hwy 80 WB EXPOSITION BLVD Sacramento CA 0.58 15 21.27 1322 3027 Hwy 99 SB MACK RD/BRUCEVILLE RD Sacramento CA 2.02 16 25.68 1589 2342 I 80 EB NORTHGATE BLVD Sacramento CA 1.13 11 21.49 1667 1450 Hwy 99 SB FLORIN RD Sacramento CA 1.20 12 24.0
10 2002 2515 Capital City Fwy/Hwy 80 WB WATT AVE Sacramento CA 0.66 8 19.3
1.00
1.05
1.10
J F M A M J J A S O N DCBSA: Sacramento-Arden-Arcade-Roseville CA
Congestion Compared to 2007: -30.6% Worst Metro Area (L.A.): 9%
Travel Time Index(TTI)1
TTI: 1.07 National TTI Rank: 38 Compared to 2007: -2.9%
Peak Travel Hour2
2008 Worst: Thursday, 5-6 PM (TTI = 1.19) 2007 Worst: Friday, 5-6 PM (TTI = 1.21)
Population Rank: #26 (2,091,120)
Sacramento Metropolitan Area
National Congestion Rank: #24 (2007 Rank: #24)
#24
Worst Bottlenecks
Overall Congestion
Travel Time Index1 by Month
LegendGreen = Roads Analyzed
Red = Bottlenecks
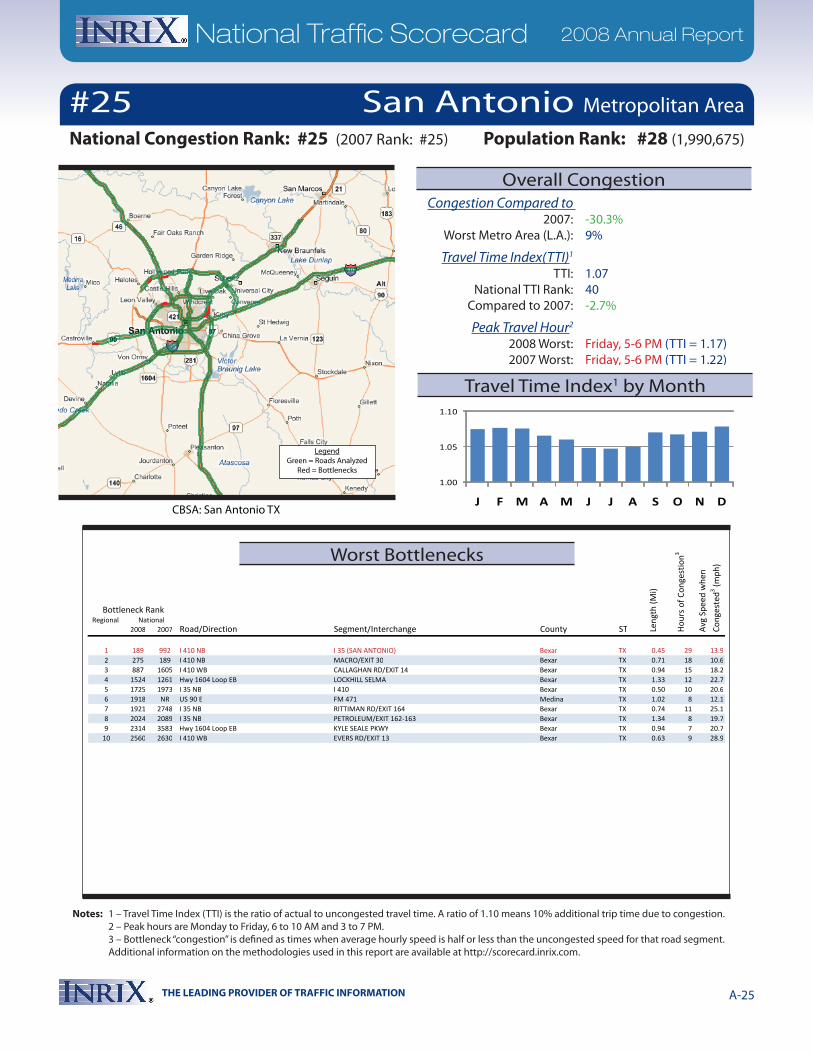
THE LEADING PROVIDER OF TRAFFIC INFORMATION A-25
National Traffic Scorecard 2008 Annual Report
Notes: 1 – Travel Time Index (TTI) is the ratio of actual to uncongested travel time. A ratio of 1.10 means 10% additional trip time due to congestion. 2 – Peak hours are Monday to Friday, 6 to 10 AM and 3 to 7 PM. 3 – Bottleneck “congestion” is defined as times when average hourly speed is half or less than the uncongested speed for that road segment. Additional information on the methodologies used in this report are available at http://scorecard.inrix.com.
Regional 2008 2007 Road/Direction Segment/Interchange County ST
Bottleneck Rank
Len
gth
(Mi)
Hou
rs o
f Con
gest
ion3
Avg
Spe
ed w
hen
Con
gest
ed3 (m
ph)
National
1 189 992 I 410 NB I 35 (SAN ANTONIO) Bexar TX 0.45 29 13.92 275 189 I 410 NB MACRO/EXIT 30 Bexar TX 0.71 18 10.63 887 1605 I 410 WB CALLAGHAN RD/EXIT 14 Bexar TX 0.94 15 18.24 1524 1261 Hwy 1604 Loop EB LOCKHILL SELMA Bexar TX 1.33 12 22.75 1725 1973 I 35 NB I 410 Bexar TX 0.50 10 20.66 1918 NR US 90 E FM 471 Medina TX 1.02 8 12.17 1921 2748 I 35 NB RITTIMAN RD/EXIT 164 Bexar TX 0.74 11 25.18 2024 2089 I 35 NB PETROLEUM/EXIT 162-163 Bexar TX 1.34 8 19.79 2314 3583 Hwy 1604 Loop EB KYLE SEALE PKWY Bexar TX 0.94 7 20.7
10 2560 2630 I 410 WB EVERS RD/EXIT 13 Bexar TX 0.63 9 28.9
1.00
1.05
1.10
J F M A M J J A S O N DCBSA: San Antonio TX
Congestion Compared to 2007: -30.3% Worst Metro Area (L.A.): 9%
Travel Time Index(TTI)1
TTI: 1.07 National TTI Rank: 40 Compared to 2007: -2.7%
Peak Travel Hour2
2008 Worst: Friday, 5-6 PM (TTI = 1.17) 2007 Worst: Friday, 5-6 PM (TTI = 1.22)
Population Rank: #28 (1,990,675)
San Antonio Metropolitan Area
National Congestion Rank: #25 (2007 Rank: #25)
#25
Worst Bottlenecks
Overall Congestion
Travel Time Index1 by Month
LegendGreen = Roads Analyzed
Red = Bottlenecks
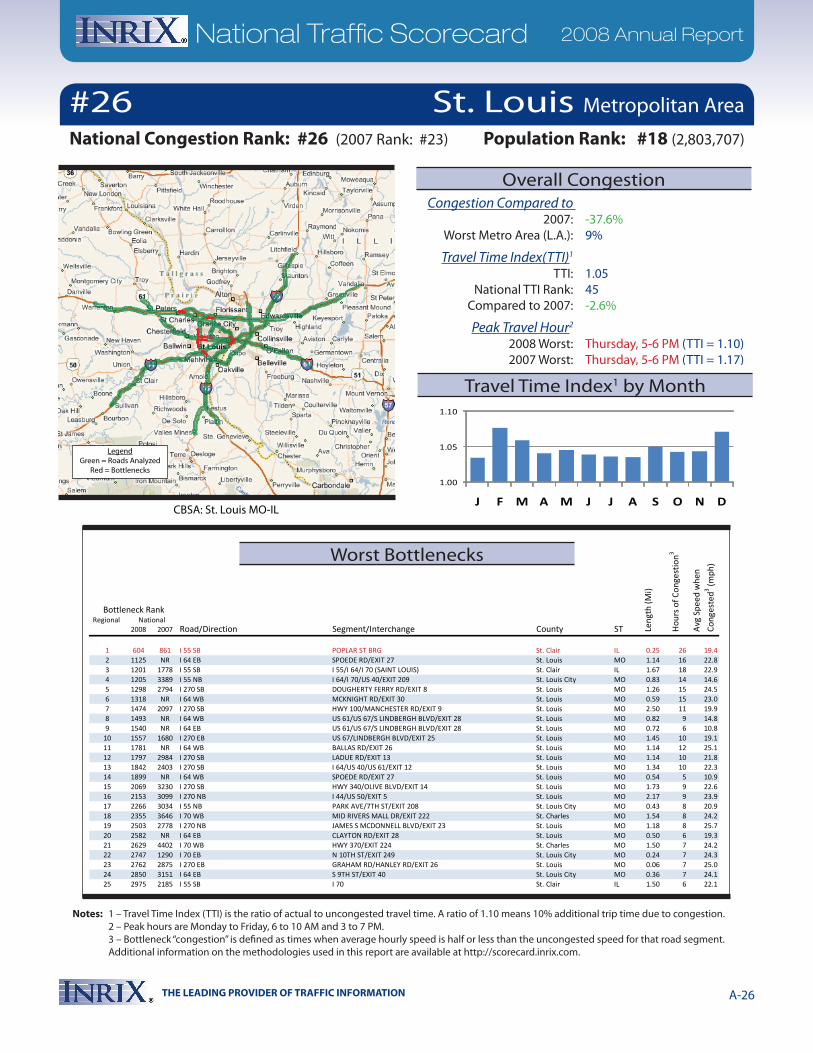
THE LEADING PROVIDER OF TRAFFIC INFORMATION A-26
National Traffic Scorecard 2008 Annual Report
Notes: 1 – Travel Time Index (TTI) is the ratio of actual to uncongested travel time. A ratio of 1.10 means 10% additional trip time due to congestion. 2 – Peak hours are Monday to Friday, 6 to 10 AM and 3 to 7 PM. 3 – Bottleneck “congestion” is defined as times when average hourly speed is half or less than the uncongested speed for that road segment. Additional information on the methodologies used in this report are available at http://scorecard.inrix.com.
Regional 2008 2007 Road/Direction Segment/Interchange County ST
Bottleneck Rank
Len
gth
(Mi)
Hou
rs o
f Con
gest
ion3
Avg
Spe
ed w
hen
Con
gest
ed3 (m
ph)
National
1 604 861 I 55 SB POPLAR ST BRG St. Clair IL 0.25 26 19.42 1125 NR I 64 EB SPOEDE RD/EXIT 27 St. Louis MO 1.14 16 22.83 1201 1778 I 55 SB I 55/I 64/I 70 (SAINT LOUIS) St. Clair IL 1.67 18 22.94 1205 3389 I 55 NB I 64/I 70/US 40/EXIT 209 St. Louis City MO 0.83 14 14.65 1298 2794 I 270 SB DOUGHERTY FERRY RD/EXIT 8 St. Louis MO 1.26 15 24.56 1318 NR I 64 WB MCKNIGHT RD/EXIT 30 St. Louis MO 0.59 15 23.07 1474 2097 I 270 SB HWY 100/MANCHESTER RD/EXIT 9 St. Louis MO 2.50 11 19.98 1493 NR I 64 WB US 61/US 67/S LINDBERGH BLVD/EXIT 28 St. Louis MO 0.82 9 14.89 1540 NR I 64 EB US 61/US 67/S LINDBERGH BLVD/EXIT 28 St. Louis MO 0.72 6 10.8
10 1557 1680 I 270 EB US 67/LINDBERGH BLVD/EXIT 25 St. Louis MO 1.45 10 19.111 1781 NR I 64 WB BALLAS RD/EXIT 26 St. Louis MO 1.14 12 25.112 1797 2984 I 270 SB LADUE RD/EXIT 13 St. Louis MO 1.14 10 21.813 1842 2403 I 270 SB I 64/US 40/US 61/EXIT 12 St. Louis MO 1.34 10 22.314 1899 NR I 64 WB SPOEDE RD/EXIT 27 St. Louis MO 0.54 5 10.915 2069 3230 I 270 SB HWY 340/OLIVE BLVD/EXIT 14 St. Louis MO 1.73 9 22.616 2153 3099 I 270 NB I 44/US 50/EXIT 5 St. Louis MO 2.17 9 23.917 2266 3034 I 55 NB PARK AVE/7TH ST/EXIT 208 St. Louis City MO 0.43 8 20.918 2355 3646 I 70 WB MID RIVERS MALL DR/EXIT 222 St. Charles MO 1.54 8 24.219 2503 2778 I 270 NB JAMES S MCDONNELL BLVD/EXIT 23 St. Louis MO 1.18 8 25.720 2582 NR I 64 EB CLAYTON RD/EXIT 28 St. Louis MO 0.50 6 19.321 2629 4402 I 70 WB HWY 370/EXIT 224 St. Charles MO 1.50 7 24.222 2747 1290 I 70 EB N 10TH ST/EXIT 249 St. Louis City MO 0.24 7 24.323 2762 2875 I 270 EB GRAHAM RD/HANLEY RD/EXIT 26 St. Louis MO 0.06 7 25.024 2850 3151 I 64 EB S 9TH ST/EXIT 40 St. Louis City MO 0.36 7 24.125 2975 2185 I 55 SB I 70 St. Clair IL 1.50 6 22.1
1.00
1.05
1.10
J F M A M J J A S O N DCBSA: St. Louis MO-IL
Congestion Compared to 2007: -37.6% Worst Metro Area (L.A.): 9%
Travel Time Index(TTI)1
TTI: 1.05 National TTI Rank: 45 Compared to 2007: -2.6%
Peak Travel Hour2
2008 Worst: Thursday, 5-6 PM (TTI = 1.10) 2007 Worst: Thursday, 5-6 PM (TTI = 1.17)
Population Rank: #18 (2,803,707)
St. Louis Metropolitan Area
National Congestion Rank: #26 (2007 Rank: #23)
#26
Worst Bottlenecks
Overall Congestion
Travel Time Index1 by Month
LegendGreen = Roads Analyzed
Red = Bottlenecks
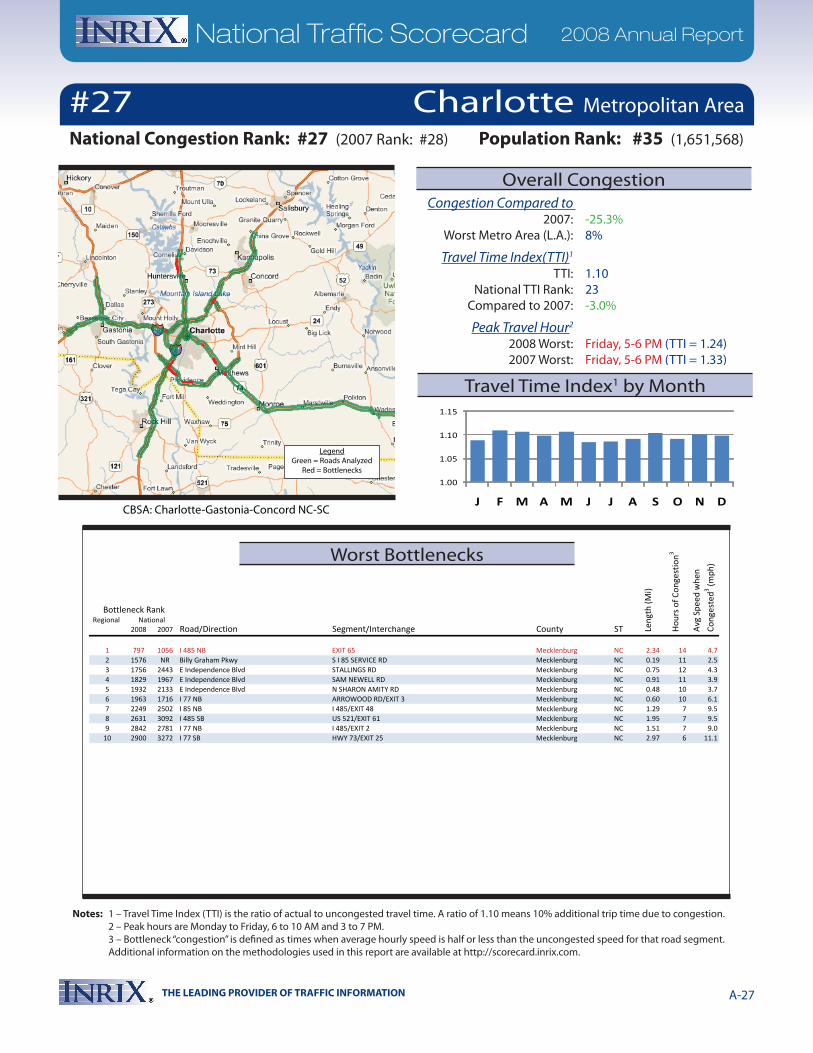
THE LEADING PROVIDER OF TRAFFIC INFORMATION A-27
National Traffic Scorecard 2008 Annual Report
Notes: 1 – Travel Time Index (TTI) is the ratio of actual to uncongested travel time. A ratio of 1.10 means 10% additional trip time due to congestion. 2 – Peak hours are Monday to Friday, 6 to 10 AM and 3 to 7 PM. 3 – Bottleneck “congestion” is defined as times when average hourly speed is half or less than the uncongested speed for that road segment. Additional information on the methodologies used in this report are available at http://scorecard.inrix.com.
Regional 2008 2007 Road/Direction Segment/Interchange County ST
Bottleneck Rank
Len
gth
(Mi)
Hou
rs o
f Con
gest
ion3
Avg
Spe
ed w
hen
Con
gest
ed3 (m
ph)
National
1 797 1056 I 485 NB EXIT 65 Mecklenburg NC 2.34 14 4.72 1576 NR Billy Graham Pkwy S I 85 SERVICE RD Mecklenburg NC 0.19 11 2.53 1756 2443 E Independence Blvd STALLINGS RD Mecklenburg NC 0.75 12 4.34 1829 1967 E Independence Blvd SAM NEWELL RD Mecklenburg NC 0.91 11 3.95 1932 2133 E Independence Blvd N SHARON AMITY RD Mecklenburg NC 0.48 10 3.76 1963 1716 I 77 NB ARROWOOD RD/EXIT 3 Mecklenburg NC 0.60 10 6.17 2249 2502 I 85 NB I 485/EXIT 48 Mecklenburg NC 1.29 7 9.58 2631 3092 I 485 SB US 521/EXIT 61 Mecklenburg NC 1.95 7 9.59 2842 2781 I 77 NB I 485/EXIT 2 Mecklenburg NC 1.51 7 9.0
10 2900 3272 I 77 SB HWY 73/EXIT 25 Mecklenburg NC 2.97 6 11.1
1.00
1.05
1.10
1.15
J F M A M J J A S O N DCBSA: Charlotte-Gastonia-Concord NC-SC
Congestion Compared to 2007: -25.3% Worst Metro Area (L.A.): 8%
Travel Time Index(TTI)1
TTI: 1.10 National TTI Rank: 23 Compared to 2007: -3.0%
Peak Travel Hour2
2008 Worst: Friday, 5-6 PM (TTI = 1.24) 2007 Worst: Friday, 5-6 PM (TTI = 1.33)
Population Rank: #35 (1,651,568) National Congestion Rank: #27 (2007 Rank: #28)
Charlotte Metropolitan Area#27
Worst Bottlenecks
Overall Congestion
Travel Time Index1 by Month
LegendGreen = Roads Analyzed
Red = Bottlenecks
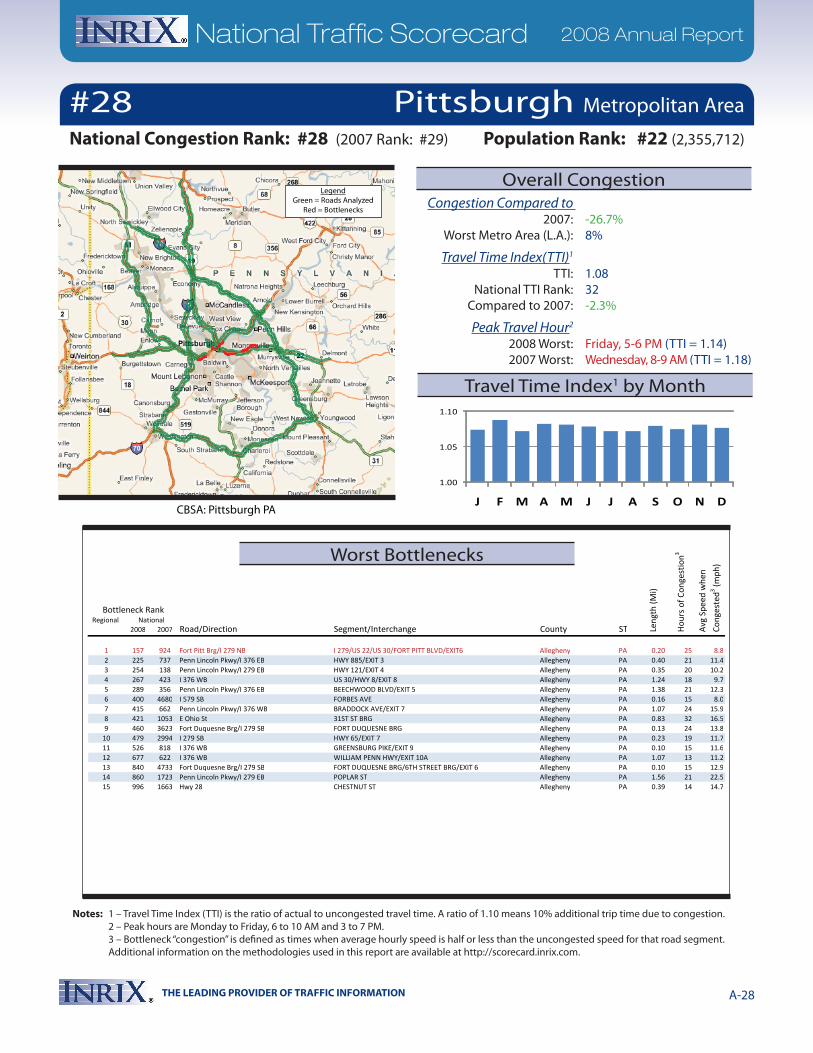
THE LEADING PROVIDER OF TRAFFIC INFORMATION A-28
National Traffic Scorecard 2008 Annual Report
Notes: 1 – Travel Time Index (TTI) is the ratio of actual to uncongested travel time. A ratio of 1.10 means 10% additional trip time due to congestion. 2 – Peak hours are Monday to Friday, 6 to 10 AM and 3 to 7 PM. 3 – Bottleneck “congestion” is defined as times when average hourly speed is half or less than the uncongested speed for that road segment. Additional information on the methodologies used in this report are available at http://scorecard.inrix.com.
Regional 2008 2007 Road/Direction Segment/Interchange County ST
Bottleneck Rank
Len
gth
(Mi)
Hou
rs o
f Con
gest
ion3
Avg
Spe
ed w
hen
Con
gest
ed3 (m
ph)
National
1 157 924 Fort Pitt Brg/I 279 NB I 279/US 22/US 30/FORT PITT BLVD/EXIT6 Allegheny PA 0.20 25 8.82 225 737 Penn Lincoln Pkwy/I 376 EB HWY 885/EXIT 3 Allegheny PA 0.40 21 11.43 254 138 Penn Lincoln Pkwy/I 279 EB HWY 121/EXIT 4 Allegheny PA 0.35 20 10.24 267 423 I 376 WB US 30/HWY 8/EXIT 8 Allegheny PA 1.24 18 9.75 289 356 Penn Lincoln Pkwy/I 376 EB BEECHWOOD BLVD/EXIT 5 Allegheny PA 1.38 21 12.36 400 4680 I 579 SB FORBES AVE Allegheny PA 0.16 15 8.07 415 662 Penn Lincoln Pkwy/I 376 WB BRADDOCK AVE/EXIT 7 Allegheny PA 1.07 24 15.98 421 1053 E Ohio St 31ST ST BRG Allegheny PA 0.83 32 16.59 460 3623 Fort Duquesne Brg/I 279 SB FORT DUQUESNE BRG Allegheny PA 0.13 24 13.8
10 479 2994 I 279 SB HWY 65/EXIT 7 Allegheny PA 0.23 19 11.711 526 818 I 376 WB GREENSBURG PIKE/EXIT 9 Allegheny PA 0.10 15 11.612 677 622 I 376 WB WILLIAM PENN HWY/EXIT 10A Allegheny PA 1.07 13 11.213 840 4733 Fort Duquesne Brg/I 279 SB FORT DUQUESNE BRG/6TH STREET BRG/EXIT 6 Allegheny PA 0.10 15 12.914 860 1723 Penn Lincoln Pkwy/I 279 EB POPLAR ST Allegheny PA 1.56 21 22.515 996 1663 Hwy 28 CHESTNUT ST Allegheny PA 0.39 14 14.7
1.00
1.05
1.10
J F M A M J J A S O N DCBSA: Pittsburgh PA
Congestion Compared to 2007: -26.7% Worst Metro Area (L.A.): 8%
Travel Time Index(TTI)1
TTI: 1.08 National TTI Rank: 32 Compared to 2007: -2.3%
Peak Travel Hour2
2008 Worst: Friday, 5-6 PM (TTI = 1.14) 2007 Worst: Wednesday, 8-9 AM (TTI = 1.18)
Population Rank: #22 (2,355,712)
Pittsburgh Metropolitan Area
National Congestion Rank: #28 (2007 Rank: #29)
#28
Worst Bottlenecks
Overall Congestion
Travel Time Index1 by Month
LegendGreen = Roads Analyzed
Red = Bottlenecks
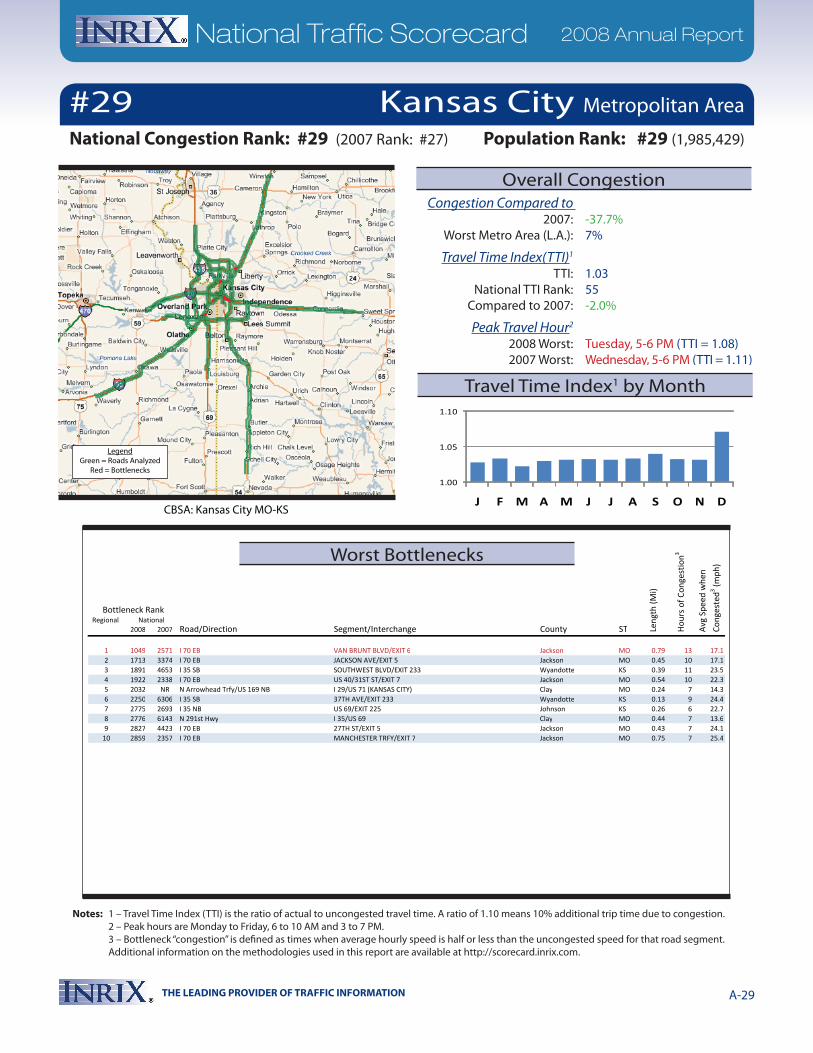
THE LEADING PROVIDER OF TRAFFIC INFORMATION A-29
National Traffic Scorecard 2008 Annual Report
Notes: 1 – Travel Time Index (TTI) is the ratio of actual to uncongested travel time. A ratio of 1.10 means 10% additional trip time due to congestion. 2 – Peak hours are Monday to Friday, 6 to 10 AM and 3 to 7 PM. 3 – Bottleneck “congestion” is defined as times when average hourly speed is half or less than the uncongested speed for that road segment. Additional information on the methodologies used in this report are available at http://scorecard.inrix.com.
Regional 2008 2007 Road/Direction Segment/Interchange County ST
Bottleneck Rank
Len
gth
(Mi)
Hou
rs o
f Con
gest
ion3
Avg
Spe
ed w
hen
Con
gest
ed3 (m
ph)
National
1 1049 2571 I 70 EB VAN BRUNT BLVD/EXIT 6 Jackson MO 0.79 13 17.12 1713 3374 I 70 EB JACKSON AVE/EXIT 5 Jackson MO 0.45 10 17.13 1891 4653 I 35 SB SOUTHWEST BLVD/EXIT 233 Wyandotte KS 0.39 11 23.54 1922 2338 I 70 EB US 40/31ST ST/EXIT 7 Jackson MO 0.54 10 22.35 2032 NR N Arrowhead Trfy/US 169 NB I 29/US 71 (KANSAS CITY) Clay MO 0.24 7 14.36 2250 6306 I 35 SB 37TH AVE/EXIT 233 Wyandotte KS 0.13 9 24.47 2775 2693 I 35 NB US 69/EXIT 225 Johnson KS 0.26 6 22.78 2776 6143 N 291st Hwy I 35/US 69 Clay MO 0.44 7 13.69 2827 4423 I 70 EB 27TH ST/EXIT 5 Jackson MO 0.43 7 24.1
10 2859 2357 I 70 EB MANCHESTER TRFY/EXIT 7 Jackson MO 0.75 7 25.4
1.00
1.05
1.10
J F M A M J J A S O N DCBSA: Kansas City MO-KS
Congestion Compared to 2007: -37.7% Worst Metro Area (L.A.): 7%
Travel Time Index(TTI)1
TTI: 1.03 National TTI Rank: 55 Compared to 2007: -2.0%
Peak Travel Hour2
2008 Worst: Tuesday, 5-6 PM (TTI = 1.08) 2007 Worst: Wednesday, 5-6 PM (TTI = 1.11)
Population Rank: #29 (1,985,429)
Kansas City Metropolitan Area
National Congestion Rank: #29 (2007 Rank: #27)
#29
Worst Bottlenecks
Overall Congestion
Travel Time Index1 by Month
LegendGreen = Roads Analyzed
Red = Bottlenecks
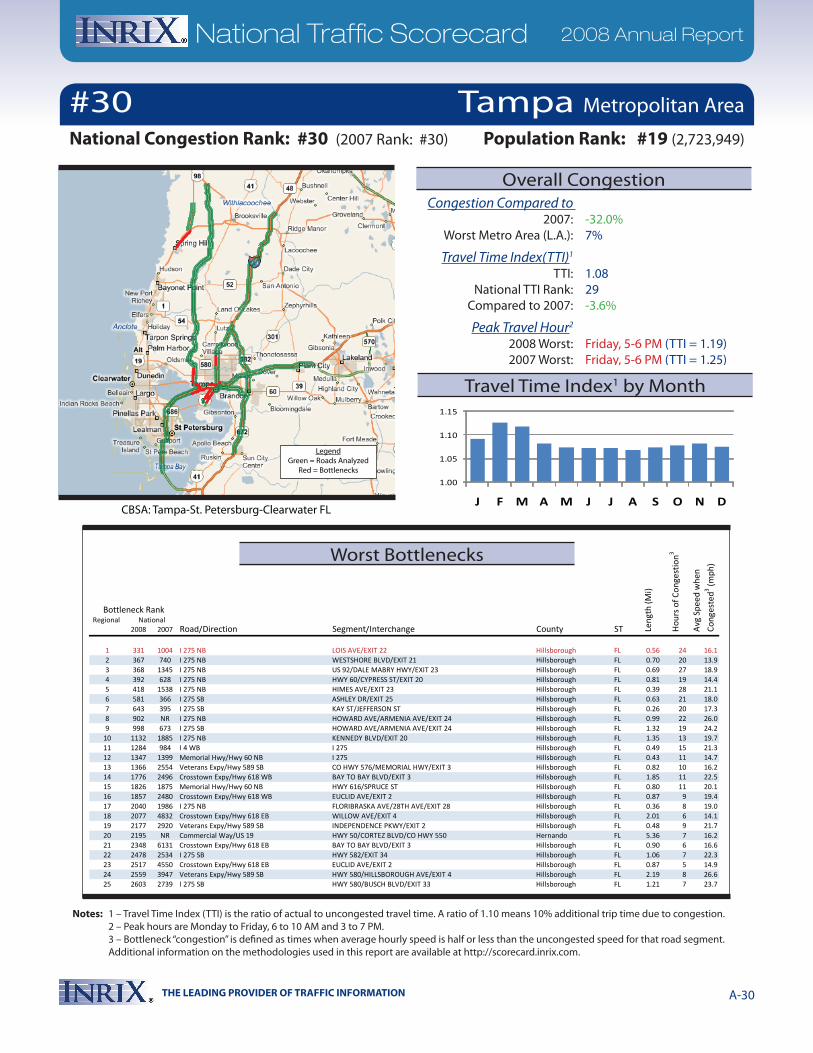
THE LEADING PROVIDER OF TRAFFIC INFORMATION A-30
National Traffic Scorecard 2008 Annual Report
Notes: 1 – Travel Time Index (TTI) is the ratio of actual to uncongested travel time. A ratio of 1.10 means 10% additional trip time due to congestion. 2 – Peak hours are Monday to Friday, 6 to 10 AM and 3 to 7 PM. 3 – Bottleneck “congestion” is defined as times when average hourly speed is half or less than the uncongested speed for that road segment. Additional information on the methodologies used in this report are available at http://scorecard.inrix.com.
Regional 2008 2007 Road/Direction Segment/Interchange County ST
Bottleneck Rank
Len
gth
(Mi)
Hou
rs o
f Con
gest
ion3
Avg
Spe
ed w
hen
Con
gest
ed3 (m
ph)
National
1 331 1004 I 275 NB LOIS AVE/EXIT 22 Hillsborough FL 0.56 24 16.12 367 740 I 275 NB WESTSHORE BLVD/EXIT 21 Hillsborough FL 0.70 20 13.93 368 1345 I 275 NB US 92/DALE MABRY HWY/EXIT 23 Hillsborough FL 0.69 27 18.94 392 628 I 275 NB HWY 60/CYPRESS ST/EXIT 20 Hillsborough FL 0.81 19 14.45 418 1538 I 275 NB HIMES AVE/EXIT 23 Hillsborough FL 0.39 28 21.16 581 366 I 275 SB ASHLEY DR/EXIT 25 Hillsborough FL 0.63 21 18.07 643 395 I 275 SB KAY ST/JEFFERSON ST Hillsborough FL 0.26 20 17.38 902 NR I 275 NB HOWARD AVE/ARMENIA AVE/EXIT 24 Hillsborough FL 0.99 22 26.09 998 673 I 275 SB HOWARD AVE/ARMENIA AVE/EXIT 24 Hillsborough FL 1.32 19 24.2
10 1132 1885 I 275 NB KENNEDY BLVD/EXIT 20 Hillsborough FL 1.35 13 19.711 1284 984 I 4 WB I 275 Hillsborough FL 0.49 15 21.312 1347 1399 Memorial Hwy/Hwy 60 NB I 275 Hillsborough FL 0.43 11 14.713 1366 2554 Veterans Expy/Hwy 589 SB CO HWY 576/MEMORIAL HWY/EXIT 3 Hillsborough FL 0.82 10 16.214 1776 2496 Crosstown Expy/Hwy 618 WB BAY TO BAY BLVD/EXIT 3 Hillsborough FL 1.85 11 22.515 1826 1875 Memorial Hwy/Hwy 60 NB HWY 616/SPRUCE ST Hillsborough FL 0.80 11 20.116 1857 2480 Crosstown Expy/Hwy 618 WB EUCLID AVE/EXIT 2 Hillsborough FL 0.87 9 19.417 2040 1986 I 275 NB FLORIBRASKA AVE/28TH AVE/EXIT 28 Hillsborough FL 0.36 8 19.018 2077 4832 Crosstown Expy/Hwy 618 EB WILLOW AVE/EXIT 4 Hillsborough FL 2.01 6 14.119 2177 2920 Veterans Expy/Hwy 589 SB INDEPENDENCE PKWY/EXIT 2 Hillsborough FL 0.48 9 21.720 2195 NR Commercial Way/US 19 HWY 50/CORTEZ BLVD/CO HWY 550 Hernando FL 5.36 7 16.221 2348 6131 Crosstown Expy/Hwy 618 EB BAY TO BAY BLVD/EXIT 3 Hillsborough FL 0.90 6 16.622 2478 2534 I 275 SB HWY 582/EXIT 34 Hillsborough FL 1.06 7 22.323 2517 4550 Crosstown Expy/Hwy 618 EB EUCLID AVE/EXIT 2 Hillsborough FL 0.87 5 14.924 2559 3947 Veterans Expy/Hwy 589 SB HWY 580/HILLSBOROUGH AVE/EXIT 4 Hillsborough FL 2.19 8 26.625 2603 2739 I 275 SB HWY 580/BUSCH BLVD/EXIT 33 Hillsborough FL 1.21 7 23.7
1.00
1.05
1.10
1.15
J F M A M J J A S O N DCBSA: Tampa-St. Petersburg-Clearwater FL
Congestion Compared to 2007: -32.0% Worst Metro Area (L.A.): 7%
Travel Time Index(TTI)1
TTI: 1.08 National TTI Rank: 29 Compared to 2007: -3.6%
Peak Travel Hour2
2008 Worst: Friday, 5-6 PM (TTI = 1.19) 2007 Worst: Friday, 5-6 PM (TTI = 1.25)
Population Rank: #19 (2,723,949)
Tampa Metropolitan Area
National Congestion Rank: #30 (2007 Rank: #30)
#30
Worst Bottlenecks
Overall Congestion
Travel Time Index1 by Month
LegendGreen = Roads Analyzed
Red = Bottlenecks
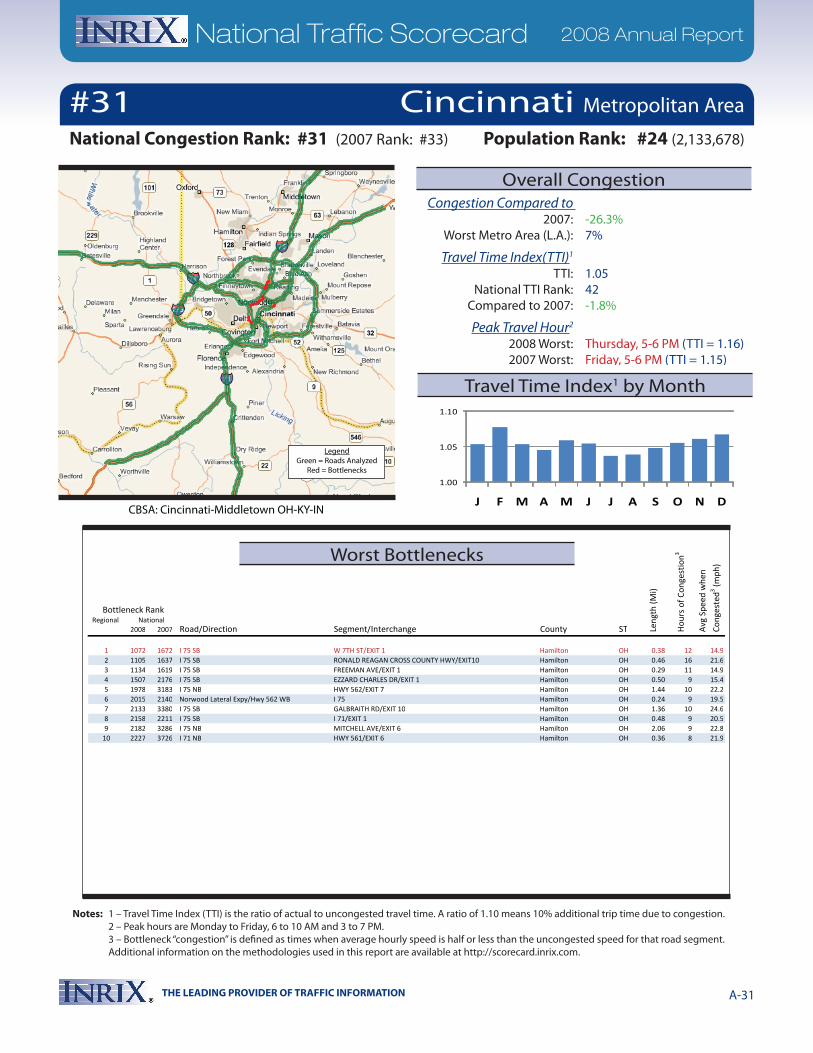
THE LEADING PROVIDER OF TRAFFIC INFORMATION A-31
National Traffic Scorecard 2008 Annual Report
Notes: 1 – Travel Time Index (TTI) is the ratio of actual to uncongested travel time. A ratio of 1.10 means 10% additional trip time due to congestion. 2 – Peak hours are Monday to Friday, 6 to 10 AM and 3 to 7 PM. 3 – Bottleneck “congestion” is defined as times when average hourly speed is half or less than the uncongested speed for that road segment. Additional information on the methodologies used in this report are available at http://scorecard.inrix.com.
Regional 2008 2007 Road/Direction Segment/Interchange County ST
Bottleneck Rank
Len
gth
(Mi)
Hou
rs o
f Con
gest
ion3
Avg
Spe
ed w
hen
Con
gest
ed3 (m
ph)
National
1 1072 1672 I 75 SB W 7TH ST/EXIT 1 Hamilton OH 0.38 12 14.92 1105 1637 I 75 SB RONALD REAGAN CROSS COUNTY HWY/EXIT10 Hamilton OH 0.46 16 21.63 1134 1619 I 75 SB FREEMAN AVE/EXIT 1 Hamilton OH 0.29 11 14.94 1507 2176 I 75 SB EZZARD CHARLES DR/EXIT 1 Hamilton OH 0.50 9 15.45 1978 3183 I 75 NB HWY 562/EXIT 7 Hamilton OH 1.44 10 22.26 2015 2140 Norwood Lateral Expy/Hwy 562 WB I 75 Hamilton OH 0.24 9 19.57 2133 3380 I 75 SB GALBRAITH RD/EXIT 10 Hamilton OH 1.36 10 24.68 2158 2211 I 75 SB I 71/EXIT 1 Hamilton OH 0.48 9 20.59 2182 3286 I 75 NB MITCHELL AVE/EXIT 6 Hamilton OH 2.06 9 22.8
10 2227 3726 I 71 NB HWY 561/EXIT 6 Hamilton OH 0.36 8 21.9
1.00
1.05
1.10
J F M A M J J A S O N DCBSA: Cincinnati-Middletown OH-KY-IN
Congestion Compared to 2007: -26.3% Worst Metro Area (L.A.): 7%
Travel Time Index(TTI)1
TTI: 1.05 National TTI Rank: 42 Compared to 2007: -1.8%
Peak Travel Hour2
2008 Worst: Thursday, 5-6 PM (TTI = 1.16) 2007 Worst: Friday, 5-6 PM (TTI = 1.15)
Population Rank: #24 (2,133,678)
Cincinnati Metropolitan Area
National Congestion Rank: #31 (2007 Rank: #33)
#31
Worst Bottlenecks
Overall Congestion
Travel Time Index1 by Month
LegendGreen = Roads Analyzed
Red = Bottlenecks
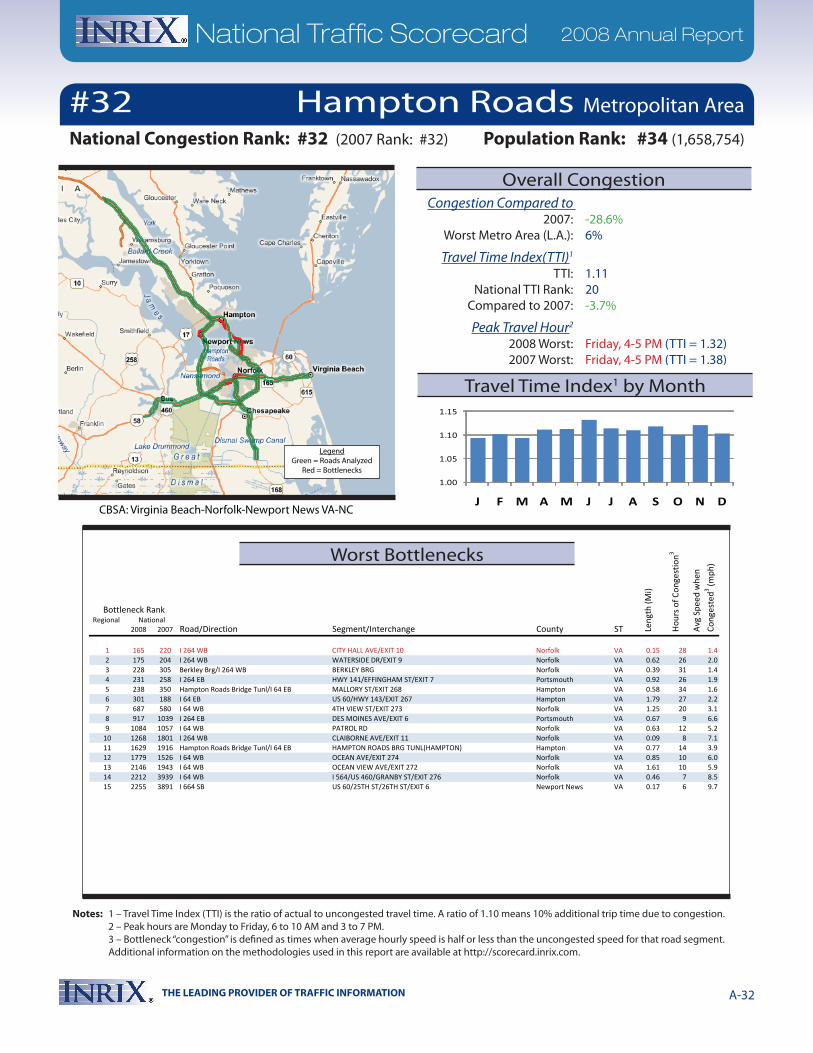
THE LEADING PROVIDER OF TRAFFIC INFORMATION A-32
National Traffic Scorecard 2008 Annual Report
Notes: 1 – Travel Time Index (TTI) is the ratio of actual to uncongested travel time. A ratio of 1.10 means 10% additional trip time due to congestion. 2 – Peak hours are Monday to Friday, 6 to 10 AM and 3 to 7 PM. 3 – Bottleneck “congestion” is defined as times when average hourly speed is half or less than the uncongested speed for that road segment. Additional information on the methodologies used in this report are available at http://scorecard.inrix.com.
Regional 2008 2007 Road/Direction Segment/Interchange County ST
Bottleneck Rank
Len
gth
(Mi)
Hou
rs o
f Con
gest
ion3
Avg
Spe
ed w
hen
Con
gest
ed3 (m
ph)
National
1 165 220 I 264 WB CITY HALL AVE/EXIT 10 Norfolk VA 0.15 28 1.42 175 204 I 264 WB WATERSIDE DR/EXIT 9 Norfolk VA 0.62 26 2.03 228 305 Berkley Brg/I 264 WB BERKLEY BRG Norfolk VA 0.39 31 1.44 231 258 I 264 EB HWY 141/EFFINGHAM ST/EXIT 7 Portsmouth VA 0.92 26 1.95 238 350 Hampton Roads Bridge Tunl/I 64 EB MALLORY ST/EXIT 268 Hampton VA 0.58 34 1.66 301 188 I 64 EB US 60/HWY 143/EXIT 267 Hampton VA 1.79 27 2.27 687 580 I 64 WB 4TH VIEW ST/EXIT 273 Norfolk VA 1.25 20 3.18 917 1039 I 264 EB DES MOINES AVE/EXIT 6 Portsmouth VA 0.67 9 6.69 1084 1057 I 64 WB PATROL RD Norfolk VA 0.63 12 5.2
10 1268 1801 I 264 WB CLAIBORNE AVE/EXIT 11 Norfolk VA 0.09 8 7.111 1629 1916 Hampton Roads Bridge Tunl/I 64 EB HAMPTON ROADS BRG TUNL(HAMPTON) Hampton VA 0.77 14 3.912 1779 1526 I 64 WB OCEAN AVE/EXIT 274 Norfolk VA 0.85 10 6.013 2146 1943 I 64 WB OCEAN VIEW AVE/EXIT 272 Norfolk VA 1.61 10 5.914 2212 3939 I 64 WB I 564/US 460/GRANBY ST/EXIT 276 Norfolk VA 0.46 7 8.515 2255 3891 I 664 SB US 60/25TH ST/26TH ST/EXIT 6 Newport News VA 0.17 6 9.7
1.00
1.05
1.10
1.15
J F M A M J J A S O N DCBSA: Virginia Beach-Norfolk-Newport News VA-NC
Congestion Compared to 2007: -28.6% Worst Metro Area (L.A.): 6%
Travel Time Index(TTI)1
TTI: 1.11 National TTI Rank: 20 Compared to 2007: -3.7%
Peak Travel Hour2
2008 Worst: Friday, 4-5 PM (TTI = 1.32) 2007 Worst: Friday, 4-5 PM (TTI = 1.38)
Population Rank: #34 (1,658,754)
Hampton Roads Metropolitan Area#32National Congestion Rank: #32 (2007 Rank: #32)
Worst Bottlenecks
Overall Congestion
Travel Time Index1 by Month
LegendGreen = Roads Analyzed
Red = Bottlenecks
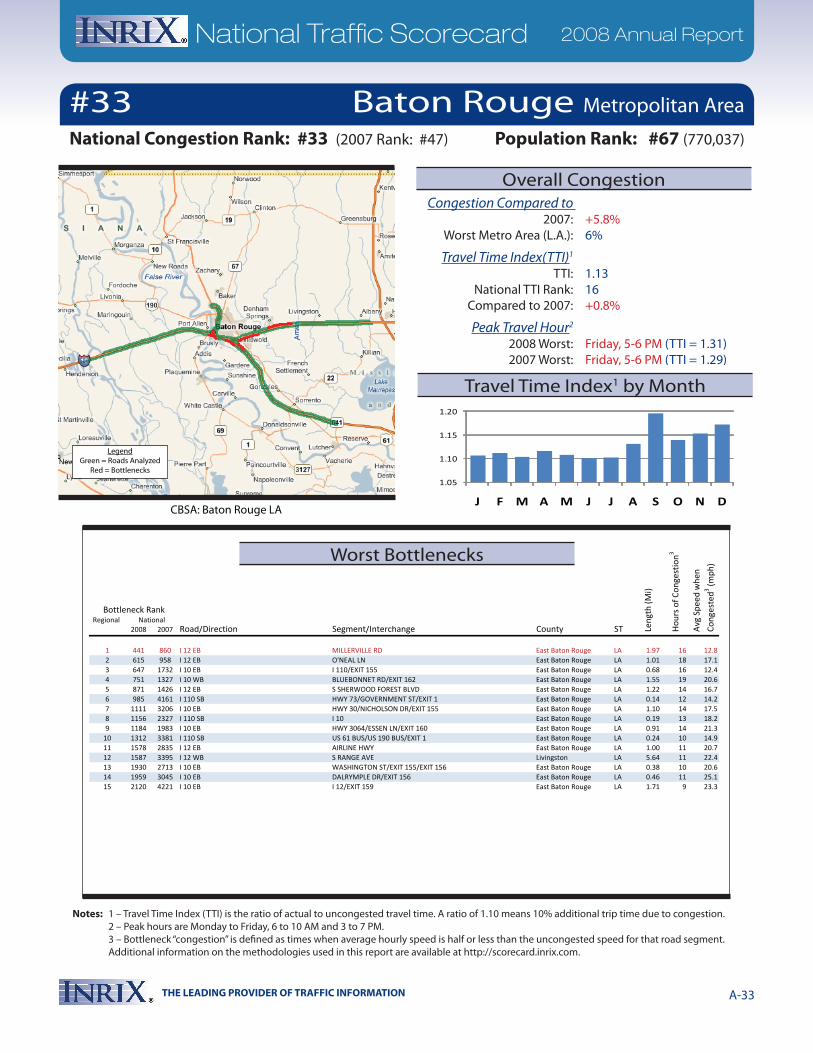
THE LEADING PROVIDER OF TRAFFIC INFORMATION A-33
National Traffic Scorecard 2008 Annual Report
Notes: 1 – Travel Time Index (TTI) is the ratio of actual to uncongested travel time. A ratio of 1.10 means 10% additional trip time due to congestion. 2 – Peak hours are Monday to Friday, 6 to 10 AM and 3 to 7 PM. 3 – Bottleneck “congestion” is defined as times when average hourly speed is half or less than the uncongested speed for that road segment. Additional information on the methodologies used in this report are available at http://scorecard.inrix.com.
Regional 2008 2007 Road/Direction Segment/Interchange County ST
Bottleneck Rank
Len
gth
(Mi)
Hou
rs o
f Con
gest
ion3
Avg
Spe
ed w
hen
Con
gest
ed3 (m
ph)
National
1 441 860 I 12 EB MILLERVILLE RD East Baton Rouge LA 1.97 16 12.82 615 958 I 12 EB O'NEAL LN East Baton Rouge LA 1.01 18 17.13 647 1732 I 10 EB I 110/EXIT 155 East Baton Rouge LA 0.68 16 12.44 751 1327 I 10 WB BLUEBONNET RD/EXIT 162 East Baton Rouge LA 1.55 19 20.65 871 1426 I 12 EB S SHERWOOD FOREST BLVD East Baton Rouge LA 1.22 14 16.76 985 4161 I 110 SB HWY 73/GOVERNMENT ST/EXIT 1 East Baton Rouge LA 0.14 12 14.27 1111 3206 I 10 EB HWY 30/NICHOLSON DR/EXIT 155 East Baton Rouge LA 1.10 14 17.58 1156 2327 I 110 SB I 10 East Baton Rouge LA 0.19 13 18.29 1184 1983 I 10 EB HWY 3064/ESSEN LN/EXIT 160 East Baton Rouge LA 0.91 14 21.3
10 1312 3381 I 110 SB US 61 BUS/US 190 BUS/EXIT 1 East Baton Rouge LA 0.24 10 14.911 1578 2835 I 12 EB AIRLINE HWY East Baton Rouge LA 1.00 11 20.712 1587 3395 I 12 WB S RANGE AVE Livingston LA 5.64 11 22.413 1930 2713 I 10 EB WASHINGTON ST/EXIT 155/EXIT 156 East Baton Rouge LA 0.38 10 20.614 1959 3045 I 10 EB DALRYMPLE DR/EXIT 156 East Baton Rouge LA 0.46 11 25.115 2120 4221 I 10 EB I 12/EXIT 159 East Baton Rouge LA 1.71 9 23.3
1.05
1.10
1.15
1.20
J F M A M J J A S O N DCBSA: Baton Rouge LA
Congestion Compared to 2007: +5.8% Worst Metro Area (L.A.): 6%
Travel Time Index(TTI)1
TTI: 1.13 National TTI Rank: 16 Compared to 2007: +0.8%
Peak Travel Hour2
2008 Worst: Friday, 5-6 PM (TTI = 1.31) 2007 Worst: Friday, 5-6 PM (TTI = 1.29)
Population Rank: #67 (770,037)
Baton Rouge Metropolitan Area
National Congestion Rank: #33 (2007 Rank: #47)
#33
Worst Bottlenecks
Overall Congestion
Travel Time Index1 by Month
LegendGreen = Roads Analyzed
Red = Bottlenecks
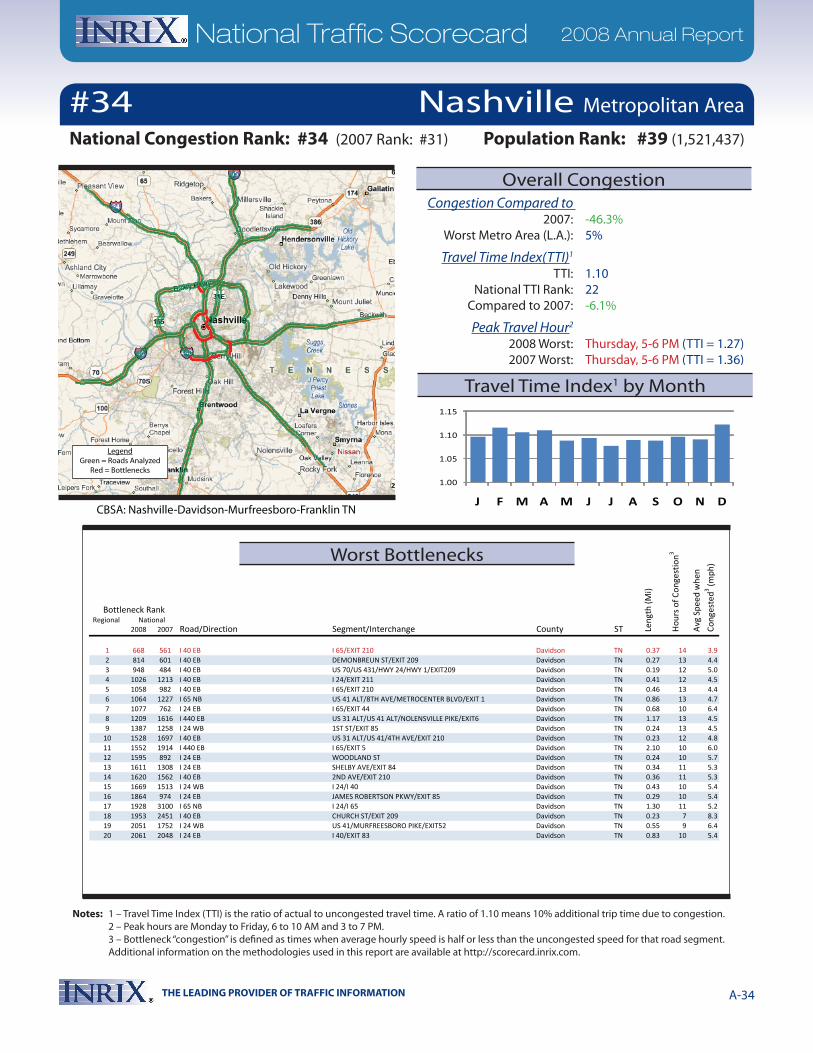
THE LEADING PROVIDER OF TRAFFIC INFORMATION A-34
National Traffic Scorecard 2008 Annual Report
Notes: 1 – Travel Time Index (TTI) is the ratio of actual to uncongested travel time. A ratio of 1.10 means 10% additional trip time due to congestion. 2 – Peak hours are Monday to Friday, 6 to 10 AM and 3 to 7 PM. 3 – Bottleneck “congestion” is defined as times when average hourly speed is half or less than the uncongested speed for that road segment. Additional information on the methodologies used in this report are available at http://scorecard.inrix.com.
Regional 2008 2007 Road/Direction Segment/Interchange County ST
Bottleneck Rank
Len
gth
(Mi)
Hou
rs o
f Con
gest
ion3
Avg
Spe
ed w
hen
Con
gest
ed3 (m
ph)
National
1 668 561 I 40 EB I 65/EXIT 210 Davidson TN 0.37 14 3.92 814 601 I 40 EB DEMONBREUN ST/EXIT 209 Davidson TN 0.27 13 4.43 948 484 I 40 EB US 70/US 431/HWY 24/HWY 1/EXIT209 Davidson TN 0.19 12 5.04 1026 1213 I 40 EB I 24/EXIT 211 Davidson TN 0.41 12 4.55 1058 982 I 40 EB I 65/EXIT 210 Davidson TN 0.46 13 4.46 1064 1227 I 65 NB US 41 ALT/8TH AVE/METROCENTER BLVD/EXIT 1 Davidson TN 0.86 13 4.77 1077 762 I 24 EB I 65/EXIT 44 Davidson TN 0.68 10 6.48 1209 1616 I 440 EB US 31 ALT/US 41 ALT/NOLENSVILLE PIKE/EXIT6 Davidson TN 1.17 13 4.59 1387 1258 I 24 WB 1ST ST/EXIT 85 Davidson TN 0.24 13 4.5
10 1528 1697 I 40 EB US 31 ALT/US 41/4TH AVE/EXIT 210 Davidson TN 0.23 12 4.811 1552 1914 I 440 EB I 65/EXIT 5 Davidson TN 2.10 10 6.012 1595 892 I 24 EB WOODLAND ST Davidson TN 0.24 10 5.713 1611 1308 I 24 EB SHELBY AVE/EXIT 84 Davidson TN 0.34 11 5.314 1620 1562 I 40 EB 2ND AVE/EXIT 210 Davidson TN 0.36 11 5.315 1669 1513 I 24 WB I 24/I 40 Davidson TN 0.43 10 5.416 1864 974 I 24 EB JAMES ROBERTSON PKWY/EXIT 85 Davidson TN 0.29 10 5.417 1928 3100 I 65 NB I 24/I 65 Davidson TN 1.30 11 5.218 1953 2451 I 40 EB CHURCH ST/EXIT 209 Davidson TN 0.23 7 8.319 2051 1752 I 24 WB US 41/MURFREESBORO PIKE/EXIT52 Davidson TN 0.55 9 6.420 2061 2048 I 24 EB I 40/EXIT 83 Davidson TN 0.83 10 5.4
1.00
1.05
1.10
1.15
J F M A M J J A S O N DCBSA: Nashville-Davidson-Murfreesboro-Franklin TN
Congestion Compared to 2007: -46.3% Worst Metro Area (L.A.): 5%
Travel Time Index(TTI)1
TTI: 1.10 National TTI Rank: 22 Compared to 2007: -6.1%
Peak Travel Hour2
2008 Worst: Thursday, 5-6 PM (TTI = 1.27) 2007 Worst: Thursday, 5-6 PM (TTI = 1.36)
Population Rank: #39 (1,521,437)
Nashville Metropolitan Area
National Congestion Rank: #34 (2007 Rank: #31)
#34
Worst Bottlenecks
Overall Congestion
Travel Time Index1 by Month
LegendGreen = Roads Analyzed
Red = Bottlenecks
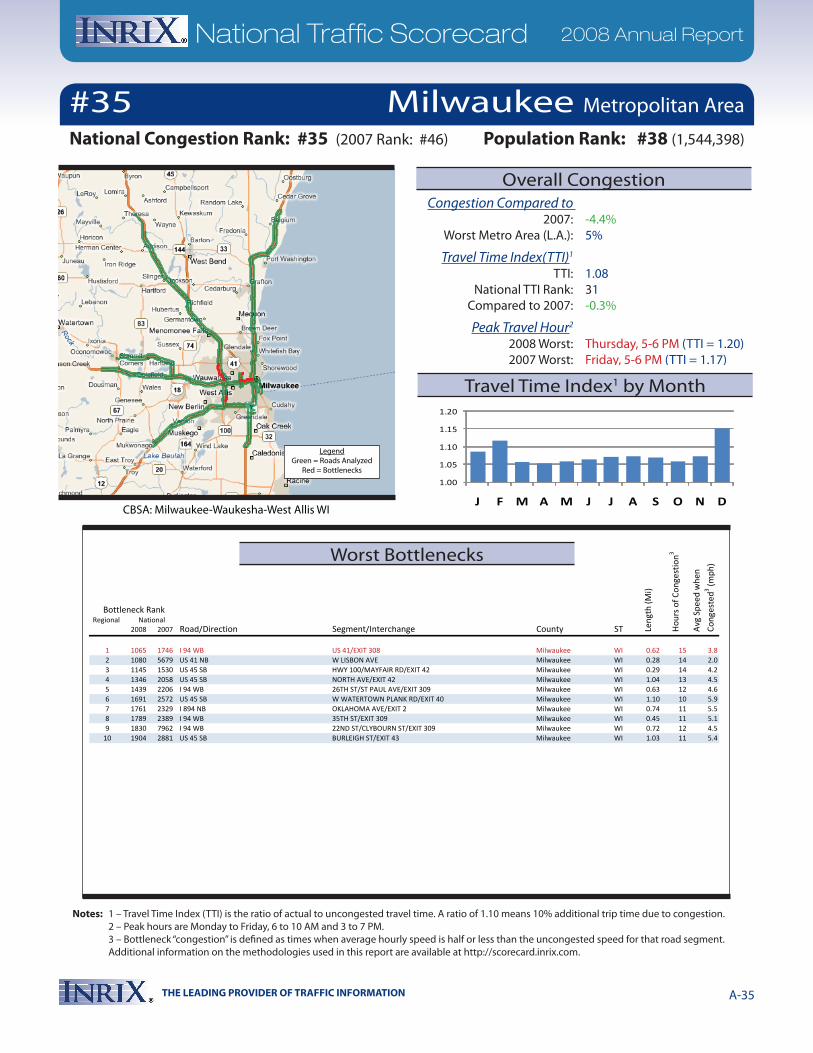
THE LEADING PROVIDER OF TRAFFIC INFORMATION A-35
National Traffic Scorecard 2008 Annual Report
Notes: 1 – Travel Time Index (TTI) is the ratio of actual to uncongested travel time. A ratio of 1.10 means 10% additional trip time due to congestion. 2 – Peak hours are Monday to Friday, 6 to 10 AM and 3 to 7 PM. 3 – Bottleneck “congestion” is defined as times when average hourly speed is half or less than the uncongested speed for that road segment. Additional information on the methodologies used in this report are available at http://scorecard.inrix.com.
Regional 2008 2007 Road/Direction Segment/Interchange County ST
Bottleneck Rank
Len
gth
(Mi)
Hou
rs o
f Con
gest
ion3
Avg
Spe
ed w
hen
Con
gest
ed3 (m
ph)
National
1 1065 1746 I 94 WB US 41/EXIT 308 Milwaukee WI 0.62 15 3.82 1080 5679 US 41 NB W LISBON AVE Milwaukee WI 0.28 14 2.03 1145 1530 US 45 SB HWY 100/MAYFAIR RD/EXIT 42 Milwaukee WI 0.29 14 4.24 1346 2058 US 45 SB NORTH AVE/EXIT 42 Milwaukee WI 1.04 13 4.55 1439 2206 I 94 WB 26TH ST/ST PAUL AVE/EXIT 309 Milwaukee WI 0.63 12 4.66 1691 2572 US 45 SB W WATERTOWN PLANK RD/EXIT 40 Milwaukee WI 1.10 10 5.97 1761 2329 I 894 NB OKLAHOMA AVE/EXIT 2 Milwaukee WI 0.74 11 5.58 1789 2389 I 94 WB 35TH ST/EXIT 309 Milwaukee WI 0.45 11 5.19 1830 7962 I 94 WB 22ND ST/CLYBOURN ST/EXIT 309 Milwaukee WI 0.72 12 4.5
10 1904 2881 US 45 SB BURLEIGH ST/EXIT 43 Milwaukee WI 1.03 11 5.4
1.00
1.05
1.10
1.15
1.20
J F M A M J J A S O N DCBSA: Milwaukee-Waukesha-West Allis WI
Congestion Compared to 2007: -4.4% Worst Metro Area (L.A.): 5%
Travel Time Index(TTI)1
TTI: 1.08 National TTI Rank: 31 Compared to 2007: -0.3%
Peak Travel Hour2
2008 Worst: Thursday, 5-6 PM (TTI = 1.20) 2007 Worst: Friday, 5-6 PM (TTI = 1.17)
Population Rank: #38 (1,544,398)
Milwaukee Metropolitan Area
National Congestion Rank: #35 (2007 Rank: #46)
#35
Worst Bottlenecks
Overall Congestion
Travel Time Index1 by Month
LegendGreen = Roads Analyzed
Red = Bottlenecks

THE LEADING PROVIDER OF TRAFFIC INFORMATION A-36
National Traffic Scorecard 2008 Annual Report
Notes: 1 – Travel Time Index (TTI) is the ratio of actual to uncongested travel time. A ratio of 1.10 means 10% additional trip time due to congestion. 2 – Peak hours are Monday to Friday, 6 to 10 AM and 3 to 7 PM. 3 – Bottleneck “congestion” is defined as times when average hourly speed is half or less than the uncongested speed for that road segment. Additional information on the methodologies used in this report are available at http://scorecard.inrix.com.
Regional 2008 2007 Road/Direction Segment/Interchange County ST
Bottleneck Rank
Len
gth
(Mi)
Hou
rs o
f Con
gest
ion3
Avg
Spe
ed w
hen
Con
gest
ed3 (m
ph)
National
1 378 262 I 4 EB KALEY AVE/35TH ST/EXIT 35 Orange FL 0.48 29 19.92 478 382 I 4 EB HWY 408/EXIT 36 Orange FL 0.40 29 22.13 573 627 I 4 EB GORE ST/EXIT 37 Orange FL 0.14 25 20.34 755 491 I 4 EB MICHIGAN ST/EXIT 34 Orange FL 0.45 23 23.55 800 1717 East West Expy/Hwy 408 EB BUMBY AVE/EXIT 12 Orange FL 0.48 15 16.36 1757 1274 I 4 EB US 17/US 441/US 92/33RD ST/EXIT 33 Orange FL 1.28 13 26.57 2045 3832 I 4 EB ANDERSON ST/EXIT 38 Orange FL 0.54 11 24.38 2064 1731 I 4 EB FAIRBANKS AVE/EXIT 45 Orange FL 1.09 9 22.19 2141 3645 East West Expy/Hwy 408 EB S CRYSTAL LAKE DR/EXIT 12 Orange FL 0.84 9 22.5
10 2418 3067 East West Expy/Hwy 408 EB MILLS AVE/EXIT 11 Orange FL 1.00 5 14.8
1.00
1.05
1.10
J F M A M J J A S O N DCBSA: Orlando-Kissimmee FL
Congestion Compared to 2007: -39.2% Worst Metro Area (L.A.): 5%
Travel Time Index(TTI)1
TTI: 1.05 National TTI Rank: 46 Compared to 2007: -2.9%
Peak Travel Hour2
2008 Worst: Thursday, 5-6 PM (TTI = 1.11) 2007 Worst: Friday, 5-6 PM (TTI = 1.16)
Population Rank: #27 (2,032,496)
Orlando Metropolitan Area
National Congestion Rank: #36 (2007 Rank: #35)
#36
Worst Bottlenecks
Overall Congestion
Travel Time Index1 by Month
LegendGreen = Roads Analyzed
Red = Bottlenecks
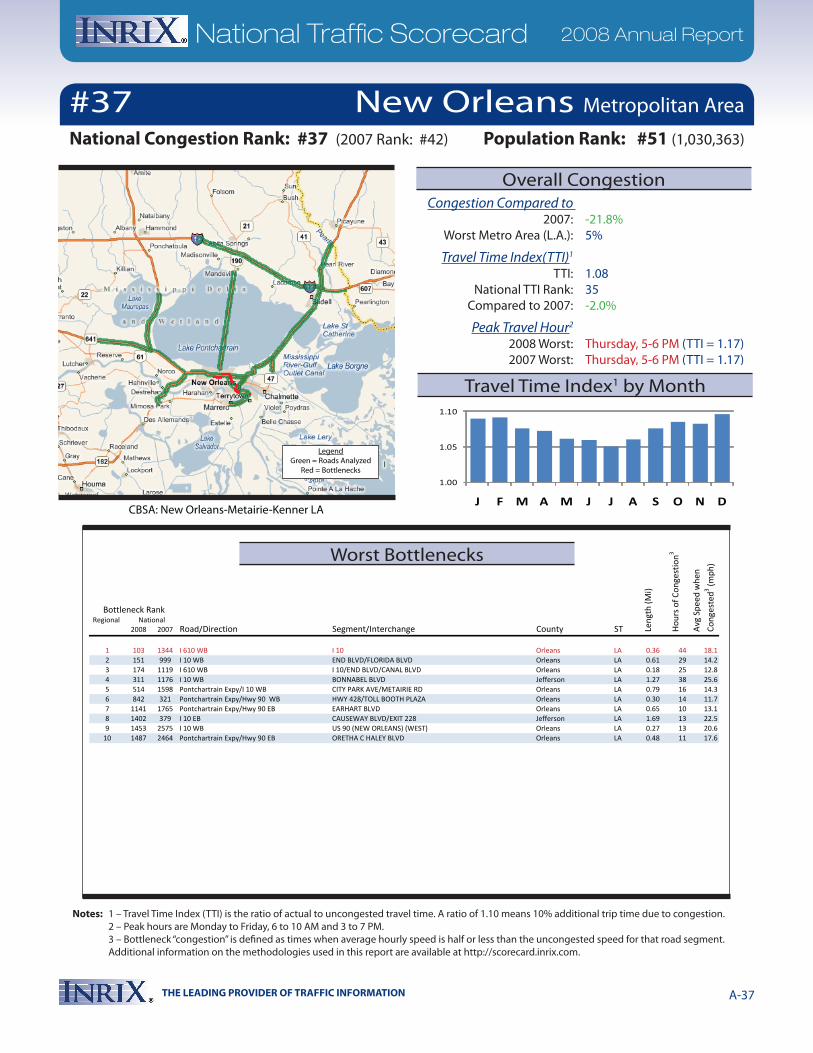
THE LEADING PROVIDER OF TRAFFIC INFORMATION A-37
National Traffic Scorecard 2008 Annual Report
Notes: 1 – Travel Time Index (TTI) is the ratio of actual to uncongested travel time. A ratio of 1.10 means 10% additional trip time due to congestion. 2 – Peak hours are Monday to Friday, 6 to 10 AM and 3 to 7 PM. 3 – Bottleneck “congestion” is defined as times when average hourly speed is half or less than the uncongested speed for that road segment. Additional information on the methodologies used in this report are available at http://scorecard.inrix.com.
Regional 2008 2007 Road/Direction Segment/Interchange County ST
1 103 1344 I 610 WB I 10 Orleans LA 0.36 44 18.12 151 999 I 10 WB END BLVD/FLORIDA BLVD Orleans LA 0.61 29 14.23 174 1119 I 610 WB I 10/END BLVD/CANAL BLVD Orleans LA 0.18 25 12.84 311 1176 I 10 WB BONNABEL BLVD Jefferson LA 1.27 38 25.65 514 1598 Pontchartrain Expy/I 10 WB CITY PARK AVE/METAIRIE RD Orleans LA 0.79 16 14.36 842 321 Pontchartrain Expy/Hwy 90 WB HWY 428/TOLL BOOTH PLAZA Orleans LA 0.30 14 11.77 1141 1765 Pontchartrain Expy/Hwy 90 EB EARHART BLVD Orleans LA 0.65 10 13.18 1402 379 I 10 EB CAUSEWAY BLVD/EXIT 228 Jefferson LA 1.69 13 22.59 1453 2575 I 10 WB US 90 (NEW ORLEANS) (WEST) Orleans LA 0.27 13 20.6
10 1487 2464 Pontchartrain Expy/Hwy 90 EB ORETHA C HALEY BLVD Orleans LA 0.48 11 17.6
Bottleneck Rank
Len
gth
(Mi)
Hou
rs o
f Con
gest
ion3
Avg
Spe
ed w
hen
Con
gest
ed3 (m
ph)
National
1.00
1.05
1.10
J F M A M J J A S O N DCBSA: New Orleans-Metairie-Kenner LA
Congestion Compared to 2007: -21.8% Worst Metro Area (L.A.): 5%
Travel Time Index(TTI)1
TTI: 1.08 National TTI Rank: 35 Compared to 2007: -2.0%
Peak Travel Hour2
2008 Worst: Thursday, 5-6 PM (TTI = 1.17) 2007 Worst: Thursday, 5-6 PM (TTI = 1.17)
Population Rank: #51 (1,030,363)
New Orleans Metropolitan Area
National Congestion Rank: #37 (2007 Rank: #42)
#37
Worst Bottlenecks
Overall Congestion
Travel Time Index1 by Month
LegendGreen = Roads Analyzed
Red = Bottlenecks

THE LEADING PROVIDER OF TRAFFIC INFORMATION A-38
National Traffic Scorecard 2008 Annual Report
Notes: 1 – Travel Time Index (TTI) is the ratio of actual to uncongested travel time. A ratio of 1.10 means 10% additional trip time due to congestion. 2 – Peak hours are Monday to Friday, 6 to 10 AM and 3 to 7 PM. 3 – Bottleneck “congestion” is defined as times when average hourly speed is half or less than the uncongested speed for that road segment. Additional information on the methodologies used in this report are available at http://scorecard.inrix.com.
Regional 2008 2007 Road/Direction Segment/Interchange County ST
Bottleneck Rank
Len
gth
(Mi)
Hou
rs o
f Con
gest
ion3
Avg
Spe
ed w
hen
Con
gest
ed3 (m
ph)
National
1 847 1315 I 90 WB CHESTER AVE/EXIT 173 Cuyahoga OH 0.24 15 15.72 909 1196 I 90 WB US 6/SUPERIOR AVE/EXIT 173 Cuyahoga OH 0.54 13 13.23 1138 1915 I 71 NB I 90/EXIT 170 Cuyahoga OH 1.24 15 21.34 1303 1910 I 90 WB PROSPECT AVE/EXIT 173 Cuyahoga OH 0.24 14 19.05 2130 2796 I 90 WB CARNEGIE AVE/EXIT 172 Cuyahoga OH 0.10 10 22.06 2329 3704 I 71 NB US 42/PEARL RD/EXIT 245 Cuyahoga OH 1.04 8 23.27 2350 2877 I 90 WB KING AVE Cuyahoga OH 0.07 7 13.78 2432 2822 I 480 EB LEE RD/EXIT 24 Cuyahoga OH 0.57 9 26.49 2467 2872 I 77 SB ROCKSIDE RD/EXIT 155 Cuyahoga OH 1.10 7 22.0
10 2800 3466 I 77 NB HWY 21/BRECKSVILLE RD/EXIT 157 Cuyahoga OH 0.65 7 25.9
1.00
1.05
1.10
J F M A M J J A S O N DCBSA: Cleveland-Elyria-Mentor OH
Congestion Compared to 2007: -32.7% Worst Metro Area (L.A.): 5%
Travel Time Index(TTI)1
TTI: 1.04 National TTI Rank: 49 Compared to 2007: -2.0%
Peak Travel Hour2
2008 Worst: Tuesday, 5-6 PM (TTI = 1.09) 2007 Worst: Tuesday, 5-6 PM (TTI = 1.13)
Population Rank: #25 (2,096,471)
Cleveland Metropolitan Area
National Congestion Rank: #38 (2007 Rank: #36)
#38
Worst Bottlenecks
Overall Congestion
Travel Time Index1 by Month
LegendGreen = Roads Analyzed
Red = Bottlenecks
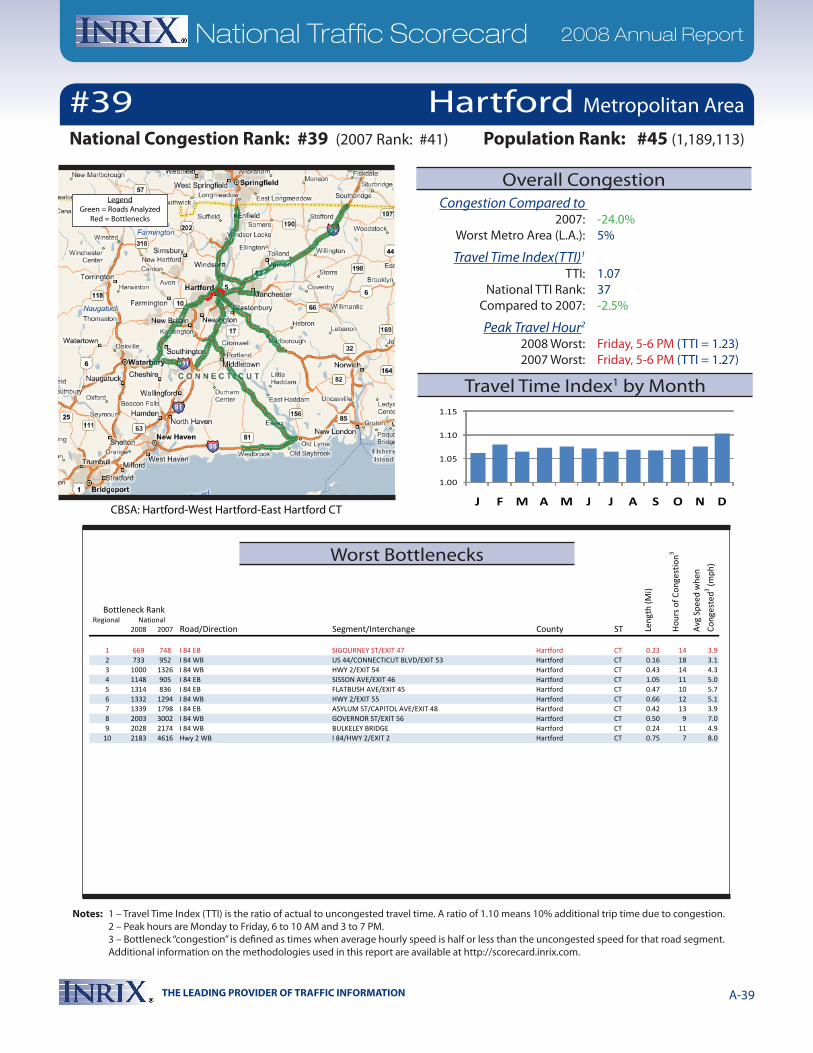
THE LEADING PROVIDER OF TRAFFIC INFORMATION A-39
National Traffic Scorecard 2008 Annual Report
Notes: 1 – Travel Time Index (TTI) is the ratio of actual to uncongested travel time. A ratio of 1.10 means 10% additional trip time due to congestion. 2 – Peak hours are Monday to Friday, 6 to 10 AM and 3 to 7 PM. 3 – Bottleneck “congestion” is defined as times when average hourly speed is half or less than the uncongested speed for that road segment. Additional information on the methodologies used in this report are available at http://scorecard.inrix.com.
Regional 2008 2007 Road/Direction Segment/Interchange County ST
Bottleneck Rank
Len
gth
(Mi)
Hou
rs o
f Con
gest
ion3
Avg
Spe
ed w
hen
Con
gest
ed3 (m
ph)
National
1 669 748 I 84 EB SIGOURNEY ST/EXIT 47 Hartford CT 0.23 14 3.92 733 952 I 84 WB US 44/CONNECTICUT BLVD/EXIT 53 Hartford CT 0.16 18 3.13 1000 1326 I 84 WB HWY 2/EXIT 54 Hartford CT 0.43 14 4.34 1148 905 I 84 EB SISSON AVE/EXIT 46 Hartford CT 1.05 11 5.05 1314 836 I 84 EB FLATBUSH AVE/EXIT 45 Hartford CT 0.47 10 5.76 1332 1294 I 84 WB HWY 2/EXIT 55 Hartford CT 0.66 12 5.17 1339 1798 I 84 EB ASYLUM ST/CAPITOL AVE/EXIT 48 Hartford CT 0.42 13 3.98 2003 3002 I 84 WB GOVERNOR ST/EXIT 56 Hartford CT 0.50 9 7.09 2028 2174 I 84 WB BULKELEY BRIDGE Hartford CT 0.24 11 4.9
10 2183 4616 Hwy 2 WB I 84/HWY 2/EXIT 2 Hartford CT 0.75 7 8.0
1.00
1.05
1.10
1.15
J F M A M J J A S O N DCBSA: Hartford-West Hartford-East Hartford CT
Congestion Compared to 2007: -24.0% Worst Metro Area (L.A.): 5%
Travel Time Index(TTI)1
TTI: 1.07 National TTI Rank: 37 Compared to 2007: -2.5%
Peak Travel Hour2
2008 Worst: Friday, 5-6 PM (TTI = 1.23) 2007 Worst: Friday, 5-6 PM (TTI = 1.27)
Population Rank: #45 (1,189,113)
Hartford Metropolitan Area
National Congestion Rank: #39 (2007 Rank: #41)
#39
Worst Bottlenecks
Overall Congestion
Travel Time Index1 by Month
LegendGreen = Roads Analyzed
Red = Bottlenecks
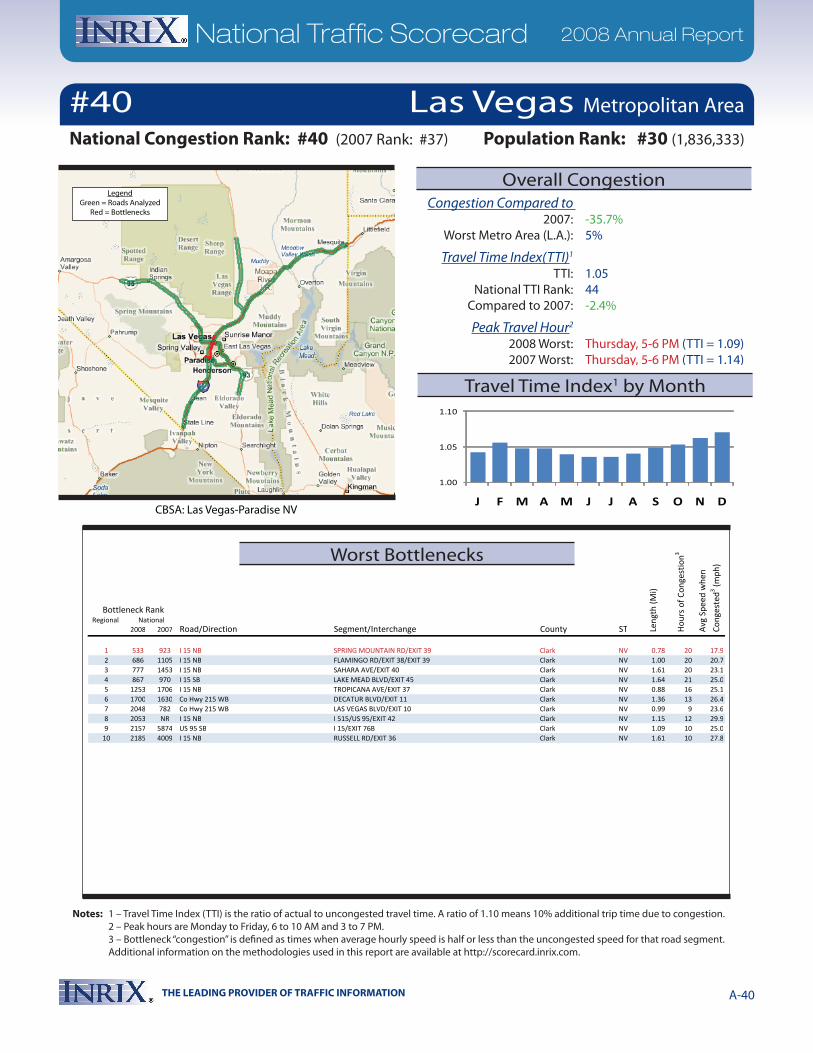
THE LEADING PROVIDER OF TRAFFIC INFORMATION A-40
National Traffic Scorecard 2008 Annual Report
Notes: 1 – Travel Time Index (TTI) is the ratio of actual to uncongested travel time. A ratio of 1.10 means 10% additional trip time due to congestion. 2 – Peak hours are Monday to Friday, 6 to 10 AM and 3 to 7 PM. 3 – Bottleneck “congestion” is defined as times when average hourly speed is half or less than the uncongested speed for that road segment. Additional information on the methodologies used in this report are available at http://scorecard.inrix.com.
Regional 2008 2007 Road/Direction Segment/Interchange County ST
Bottleneck Rank
Len
gth
(Mi)
Hou
rs o
f Con
gest
ion3
Avg
Spe
ed w
hen
Con
gest
ed3 (m
ph)
National
1 533 923 I 15 NB SPRING MOUNTAIN RD/EXIT 39 Clark NV 0.78 20 17.92 686 1105 I 15 NB FLAMINGO RD/EXIT 38/EXIT 39 Clark NV 1.00 20 20.73 777 1453 I 15 NB SAHARA AVE/EXIT 40 Clark NV 1.61 20 23.14 867 970 I 15 SB LAKE MEAD BLVD/EXIT 45 Clark NV 1.64 21 25.05 1253 1706 I 15 NB TROPICANA AVE/EXIT 37 Clark NV 0.88 16 25.16 1700 1630 Co Hwy 215 WB DECATUR BLVD/EXIT 11 Clark NV 1.36 13 26.47 2048 782 Co Hwy 215 WB LAS VEGAS BLVD/EXIT 10 Clark NV 0.99 9 23.68 2053 NR I 15 NB I 515/US 95/EXIT 42 Clark NV 1.15 12 29.99 2157 5874 US 95 SB I 15/EXIT 76B Clark NV 1.09 10 25.0
10 2185 4009 I 15 NB RUSSELL RD/EXIT 36 Clark NV 1.61 10 27.8
1.00
1.05
1.10
J F M A M J J A S O N DCBSA: Las Vegas-Paradise NV
Congestion Compared to 2007: -35.7% Worst Metro Area (L.A.): 5%
Travel Time Index(TTI)1
TTI: 1.05 National TTI Rank: 44 Compared to 2007: -2.4%
Peak Travel Hour2
2008 Worst: Thursday, 5-6 PM (TTI = 1.09) 2007 Worst: Thursday, 5-6 PM (TTI = 1.14)
Population Rank: #30 (1,836,333)
Las Vegas Metropolitan Area
National Congestion Rank: #40 (2007 Rank: #37)
#40
Worst Bottlenecks
Overall Congestion
Travel Time Index1 by Month
LegendGreen = Roads Analyzed
Red = Bottlenecks
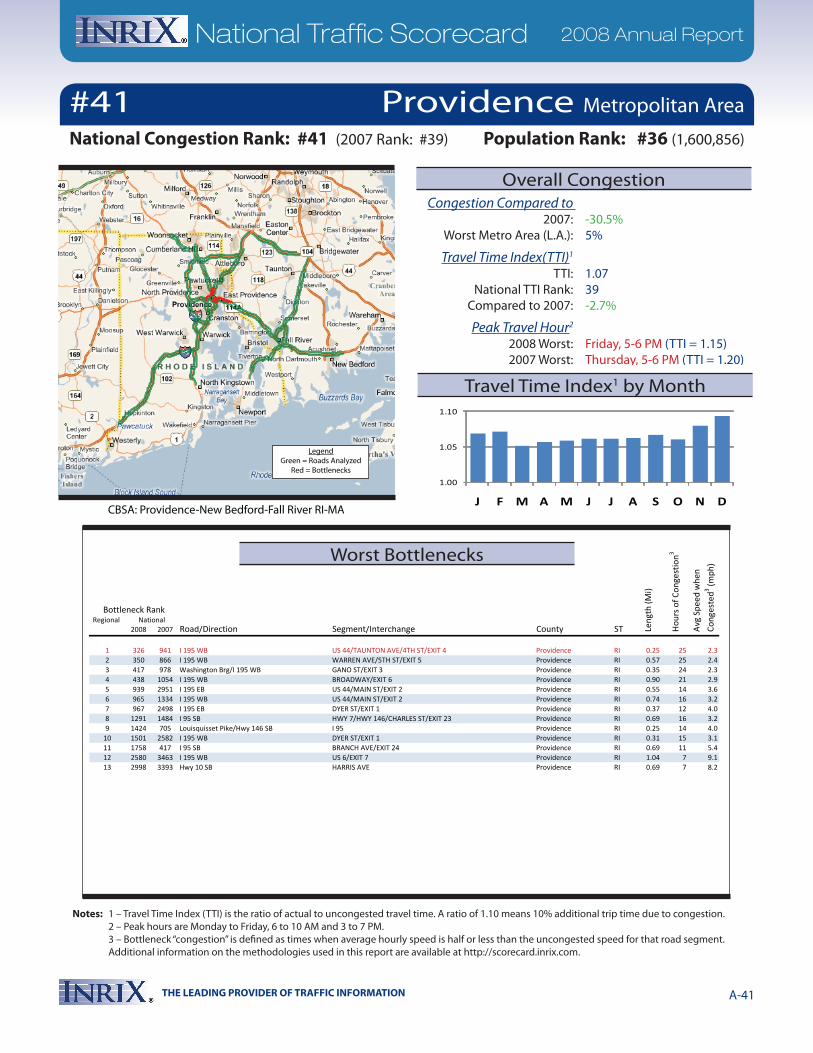
THE LEADING PROVIDER OF TRAFFIC INFORMATION A-41
National Traffic Scorecard 2008 Annual Report
Notes: 1 – Travel Time Index (TTI) is the ratio of actual to uncongested travel time. A ratio of 1.10 means 10% additional trip time due to congestion. 2 – Peak hours are Monday to Friday, 6 to 10 AM and 3 to 7 PM. 3 – Bottleneck “congestion” is defined as times when average hourly speed is half or less than the uncongested speed for that road segment. Additional information on the methodologies used in this report are available at http://scorecard.inrix.com.
Regional 2008 2007 Road/Direction Segment/Interchange County ST
Bottleneck Rank
Len
gth
(Mi)
Hou
rs o
f Con
gest
ion3
Avg
Spe
ed w
hen
Con
gest
ed3 (m
ph)
National
1 326 941 I 195 WB US 44/TAUNTON AVE/4TH ST/EXIT 4 Providence RI 0.25 25 2.32 350 866 I 195 WB WARREN AVE/5TH ST/EXIT 5 Providence RI 0.57 25 2.43 417 978 Washington Brg/I 195 WB GANO ST/EXIT 3 Providence RI 0.35 24 2.34 438 1054 I 195 WB BROADWAY/EXIT 6 Providence RI 0.90 21 2.95 939 2951 I 195 EB US 44/MAIN ST/EXIT 2 Providence RI 0.55 14 3.66 965 1334 I 195 WB US 44/MAIN ST/EXIT 2 Providence RI 0.74 16 3.27 967 2498 I 195 EB DYER ST/EXIT 1 Providence RI 0.37 12 4.08 1291 1484 I 95 SB HWY 7/HWY 146/CHARLES ST/EXIT 23 Providence RI 0.69 16 3.29 1424 705 Louisquisset Pike/Hwy 146 SB I 95 Providence RI 0.25 14 4.0
10 1501 2582 I 195 WB DYER ST/EXIT 1 Providence RI 0.31 15 3.111 1758 417 I 95 SB BRANCH AVE/EXIT 24 Providence RI 0.69 11 5.412 2580 3463 I 195 WB US 6/EXIT 7 Providence RI 1.04 7 9.113 2998 3393 Hwy 10 SB HARRIS AVE Providence RI 0.69 7 8.2
1.00
1.05
1.10
J F M A M J J A S O N DCBSA: Providence-New Bedford-Fall River RI-MA
Congestion Compared to 2007: -30.5% Worst Metro Area (L.A.): 5%
Travel Time Index(TTI)1
TTI: 1.07 National TTI Rank: 39 Compared to 2007: -2.7%
Peak Travel Hour2
2008 Worst: Friday, 5-6 PM (TTI = 1.15) 2007 Worst: Thursday, 5-6 PM (TTI = 1.20)
Population Rank: #36 (1,600,856)
Providence Metropolitan Area
National Congestion Rank: #41 (2007 Rank: #39)
#41
Worst Bottlenecks
Overall Congestion
Travel Time Index1 by Month
LegendGreen = Roads Analyzed
Red = Bottlenecks
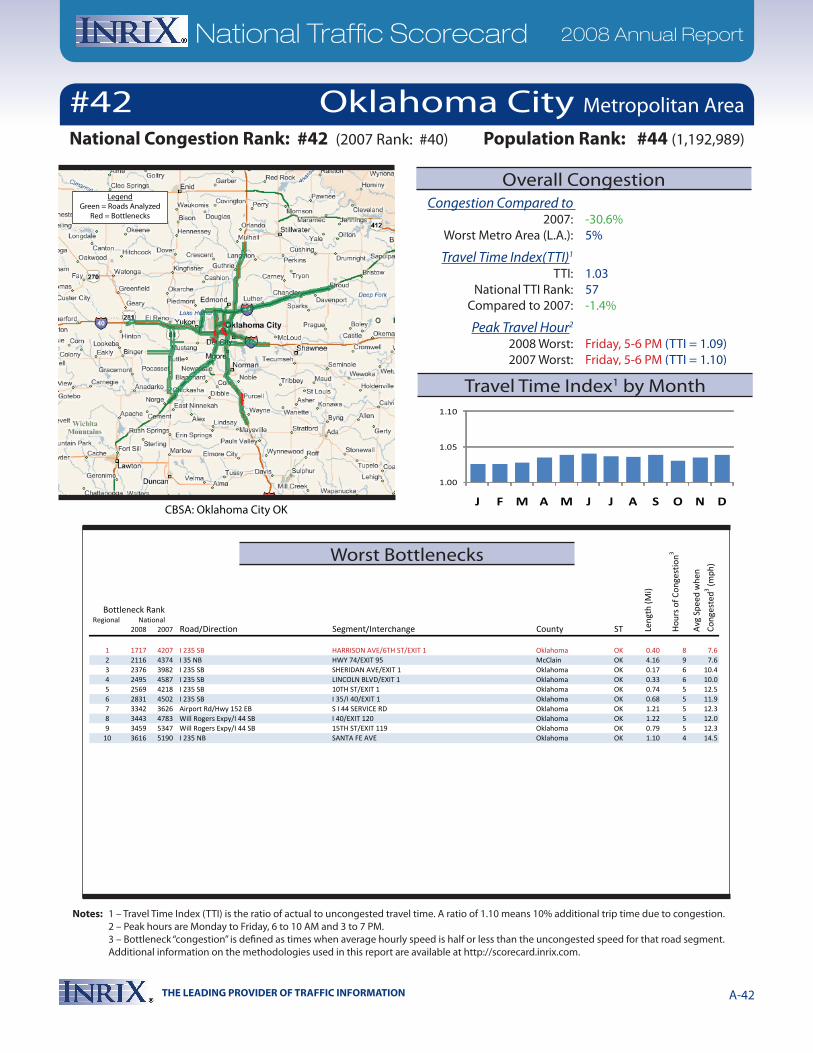
THE LEADING PROVIDER OF TRAFFIC INFORMATION A-42
National Traffic Scorecard 2008 Annual Report
Notes: 1 – Travel Time Index (TTI) is the ratio of actual to uncongested travel time. A ratio of 1.10 means 10% additional trip time due to congestion. 2 – Peak hours are Monday to Friday, 6 to 10 AM and 3 to 7 PM. 3 – Bottleneck “congestion” is defined as times when average hourly speed is half or less than the uncongested speed for that road segment. Additional information on the methodologies used in this report are available at http://scorecard.inrix.com.
Regional 2008 2007 Road/Direction Segment/Interchange County ST
Bottleneck Rank
Len
gth
(Mi)
Hou
rs o
f Con
gest
ion3
Avg
Spe
ed w
hen
Con
gest
ed3 (m
ph)
National
1 1717 4207 I 235 SB HARRISON AVE/6TH ST/EXIT 1 Oklahoma OK 0.40 8 7.62 2116 4374 I 35 NB HWY 74/EXIT 95 McClain OK 4.16 9 7.63 2376 3982 I 235 SB SHERIDAN AVE/EXIT 1 Oklahoma OK 0.17 6 10.44 2495 4587 I 235 SB LINCOLN BLVD/EXIT 1 Oklahoma OK 0.33 6 10.05 2569 4218 I 235 SB 10TH ST/EXIT 1 Oklahoma OK 0.74 5 12.56 2831 4502 I 235 SB I 35/I 40/EXIT 1 Oklahoma OK 0.68 5 11.97 3342 3626 Airport Rd/Hwy 152 EB S I 44 SERVICE RD Oklahoma OK 1.21 5 12.38 3443 4783 Will Rogers Expy/I 44 SB I 40/EXIT 120 Oklahoma OK 1.22 5 12.09 3459 5347 Will Rogers Expy/I 44 SB 15TH ST/EXIT 119 Oklahoma OK 0.79 5 12.3
10 3616 5190 I 235 NB SANTA FE AVE Oklahoma OK 1.10 4 14.5
1.00
1.05
1.10
J F M A M J J A S O N DCBSA: Oklahoma City OK
Congestion Compared to 2007: -30.6% Worst Metro Area (L.A.): 5%
Travel Time Index(TTI)1
TTI: 1.03 National TTI Rank: 57 Compared to 2007: -1.4%
Peak Travel Hour2
2008 Worst: Friday, 5-6 PM (TTI = 1.09) 2007 Worst: Friday, 5-6 PM (TTI = 1.10)
Population Rank: #44 (1,192,989)
Oklahoma City Metropolitan Area
National Congestion Rank: #42 (2007 Rank: #40)
#42
Worst Bottlenecks
Overall Congestion
Travel Time Index1 by Month
LegendGreen = Roads Analyzed
Red = Bottlenecks
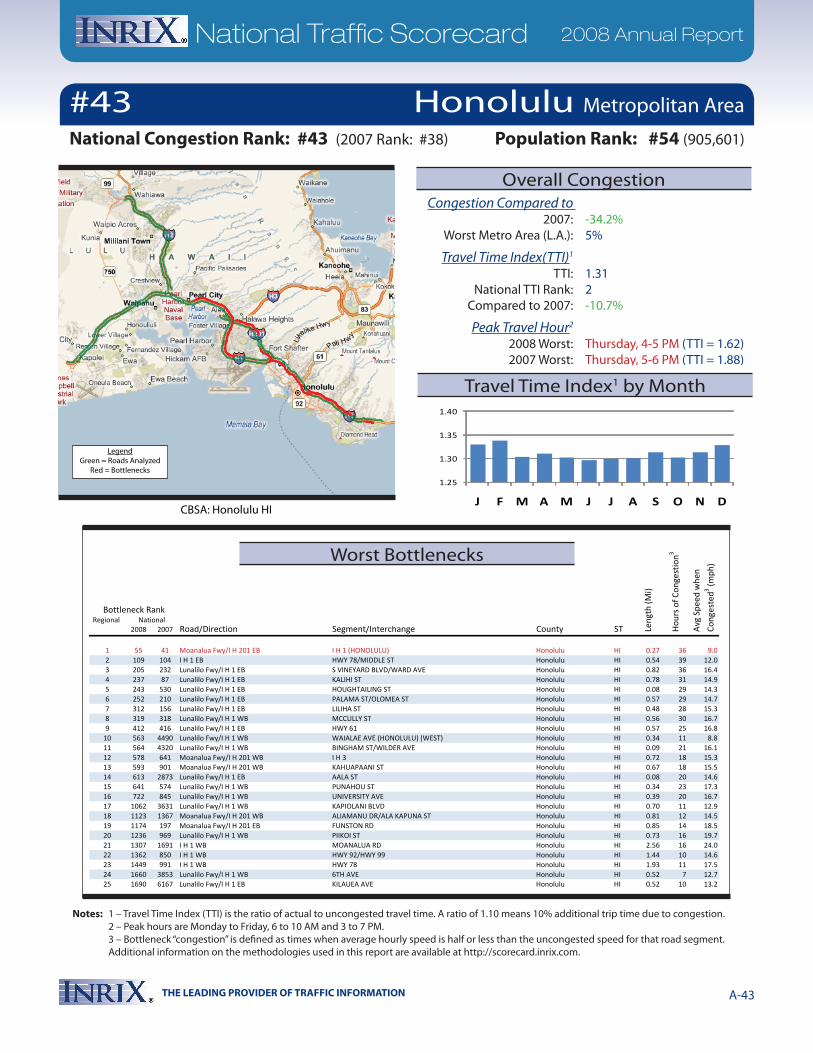
THE LEADING PROVIDER OF TRAFFIC INFORMATION A-43
National Traffic Scorecard 2008 Annual Report
Notes: 1 – Travel Time Index (TTI) is the ratio of actual to uncongested travel time. A ratio of 1.10 means 10% additional trip time due to congestion. 2 – Peak hours are Monday to Friday, 6 to 10 AM and 3 to 7 PM. 3 – Bottleneck “congestion” is defined as times when average hourly speed is half or less than the uncongested speed for that road segment. Additional information on the methodologies used in this report are available at http://scorecard.inrix.com.
Regional 2008 2007 Road/Direction Segment/Interchange County ST
Bottleneck Rank
Len
gth
(Mi)
Hou
rs o
f Con
gest
ion3
Avg
Spe
ed w
hen
Con
gest
ed3 (m
ph)
National
1 55 41 Moanalua Fwy/I H 201 EB I H 1 (HONOLULU) Honolulu HI 0.27 36 9.02 109 104 I H 1 EB HWY 78/MIDDLE ST Honolulu HI 0.54 39 12.03 205 232 Lunalilo Fwy/I H 1 EB S VINEYARD BLVD/WARD AVE Honolulu HI 0.82 36 16.44 237 87 Lunalilo Fwy/I H 1 EB KALIHI ST Honolulu HI 0.78 31 14.95 243 530 Lunalilo Fwy/I H 1 EB HOUGHTAILING ST Honolulu HI 0.08 29 14.36 252 210 Lunalilo Fwy/I H 1 EB PALAMA ST/OLOMEA ST Honolulu HI 0.57 29 14.77 312 156 Lunalilo Fwy/I H 1 EB LILIHA ST Honolulu HI 0.48 28 15.38 319 318 Lunalilo Fwy/I H 1 WB MCCULLY ST Honolulu HI 0.56 30 16.79 412 416 Lunalilo Fwy/I H 1 EB HWY 61 Honolulu HI 0.57 25 16.8
10 563 4490 Lunalilo Fwy/I H 1 WB WAIALAE AVE (HONOLULU) (WEST) Honolulu HI 0.34 11 8.811 564 4320 Lunalilo Fwy/I H 1 WB BINGHAM ST/WILDER AVE Honolulu HI 0.09 21 16.112 578 641 Moanalua Fwy/I H 201 WB I H 3 Honolulu HI 0.72 18 15.313 593 901 Moanalua Fwy/I H 201 WB KAHUAPAANI ST Honolulu HI 0.67 18 15.514 613 2873 Lunalilo Fwy/I H 1 EB AALA ST Honolulu HI 0.08 20 14.615 641 574 Lunalilo Fwy/I H 1 WB PUNAHOU ST Honolulu HI 0.34 23 17.316 722 845 Lunalilo Fwy/I H 1 WB UNIVERSITY AVE Honolulu HI 0.39 20 16.717 1062 3631 Lunalilo Fwy/I H 1 WB KAPIOLANI BLVD Honolulu HI 0.70 11 12.918 1123 1367 Moanalua Fwy/I H 201 WB ALIAMANU DR/ALA KAPUNA ST Honolulu HI 0.81 12 14.519 1174 197 Moanalua Fwy/I H 201 EB FUNSTON RD Honolulu HI 0.85 14 18.520 1236 969 Lunalilo Fwy/I H 1 WB PIIKOI ST Honolulu HI 0.73 16 19.721 1307 1691 I H 1 WB MOANALUA RD Honolulu HI 2.56 16 24.022 1362 850 I H 1 WB HWY 92/HWY 99 Honolulu HI 1.44 10 14.623 1449 991 I H 1 WB HWY 78 Honolulu HI 1.93 11 17.524 1660 3853 Lunalilo Fwy/I H 1 WB 6TH AVE Honolulu HI 0.52 7 12.725 1690 6167 Lunalilo Fwy/I H 1 EB KILAUEA AVE Honolulu HI 0.52 10 13.2
1.25
1.30
1.35
1.40
J F M A M J J A S O N DCBSA: Honolulu HI
Congestion Compared to 2007: -34.2% Worst Metro Area (L.A.): 5%
Travel Time Index(TTI)1
TTI: 1.31 National TTI Rank: 2 Compared to 2007: -10.7%
Peak Travel Hour2
2008 Worst: Thursday, 4-5 PM (TTI = 1.62) 2007 Worst: Thursday, 5-6 PM (TTI = 1.88)
Population Rank: #54 (905,601)
Honolulu Metropolitan Area
National Congestion Rank: #43 (2007 Rank: #38)
#43
Worst Bottlenecks
Overall Congestion
Travel Time Index1 by Month
LegendGreen = Roads Analyzed
Red = Bottlenecks
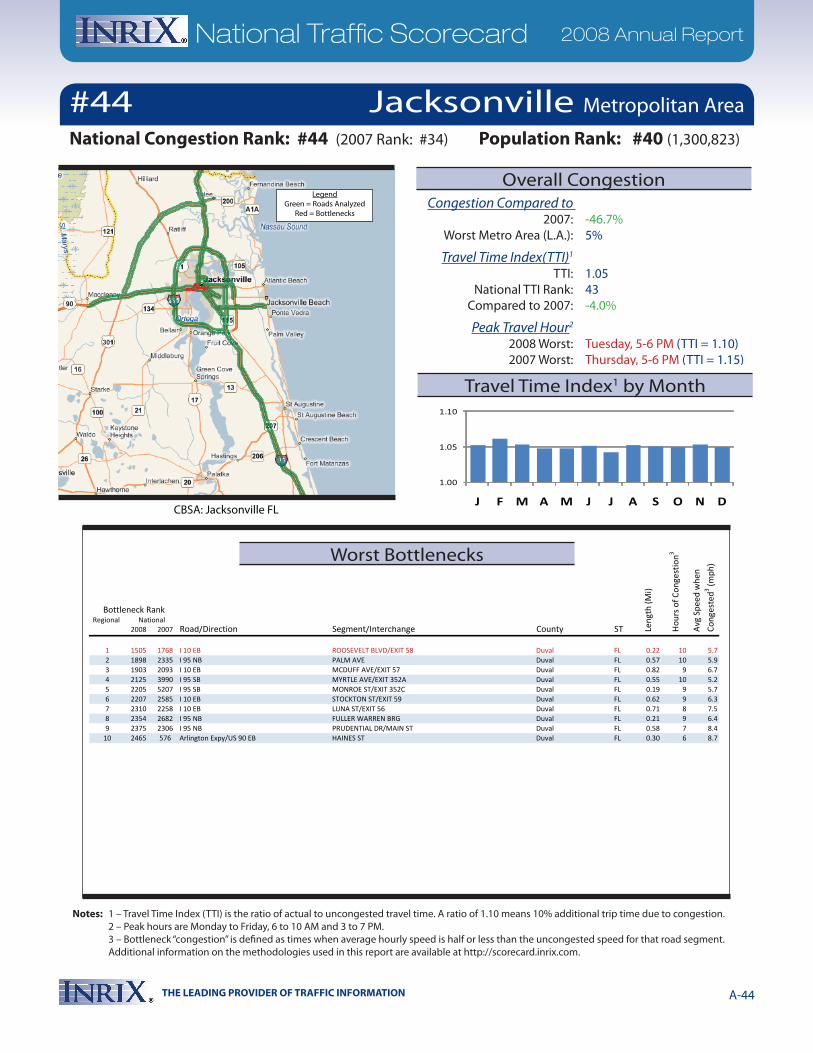
THE LEADING PROVIDER OF TRAFFIC INFORMATION A-44
National Traffic Scorecard 2008 Annual Report
Notes: 1 – Travel Time Index (TTI) is the ratio of actual to uncongested travel time. A ratio of 1.10 means 10% additional trip time due to congestion. 2 – Peak hours are Monday to Friday, 6 to 10 AM and 3 to 7 PM. 3 – Bottleneck “congestion” is defined as times when average hourly speed is half or less than the uncongested speed for that road segment. Additional information on the methodologies used in this report are available at http://scorecard.inrix.com.
Regional 2008 2007 Road/Direction Segment/Interchange County ST
Bottleneck Rank
Len
gth
(Mi)
Hou
rs o
f Con
gest
ion3
Avg
Spe
ed w
hen
Con
gest
ed3 (m
ph)
National
1 1505 1768 I 10 EB ROOSEVELT BLVD/EXIT 58 Duval FL 0.22 10 5.72 1898 2335 I 95 NB PALM AVE Duval FL 0.57 10 5.93 1903 2093 I 10 EB MCDUFF AVE/EXIT 57 Duval FL 0.82 9 6.74 2125 3990 I 95 SB MYRTLE AVE/EXIT 352A Duval FL 0.55 10 5.25 2205 5207 I 95 SB MONROE ST/EXIT 352C Duval FL 0.19 9 5.76 2207 2585 I 10 EB STOCKTON ST/EXIT 59 Duval FL 0.62 9 6.37 2310 2258 I 10 EB LUNA ST/EXIT 56 Duval FL 0.71 8 7.58 2354 2682 I 95 NB FULLER WARREN BRG Duval FL 0.21 9 6.49 2375 2306 I 95 NB PRUDENTIAL DR/MAIN ST Duval FL 0.58 7 8.4
10 2465 576 Arlington Expy/US 90 EB HAINES ST Duval FL 0.30 6 8.7
1.00
1.05
1.10
J F M A M J J A S O N DCBSA: Jacksonville FL
Congestion Compared to 2007: -46.7% Worst Metro Area (L.A.): 5%
Travel Time Index(TTI)1
TTI: 1.05 National TTI Rank: 43 Compared to 2007: -4.0%
Peak Travel Hour2
2008 Worst: Tuesday, 5-6 PM (TTI = 1.10) 2007 Worst: Thursday, 5-6 PM (TTI = 1.15)
#44Population Rank: #40 (1,300,823)
Jacksonville Metropolitan Area
National Congestion Rank: #44 (2007 Rank: #34)
Worst Bottlenecks
Overall Congestion
Travel Time Index1 by Month
LegendGreen = Roads Analyzed
Red = Bottlenecks
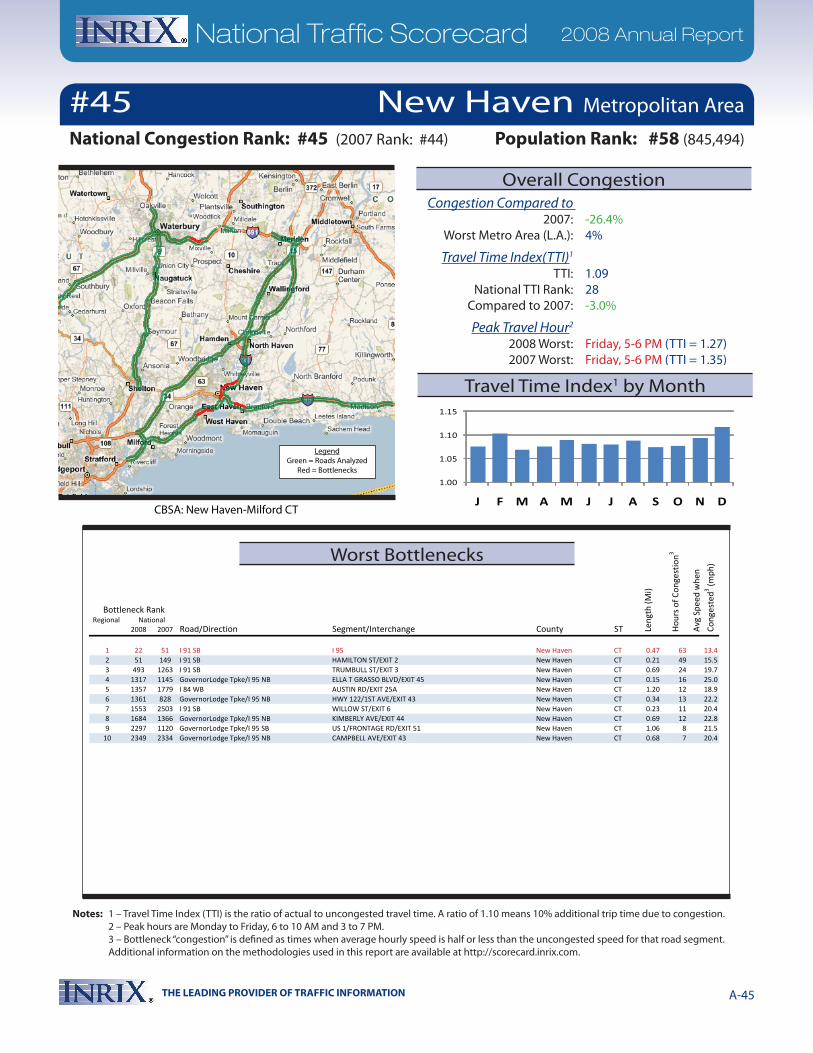
THE LEADING PROVIDER OF TRAFFIC INFORMATION A-45
National Traffic Scorecard 2008 Annual Report
Notes: 1 – Travel Time Index (TTI) is the ratio of actual to uncongested travel time. A ratio of 1.10 means 10% additional trip time due to congestion. 2 – Peak hours are Monday to Friday, 6 to 10 AM and 3 to 7 PM. 3 – Bottleneck “congestion” is defined as times when average hourly speed is half or less than the uncongested speed for that road segment. Additional information on the methodologies used in this report are available at http://scorecard.inrix.com.
Regional 2008 2007 Road/Direction Segment/Interchange County ST
Bottleneck Rank
Len
gth
(Mi)
Hou
rs o
f Con
gest
ion3
Avg
Spe
ed w
hen
Con
gest
ed3 (m
ph)
National
1 22 51 I 91 SB I 95 New Haven CT 0.47 63 13.42 51 149 I 91 SB HAMILTON ST/EXIT 2 New Haven CT 0.21 49 15.53 493 1263 I 91 SB TRUMBULL ST/EXIT 3 New Haven CT 0.69 24 19.74 1317 1145 GovernorLodge Tpke/I 95 NB ELLA T GRASSO BLVD/EXIT 45 New Haven CT 0.15 16 25.05 1357 1779 I 84 WB AUSTIN RD/EXIT 25A New Haven CT 1.20 12 18.96 1361 828 GovernorLodge Tpke/I 95 NB HWY 122/1ST AVE/EXIT 43 New Haven CT 0.34 13 22.27 1553 2503 I 91 SB WILLOW ST/EXIT 6 New Haven CT 0.23 11 20.48 1684 1366 GovernorLodge Tpke/I 95 NB KIMBERLY AVE/EXIT 44 New Haven CT 0.69 12 22.89 2297 1120 GovernorLodge Tpke/I 95 SB US 1/FRONTAGE RD/EXIT 51 New Haven CT 1.06 8 21.5
10 2349 2334 GovernorLodge Tpke/I 95 NB CAMPBELL AVE/EXIT 43 New Haven CT 0.68 7 20.4
1.00
1.05
1.10
1.15
J F M A M J J A S O N DCBSA: New Haven-Milford CT
Congestion Compared to 2007: -26.4% Worst Metro Area (L.A.): 4%
Travel Time Index(TTI)1
TTI: 1.09 National TTI Rank: 28 Compared to 2007: -3.0%
Peak Travel Hour2
2008 Worst: Friday, 5-6 PM (TTI = 1.27) 2007 Worst: Friday, 5-6 PM (TTI = 1.35)
Population Rank: #58 (845,494)
New Haven Metropolitan Area
National Congestion Rank: #45 (2007 Rank: #44)
#45
Worst Bottlenecks
Overall Congestion
Travel Time Index1 by Month
LegendGreen = Roads Analyzed
Red = Bottlenecks

THE LEADING PROVIDER OF TRAFFIC INFORMATION A-46
National Traffic Scorecard 2008 Annual Report
Notes: 1 – Travel Time Index (TTI) is the ratio of actual to uncongested travel time. A ratio of 1.10 means 10% additional trip time due to congestion. 2 – Peak hours are Monday to Friday, 6 to 10 AM and 3 to 7 PM. 3 – Bottleneck “congestion” is defined as times when average hourly speed is half or less than the uncongested speed for that road segment. Additional information on the methodologies used in this report are available at http://scorecard.inrix.com.
Regional 2008 2007 Road/Direction Segment/Interchange County ST
Bottleneck Rank
Len
gth
(Mi)
Hou
rs o
f Con
gest
ion3
Avg
Spe
ed w
hen
Con
gest
ed3 (m
ph)
National
1 878 583 I 65 SB COURT AVE Clark IN 0.18 18 3.12 940 1201 I 64 WB STORY AVE/EXIT 7 Jefferson KY 0.25 14 4.13 1228 1033 I 65 SB MARKET ST/EXIT 0 Clark IN 0.20 16 3.54 1596 1244 I 65 SB JOHN F KENNEDY MEMORIAL BRG Clark IN 0.13 13 4.25 1698 1216 I 65 SB US 31/HWY 62 Clark IN 0.80 11 5.26 1834 864 I 64 WB I 71/EXIT 6 Jefferson KY 0.51 10 5.67 2736 2807 I 64 WB US 42/US 60/MELLWOOD AVE/EXIT 7 Jefferson KY 1.22 6 10.08 3271 4187 I 64 EB US 42/US 60/MELLWOOD AVE/EXIT 7 Jefferson KY 0.19 5 11.89 3514 4661 Gene Snyder Fwy/I 265 NB I 71/HWY 841/EXIT 35 Jefferson KY 0.90 4 14.8
10 3785 4675 I 65 SB BROOK ST/EXIT 136 Jefferson KY 0.45 4 13.3
1.00
1.05
1.10
J F M A M J J A S O N DCBSA: Louisville-Jefferson County KY-IN
Congestion Compared to 2007: -38.8% Worst Metro Area (L.A.): 4%
Travel Time Index(TTI)1
TTI: 1.03 National TTI Rank: 62 Compared to 2007: -2.0%
Peak Travel Hour2
2008 Worst: Thursday, 5-6 PM (TTI = 1.09) 2007 Worst: Thursday, 5-6 PM (TTI = 1.11)
Population Rank: #42 (1,233,735)
Louisville Metropolitan Area
National Congestion Rank: #46 (2007 Rank: #43)
#46
Worst Bottlenecks
Overall Congestion
Travel Time Index1 by Month
LegendGreen = Roads Analyzed
Red = Bottlenecks
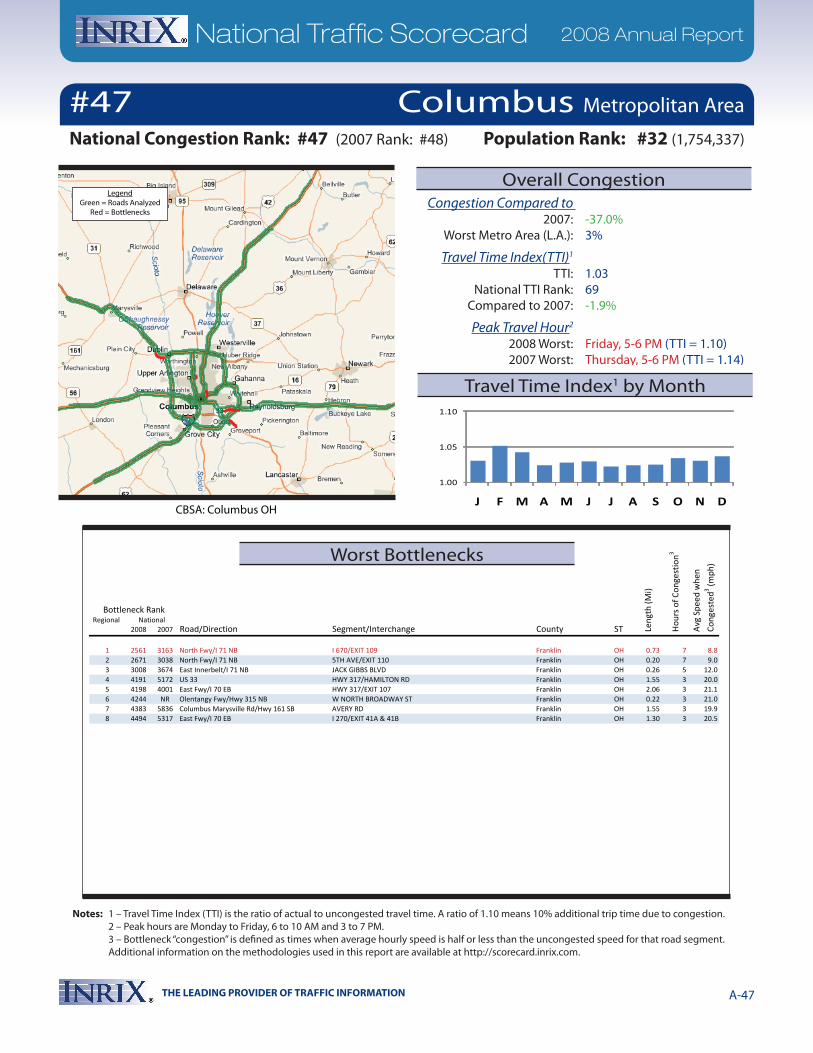
THE LEADING PROVIDER OF TRAFFIC INFORMATION A-47
National Traffic Scorecard 2008 Annual Report
Notes: 1 – Travel Time Index (TTI) is the ratio of actual to uncongested travel time. A ratio of 1.10 means 10% additional trip time due to congestion. 2 – Peak hours are Monday to Friday, 6 to 10 AM and 3 to 7 PM. 3 – Bottleneck “congestion” is defined as times when average hourly speed is half or less than the uncongested speed for that road segment. Additional information on the methodologies used in this report are available at http://scorecard.inrix.com.
Regional 2008 2007 Road/Direction Segment/Interchange County ST
Bottleneck Rank
Len
gth
(Mi)
Hou
rs o
f Con
gest
ion3
Avg
Spe
ed w
hen
Con
gest
ed3 (m
ph)
National
1 2561 3163 North Fwy/I 71 NB I 670/EXIT 109 Franklin OH 0.73 7 8.82 2671 3038 North Fwy/I 71 NB 5TH AVE/EXIT 110 Franklin OH 0.20 7 9.03 3008 3674 East Innerbelt/I 71 NB JACK GIBBS BLVD Franklin OH 0.26 5 12.04 4191 5172 US 33 HWY 317/HAMILTON RD Franklin OH 1.55 3 20.05 4198 4001 East Fwy/I 70 EB HWY 317/EXIT 107 Franklin OH 2.06 3 21.16 4244 NR Olentangy Fwy/Hwy 315 NB W NORTH BROADWAY ST Franklin OH 0.22 3 21.07 4383 5836 Columbus Marysville Rd/Hwy 161 SB AVERY RD Franklin OH 1.55 3 19.98 4494 5317 East Fwy/I 70 EB I 270/EXIT 41A & 41B Franklin OH 1.30 3 20.5
1.00
1.05
1.10
J F M A M J J A S O N DCBSA: Columbus OH
Congestion Compared to 2007: -37.0% Worst Metro Area (L.A.): 3%
Travel Time Index(TTI)1
TTI: 1.03 National TTI Rank: 69 Compared to 2007: -1.9%
Peak Travel Hour2
2008 Worst: Friday, 5-6 PM (TTI = 1.10) 2007 Worst: Thursday, 5-6 PM (TTI = 1.14)
Population Rank: #32 (1,754,337)
Columbus Metropolitan Area
National Congestion Rank: #47 (2007 Rank: #48)
#47
Worst Bottlenecks
Overall Congestion
Travel Time Index1 by Month
LegendGreen = Roads Analyzed
Red = Bottlenecks
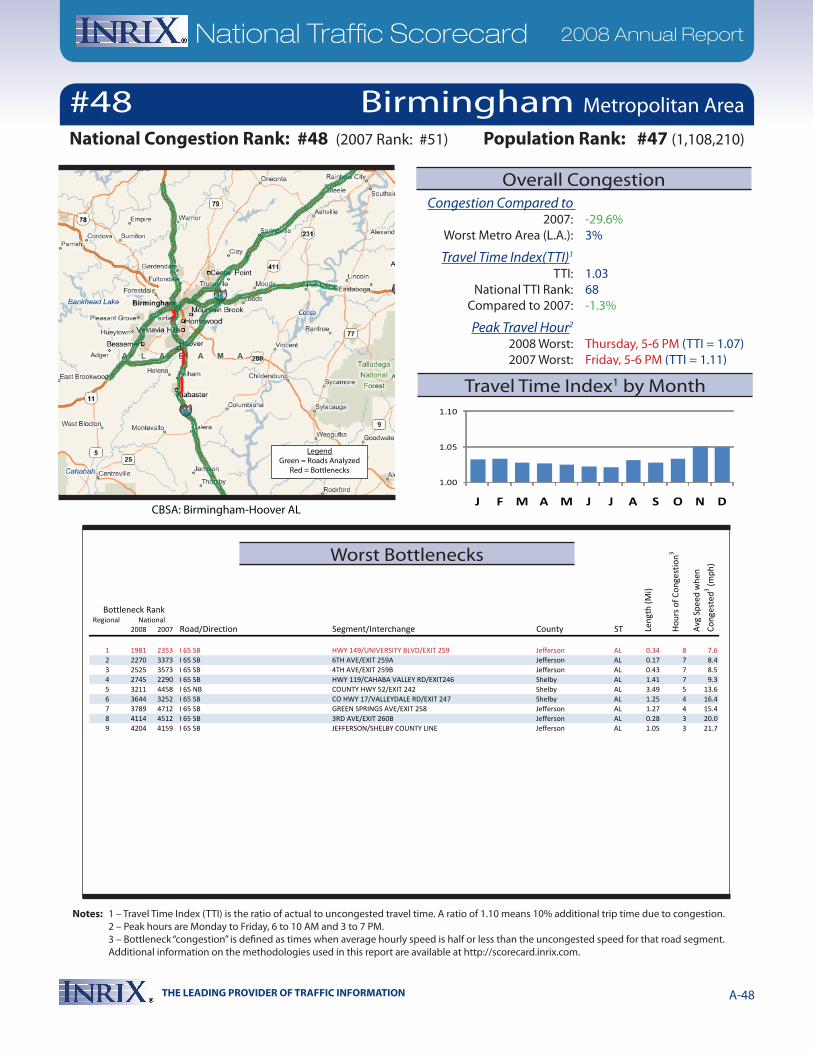
THE LEADING PROVIDER OF TRAFFIC INFORMATION A-48
National Traffic Scorecard 2008 Annual Report
Notes: 1 – Travel Time Index (TTI) is the ratio of actual to uncongested travel time. A ratio of 1.10 means 10% additional trip time due to congestion. 2 – Peak hours are Monday to Friday, 6 to 10 AM and 3 to 7 PM. 3 – Bottleneck “congestion” is defined as times when average hourly speed is half or less than the uncongested speed for that road segment. Additional information on the methodologies used in this report are available at http://scorecard.inrix.com.
Regional 2008 2007 Road/Direction Segment/Interchange County ST
Bottleneck Rank
Len
gth
(Mi)
Hou
rs o
f Con
gest
ion3
Avg
Spe
ed w
hen
Con
gest
ed3 (m
ph)
National
1 1981 2353 I 65 SB HWY 149/UNIVERSITY BLVD/EXIT 259 Jefferson AL 0.34 8 7.62 2270 3373 I 65 SB 6TH AVE/EXIT 259A Jefferson AL 0.17 7 8.43 2525 3573 I 65 SB 4TH AVE/EXIT 259B Jefferson AL 0.43 7 8.54 2745 2290 I 65 SB HWY 119/CAHABA VALLEY RD/EXIT246 Shelby AL 1.41 7 9.35 3211 4458 I 65 NB COUNTY HWY 52/EXIT 242 Shelby AL 3.49 5 13.66 3644 3252 I 65 SB CO HWY 17/VALLEYDALE RD/EXIT 247 Shelby AL 1.25 4 16.47 3789 4712 I 65 SB GREEN SPRINGS AVE/EXIT 258 Jefferson AL 1.27 4 15.48 4114 4512 I 65 SB 3RD AVE/EXIT 260B Jefferson AL 0.28 3 20.09 4204 4159 I 65 SB JEFFERSON/SHELBY COUNTY LINE Jefferson AL 1.05 3 21.7
1.00
1.05
1.10
J F M A M J J A S O N DCBSA: Birmingham-Hoover AL
Congestion Compared to 2007: -29.6% Worst Metro Area (L.A.): 3%
Travel Time Index(TTI)1
TTI: 1.03 National TTI Rank: 68 Compared to 2007: -1.3%
Peak Travel Hour2
2008 Worst: Thursday, 5-6 PM (TTI = 1.07) 2007 Worst: Friday, 5-6 PM (TTI = 1.11)
Population Rank: #47 (1,108,210)
Birmingham Metropolitan Area
National Congestion Rank: #48 (2007 Rank: #51)
#48
Worst Bottlenecks
Overall Congestion
Travel Time Index1 by Month
LegendGreen = Roads Analyzed
Red = Bottlenecks
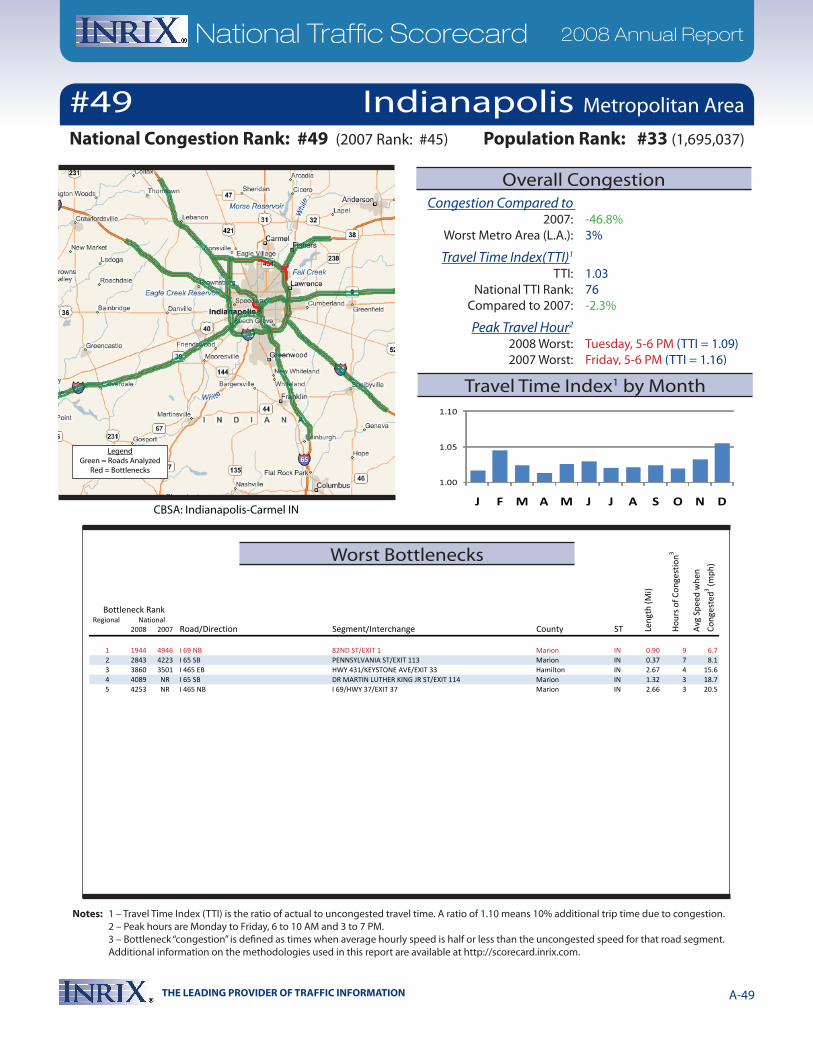
THE LEADING PROVIDER OF TRAFFIC INFORMATION A-49
National Traffic Scorecard 2008 Annual Report
Notes: 1 – Travel Time Index (TTI) is the ratio of actual to uncongested travel time. A ratio of 1.10 means 10% additional trip time due to congestion. 2 – Peak hours are Monday to Friday, 6 to 10 AM and 3 to 7 PM. 3 – Bottleneck “congestion” is defined as times when average hourly speed is half or less than the uncongested speed for that road segment. Additional information on the methodologies used in this report are available at http://scorecard.inrix.com.
Regional 2008 2007 Road/Direction Segment/Interchange County ST
Bottleneck Rank
Len
gth
(Mi)
Hou
rs o
f Con
gest
ion3
Avg
Spe
ed w
hen
Con
gest
ed3 (m
ph)
National
1 1944 4946 I 69 NB 82ND ST/EXIT 1 Marion IN 0.90 9 6.72 2843 4223 I 65 SB PENNSYLVANIA ST/EXIT 113 Marion IN 0.37 7 8.13 3860 3501 I 465 EB HWY 431/KEYSTONE AVE/EXIT 33 Hamilton IN 2.67 4 15.64 4089 NR I 65 SB DR MARTIN LUTHER KING JR ST/EXIT 114 Marion IN 1.32 3 18.75 4253 NR I 465 NB I 69/HWY 37/EXIT 37 Marion IN 2.66 3 20.5
1.00
1.05
1.10
J F M A M J J A S O N D
Indianapolis Metropolitan Area#49National Congestion Rank: #49 (2007 Rank: #45) Population Rank: #33 (1,695,037)
Congestion Compared to 2007: -46.8% Worst Metro Area (L.A.): 3%
Travel Time Index(TTI)1
TTI: 1.03 National TTI Rank: 76 Compared to 2007: -2.3%
Peak Travel Hour2
2008 Worst: Tuesday, 5-6 PM (TTI = 1.09) 2007 Worst: Friday, 5-6 PM (TTI = 1.16)
CBSA: Indianapolis-Carmel IN
Worst Bottlenecks
Overall Congestion
Travel Time Index1 by Month
LegendGreen = Roads Analyzed
Red = Bottlenecks
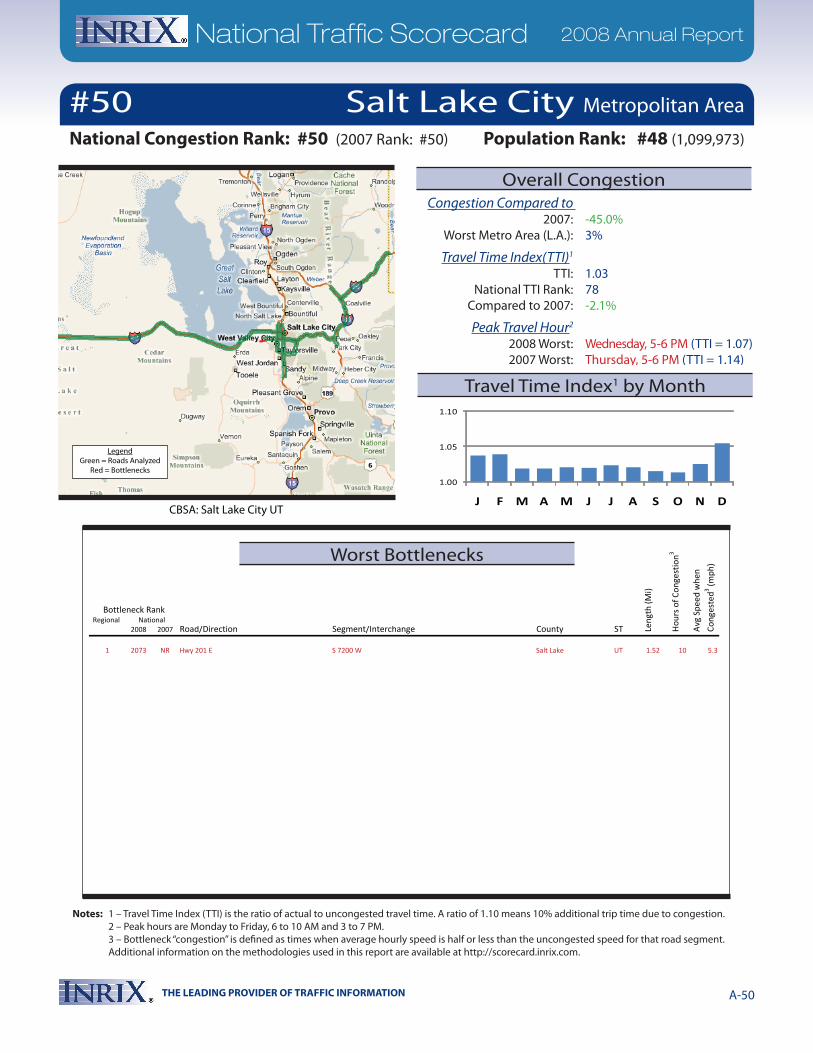
THE LEADING PROVIDER OF TRAFFIC INFORMATION A-50
National Traffic Scorecard 2008 Annual Report
Notes: 1 – Travel Time Index (TTI) is the ratio of actual to uncongested travel time. A ratio of 1.10 means 10% additional trip time due to congestion. 2 – Peak hours are Monday to Friday, 6 to 10 AM and 3 to 7 PM. 3 – Bottleneck “congestion” is defined as times when average hourly speed is half or less than the uncongested speed for that road segment. Additional information on the methodologies used in this report are available at http://scorecard.inrix.com.
Regional 2008 2007 Road/Direction Segment/Interchange County ST
Bottleneck Rank
Len
gth
(Mi)
Hou
rs o
f Con
gest
ion3
Avg
Spe
ed w
hen
Con
gest
ed3 (m
ph)
National
1 2073 NR Hwy 201 E S 7200 W Salt Lake UT 1.52 10 5.3
1.00
1.05
1.10
J F M A M J J A S O N D
#50 Salt Lake City Metropolitan Area
National Congestion Rank: #50 (2007 Rank: #50) Population Rank: #48 (1,099,973)
Congestion Compared to 2007: -45.0% Worst Metro Area (L.A.): 3%
Travel Time Index(TTI)1
TTI: 1.03 National TTI Rank: 78 Compared to 2007: -2.1%
Peak Travel Hour2
2008 Worst: Wednesday, 5-6 PM (TTI = 1.07) 2007 Worst: Thursday, 5-6 PM (TTI = 1.14)
CBSA: Salt Lake City UT
Worst Bottlenecks
Overall Congestion
Travel Time Index1 by Month
LegendGreen = Roads Analyzed
Red = Bottlenecks

THE LEADING PROVIDER OF TRAFFIC INFORMATION A-51
National Traffic Scorecard 2008 Annual Report
Notes: 1 – Travel Time Index (TTI) is the ratio of actual to uncongested travel time. A ratio of 1.10 means 10% additional trip time due to congestion. 2 – Peak hours are Monday to Friday, 6 to 10 AM and 3 to 7 PM. 3 – Bottleneck “congestion” is defined as times when average hourly speed is half or less than the uncongested speed for that road segment. Additional information on the methodologies used in this report are available at http://scorecard.inrix.com.
Regional 2008 2007 Road/Direction Segment/Interchange County ST
Bottleneck Rank
Len
gth
(Mi)
Hou
rs o
f Con
gest
ion3
Avg
Spe
ed w
hen
Con
gest
ed3 (m
ph)
National
1 2184 3009 I 40 WB I 440/US 1/US 64/EXIT 293 Wake NC 1.06 8 8.42 2557 3495 I 40 WB US 1/US 64/EXIT 293 Wake NC 2.61 8 8.33 2639 4045 I 40 EB HARRISON AVE/EXIT 287 Wake NC 2.26 7 9.54 2674 4082 I 40 EB RALEIGH CHAPEL HILL EXPY/EXIT 289 Wake NC 2.16 7 9.65 3163 4078 I 40 EB AVIATION PKWY/EXIT 285 Wake NC 1.23 5 13.46 3221 4855 I 440 WB WADE AVE/EXIT 4 Wake NC 0.91 5 12.17 3462 4912 I 440 WB LAKE BOONE TRL/EXIT 5 Wake NC 1.86 5 12.68 3554 5516 I 40 EB HWY 54/EXIT 290 Wake NC 1.29 5 13.39 3587 5209 I 540 NB US 70/EXIT 4 Wake NC 1.44 4 16.5
10 3656 3731 I 40 WB CARY TOWNE BLVD/FARM GATE RD/EXIT 291 Wake NC 1.01 5 13.3
1.00
1.05
1.10
J F M A M J J A S O N DCBSA: Raleigh-Cary NC
Congestion Compared to 2007: -26.1% Worst Metro Area (L.A.): 3%
Travel Time Index(TTI)1
TTI: 1.05 National TTI Rank: 48 Compared to 2007: -1.6%
Peak Travel Hour2
2008 Worst: Thursday, 5-6 PM (TTI = 1.12) 2007 Worst: Friday, 5-6 PM (TTI = 1.13)
Population Rank: #49 (1,047,629)
Raleigh Metropolitan Area
National Congestion Rank: #51 (2007 Rank: #60)
#51
Worst Bottlenecks
Overall Congestion
Travel Time Index1 by Month
LegendGreen = Roads Analyzed
Red = Bottlenecks
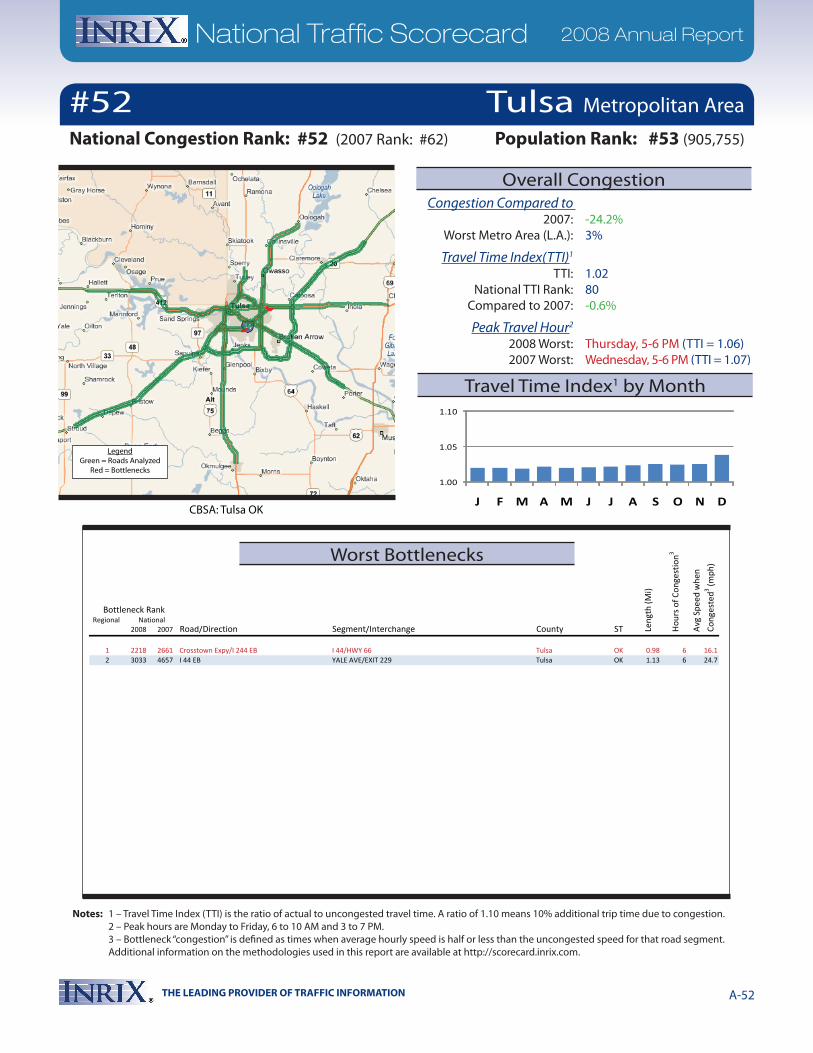
THE LEADING PROVIDER OF TRAFFIC INFORMATION A-52
National Traffic Scorecard 2008 Annual Report
Notes: 1 – Travel Time Index (TTI) is the ratio of actual to uncongested travel time. A ratio of 1.10 means 10% additional trip time due to congestion. 2 – Peak hours are Monday to Friday, 6 to 10 AM and 3 to 7 PM. 3 – Bottleneck “congestion” is defined as times when average hourly speed is half or less than the uncongested speed for that road segment. Additional information on the methodologies used in this report are available at http://scorecard.inrix.com.
Regional 2008 2007 Road/Direction Segment/Interchange County ST
Bottleneck Rank
Len
gth
(Mi)
Hou
rs o
f Con
gest
ion3
Avg
Spe
ed w
hen
Con
gest
ed3 (m
ph)
National
1 2218 2661 Crosstown Expy/I 244 EB I 44/HWY 66 Tulsa OK 0.98 6 16.12 3033 4657 I 44 EB YALE AVE/EXIT 229 Tulsa OK 1.13 6 24.7
1.00
1.05
1.10
J F M A M J J A S O N DCBSA: Tulsa OK
Congestion Compared to 2007: -24.2% Worst Metro Area (L.A.): 3%
Travel Time Index(TTI)1
TTI: 1.02 National TTI Rank: 80 Compared to 2007: -0.6%
Peak Travel Hour2
2008 Worst: Thursday, 5-6 PM (TTI = 1.06) 2007 Worst: Wednesday, 5-6 PM (TTI = 1.07)
Population Rank: #53 (905,755)
Tulsa Metropolitan Area
National Congestion Rank: #52 (2007 Rank: #62)
#52
Worst Bottlenecks
Overall Congestion
Travel Time Index1 by Month
LegendGreen = Roads Analyzed
Red = Bottlenecks

THE LEADING PROVIDER OF TRAFFIC INFORMATION A-53
National Traffic Scorecard 2008 Annual Report
Notes: 1 – Travel Time Index (TTI) is the ratio of actual to uncongested travel time. A ratio of 1.10 means 10% additional trip time due to congestion. 2 – Peak hours are Monday to Friday, 6 to 10 AM and 3 to 7 PM. 3 – Bottleneck “congestion” is defined as times when average hourly speed is half or less than the uncongested speed for that road segment. Additional information on the methodologies used in this report are available at http://scorecard.inrix.com.
Regional 2008 2007 Road/Direction Segment/Interchange County ST
Bottleneck Rank
Len
gth
(Mi)
Hou
rs o
f Con
gest
ion3
Avg
Spe
ed w
hen
Con
gest
ed3 (m
ph)
National
1 1615 1658 US 22 WB HWY 987/AIRPORT RD Lehigh PA 0.76 11 21.12 1626 1369 US 22 WB HWY 378 Lehigh PA 0.60 11 21.5
1.00
1.05
1.10
J F M A M J J A S O N DCBSA: Allentown-Bethlehem-Easton PA-NJ
Congestion Compared to 2007: -48.3% Worst Metro Area (L.A.): 3%
Travel Time Index(TTI)1
TTI: 1.03 National TTI Rank: 58 Compared to 2007: -3.0%
Peak Travel Hour2
2008 Worst: Friday, 5-6 PM (TTI = 1.07) 2007 Worst: Friday, 4-5 PM (TTI = 1.13)
Population Rank: #62 (803,844)
Allentown Metropolitan Area
National Congestion Rank: #53 (2007 Rank: #49)
#53
Worst Bottlenecks
Overall Congestion
Travel Time Index1 by Month
LegendGreen = Roads Analyzed
Red = Bottlenecks

THE LEADING PROVIDER OF TRAFFIC INFORMATION A-54
National Traffic Scorecard 2008 Annual Report
Notes: 1 – Travel Time Index (TTI) is the ratio of actual to uncongested travel time. A ratio of 1.10 means 10% additional trip time due to congestion. 2 – Peak hours are Monday to Friday, 6 to 10 AM and 3 to 7 PM. 3 – Bottleneck “congestion” is defined as times when average hourly speed is half or less than the uncongested speed for that road segment. Additional information on the methodologies used in this report are available at http://scorecard.inrix.com.
Regional 2008 2007 Road/Direction Segment/Interchange County ST
Bottleneck Rank
Len
gth
(Mi)
Hou
rs o
f Con
gest
ion3
Avg
Spe
ed w
hen
Con
gest
ed3 (m
ph)
National
1 1893 2295 I 240 EB POPLAR AVE Shelby TN 1.60 10 6.22 2155 2636 I 240 EB NONCONNAH PKWY/EXIT 16 Shelby TN 1.04 7 9.13 2627 2971 I 40 WB SYCAMORE VIEW RD/EXIT 12 Shelby TN 1.59 7 8.84 3170 4222 I 240 WB WALNUT GROVE RD Shelby TN 1.99 6 10.25 3729 2975 I 40 EB US 64/US 70/US 79/HWY 1/EXIT 12 Shelby TN 1.13 4 15.0
1.00
1.05
1.10
J F M A M J J A S O N DCBSA: Memphis TN-MS-AR
Congestion Compared to 2007: -40.1% Worst Metro Area (L.A.): 3%
Travel Time Index(TTI)1
TTI: 1.03 National TTI Rank: 56 Compared to 2007: -2.2%
Peak Travel Hour2
2008 Worst: Friday, 5-6 PM (TTI = 1.07) 2007 Worst: Wednesday, 5-6 PM (TTI = 1.13)
Population Rank: #41 (1,280,533)
Memphis Metropolitan Area
National Congestion Rank: #54 (2007 Rank: #54)
#54
Worst Bottlenecks
Overall Congestion
Travel Time Index1 by Month
LegendGreen = Roads Analyzed
Red = Bottlenecks
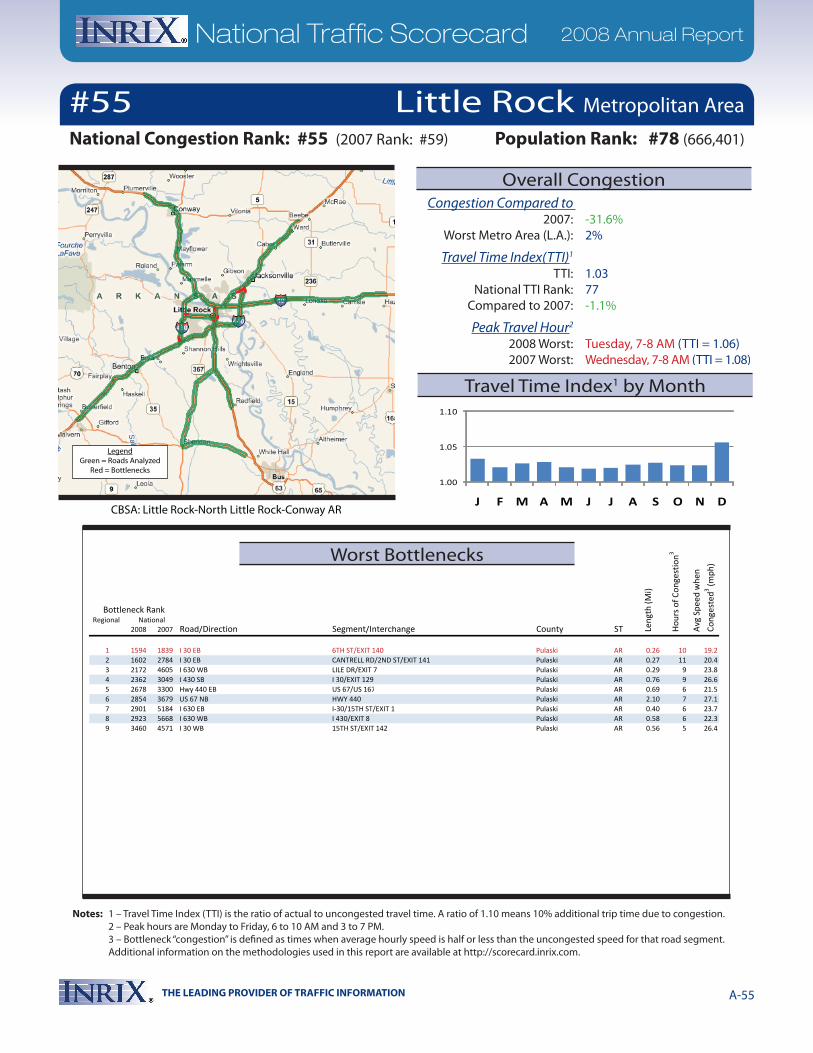
THE LEADING PROVIDER OF TRAFFIC INFORMATION A-55
National Traffic Scorecard 2008 Annual Report
Notes: 1 – Travel Time Index (TTI) is the ratio of actual to uncongested travel time. A ratio of 1.10 means 10% additional trip time due to congestion. 2 – Peak hours are Monday to Friday, 6 to 10 AM and 3 to 7 PM. 3 – Bottleneck “congestion” is defined as times when average hourly speed is half or less than the uncongested speed for that road segment. Additional information on the methodologies used in this report are available at http://scorecard.inrix.com.
Regional 2008 2007 Road/Direction Segment/Interchange County ST
Bottleneck Rank
Len
gth
(Mi)
Hou
rs o
f Con
gest
ion3
Avg
Spe
ed w
hen
Con
gest
ed3 (m
ph)
National
1 1594 1839 I 30 EB 6TH ST/EXIT 140 Pulaski AR 0.26 10 19.22 1602 2784 I 30 EB CANTRELL RD/2ND ST/EXIT 141 Pulaski AR 0.27 11 20.43 2172 4605 I 630 WB LILE DR/EXIT 7 Pulaski AR 0.29 9 23.84 2362 3049 I 430 SB I 30/EXIT 129 Pulaski AR 0.76 9 26.65 2678 3300 Hwy 440 EB US 67/US 167 Pulaski AR 0.69 6 21.56 2854 3679 US 67 NB HWY 440 Pulaski AR 2.10 7 27.17 2901 5184 I 630 EB I-30/15TH ST/EXIT 1 Pulaski AR 0.40 6 23.78 2923 5668 I 630 WB I 430/EXIT 8 Pulaski AR 0.58 6 22.39 3460 4571 I 30 WB 15TH ST/EXIT 142 Pulaski AR 0.56 5 26.4
1.00
1.05
1.10
J F M A M J J A S O N D
#55National Congestion Rank: #55 (2007 Rank: #59)
CBSA: Little Rock-North Little Rock-Conway AR
Congestion Compared to 2007: -31.6% Worst Metro Area (L.A.): 2%
Travel Time Index(TTI)1
TTI: 1.03 National TTI Rank: 77 Compared to 2007: -1.1%
Peak Travel Hour2
2008 Worst: Tuesday, 7-8 AM (TTI = 1.06) 2007 Worst: Wednesday, 7-8 AM (TTI = 1.08)
Population Rank: #78 (666,401)
Little Rock Metropolitan Area
Worst Bottlenecks
Overall Congestion
Travel Time Index1 by Month
LegendGreen = Roads Analyzed
Red = Bottlenecks
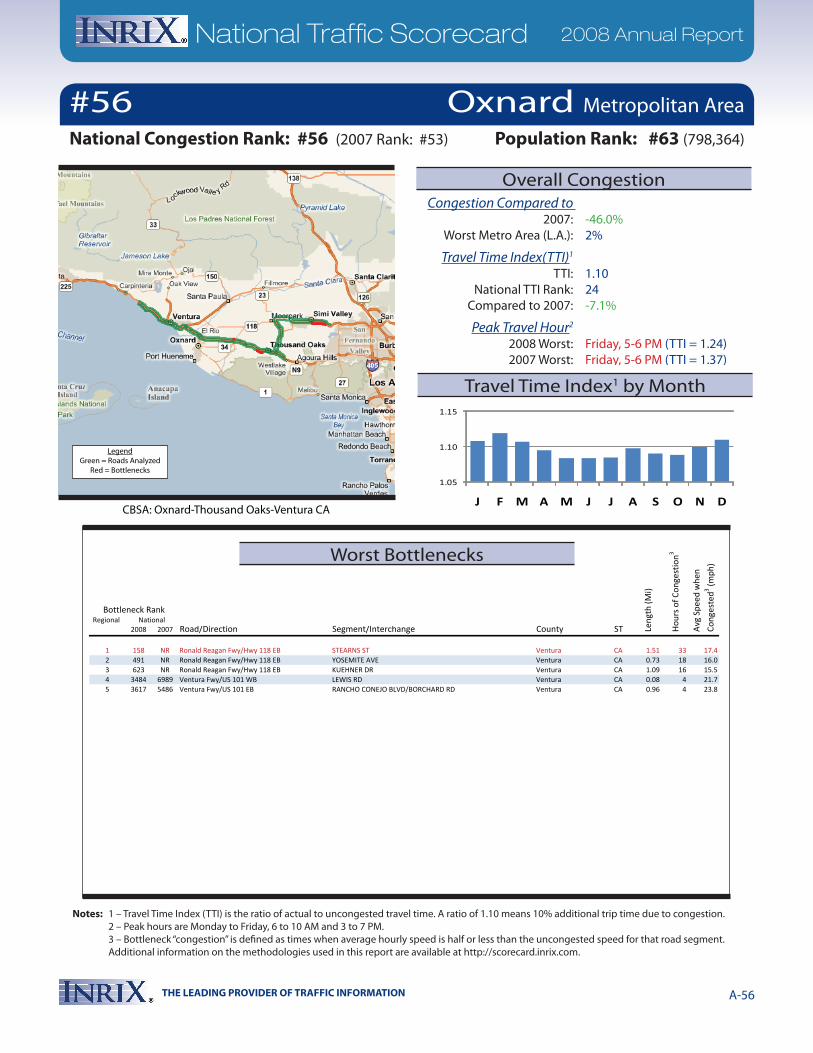
THE LEADING PROVIDER OF TRAFFIC INFORMATION A-56
National Traffic Scorecard 2008 Annual Report
Notes: 1 – Travel Time Index (TTI) is the ratio of actual to uncongested travel time. A ratio of 1.10 means 10% additional trip time due to congestion. 2 – Peak hours are Monday to Friday, 6 to 10 AM and 3 to 7 PM. 3 – Bottleneck “congestion” is defined as times when average hourly speed is half or less than the uncongested speed for that road segment. Additional information on the methodologies used in this report are available at http://scorecard.inrix.com.
Regional 2008 2007 Road/Direction Segment/Interchange County ST
Bottleneck Rank
Len
gth
(Mi)
Hou
rs o
f Con
gest
ion3
Avg
Spe
ed w
hen
Con
gest
ed3 (m
ph)
National
1 158 NR Ronald Reagan Fwy/Hwy 118 EB STEARNS ST Ventura CA 1.51 33 17.42 491 NR Ronald Reagan Fwy/Hwy 118 EB YOSEMITE AVE Ventura CA 0.73 18 16.03 623 NR Ronald Reagan Fwy/Hwy 118 EB KUEHNER DR Ventura CA 1.09 16 15.54 3484 6989 Ventura Fwy/US 101 WB LEWIS RD Ventura CA 0.08 4 21.75 3617 5486 Ventura Fwy/US 101 EB RANCHO CONEJO BLVD/BORCHARD RD Ventura CA 0.96 4 23.8
1.05
1.10
1.15
J F M A M J J A S O N D
#56National Congestion Rank: #56 (2007 Rank: #53)
CBSA: Oxnard-Thousand Oaks-Ventura CA
Congestion Compared to 2007: -46.0% Worst Metro Area (L.A.): 2%
Travel Time Index(TTI)1
TTI: 1.10 National TTI Rank: 24 Compared to 2007: -7.1%
Peak Travel Hour2
2008 Worst: Friday, 5-6 PM (TTI = 1.24) 2007 Worst: Friday, 5-6 PM (TTI = 1.37)
Population Rank: #63 (798,364)
Oxnard Metropolitan Area
Worst Bottlenecks
Overall Congestion
Travel Time Index1 by Month
LegendGreen = Roads Analyzed
Red = Bottlenecks

THE LEADING PROVIDER OF TRAFFIC INFORMATION A-57
National Traffic Scorecard 2008 Annual Report
Notes: 1 – Travel Time Index (TTI) is the ratio of actual to uncongested travel time. A ratio of 1.10 means 10% additional trip time due to congestion. 2 – Peak hours are Monday to Friday, 6 to 10 AM and 3 to 7 PM. 3 – Bottleneck “congestion” is defined as times when average hourly speed is half or less than the uncongested speed for that road segment. Additional information on the methodologies used in this report are available at http://scorecard.inrix.com.
Regional 2008 2007 Road/Direction Segment/Interchange County ST
Bottleneck Rank
Len
gth
(Mi)
Hou
rs o
f Con
gest
ion3
Avg
Spe
ed w
hen
Con
gest
ed3 (m
ph)
National
1 1509 2238 I 83 NB 17TH ST/EXIT 44 Dauphin PA 0.15 12 20.22 1689 1928 I 83 NB 13TH ST/EXIT 44 Dauphin PA 0.42 10 19.53 2129 2611 I 83 NB 19TH ST/EXIT 44 Dauphin PA 0.31 10 24.94 2668 1991 I 83 SB 13TH ST/EXIT 44 Dauphin PA 0.29 8 27.35 2697 2076 I 83 NB CARLISLE RD/SIMPSON FERRY RD/EXIT 40 Cumberland PA 1.17 6 20.56 2905 2508 I 83 SB 2ND ST/EXIT 43 Dauphin PA 0.38 7 27.67 3189 2255 I 83 NB LOWTHER ST/EXIT 41 Cumberland PA 0.36 6 25.18 3437 4365 I 83 NB UNION DEPOSIT RD/EXIT 48 Dauphin PA 1.34 5 25.2
1.00
1.05
1.10
J F M A M J J A S O N DCBSA: Harrisburg-Carlisle PA
Congestion Compared to 2007: -37.2% Worst Metro Area (L.A.): 2%
Travel Time Index(TTI)1
TTI: 1.04 National TTI Rank: 53 Compared to 2007: -1.8%
Peak Travel Hour2
2008 Worst: Friday, 5-6 PM (TTI = 1.12) 2007 Worst: Friday, 4-5 PM (TTI = 1.13)
Population Rank: #94 (528,892
Harrisburg Metropolitan Area
National Congestion Rank: #57 (2007 Rank: #58)
#57
Worst Bottlenecks
Overall Congestion
Travel Time Index1 by Month
LegendGreen = Roads Analyzed
Red = Bottlenecks
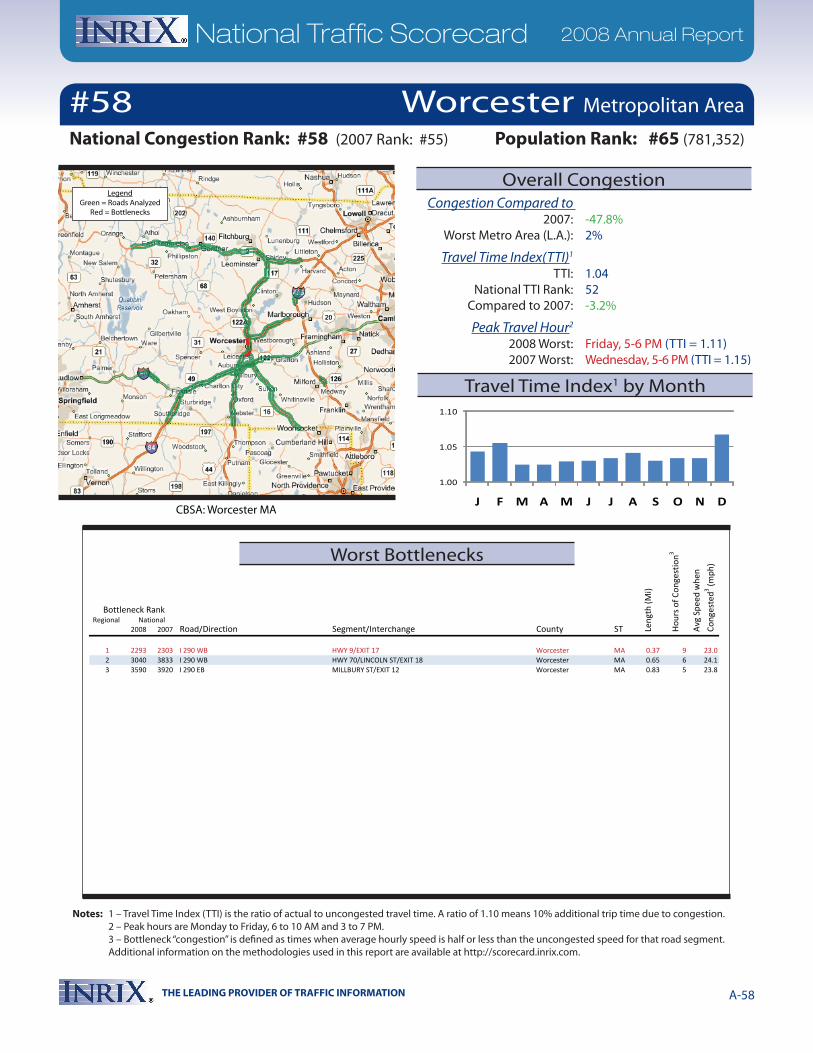
THE LEADING PROVIDER OF TRAFFIC INFORMATION A-58
National Traffic Scorecard 2008 Annual Report
Notes: 1 – Travel Time Index (TTI) is the ratio of actual to uncongested travel time. A ratio of 1.10 means 10% additional trip time due to congestion. 2 – Peak hours are Monday to Friday, 6 to 10 AM and 3 to 7 PM. 3 – Bottleneck “congestion” is defined as times when average hourly speed is half or less than the uncongested speed for that road segment. Additional information on the methodologies used in this report are available at http://scorecard.inrix.com.
Regional 2008 2007 Road/Direction Segment/Interchange County ST
Bottleneck Rank
Len
gth
(Mi)
Hou
rs o
f Con
gest
ion3
Avg
Spe
ed w
hen
Con
gest
ed3 (m
ph)
National
1 2293 2303 I 290 WB HWY 9/EXIT 17 Worcester MA 0.37 9 23.02 3040 3833 I 290 WB HWY 70/LINCOLN ST/EXIT 18 Worcester MA 0.65 6 24.13 3590 3920 I 290 EB MILLBURY ST/EXIT 12 Worcester MA 0.83 5 23.8
1.00
1.05
1.10
J F M A M J J A S O N D
#58National Congestion Rank: #58 (2007 Rank: #55)
CBSA: Worcester MA
Congestion Compared to 2007: -47.8% Worst Metro Area (L.A.): 2%
Travel Time Index(TTI)1
TTI: 1.04 National TTI Rank: 52 Compared to 2007: -3.2%
Peak Travel Hour2
2008 Worst: Friday, 5-6 PM (TTI = 1.11) 2007 Worst: Wednesday, 5-6 PM (TTI = 1.15)
Population Rank: #65 (781,352)
Worcester Metropolitan Area
Worst Bottlenecks
Overall Congestion
Travel Time Index1 by Month
LegendGreen = Roads Analyzed
Red = Bottlenecks
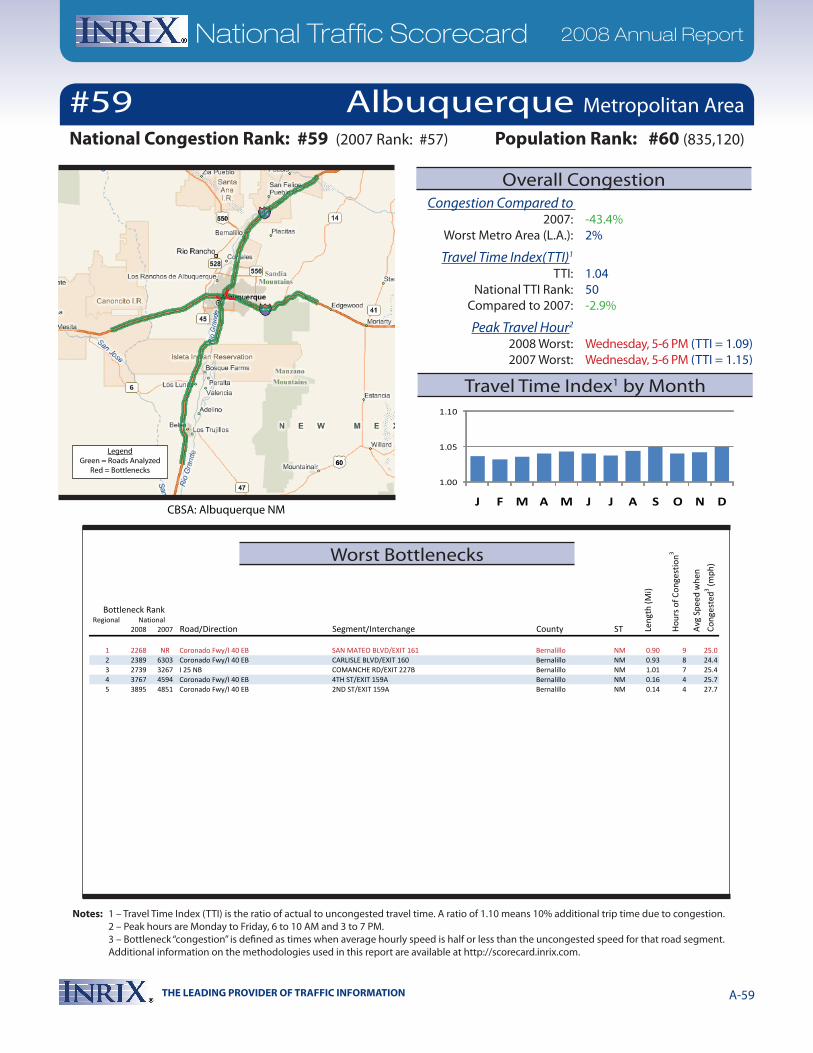
THE LEADING PROVIDER OF TRAFFIC INFORMATION A-59
National Traffic Scorecard 2008 Annual Report
Notes: 1 – Travel Time Index (TTI) is the ratio of actual to uncongested travel time. A ratio of 1.10 means 10% additional trip time due to congestion. 2 – Peak hours are Monday to Friday, 6 to 10 AM and 3 to 7 PM. 3 – Bottleneck “congestion” is defined as times when average hourly speed is half or less than the uncongested speed for that road segment. Additional information on the methodologies used in this report are available at http://scorecard.inrix.com.
Regional 2008 2007 Road/Direction Segment/Interchange County ST
Bottleneck Rank
Len
gth
(Mi)
Hou
rs o
f Con
gest
ion3
Avg
Spe
ed w
hen
Con
gest
ed3 (m
ph)
National
1 2268 NR Coronado Fwy/I 40 EB SAN MATEO BLVD/EXIT 161 Bernalillo NM 0.90 9 25.02 2389 6303 Coronado Fwy/I 40 EB CARLISLE BLVD/EXIT 160 Bernalillo NM 0.93 8 24.43 2739 3267 I 25 NB COMANCHE RD/EXIT 227B Bernalillo NM 1.01 7 25.44 3767 4594 Coronado Fwy/I 40 EB 4TH ST/EXIT 159A Bernalillo NM 0.16 4 25.75 3895 4851 Coronado Fwy/I 40 EB 2ND ST/EXIT 159A Bernalillo NM 0.14 4 27.7
1.00
1.05
1.10
J F M A M J J A S O N D
Albuquerque Metropolitan Area
Population Rank: #60 (835,120)
Congestion Compared to 2007: -43.4% Worst Metro Area (L.A.): 2%
Travel Time Index(TTI)1
TTI: 1.04 National TTI Rank: 50 Compared to 2007: -2.9%
Peak Travel Hour2
2008 Worst: Wednesday, 5-6 PM (TTI = 1.09) 2007 Worst: Wednesday, 5-6 PM (TTI = 1.15)
CBSA: Albuquerque NM
National Congestion Rank: #59 (2007 Rank: #57)
#59
Worst Bottlenecks
Overall Congestion
Travel Time Index1 by Month
LegendGreen = Roads Analyzed
Red = Bottlenecks
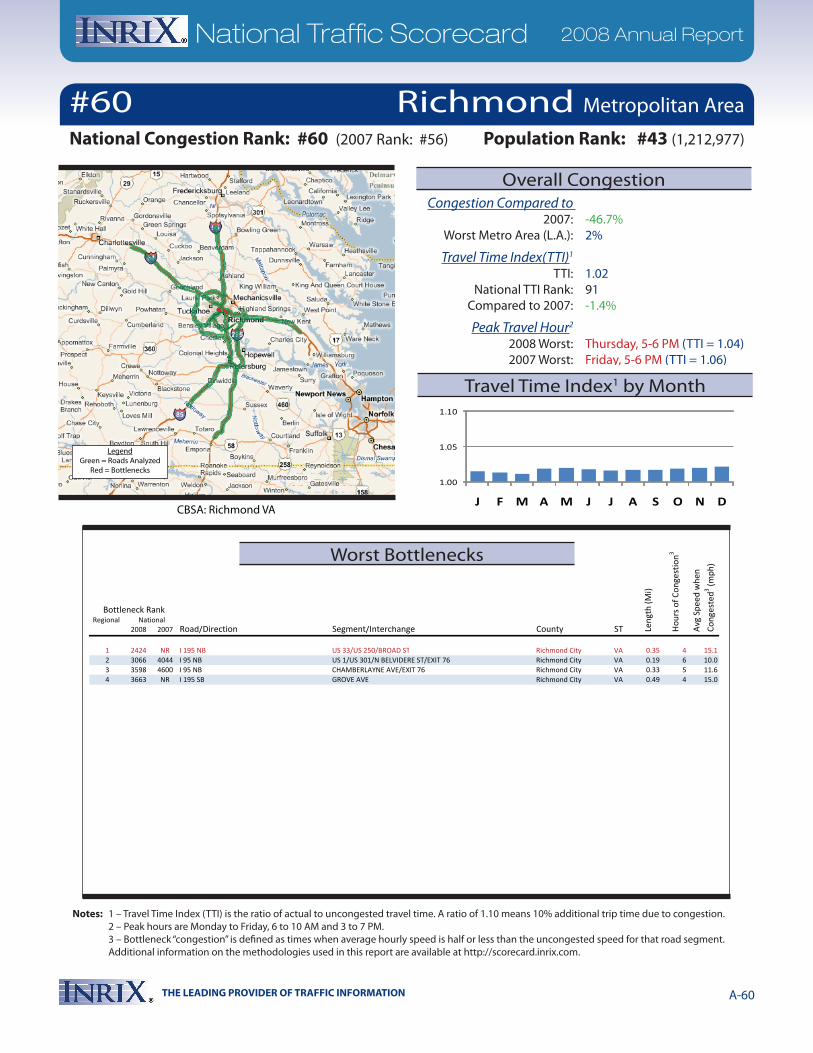
THE LEADING PROVIDER OF TRAFFIC INFORMATION A-60
National Traffic Scorecard 2008 Annual Report
Notes: 1 – Travel Time Index (TTI) is the ratio of actual to uncongested travel time. A ratio of 1.10 means 10% additional trip time due to congestion. 2 – Peak hours are Monday to Friday, 6 to 10 AM and 3 to 7 PM. 3 – Bottleneck “congestion” is defined as times when average hourly speed is half or less than the uncongested speed for that road segment. Additional information on the methodologies used in this report are available at http://scorecard.inrix.com.
Regional 2008 2007 Road/Direction Segment/Interchange County ST
Bottleneck Rank
Len
gth
(Mi)
Hou
rs o
f Con
gest
ion3
Avg
Spe
ed w
hen
Con
gest
ed3 (m
ph)
National
1 2424 NR I 195 NB US 33/US 250/BROAD ST Richmond City VA 0.35 4 15.12 3066 4044 I 95 NB US 1/US 301/N BELVIDERE ST/EXIT 76 Richmond City VA 0.19 6 10.03 3598 4600 I 95 NB CHAMBERLAYNE AVE/EXIT 76 Richmond City VA 0.33 5 11.64 3663 NR I 195 SB GROVE AVE Richmond City VA 0.49 4 15.0
1.00
1.05
1.10
J F M A M J J A S O N D
Richmond Metropolitan Area
Population Rank: #43 (1,212,977)
Congestion Compared to 2007: -46.7% Worst Metro Area (L.A.): 2%
Travel Time Index(TTI)1
TTI: 1.02 National TTI Rank: 91 Compared to 2007: -1.4%
Peak Travel Hour2
2008 Worst: Thursday, 5-6 PM (TTI = 1.04) 2007 Worst: Friday, 5-6 PM (TTI = 1.06)
CBSA: Richmond VA
National Congestion Rank: #60 (2007 Rank: #56)
#60
Worst Bottlenecks
Overall Congestion
Travel Time Index1 by Month
LegendGreen = Roads Analyzed
Red = Bottlenecks
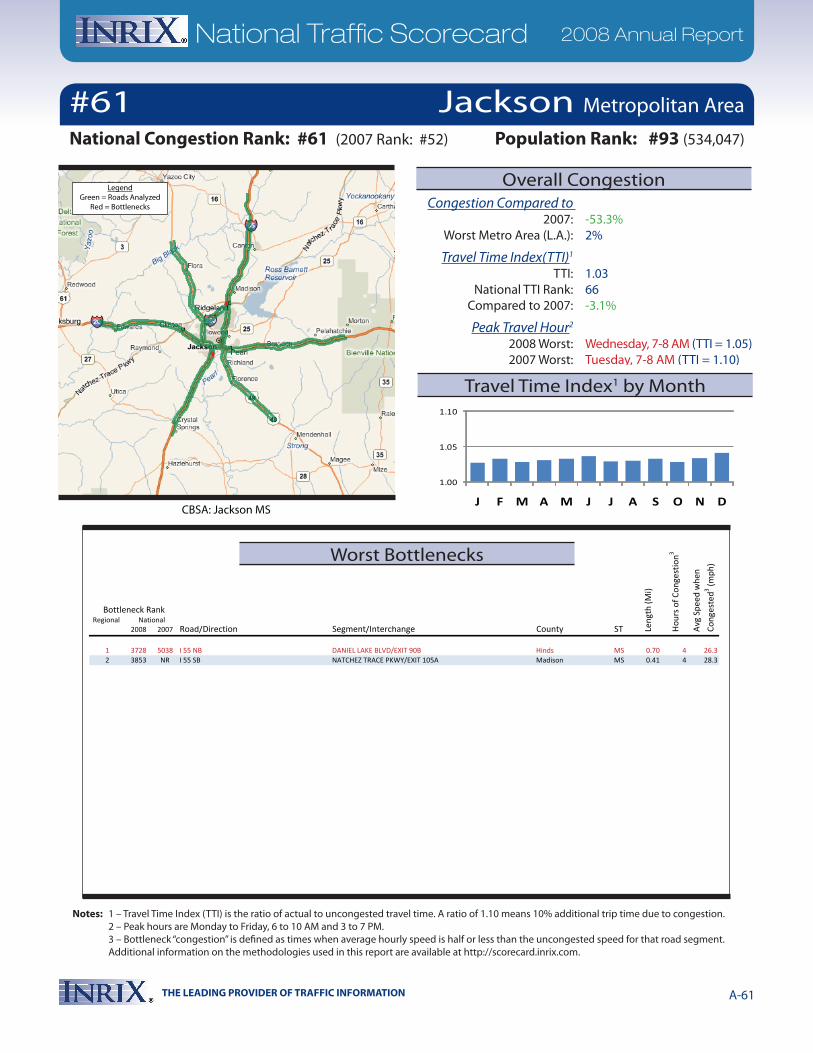
THE LEADING PROVIDER OF TRAFFIC INFORMATION A-61
National Traffic Scorecard 2008 Annual Report
Notes: 1 – Travel Time Index (TTI) is the ratio of actual to uncongested travel time. A ratio of 1.10 means 10% additional trip time due to congestion. 2 – Peak hours are Monday to Friday, 6 to 10 AM and 3 to 7 PM. 3 – Bottleneck “congestion” is defined as times when average hourly speed is half or less than the uncongested speed for that road segment. Additional information on the methodologies used in this report are available at http://scorecard.inrix.com.
Regional 2008 2007 Road/Direction Segment/Interchange County ST
Bottleneck Rank
Len
gth
(Mi)
Hou
rs o
f Con
gest
ion3
Avg
Spe
ed w
hen
Con
gest
ed3 (m
ph)
National
1 3728 5038 I 55 NB DANIEL LAKE BLVD/EXIT 90B Hinds MS 0.70 4 26.32 3853 NR I 55 SB NATCHEZ TRACE PKWY/EXIT 105A Madison MS 0.41 4 28.3
1.00
1.05
1.10
J F M A M J J A S O N D
#61National Congestion Rank: #61 (2007 Rank: #52)
CBSA: Jackson MS
Congestion Compared to 2007: -53.3% Worst Metro Area (L.A.): 2%
Travel Time Index(TTI)1
TTI: 1.03 National TTI Rank: 66 Compared to 2007: -3.1%
Peak Travel Hour2
2008 Worst: Wednesday, 7-8 AM (TTI = 1.05) 2007 Worst: Tuesday, 7-8 AM (TTI = 1.10)
Population Rank: #93 (534,047)
Jackson Metropolitan Area
Worst Bottlenecks
Overall Congestion
Travel Time Index1 by Month
LegendGreen = Roads Analyzed
Red = Bottlenecks

THE LEADING PROVIDER OF TRAFFIC INFORMATION A-62
National Traffic Scorecard 2008 Annual Report
Notes: 1 – Travel Time Index (TTI) is the ratio of actual to uncongested travel time. A ratio of 1.10 means 10% additional trip time due to congestion. 2 – Peak hours are Monday to Friday, 6 to 10 AM and 3 to 7 PM. 3 – Bottleneck “congestion” is defined as times when average hourly speed is half or less than the uncongested speed for that road segment. Additional information on the methodologies used in this report are available at http://scorecard.inrix.com.
This region has no areas with bottleneck congestion3 for four or more hours per week.
1.00
1.05
1.10
J F M A M J J A S O N DCBSA:Buffalo-Niagara Falls NY
Congestion Compared to 2007: -25.7% Worst Metro Area (L.A.): 2%
Travel Time Index(TTI)1
TTI: 1.03 National TTI Rank: 59 Compared to 2007: -0.9%
Peak Travel Hour2
2008 Worst: Friday, 5-6 PM (TTI = 1.07) 2007 Worst: Friday, 5-6 PM (TTI = 1.08)
National Congestion Rank: #62 (2007 Rank: #68)
#62 Buffalo Metropolitan Area
Population Rank: #46 (1,128,183)
Worst Bottlenecks
Overall Congestion
Travel Time Index1 by Month
LegendGreen = Roads Analyzed
Red = Bottlenecks
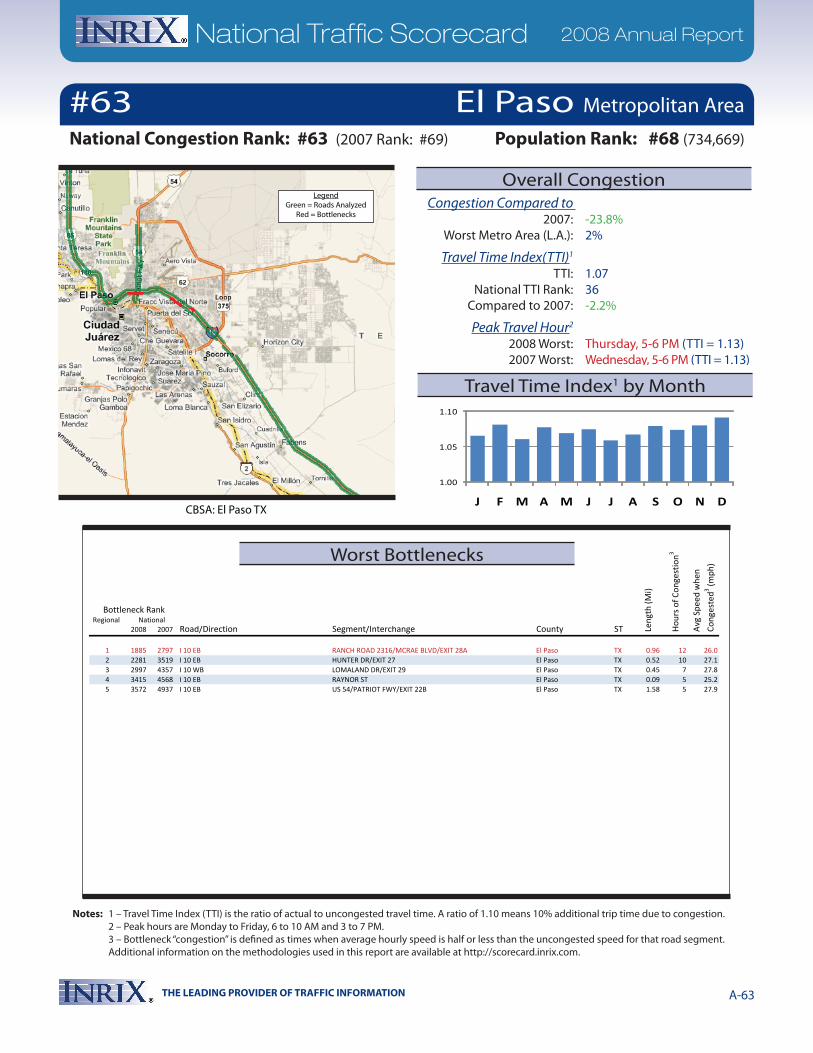
THE LEADING PROVIDER OF TRAFFIC INFORMATION A-63
National Traffic Scorecard 2008 Annual Report
Notes: 1 – Travel Time Index (TTI) is the ratio of actual to uncongested travel time. A ratio of 1.10 means 10% additional trip time due to congestion. 2 – Peak hours are Monday to Friday, 6 to 10 AM and 3 to 7 PM. 3 – Bottleneck “congestion” is defined as times when average hourly speed is half or less than the uncongested speed for that road segment. Additional information on the methodologies used in this report are available at http://scorecard.inrix.com.
Regional 2008 2007 Road/Direction Segment/Interchange County ST
Bottleneck Rank
Len
gth
(Mi)
Hou
rs o
f Con
gest
ion3
Avg
Spe
ed w
hen
Con
gest
ed3 (m
ph)
National
1 1885 2797 I 10 EB RANCH ROAD 2316/MCRAE BLVD/EXIT 28A El Paso TX 0.96 12 26.02 2281 3519 I 10 EB HUNTER DR/EXIT 27 El Paso TX 0.52 10 27.13 2997 4357 I 10 WB LOMALAND DR/EXIT 29 El Paso TX 0.45 7 27.84 3415 4568 I 10 EB RAYNOR ST El Paso TX 0.09 5 25.25 3572 4937 I 10 EB US 54/PATRIOT FWY/EXIT 22B El Paso TX 1.58 5 27.9
1.00
1.05
1.10
J F M A M J J A S O N D
El Paso Metropolitan Area
Population Rank: #68 (734,669)
Congestion Compared to 2007: -23.8% Worst Metro Area (L.A.): 2%
Travel Time Index(TTI)1
TTI: 1.07 National TTI Rank: 36 Compared to 2007: -2.2%
Peak Travel Hour2
2008 Worst: Thursday, 5-6 PM (TTI = 1.13) 2007 Worst: Wednesday, 5-6 PM (TTI = 1.13)
CBSA: El Paso TX
National Congestion Rank: #63 (2007 Rank: #69)
#63
Worst Bottlenecks
Overall Congestion
Travel Time Index1 by Month
LegendGreen = Roads Analyzed
Red = Bottlenecks
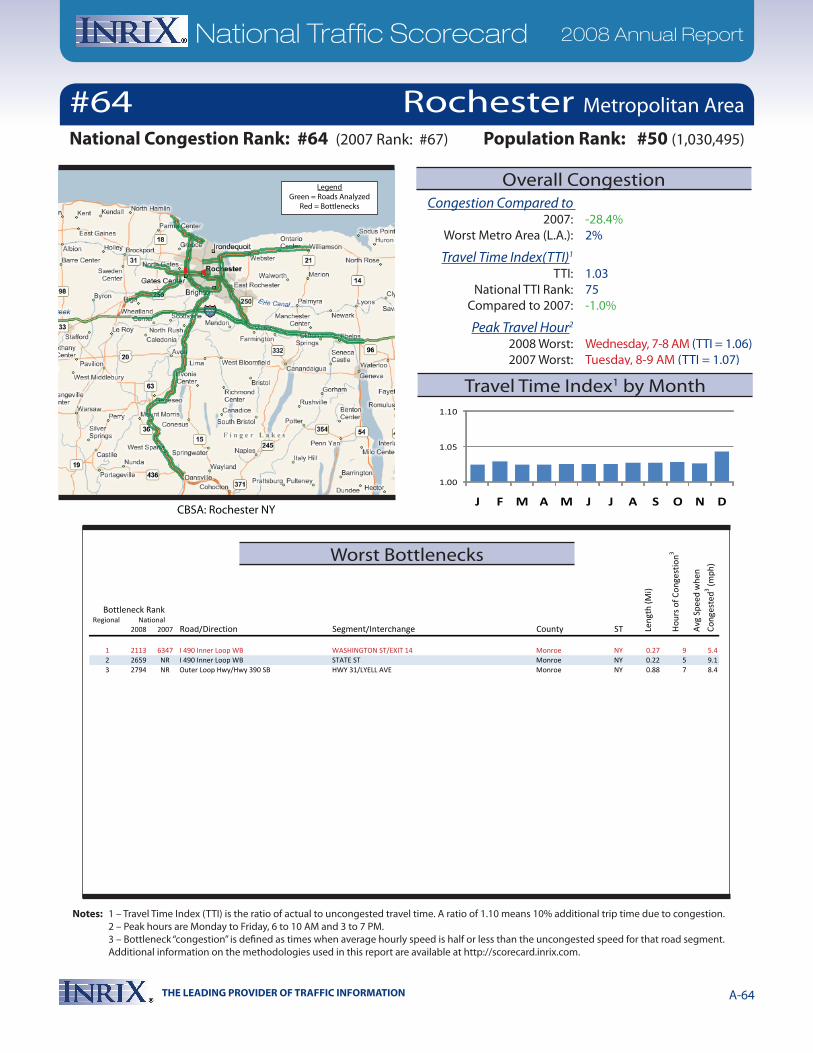
THE LEADING PROVIDER OF TRAFFIC INFORMATION A-64
National Traffic Scorecard 2008 Annual Report
Notes: 1 – Travel Time Index (TTI) is the ratio of actual to uncongested travel time. A ratio of 1.10 means 10% additional trip time due to congestion. 2 – Peak hours are Monday to Friday, 6 to 10 AM and 3 to 7 PM. 3 – Bottleneck “congestion” is defined as times when average hourly speed is half or less than the uncongested speed for that road segment. Additional information on the methodologies used in this report are available at http://scorecard.inrix.com.
Regional 2008 2007 Road/Direction Segment/Interchange County ST
Bottleneck Rank
Len
gth
(Mi)
Hou
rs o
f Con
gest
ion3
Avg
Spe
ed w
hen
Con
gest
ed3 (m
ph)
National
1 2113 6347 I 490 Inner Loop WB WASHINGTON ST/EXIT 14 Monroe NY 0.27 9 5.42 2659 NR I 490 Inner Loop WB STATE ST Monroe NY 0.22 5 9.13 2794 NR Outer Loop Hwy/Hwy 390 SB HWY 31/LYELL AVE Monroe NY 0.88 7 8.4
1.00
1.05
1.10
J F M A M J J A S O N D
#64National Congestion Rank: #64 (2007 Rank: #67)
CBSA: Rochester NY
Congestion Compared to 2007: -28.4% Worst Metro Area (L.A.): 2%
Travel Time Index(TTI)1
TTI: 1.03 National TTI Rank: 75 Compared to 2007: -1.0%
Peak Travel Hour2
2008 Worst: Wednesday, 7-8 AM (TTI = 1.06) 2007 Worst: Tuesday, 8-9 AM (TTI = 1.07)
Population Rank: #50 (1,030,495)
Rochester Metropolitan Area
Worst Bottlenecks
Overall Congestion
Travel Time Index1 by Month
LegendGreen = Roads Analyzed
Red = Bottlenecks

THE LEADING PROVIDER OF TRAFFIC INFORMATION A-65
National Traffic Scorecard 2008 Annual Report
Notes: 1 – Travel Time Index (TTI) is the ratio of actual to uncongested travel time. A ratio of 1.10 means 10% additional trip time due to congestion. 2 – Peak hours are Monday to Friday, 6 to 10 AM and 3 to 7 PM. 3 – Bottleneck “congestion” is defined as times when average hourly speed is half or less than the uncongested speed for that road segment. Additional information on the methodologies used in this report are available at http://scorecard.inrix.com.
Regional 2008 2007 Road/Direction Segment/Interchange County ST
Bottleneck Rank
Len
gth
(Mi)
Hou
rs o
f Con
gest
ion3
Avg
Spe
ed w
hen
Con
gest
ed3 (m
ph)
National
1 1271 6554 I 75 NB HWY 48/GRAND AVE/EXIT 54 Montgomery OH 0.67 12 17.42 2148 NR I 75 NB HWY 4/EXIT 54 Montgomery OH 0.53 10 20.93 2394 NR I 75 NB KEOWEE ST/EXIT 55 Montgomery OH 0.06 8 20.74 2423 NR I 75 SB WAGNER FORD RD/EXIT 57 Montgomery OH 1.34 9 26.85 2555 NR I 75 NB 1ST ST/EXIT 53 Montgomery OH 0.89 7 21.6
1.00
1.05
1.10
J F M A M J J A S O N D
#65National Congestion Rank: #65 (2007 Rank: #66)
CBSA: Dayton OH
Congestion Compared to 2007: -33.6% Worst Metro Area (L.A.): 2%
Travel Time Index(TTI)1
TTI: 1.03 National TTI Rank: 65 Compared to 2007: -1.5%
Peak Travel Hour2
2008 Worst: Thursday, 5-6 PM (TTI = 1.08) 2007 Worst: Friday, 5-6 PM (TTI = 1.09)
Population Rank: #59 (835,537)
Dayton Metropolitan Area
Worst Bottlenecks
Overall Congestion
Travel Time Index1 by Month
LegendGreen = Roads Analyzed
Red = Bottlenecks
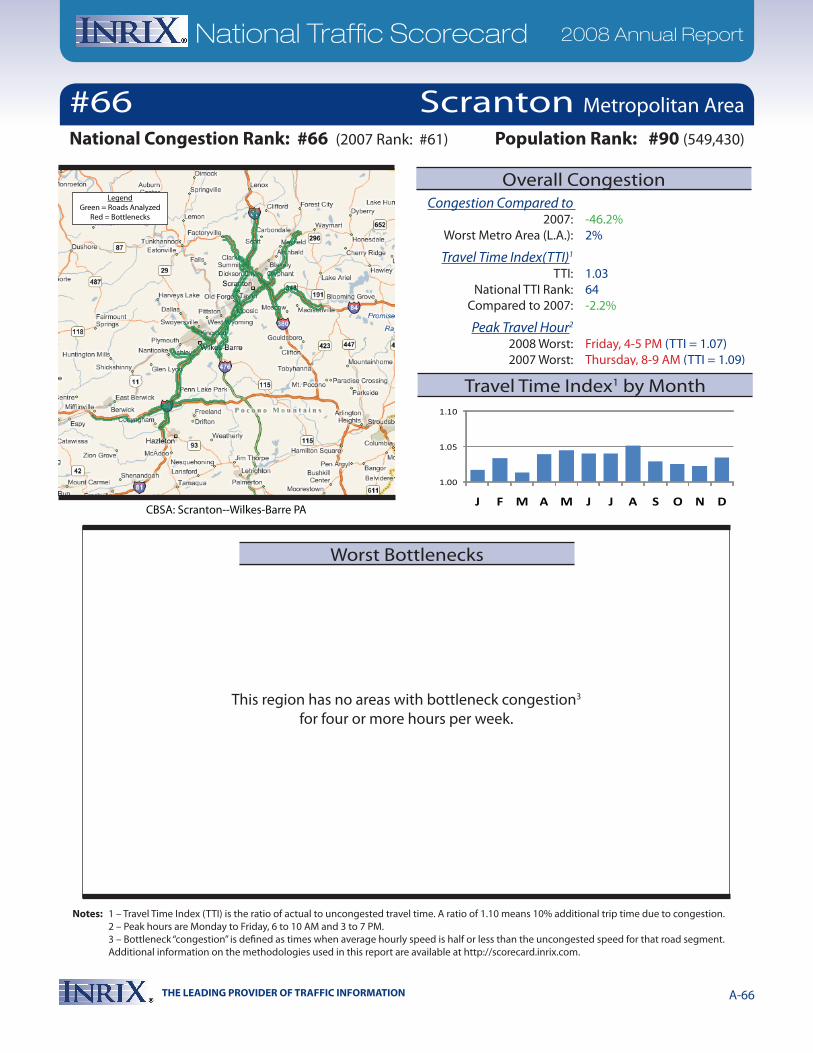
THE LEADING PROVIDER OF TRAFFIC INFORMATION A-66
National Traffic Scorecard 2008 Annual Report
Notes: 1 – Travel Time Index (TTI) is the ratio of actual to uncongested travel time. A ratio of 1.10 means 10% additional trip time due to congestion. 2 – Peak hours are Monday to Friday, 6 to 10 AM and 3 to 7 PM. 3 – Bottleneck “congestion” is defined as times when average hourly speed is half or less than the uncongested speed for that road segment. Additional information on the methodologies used in this report are available at http://scorecard.inrix.com.
This region has no areas with bottleneck congestion3 for four or more hours per week.
1.00
1.05
1.10
J F M A M J J A S O N D
Scranton Metropolitan Area
Population Rank: #90 (549,430)
Congestion Compared to 2007: -46.2% Worst Metro Area (L.A.): 2%
Travel Time Index(TTI)1
TTI: 1.03 National TTI Rank: 64 Compared to 2007: -2.2%
Peak Travel Hour2
2008 Worst: Friday, 4-5 PM (TTI = 1.07) 2007 Worst: Thursday, 8-9 AM (TTI = 1.09)
CBSA: Scranton--Wilkes-Barre PA
National Congestion Rank: #66 (2007 Rank: #61)
#66
Worst Bottlenecks
Overall Congestion
Travel Time Index1 by Month
LegendGreen = Roads Analyzed
Red = Bottlenecks
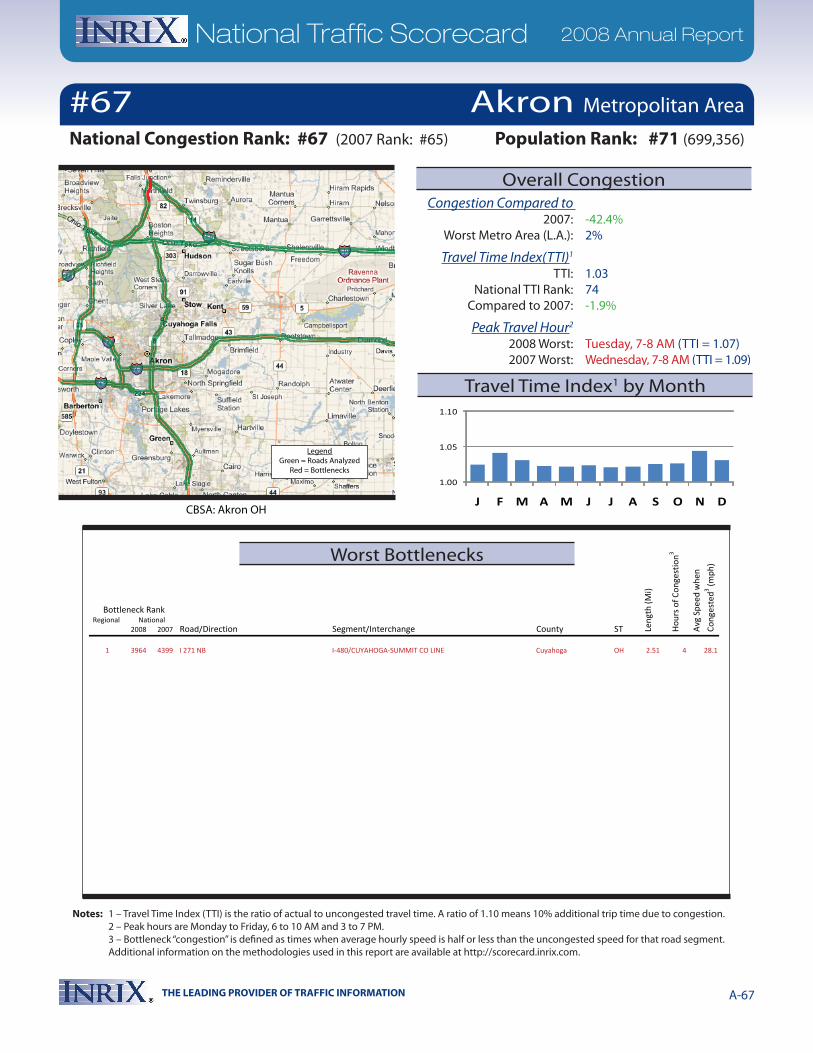
THE LEADING PROVIDER OF TRAFFIC INFORMATION A-67
National Traffic Scorecard 2008 Annual Report
Notes: 1 – Travel Time Index (TTI) is the ratio of actual to uncongested travel time. A ratio of 1.10 means 10% additional trip time due to congestion. 2 – Peak hours are Monday to Friday, 6 to 10 AM and 3 to 7 PM. 3 – Bottleneck “congestion” is defined as times when average hourly speed is half or less than the uncongested speed for that road segment. Additional information on the methodologies used in this report are available at http://scorecard.inrix.com.
Regional 2008 2007 Road/Direction Segment/Interchange County ST
Bottleneck Rank
Len
gth
(Mi)
Hou
rs o
f Con
gest
ion3
Avg
Spe
ed w
hen
Con
gest
ed3 (m
ph)
National
1 3964 4399 I 271 NB I-480/CUYAHOGA-SUMMIT CO LINE Cuyahoga OH 2.51 4 28.1
1.00
1.05
1.10
J F M A M J J A S O N D
#67National Congestion Rank: #67 (2007 Rank: #65)
CBSA: Akron OH
Congestion Compared to 2007: -42.4% Worst Metro Area (L.A.): 2%
Travel Time Index(TTI)1
TTI: 1.03 National TTI Rank: 74 Compared to 2007: -1.9%
Peak Travel Hour2
2008 Worst: Tuesday, 7-8 AM (TTI = 1.07) 2007 Worst: Wednesday, 7-8 AM (TTI = 1.09)
Population Rank: #71 (699,356)
Akron Metropolitan Area
Worst Bottlenecks
Overall Congestion
Travel Time Index1 by Month
LegendGreen = Roads Analyzed
Red = Bottlenecks
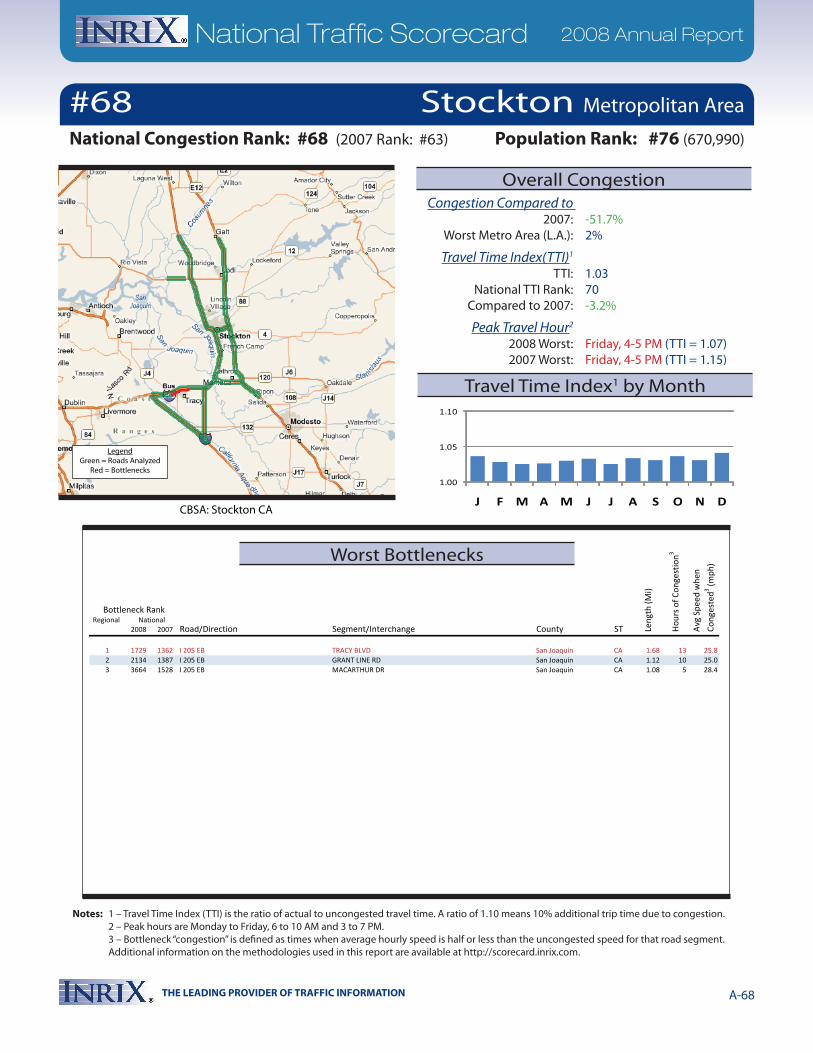
THE LEADING PROVIDER OF TRAFFIC INFORMATION A-68
National Traffic Scorecard 2008 Annual Report
Notes: 1 – Travel Time Index (TTI) is the ratio of actual to uncongested travel time. A ratio of 1.10 means 10% additional trip time due to congestion. 2 – Peak hours are Monday to Friday, 6 to 10 AM and 3 to 7 PM. 3 – Bottleneck “congestion” is defined as times when average hourly speed is half or less than the uncongested speed for that road segment. Additional information on the methodologies used in this report are available at http://scorecard.inrix.com.
Regional 2008 2007 Road/Direction Segment/Interchange County ST
Bottleneck Rank
Len
gth
(Mi)
Hou
rs o
f Con
gest
ion3
Avg
Spe
ed w
hen
Con
gest
ed3 (m
ph)
National
1 1729 1362 I 205 EB TRACY BLVD San Joaquin CA 1.68 13 25.82 2134 1387 I 205 EB GRANT LINE RD San Joaquin CA 1.12 10 25.03 3664 1528 I 205 EB MACARTHUR DR San Joaquin CA 1.08 5 28.4
1.00
1.05
1.10
J F M A M J J A S O N D
#68National Congestion Rank: #68 (2007 Rank: #63)
CBSA: Stockton CA
Congestion Compared to 2007: -51.7% Worst Metro Area (L.A.): 2%
Travel Time Index(TTI)1
TTI: 1.03 National TTI Rank: 70 Compared to 2007: -3.2%
Peak Travel Hour2
2008 Worst: Friday, 4-5 PM (TTI = 1.07) 2007 Worst: Friday, 4-5 PM (TTI = 1.15)
Population Rank: #76 (670,990)
Stockton Metropolitan Area
Worst Bottlenecks
Overall Congestion
Travel Time Index1 by Month
LegendGreen = Roads Analyzed
Red = Bottlenecks
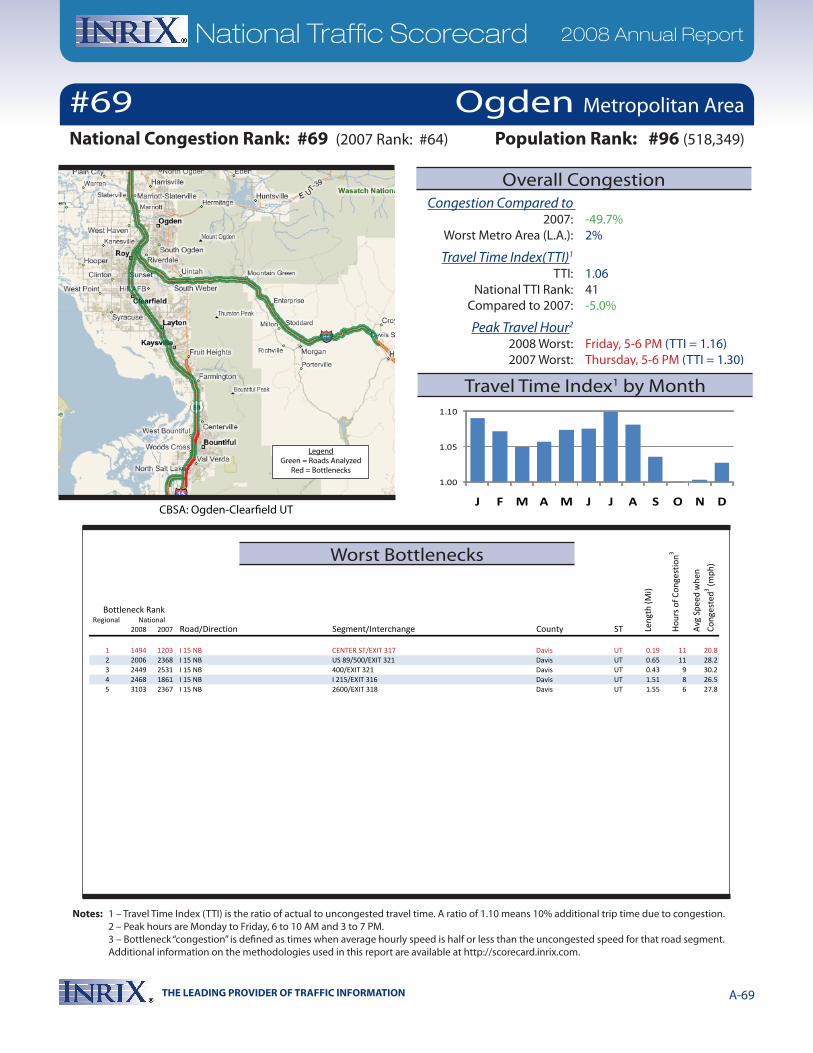
THE LEADING PROVIDER OF TRAFFIC INFORMATION A-69
National Traffic Scorecard 2008 Annual Report
Notes: 1 – Travel Time Index (TTI) is the ratio of actual to uncongested travel time. A ratio of 1.10 means 10% additional trip time due to congestion. 2 – Peak hours are Monday to Friday, 6 to 10 AM and 3 to 7 PM. 3 – Bottleneck “congestion” is defined as times when average hourly speed is half or less than the uncongested speed for that road segment. Additional information on the methodologies used in this report are available at http://scorecard.inrix.com.
Regional 2008 2007 Road/Direction Segment/Interchange County ST
Bottleneck Rank
Len
gth
(Mi)
Hou
rs o
f Con
gest
ion3
Avg
Spe
ed w
hen
Con
gest
ed3 (m
ph)
National
1 1494 1203 I 15 NB CENTER ST/EXIT 317 Davis UT 0.19 11 20.82 2006 2368 I 15 NB US 89/500/EXIT 321 Davis UT 0.65 11 28.23 2449 2531 I 15 NB 400/EXIT 321 Davis UT 0.43 9 30.24 2468 1861 I 15 NB I 215/EXIT 316 Davis UT 1.51 8 26.55 3103 2367 I 15 NB 2600/EXIT 318 Davis UT 1.55 6 27.8
1.00
1.05
1.10
J F M A M J J A S O N DCBSA: Ogden-Clearfield UT
National Congestion Rank: #69 (2007 Rank: #64)
#69
Congestion Compared to 2007: -49.7% Worst Metro Area (L.A.): 2%
Travel Time Index(TTI)1
TTI: 1.06 National TTI Rank: 41 Compared to 2007: -5.0%
Peak Travel Hour2
2008 Worst: Friday, 5-6 PM (TTI = 1.16) 2007 Worst: Thursday, 5-6 PM (TTI = 1.30)
Population Rank: #96 (518,349)
Ogden Metropolitan Area
Worst Bottlenecks
Overall Congestion
Travel Time Index1 by Month
LegendGreen = Roads Analyzed
Red = Bottlenecks
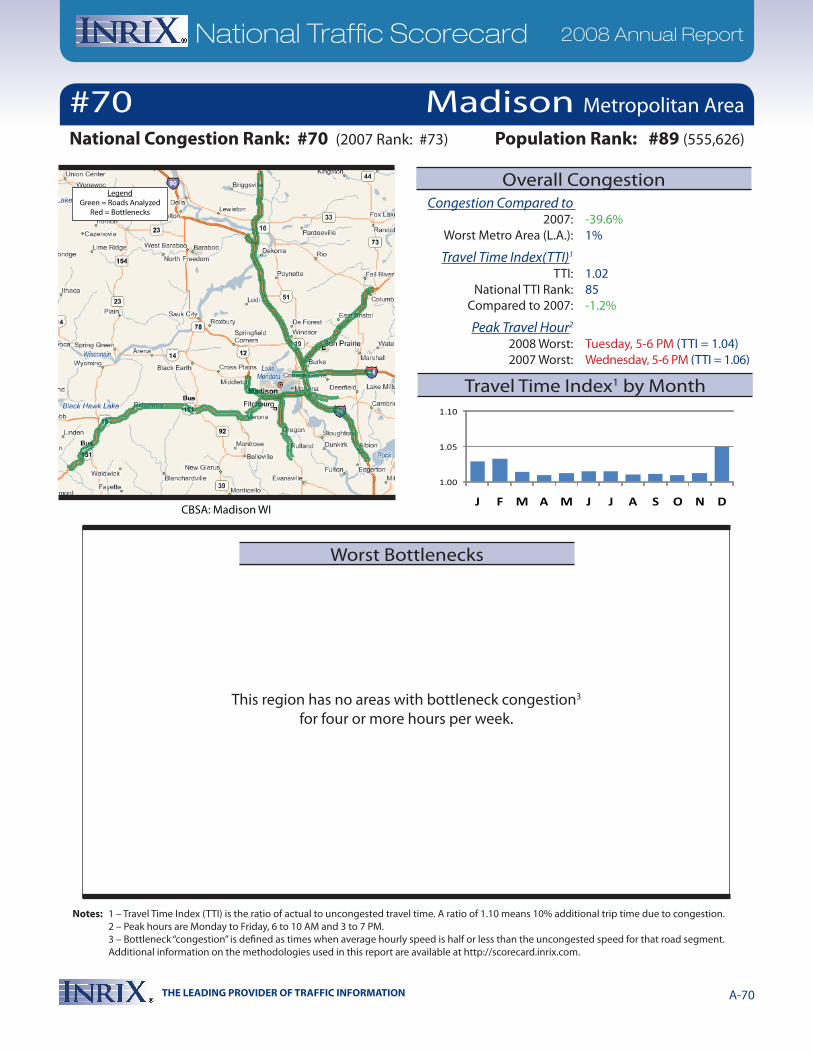
THE LEADING PROVIDER OF TRAFFIC INFORMATION A-70
National Traffic Scorecard 2008 Annual Report
Notes: 1 – Travel Time Index (TTI) is the ratio of actual to uncongested travel time. A ratio of 1.10 means 10% additional trip time due to congestion. 2 – Peak hours are Monday to Friday, 6 to 10 AM and 3 to 7 PM. 3 – Bottleneck “congestion” is defined as times when average hourly speed is half or less than the uncongested speed for that road segment. Additional information on the methodologies used in this report are available at http://scorecard.inrix.com.
This region has no areas with bottleneck congestion3 for four or more hours per week.
1.00
1.05
1.10
J F M A M J J A S O N D
#70National Congestion Rank: #70 (2007 Rank: #73)
CBSA: Madison WI
Congestion Compared to 2007: -39.6% Worst Metro Area (L.A.): 1%
Travel Time Index(TTI)1
TTI: 1.02 National TTI Rank: 85 Compared to 2007: -1.2%
Peak Travel Hour2
2008 Worst: Tuesday, 5-6 PM (TTI = 1.04) 2007 Worst: Wednesday, 5-6 PM (TTI = 1.06)
Population Rank: #89 (555,626)
Madison Metropolitan Area
Worst Bottlenecks
Overall Congestion
Travel Time Index1 by Month
LegendGreen = Roads Analyzed
Red = Bottlenecks

THE LEADING PROVIDER OF TRAFFIC INFORMATION A-71
National Traffic Scorecard 2008 Annual Report
Notes: 1 – Travel Time Index (TTI) is the ratio of actual to uncongested travel time. A ratio of 1.10 means 10% additional trip time due to congestion. 2 – Peak hours are Monday to Friday, 6 to 10 AM and 3 to 7 PM. 3 – Bottleneck “congestion” is defined as times when average hourly speed is half or less than the uncongested speed for that road segment. Additional information on the methodologies used in this report are available at http://scorecard.inrix.com.
Regional 2008 2007 Road/Direction Segment/Interchange County ST
Bottleneck Rank
Len
gth
(Mi)
Hou
rs o
f Con
gest
ion3
Avg
Spe
ed w
hen
Con
gest
ed3 (m
ph)
National
1 1330 1375 I 26 EB ASHLEY PHOSPHATE RD Charleston SC 0.17 13 19.82 1835 1918 I 26 WB I 526 Charleston SC 0.90 9 18.63 1872 2189 I 26 WB REMOUNT RD Charleston SC 0.73 10 20.84 2586 2550 I 26 WB W AVIATION AVE Charleston SC 0.58 8 26.75 2732 4704 I 26 WB MALL DR/W MONTAGUE AVE Charleston SC 2.05 8 28.4
1.00
1.05
1.10
J F M A M J J A S O N D
#71National Congestion Rank: #71 (2007 Rank: #71)
CBSA: Charleston-North Charleston SC
Congestion Compared to 2007: -45.2% Worst Metro Area (L.A.): 1%
Travel Time Index(TTI)1
TTI: 1.08 National TTI Rank: 34 Compared to 2007: -4.7%
Peak Travel Hour2
2008 Worst: Thursday, 5-6 PM (TTI = 1.20) 2007 Worst: Thursday, 5-6 PM (TTI = 1.31)
Population Rank: #81 (630,100)
Charleston Metropolitan Area
Worst Bottlenecks
Overall Congestion
Travel Time Index1 by Month
LegendGreen = Roads Analyzed
Red = Bottlenecks
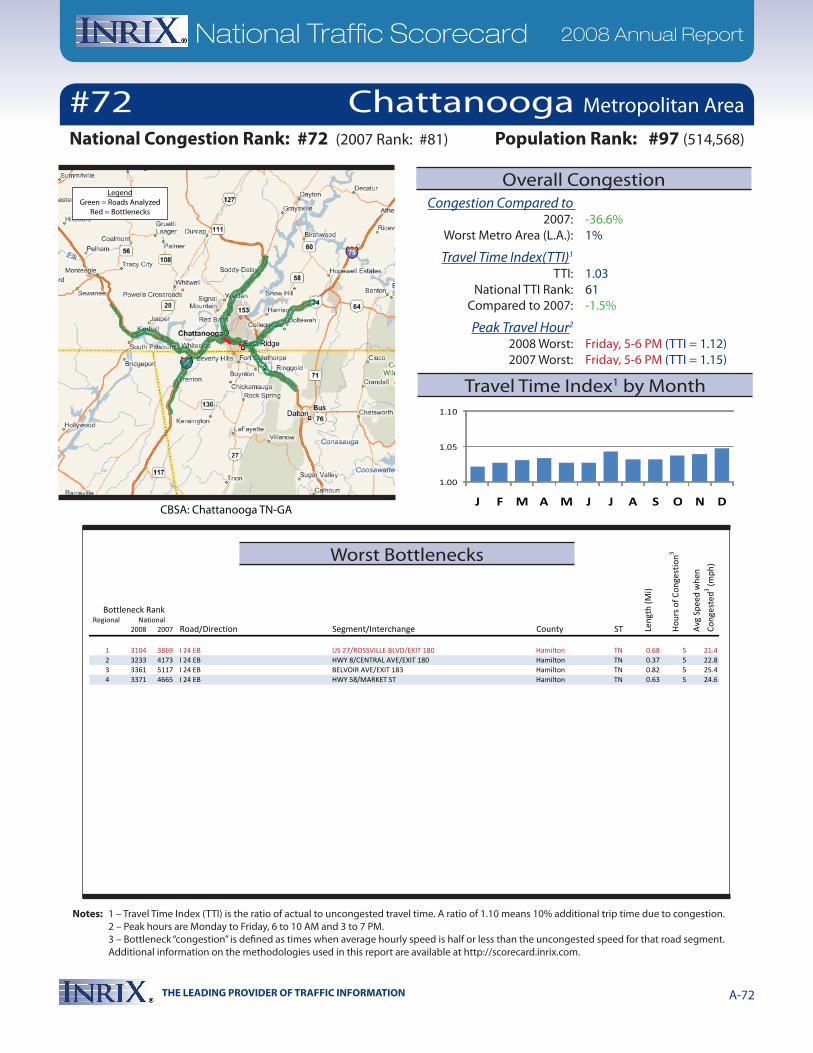
THE LEADING PROVIDER OF TRAFFIC INFORMATION A-72
National Traffic Scorecard 2008 Annual Report
Notes: 1 – Travel Time Index (TTI) is the ratio of actual to uncongested travel time. A ratio of 1.10 means 10% additional trip time due to congestion. 2 – Peak hours are Monday to Friday, 6 to 10 AM and 3 to 7 PM. 3 – Bottleneck “congestion” is defined as times when average hourly speed is half or less than the uncongested speed for that road segment. Additional information on the methodologies used in this report are available at http://scorecard.inrix.com.
Regional 2008 2007 Road/Direction Segment/Interchange County ST
Bottleneck Rank
Len
gth
(Mi)
Hou
rs o
f Con
gest
ion3
Avg
Spe
ed w
hen
Con
gest
ed3 (m
ph)
National
1 3104 3869 I 24 EB US 27/ROSSVILLE BLVD/EXIT 180 Hamilton TN 0.68 5 21.42 3233 4173 I 24 EB HWY 8/CENTRAL AVE/EXIT 180 Hamilton TN 0.37 5 22.83 3361 5117 I 24 EB BELVOIR AVE/EXIT 183 Hamilton TN 0.82 5 25.44 3371 4665 I 24 EB HWY 58/MARKET ST Hamilton TN 0.63 5 24.6
1.00
1.05
1.10
J F M A M J J A S O N D
#72National Congestion Rank: #72 (2007 Rank: #81)
CBSA: Chattanooga TN-GA
Congestion Compared to 2007: -36.6% Worst Metro Area (L.A.): 1%
Travel Time Index(TTI)1
TTI: 1.03 National TTI Rank: 61 Compared to 2007: -1.5%
Peak Travel Hour2
2008 Worst: Friday, 5-6 PM (TTI = 1.12) 2007 Worst: Friday, 5-6 PM (TTI = 1.15)
Population Rank: #97 (514,568)
Chattanooga Metropolitan Area
Worst Bottlenecks
Overall Congestion
Travel Time Index1 by Month
LegendGreen = Roads Analyzed
Red = Bottlenecks

THE LEADING PROVIDER OF TRAFFIC INFORMATION A-73
National Traffic Scorecard 2008 Annual Report
Notes: 1 – Travel Time Index (TTI) is the ratio of actual to uncongested travel time. A ratio of 1.10 means 10% additional trip time due to congestion. 2 – Peak hours are Monday to Friday, 6 to 10 AM and 3 to 7 PM. 3 – Bottleneck “congestion” is defined as times when average hourly speed is half or less than the uncongested speed for that road segment. Additional information on the methodologies used in this report are available at http://scorecard.inrix.com.
This region has no areas with bottleneck congestion3 for four or more hours per week.
1.00
1.05
1.10
J F M A M J J A S O N D
#73National Congestion Rank: #73 (2007 Rank: #87)
CBSA: Grand Rapids-Wyoming MI
Congestion Compared to 2007: -26.9% Worst Metro Area (L.A.): 1%
Travel Time Index(TTI)1
TTI: 1.03 National TTI Rank: 73 Compared to 2007: -1.3%
Peak Travel Hour2
2008 Worst: Friday, 5-6 PM (TTI = 1.07) 2007 Worst: Thursday, 5-6 PM (TTI = 1.08)
Population Rank: #66 (776,742)
Grand Rapids Metropolitan Area
Worst Bottlenecks
Overall Congestion
Travel Time Index1 by Month
LegendGreen = Roads Analyzed
Red = Bottlenecks
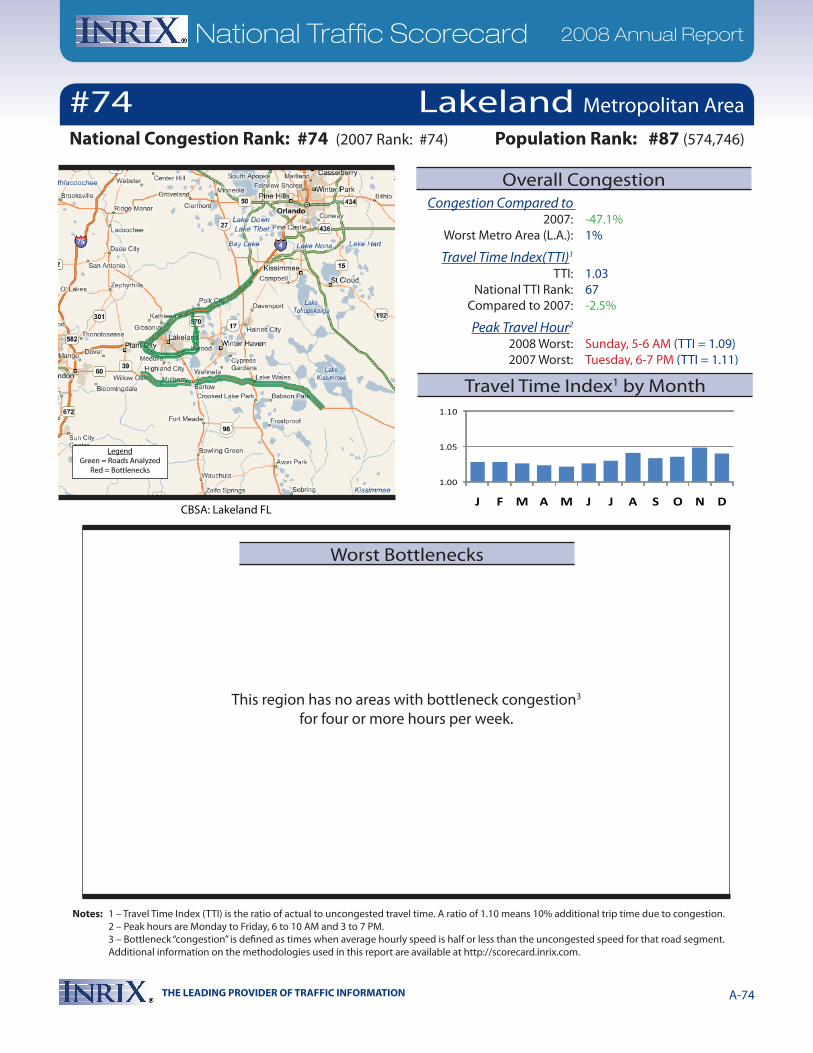
THE LEADING PROVIDER OF TRAFFIC INFORMATION A-74
National Traffic Scorecard 2008 Annual Report
Notes: 1 – Travel Time Index (TTI) is the ratio of actual to uncongested travel time. A ratio of 1.10 means 10% additional trip time due to congestion. 2 – Peak hours are Monday to Friday, 6 to 10 AM and 3 to 7 PM. 3 – Bottleneck “congestion” is defined as times when average hourly speed is half or less than the uncongested speed for that road segment. Additional information on the methodologies used in this report are available at http://scorecard.inrix.com.
This region has no areas with bottleneck congestion3 for four or more hours per week.
1.00
1.05
1.10
J F M A M J J A S O N D
#74National Congestion Rank: #74 (2007 Rank: #74)
CBSA: Lakeland FL
Congestion Compared to 2007: -47.1% Worst Metro Area (L.A.): 1%
Travel Time Index(TTI)1
TTI: 1.03 National TTI Rank: 67 Compared to 2007: -2.5%
Peak Travel Hour2
2008 Worst: Sunday, 5-6 AM (TTI = 1.09) 2007 Worst: Tuesday, 6-7 PM (TTI = 1.11)
Population Rank: #87 (574,746)
Lakeland Metropolitan Area
Worst Bottlenecks
Overall Congestion
Travel Time Index1 by Month
LegendGreen = Roads Analyzed
Red = Bottlenecks
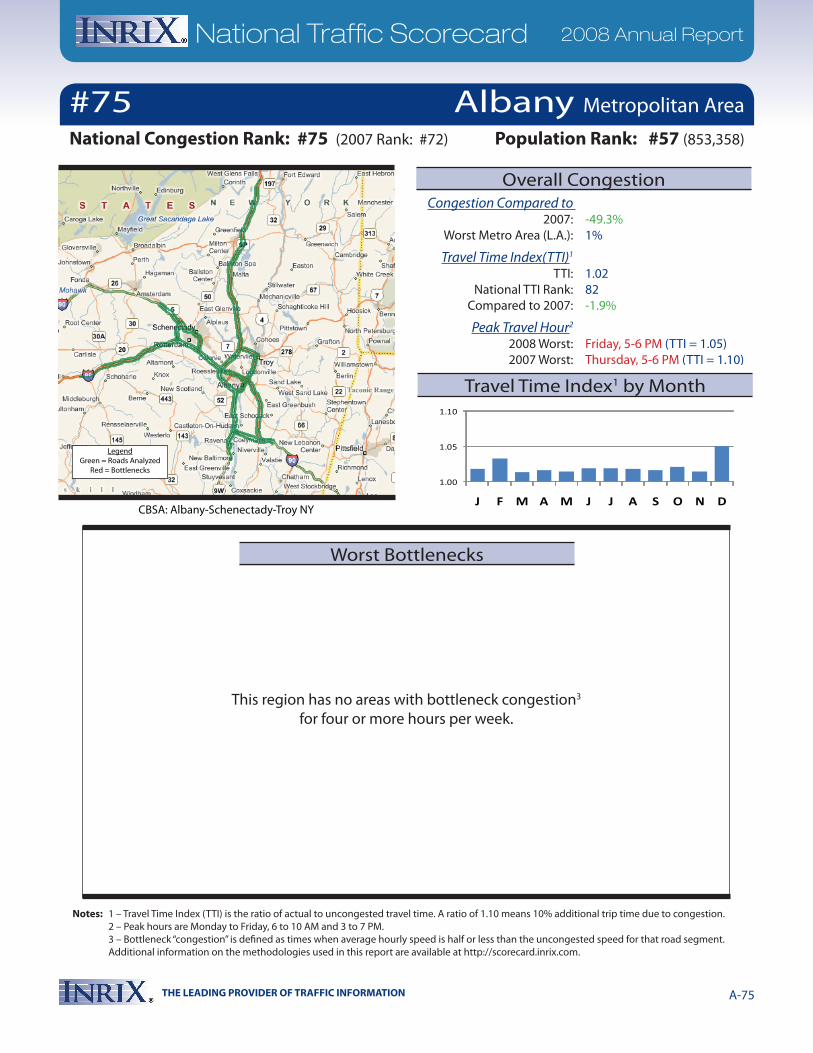
THE LEADING PROVIDER OF TRAFFIC INFORMATION A-75
National Traffic Scorecard 2008 Annual Report
Notes: 1 – Travel Time Index (TTI) is the ratio of actual to uncongested travel time. A ratio of 1.10 means 10% additional trip time due to congestion. 2 – Peak hours are Monday to Friday, 6 to 10 AM and 3 to 7 PM. 3 – Bottleneck “congestion” is defined as times when average hourly speed is half or less than the uncongested speed for that road segment. Additional information on the methodologies used in this report are available at http://scorecard.inrix.com.
This region has no areas with bottleneck congestion3 for four or more hours per week.
1.00
1.05
1.10
J F M A M J J A S O N D
#75National Congestion Rank: #75 (2007 Rank: #72)
CBSA: Albany-Schenectady-Troy NY
Congestion Compared to 2007: -49.3% Worst Metro Area (L.A.): 1%
Travel Time Index(TTI)1
TTI: 1.02 National TTI Rank: 82 Compared to 2007: -1.9%
Peak Travel Hour2
2008 Worst: Friday, 5-6 PM (TTI = 1.05) 2007 Worst: Thursday, 5-6 PM (TTI = 1.10)
Population Rank: #57 (853,358)
Albany Metropolitan Area
Worst Bottlenecks
Overall Congestion
Travel Time Index1 by Month
LegendGreen = Roads Analyzed
Red = Bottlenecks

THE LEADING PROVIDER OF TRAFFIC INFORMATION A-76
National Traffic Scorecard 2008 Annual Report
Notes: 1 – Travel Time Index (TTI) is the ratio of actual to uncongested travel time. A ratio of 1.10 means 10% additional trip time due to congestion. 2 – Peak hours are Monday to Friday, 6 to 10 AM and 3 to 7 PM. 3 – Bottleneck “congestion” is defined as times when average hourly speed is half or less than the uncongested speed for that road segment. Additional information on the methodologies used in this report are available at http://scorecard.inrix.com.
Regional 2008 2007 Road/Direction Segment/Interchange County ST
Bottleneck Rank
Len
gth
(Mi)
Hou
rs o
f Con
gest
ion3
Avg
Spe
ed w
hen
Con
gest
ed3 (m
ph)
National
1 3100 1254 I 40 EB US 441/HENLEY ST/EXIT 388 Knox TN 0.48 6 25.32 3150 1377 I 40 EB I 275/EXIT 387 Knox TN 0.64 6 25.3
1.00
1.05
1.10
J F M A M J J A S O N D
#76National Congestion Rank: #76 (2007 Rank: #77)
CBSA: Knoxville TN
Congestion Compared to 2007: -42.1% Worst Metro Area (L.A.): 1%
Travel Time Index(TTI)1
TTI: 1.03 National TTI Rank: 63 Compared to 2007: -2.1%
Peak Travel Hour2
2008 Worst: Friday, 5-6 PM (TTI = 1.09) 2007 Worst: Friday, 5-6 PM (TTI = 1.13)
Population Rank: #75 (681,525)
Knoxville Metropolitan Area
Worst Bottlenecks
Overall Congestion
Travel Time Index1 by Month
LegendGreen = Roads Analyzed
Red = Bottlenecks
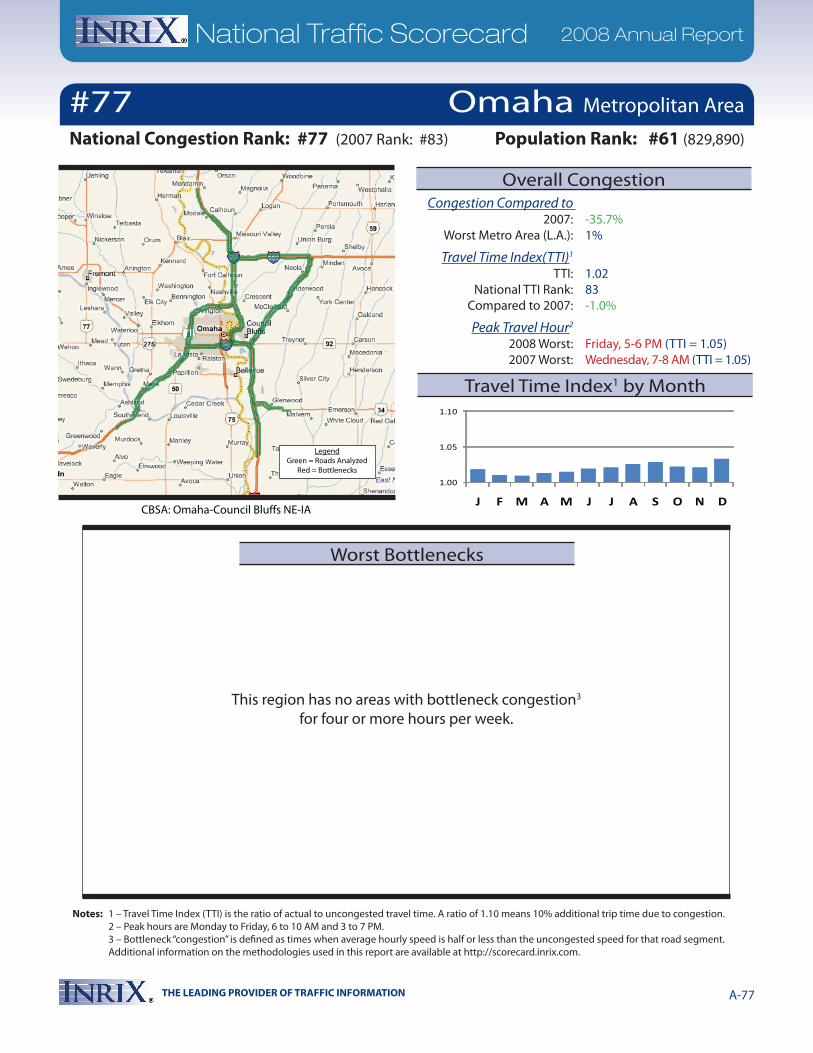
THE LEADING PROVIDER OF TRAFFIC INFORMATION A-77
National Traffic Scorecard 2008 Annual Report
Notes: 1 – Travel Time Index (TTI) is the ratio of actual to uncongested travel time. A ratio of 1.10 means 10% additional trip time due to congestion. 2 – Peak hours are Monday to Friday, 6 to 10 AM and 3 to 7 PM. 3 – Bottleneck “congestion” is defined as times when average hourly speed is half or less than the uncongested speed for that road segment. Additional information on the methodologies used in this report are available at http://scorecard.inrix.com.
This region has no areas with bottleneck congestion3 for four or more hours per week.
1.00
1.05
1.10
J F M A M J J A S O N D
#77National Congestion Rank: #77 (2007 Rank: #83)
CBSA: Omaha-Council Bluffs NE-IA
Congestion Compared to 2007: -35.7% Worst Metro Area (L.A.): 1%
Travel Time Index(TTI)1
TTI: 1.02 National TTI Rank: 83 Compared to 2007: -1.0%
Peak Travel Hour2
2008 Worst: Friday, 5-6 PM (TTI = 1.05) 2007 Worst: Wednesday, 7-8 AM (TTI = 1.05)
Population Rank: #61 (829,890)
Omaha Metropolitan Area
Worst Bottlenecks
Overall Congestion
Travel Time Index1 by Month
LegendGreen = Roads Analyzed
Red = Bottlenecks
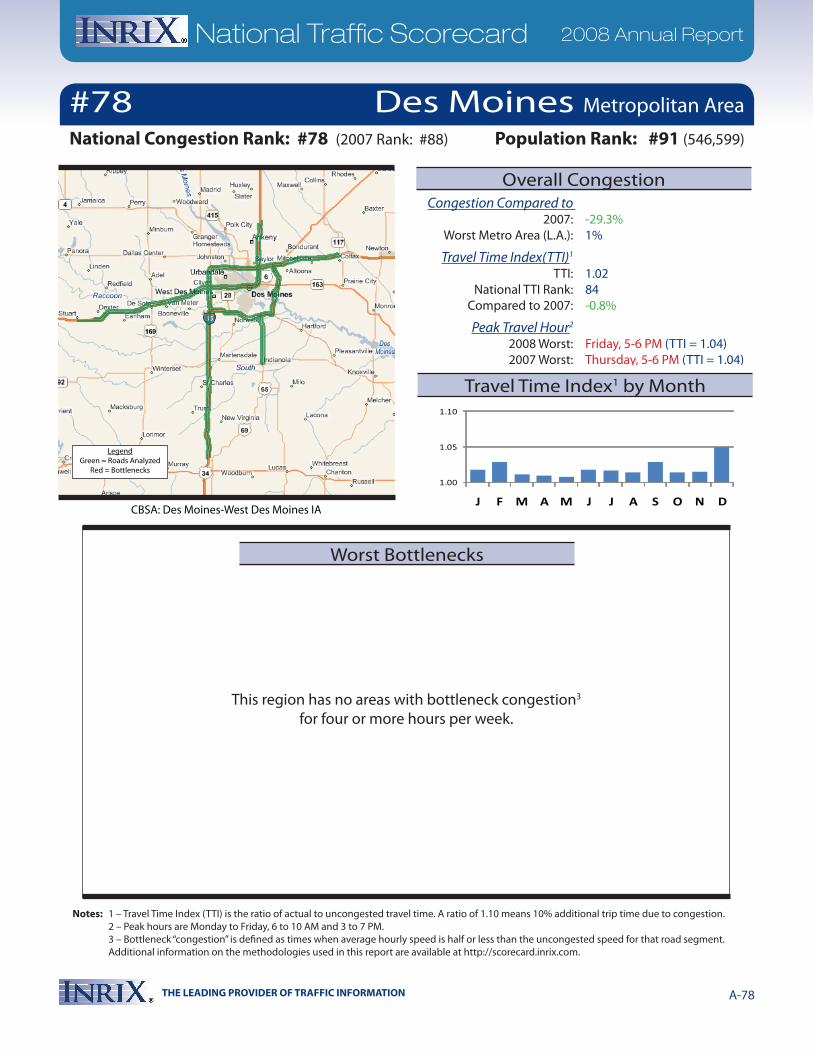
THE LEADING PROVIDER OF TRAFFIC INFORMATION A-78
National Traffic Scorecard 2008 Annual Report
Notes: 1 – Travel Time Index (TTI) is the ratio of actual to uncongested travel time. A ratio of 1.10 means 10% additional trip time due to congestion. 2 – Peak hours are Monday to Friday, 6 to 10 AM and 3 to 7 PM. 3 – Bottleneck “congestion” is defined as times when average hourly speed is half or less than the uncongested speed for that road segment. Additional information on the methodologies used in this report are available at http://scorecard.inrix.com.
This region has no areas with bottleneck congestion3 for four or more hours per week.
1.00
1.05
1.10
J F M A M J J A S O N D
#78National Congestion Rank: #78 (2007 Rank: #88)
CBSA: Des Moines-West Des Moines IA
Congestion Compared to 2007: -29.3% Worst Metro Area (L.A.): 1%
Travel Time Index(TTI)1
TTI: 1.02 National TTI Rank: 84 Compared to 2007: -0.8%
Peak Travel Hour2
2008 Worst: Friday, 5-6 PM (TTI = 1.04) 2007 Worst: Thursday, 5-6 PM (TTI = 1.04)
Population Rank: #91 (546,599)
Des Moines Metropolitan Area
Worst Bottlenecks
Overall Congestion
Travel Time Index1 by Month
LegendGreen = Roads Analyzed
Red = Bottlenecks
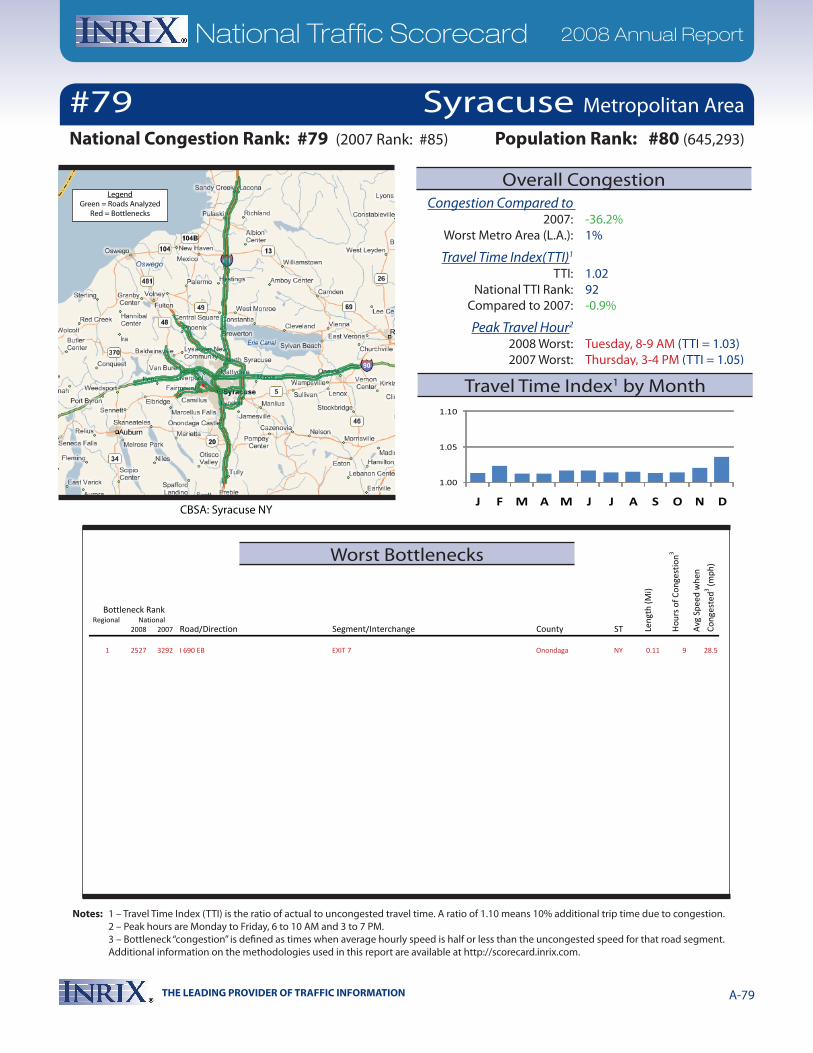
THE LEADING PROVIDER OF TRAFFIC INFORMATION A-79
National Traffic Scorecard 2008 Annual Report
Notes: 1 – Travel Time Index (TTI) is the ratio of actual to uncongested travel time. A ratio of 1.10 means 10% additional trip time due to congestion. 2 – Peak hours are Monday to Friday, 6 to 10 AM and 3 to 7 PM. 3 – Bottleneck “congestion” is defined as times when average hourly speed is half or less than the uncongested speed for that road segment. Additional information on the methodologies used in this report are available at http://scorecard.inrix.com.
Regional 2008 2007 Road/Direction Segment/Interchange County ST
Bottleneck Rank
Len
gth
(Mi)
Hou
rs o
f Con
gest
ion3
Avg
Spe
ed w
hen
Con
gest
ed3 (m
ph)
National
1 2527 3292 I 690 EB EXIT 7 Onondaga NY 0.11 9 28.5
1.00
1.05
1.10
J F M A M J J A S O N D
#79National Congestion Rank: #79 (2007 Rank: #85)
CBSA: Syracuse NY
Congestion Compared to 2007: -36.2% Worst Metro Area (L.A.): 1%
Travel Time Index(TTI)1
TTI: 1.02 National TTI Rank: 92 Compared to 2007: -0.9%
Peak Travel Hour2
2008 Worst: Tuesday, 8-9 AM (TTI = 1.03) 2007 Worst: Thursday, 3-4 PM (TTI = 1.05)
Population Rank: #80 (645,293)
Syracuse Metropolitan Area
Worst Bottlenecks
Overall Congestion
Travel Time Index1 by Month
LegendGreen = Roads Analyzed
Red = Bottlenecks
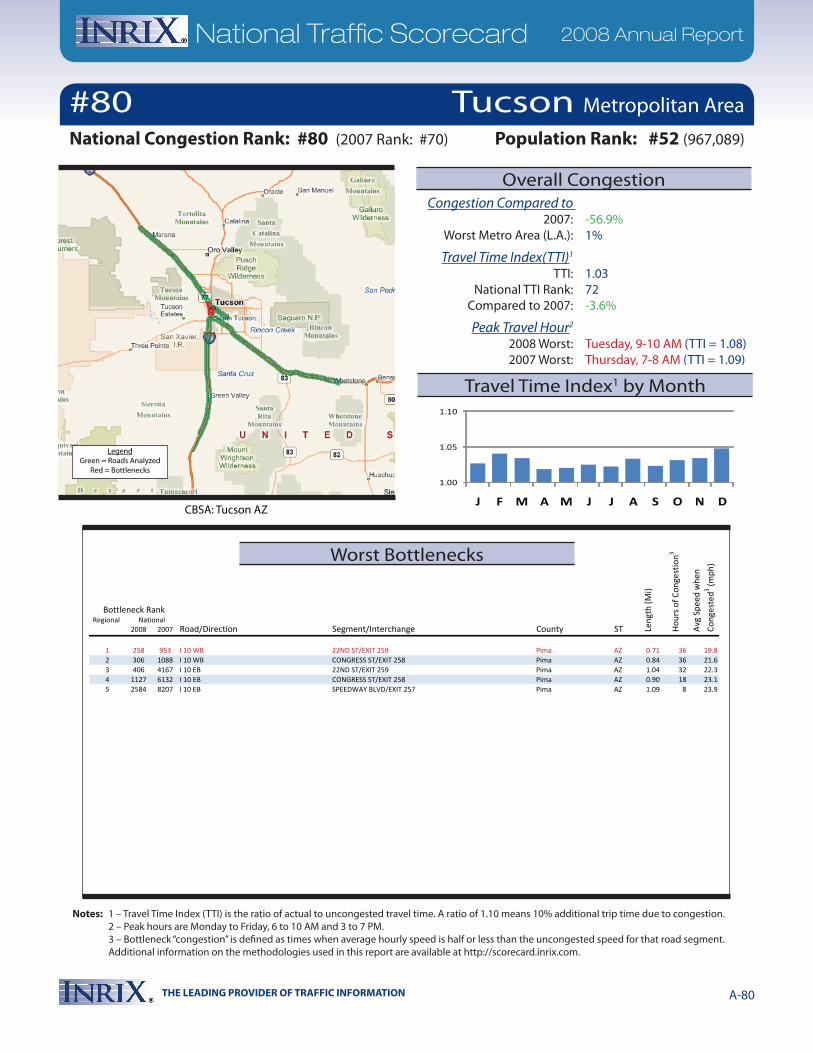
THE LEADING PROVIDER OF TRAFFIC INFORMATION A-80
National Traffic Scorecard 2008 Annual Report
Notes: 1 – Travel Time Index (TTI) is the ratio of actual to uncongested travel time. A ratio of 1.10 means 10% additional trip time due to congestion. 2 – Peak hours are Monday to Friday, 6 to 10 AM and 3 to 7 PM. 3 – Bottleneck “congestion” is defined as times when average hourly speed is half or less than the uncongested speed for that road segment. Additional information on the methodologies used in this report are available at http://scorecard.inrix.com.
Regional 2008 2007 Road/Direction Segment/Interchange County ST
Bottleneck Rank
Len
gth
(Mi)
Hou
rs o
f Con
gest
ion3
Avg
Spe
ed w
hen
Con
gest
ed3 (m
ph)
National
1 258 953 I 10 WB 22ND ST/EXIT 259 Pima AZ 0.71 36 19.82 306 1088 I 10 WB CONGRESS ST/EXIT 258 Pima AZ 0.84 36 21.63 406 4167 I 10 EB 22ND ST/EXIT 259 Pima AZ 1.04 32 22.34 1127 6132 I 10 EB CONGRESS ST/EXIT 258 Pima AZ 0.90 18 23.15 2584 8207 I 10 EB SPEEDWAY BLVD/EXIT 257 Pima AZ 1.09 8 23.9
1.00
1.05
1.10
J F M A M J J A S O N D
#80National Congestion Rank: #80 (2007 Rank: #70)
CBSA: Tucson AZ
Congestion Compared to 2007: -56.9% Worst Metro Area (L.A.): 1%
Travel Time Index(TTI)1
TTI: 1.03 National TTI Rank: 72 Compared to 2007: -3.6%
Peak Travel Hour2
2008 Worst: Tuesday, 9-10 AM (TTI = 1.08) 2007 Worst: Thursday, 7-8 AM (TTI = 1.09)
Population Rank: #52 (967,089)
Tucson Metropolitan Area
Worst Bottlenecks
Overall Congestion
Travel Time Index1 by Month
LegendGreen = Roads Analyzed
Red = Bottlenecks
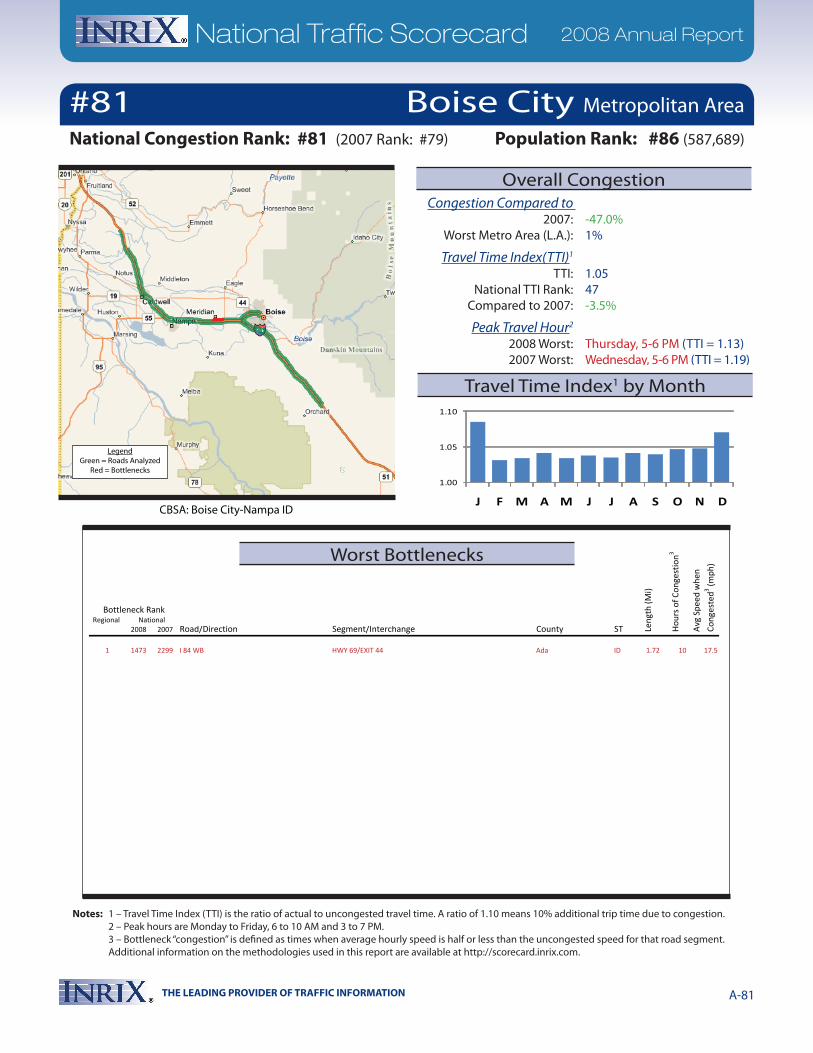
THE LEADING PROVIDER OF TRAFFIC INFORMATION A-81
National Traffic Scorecard 2008 Annual Report
Notes: 1 – Travel Time Index (TTI) is the ratio of actual to uncongested travel time. A ratio of 1.10 means 10% additional trip time due to congestion. 2 – Peak hours are Monday to Friday, 6 to 10 AM and 3 to 7 PM. 3 – Bottleneck “congestion” is defined as times when average hourly speed is half or less than the uncongested speed for that road segment. Additional information on the methodologies used in this report are available at http://scorecard.inrix.com.
Regional 2008 2007 Road/Direction Segment/Interchange County ST
Bottleneck Rank
Len
gth
(Mi)
Hou
rs o
f Con
gest
ion3
Avg
Spe
ed w
hen
Con
gest
ed3 (m
ph)
National
1 1473 2299 I 84 WB HWY 69/EXIT 44 Ada ID 1.72 10 17.5
1.00
1.05
1.10
J F M A M J J A S O N D
#81National Congestion Rank: #81 (2007 Rank: #79)
CBSA: Boise City-Nampa ID
Congestion Compared to 2007: -47.0% Worst Metro Area (L.A.): 1%
Travel Time Index(TTI)1
TTI: 1.05 National TTI Rank: 47 Compared to 2007: -3.5%
Peak Travel Hour2
2008 Worst: Thursday, 5-6 PM (TTI = 1.13) 2007 Worst: Wednesday, 5-6 PM (TTI = 1.19)
Population Rank: #86 (587,689)
Boise City Metropolitan Area
Worst Bottlenecks
Overall Congestion
Travel Time Index1 by Month
LegendGreen = Roads Analyzed
Red = Bottlenecks

THE LEADING PROVIDER OF TRAFFIC INFORMATION A-82
National Traffic Scorecard 2008 Annual Report
Notes: 1 – Travel Time Index (TTI) is the ratio of actual to uncongested travel time. A ratio of 1.10 means 10% additional trip time due to congestion. 2 – Peak hours are Monday to Friday, 6 to 10 AM and 3 to 7 PM. 3 – Bottleneck “congestion” is defined as times when average hourly speed is half or less than the uncongested speed for that road segment. Additional information on the methodologies used in this report are available at http://scorecard.inrix.com.
This region has no areas with bottleneck congestion3 for four or more hours per week.
1.00
1.05
1.10
J F M A M J J A S O N D
#82National Congestion Rank: #82 (2007 Rank: #80)
CBSA: Bakersfield CA
Congestion Compared to 2007: -47.9% Worst Metro Area (L.A.): 1%
Travel Time Index(TTI)1
TTI: 1.02 National TTI Rank: 95 Compared to 2007: -1.2%
Peak Travel Hour2
2008 Worst: Monday, 8-9 PM (TTI = 1.03) 2007 Worst: Thursday, 9-10 AM (TTI = 1.04)
Population Rank: #64 (790,710)
Bakersfield Metropolitan Area
Worst Bottlenecks
Overall Congestion
Travel Time Index1 by Month
LegendGreen = Roads Analyzed
Red = Bottlenecks
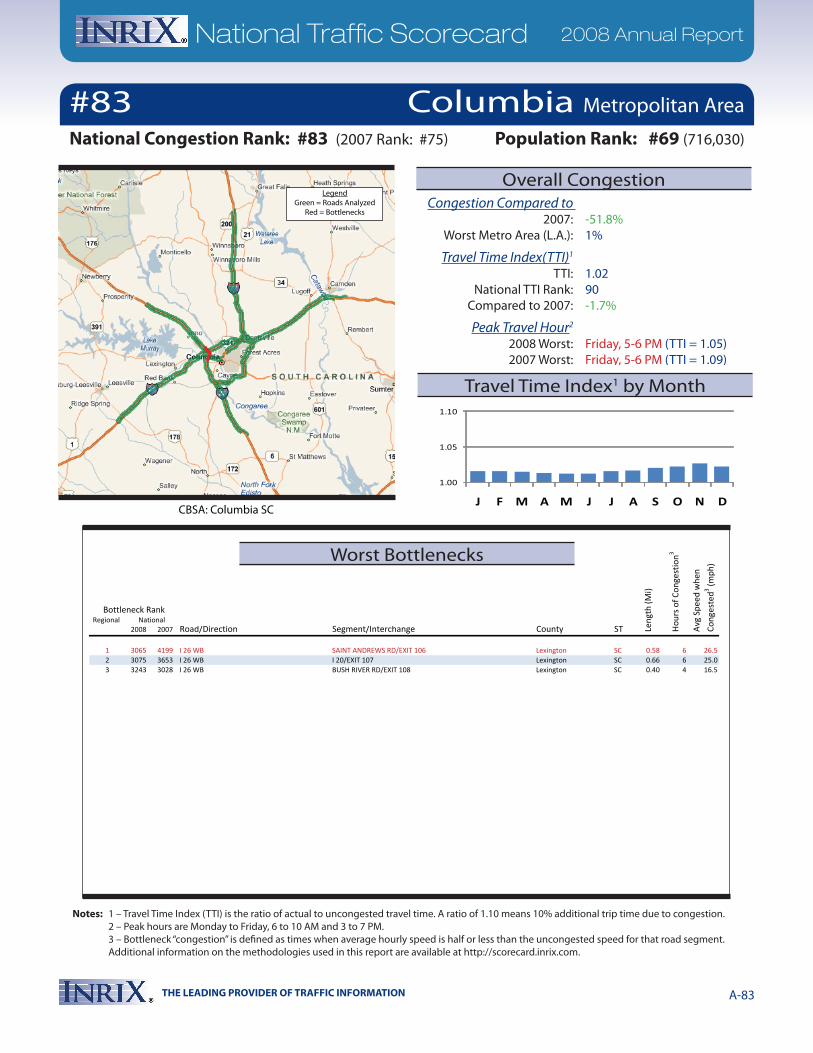
THE LEADING PROVIDER OF TRAFFIC INFORMATION A-83
National Traffic Scorecard 2008 Annual Report
Notes: 1 – Travel Time Index (TTI) is the ratio of actual to uncongested travel time. A ratio of 1.10 means 10% additional trip time due to congestion. 2 – Peak hours are Monday to Friday, 6 to 10 AM and 3 to 7 PM. 3 – Bottleneck “congestion” is defined as times when average hourly speed is half or less than the uncongested speed for that road segment. Additional information on the methodologies used in this report are available at http://scorecard.inrix.com.
Regional 2008 2007 Road/Direction Segment/Interchange County ST
Bottleneck Rank
Len
gth
(Mi)
Hou
rs o
f Con
gest
ion3
Avg
Spe
ed w
hen
Con
gest
ed3 (m
ph)
National
1 3065 4199 I 26 WB SAINT ANDREWS RD/EXIT 106 Lexington SC 0.58 6 26.52 3075 3653 I 26 WB I 20/EXIT 107 Lexington SC 0.66 6 25.03 3243 3028 I 26 WB BUSH RIVER RD/EXIT 108 Lexington SC 0.40 4 16.5
1.00
1.05
1.10
J F M A M J J A S O N D
#83National Congestion Rank: #83 (2007 Rank: #75)
CBSA: Columbia SC
Congestion Compared to 2007: -51.8% Worst Metro Area (L.A.): 1%
Travel Time Index(TTI)1
TTI: 1.02 National TTI Rank: 90 Compared to 2007: -1.7%
Peak Travel Hour2
2008 Worst: Friday, 5-6 PM (TTI = 1.05) 2007 Worst: Friday, 5-6 PM (TTI = 1.09)
Population Rank: #69 (716,030)
Columbia Metropolitan Area
Worst Bottlenecks
Overall Congestion
Travel Time Index1 by Month
LegendGreen = Roads Analyzed
Red = Bottlenecks
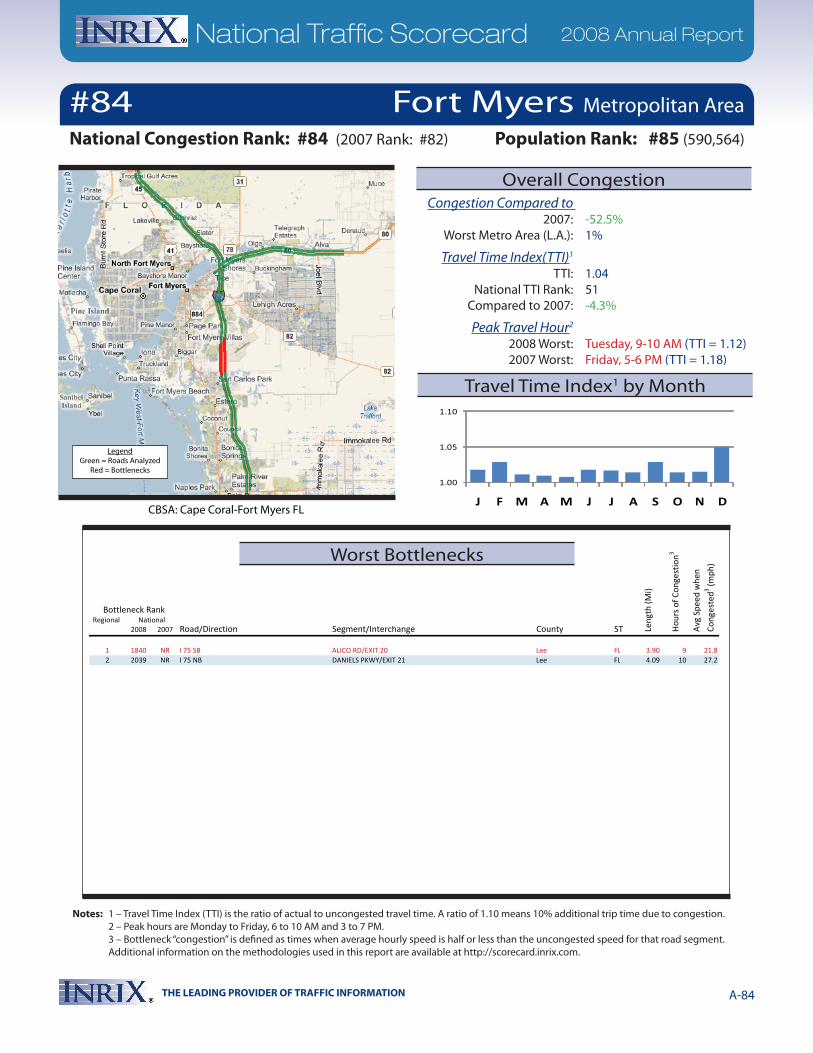
THE LEADING PROVIDER OF TRAFFIC INFORMATION A-84
National Traffic Scorecard 2008 Annual Report
Notes: 1 – Travel Time Index (TTI) is the ratio of actual to uncongested travel time. A ratio of 1.10 means 10% additional trip time due to congestion. 2 – Peak hours are Monday to Friday, 6 to 10 AM and 3 to 7 PM. 3 – Bottleneck “congestion” is defined as times when average hourly speed is half or less than the uncongested speed for that road segment. Additional information on the methodologies used in this report are available at http://scorecard.inrix.com.
Regional 2008 2007 Road/Direction Segment/Interchange County ST
Bottleneck Rank
Len
gth
(Mi)
Hou
rs o
f Con
gest
ion3
Avg
Spe
ed w
hen
Con
gest
ed3 (m
ph)
National
1 1840 NR I 75 SB ALICO RD/EXIT 20 Lee FL 3.90 9 21.82 2039 NR I 75 NB DANIELS PKWY/EXIT 21 Lee FL 4.09 10 27.2
1.00
1.05
1.10
J F M A M J J A S O N D
#84National Congestion Rank: #84 (2007 Rank: #82)
CBSA: Cape Coral-Fort Myers FL
Congestion Compared to 2007: -52.5% Worst Metro Area (L.A.): 1%
Travel Time Index(TTI)1
TTI: 1.04 National TTI Rank: 51 Compared to 2007: -4.3%
Peak Travel Hour2
2008 Worst: Tuesday, 9-10 AM (TTI = 1.12) 2007 Worst: Friday, 5-6 PM (TTI = 1.18)
Population Rank: #85 (590,564)
Fort Myers Metropolitan Area
Worst Bottlenecks
Overall Congestion
Travel Time Index1 by Month
LegendGreen = Roads Analyzed
Red = Bottlenecks
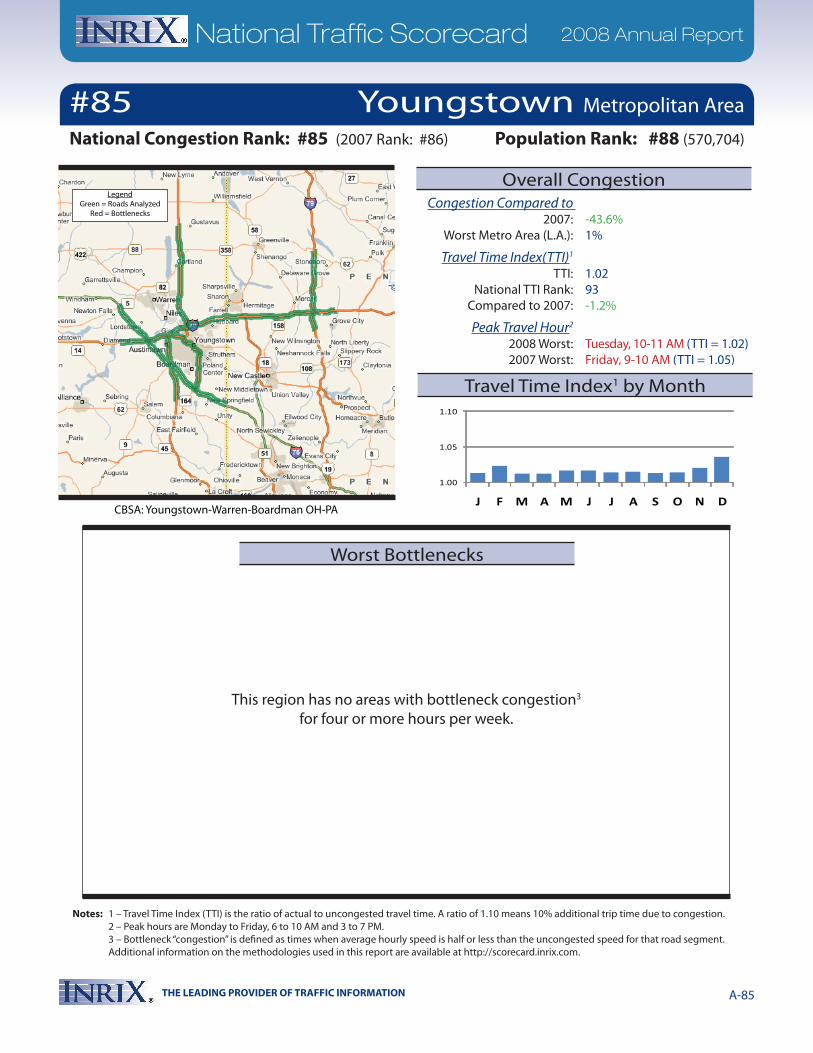
THE LEADING PROVIDER OF TRAFFIC INFORMATION A-85
National Traffic Scorecard 2008 Annual Report
Notes: 1 – Travel Time Index (TTI) is the ratio of actual to uncongested travel time. A ratio of 1.10 means 10% additional trip time due to congestion. 2 – Peak hours are Monday to Friday, 6 to 10 AM and 3 to 7 PM. 3 – Bottleneck “congestion” is defined as times when average hourly speed is half or less than the uncongested speed for that road segment. Additional information on the methodologies used in this report are available at http://scorecard.inrix.com.
This region has no areas with bottleneck congestion3 for four or more hours per week.
1.00
1.05
1.10
J F M A M J J A S O N D
#85National Congestion Rank: #85 (2007 Rank: #86)
CBSA: Youngstown-Warren-Boardman OH-PA
Congestion Compared to 2007: -43.6% Worst Metro Area (L.A.): 1%
Travel Time Index(TTI)1
TTI: 1.02 National TTI Rank: 93 Compared to 2007: -1.2%
Peak Travel Hour2
2008 Worst: Tuesday, 10-11 AM (TTI = 1.02) 2007 Worst: Friday, 9-10 AM (TTI = 1.05)
Population Rank: #88 (570,704)
Youngstown Metropolitan Area
Worst Bottlenecks
Overall Congestion
Travel Time Index1 by Month
LegendGreen = Roads Analyzed
Red = Bottlenecks
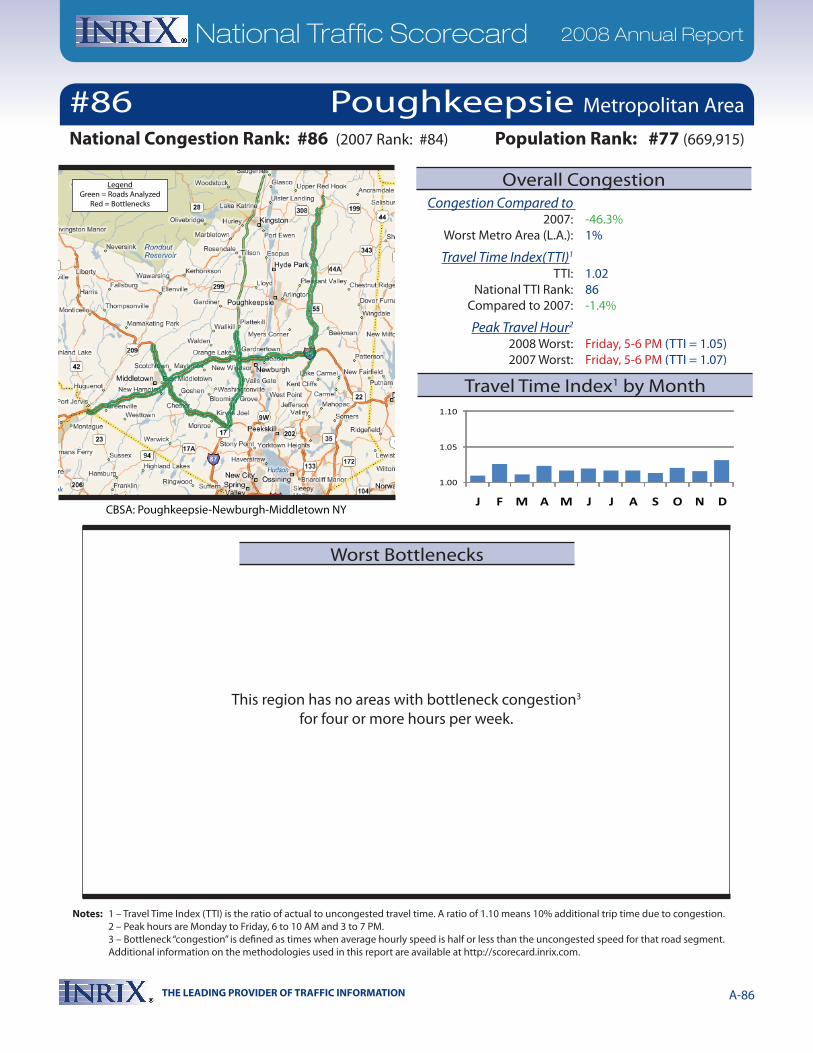
THE LEADING PROVIDER OF TRAFFIC INFORMATION A-86
National Traffic Scorecard 2008 Annual Report
Notes: 1 – Travel Time Index (TTI) is the ratio of actual to uncongested travel time. A ratio of 1.10 means 10% additional trip time due to congestion. 2 – Peak hours are Monday to Friday, 6 to 10 AM and 3 to 7 PM. 3 – Bottleneck “congestion” is defined as times when average hourly speed is half or less than the uncongested speed for that road segment. Additional information on the methodologies used in this report are available at http://scorecard.inrix.com.
This region has no areas with bottleneck congestion3 for four or more hours per week.
1.00
1.05
1.10
J F M A M J J A S O N D
#86National Congestion Rank: #86 (2007 Rank: #84)
CBSA: Poughkeepsie-Newburgh-Middletown NY
Congestion Compared to 2007: -46.3% Worst Metro Area (L.A.): 1%
Travel Time Index(TTI)1
TTI: 1.02 National TTI Rank: 86 Compared to 2007: -1.4%
Peak Travel Hour2
2008 Worst: Friday, 5-6 PM (TTI = 1.05) 2007 Worst: Friday, 5-6 PM (TTI = 1.07)
Population Rank: #77 (669,915)
Poughkeepsie Metropolitan Area
Worst Bottlenecks
Overall Congestion
Travel Time Index1 by Month
LegendGreen = Roads Analyzed
Red = Bottlenecks
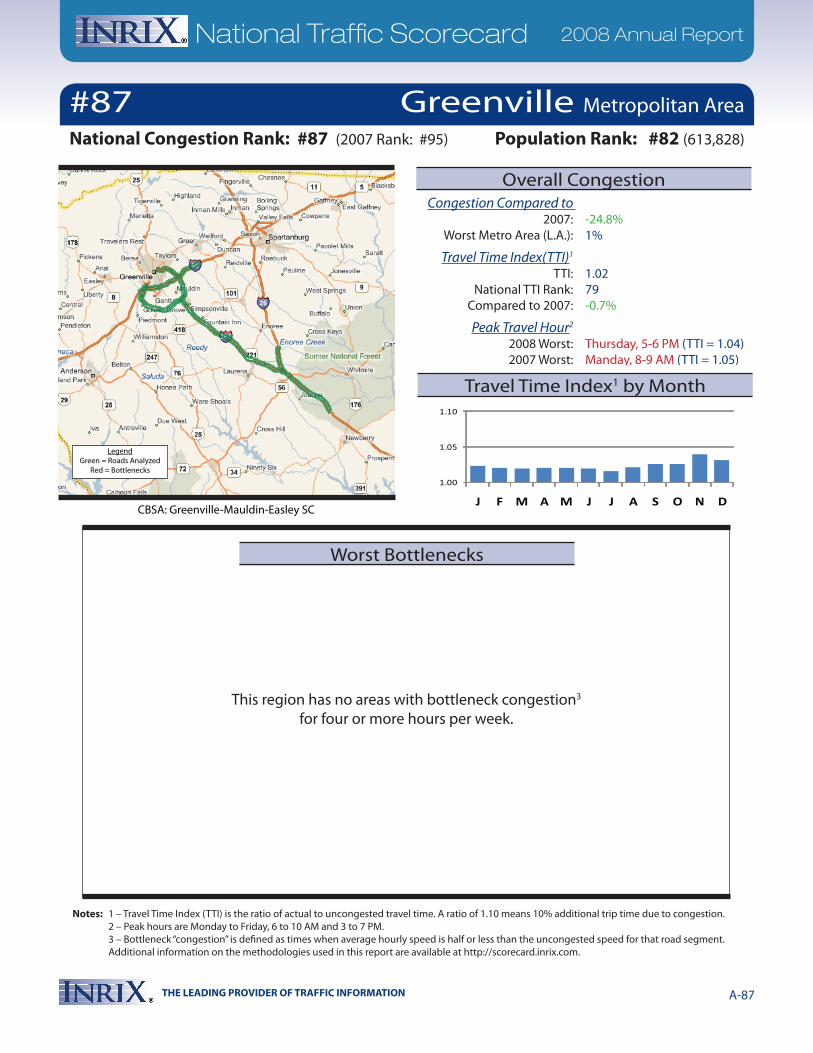
THE LEADING PROVIDER OF TRAFFIC INFORMATION A-87
National Traffic Scorecard 2008 Annual Report
Notes: 1 – Travel Time Index (TTI) is the ratio of actual to uncongested travel time. A ratio of 1.10 means 10% additional trip time due to congestion. 2 – Peak hours are Monday to Friday, 6 to 10 AM and 3 to 7 PM. 3 – Bottleneck “congestion” is defined as times when average hourly speed is half or less than the uncongested speed for that road segment. Additional information on the methodologies used in this report are available at http://scorecard.inrix.com.
This region has no areas with bottleneck congestion3 for four or more hours per week.
1.00
1.05
1.10
J F M A M J J A S O N D
#87National Congestion Rank: #87 (2007 Rank: #95)
CBSA: Greenville-Mauldin-Easley SC
Congestion Compared to 2007: -24.8% Worst Metro Area (L.A.): 1%
Travel Time Index(TTI)1
TTI: 1.02 National TTI Rank: 79 Compared to 2007: -0.7%
Peak Travel Hour2
2008 Worst: Thursday, 5-6 PM (TTI = 1.04) 2007 Worst: Manday, 8-9 AM (TTI = 1.05)
Population Rank: #82 (613,828)
Greenville Metropolitan Area
Worst Bottlenecks
Overall Congestion
Travel Time Index1 by Month
LegendGreen = Roads Analyzed
Red = Bottlenecks
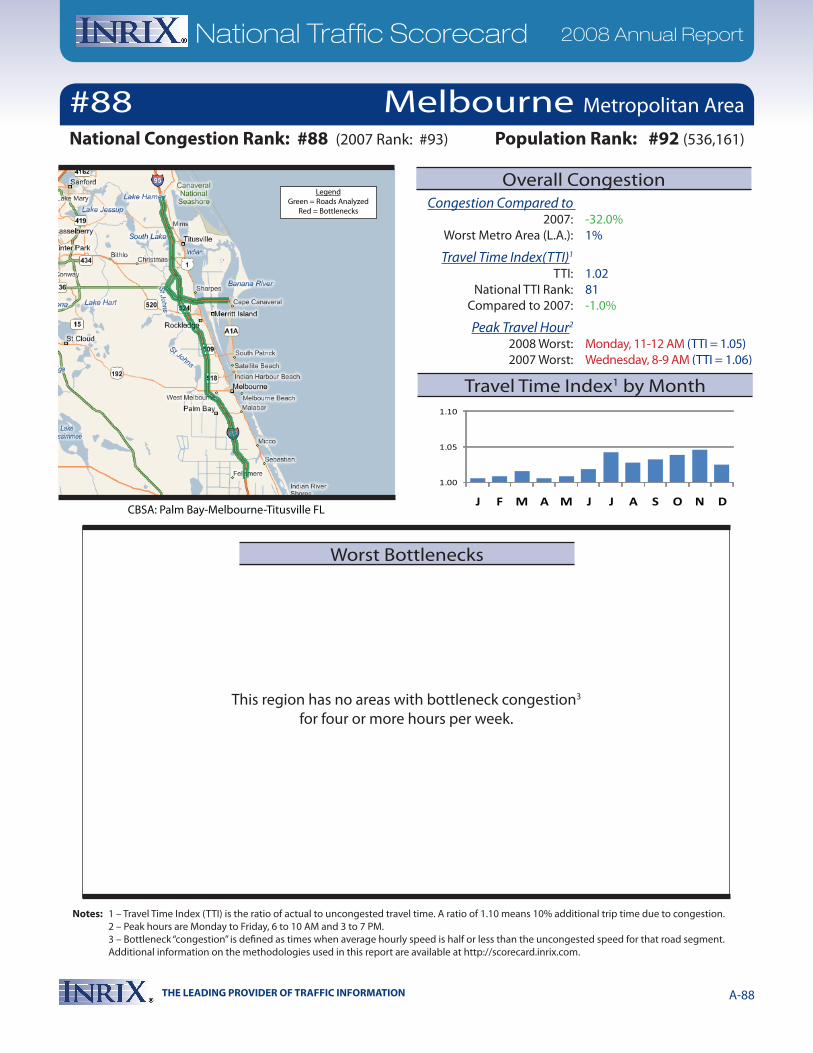
THE LEADING PROVIDER OF TRAFFIC INFORMATION A-88
National Traffic Scorecard 2008 Annual Report
Notes: 1 – Travel Time Index (TTI) is the ratio of actual to uncongested travel time. A ratio of 1.10 means 10% additional trip time due to congestion. 2 – Peak hours are Monday to Friday, 6 to 10 AM and 3 to 7 PM. 3 – Bottleneck “congestion” is defined as times when average hourly speed is half or less than the uncongested speed for that road segment. Additional information on the methodologies used in this report are available at http://scorecard.inrix.com.
This region has no areas with bottleneck congestion3 for four or more hours per week.
1.00
1.05
1.10
J F M A M J J A S O N D
#88National Congestion Rank: #88 (2007 Rank: #93)
CBSA: Palm Bay-Melbourne-Titusville FL
Congestion Compared to 2007: -32.0% Worst Metro Area (L.A.): 1%
Travel Time Index(TTI)1
TTI: 1.02 National TTI Rank: 81 Compared to 2007: -1.0%
Peak Travel Hour2
2008 Worst: Monday, 11-12 AM (TTI = 1.05) 2007 Worst: Wednesday, 8-9 AM (TTI = 1.06)
Population Rank: #92 (536,161)
Melbourne Metropolitan Area
Worst Bottlenecks
Overall Congestion
Travel Time Index1 by Month
LegendGreen = Roads Analyzed
Red = Bottlenecks
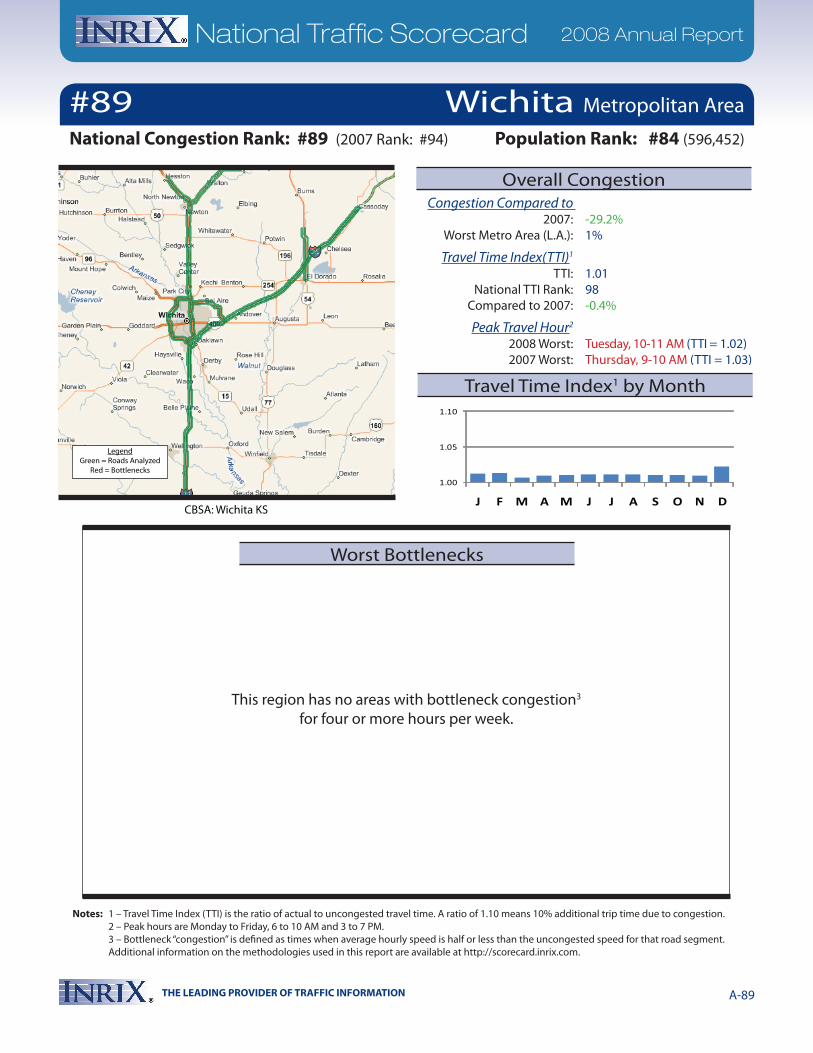
THE LEADING PROVIDER OF TRAFFIC INFORMATION A-89
National Traffic Scorecard 2008 Annual Report
Notes: 1 – Travel Time Index (TTI) is the ratio of actual to uncongested travel time. A ratio of 1.10 means 10% additional trip time due to congestion. 2 – Peak hours are Monday to Friday, 6 to 10 AM and 3 to 7 PM. 3 – Bottleneck “congestion” is defined as times when average hourly speed is half or less than the uncongested speed for that road segment. Additional information on the methodologies used in this report are available at http://scorecard.inrix.com.
This region has no areas with bottleneck congestion3 for four or more hours per week.
1.00
1.05
1.10
J F M A M J J A S O N D
#89National Congestion Rank: #89 (2007 Rank: #94)
CBSA: Wichita KS
Congestion Compared to 2007: -29.2% Worst Metro Area (L.A.): 1%
Travel Time Index(TTI)1
TTI: 1.01 National TTI Rank: 98 Compared to 2007: -0.4%
Peak Travel Hour2
2008 Worst: Tuesday, 10-11 AM (TTI = 1.02) 2007 Worst: Thursday, 9-10 AM (TTI = 1.03)
Population Rank: #84 (596,452)
Wichita Metropolitan Area
Worst Bottlenecks
Overall Congestion
Travel Time Index1 by Month
LegendGreen = Roads Analyzed
Red = Bottlenecks
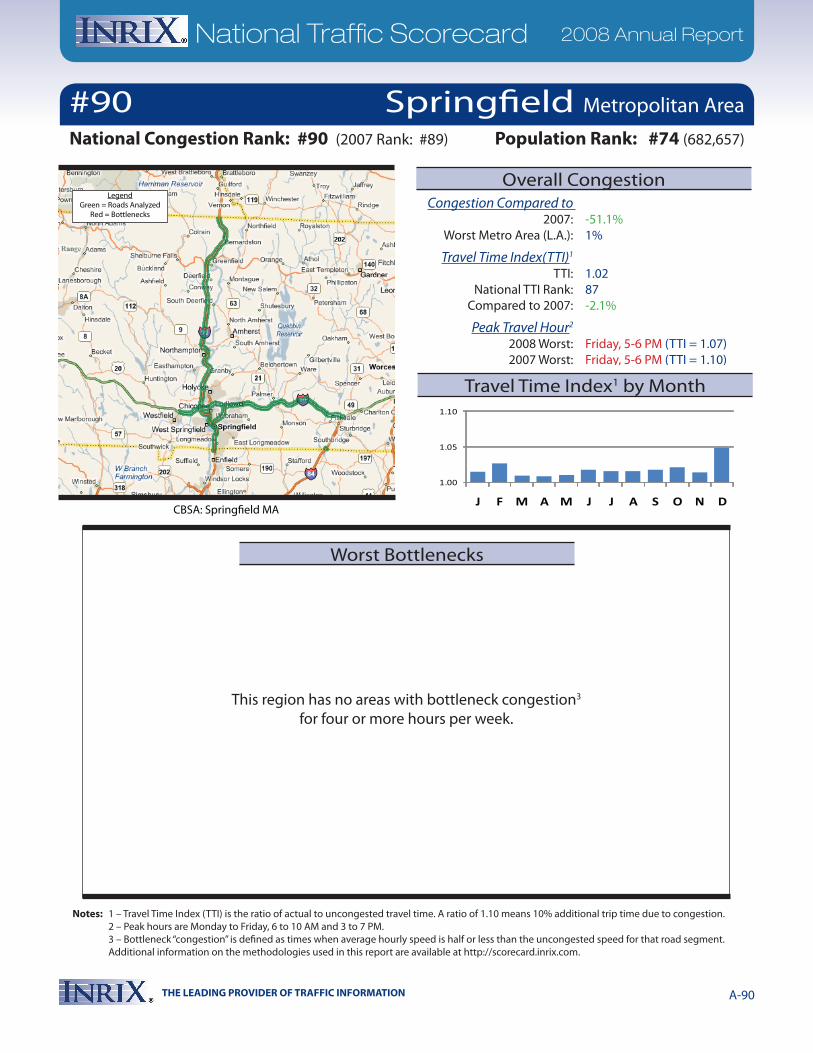
THE LEADING PROVIDER OF TRAFFIC INFORMATION A-90
National Traffic Scorecard 2008 Annual Report
Notes: 1 – Travel Time Index (TTI) is the ratio of actual to uncongested travel time. A ratio of 1.10 means 10% additional trip time due to congestion. 2 – Peak hours are Monday to Friday, 6 to 10 AM and 3 to 7 PM. 3 – Bottleneck “congestion” is defined as times when average hourly speed is half or less than the uncongested speed for that road segment. Additional information on the methodologies used in this report are available at http://scorecard.inrix.com.
This region has no areas with bottleneck congestion3 for four or more hours per week.
1.00
1.05
1.10
J F M A M J J A S O N D
#90National Congestion Rank: #90 (2007 Rank: #89)
CBSA: Springfield MA
Congestion Compared to 2007: -51.1% Worst Metro Area (L.A.): 1%
Travel Time Index(TTI)1
TTI: 1.02 National TTI Rank: 87 Compared to 2007: -2.1%
Peak Travel Hour2
2008 Worst: Friday, 5-6 PM (TTI = 1.07) 2007 Worst: Friday, 5-6 PM (TTI = 1.10)
Population Rank: #74 (682,657)
Springfield Metropolitan Area
Worst Bottlenecks
Overall Congestion
Travel Time Index1 by Month
LegendGreen = Roads Analyzed
Red = Bottlenecks
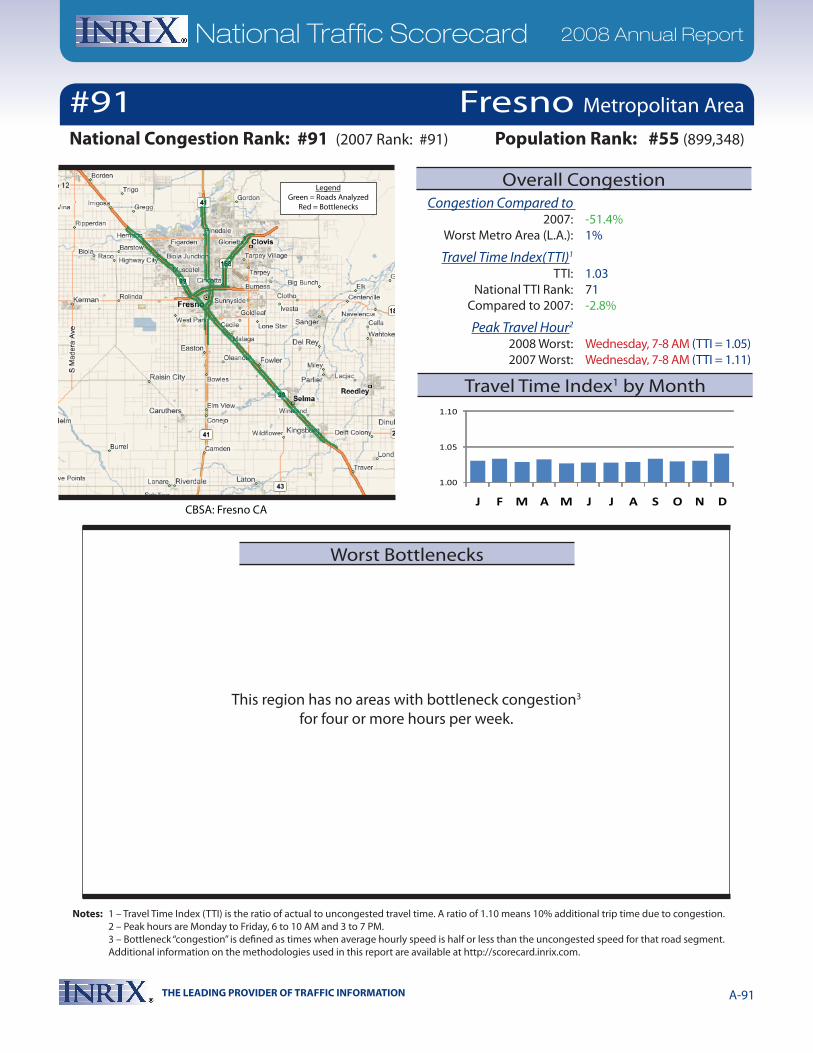
THE LEADING PROVIDER OF TRAFFIC INFORMATION A-91
National Traffic Scorecard 2008 Annual Report
Notes: 1 – Travel Time Index (TTI) is the ratio of actual to uncongested travel time. A ratio of 1.10 means 10% additional trip time due to congestion. 2 – Peak hours are Monday to Friday, 6 to 10 AM and 3 to 7 PM. 3 – Bottleneck “congestion” is defined as times when average hourly speed is half or less than the uncongested speed for that road segment. Additional information on the methodologies used in this report are available at http://scorecard.inrix.com.
This region has no areas with bottleneck congestion3 for four or more hours per week.
1.00
1.05
1.10
J F M A M J J A S O N D
#91National Congestion Rank: #91 (2007 Rank: #91)
CBSA: Fresno CA
Congestion Compared to 2007: -51.4% Worst Metro Area (L.A.): 1%
Travel Time Index(TTI)1
TTI: 1.03 National TTI Rank: 71 Compared to 2007: -2.8%
Peak Travel Hour2
2008 Worst: Wednesday, 7-8 AM (TTI = 1.05) 2007 Worst: Wednesday, 7-8 AM (TTI = 1.11)
Population Rank: #55 (899,348)
Fresno Metropolitan Area
Worst Bottlenecks
Overall Congestion
Travel Time Index1 by Month
LegendGreen = Roads Analyzed
Red = Bottlenecks
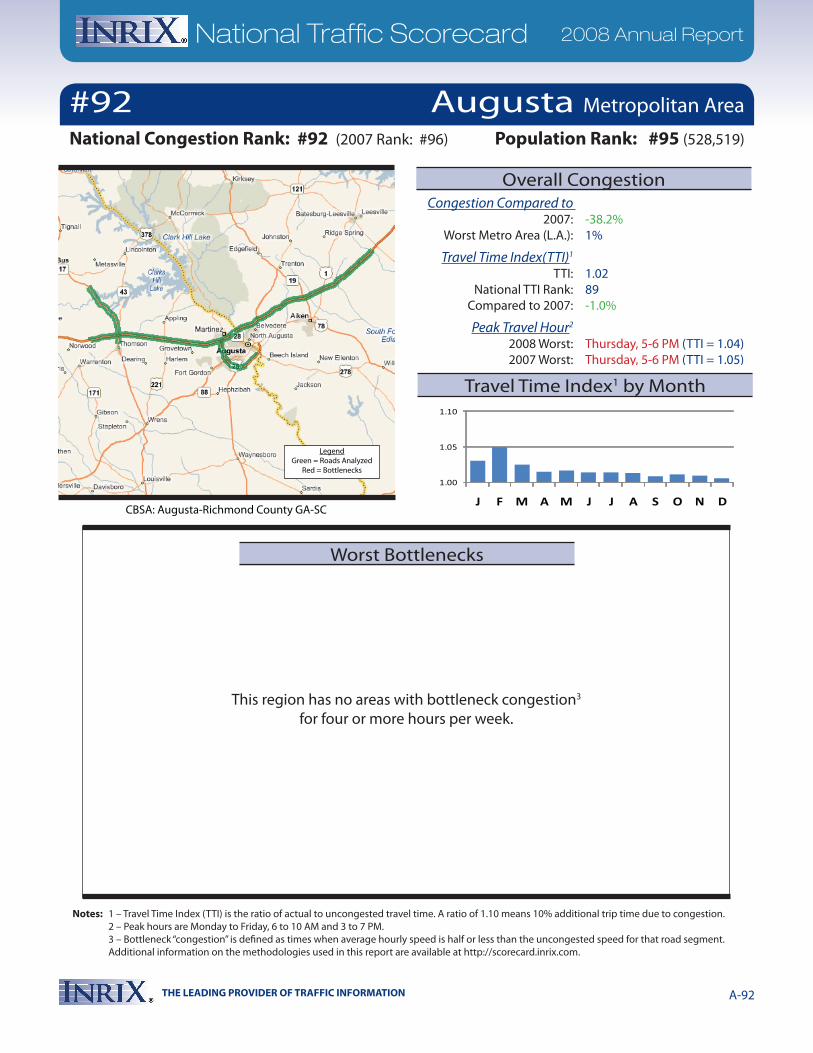
THE LEADING PROVIDER OF TRAFFIC INFORMATION A-92
National Traffic Scorecard 2008 Annual Report
Notes: 1 – Travel Time Index (TTI) is the ratio of actual to uncongested travel time. A ratio of 1.10 means 10% additional trip time due to congestion. 2 – Peak hours are Monday to Friday, 6 to 10 AM and 3 to 7 PM. 3 – Bottleneck “congestion” is defined as times when average hourly speed is half or less than the uncongested speed for that road segment. Additional information on the methodologies used in this report are available at http://scorecard.inrix.com.
This region has no areas with bottleneck congestion3 for four or more hours per week.
1.00
1.05
1.10
J F M A M J J A S O N D
#92National Congestion Rank: #92 (2007 Rank: #96)
CBSA: Augusta-Richmond County GA-SC
Congestion Compared to 2007: -38.2% Worst Metro Area (L.A.): 1%
Travel Time Index(TTI)1
TTI: 1.02 National TTI Rank: 89 Compared to 2007: -1.0%
Peak Travel Hour2
2008 Worst: Thursday, 5-6 PM (TTI = 1.04) 2007 Worst: Thursday, 5-6 PM (TTI = 1.05)
Population Rank: #95 (528,519)
Augusta Metropolitan Area
Worst Bottlenecks
Overall Congestion
Travel Time Index1 by Month
LegendGreen = Roads Analyzed
Red = Bottlenecks
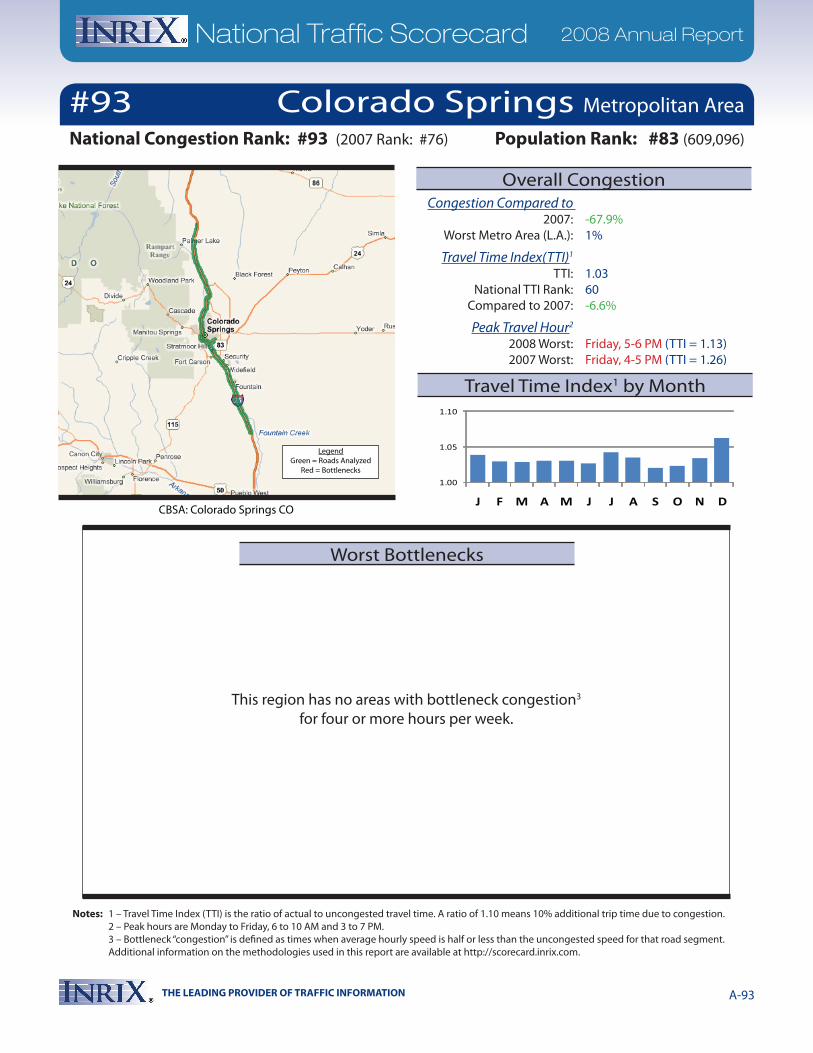
THE LEADING PROVIDER OF TRAFFIC INFORMATION A-93
National Traffic Scorecard 2008 Annual Report
Notes: 1 – Travel Time Index (TTI) is the ratio of actual to uncongested travel time. A ratio of 1.10 means 10% additional trip time due to congestion. 2 – Peak hours are Monday to Friday, 6 to 10 AM and 3 to 7 PM. 3 – Bottleneck “congestion” is defined as times when average hourly speed is half or less than the uncongested speed for that road segment. Additional information on the methodologies used in this report are available at http://scorecard.inrix.com.
This region has no areas with bottleneck congestion3 for four or more hours per week.
1.00
1.05
1.10
J F M A M J J A S O N D
#93National Congestion Rank: #93 (2007 Rank: #76)
CBSA: Colorado Springs CO
Congestion Compared to 2007: -67.9% Worst Metro Area (L.A.): 1%
Travel Time Index(TTI)1
TTI: 1.03 National TTI Rank: 60 Compared to 2007: -6.6%
Peak Travel Hour2
2008 Worst: Friday, 5-6 PM (TTI = 1.13) 2007 Worst: Friday, 4-5 PM (TTI = 1.26)
Population Rank: #83 (609,096)
Colorado Springs Metropolitan Area
Worst Bottlenecks
Overall Congestion
Travel Time Index1 by Month
LegendGreen = Roads Analyzed
Red = Bottlenecks
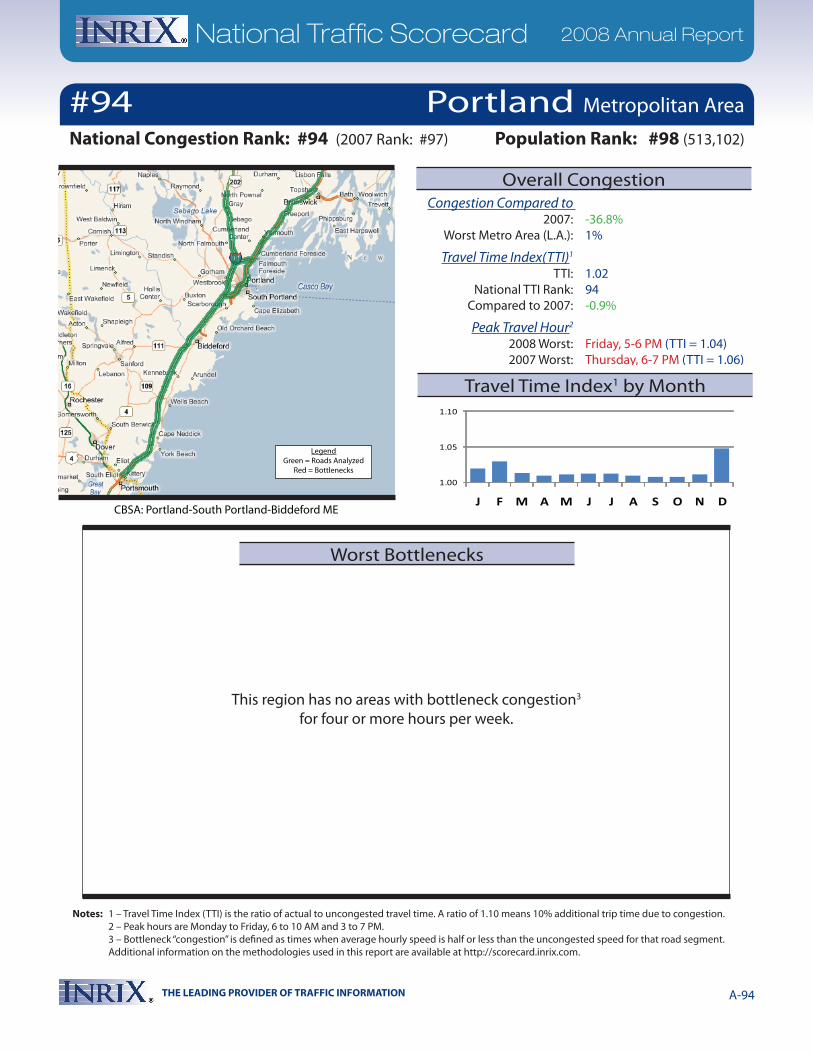
THE LEADING PROVIDER OF TRAFFIC INFORMATION A-94
National Traffic Scorecard 2008 Annual Report
Notes: 1 – Travel Time Index (TTI) is the ratio of actual to uncongested travel time. A ratio of 1.10 means 10% additional trip time due to congestion. 2 – Peak hours are Monday to Friday, 6 to 10 AM and 3 to 7 PM. 3 – Bottleneck “congestion” is defined as times when average hourly speed is half or less than the uncongested speed for that road segment. Additional information on the methodologies used in this report are available at http://scorecard.inrix.com.
This region has no areas with bottleneck congestion3 for four or more hours per week.
1.00
1.05
1.10
J F M A M J J A S O N DCBSA: Portland-South Portland-Biddeford ME
National Congestion Rank: #94 (2007 Rank: #97)
#94
Congestion Compared to 2007: -36.8% Worst Metro Area (L.A.): 1%
Travel Time Index(TTI)1
TTI: 1.02 National TTI Rank: 94 Compared to 2007: -0.9%
Peak Travel Hour2
2008 Worst: Friday, 5-6 PM (TTI = 1.04) 2007 Worst: Thursday, 6-7 PM (TTI = 1.06)
Population Rank: #98 (513,102)
Portland Metropolitan Area
Worst Bottlenecks
Overall Congestion
Travel Time Index1 by Month
LegendGreen = Roads Analyzed
Red = Bottlenecks
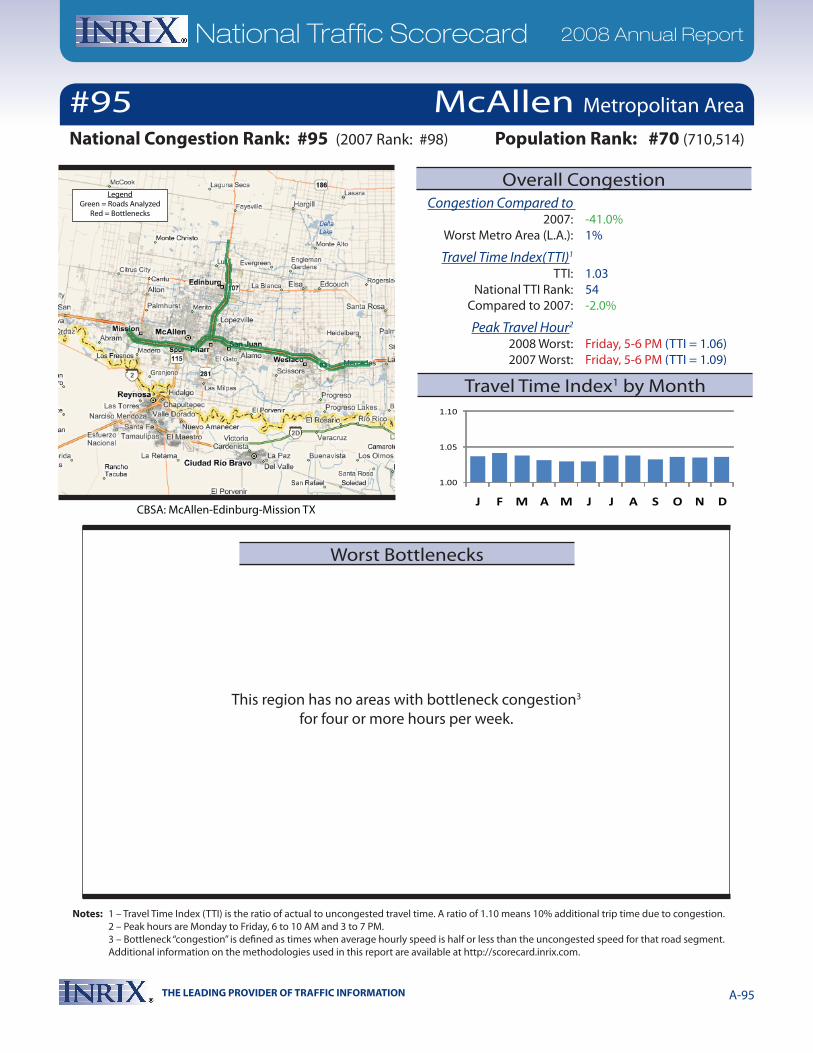
THE LEADING PROVIDER OF TRAFFIC INFORMATION A-95
National Traffic Scorecard 2008 Annual Report
Notes: 1 – Travel Time Index (TTI) is the ratio of actual to uncongested travel time. A ratio of 1.10 means 10% additional trip time due to congestion. 2 – Peak hours are Monday to Friday, 6 to 10 AM and 3 to 7 PM. 3 – Bottleneck “congestion” is defined as times when average hourly speed is half or less than the uncongested speed for that road segment. Additional information on the methodologies used in this report are available at http://scorecard.inrix.com.
This region has no areas with bottleneck congestion3 for four or more hours per week.
1.00
1.05
1.10
J F M A M J J A S O N DCBSA: McAllen-Edinburg-Mission TX
Congestion Compared to 2007: -41.0% Worst Metro Area (L.A.): 1%
Travel Time Index(TTI)1
TTI: 1.03 National TTI Rank: 54 Compared to 2007: -2.0%
Peak Travel Hour2
2008 Worst: Friday, 5-6 PM (TTI = 1.06) 2007 Worst: Friday, 5-6 PM (TTI = 1.09)
National Congestion Rank: #95 (2007 Rank: #98)
#95Population Rank: #70 (710,514)
McAllen Metropolitan Area
Worst Bottlenecks
Overall Congestion
Travel Time Index1 by Month
LegendGreen = Roads Analyzed
Red = Bottlenecks
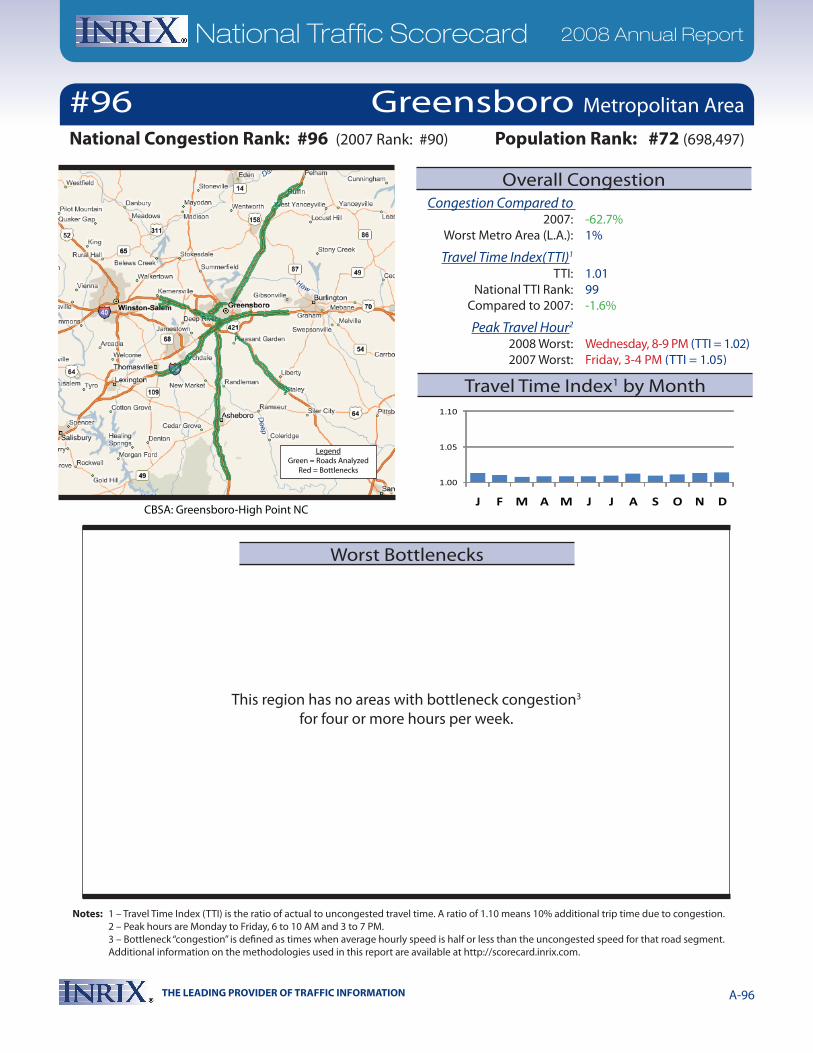
THE LEADING PROVIDER OF TRAFFIC INFORMATION A-96
National Traffic Scorecard 2008 Annual Report
Notes: 1 – Travel Time Index (TTI) is the ratio of actual to uncongested travel time. A ratio of 1.10 means 10% additional trip time due to congestion. 2 – Peak hours are Monday to Friday, 6 to 10 AM and 3 to 7 PM. 3 – Bottleneck “congestion” is defined as times when average hourly speed is half or less than the uncongested speed for that road segment. Additional information on the methodologies used in this report are available at http://scorecard.inrix.com.
This region has no areas with bottleneck congestion3 for four or more hours per week.
1.00
1.05
1.10
J F M A M J J A S O N DCBSA: Greensboro-High Point NC
National Congestion Rank: #96 (2007 Rank: #90)
#96
Congestion Compared to 2007: -62.7% Worst Metro Area (L.A.): 1%
Travel Time Index(TTI)1
TTI: 1.01 National TTI Rank: 99 Compared to 2007: -1.6%
Peak Travel Hour2
2008 Worst: Wednesday, 8-9 PM (TTI = 1.02) 2007 Worst: Friday, 3-4 PM (TTI = 1.05)
Population Rank: #72 (698,497)
Greensboro Metropolitan Area
Worst Bottlenecks
Overall Congestion
Travel Time Index1 by Month
LegendGreen = Roads Analyzed
Red = Bottlenecks
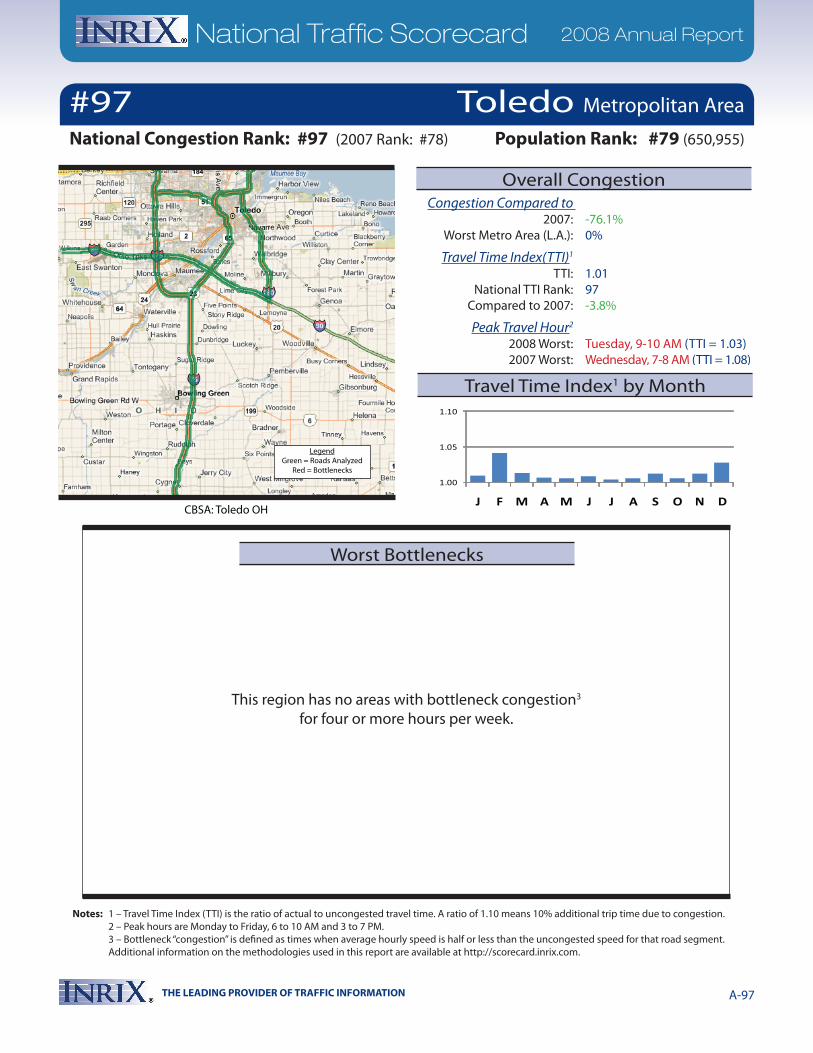
THE LEADING PROVIDER OF TRAFFIC INFORMATION A-97
National Traffic Scorecard 2008 Annual Report
Notes: 1 – Travel Time Index (TTI) is the ratio of actual to uncongested travel time. A ratio of 1.10 means 10% additional trip time due to congestion. 2 – Peak hours are Monday to Friday, 6 to 10 AM and 3 to 7 PM. 3 – Bottleneck “congestion” is defined as times when average hourly speed is half or less than the uncongested speed for that road segment. Additional information on the methodologies used in this report are available at http://scorecard.inrix.com.
This region has no areas with bottleneck congestion3 for four or more hours per week.
1.00
1.05
1.10
J F M A M J J A S O N D
#97National Congestion Rank: #97 (2007 Rank: #78)
CBSA: Toledo OH
Congestion Compared to 2007: -76.1% Worst Metro Area (L.A.): 0%
Travel Time Index(TTI)1
TTI: 1.01 National TTI Rank: 97 Compared to 2007: -3.8%
Peak Travel Hour2
2008 Worst: Tuesday, 9-10 AM (TTI = 1.03) 2007 Worst: Wednesday, 7-8 AM (TTI = 1.08)
Population Rank: #79 (650,955)
Toledo Metropolitan Area
Worst Bottlenecks
Overall Congestion
Travel Time Index1 by Month
LegendGreen = Roads Analyzed
Red = Bottlenecks
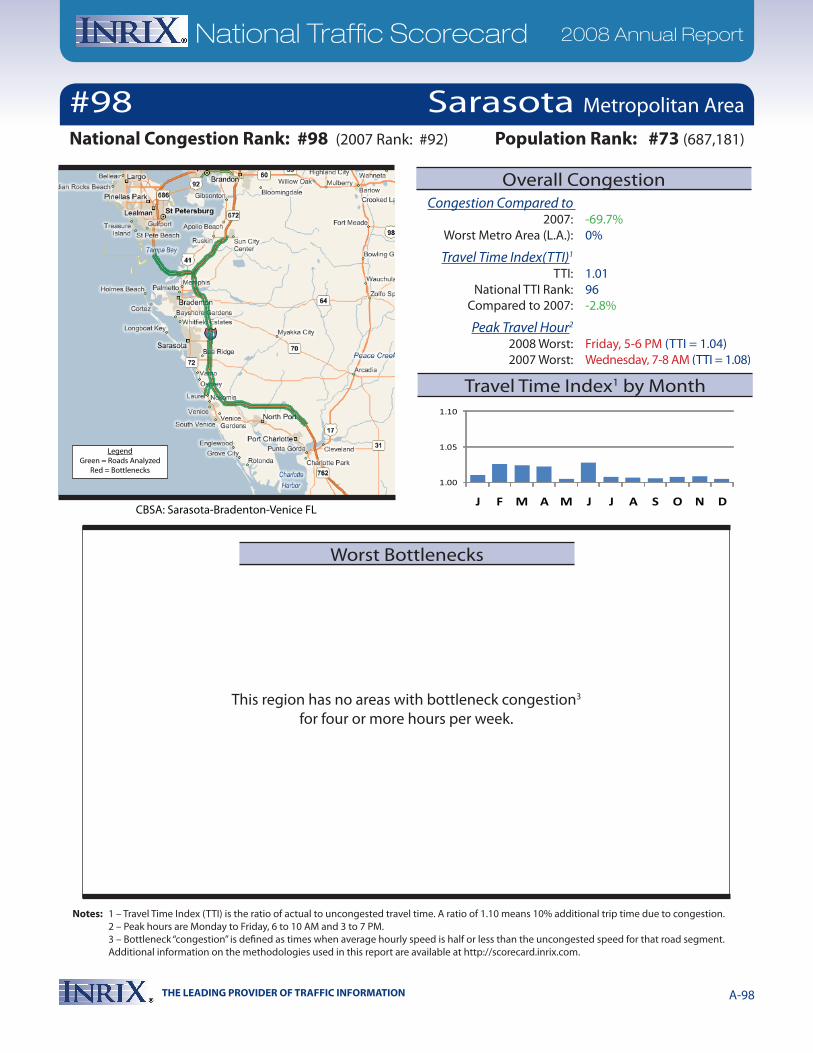
THE LEADING PROVIDER OF TRAFFIC INFORMATION A-98
National Traffic Scorecard 2008 Annual Report
Notes: 1 – Travel Time Index (TTI) is the ratio of actual to uncongested travel time. A ratio of 1.10 means 10% additional trip time due to congestion. 2 – Peak hours are Monday to Friday, 6 to 10 AM and 3 to 7 PM. 3 – Bottleneck “congestion” is defined as times when average hourly speed is half or less than the uncongested speed for that road segment. Additional information on the methodologies used in this report are available at http://scorecard.inrix.com.
This region has no areas with bottleneck congestion3 for four or more hours per week.
1.00
1.05
1.10
J F M A M J J A S O N DCBSA: Sarasota-Bradenton-Venice FL
National Congestion Rank: #98 (2007 Rank: #92)
#98
Congestion Compared to 2007: -69.7% Worst Metro Area (L.A.): 0%
Travel Time Index(TTI)1
TTI: 1.01 National TTI Rank: 96 Compared to 2007: -2.8%
Peak Travel Hour2
2008 Worst: Friday, 5-6 PM (TTI = 1.04) 2007 Worst: Wednesday, 7-8 AM (TTI = 1.08)
Population Rank: #73 (687,181)
Sarasota Metropolitan Area
Worst Bottlenecks
Overall Congestion
Travel Time Index1 by Month
LegendGreen = Roads Analyzed
Red = Bottlenecks
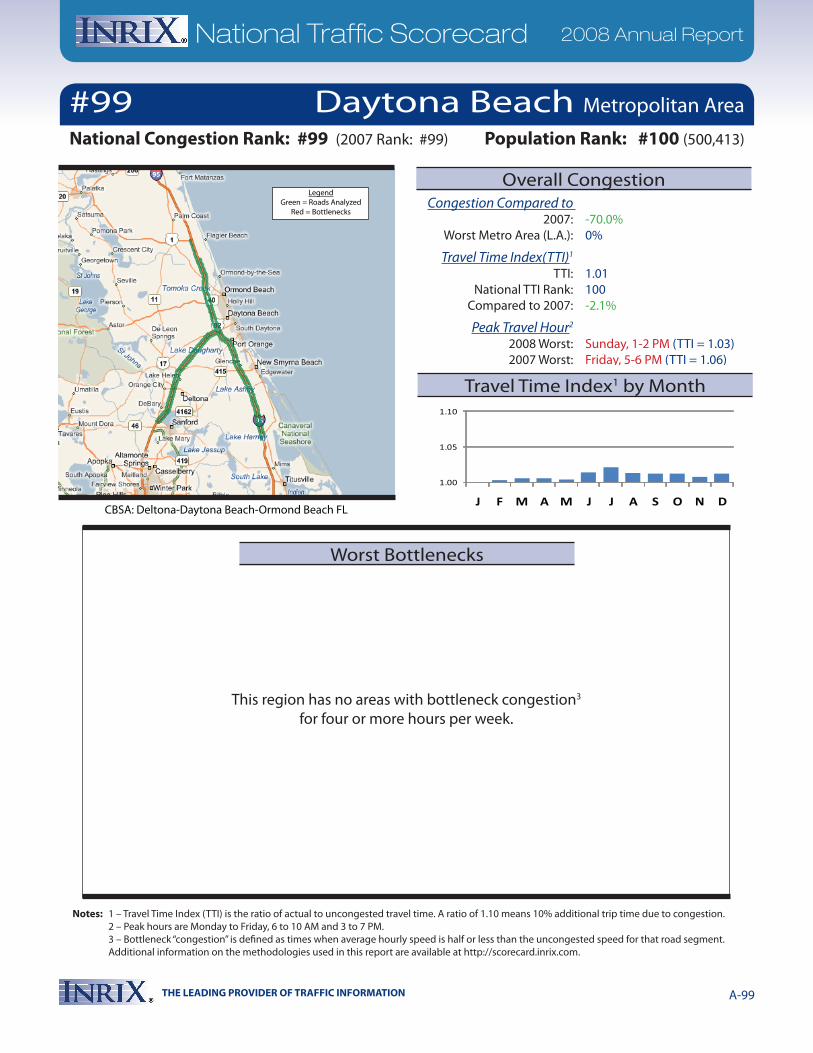
THE LEADING PROVIDER OF TRAFFIC INFORMATION A-99
National Traffic Scorecard 2008 Annual Report
Notes: 1 – Travel Time Index (TTI) is the ratio of actual to uncongested travel time. A ratio of 1.10 means 10% additional trip time due to congestion. 2 – Peak hours are Monday to Friday, 6 to 10 AM and 3 to 7 PM. 3 – Bottleneck “congestion” is defined as times when average hourly speed is half or less than the uncongested speed for that road segment. Additional information on the methodologies used in this report are available at http://scorecard.inrix.com.
This region has no areas with bottleneck congestion3 for four or more hours per week.
1.00
1.05
1.10
J F M A M J J A S O N DCBSA: Deltona-Daytona Beach-Ormond Beach FL
National Congestion Rank: #99 (2007 Rank: #99)
#99
Congestion Compared to 2007: -70.0% Worst Metro Area (L.A.): 0%
Travel Time Index(TTI)1
TTI: 1.01 National TTI Rank: 100 Compared to 2007: -2.1%
Peak Travel Hour2
2008 Worst: Sunday, 1-2 PM (TTI = 1.03) 2007 Worst: Friday, 5-6 PM (TTI = 1.06)
Population Rank: #100 (500,413)
Daytona Beach Metropolitan Area
Worst Bottlenecks
Overall Congestion
Travel Time Index1 by Month
LegendGreen = Roads Analyzed
Red = Bottlenecks
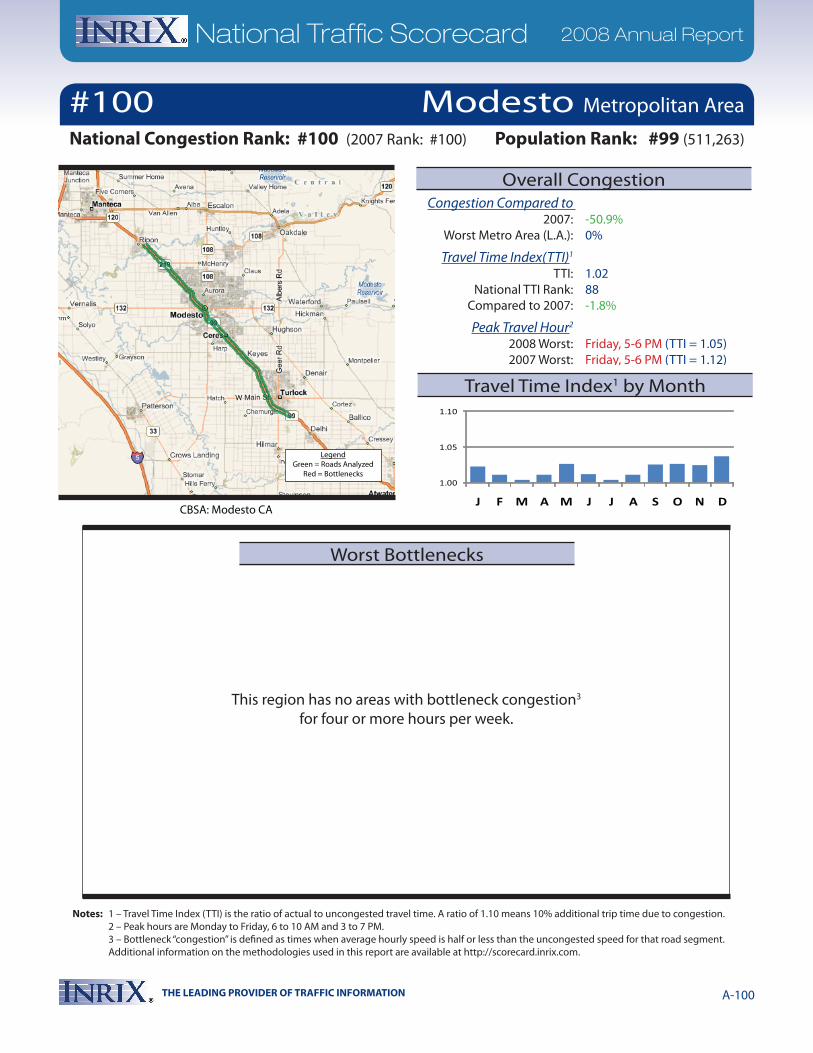
THE LEADING PROVIDER OF TRAFFIC INFORMATION A-100
National Traffic Scorecard 2008 Annual Report
Notes: 1 – Travel Time Index (TTI) is the ratio of actual to uncongested travel time. A ratio of 1.10 means 10% additional trip time due to congestion. 2 – Peak hours are Monday to Friday, 6 to 10 AM and 3 to 7 PM. 3 – Bottleneck “congestion” is defined as times when average hourly speed is half or less than the uncongested speed for that road segment. Additional information on the methodologies used in this report are available at http://scorecard.inrix.com.
This region has no areas with bottleneck congestion3 for four or more hours per week.
1.00
1.05
1.10
J F M A M J J A S O N DCBSA: Modesto CA
National Congestion Rank: #100 (2007 Rank: #100)
#100
Congestion Compared to 2007: -50.9% Worst Metro Area (L.A.): 0%
Travel Time Index(TTI)1
TTI: 1.02 National TTI Rank: 88 Compared to 2007: -1.8%
Peak Travel Hour2
2008 Worst: Friday, 5-6 PM (TTI = 1.05) 2007 Worst: Friday, 5-6 PM (TTI = 1.12)
Population Rank: #99 (511,263)
Modesto Metropolitan Area
Worst Bottlenecks
Overall Congestion
Travel Time Index1 by Month
LegendGreen = Roads Analyzed
Red = Bottlenecks