innovation park - penn state college of engineering park at penn state is an engine of invention and...
TRANSCRIPT

INNOVATION PARK
Innovation Park at Penn State is an engine of invention and a catalyst for job creation. Its mission is to provide space, access to Penn State facilities, and business support services that help companies transfer the knowledge within the University to the market place and to foster economic development. The participating companies have adopted the following motto:
As a community with the same goals and objectives, Innovation Park is a unified collection of businesses. Not only do the companies involved agree on purpose, the buildings that house these companies are unified through appearance. Many different architects and engineers have been involved in Innovation Park, but each project has incorporated characteristics of previous projects to give the park a theme. Much of this has to do with the materials used, but subtle characteristics were used in the redesign of 329 Innovation Boulevard. The following sections look into multiple facades of Innovation Park, explain the materials used, the selection of materials, and present a possible façade design for 329 Innovation Boulevard.
ARCHITECTURAL BREADTH: FAÇADE STUDY PAGE 33 OF 65
“It’s a mindset, a philosophy, a place for creating the future. We’ve taken the academic and research tradition of Penn State and fused it with scientific discovery
and entrepreneurship to create a destination called Innovation Park.”

PAGE 34 OF 65
THE BUILDINGS OF INNOVATION PARK
The center of Innovation Park is occupied by the Penn Stater, which doubles as a conference center and a hotel. The Penn Stater is the biggest attraction of Innovation Park and one of the first builldings built in the park. It set the standard and produced the overall appearance of Innovation Park. The buildings below starting with the top left and going clockwise are as follows:
The Lupert Building, The Penn Stater, The Outreach Building, 328 Innovation Boulevard, and Technology Center
This collection of Innovation Park buildings is a good example of the various materials and schemes present in the park. The primary materials for the façade are red brick, large glass windows and at times ribbon windows, and a common composite material found on many Penn State buildings. Notice how the same materials have created such diverse facades. The materials and themes of these buildings greatly influenced the redesign of the façade of 329 Innovation Boulevard.
*Note: The Images on this Page Will Be Used a Reference for Following Pages*

PAGE 35 OF 65
329 INNOVATION BOULEVARD
The following section will discuss how I came up with the new façade of 329 Innovation Boulevard. First lets start with the original façade for the actual 329 Innovation Boulevard. The image below shows that it closely resembles 328 Innov. Blvd. and rightfully so, fore they have the same designers. Notice how the brick veneer gives the illusion of columns by seperating the windows. This scheme was also used on 328’s façade.
The next image shows the existing façade with the two‐story expansion. The brick veneer expresses the verticality of the building. The cornice also gives a nice accent to the horizontal.

PAGE 36 OF 65 The re‐design of the façade drew inspiration from the buildings of Innovation Park. The images of Innovation Park may be useful when describing the changes made to the façade. Here is an elevation of 329 with my redesign of the façade:
To contrast the verticality expressed in the previous elevation, I chose to express the horizontal. Ribbon windows were used to achieve this. The ribbon windows were inspired by the Outreach Building, which also utilizes ribbon windows. Breaks in the windows were needed so that there are areas to place partitions on the interior. The first and sixth floors used the first and fourth floors’ façade of the actual building. I wanted to keep something constant, and I feel it gives a nice contrast to what is occuring in the middle four floors of the building. The stairwells on the sides of the building got a face‐lift, and the brick was removed and replaced with metal cladding. The Lupert Building served as inspiration for this change. Windows were also added to the wells for natural daylight. The floor plan of 329 is not yet established, but I have used the brick veneer in an attempt to signify that the exterior reflects the appearance of the interior spaces. The brick veneer seperates the building in half, and I am assuming that two or more tenants will occupy the floor. I feel the brick veneer helps indicate multiple tenants per floor.
The following sections will use the new façade and its materials to analyze the moisture and thermal performance of the façade.

PAGE 37 OF 65
THE MATERIALS
As mentioned before, the façade materials used in Innovation Park are brick, glass, and metal cladding.
Brick Glass Metal Cladding
These materials directly affect the thermal comfort of the building. Many studies have shown that these materials alter the effects of the outside climate, and is nicely summed up by the following quote:
The materials’ R‐Value is a numerical representation of a material’s insulation properties. A material will slow the transfer of heat through it, and the larger the R‐Value, the more of an insulator it is. The following diagram and chart will be used to determine the overall R‐Value of the façade:
Wall Diagrams:
“The building envelope separating the indoor space from the outdoor environment has an important role in the passive control because it acts as a modifier of the direct effects of climate variables such as the outdoor temperature, humidity, wind, solar
radiation and rain.”
Dr. Wong Nyuk Hien, 2006
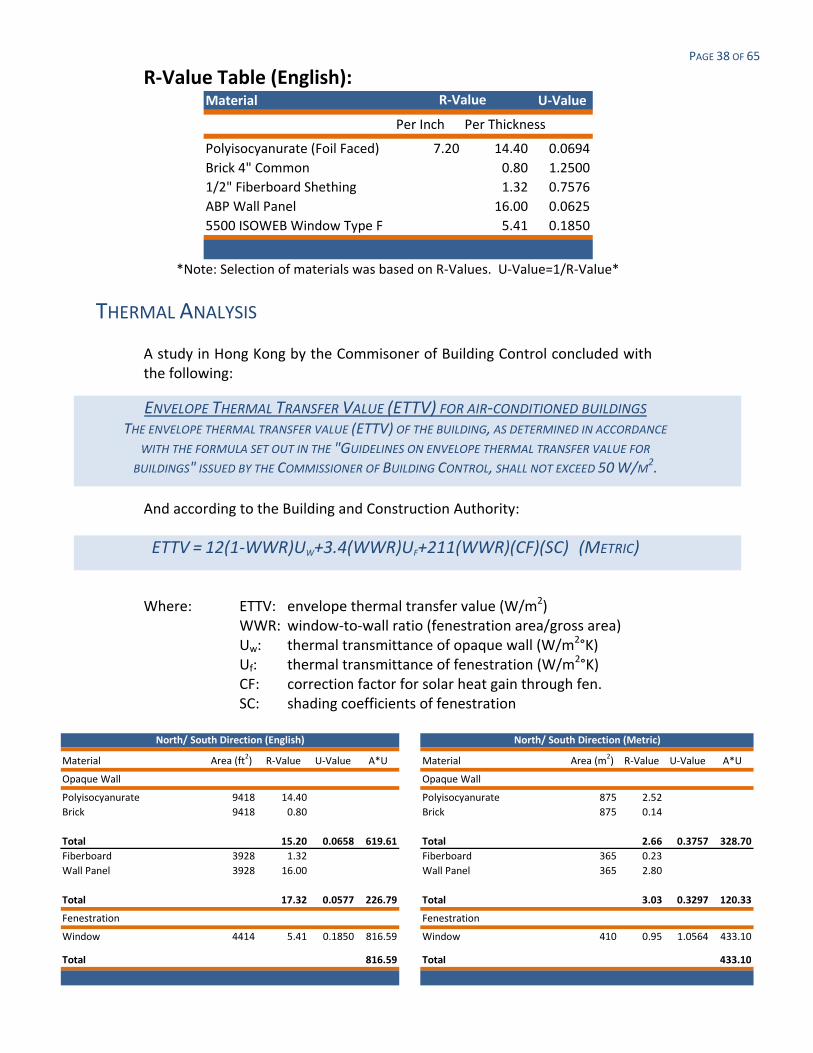
PAGE 38 OF 65 R‐Value Table (English):
Material U‐Value
Per Inch Per Thickness
Polyisocyanurate (Foil Faced) 7.20 14.40 0.0694Brick 4" Common 0.80 1.25001/2" Fiberboard Shething 1.32 0.7576ABP Wall Panel 16.00 0.06255500 ISOWEB Window Type F 5.41 0.1850
R‐Value
*Note: Selection of materials was based on R‐Values. U‐Value=1/R‐Value*
THERMAL ANALYSIS
A study in Hong Kong by the Commisoner of Building Control concluded with the following:
And according to the Building and Construction Authority:
Where: ETTV: envelope thermal transfer value (W/m2) WWR: window‐to‐wall ratio (fenestration area/gross area) Uw: thermal transmittance of opaque wall (W/m2°K) Uf: thermal transmittance of fenestration (W/m2°K) CF: correction factor for solar heat gain through fen. SC: shading coefficients of fenestration
Material Area (ft2) R‐Value U‐Value A*U Material Area (m2) R‐Value U‐Value A*U
Opaque Wall Opaque Wall
Polyisocyanurate 9418 14.40 Polyisocyanurate 875 2.52Brick 9418 0.80 Brick 875 0.14
Total 15.20 0.0658 619.61 Total 2.66 0.3757 328.70Fiberboard 3928 1.32 Fiberboard 365 0.23Wall Panel 3928 16.00 Wall Panel 365 2.80
Total 17.32 0.0577 226.79 Total 3.03 0.3297 120.33
Fenestration Fenestration
Window 4414 5.41 0.1850 816.59 Window 410 0.95 1.0564 433.10
Total 816.59 Total 433.10
North/ South Direction (English) North/ South Direction (Metric)
ENVELOPE THERMAL TRANSFER VALUE (ETTV) FOR AIR‐CONDITIONED BUILDINGS THE ENVELOPE THERMAL TRANSFER VALUE (ETTV) OF THE BUILDING, AS DETERMINED IN ACCORDANCE
WITH THE FORMULA SET OUT IN THE "GUIDELINES ON ENVELOPE THERMAL TRANSFER VALUE FOR
BUILDINGS" ISSUED BY THE COMMISSIONER OF BUILDING CONTROL, SHALL NOT EXCEED 50 W/M2.
ETTV = 12(1‐WWR)UW+3.4(WWR)UF+211(WWR)(CF)(SC) (METRIC)

PAGE 39 OF 65
The square area of windows and R‐Value of them dictated the equation. The first two terms are relatively small, and the third term was used to find the right combination of square area and R‐Value.
MOISTURE ANALYSIS
Condensation may occure on either side of the windows; however, condensation is not necessarily a problem. It will form water on non‐porous materials such as the glass itself, and the metal studs. It may also be absorbed by the porous such as drywall. A problem occurs when sufficient drying does not occur, the safe storage of the materials are exceeded, and when materials susceptible to moisture are used. The following calculations shows how the interior dewpoints were obtained, which would be used for mechanical purposes:
Inside Surface Film C‐Value From ASHRAE: C = 8.3
Rsurface film = 1/8.3 = 0.1205
Surface Temperature Index, TIsurface = Rsurface film/Rtotal = 0.1205/(0.1205 + 0.95) = 0.114
TDewpoint, Interior < TInt – Tisurface (Tint ‐ TExt) Design Values: TInt = 70 °F
Average Temperatures: Winter (Low): TExt = 18 °F Summer (High): TExt = 81 °F Winter: TDewpoint, Interior < 70 + 0.114(70 – 18) < 76 °F Summer: TDewpoint, Interior < 70 ‐ 0.114(70 – 81) < 68 °F The results show that the interior temperature should not climb above 76 °F in the winter and shouldn’t fall below 68 °F in the summer. These temperatures should be taken into consideration for the climate control of the space.
ETTV = 12((328.7 + 120.33)/1650) + 3.4(433.1/1650) + 211(433.1/1650)(0.80)(1.00)
ETTV =48.5 W/M2 < 50 W/M2

PAGE 40 OF 65 STRUCTURAL IMPACT
As is the case for most steel frame structures, the façade is known as a “hanging façade.” The façade itself does not contribute to the structural system, but is connected by numerous means. This means that the structural system is designed to withstand any additive loads of the façade. These loads are very minimal due to the fact that this particular façade is self‐load bearing. The majority of the façade’s load is transferred through itself down to the ground and foundation. For these reasons, it was not necessary to perform a structural analysis of the façade.
CONCLUSIONS
The redesign of 329 Innovation Boulevard was intended to re‐create a façade that still fit the mold of Innovation Park. It used many influences from other buildings and expresses the horizontal rather than the vertical of the previous design. The materials used were the same of the previous system. Therefore, in terms of performance, the selection of manufacturer’s would be the key element. A comfort standard from Hong Kong was used to evaluate the new façade. It dictated the selection of windows and the area the windows occupied. The square footage had to be decreased from a previous design and the best ribbon windows provided by Kawneer were needed. The windows may become a price issue because of this, but the square footage can be reduced until a desired window is achieved. A moisture analysis was performed using the R‐Value of the façade. It was found that the interior temperature should climb above 76 °F in the winter and shouldn’t fall below 68 °F in the summer. If the temperatures happen to decrease or increase past those values, condensation would form. However, condensation is not detramental as long is it is properly taken care of. It does become a problem when the following occurs: when there isn’t sufficient drying, the safe storage of the materials are exceeded, and when materials susceptible to moisture are used. The calculations done show that the façade will not have a strenuous affect on the mechanical system, and is rather efficient. From the 48 W/m2 found before, it can be determined that the North façade losses 5,720 KWhr each month. Allegheny Power prices a Kilowatt Hour at 2.5 cents, which yields a cost of $143. Assuming that the South façade is identical, and a reduction of windows on the East and West, the cost due to energy loss throught the façade should be in the $400 to $500 range.

MECHANICAL REDESIGN INTRODUCTION
Due to the addition of two floors, the mechanical load will increase. The following sections will detail the process of redesigning the mechanical system of 329 Innovation Boulevard. An analysis of the new system will also be provided.
CURRENT MECHANICAL SYSTEM
329 Innovation Boulevard utilizes 14 indoor heat pumps, each with micro‐processor control boards, and four rooftop heat pumps, provided with enthalpy exhange wheels. Heat pumps include a reversing valve and optimized heat exchangers so that the direction of the heat flow may be reversed. The rooftop heat pumps draw the outside air and begin the process of supplying the spaces. Here are some advantages and disadvantages of a heat pump system:
1 Even temperatures2 Comfortable humidity levels in winter 1 Unable to operate at low temperatures, 3 Less noise and odor which requires a back‐up system4 No pilot light or vent5 No seasonable change‐over 2 People find the air supplied to be "cold"6 Only one fuel bill during the winter7 May supply hot water w/ excess heat
Heat Pump Advantages Heat Pump Disadvantages
The rooftop heat pumps provide 4700 CFMs each, whereas two indoor terminal heat pumps located in the lobby supply 900 CFMs, four pumps located at the core on each floor supply 600 CFMs, and the remaining eight pumps (two per floor) supply 1800 CFMs, for a total of 28,000 CFMs supplied. The following calculation shows what percentage of outdoor air is suppied:
% Outdoor Air Supplied = (2)(4,700 CFM)/28,000 CFM = 33.6 %
CFM/SF = 28,000 CFM/(4)(21,000 SF) = 0.33 CFM/SF
Along with other factors, the redesign of the mechanical system will be judged against those values. With a greater total load, the new system will have to supply much more outdoor air to achieve that percentage.
MECHANICAL BREADTH: MECHANICAL REDESIGN PAGE 41 OF 65

PAGE 42 OF 65
NEW MECHANICAL SYSTEM
In an effort to reduce system energy cost and usage, a variable air volume system was selected for the redesign of the mechanical system for 329 Innovation Boulevard. The pie chart below illustrates the breakdown of energy used in commericial buildings:
*Source: Commercial Buildings Energy Consumption Survey
The chart shows that 39% of the energy used in the building goes to heating and cooling. Therefore, an efficient mechanical system will greatly affect the amount of energy used by the building. Since energy costs money, an efficient system will ultimately save the owner money. A VAV system allows each designated zone its own independent control. The system is designed to supply only the volume of conditional air to a space that is needed to satisfy the load.
Much like the heat pumps, VAV systems have multiple advantages and disadvantages.
1 Produces minimal margin of error from 1 Latent heat may cause issues inthe specified desired temperature auditoriums and conference rooms
2 Contributes significantly to the efficiency 2 Minimum outside air requirementsof the system must be met
3 Individually controlled zones (as small as 3 Decreased air temperature may leadindividual rooms) to poor dispersion of the tempered air
4 Little cost added to operational cost to run 4 Little control over pressurizationthe system 5 Equipment located just above the ceiling
5 Requires minimal maintenance can create noise
VAV Advantages VAV Disadvantages
The industry has seen a shift towards VAV systems in office buildings, and while heat pumps may work in the four‐story building, it may be beneficial to use VAV with the expansion.

PAGE 43 OF 65
TRACE® 700 PARAMETERS
The Trace 700 Parameters are largerly based on the programs defaults and values tabulated in the façade study sections.
Internal Loads:
I. People a. Type: General Office Space b. Density: 143 sq ft/person c. Schedule: Cooling Only (Design) d. Sensible: 250 Btu/hr e. Latent: 200 Btu/hr
II. Lightning a. Type: Recessed fluorescent, not
vented, 80% load to space b. Heat Gain: 2 W/sq ft
III. Miscellaneous Loads a. Type: Std. Office Equipment b. Energy: 0.5 W/sq ft
Airflow
I. Ventilation: a. Type: General Office Space b. Cooling: 20 cfm/person c. Heating: 20 cfm/person
Thermostat
I. Thermostat Settings: a. Cooling Dry Bulb: 75 °F b. Heating Dry Bulb: 68 °F c. Relative Humidity: 50 % d. Cooling Driftpoint: 90 °F e. Heating Driftpoint: 55 °F
TRACE® 700 OUTPUTS
MAIN SYSTEM Auxiliary System RoomOutside Cooling Heating Return Exhaust Supply ExhaustAirflow Airflow Airflow Airflow Airflow Airflow Airflow
System Description cfm cfm cfm cfm cfm cfm cfm
System - 001 17,622 145,609 43,891 145,609 17,622 0 0Totals 17,622 145,609 43,891 145,609 17,622 0 0
Note: Airflows on this report are not additive because they are each taken at the time of their respective peaks. To view the balanced system design airflows, see the appropriate Checksums report (Airflows section).
Project Name: 329 Innovation Boulevard TRACE® 700 v4.1 Dataset Name: P:\Thesis\Research\Mechanical Breadth\329 Inn Boul System.trc Alternative - 1 Design Airflow Quantities report page 1
(30% Min Flow Default)
System Type
SYSTEM SUMMARY
By PSUAEDESIGN AIRFLOW QUANTITIES
Variable Volume Reheat
VAV BOX SIZING
The VAV boxes are sized based upon the Cooling Airflow (145,609 cfm) found using Trace. They each should be in the range of 2,000‐3,000 cfm for acoustical reasons. There are two zones per floor, and six floors; therefore, if each VAV box is sized for 3,000 cfm, the following is how many are requried per zone:
# VAV Boxes = 145,609 cfm/(2 Zones)(6 Floors)(3,000 cfm/box) = 4.04

PAGE 44 OF 65 Try 5 Boxes Per Zone:
VAV Box Size (CFM) = 145,609 cfm/(2 Zones)(6 Floors)(5 Boxes/Zone) = 2,430 CFM
Krueger KQFP Ultra‐Quiet VAV units will be used (Total CFM = 2960 > 2430 CFM). The unit size is 7, and the inlet size is 16. The following is a table of the specifications and noise output:
VAV DUCT SIZING
Equation Method: Friction loss can be expressed by the following equation:
Δp = (0.109136 q1.9) / de
5.02
Where: Δp = friction (head or pressure ) (inches water gauge/100 ft of duct) de = equivalent duct diameter (inches) q = air volume flow ‐ (cfm ‐ cubic feet per minute)
And:
de = 1.30 x ((a x b)0.625) / (a + b)0.25)
To achieve a friction value of 0.25, de must equal 16.2” Assume square ducts to start: 16.2 = 1.30 x (a2(0.625)) / (2a)0.25 a = 14.8” ≈ 15.0”
Try 18”x12”: de = 1.30 x ((18 x 12)0.625) / (18 + 12)0.25) = 16.0” ≈ 16.2” OK
ACCORDING TO ENERGY DESIGN RESOURCES “ADVANCED VAV SYSTEM DESIGN BRIEF”:FOR VAV SYSTEM SUPPLY AIR DUCT MAINS, USE A STARTING FRICTION RATE OF 0.25 TO
0.30 IN. PER 100 FT. AT THE AIR HANDLER.

PAGE 45 OF 65 Ductulator Method:
Air Volume: 2,430 CFM Friction Per 100 Feet of Duct: 0.25
Ductulator Checks:
Rectangular Duct Possabilities: 15”x15” 18”x12” 16”x14
Other Ductulator Value: Velocity = 1700 FPM
OUTDOOR SUPPLIED AIR AND VENTILATION RATE ANALYSIS
The following analysis utilizes ASHRAE Standard 62.1‐2007. The standard focuses on ventilation for acceptable air quality. The existing mechanical system was designed for 33% outdoor, whereas the VAV system will be designed for 20%, which is typical of VAV systems. Therefore, each Air Handler Unit outside air flow will be about 10% of the total supply air. The following table utilizes ASHRAE values and equations to find the minimum required primary outdoor airflow for the summation of the different areas in the building:
Occupancy Category Area Occupant Zone People Outdoor Area Outdoor Breathing Zone Primary Outdoor Min. Req'd PrimarySF Density Population Air Rate Air Rate Outdoor Airflow Air Fraction Outdoor Airflow
Office Building Az #/1000 ft2 Pz Rp Ra Vbz Zp Vpz
Office Space 115920 5 580 5 0.06 9855.2 ≤0.15 65701.33Reception Area 7200 30 216 5 0.06 1512 ≤0.15 10080.00Telephone/Data Entry 480 60 29 5 0.06 173.8 ≤0.15 1158.67Main Entry Lobbies 2400 10 24 5 0.06 264 ≤0.15 1760.00
Totals 126000 849 11805
Those values are then used to find the total outdoor air intake values for summation of the different areas in the building and are found in the following table:
Occupancy Category Zone Occupant Uncorrected Outdoor System Ventilation Outdoor AirPopulation Diversity Air Intake Efficiency Intake
Office Building Pz D Vou Ev Vot
Office Space 580 0.683 8936.35 1.0 8936.35Reception Area 216 0.254 706.77 1.0 706.77Telephone/Data Entry 29 0.034 33.75 1.0 33.75Main Entry Lobbies 24 0.028 147.39 1.0 147.39
Equation Method Checks Ductulator Values

PAGE 46 OF 65 The total outdoor air intake is 9,524.26 CFM, which is less than the 17,622 CFM provided. (This value was taken from Trace 700 Output table.) The percentage of outdoor suppy can be found by the following:
% Outdoor Air Supplied = (17,622 CFM)/145,609 CFM = 12.1 %
CFM/SF = 145,609 CFM/(6)(21,000 SF) = 1.16 CFM/SF
If one AHU (Air Handler Unit) is used to supply the air, it must be custom made. Trane designs custom AHUs that are able to supply from 1500 – 200,000 CFM, which is a large enough range to create one AHU for the building. Obviously, more AHUs could be used to lessen to the load, but that would involve the design of connections and coordination of supply ductwork. One AHU may help simplify the design.
CONCLUSIONS
The heat pump system (existing) provides 0.33 CFM/SF, where a typical system supplies around 1.0 CFM/SF. This is because it is a temporary system due to the fact that the tenants are unknown. The heat pumps placed on each floor are labeled as temporary air conditioning units, and are most likely provided for the workers. The ductwork indicate locations for temporary grilles to be removed after tenant fit out. After researching heat pump systems and other possible systems, it was concluded that a VAV system may be more efficient and cost effective. Assuming that the spaces would be used as general offices, Trace was utilized to formulate the design loads. The findings were compared to the values tabulataed using ASHRAE’s Standard 62.1‐2007 and substantially met the requirements.
The cooling design load was found to be 145,609 CFM, and the main system capacity was 327 tons. The spaces were designed as two different zones (assuming two tenants per floor), and each zone is equipped with 5 VAV boxes in an effort to easily regulate the temperature. Krueger KQFP Ultra‐Quiet VAV Unit Size 7 were found to be able to handle the required load. 15”x15” ductwork is able to transfer the air, but 18”x12” and 16”x14” also work, and may be used for architectural finishing purposes. One AHU unit was selected and must be custom made by Trane. Only one was selected to help alleviate coordination problems between AHUs, but multiple AHUs are always possible.
Overall, the VAV system may cost more money upfront (due to installation, custom units, etc.). However, VAV systems have very minimal operational costs and low maintenance is required. So if the owner has the money upfront it may be the way to go. The industry has seen a switch to VAV systems in office buildings over the past five years, as well.