innovation in capital power projects development
TRANSCRIPT

Innovation in Capital Power Projects Development
By: Danie Du Plooy
Date 29 May 2013
Electricity in South Africa – A brief overview of the early years

Electricity in SA – The early years
2013/06/03 3
• The Diamond City, Kimberley, switched on electric
streetlights in 1882 making it the first city in Africa
to be illuminated in this manner. At this time,
London still relied on gas lamps for street lighting.
• The General Electric Power Company Ltd
commissioned a power station at Driehoek (near
Germiston) that first supplied power in 1898.
• The photo on the left hand side depicts a view of
two 500 kW generators at Driehoek. The field
magnets formed part of the flywheel, which was
20 feet in diameter. (Photo: SA Mining Journal,
Mar 1898, p.517).
Information courtesy of the Eskom Heritage website -http://intranet.eskom.co.za/heritage/indexNHR.htm

Early Years - Brakpan power station built by the Victoria Falls Power Company (the VFP) commissioned in September 1908
2013/06/03 4
Generators One at 3 MW, two at 12,5 MW and one at 20 MW
Boilers Eight at 28 000 lb/h, ten at 45 000 lb/h and one at
70 000 lb/h
Compressors Three at 800 hp (driven by piston steam engines)
One at 2 550 hp (driven by a steam turbine)
One at 2 650 hp (driven by a steam turbine)
Completed station with the spray pond in operation
Information courtesy of the Eskom Heritage website -http://intranet.eskom.co.za/heritage/indexNHR.htm

Early Years – Simmerpan, Rosherville & Vereeniging power stations
• By 1915, four VFP thermal power stations Brakpan, Simmerpan, Rosherville and Vereeniging, collectively had a total installed capacity of more than 160 megawatts.
• The following power stations were built during this period:
• Rosherville
• Vereeniging
• The Simmerpan Control Centre was also built during this period.
2013/06/03 5 Information courtesy of the Eskom Heritage website -http://intranet.eskom.co.za/heritage/indexNHR.htm
Rosherville power station
Vereeniging power station
Simmerpan control centre

1923 to 1929 – The Early years of establishment
• The Government Gazette of 6 March 1923 announced the establishment of The Electricity Supply Commission (Escom), effective from 1 March 1923.
• The Commission was made responsible for establishing and maintaining electricity supply undertakings on a regional basis.
• Electricity was to be supplied efficiently, cheaply and abundantly to government departments, railways and harbours, local authorities and industry.
2013/06/03 6
The Electricity Supply Commission (Escom)
Logo
Information courtesy of the Eskom Heritage website -http://intranet.eskom.co.za/heritage/indexNHR.htm

1923 to 1929 - The early years of establishment
• The following power stations were built during this period:
• Witbank
• Salt River
• Congella
• Colenso
• Sabie River Gorge
2013/06/03 7 Information courtesy of the Eskom Heritage website -http://intranet.eskom.co.za/heritage/indexNHR.htm
Witbank power station
Salt River power station Witbank power station

1930 to 1939 – Roots were established
2013/06/03 8 Information courtesy of the Eskom Heritage website -http://intranet.eskom.co.za/heritage/indexNHR.htm
Escom House, the headquarters of the
Electricity Supply Commission from 1937
Klip power station – the first generator was started
in 1936

1940 to 1949 – The years of suffering
• Vaal power Station was the first Escom station to be built in the Orange Free State.
• The station had been planned to have 108 MW of generating plant installed initially, scheduled to be in operation in 1941, and to be extended later to 400 MW, if necessary.
• However, delivery of equipment was delayed and the construction programme seriously delayed by difficulties arising out of World War II (1939-1945).
• When finally completed in 1953, Vaal had 318MW of generating plant installed.
2013/06/03 9
Vaal power station - View of the station that
appears in Eskom Golden Jubilee
Information courtesy of the Eskom Heritage website -http://intranet.eskom.co.za/heritage/indexNHR.htm

1950 to 1959 – The years of growth
• Soaring demand for power challenged Escom in the post-war period. This demand came from industrial growth in the Vaal Triangle (Vereeniging / Vanderbijlpark / Sasolburg) area, on the Witwatersrand, in the big cities and the Northern Transvaal (now known as Northern Province)
• The following power stations were built during this period:
• Vierfontein
• Umgeni
• Hex River
• Highveld
• Taaibos
• Salt river 2
• Wilge
• Komati
• Ingagane
• West bank
2013/06/03 10
Information courtesy of the Eskom Heritage website -http://intranet.eskom.co.za/heritage/indexNHR.htm
Vierfontein power station
Umgeni power station

1960 to 1969 – The years of blossoming…
• More coal-fired power station giants, to be erected in the Eastern Transvaal, were announced in the 1960s.
• The following power stations were built during this period:
• Camden
• Hendrina
• Arnot
• Kriel
• Grootvlei
• Cahora Bassa
2013/06/03 11
Camden power station
Hendrina power station
Information courtesy of the Eskom Heritage website -http://intranet.eskom.co.za/heritage/indexNHR.htm
Cahora Bassa power station

1970 to 1979 – The years of consolidation
• The following power stations were built during this period:
• Van Der Kloof
• Gariep
• Matla
• Duvha
• Koeberg
• Drakensberg
2013/06/03 12
Information courtesy of the Eskom Heritage website -http://intranet.eskom.co.za/heritage/indexNHR.htm
Van Der Kloof power station
Gariep power station Koeberg power station
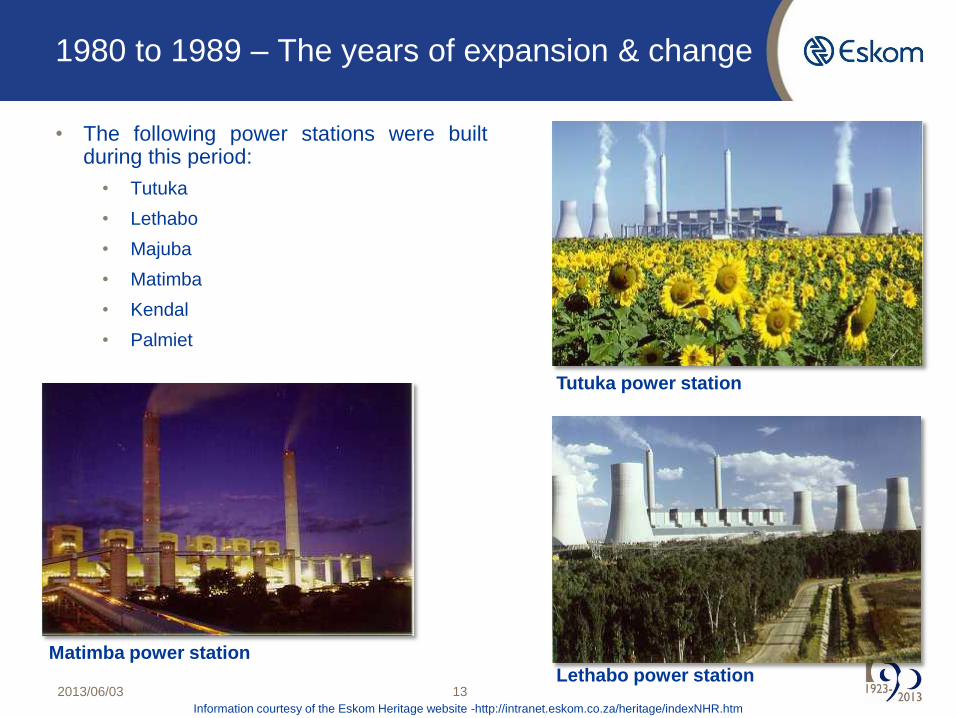
1980 to 1989 – The years of expansion & change
• The following power stations were built during this period:
• Tutuka
• Lethabo
• Majuba
• Matimba
• Kendal
• Palmiet
2013/06/03 13
Information courtesy of the Eskom Heritage website -http://intranet.eskom.co.za/heritage/indexNHR.htm
Tutuka power station
Lethabo power station
Matimba power station

1990 to 1999 – African Renaissance
• Efforts were directed to bring electricity for all. By 1992, almost one million more people were receiving an electricity supply and 260 electrification projects were underway.
• The National Electricity Regulator was established in 1994 to ensure orderly, effective generation and distribution of electricity throughout SA.
• Technology and management agreements where established with Electricité de France and East Midlands Electricity (UK) to ensure long-term improvements in the quality of supply.
• Eskom Enterprises was formed in 1999 to focus on non-regulated business activities in SA and became involved in energy and related services business internationally. This was done on the spirit of President Thabo Mbheki’s vision of an African Renaissance.
• Eskom Development Foundation was launched in 1999 which undertook initiatives such as small business development, community development, electrification of schools and clinics.
2013/06/03 14
Information courtesy of the Eskom Heritage website -http://intranet.eskom.co.za/heritage/indexNHR.htm
Jeff Radebe, Minister of Public
Enterprises, switches on the power in the
Mashigo household in Elandsfontein,
Mpumalanga to celebrate the 1,75
millionth connection.

2000 to 2008 – Our recent past…
• In 2001, Eskom was presented with the award for the Power Company of the Year at the Global Energy Awards ceremony.
• In 2002, the Eskom Conversion Act was signed converting Eskom from a public enterprise into a public company having share capital. The Minister of Public Enterprises, Mr Jeff Radebe, announced the appointment of a Board of Directors for Eskom.
• In 2004, Markinor Sunday Times Top Brands survey identified Eskom as South Africa's most admired brand.
• Higher energy demand caused power outages in 2006/7. The generation capacity reserve margin shrunk between 8% and 10%. President Thabo Mbeki made a public apology in 2007 for government not accepting Eskom's timeous recommendation to build more generating plant to match the country's growth rate.
• Gourikwa and Ankerlig, open-cycle gas turbine stations, were ready to supply power for the winter of 2007.
2013/06/03 15
The State President,
Thabo Mbeki, officially
opened Majuba Power
Station in September
2003.
Gourikwa and Ankerlig
Open-Cycle Gas turbine
stations.

To sustain growth and prosperity, South Africa urgently needs a vast expansion in power generation capacity
South Africa 1994-2008 growth
Real GDP Power capacity (~5 000 MW)
64%
14%
How
do we
keep the
lights
on?
SOURCE: STATS-SA, Eskom website 16

The Eskom value chain and plant mix

Electricity value chain
18

19
Existing plant mix
TOTAL
27 stations
44 115MW
Type Number Nominal capacity
Wind energy 1 station 3 MW
Coal-fired
Gas/liquid fuel turbine
Hydroelectric
Pumped storage
Nuclear
13 stations
4 stations
6 stations
2 stations
1 station
37 715 MW
2 426 MW
661 MW
1 400 MW
1 910 MW

Note:
* Solar PV Plants at Lethabo (0.575MW) & Kendal (0.620MW) are in operation phase
• ~ 17 082MW of new capacity (5 756MW installed and
commissioned) • ~ 4 700km of required transmission network
(3 899.3km installed) • 20 600MVA planned (20 195MVA installed)
New generation capacity and transmission networks 2005–2018
Commissions of new stations
Un
der
Co
ns
tru
cti
on
/
co
mp
lete
In
deve
lop
me
nt
• None • Nuclear–site development and front end planning
• Biomass • Primary Energy
projects (Road & Rail)
• Sere (100MW) • Pilot Concentrated Solar
Power (100MW) • Photovoltaic (Own use*)
• Refurbishment and air quality projects
• 60 Grid strengthening projects
• Komati (1 000MW) • Camden (1 520MW) • Grootvlei (1 180MW)
• 3 700MW
• Medupi (4 764MW) • Kusile (4 800MW)
• 9 564MW
• Ankerlig (1 338.3MW) • Gourikwa (746MW) • Ingula (1 332MW) • Solar PV installations
at MWP (0.4MW)
• 3 518MW (1)
• Arnot capacity increase (300MW)
• Matla refurbishment • Kriel refurbishment • Duvha refurbishment
• 300MW
• 765kV projects • Central projects • Northern projects • Cape projects
• ~ 4 700km
Mpumalanga
refurbishment Return-to-service (RTS) Base load Peaking & renewables Transmission
First unit Last unit
Medupi
Kusile
Ingula
2013
2014
2014
2017
2014
2018
(1) Includes 1.62 MW for Solar PV (MWP, Lethabo & Kendal) Source: Eskom Group Capital Division (Construction Management)
Medupi is the first coal-generating plant in Africa to use supercritical power generation technology
20

Current planned capital expansion plan
Project
Year to 31
March
2013
Year to 31
March
2014
Year to 31
March
2015
Year to 31
March
2016
Year to 31
March
2017
Year to 31
March
2018
Year to 31
March
2019
Total
Grootvlei (return to service) 30 30
Komati (return to service) 200 200
Camden (return to service) 30 30
Medupi (coal fired) 794 794 1 588 794 794 4 764
Kusile (coal fired) 800 800 800 800 1 600 4 800
Ingula (pumped storage) 1 332 1 332
Sere wind farm (renewable) 100 100
Total (MW) 260 894 2 926 2 388 1 594 1 594 1 600 11 256
In addition, Eskom has commenced the development of a 100MW CSP plant
21

22
Kusile and Medupi will be the third and fourth largest coal-fired power plant in the world, respectively,…
Higher than Sandton
City Towers ~
113m
4x more investment than
Gautrain
4x
Medupi
1 = 5 500 existing + 1 600 planned
Coal-fired power plants (MW)
▪ Taichung (Taiwan, 7 1001)
▪ Waigaoqiao (China, 5 000)
▪ Kusile (South Africa, 4 800)
▪ Medupi (South Africa, 4 764)
▪ Zouxian (China, 4 540)
▪ Kendal (South Africa, 4 374)
▪ …
▪ …
1
2
3
4
5
6
7
8

…requiring considerable amounts of materials and large transport effort in their construction
Characteristics of Medupi/ Kusile
Concrete…
▪ … to build 4 Greenpoint stadiums will be
used per plant
Parts and
cement…
▪ …weighing the same as 14 super tankers
will be transported over land
Steel…
▪ …to build one of the world’s tallest
buildings (The Burj Khalifa) will be used
Transport…
▪ …of materials to site is equivalent to at least
40 times around the world
SOURCE: Eskom Build Programme 23

The operation of the plant will demand large amounts of coal and water on a daily basis
Coal
▪ ~40 Olympic pools of coal
will be consumed per day
at Medupi/Kusile
Water
▪ ~30 Olympic pools will be
used for the plant
operation on a daily basis
24

Medupi would …
The programme will fuel demand for relevant graduates and artisans and will grow the wide required skill base
… rapidly grow South Africa‟s supply
of engineers, artisans, R&D and
project management experts
… consume 43% of a year‟s relevant
university graduation (engine-
ering, project planning, etc.)
… deploy 48% of a year‟s output
of artisans
… develop a wide range of additional
skills through ASGI-SA commitments
SOURCE: Eskom Enterprises division and Medupi project 25

Across Medupi, Kusile, and Ingula new employment opportunities will touch the lives of ~160 000 people
On site construction
Supporting project staff
Coal mine expansion
Transmission expansion
Crocodile River expansion
Ongoing operations
Subtotal
DIRECT
INDIRECT Social services +
local business
8 300
2 200
2 100
2 700
3 000
700
~19 000
Total employed
1 700
20 700
x family multiplier
(4/family) x 4
People directly impacted
by Medupi, Kusile & Ingula
~160 000
7 200
600
~12 000
1 700
13 700
4 100
100
~4 500
1 100
5 600
Medupi Kusile Ingula
2 000
200
2 000 300
SOURCE: Eskom Enterprises division and Medupi project
Other projects such as 765kV and
RTS provide
~ 11 000 direct employment
opportunities during construction
and a further
~1 700 during operation
26
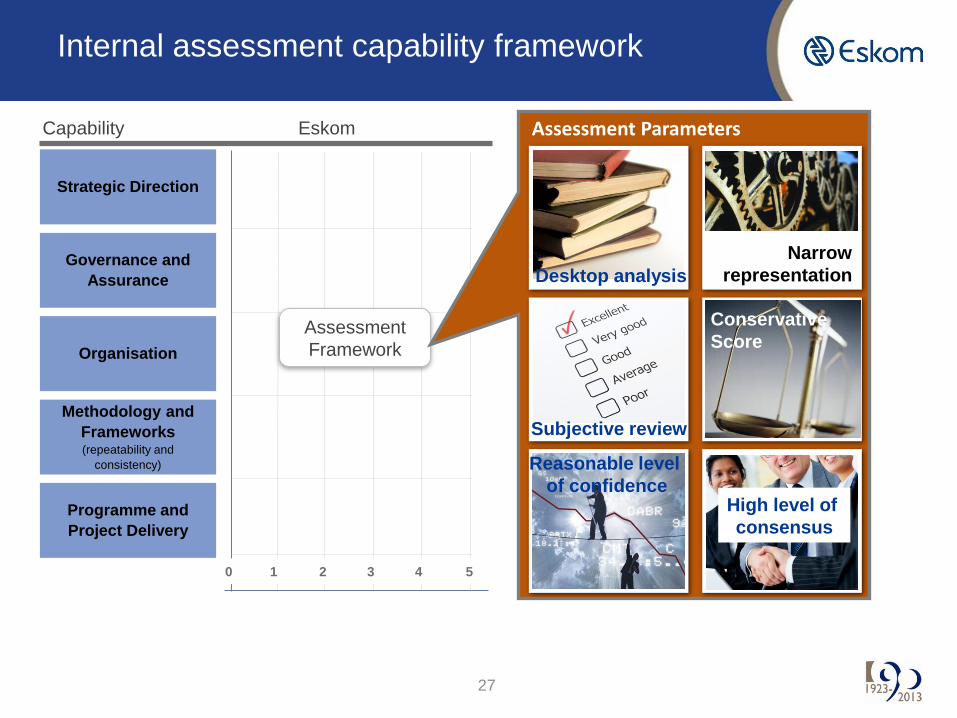
Strategic Direction
Governance and
Assurance
Organisation
Methodology and
Frameworks (repeatability and
consistency)
Programme and
Project Delivery
Capability Eskom
0 1 2 3 4
Internal assessment capability framework
27
5
Assessment
Framework
Assessment Parameters
..... .....
.....
..... .....
Desktop analysis
Subjective review
Reasonable level
of confidence
Conservative
Score
Narrow
representation
High level of
consensus

Were we missing the obvious?
28

Maturity level of the six organisational capabilities
Strategic Direction
Governance and
Assurance
Organisation
Methodology and
Frameworks (repeatability and
consistency)
Programme and
Project Delivery
Capability
29
Eskom
2,9
3,1
3,1
3,3
3,2
0 1 2 3 4
Realising Eskom is still in the process of fully
developing all the required supporting
capability elements, and building the
management experience and competencies
essential for effective project development
and execution from a low base.
5
Average = 3,1
62%

Independent Project Analysis assessments requested
• Organisational Effectiveness Assessment
• The purpose of the Organisational Effectiveness Benchmarking study was to
assess Eskom‟s organisational effectiveness to manage its capital projects
compared to Industry and Best Practice.
• Capital Project System Benchmarking
• IPA measured the effectiveness of project delivery systems presently used within
Eskom by benchmarking a sample of 11 projects conducted by Eskom.

Organisational effectiveness

32
Houston we have a problem

33
We had two choices: pretend everything is ok

34
Let us move the boundaries
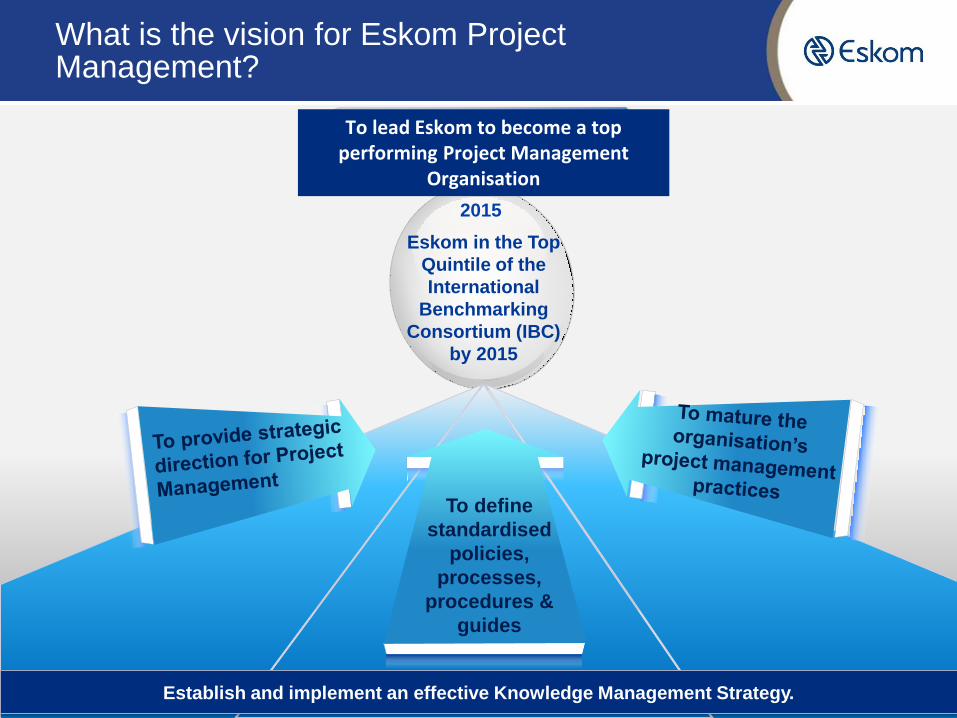
What is the vision for Eskom Project Management?
2013/06/03 35 2013/06/03 PMCoE Presentation
2015
To define
standardised
policies,
processes,
procedures &
guides
To lead Eskom to become a top performing Project Management
Organisation
Eskom in the Top
Quintile of the
International
Benchmarking
Consortium (IBC)
by 2015
Establish and implement an effective Knowledge Management Strategy.

Elements of Capital Effectiveness
Alignment of
Functions
Front-End Loading
Use of Value
Improving Practices
Leading Technology
Technology
Strategy
Business
Strategy
Optimal
Scope for
Business
Needs
Executed
With
Minimum
Change
Timely Involvement of
Contractors/Vendors
Discipline &
Continuity
Fast Cycle
Time
SAFETY
BETTER
IRR
Key Leading Indicators Key Performance Indicators

IPA assessment
17 April 2013 37

2013/06/03 38
CII Project Life Cycle Matrix
Phase
Knowledge Area
Determ
in
e
Reso
urce
req
uirem
en
ts
an
d S
ou
rces
In
den
tify
Co
rp
orate
Ob
jectives
an
d
Develo
p
Pro
ject
Co
ncep
t
Org
an
ize fo
r
Pre-P
ro
ject
Plan
nin
g
Select P
ro
ject
Altern
atives
Develo
p
Pro
ject
Defin
itio
n
Packag
e
Decid
e
wh
eth
er to
Pro
ceed
w
ith
Pro
ject
Develo
p
Detail D
esig
n
Pro
cu
re
Eq
uip
men
t
an
d M
aterials
Co
nstru
ct th
e
Pro
ject
Startu
p
Facility
Man
ag
e
Op
eratio
n o
f
th
e Facility
Mo
nito
r
Op
eratin
g
Co
nd
itio
ns
Evalu
ate
Op
eratin
g
Co
nd
itio
ns
Pro
po
se
Im
pro
vem
en
t
s
Im
plem
en
t
Im
pro
vem
en
t
s
Deco
mm
issio
n
Pu
blicatio
n
Date
01.01 Front End Planning BP - - - - - - - - - -
01.02 Alignment BP - - - - - - - - - - - - - - - - - - - -
02.01 Constructability BP - - - - - - - - - - - - - - - - - - - -
03.01 Materials Management BP - - - - - - - - - - - - - - - - - - - -
05.01 Planning for Startup BP - - - - - - - - - - - - - - - - - - - - - -
07.01 Team Building BP - - - - - - - - - - - - - - - - - - - - - -
07.02 Partnering BP - - - - - - - - - - - - - - - - - - - - - -
08.01 Quality Management BP - - - - - - - - - - - - - - - - - - - - - - - - - - - - - - - -
08.02 Implementation of CII Research BP - - - - - - - - - - - - - - - - - - - - - - - - - - - - - - - -
08.03 Lessons Learned BP - - - - - - - - - - - - - - - - - - - - - - - - - - - - - - - -
08.05 Benchmarking and Metrics BP - - - - - - - - - - - - - -
08.09 Change Management BP - - - - - - - - - -
10.01 Disputes Prevention & Resolution BP - - - - - - - - - - - - - - - - - -
10.06 Project Risk Assessment BP - - - - - - - - - - - - - - - - - -
11.01 Zero Accidents Techniques BP - - - - - - - - - - - - - - - - - -
04 Construction - Other
05 Facility Startup and Operations
09 Project Controls
10 Risk Management
11 Safety, Health, and Environment
13 Globalization Issues
14 Security
06 Human Resources Management
07 Project Organization and Management
08 Business and Project Processes
12 Information Management and Technology Systems
Construction Industry Institute - Project Life Cycle Matrix
01 Project Planning
02 Design Optimization
03 Procurement and Materials Management
Perform Business Planning Perform Pre-Project Planning Execute Project Operate Facility
Primary Application of Information: BP = CII Best Practice P = Practice IN = Information

Eskom is implementing the PDRA to improve project scope definition and the probability for project success
2013/06/03 39
What is the PDRA
The PDRA is a ‘best practice’ procedure and toolset
designed to increase the probability of project
success, by improving the completeness of the
project scope definition, identifying and rectifying
deficiencies early on.
The project definition readiness assessment utilises
the project definition rating index (PDRI) tools
developed by the Construction Industry Institute
(CII), based in the University of Texas, in the USA.
Why use the PDRA
Research by the CII has clearly shown improved
levels of front end planning effort result in significant
cost and schedule savings.[1]
Steps to improve Eskom project success.
Implement the Project Definition
Readiness Assessment (PDRA) and
Team Alignment tools.
Train people to apply the project
definition readiness assessment
procedure and tools.
Develop and embed the project
definition readiness procedure and
toolset solution.
Facilitate project readiness
assessments on all capital
(construction and engineering) projects.
Develop and tailor an Eskom aligned
toolset.
Build a project readiness core
competence and skills base in Eskom.
Comparison of projects with PDRA scores above and below 200 points
Performance PDRA Score
< 200 > 200
Cost 5% below budget 25% over budget
Schedule 13% behind schedule 30% behind schedule
Change Orders 3% of budget 10% of budget
Ref: [1] Construction Industry Institute, Project Definition Rating Index – Infrastructure Projects – Implementation Resource: 268-2

The Project Definition Readiness Assessment assess the readiness of a project to proceed to the next phase
2013/06/03 40
Concept Definition Execution
FEL 2 FEL 3
1st
Project
Readiness
Evaluation
2nd
Project
Readiness
Evaluation
3rd
Project
Readiness
Evaluation
4th
▪Project
Readiness
Evaluation
Independent
Project
Analysis
(IPA) project
evaluation
Project Readiness assessment
methodology and tool applied by the
GCD PMCoE
Phase
Gates
The PMCoE is the Custodian of the
PDRA and will schedule and facilitate the
4 PDRA sessions. This will ensure the
outcome remains independent.
On selected projects, the IPA will
administer an independent front end
loading project evaluation.
This will provide an independent
„qualified‟ assurance evaluation to
funders and other stakeholders.
Evaluations Managed Internally by Group Capital
Internal to
Eskom
Project Health Checks
FEL 1
Phases Pre-Project
Planning
DRA ERA CRA
Examples of projects which the IPA
will be requested to evaluate:
• Projects involving multiple Divisions.
• Projects involving more than 1 Region.
• Projects identified as particularly
complex, and/or strategic

Application of PKHI Assessment Tool
2013/06/03 41 2013/06/03 ▪41 41
IPA
8 Project Practices
- Alignment
- Change Management
- Constructability
- Contracting
- Quality Management
- Safety Practices
- Project Control
- Team Building
5 Project Health
Outcomes
- Cost
- Schedule
- Quality/Operability
- Safety
- Stakeholder Satisfaction
43 Leading Indicators
(Some Examples below)
- Project Team‟s role
- Project Milestones
- Scope Definition
- Supplier Involvement
- Quality Plan
- Safety Standards
- Design Reviews
- People Management matters
- Technology standards
- Key Project Stakeholders
- Organisational Involvement
External IPA Independent Project Readiness Assessment
1st Project
Readiness
Assessme
nt
2nd Project
Readiness
Assessme
nt
3rd Project
Readiness
Assessme
nt
4th Project
Readiness
Assessme
nt
1st Project Key
Health Indicator
(PKHI)
Assessment
Evaluations managed internally by Group Capital
Finalisation

Project Life Cycle Model (PLCM) & Benefit Realisation Management (BRM)
2013/06/03 42
Strawman - Draft DetailsPhases
Stages
Gates Concept designBasic
Design
Detail
DesignInvestment
Board
Authorise to
Execute
Reviews
"Business" Project Strategy Plan Implement Finalise & Close Review
Benefits
RealisatoinBenefits Strategy Benefits statement
Benefits Management
PlanBenefits Realisation Plan
Measure Benefits
Measureables
Identify Benefits realised
throughout Project
Execution
Remediation efforts to be
identified and
implemented to ensure
benefits realisation
OperateOutline Project Definition Develop Alternatives Develop Solution Execute Project Close
ImplementStart-up and
HandoverProject Close
Realise
Benefits
Authorise to Investigate
Alternatives
Authorise to
Develop Solution
Define needIdentify
Alternatives
Develop
Alternatives
Select single
Solution
Develop
Solution
Detail
Engineering
CRA DRA ERA IRA HOA FRA
PDRA 1 PDRA 2 PDRA 3 PDRA 4
1 2 3 4 5 6 7 8 9 10
BR
Proposal Bus. case BR reports BR close-out
report
Value Management lifecycle
Investment lifecycle
Project lifecycle
Asset lifecycle
Benefits Strategy Benefits
Statement
Benefits Mng
Plan
Benefits
Realisation Plan Measure Benefits
Measurables
Identify Benefits
realised @ Project
Execution
Remediation efforts
identify & implement
Valu
e M
an
ag
em
en
t
BRM
Achievements:
Benefits Realization was updated on:
• Portfolio and Programme PCM‟s.
• PLCM Policy.
• Project Delivery Policy.
• Programme management procedure.
Next Steps / Way forward:
• PLCM Rev.10 to be completed by Dec 2013.
• Value management framework to be confirmed end Oct
2012.
• Benefits Realisation Procedure to be completed end Oct
2012.
• Value management & benefits realization artifacts to be
confirmed as per the PLCM (post Oct 2012).
PDRA
External
Review
Review 1 Review 2 Review 3 Review 4 BR
IPA
KHI
Gate Reviews
Checklists

Integration with other “Worlds” in the Organisation
2013/06/03 43
End State
En
gin
ee
rin
g
Pro
cure
ment
En
gin
ee
rin
g
En
gin
ee
rin
g
Oth
er
Strategic Intent Artefact Sanitisation Integration Required
Integration to other “worlds”
Inte
gra
tion I
dentification P
rocess
Detailed Plan

Business PCM‟s PPM & Oracle Centric PCM‟s
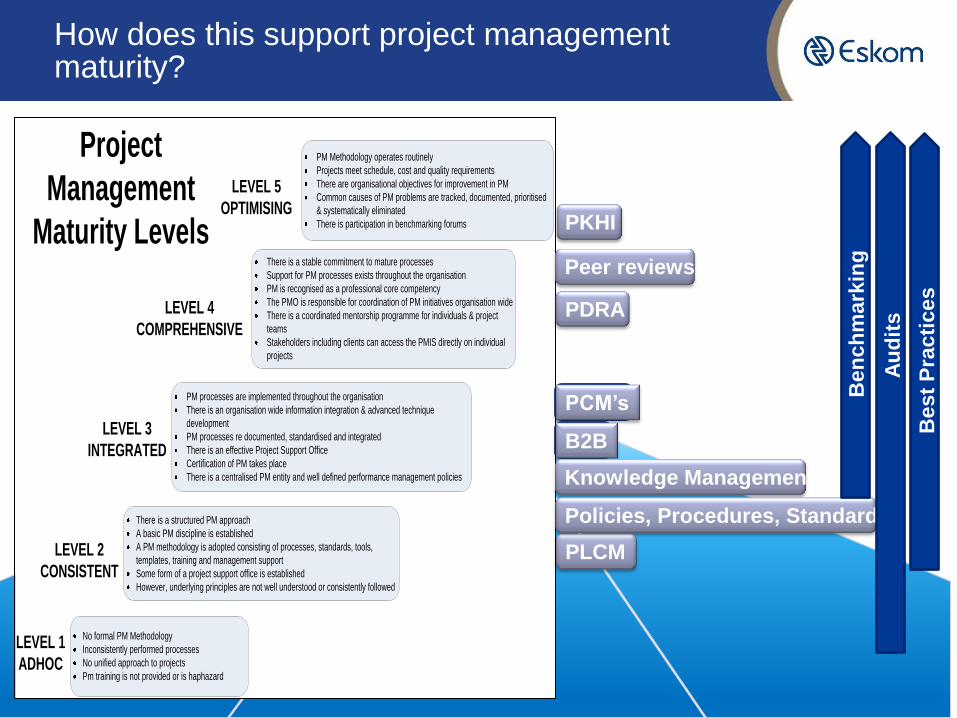
How does this support project management maturity?
No formal PM Methodology
Inconsistently performed processes
No unified approach to projects
Pm training is not provided or is haphazard
LEVEL 1
ADHOC
There is a structured PM approach
A basic PM discipline is established
A PM methodology is adopted consisting of processes, standards, tools,
templates, training and management support
Some form of a project support office is established
However, underlying principles are not well understood or consistently followed
LEVEL 2
CONSISTENT
LEVEL 3
INTEGRATED
PM processes are implemented throughout the organisation
There is an organisation wide information integration & advanced technique
development
PM processes re documented, standardised and integrated
There is an effective Project Support Office
Certification of PM takes place
There is a centralised PM entity and well defined performance management policies
LEVEL 4
COMPREHENSIVE
There is a stable commitment to mature processes
Support for PM processes exists throughout the organisation
PM is recognised as a professional core competency
The PMO is responsible for coordination of PM initiatives organisation wide
There is a coordinated mentorship programme for individuals & project
teams
Stakeholders including clients can access the PMIS directly on individual
projects
LEVEL 5
OPTIMISING
PM Methodology operates routinely
Projects meet schedule, cost and quality requirements
There are organisational objectives for improvement in PM
Common causes of PM problems are tracked, documented, prioritised
& systematically eliminated
There is participation in benchmarking forums
Project
Management
Maturity Levels
PCM’s
B2B
PLCM
PDRA
PKHI
Knowledge Management
Policies, Procedures, Standards
Peer reviews
Au
dit
s
Best
Pra
cti
ces
Ben
ch
mark
ing

Project sizing and classification provides a structured
approach to determine the governance class of project

The “Franschise” deliverable is depicted in our project framework called the Eskom Project Management System (E-PMS)

The Eskom Project Management System (E-PMS) was created using HPUM, PLCM and existing capabilities and processes

Systems selected and implemented
49

Continuous improvement roadmap principles
• Inter-dependant business elements with underlying Eskom values make up organisational effectiveness in line with IPA framework and findings:
• Organisational Structure, people & governance
• Processes and Systems
• Safety (Zero Harm)
Organisational
Structure,
people &
governance
Processes and
Systems
Organisational
Effectiveness
Safety (Zero Harm)
50

Eskom‟s Approach aligns to international best practices and standards
The ‘Eskom Way’
…Eskom’s EPMS & Framework 51 PMCoE - Driving Project Management Excellence

The Next Generation Project Leadership
• People are the driving force for a successful business/project and we therefor need to invest in the enhancement of their capabilities
• A top performing business calls for a „next generation‟ project leader/team that not only
delivers on tangible results (safety, cost, time, quality, etc) but also possess the required „soft skills‟.
• These interpersonal and behavioural „soft skills‟ include:
Managing stakeholders and human resources effectively.
Effectively managing Change and Communication.
Continuously enhancing team effectiveness.
Resolving conflict quickly and effectively.
Having the ability to oversee, negotiate, assign, influence, delegate, coach and mentor.
• The „next generation‟ project leader/team will successfully deliver our programmes and do so with a strong focus on effective leadership, safety and environmental management.
• The next generation project leader will effectively deliver through skills such as systems thinking, adaptability to change , learning agility and dealing with
paradox and ambiguity.
52

Project Management Pledge
“Our commitment is to develop a
Project Management Community
to deliver on the project execution
plan which will make Eskom a
world-class organisation.”
53

Eskom‟s Vision: To be one of the World‟s Top 5 Performing Utilities
54
To be recognised globally as a top performing
organisation, our project delivery capability
should be at the top quintile of performance and
recognised as such globally.
…How do we get there?
Thank you