infographics and other cool tools
TRANSCRIPT
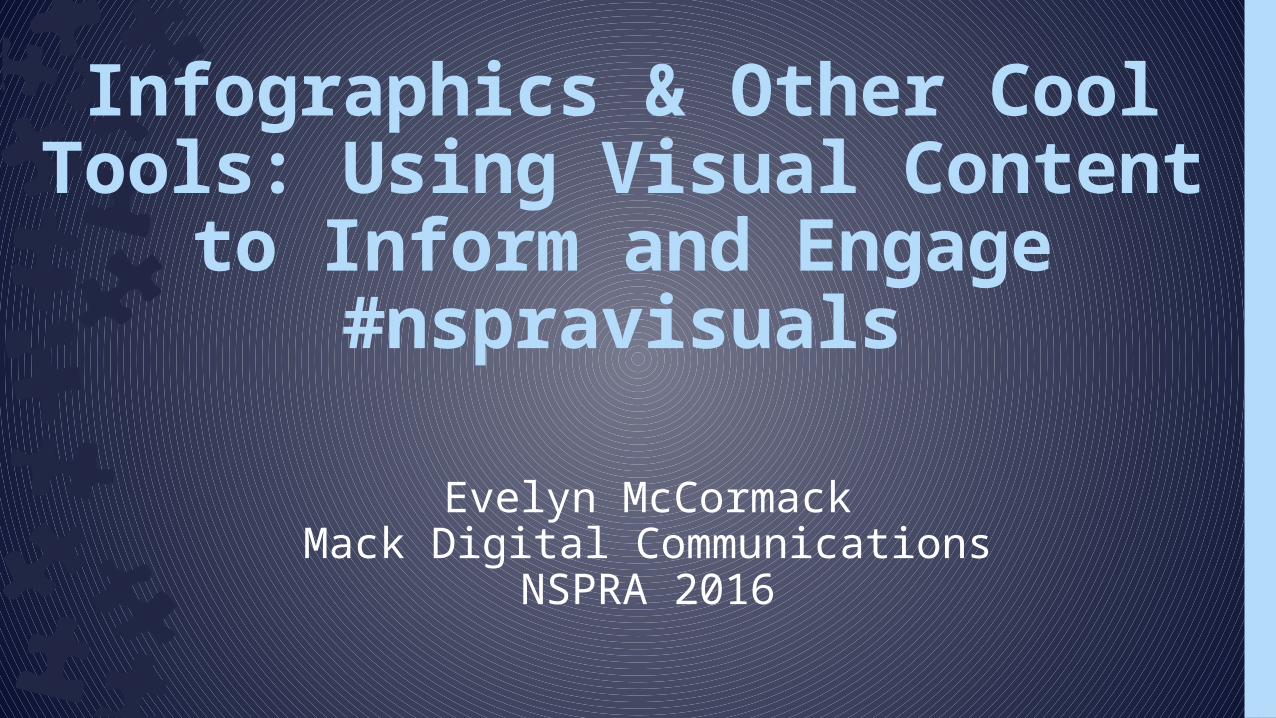
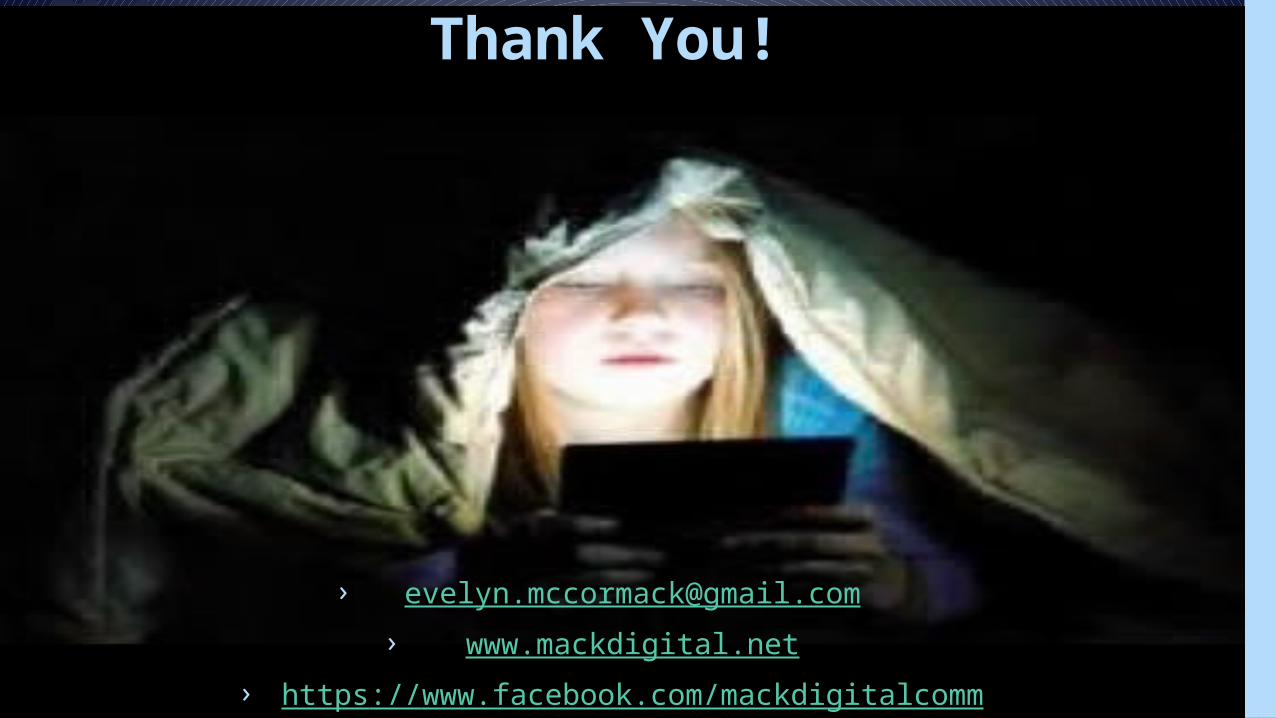
Evelyn McCormackMack Digital Communications
NSPRA 2016
Infographics & Other Cool Tools: Using Visual Content
to Inform and Engage#nspravisuals
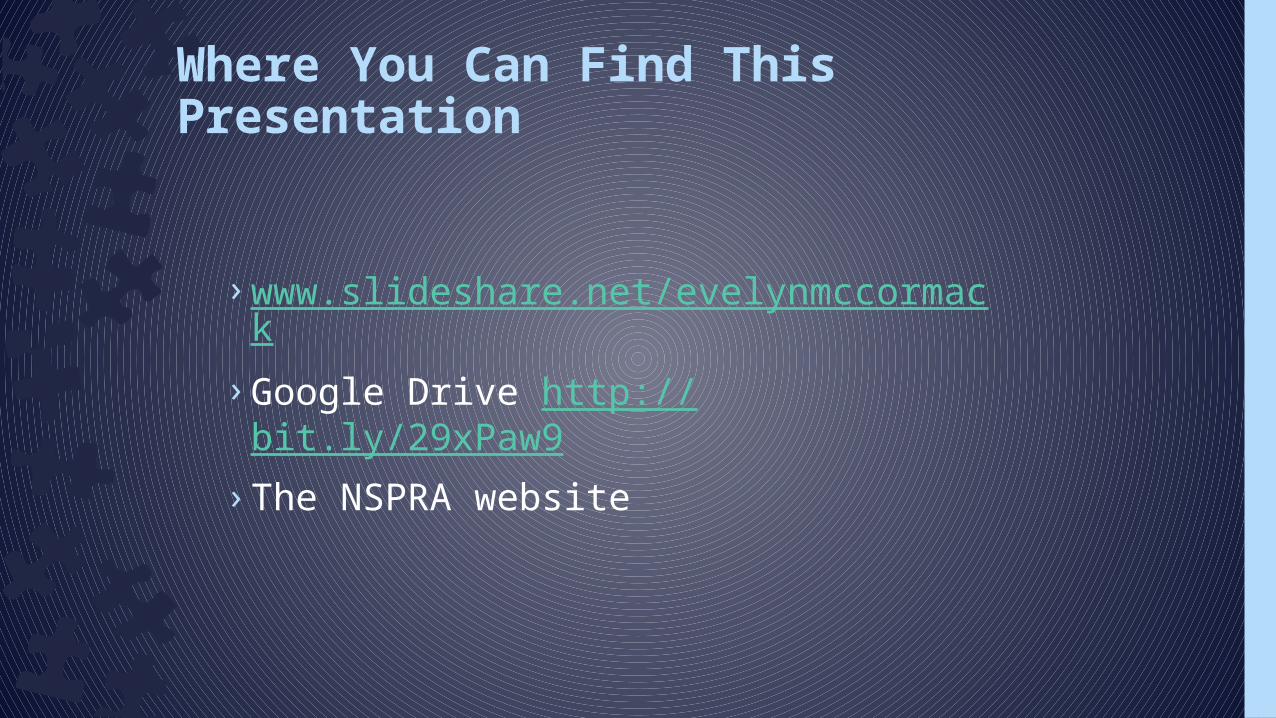
› www.slideshare.net/evelynmccormack› Google Drive http://bit.ly/29xPaw9› The NSPRA website
Where You Can Find This Presentation
› No Adobe Illustrator› No CorelDraw› No Photoshop› No vector images› No designing from scratch
Hello, Non-Designers
I write well and take mediocre photographs. I’m not a designer.

We’re Humans. We Communicate Visually.

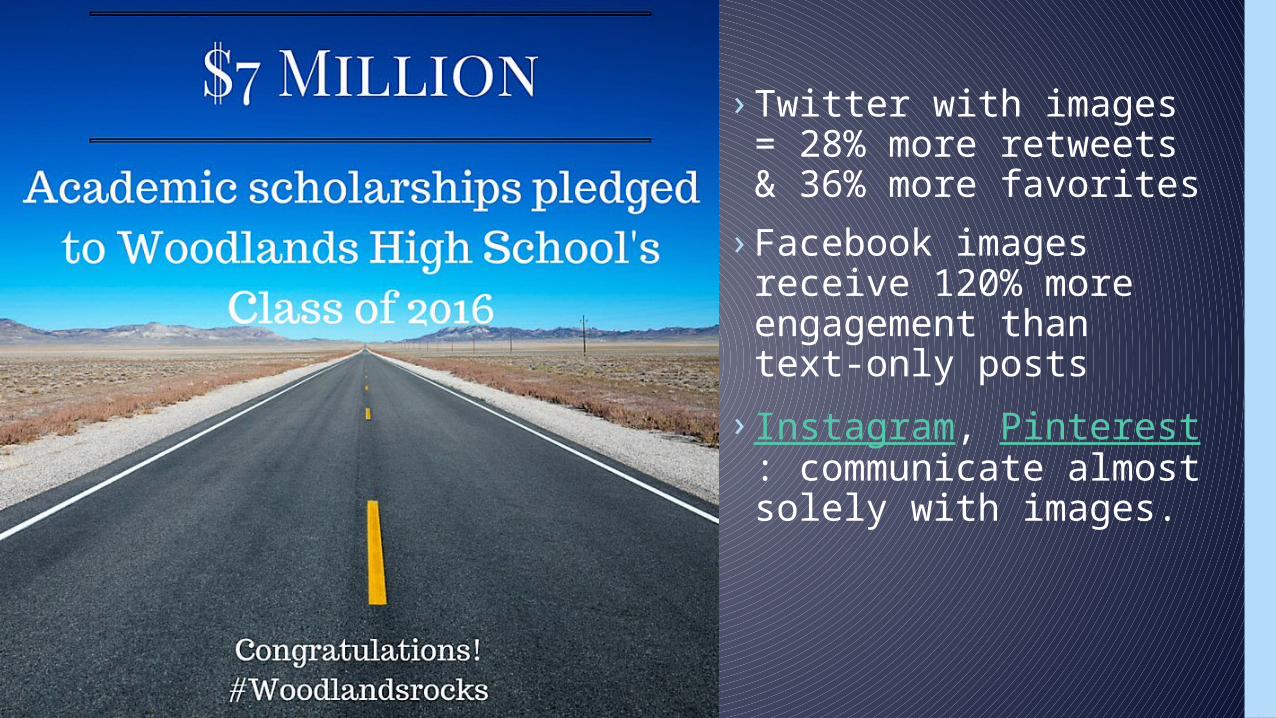
› Twitter with images = 28% more retweets & 36% more favorites
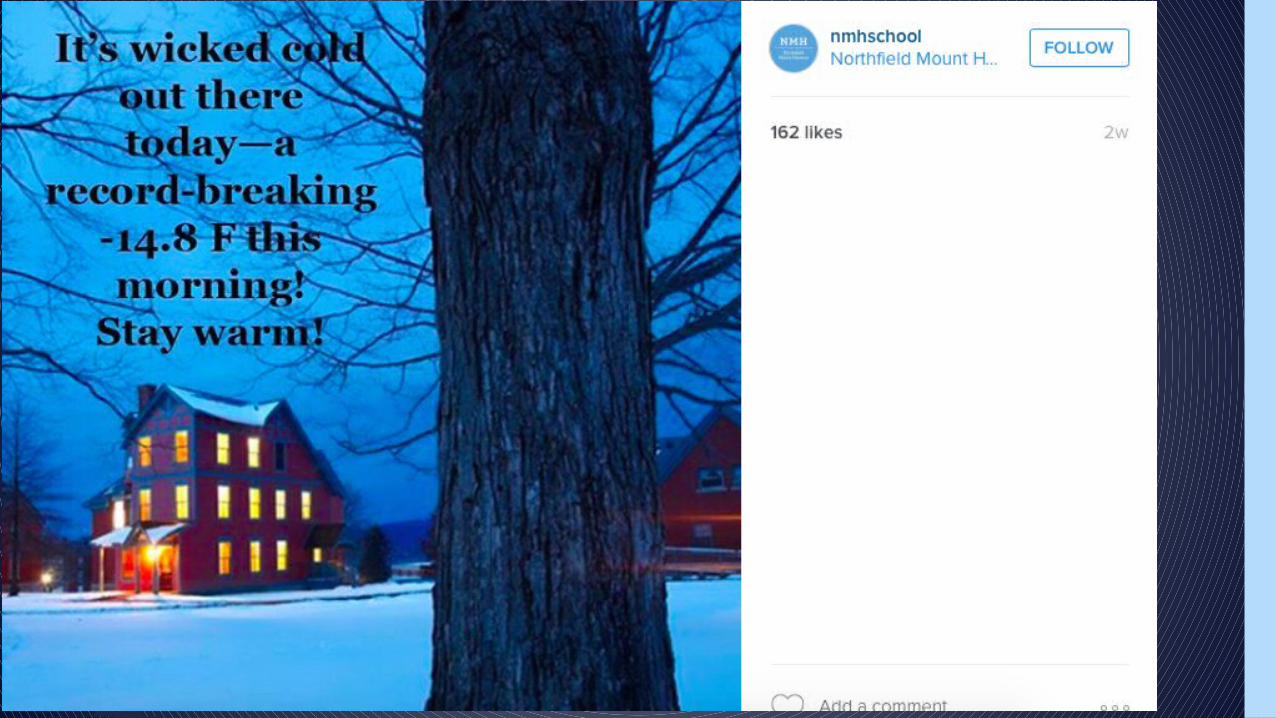
› Facebook images receive 120% more engagement than text-only posts
› Instagram, Pinterest: communicate almost solely with images.
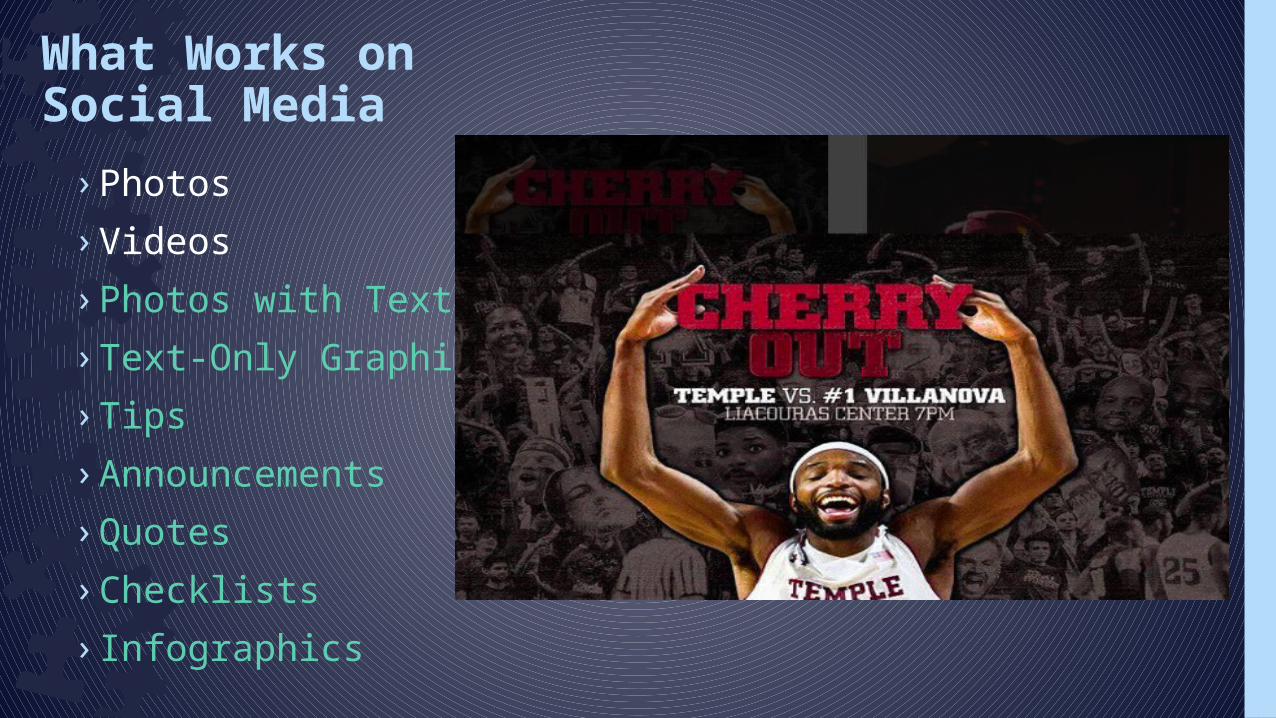
› Photos› Videos› Photos with Text› Text-Only Graphics› Tips› Announcements› Quotes› Checklists› Infographics
What Works on Social Media
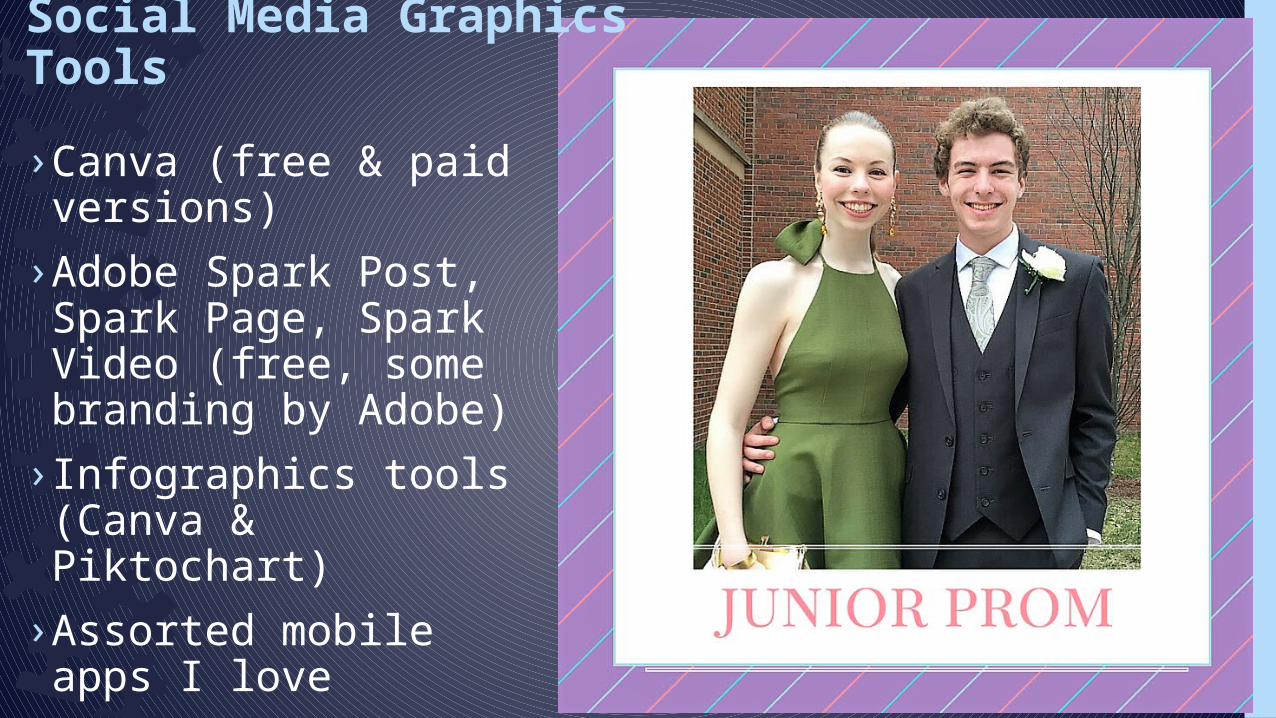
› Canva (free & paid versions)
› Adobe Spark Post, Spark Page, Spark Video (free, some branding by Adobe)
› Infographics tools (Canva & Piktochart)
› Assorted mobile apps I love
Social Media Graphics Tools
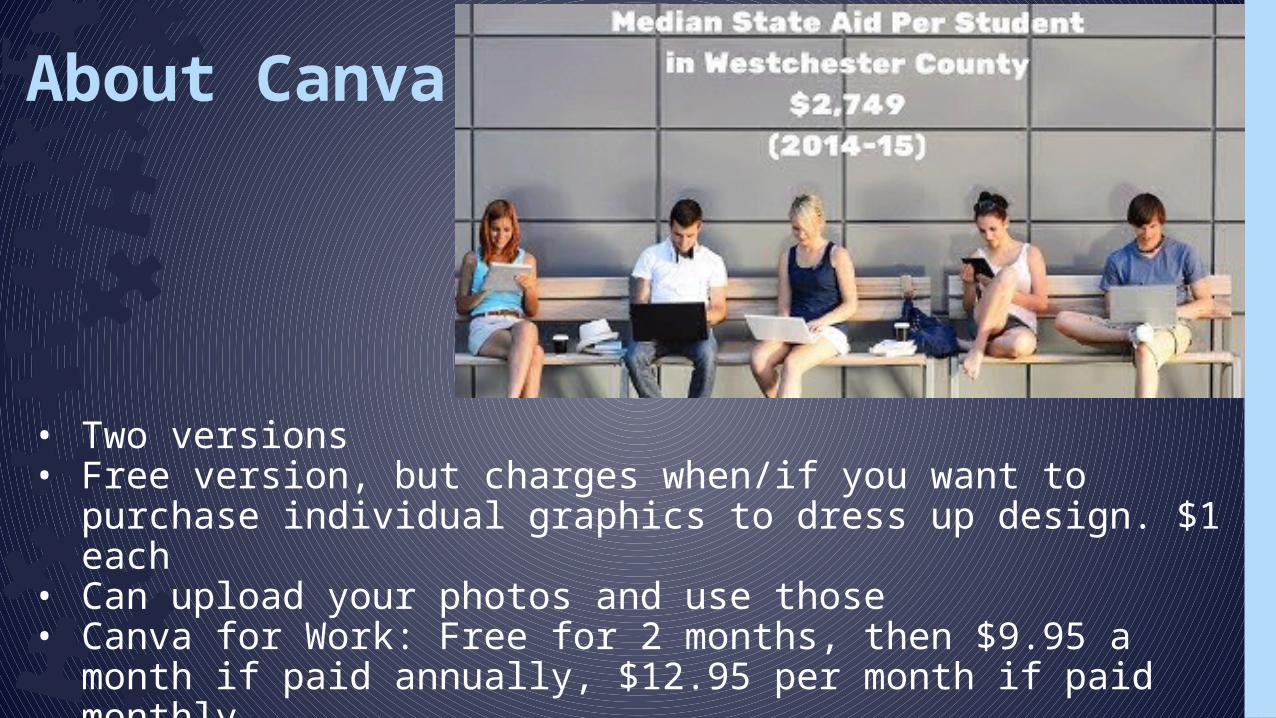
About Canva
• Two versions • Free version, but charges when/if you want to purchase
individual graphics to dress up design. $1 each• Can upload your photos and use those• Canva for Work: Free for 2 months, then $9.95 a month if paid
annually, $12.95 per month if paid monthly.
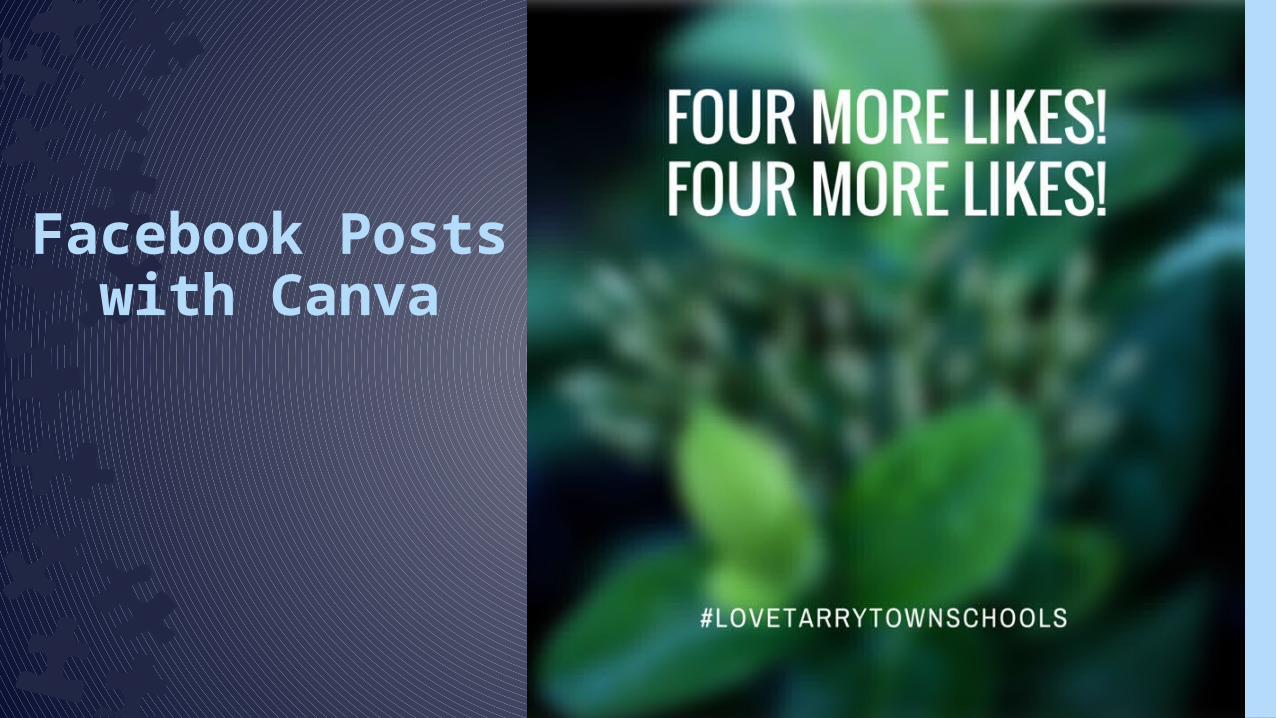
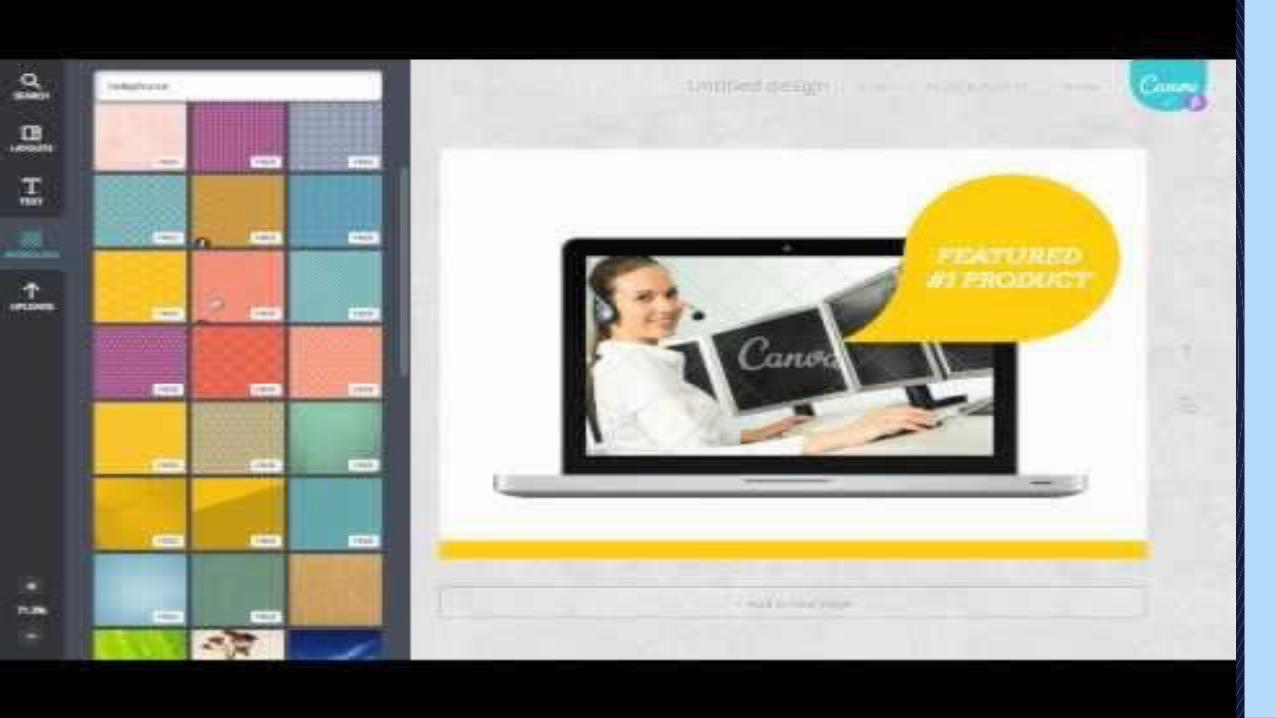
Facebook Posts with Canva

Classic 1990s flyer Canva social media post
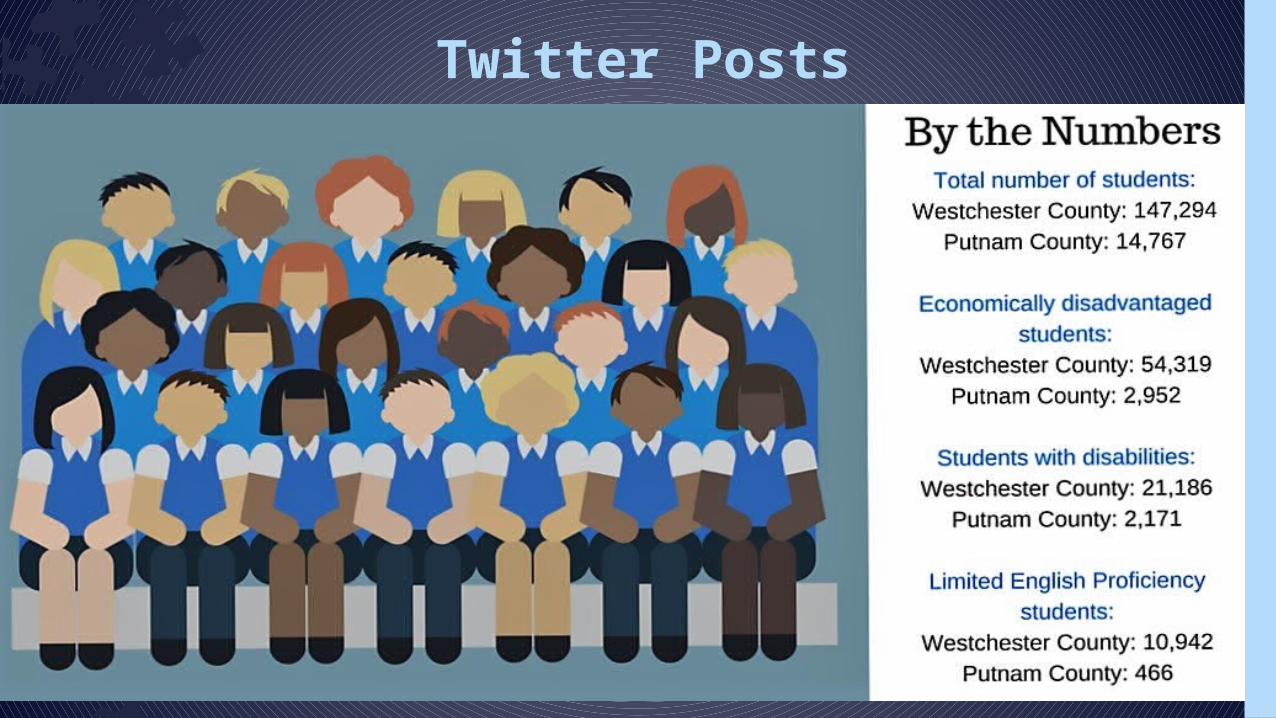
Twitter Posts

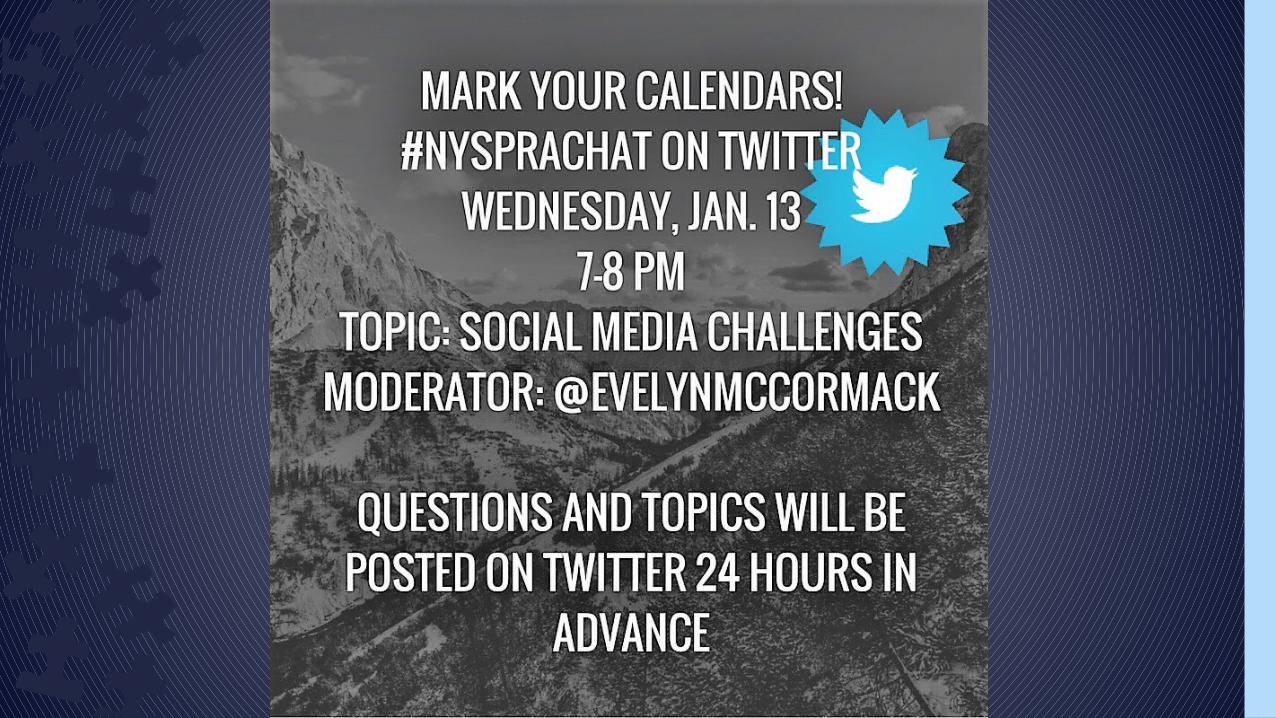
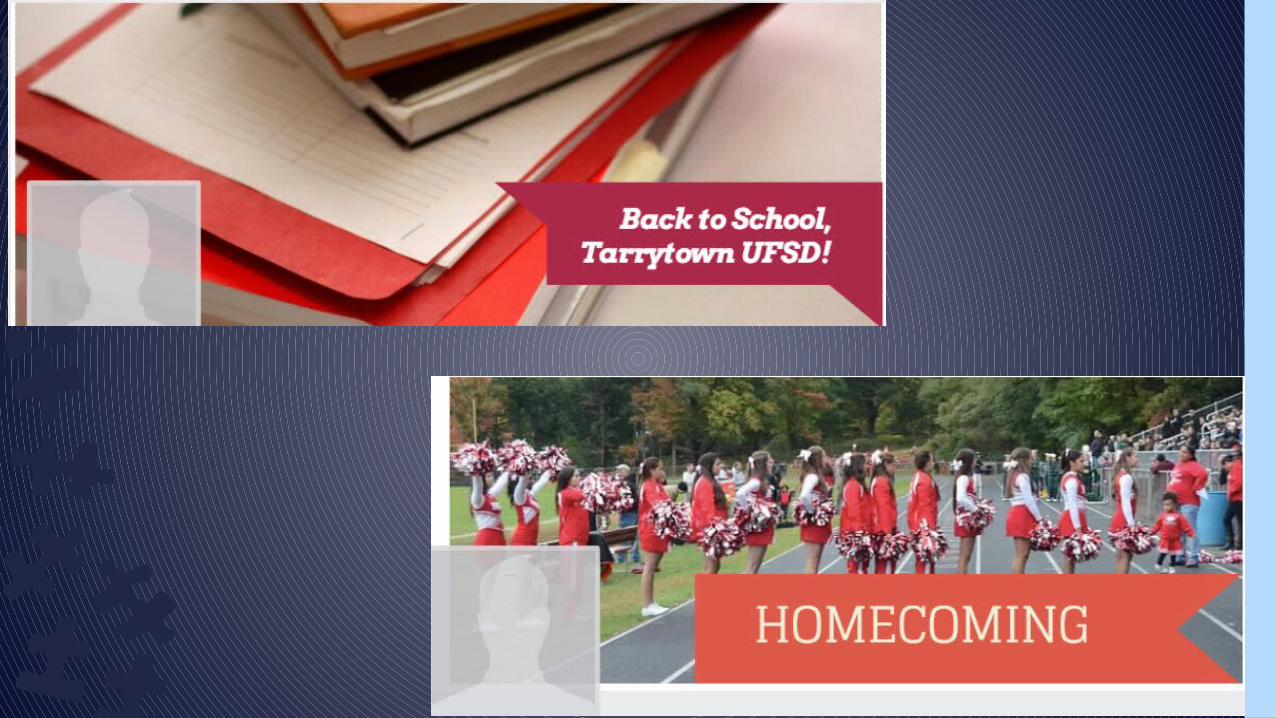


Use alone or save as JPGs to use in publications, e-newsletters, etc.Share directly to social media.
›Go to Canva.com›Create a FREE account. You’ll need your email address and a password.
›Follow along with me once you’re there.
Let’s Use Canva!
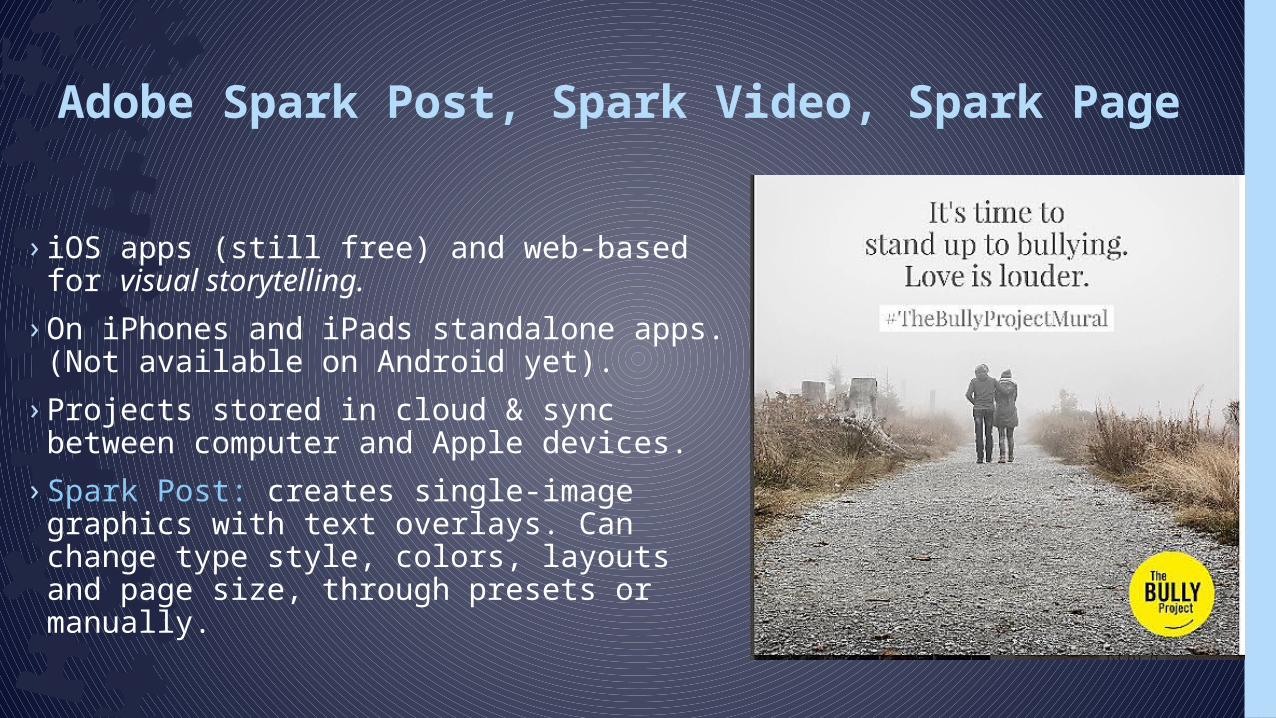
› iOS apps (still free) and web-based for visual storytelling.
› On iPhones and iPads standalone apps. (Not available on Android yet).
› Projects stored in cloud & sync between computer and Apple devices.
› Spark Post: creates single-image graphics with text overlays. Can change type style, colors, layouts and page size, through presets or manually.
Adobe Spark Post, Spark Video, Spark Page
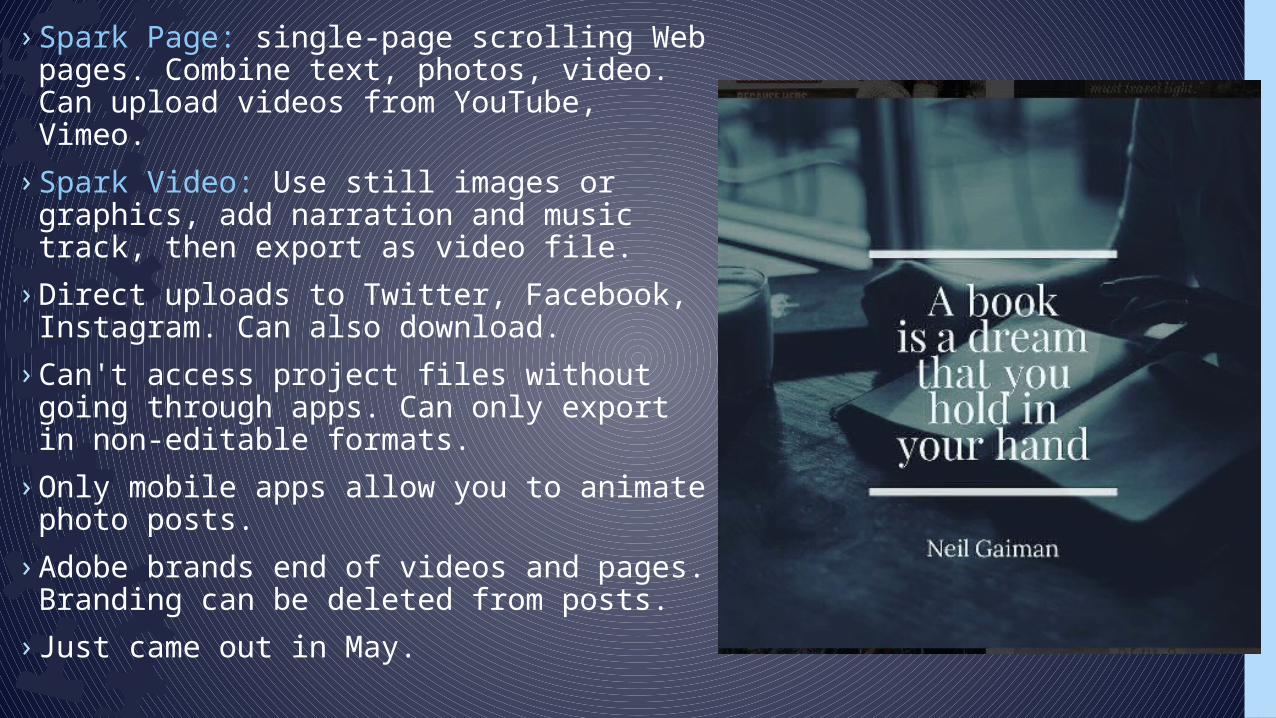
› Spark Page: single-page scrolling Web pages. Combine text, photos, video. Can upload videos from YouTube, Vimeo.
› Spark Video: Use still images or graphics, add narration and music track, then export as video file.
› Direct uploads to Twitter, Facebook, Instagram. Can also download.
› Can't access project files without going through apps. Can only export in non-editable formats.
› Only mobile apps allow you to animate photo posts.
› Adobe brands end of videos and pages. Branding can be deleted from posts.
› Just came out in May.
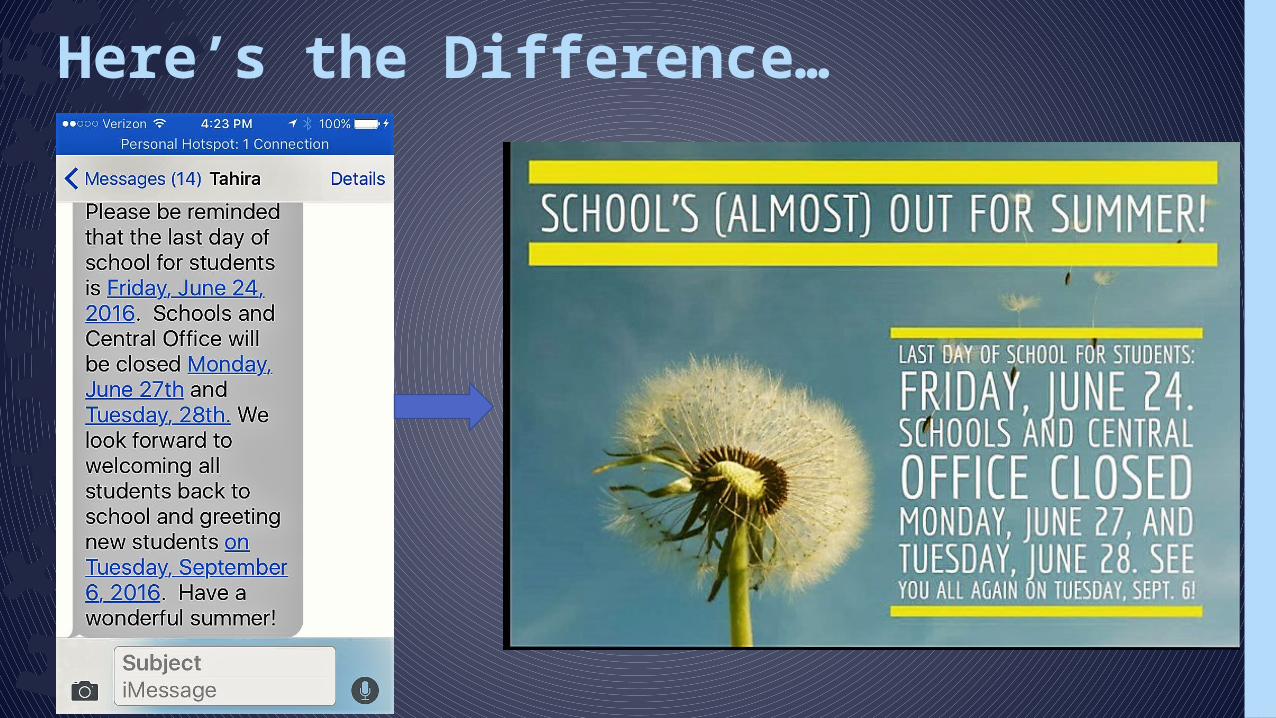
Here’s the Difference…
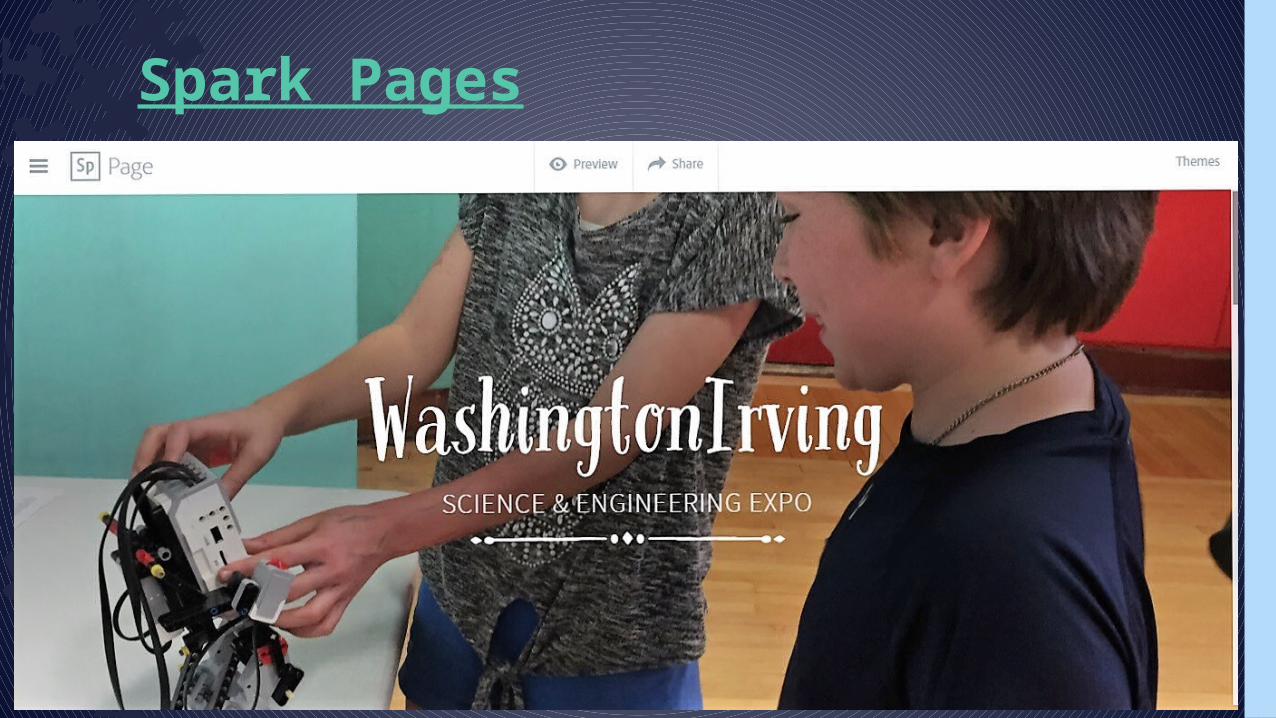
Spark Pages
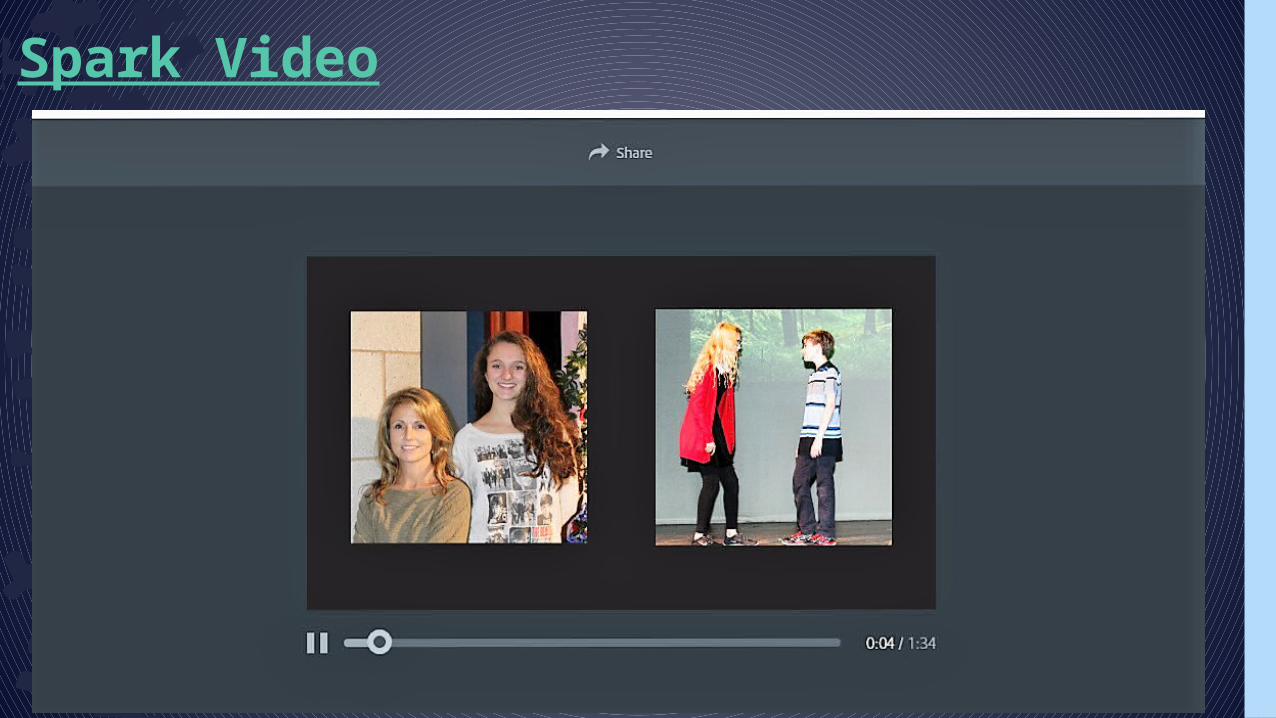
Spark Video
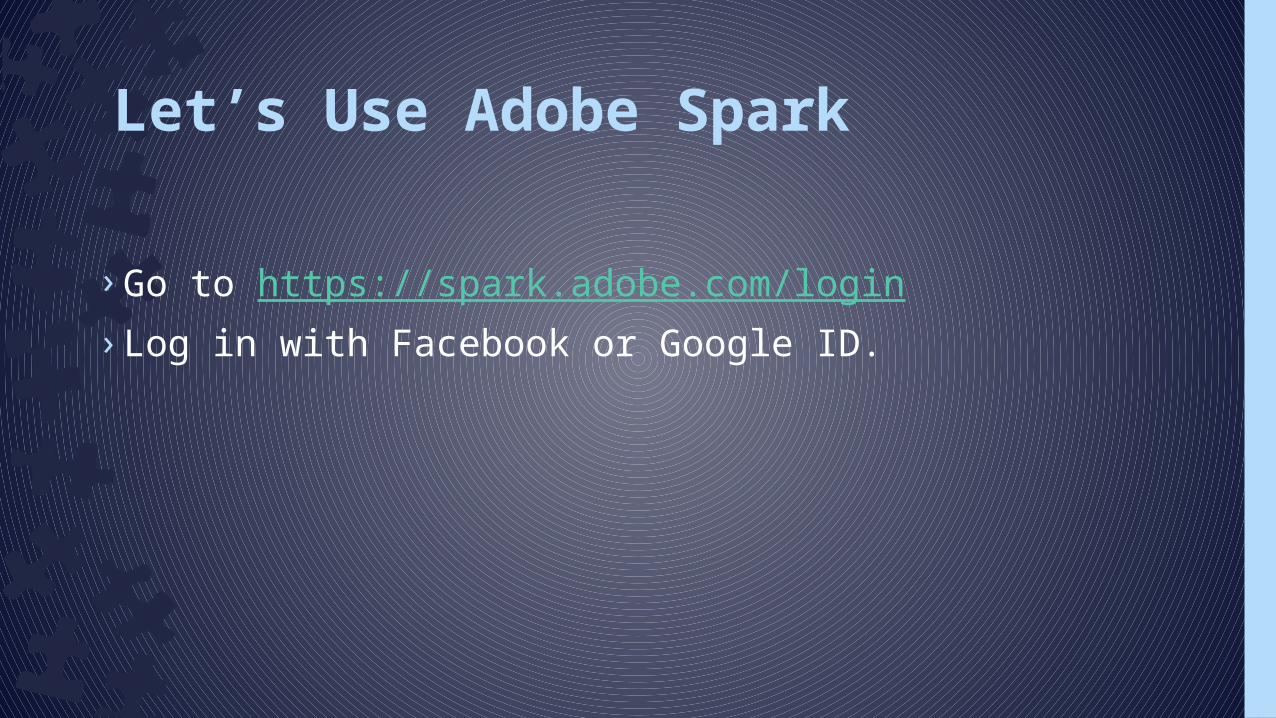
› Go to https://spark.adobe.com/login› Log in with Facebook or Google ID.
Let’s Use Adobe Spark
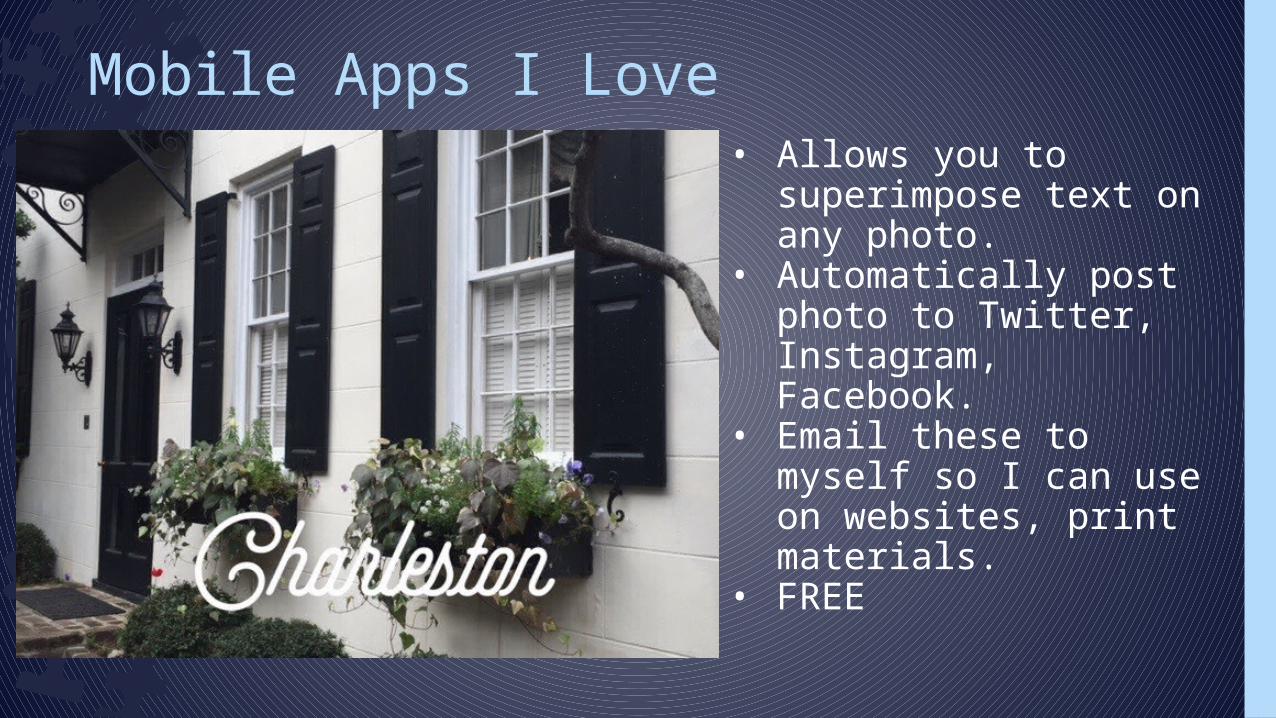
Mobile Apps I Love• Allows you to
superimpose text on any photo.
• Automatically post photo to Twitter, Instagram, Facebook.
• Email these to myself so I can use on websites, print materials.
• FREE
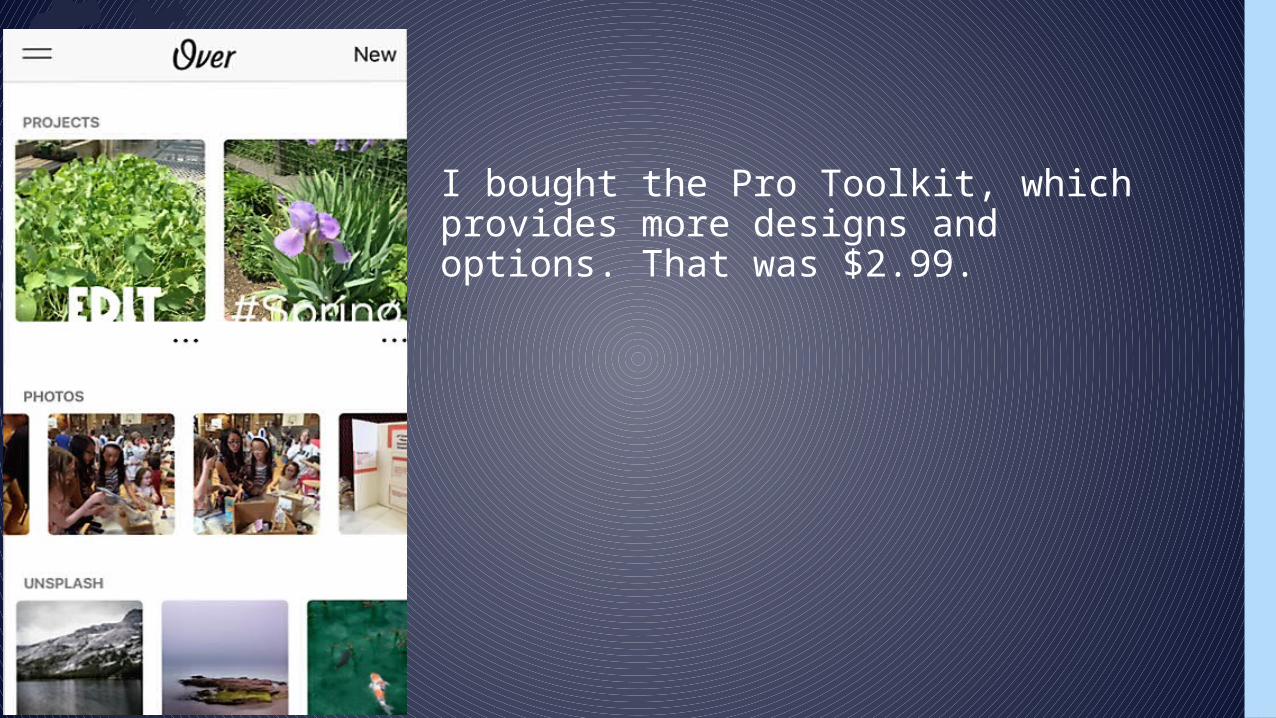
I bought the Pro Toolkit, which provides more designs and options. That was $2.99.
A Quick Over Tutorial
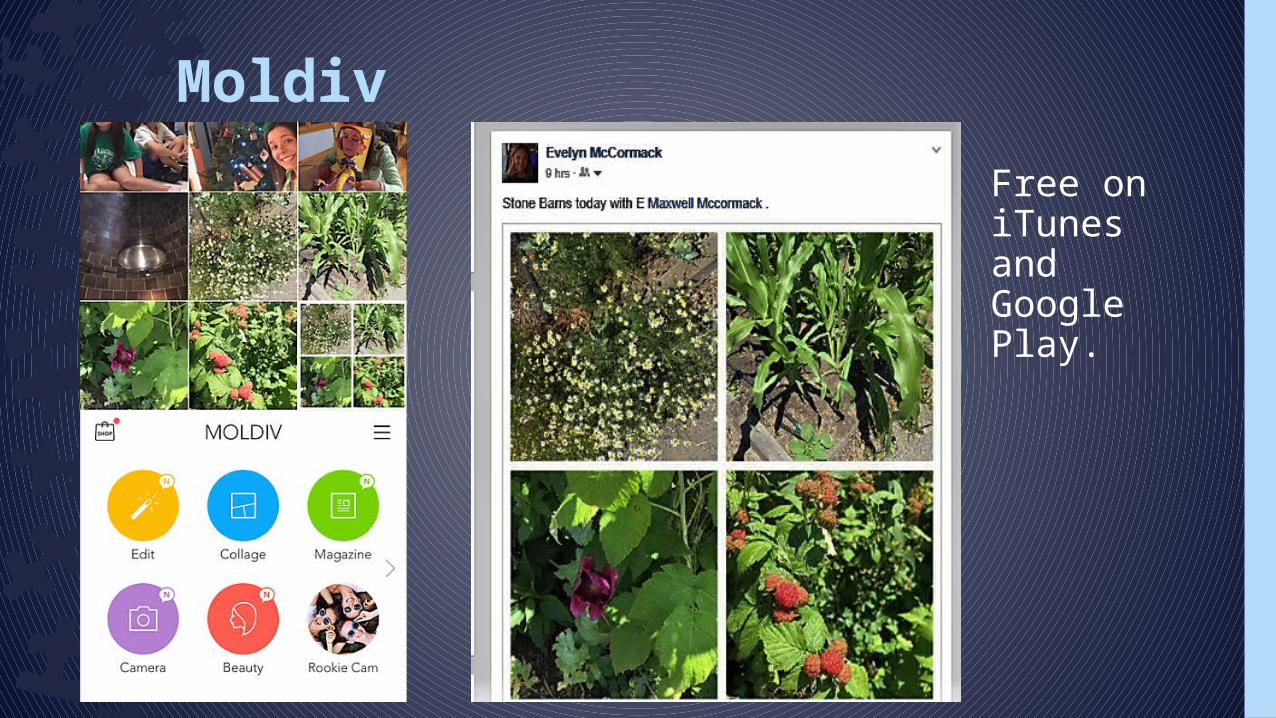
MoldivFree on iTunes and Google Play.
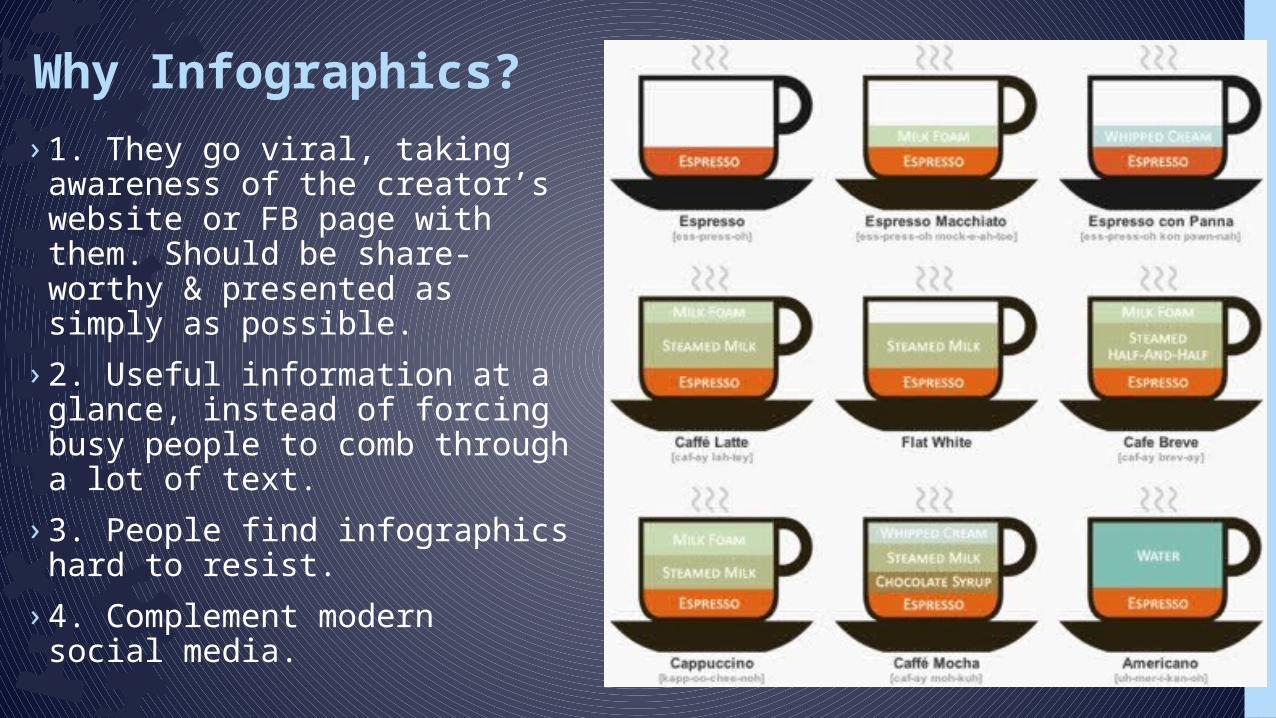
› 1. They go viral, taking awareness of the creator’s website or FB page with them. Should be share-worthy & presented as simply as possible.
› 2. Useful information at a glance, instead of forcing busy people to comb through a lot of text.
› 3. People find infographics hard to resist.
› 4. Complement modern social media.
Why Infographics?
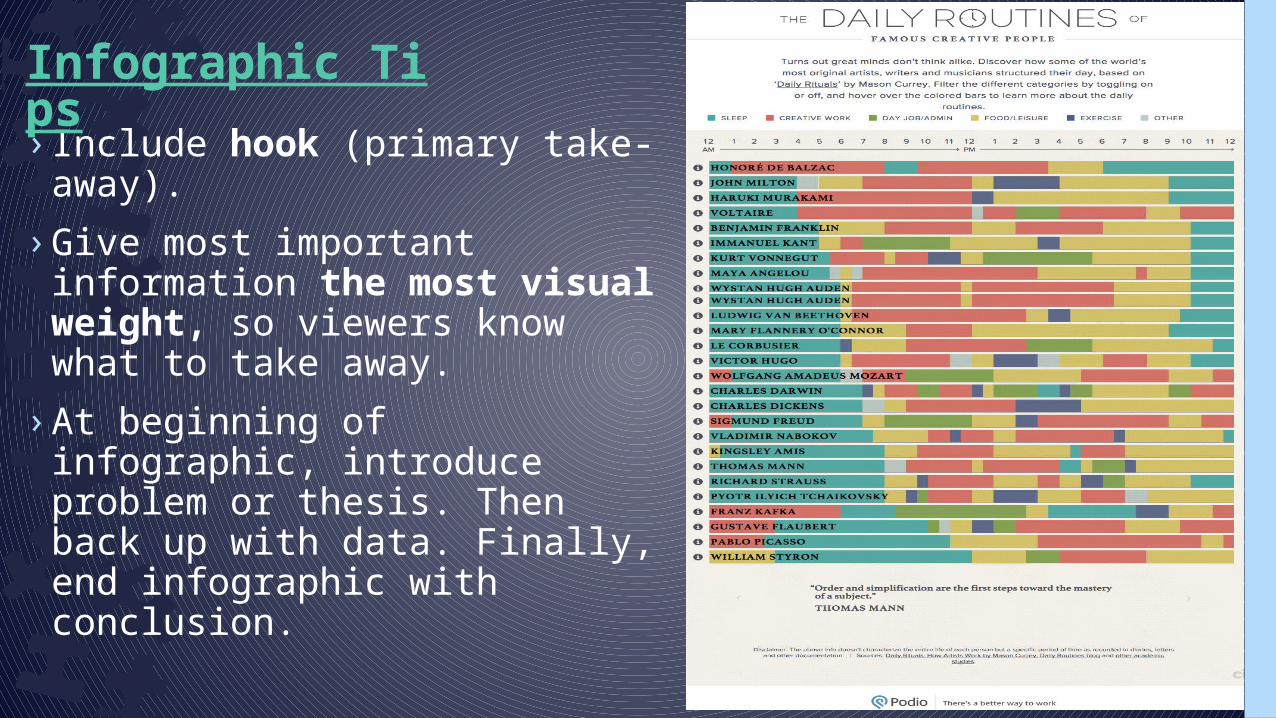
› Include hook (primary take-away).
› Give most important information the most visual weight, so viewers know what to take away.
› At beginning of infographic, introduce problem or thesis. Then back up with data. Finally, end infographic with conclusion.
Infographic Tips
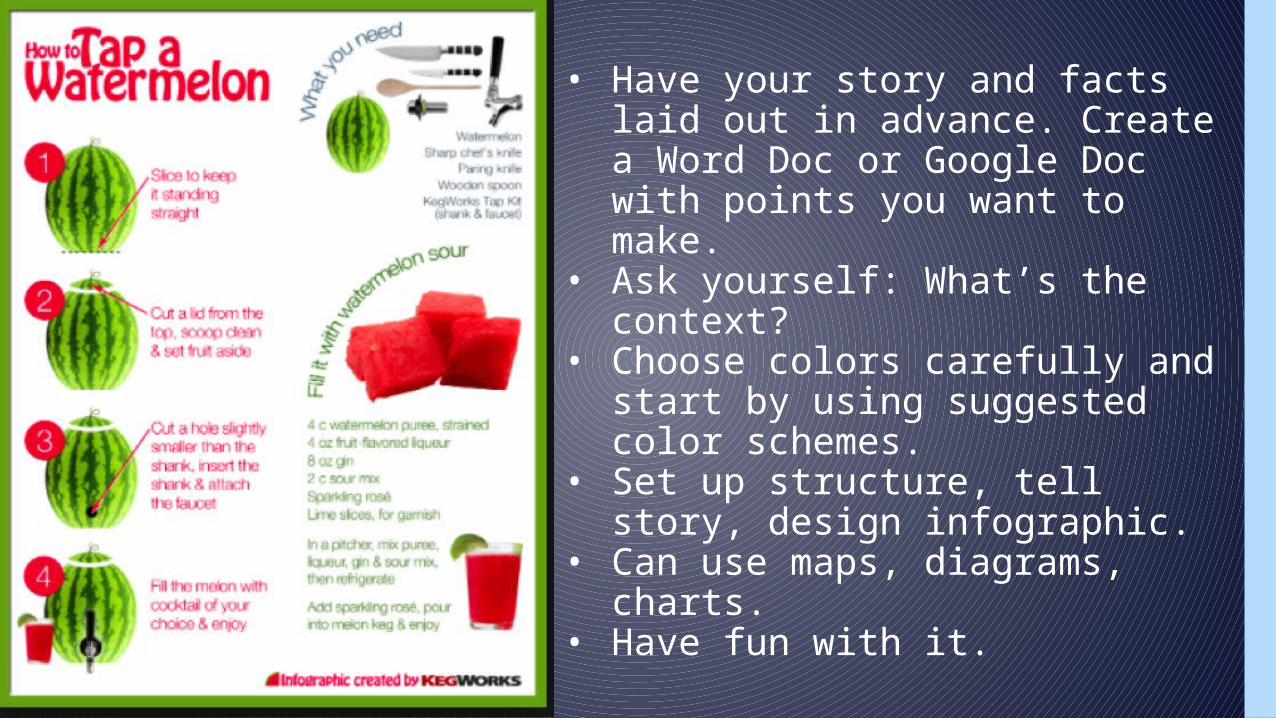
• Have your story and facts laid out in advance. Create a Word Doc or Google Doc with points you want to make.
• Ask yourself: What’s the context? • Choose colors carefully and start
by using suggested color schemes.
• Set up structure, tell story, design infographic.
• Can use maps, diagrams, charts. • Have fun with it.
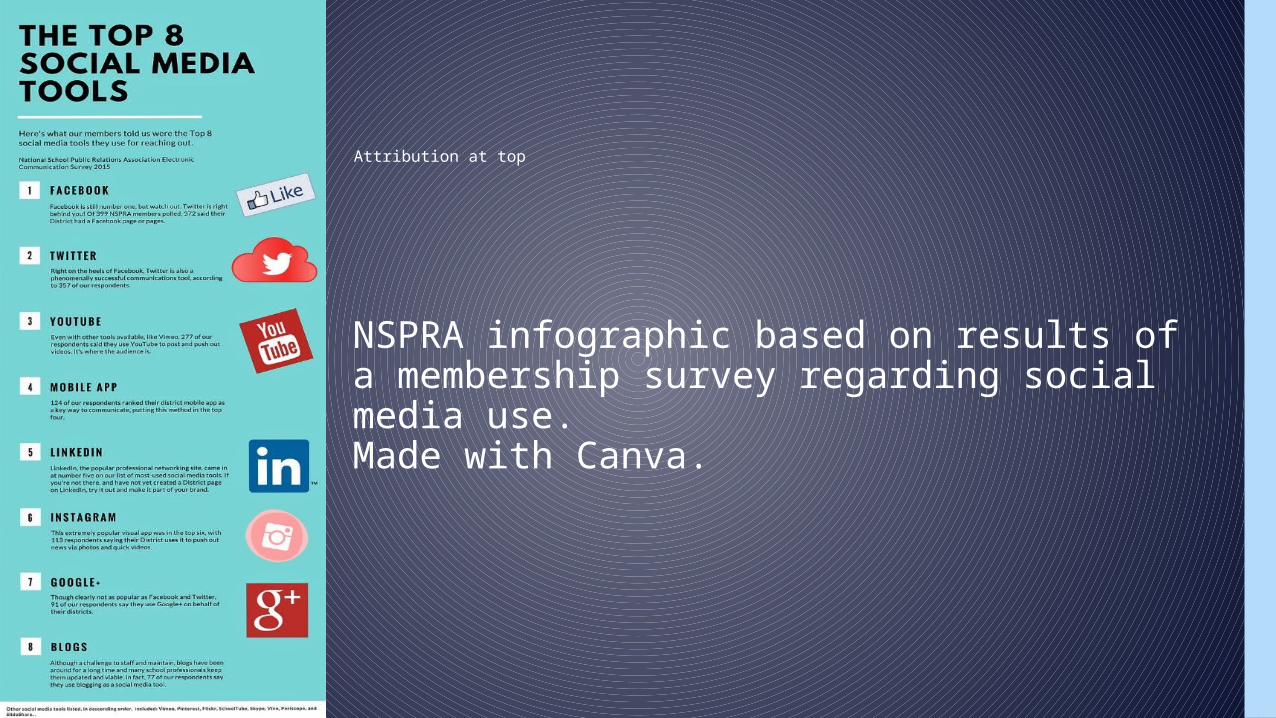
NSPRA infographic based on results of a membership survey regarding social media use.Made with Canva.
Attribution at top
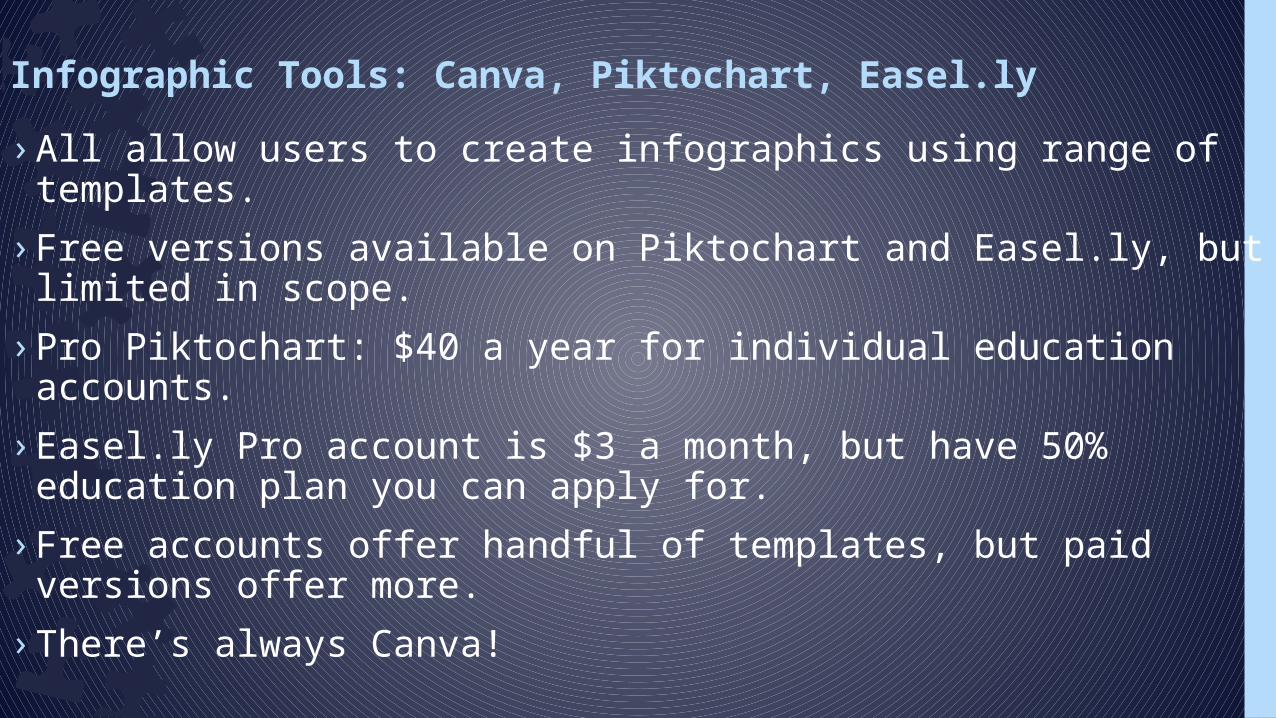
› All allow users to create infographics using range of templates. › Free versions available on Piktochart and Easel.ly, but limited in
scope.› Pro Piktochart: $40 a year for individual education accounts.› Easel.ly Pro account is $3 a month, but have 50% education plan
you can apply for. › Free accounts offer handful of templates, but paid versions offer
more.› There’s always Canva!
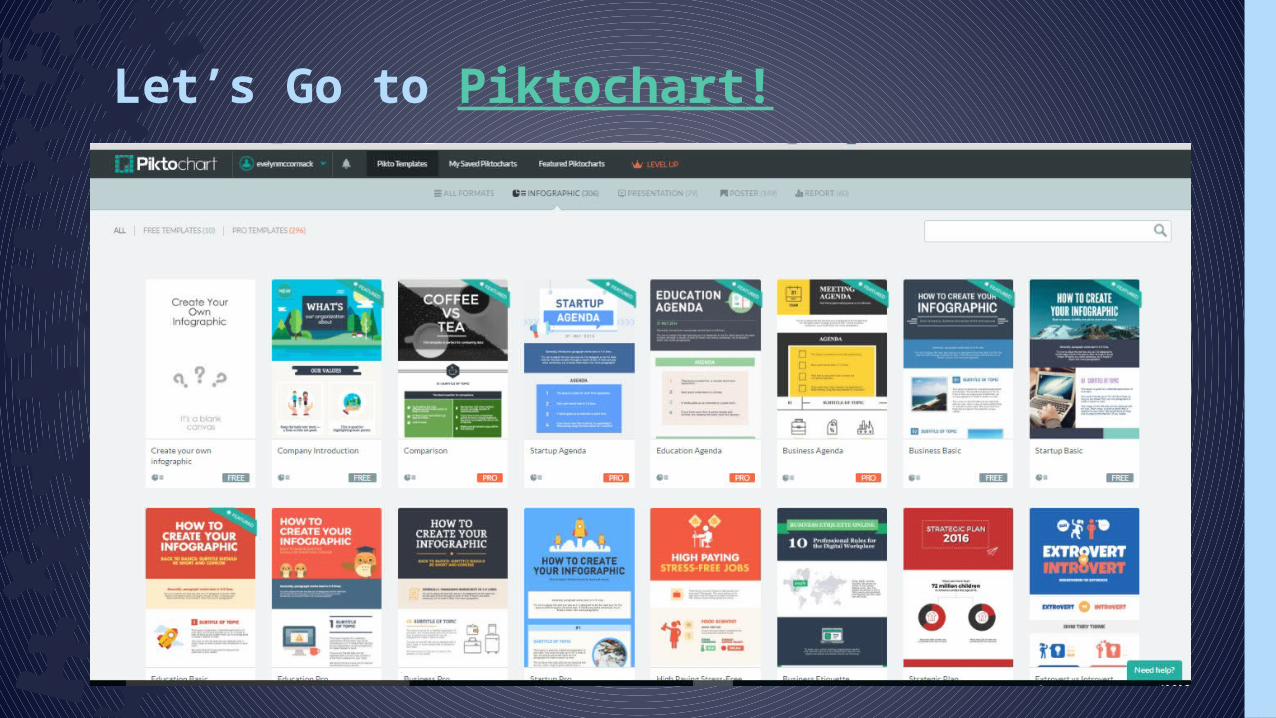
Infographic Tools: Canva, Piktochart, Easel.ly
Piktochart Tutorial