influence of granulated blast furnace slag as fine ... · furnace slag as partial replacement of...
TRANSCRIPT

Advances in Concrete Construction, Vol. 6, No. 6 (2018) 611-629
DOI: https://doi.org/10.12989/acc.2018.6.6.611 611
Copyright © 2018 Techno-Press, Ltd.
http://www.techno-press.org/?journal=acc&subpage=7 ISSN: 2287-5301 (Print), 2287-531X (Online)
Influence of granulated blast furnace slag as fine aggregate on properties of cement mortar
Rakesh Kumar Patra1a and Bibhuti Bhusan Mukharjee2
1Department of Civil Engineering, Indian Institute of Technology Roorkee, India
2Department of Civil Engineering, Biju Patnaik University of Technology, Rourkela, Odisha, India
(Received November 25, 2017, Revised November 3, 2018, Accepted November 8, 2018)
Abstract. The objective of present study is to investigate the effect of granulated blast furnace slag (GBS)
as partial substitution of natural sand on behaviour of cement mortar. For this, the methods of factorial
design with water cement (w/c) ratio and incorporation percentages of GBS as replacement of natural fine
aggregate i.e., GBS(%) as factors are followed. The levels of factor w/c ratio are fixed at 0.4, 0.45, and 0.5
and the levels of factor GBS(%) are kept fixed as 0%, 20%, 40%, 60%, 80% and 100%. The compressive
strength (CS) of mortar after 3, 7, 14, 28, 56 and 90 days, and water absorption (WA) are chosen as
responses of the study. Analysis of variance (ANOVA) of experimental results has been carried out and those
are illustrated by ANOVA tables, main effect and interaction plots. The results of study depict that the
selected factors have substantial influence on the strength and WA of mortar. However, the interaction of
factors has no substantial impact on CS and WA of mixes.
Keywords: ANOVA; granulated blast furnace slag; compressive strength; water absorption
1. Introduction
Utilisation of various industrial waste products as replacement of natural aggregates provides
several sustainable benefits like preservation of sources of natural aggregates, reduction of
landfills, conservation of energy and reduction in the rate of emission of greenhouse gases (Topçu
and Boğa 2010, Mukharjee and Barai 2015a, Ambily et al. 2015, Lee et al. 2016). With vast
increase in the use of concrete for construction work, several parts of world are facing acute
shortage of natural aggregates. Furthermore, a number of environmental problems such as sliding
of river banks, loss of water retaining sand strata, lowering of river courses, lowering of the
ground water table, loss of aquatic life and disturbance on the agriculture process are caused due to
the increase in the extraction of natural sands from the river bed. Therefore, researchers have been
trying to utilise aggregates retrieved from various industrial waste products, construction
demolition waste and agricultural waste for making concrete (Kehagia 2009, Chithra et al. 2016,
Mukharjee and Barai 2015b, Kockal 2016, Ding et al. 2017, dos Anjos et al. 2017). The molten
form of slag collected from blast furnace of iron and steel industry is of molten form, which is
Corresponding author, Associate Professor, E-mail: [email protected] aResearch Scholar, E-mail: [email protected]

Rakesh Kumar Patra and Bibhuti Bhusan Mukharjee
cooled quickly by using powerful water jets.
After the cooling process, the molten slag changes to granular, fine and glassy form which is
known as granulated blast furnace slag (GBS). The use of powdered form of granulated blast
furnace slag as partial replacement of cement for making concrete has been well established (Patra
and Mukharjee 2014). The properties of mortar and concrete were significantly influenced by the
use of aggregates produced from steel slag because of the hydraulic activity of steel slag (Lin et al.
2003, Singh et al. 2015). Moreover, around 30% increase in 28 days CS was detected for
specimens with steel slag as coarse and fine aggregate (Chunlin et al. 2011). The GBS was utilized
in alkali activated slag mortars as fine aggregate and found to have beneficial for improving its
resistance to temperature (Rashad et al. 2016). Furthermore, enhancement in the fatigue life of
mortar and static compressive strength (CS) was detected with the use of GBS in mortar (Farooq et
al. 2017). Workability of concrete decreased substantially with the utilization of GBS as
substitution of sand owing to its high water absorption (Binici et al. 2008, Patra and Mukharjee
2017a). However, the study depicted that incorporation of GBS had no substantial impact on the
fresh density of concrete mixes. Strength development ratio calculated after days for GBS
incorporated mixes was similar to normal concrete (Binici et al. 2009). Babu and Mahendran
(2014) demonstrated that strength of concrete made with slag as fine aggregate improved up to
25% and further enhancement in the percentage of incorporation of GBS decreased the strength.
Improvement in the 28 and 90 days CS, resistance to permeability and sulphate resistance of
concrete was observed with the use of GBS in place of sand (Binici et al. 2012). Furthermore, the
resistance to water and chloride penetration was enhanced with use of GBS as fine aggregate in
designing concrete mixes (Binici et al. 2008). Scanning electron microscope was employed for
analyzing the microstructure of concrete containing GBS as fine aggregate and it was observed
that there was increase in number of C-S-H gel in GBS incorporated mixes, as CaO present in
GBS promoted the growth of C-S-H gel. Therefore, enhancement in strength parameters of
concrete occurred with the replacement of natural sand by GBS. In another study, Yuskel et al.
(2008) found that GBS having grain size more than 30 μm participated in hydration process
similar to normal aggregate by performing analysis of microstructure by using scanning electron
microscope. The study also reported about enhancement in resistance to high temperature,
abrasion, freezing, and thawing with the use of 20% GBS in concrete. Furthermore, enhancement
in the tensile behaviour of concrete was detected by use of GBS in concrete as fine aggregate
(Zeghichi 2006). Durability of concrete also affected with the substitution of sand by GBS (Patra
and Mukharjee 2017b) The utilization of fines made from steel and copper slag for developing
geo-polymer and self-compacting concrete mixes were reported in the literature (Valcuende et al.
2015, Singh and Siddique 2016, Mithun and Narasimhan 2016).
Design of experiments is very useful in determining the influence of factors and the responses
when number factors are involved in a process. The determination of insignificant factors and
elimination of these factors could be done by following procedures of design of experiments.
Moreover, statistically planned experiments are employed for determining the best combination
for achieving optimized properties of a mixture. Nehdi and Summer (2002) used 32 design for
determining the effect of various waste products on characteristics of mortar. Sneff et al. (2012)
adopted factorial design for evaluating the individual and interactive effect of nano-silica and
nano- TiO2 on long term properties of mortar. It was observed that the contribution of main effects
and interaction between factors did not significant effect on CS; however, substantial influence on
rheology of mortar was detected. Mukharjee and Barai (2014) utilized factorial design of
experiments for accessing the influence w/c ratio and percentage of nano-silica on water
612

Influence of granulated blast furnace slag as fine aggregate on properties of cement mortar
absorption and strength of mortar. Several studies have been also conducted in area of application
of procedures of design of experiments for accessing influence of different factors on the behavior
of concrete. Lopez-Gayarre et al. (2009) studied the effect of quality and amount of the recycled
aggregate on characteristics of concrete. ANOVA technique was used for analysis of experimental
results and screening insignificant factors. Use of design experiments for analyzing the concrete
behavior with consideration of various factors has been reported in literature (Correia et al. 2009,
Alqadi et al. 2013, Mukahrjee and Barai 2014).
Determination of effect of various factors on the properties of mortar and concrete using design
of experiment has been found in existing literature. Furthermore, several studies have been
conducted in the area of use of from blast furnace slag as aggregates in developing sustainable
mixes. The purpose of the current study is to determine the effect of the different factors on the
properties of mortar using the procedures of factorial design. For this, the W/C ratio and GBS(%)
are selected as factors and CS after different curing days and WA are chosen as responses. Two-
way ANOVA has been performed on experiential results and the outcomes of this study are
illustrated with the help of individual value, contour, main effects and interaction plots.
2. Material and methods
2.1 Materials
Commercially available OPC (Ordinary Portland Cement) grade - 43 confirming to BIS 8112
(1959) provided by Ultratech Co. Ltd. was used in the present experimental work, for designing
mortar mixes. The experimental work completed within 30 days of procurement of cement to
avoid the negative effect on cement because of storage. Table 1 illustrates the characterized
properties of cement which are obtained by adopting standard procedures followed by Bureau of
Indian Standards.
The GBS was brought from the steel plant located at Rourkela (A city of Eastern India) used
for current study. Table 2 illustrates the chemical composition of cement and GBS. Scanning
Electron Microscope (SEM) analysis which is performed for GBS in bright field mode and
represented in Fig. 1(a). SEM is a unique technique in which the surface morphology of the
materials is studied. From the figure, it can be observed that the surface of GBS is rough with
angular particles.
Table 1 Properties of the cement
Fineness
(%)
Standard
Consistency (%)
Specific
gravity
Setting time (min) Soundness
(mm)
Compressive strength (MPa)
Initial Final 3 days 7 days 28 days
99.98 31 3.09 132 328 9 34.8 44.9 54.1
Table 2 Composition of cement and GBS
Component
type CaO SiO2 MgO Al2O3 S
FeO or
Fe2O3 P2O5 MnO Na2O KO SO3
GBS (%) 41.7 35.6 10.7 8.4 1.3 0.8 0.7 0.5 - - -
Cement (%) 65.67 16.57 1.31 11.74 - 0.34 - - 0.44 2.11 1.47
613

Rakesh Kumar Patra and Bibhuti Bhusan Mukharjee
Table 3 Properties of aggregates and GBS
Material Bulk density (kg/m
3) Specific
gravity (SD)
Water
absorption (%)
Los Angeles
Abrasion
resistance (%)
Impact
value (%)
Crushing
value (%) Compact Loose
FA 1615 1462 2.63 0.4 - - -
GBS 1250 1157 2.56 1.2 - - -
Fig. 1(a) Scanning electron microscope micrograph of GBS
Fig. 1(b) Particle size distribution curve of natural fine aggregate and GBS
0
20
40
60
80
100
120
0 0.5 1 1.5 2 2.5 3 3.5 4 4.5 5
Per
centa
ge
pas
sing
Sieve size (mm)
Min-IS:383
GBS
Natural Fine Aggregate
Max-IS:384
614

Influence of granulated blast furnace slag as fine aggregate on properties of cement mortar
The gradation of sand for preparation of mortar specimens was kept in accordance to the BIS
4031 (part- 6) (1988). The gradation of GBS was kept similar to the sand as per aforementioned
code while making replacements for natural sand. The standard test results for various properties
of aggregates as well as GBS were presented in Table 3. In addition the particle size distribution
curve of natural fine aggregate and GBS was represented in Fig. 1(b).
2.2 Specimen casting, curing and testing
A mechanical mixer having a working speed of 80 rpm was used for dry mixing of the solid
ingredients which includes cement, fine aggregate and cement. The mortar mix proportion was
taken as 1:3 for cement and fine aggregate ratio. GBS was replaced with natural sand with 20%,
40%, 60%, 80% and 100% replacement level and w/c ratio was varied as 0.4, 0.45 and 0.5. The
mixer was operated for 4 min for each mix to ensure homogeneous mixing and water is added
afterwards. Immediately after the mixing process was completed, the mortar mix was put into the
moulds of size 70.6×70.6×70.6 mm conforming to BIS 10080 (1982) placed on the vibrating table
and prodded for 20 times in about 8 seconds to ensure elimination of any entrapped air. The period
of vibration was 2 minute at a speed of 12000±400 vibrations per minute. After keeping the mix
for 24 hours, specimens were brought out from the moulds and cured under water at 27°C±2°C. A
2000 kN compression testing machine confirming to BIS 516 (1959) with a constant rate of
loading 35 N/ mm2/min was used to determine the CS of the mortar cubes after 3, 7, 14, 28, 56 and
90 days of curing period and WA test was performed after 28 days of curing period. For each
curing period average test result of three mortar cube specimens were taken.
2.3 Factorial design of experiments
Design of experiments (DOE) has a substantial role in determining the influence of various
factors on the responses and helps in screening of insignificant factors. When two or more factors
are involved in a process then factorial experimental design is powerful technique for analyzing
their effect on the process. Usually, experimental trials (or runs) are conducted for various
combinations of levels of all factors for a full factorial design. Furthermore, the analysis of
variance (ANOVA) is employed which is one of the major tools to analyze statistical data. The
number of combinations are „c×d‟, when the factor levels of two factors „C‟ and „D‟ are fixed at
„c‟ and „d‟ respectively. If the experiment has „n‟ replicates for each treatment then total numbers
of observations are „c×d×n‟, which are determined in random order. The observations is
represented by
yijk=µ+τi+βj+(τβ)ij+ϵijk, where i= 1,2,3….,a; j= 1,2,3….,b; k=1,2,3….,n; (1)
where µ is the overall mean effect, τi is the effect of the ith level of factor C, βj is the effect of the j
th
level of factor C, (τβ)ij is the effect of the interaction between C and D, and
ϵijk is a random error component having a normal distribution with mean zero and variance. The
details of testing of hypothesis are being performed by ANOVA. The analysis of variance for the
two-factor factorial design is given in following format (Table 4)
The total sum of squares is computed by
SS T = ∑ ∑ ∑
(2)
615

Rakesh Kumar Patra and Bibhuti Bhusan Mukharjee
Table 4 Details of terms associated with two-way ANOVA
Source of variation Sum of squares Degrees of freedom Mean square F0
C treatments SSC c-1 MSC = SS C /c-1 F0 = MSC/MSE
D treatments SSD d-1 MSD = SSD /d-1 F0 = MSD/MSE
Interaction SSCD (c-1) (d-1) MSCD =
SSCD /(c-1)(d-1) F0 = MSCD/MSE
Error SSE cd(n-1) MSE =
SSE /cd(n-1)
Total SST cdn-1
The sums of squares of the main and interaction effects are given as follows
SSC =
∑
(3)
SSD =
∑
(4)
SSSubtotals =
∑ ∑
(5)
SSCD= SS Subtotals - SSC - SS D (6)
SSE = SST- SS substotal (7)
Main effect refers to the influence of the primary factors on the selected responses. The
difference of response between the levels for one factor is not the same at all levels of the other
factor which is due to the existence of interaction between the factors. The p-value of Fisher
distribution is less than 0.05 in 95% confidence level for one factor or interaction of many factors
is considered to be statistically significant. F-value is the distribution of one random variable
defined as the ratio of two chi-square random variables each divided by their number of degrees of
freedom. The p-value can be defined as the lowest level of significance which would lead to
rejection of the null hypothesis, which is 5% in the present study. Degree of freedom (DF) can be
defined as the number of independent comparisons that can be carried out between the elements of
a sample.
3. Result and discussion
3.1 3 days CS
The individual value plot for the results of 3 days CS with varying w/c ratio and GBS(%) is
illustrated in Fig. 2(a), which illustrates that 3 days CS reduces with increase in the level of
GBS(%) for a fixed W/C ratio. This reduction in strength early days is because of slow pozzolanic
action of GBS (Binici et al. 2008). Moreover, 3 days CS shows a decreasing tend with an
enhancement in the factor w/c ratio, as the mortar matrix weakens with increase in the amount of
water in the mix. It should be noted that individual standard deviation has been used for
determining intervals in the individual value plot. Individual plots for 3days CS show closer
values to particular combination of each factor. Fig. 2(b) represents the contour plots of 3 days CS
616

Influence of granulated blast furnace slag as fine aggregate on properties of cement mortar
(a) (b)
(c) (d)
Fig. 2 (a) Individual value plot (b) Contour plot (c) Main effects plot (d) interaction plot of 3 days CS
with varying GBS(%) and w/c ratio. Contour lines are obtained at a fixed interval (1.42 MPa) and
vary from 13.92 MPa to 25.28 MPa. The contour plot also indicated that reduction in contour
values is detected with enhancement in the w/c ratio. Similar type of trend for an increase in the
level of GBS(%).
Table 5 indicates the results of ANOVA of experimental data of 3 days CS, which shows that
w/c ratio Higher F-values and p-value lower 0.05 shows that GBS(%) and W/C ratio are
considerably influencing the CS strength after 3 days. The delay in the pozzolanic activity of GBS
and weaker bonding with increasing W/C ratio are explanations for substantial impact of the
selected factors W/C ratio and GBS(%) on the response. However, the ANOVA results indicate no
significance impact of interaction of factors on 3 days CS as p-value higher than 0.05 is obtained.
Fig. 2(c) represents the main effect plot for 3 days CS with variation of W/C ratio and GBS(%),
which indicates that 3 days CS declines from 22.62 MPa to 15.97 MPa with the enhancement in
W/C ratio (0.4 to 0.5). Furthermore, 3 days CS reduces from 22.13 MPa to 15.93 MPa with change
in amount of GBS(0 to 100%). The interaction plot for 3 days CS is presented in Fig. 2(d), which
depicts the non-existence of the interaction effect, as interaction lines are not crossing each other
that signifies that for each W/C ratio, reduction in 3 days CS is observed with increase in level of
other factor GBS(%). The lower strength GBS incorporated mortar could be attributed to the delay
in hydration of cement as GBS contributes hydration process, which is lower in early days.
W/C ratio
GBS(%)
0.500.450.40
100806040200100806040200100806040200
30
25
20
15
10
3 d
ays C
S (
MP
a)
Individual standard deviations were used to calculate the intervals.
23.86
22.44
21.02
19.60
18.18
16.76
15.34
W/C ratio
GB
S(%
)
0.500.480.460.440.420.40
100
80
60
40
20
0
617

Rakesh Kumar Patra and Bibhuti Bhusan Mukharjee
Table 5 Analysis of Variance for 3 days CS
Source Degrees of Freedom Sum of Squares Mean Square F-value P-value
W/C ratio 2 407.903 203.952 367.48 0.000
GBS(%) 5 248.688 49.738 89.62 0.000
W/C ratio*GBS(%) 10 3.677 0.368 0.66 0.751
Error 36 19.980 0.555
Total 53 680.248
Table 6 Analysis of variance for 7 days CS
Source Degrees of Freedom Sum of Squares Mean Square F-value P-value
W/C ratio 2 903.753 451.876 277.73 0.000
GBS(%) 5 616.156 123.231 75.74 0.000
W/C ratio*GBS(%) 10 5.496 0.550 0.34 0.964
Error 36 58.573 1.627
Total 53 1583.979
However, natural sand is inert and has no role in hydration process. During early days, the rate of
hydration is lower for GBS incorporated mortar than natural ones.
3.2 7 days CS
Fig. 3 represents the individual value, contour, main effects and interaction plot of 7 days CS of
mortar. The intervals of the individual plot are construction based upon the individual standard
deviation each combination of factors. It can be seen from the figure that 7 days CS of mortar
decreases with the enhancement in W/C ratio which leads to the lesser strength of mortar matrix
with increase in the amount of water (Fig. 3(a)). However, 7 days CS improves with the increase
in the GBS (%) from 0% to 60% and after 60% replacement level the strength starts decreasing.
The contour plots of 7 days CS are plotted and presented in Fig. 3(b). The contour interval is fixed
at 2 MPa and ranges from 22 MPa to 40 MPa. The plot indicates that CS after 7 days shows a
decreasing trend with an enhancement in level of W/C ratio. However, contour lines for 7 days
CS of mortar shows an increasing trend up 60% GBS and after that values of contour lines
reduces. The main effects plot of 7 days CS Fig. 3(c). The 7 days CS reduces from 36.02 MPa to
26.15 MPa with the rise in level of the W/C ratio 0.4 to 0.45, which indicates that main 7 days CS
shows a reducing trend for an enhancement in W/C ratio. However, the values of 7 days CS
changes from 30. 73 MPa to 35.93 MPa with the change level of GBS from 0 to 60%, which
indicates the beneficial effect of GBS on CS. The 7 days CS declines from 35.93 MPa to 26.22
MPa when the GBS(%) is increased from 60% to 100%. The effects of factors are found to have
symbolic effect on the 7 days CS (p-value < 0.05) (Table 6). The interaction plot is represented in
Fig. 3(d), which indicates that for each level of W/C ratio, the effect of the change in the level of
GBS(%) is same.
In other way, the 7 days CS increases up to 60% and then starts reducing up to 100% for every
W/C ratio. Similarly, for every level of GBS(%), 7 days CS reduces with change in W/C ratio
from 0.4 to 0.45, which indicates no considerable impact of interaction of factors. The absence of
interaction between could be seen from the ANOVA table as p-value is more than 0.05 (Table 5).
618

Influence of granulated blast furnace slag as fine aggregate on properties of cement mortar
(a) (b)
(c) (d)
Fig. 3 (a) Individual value plot (b) Contour plot (c) Main effects plot (d) interaction plot of 7 days CS
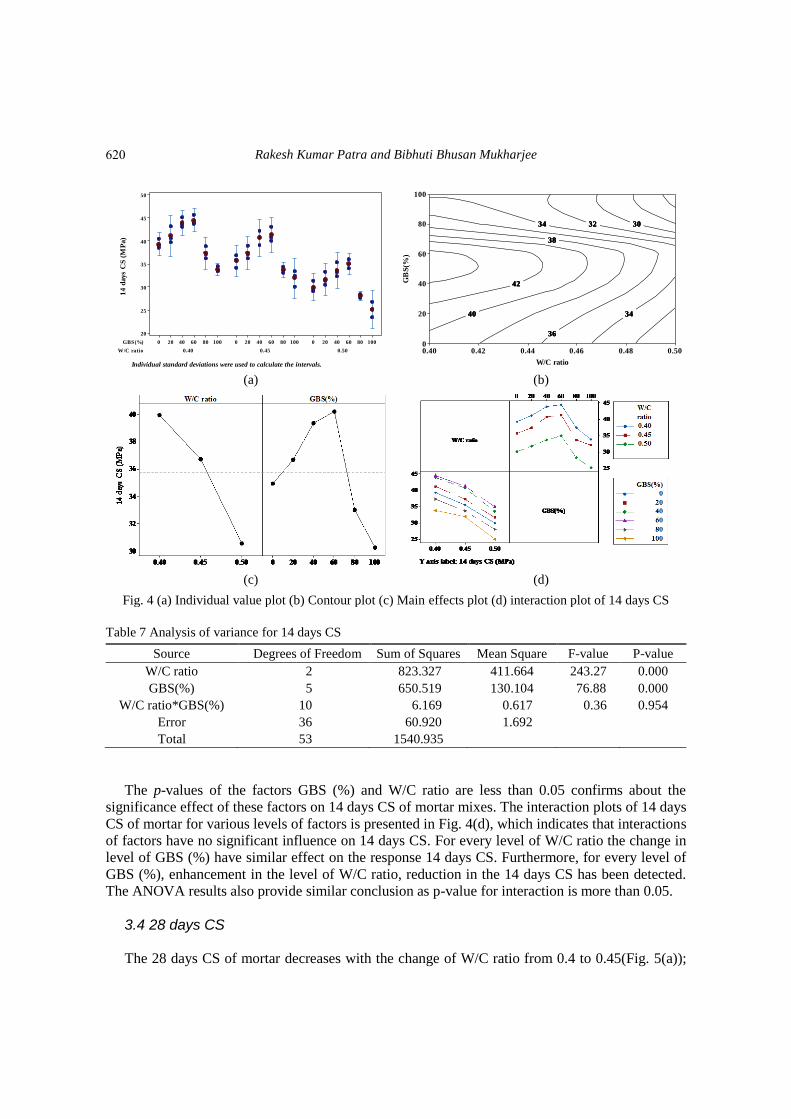
3.3 14 days CS
The results of 14 days CS of mortar determined for varying amount of GBS and at different
W/C ratio has been analysed and those are shown in Fig. 4. The individual plot for 14 days CS
indicates that CS after 14 days reduces with augmentation in W/C ratio (Fig. 4(a)). However, 14
days CS increases with the increasing GBS(%) up to 60% and after this level strength reduces up
to 100%. The 95% confidence interval is presented in individual plot based upon individual
standard deviation. The contour plot of 14 days CS is represented in Fig. 4(b), which indicates
reduced vales of contour lines with increase in W/C because of increase in amount of water in
mortar mixes. However, enhancement in the contour values can be detected for increase in the
level of GBS (%) up to 60% and beyond this level strength decreases. Fig. 4(c) represents the main
effects plot for 14 days CS varying GBS (%) and W/C ratio. The CS reduces from 36.96 MPa to
30.55 MPa with enhancement in W/C ratio from 0.4 to 0.5. However, 14 days CS of mortar
increases from 34.93 MPa to 40.22 MPa with an enhancement in the level of GBS (%) from 0% to
60%. Furthermore, 14 days CS of mortar reduces from 40.22 MPa 30.27 MPa with increase in the
level of GBS (%) from 60% to 100%. The aforementioned analysis indicates that the main effects
of W/C ratio and GBS (%) has considerable influence on the response which can be confirmed
from the ANOVA results of 14 days CS (Table 7).
W/C ratio
GBS(%)
0.500.450.40
100806040200100806040200100806040200
45
40
35
30
25
20
15
7 d
ays C
S (
MP
a)
Individual standard deviations were used to calculate the intervals.
38
36
34
32
30
30 28
28
26
W/C ratio
GB
S(%
)
0.500.480.460.440.420.40
100
80
60
40
20
0
619
Rakesh Kumar Patra and Bibhuti Bhusan Mukharjee
(a) (b)
(c) (d)
Fig. 4 (a) Individual value plot (b) Contour plot (c) Main effects plot (d) interaction plot of 14 days CS
Table 7 Analysis of variance for 14 days CS
Source Degrees of Freedom Sum of Squares Mean Square F-value P-value
W/C ratio 2 823.327 411.664 243.27 0.000
GBS(%) 5 650.519 130.104 76.88 0.000
W/C ratio*GBS(%) 10 6.169 0.617 0.36 0.954
Error 36 60.920 1.692
Total 53 1540.935
The p-values of the factors GBS (%) and W/C ratio are less than 0.05 confirms about the
significance effect of these factors on 14 days CS of mortar mixes. The interaction plots of 14 days
CS of mortar for various levels of factors is presented in Fig. 4(d), which indicates that interactions
of factors have no significant influence on 14 days CS. For every level of W/C ratio the change in
level of GBS (%) have similar effect on the response 14 days CS. Furthermore, for every level of
GBS (%), enhancement in the level of W/C ratio, reduction in the 14 days CS has been detected.
The ANOVA results also provide similar conclusion as p-value for interaction is more than 0.05.
3.4 28 days CS
The 28 days CS of mortar decreases with the change of W/C ratio from 0.4 to 0.45(Fig. 5(a));
W/C ratio
GBS(%)
0.500.450.40
100806040200100806040200100806040200
50
45
40
35
30
25
20
14
days C
S (
MP
a)
Individual standard deviations were used to calculate the intervals.
42
40
38
36
34
34 32 30
42
40
38
36
34
34 32 30
42
40
38
36
34
34 32 30
W/C ratio
GB
S(%
)
0.500.480.460.440.420.40
100
80
60
40
20
0
620

Influence of granulated blast furnace slag as fine aggregate on properties of cement mortar
(a) (b)
(c) (d)
Fig. 5 (a) Individual value plot (b) Contour plot (c) Main effects plot (d) interaction plot of 28 days CS
however, 28 days CS increases with an increase in GBS (%) from 0% to 60% and beyond this
level it reduces significantly. In this plot, individual standard deviation is used for calculation of
95% of confidence interval. The contour plots for 28 days CS is furnished in Fig. 5(b), which
indicates that contour values reduce with increasing the W/C ratio from 0.4 to 0.5, because of the
weakening cement paste matrix.
However, the value of contour lines increases with increases in the level of GBS (%) from 0%
to 60% and beyond this level 28 days CS of mortar reduces. Fig. 5(c) show the main effects plot
of 28 days CS with the various levels of factors W/C ratio and GBS (%). The 28 days CS of
mortar is 40.78 MPa at 0% GBS, which increases to 47.07 MPa for change in GBS(%) 0% to 60%.
However, it reduces from 47.07 MPa to 35.25 MPa with the change in the GBS(%) from 60% to
100%. It is also obtained that 28 days CS of mortar changes from 46.72 MPa to 37.44 MPa with
change in W/C ratio from 0.4 to 0.5. The analysis of main effect plot indicates that the main effects
of the factors have substantial effect on the response, which can be seen from ANOVA Table
(Table 8). The p-values are less than 0.05 for the main effects of factors. This indicates that 28
days CS is significantly affected by the factors. The interaction plot for 28 days CS of mortar
shows that interaction of factors has no significant impact on the 28 days CS as non-intersecting
lines are obtained from the interaction plots (Fig. 5(d)). This indicates that the impact of one factor
on the response is unaffected by the change in the level of other factor. The behaviour of the factor
W/C ratio
GBS(%)
0.500.450.40
100806040200100806040200100806040200
55
50
45
40
35
30
28
days C
S (
MP
a)
Individual standard deviations were used to calculate the intervals.
48
46
44
42
42
40
40 38
36
W/C ratio
GB
S(%
)
0.500.480.460.440.420.40
100
80
60
40
20
0
621

Rakesh Kumar Patra and Bibhuti Bhusan Mukharjee
Table 8 Analysis of variance for 28 days CS
Source Degrees of Freedom Sum of Squares Mean Square F-value P-value
W/C ratio 2 777.905 388.952 333.81 0.000
GBS(%) 5 864.719 172.944 148.43 0.000
W/C ratio*GBS(%) 10 12.640 1.264 1.08 0.399
Error 36 41.947 1.165
Total 53 1697.210
(a) (b)
(c) (d)
Fig. 6 (a) Individual value plot (b) Contour plot (c) Main effects plot (d) interaction plot of 56 days CS
GBS(%) is similar for all the levels of W/C ratio. i.e., CS of mortar increases upto the addition of
GBS to 60% and reduces beyond 60% regardless of W/C ratio. Similarly, with the increase inW/C
ratio from 0.45 to 0.5, CS decreases at each level of GBS(%). This causes due to the increment in
the amount of voids. Furthermore, the results obtained from the ANOVA study illustrates that
interactions of both factors have no considerable effect on the 28-days CS of mortar as p-value less
than 0.05 is obtained.
3.5 56 days CS
Fig. 6(a) illustrates the individual value plot of the response 56 days CS, which depicts that 56
W/C ratio
GBS(%)
0.500.450.40
100806040200100806040200100806040200
60
55
50
45
40
35
30
56
days C
S (
MP
a)
Individual standard deviations were used to calculate the intervals.
54
52
50
48
46
4644
44
4240
54
52
50
48
46
4644
44
4240
W/C ratio
GB
S(%
)
0.500.480.460.440.420.40
100
80
60
40
20
0
622

Influence of granulated blast furnace slag as fine aggregate on properties of cement mortar
Table 9 Analysis of variance for 56 days CS
Source Degrees of Freedom Sum of Squares Mean Square F-value P-value
W/C ratio 2 759.125 379.562 299.35 0.000
GBS(%) 5 910.896 182.179 143.68 0.000
W/C ratio*GBS(%) 10 12.311 1.231 0.97 0.485
Error 36 45.647 1.268
Total 53 1727.979
(a) (b)
(c) (d)
Fig. 7 (a) Individual value plot (b) Contour plot (c) Main effects plot (d) interaction plot of 90 days CS
days CS improves with the augmentation of GBS up to 60% and after this substitution level
strength starts reducing. Furthermore, enhancement in the level of the other factor has negative
impact on the CS after 56 days. Reduction in contour values of 56 days CS of mortar can be seen
with the rise W/C ratio from 0.4 to 0.5 (Fig. 6(b)). However, improvement in the contour values
are detected with the increase in the GBS(%) from 0 to 60% and beyond this level strength
reduces. Theses contour lines are drawn at an interval of 2 MPa and are ranging from 36 MPa to
54 MPa. Fig. 6(c) represents the main effects of 56 days CS with consideration of varying levels
of two selected factors. The 56 days CS changes from 45.28 MPa to 51.59 MPa with the rise in the
GBS(%) from 0 to 60% and reduces from 51.59 MPa to 39.64 MPa for change in GBS(%) from
56
54
52
50
50
48
48 46
44
42
W/C ratio
GB
S(%
)
0.500.480.460.440.420.40
100
80
60
40
20
0
623

Rakesh Kumar Patra and Bibhuti Bhusan Mukharjee
Table 10 Analysis of variance for 90 days CS
Source Degrees of Freedom Sum of Squares Mean Square F-value P-value
W/C ratio 2 811.60 405.80 401.56 0.000
GBS(%) 5 948.74 189.75 187.77 0.000
W/C ratio*GBS(%) 10 14.75 1.48 1.46 0.195
Error 36 36.38 1.01
Total 53 1811.47
60% to 100%. Increase in the level of W/C ratio from 0.4 to 0.5 reduces the 56 days CS from
51.01MPa to 41.83 MPa. From the aforementioned analysis, the selected factors are considerably
affecting the response which can be confirmed from ANOVA table (Table 9).
The p-value for the factors is less than 0.05 which indicates about presence of significant
influence of factors on the response. However, the interactions of factors have no substantial
impact on the response (p-value >0.05). The interaction of factors have no significant influence as
most of these lines are not intersecting i.e. for every level of GBS(%) , the effect of change of W/C
ratio has similar effect on 56 days CS of mortar. Furthermore, for every level of W/C ratio, CS
after 90 days increases up to 60% and beyond this mark strength decreases.
3.6 90 days CS
The individual values and contour plots of the response 90 days CS with varying W/C ratio and
GBS (%) are presented in Fig. 7(a) and 7(b) respectively. The individual values for a specific
combination factors are found to be close to each other. The individual standard deviation is used
for calculating 95% confidence interval. The individual value plot indicates that CS of mortar after
90 days reduces with increasing W/C ratio from 0.4 to 0.5 and increases with enhancement of the
level of factor GBS (%) from 0% to 60%. However, increase in the factor level from 60% to 100%
shows an adverse effect on the 90 days CS mortar. The contour lines shows a decreasing trend
with augmentation in W/C ratio and for fixed level of W/C ratio, the contour values increase up to
60% and beyond that values start reducing (Fig. 7(b)).
This indicates that beneficial effect of incorporation of GBS could be detected up 60%. The
contour lines are drawn at an interval of 2 MPa and range from 40 MPa to 58 MPa. The main
effects plot indicates about the substantial impact of the factors. The 90 days CS improves from
48.4 MPa to 54.88 MPa with an increase in the level of factor from 0% to 60% and CS reduces
from 54.88 MPa 42.48 MPa for change in the level of GBS (%) from 60% to 100%. Furthermore,
CS after 90 days declines from 54.20 MPa to 44.71 with the change in the W/C ratio from 0.4 to
0.5. The significant effect on factors could be detected from ANOVA table as p-value for the
aforementioned factors less than 0.05 (Table 10).
3.7 28 days WA
The individual value plot of WA of mortar with varying W/C ratio and GBS(%) is illustrated in
Fig. 8(a), which illustrates about the increase in WA with the enhancement in W/C ratio. This
change is probably because of augmentation in quantity of voids in the mortar with rising W/C
ratio. Conversely, the reduction in the WA has been detected with the increase in the GBS(%)
624

Influence of granulated blast furnace slag as fine aggregate on properties of cement mortar
(a) (b)
(c) (d)
Fig. 8 (a) Individual value plot (b) Contour plot (c) Main effects plot (d) interaction plot of WA
from 0% to 60%, which is because of the reduction of amount voids present in the mortar. Further
enhancement in the GBS(%) beyond 60% lead to the increase in WA of mortar mixes.
Fig. 8(b) presents the contour plot of WA of mortar specimens with varying W/C ratio and
GBS(%). The contour lines are drawn at an interval of 0.8% and vary from 3.2% to 9.6%. The
values of contour levels are increased with increase in W/C ratio. However, contour values
decreases with increase in GBS(%) from 0% to 60% for particular level of W/C ratio and further
increase in the GBS(%) increases the WA of mortar. The main effects plot of WA of mortar with
is shown in Fig. 8(c), which illustrates that WA changes from 3.86% to 7.06% with the
enhancement in W/C ratio from 0.4 to 0.5 with increase in the amount of voids in the mortar.
However, WA of mortar reduces from 6.04% to 3.81% when the level of GBS(%) changes from
0% to 60% and further increase in GBS(%) from 60% to 100% the WA increases from 3.81% to
8.2%. The analysis of main effects plot of WA indicates that W/C ratio and GBS(%) are
considerably influencing the WA, which can be confirmed from the ANOVA of test results of WA
(Table 10). The p-value <0.05 and higher F-value confirms that these factors have substantial
impact on WA of mortar. The increase in the amount of void with increasing WA ratio and
densification of mortar with addition of GBS are main reasons for the substantial effect on the
response. However, increasing the incorporation of GBS beyond 60% has negative impact on the
mortar matrix. The interaction plot of WA is shown in Fig. 8(d), which shows that most of lines
are not intersecting each other, which indicates about the insignificance of interaction effect. When
W/C ratio
GBS(%)
0.500.450.40
100806040200100806040200100806040200
11
10
9
8
7
6
5
4
3
2
Wa
ter
ab
sorp
tio
n (
%)
Individual standard deviations were used to calculate the intervals.
8.0
7.2
6.4
6.4
5.6
5.6
4.8
4.8
4.0
3.2
W/C ratio
GB
S(%
)
0.500.480.460.440.420.40
100
80
60
40
20
0
625

Rakesh Kumar Patra and Bibhuti Bhusan Mukharjee
Table 11 Analysis of variance for WA
Source Degrees of Freedom Sum of Squares Mean Square F-value P-value
W/C ratio 2 96.723 48.362 164.04 0.000
GBS(%) 5 122.762 24.552 83.28 0.000
W/C ratio*GBS(%) 10 5.661 0.566 1.92 0.074
Error 36 10.613 0.295
Total 53 235.760
two lines intersect each other or close to each other, interaction effects of the factors is substantial.
Alternatively, the impact of a factor on the response is unaffected by the changing of level of other
factor. This non-existence of interaction effect could be visualized from ANOVA table as the p-
value for the interaction is more than 5% (Table 11).
4. Conclusions
The present study has been designed to access the impact of utilization of GBS as fine
aggregates on the various properties of mortar. Factorial deign of experiment has been employed
with W/C ratio and GBS (%) as factors. The levels of W/C ratio are 0.4, 0.45 and 0.5, and the
levels of GBS(%) are 0%, 20%, 40%, 60%, 80% and 100%. Compressive strength after 3, 7, 14,
28, 56, and 90 days, and water absorption are selected as responses for this study. Two-way
ANOVA has been conducted on the test results for determination of importance of the main and
interaction effects. Furthermore, detailed description of the analysis is carried out by individual
and contour plots, main effect and interaction plots. The inferences of this investigation are
illustrated as follows:
• The individual and contour plots for CS after 3 days of curing illustrates that CS reduces with
increase in the levels of the both factors (W/C) ratio and GBS (%). The wakening of cement
paste with the enhancement in the (W/C) ratio and lower pozzolanic activity during early days
are explanations for this type of behaviour of cement mortar. Moreover, W/C ratio and GBS
(%) are considerably affecting strength after 3 days, which can be seen from ANOVA results
and main effect plots. However, ANOVA results and interaction plot depicts that the
interaction effect has no considerable influence on strength parameters.
• The 7,14, 28, 56 and 90 days CS is reduced with change in the W/C ratio from 0.4 to 0.5 and
increased with the increase in the amount of GBS from 0% to 60% and beyond this level
strength starts reducing. Factors like W/C ratio and GBS(%) have considerable impact on CS
of concrete, which can be observed from the contour and main effect plots. However, analysis
of ANOVA table and interaction plot indicates insignificant influence of interaction between
factors.
• The WA of mortar mixes declines with augmentation in the GBS content up to 60% and after
that it increases. This reduction in WA by the incorporation of GBS(%) is because of reduction
in of voids. However, WA improves with enhancement in w/c ratio because of in the void
quantity.
626

Influence of granulated blast furnace slag as fine aggregate on properties of cement mortar
References Alqadi, A.N., Mustapha, K.N.B., Naganathan, S. and Al-Kadi, Q.N. (2013), “Development of self-
compacting concrete using contrast constant factorial design”, J. King Saud Univ.-Eng. Sci., 25(2), 105-
112.
Ambily, P.S., Umarani, C., Ravisankar, K., Prem, P.R., Bharatkumar, B.H. and Iyer, N.R. (2015), “Studies
on ultra high performance concrete incorporating copper slag as fine aggregate”, Constr. Build. Mater.,
77, 233-240.
Ashish, D.K., Singh, B. and Verma, S.K. (2016), “The effect of attack of chloride and sulphate on ground
granulated blast furnace slag concrete”, Adv. Concrete Constr., 4(2), 101-121.
Babu, J. and Mahendran, N. (2014), “Experimental studies on concrete replacing fine aggregate with blast
furnace slags”, Int. J. Eng. Trend. Technol., 10(8), 1-3.
Binici, H., Aksogan, O., Gorur, E.B., Kaplan, H. and Bodur, M.N. (2008), “Performance of ground blast
furnace slag and ground basaltic pumice concrete against seawater attack”, Constr. Build. Mater., 22(7),
1515-1526.
Binici, H., Aksogan, O., Gorur, E.B., Kaplan, H. and Bodur, M.N. (2009), “Hydro-abrasive erosion of
concrete incorporating ground blast-furnace slag and ground basaltic pumice”, Constr. Build. Mater.,
23(2), 804-811.
B n ci, H., Durgun, M.Y., R zaoglu, T. and Kolu olak, M. (2012), “Investigation of durability properties of
concrete pipes incorporating blast furnace slag and ground basaltic pumice as fine aggregates”, Scientia
Iranica, 19(3), 366-372.
Chithra, S., Kumar, S.S. and Chinnaraju, K. (2016), “The effect of Colloidal Nano-silica on workability,
mechanical and durability properties of High Performance Concrete with Copper slag as partial fine
aggregate”, Constr. Build. Mater., 113, 794-804.
Chunlin, L., Kunpeng, Z. and Depeng, C. (2011), “Possibility of concrete prepared with steel slag as fine
and coarse aggregates: a preliminary study”, Procedia Eng., 24, 412-416.
Correia, S.L., Souza, F.L., Dienstmann, G. and Segadaes, A.M. (2009), “Assessment of the recycling
potential of fresh concrete waste using a factorial design of experiments”, Waste Manage., 29(11), 2886-
2891.
Ding, Y.C., Cheng, T.W., Liu, P.C. and Lee, W.H. (2017), “Study on the treatment of BOF slag to replace
fine aggregate in concrete”, Constr. Build. Mater., 146, 644-651.
dos Anjos, M.A.G., Sales, A.T.C. and Andrade, N. (2017), “Blasted copper slag as fine aggregate in
Portland cement concrete”, J. Environ. Manage., 196, 607-613.
Farooq, M.A., Sato, Y., Ayano, T. and Niitani, K. (2017), “Experimental and numerical investigation of
static and fatigue behavior of mortar with blast furnace slag sand as fine aggregates in air and water”,
Constr. Build. Mater., 143, 429-443.
IS 2386 (1963), Indian Standard Methods of Test for Aggregates for Concrete: Part 3 Determination of
Specific Gravity, Density, Voids, Absorption and Bulking, Bureau of Indian Standards, New Delhi, India.
IS 383 (1970), Indian Standard Specification for Coarse and Fine Aggregates from Natural Sources for
Concrete, bureau of Indian standards, New Delhi, India.
IS 4031 (1988), Indian Standard Method of Physical Tests for Hydraulic Cement: Part 6 Determination of
Compressive Strength of Cement Other than Masonry Cement, Bureau of Indian Standards, New Delhi,
India.
IS 8112 (1959), Indian Standard Specification 43 Grade Ordinary Portland Cement Specification, Bureau of
Indian Standards, New Delhi, India.
Kehagia, F. (2009), “Skid resistance performance of asphalt wearing courses with electric arc furnace slag
aggregates”, Waste Manage. Res., 27(3), 288-294.
Kockal, N.U. (2016), “Investigation about the effect of different fine aggregates on physical, mechanical
and thermal properties of mortars”, Constr. Build. Mater., 124, 816-825.
Lee, B.J., Prabhu, G.G., Lee, B.C. and Kim, Y.Y. (2016), “Eco-friendly porous concrete using bottom ash
627
Rakesh Kumar Patra and Bibhuti Bhusan Mukharjee
aggregate for marine ranch application”, Waste. Manage. Res., 34(3), 214-224.
Lin, K.L., Wang, K.S., Tzeng, B.Y. and Lin, C.Y. (2003), “Hydraulic activity of cement mixed with slag
from vitrified solid waste incinerator fly ash”, Waste Manage. Res., 21(6), 567-574.
Lopez-Gayarre, F., Serna, P., Domingo-Cabo, A., Serrano-Lopez, M.A. and Lopez-Colina, C. (2009),
“Influence of recycled aggregate quality and proportioning criteria on recycled concrete properties”,
Waste Manage., 29(12), 3022-3028.
Mithun, B.M. and Narasimhan, M.C. (2016), “Performance of alkali activated slag concrete mixes
incorporating copper slag as fine aggregate”, J. Clean. Prod., 112, 837-844.
Montgomery, D.C. (2010), Design and Analysis of Experiments, WileyIndia, NewDelhi.
Mukharjee, B.B. and Barai, S.V. (2014a), “Assessment of the influence of Nano-Silica on the behavior of
mortar using factorial design of experiments”, Constr. Build. Mater., 68, 416-425.
Mukharjee, B.B. and Barai, S.V. (2014b), “Statistical techniques to analyze properties of nano-engineered
concrete using Recycled Coarse Aggregates”, J. Clean. Prod., 83, 273-285.
Mukharjee, B.B. and Barai, S.V. (2015b), “Characteristics of sustainable concrete incorporating recycled
coarse aggregates and colloidal nano-silica”, Adv. Concrete Constr., 3(3), 187-202.
Mukharjee, B.B. and Barai, S.V. (2015b), “Development of construction materials using nano-silica and
aggregates recycled from construction and demolition waste”, Waste Manage. Res., 33(6), 515-523.
Nehdi, M.L. and Summer, J. (2002), “Optimization of ternary cementitious mortar blends using factorial
experimental plans”, Mater. Struct., 35(8), 495-503.
Neville, A.M. (1997), Properties of Concrete, 4th and Final Edition, Pearson Education Limited. Harlow,
United Kingdom.
Pal, S.C., Mukherjee, A. and Pathak, S.R. (2003), “Investigation of hydraulic activity of ground granulated
blast furnace slag in concrete”, Cement Concrete Res., 33(9), 1481-1486.
Pang, B., Zhou, Z. and Xu, H. (2015), “Utilization of carbonated and granulated steel slag aggregate in
concrete”, Constr. Build. Mater., 84, 454-467.
Patra, R.K. and Mukharjee, B.B. (2016), “Fresh and hardened properties of concrete incorporating ground
granulated blast furnace slag-A review”, Adv. Concrete Constr., 4(4), 283-303.
Patra, R.K. and Mukharjee, B.B. (2017a), “Influence of incorporation of granulated blast furnace slag as
replacement of fine aggregate on properties of concrete”, J. Clean. Prod., 165, 468-476.
Patra, R.K. and Mukharjee, B.B. (2017b), “Properties of concrete incorporating granulated blast furnace slag
as fine aggregate”, Adv. Concrete Constr., 5(5), 437-450.
Rashad, A.M., Sadek, D.M. and Hassan, H.A. (2016), “An investigation on blast-furnace stag as fine
aggregate in alkali-activated slag mortars subjected to elevated temperatures”, J. Clean. Prod., 112, 1086-
1096.
Senff, L., Hotza, D., Repette, W.L., Ferreira, V.M. and Labrincha, J.A. (2010), “Mortars with nano-SiO2 and
micro-SiO2 investigated by experimental design”, Constr. Build. Mater., 24(8), 1432-1437.
Shu, C.Y., Kuo, W.T. and Juang, C.U. (2016), “Analytical model of expansion for electric arc furnace
oxidizing slag-containing concrete”, Comput. Concrete, 18(5), 937-950.
Singh, G. and Siddique, R. (2016), “Strength properties and micro-structural analysis of self-compacting
concrete made with iron slag as partial replacement of fine aggregates”, Constr. Build. Mater., 127, 144-
152.
Singh, G., Das, S., Ahmed, A.A., Saha, S. and Karmakar, S. (2015), “Study of Granulated Blast Furnace
Slag as Fine Aggregates in Concrete for Sustainable Infrastructure”, Procedia-Social Behavioral Sci.,
195, 2272-2279.
Topçu, I.B. and Boga, A.R. (2010), “Effect of boron waste on the properties of mortar and concrete”, Waste
Manag. Res., 28(7), 626-633.
Valcuende, M., Benito, F., Parra, C. and Minano, I. (2015), “Shrinkage of self-compacting concrete made
with blast furnace slag as fine aggregate”, Constr. Build. Mater., 76, 1-9.
Yüksel, I., Bilir, T. and Ozkan, O. (2007), “Durability of concrete incorporating non-ground blast furnace
slag and bottom ash as fine aggregate”, Build. Environ., 42(7), 2651-2659.
Zeghichi, L. (2006), “The effect of replacement of naturals aggregates by slag products on the strength of
628

Influence of granulated blast furnace slag as fine aggregate on properties of cement mortar
concrete”, Asian J. Civ. Eng., 7(1), 27-35.
CC
629