industrial sector water use survey 2006€¦ · handle the type of treatment of said water, ... in...
TRANSCRIPT

Industrial sector water use survey
2006
- PILOT STUDY -
Environmental Statistics and Accounts
National Statistics Institute
INE
. Nat
ion
al S
tati
stic
s In
stit
ute

Index
1 Introduction 4
2 Design of the statistical study of the module on water in
industry 5
2.1 Objectives 5 2.2 Scope 6 2.3 Framework and sample 6 3 Variables and definitions 7 3.1 Water supply 7 3.2 Wastewater 8 4 Incidences in the information collection 8 4.1 Total and partial non-response 8 4.2 Sample response structure of different variables 12 4.2.1 Water supply 14 4.2.2 Wastewater dumped and produced 15 4.2.3 Cooling water 17 4.2.4 Water reused 18 5 Re-encoding and imputation 18 5.3 Re-encoding 18 5.4 Imputation 19 6 Estimators 20 7 Manufacturing industries 22 7.1 Physical magnitudes 22 7.2 Monetary magnitudes 26 8 Extractive industries 27 9 Energy industries 28
2
INE
. Nat
ion
al S
tati
stic
s In
stit
ute

10 Comparison of results with other sources 29 10.1 Industrial sector water use survey (1999) 29 10.2 Survey on Water Supply and Treatment (2006) 30 10.3 Other external sources of an administrative origin 30 11 Conclusions 31 Annexes 32 Subsection literal from CNAE-93 Rev.1 32 Questionnaire from the water use module in Waste
Production in Industry Survey 2006 33
INE
. Nat
ion
al S
tati
stic
s In
stit
ute

1. Introduction
Water is one of the most important resources in industry, as it may be employed for numerous uses, as a raw material, for refrigeration, as a solvent, transport and cleaning agent, source of energy (hydroelectric plants, production of steam and motive power) or as a constitutive part of the product itself.
There are industries that use water intensively, as in the case of the manufacture of chemical products, iron, steel and paper pulp, which makes it necessary to implant the processes that allow for the recovery and recycling of water and the reduction of the volume of water required per production unit.
The origin of the water used by industry may be one of two types: water supplied by the urban supply networks (mostly drinking water) or their own collections, which at the same time, may be carried out directly or through other methods, such as the provision of industrial estates themselves. As a general rule, the studies on industrial water demand refer solely to the manufacturing industry, and exclude the extractive industries, due to the intrinsic difficulty that this sector presents, as it is simultaneously a water user (cleaning, classifying, cutting and polishing minerals, etc...) and a water producer (mine bailing, filtrations from mine shafts and quarries, etc.). The Waste Production in Industry Survey (WPI) includes a small sample of this type of company, as well as of those whose main activity is the production and distribution of energy, and therefore it is only possible to have a limited amount of information available regarding water use in these sub-sectors.
The industrial supply of water through municipal supply networks is accounted for via the corresponding invoicing, in many cases, the prices applied to industrial water being different from the price for households and services. As a result, there is generally an adequate measurement of the physical and monetary flows. However, water collection by industrial companies themselves presents important measurement problems, due to the lack of capacity, the great geographical dispersion of the industries and the complexity of the production processes themselves. In fact, the demand for water frequently comes to accommodate the supply, the water demand being a function of a series of specific variables, such as quantity and type of final product produced, the manufacturing system adopted or the volume of water re-used. It is no surprise, therefore, that industries from the same branch of activity and with a similar production, require very different water volumes.
The dumping of water of an industrial origin poses important risks and problems with environmental pollution, and thus, since the 1980s, the legislation and administrative norms that regulate this dumping have evolved very significantly. Pressed by increasingly demanding regulations and norms and the need to cut costs, companies have taken great steps to reduce the pollution produced. Each type of industrial activity, according to the production process applied, dumps wastewater that contains a potentially contaminating characteristic, and thus, to handle the type of treatment of said water, it must consider the characteristics of
4
INE
. Nat
ion
al S
tati
stic
s In
stit
ute
the sources (organic, inorganic, particles in suspension or from cooling of thermal and nuclear plants). The relationship between the volume of water supplied (used) and the volume dumped is greater in the cases in which the water is used for cleaning, dissolution and material transport processes, and also depends on the consumption of water that is incorporated in the product.
This complexity of certain variables of the observation universe has led to the custom of establishing, for guidance purposes, water supplies in terms of the surface area occupied by the industrial establishment, in the case of industrial estates, as well as average supplies of demand for water, in terms of the number of workers or the Gross Added Value (GAV) generated, according to the economic branch to which the activity that said establishment belongs (Order of the Ministry of the Environment and Rural and Marine Affairs of 10 September 2008). These average supplies can provide reasonable global estimates if they are applied to sectors on which there is previous knowledge of their characteristics, but that do not offer great intrinsic reliability, and it is necessary to carry out specific statistical studies.
Some authors question the use of this type of indicator, and suggest the use of other variables that provide a better correlation with water consumption. This could be the case, for example, for the electrical capacity hired or the energy consumption.
On the other hand, the Hydrological Basin Plans can also offer information regarding this problem, though they are not always comparable in themselves, given the different interpretation as per the part of industry considered within urban demand.
2. Design of the statistical study of the module on water in
industry.
2.1 Objectives
From the aforementioned, we may deduce the need to make an effort to improve the statistics available regarding water use in industry, as is recommended in the White Water Book (2000). In order to face these information requirements, in the year 1999, the INE carried out an Industrial sector water use survey, which allowed for establishing some initial estimates of the magnitudes that comprised water use in the industrial sector.
Subsequently, for the purpose of optimising costs and implanting an annual data collection, the Waste Production in Industry Survey (WPI) from the year 2004 included a model referring to the supply of water and the treatment of wastewater. Based on said module, a study was conducted on the coverage of a certain number of control variables, to evaluate the quality of the information collected and allow for the extrapolation of the results obtained in 1999, with the objective of compiling the satellite water accounts.
5
INE
. Nat
ion
al S
tati
stic
s In
stit
ute

With reference year 2006, we proceeded to a more detailed use of the information collected in the module on water of the WPI, obtaining a series of results and indicators that provide a joint perspective on the variables that comprise the demand for water use in the industrial sector and the treatment of wastewater. Use in subsequent years will allow for contrasting the quality of said information, following-up on the temporal coherence of the data that will serve to support the estimates of the satellite water accounts.
It is worth noting that the study of the module presented herein considers health water (bathrooms, showers, canteens, etc...) to be water used with an auxiliary nature in the productive process, therefore being included in the global computation of the water used within the same.
2.2 Scope
The target population of study is the set of industrial establishments with more than ten workers, whose main activity corresponds to sections C, D, and E of NCEA−93− Rev.1, that is, the manufacturing, extractive and electrical energy production and distribution industries. Excluded from the population scope studied are those activities related to recycling (division 37) and to the collection, purification and distribution of water (division 41 of NCEA−93− Rev.1). The
industrial establishments are researched irregardless of the main activity of the company to which they belong. Beginning in the year 2008, NCEA 2009 shall be applied in the definition of the population studied.
From a geographical point of view, the target population of study is the set of units that carry out their productive activity throughout the entire country.
The WPI is conducted annually, and the data requested refers to the calendar year prior to the year of the data collection.
2.3 Framework and sample
Given that the module is integrated in the WPI, the framework and type of sampling are those which comprise said survey and appear in the methodology that is available on the INE website. The sample size and design only allow, for the variables included in the water module, for obtaining results for the national total and for each one of the branches of economic activity, and it is not currently possible to break down the data by branch and Autonomous Community.
The design strata (TAME, "establishment size") are related in the attached graph. The last two strata are researched comprehensively.
6
INE
. Nat
ion
al S
tati
stic
s In
stit
ute

Table no. 1: Establishment size
TAME Employee bracket
14 10-19
15 20-49
16 50-99
17 100-199
18 200-499
19, 20 and 21 500 and over
As indicated previously, establishments with fewer than ten workers are excluded from the sampling. The design is carried out on a national level. Under study are indirect estimation models for the regionalisation of some results.
3. Variables and definitions
The target module of study in this document regarding water use in industry has been integrated into the WPI referring to the year 2006, whose information was collected during the second and third quarters of the year 2007; it consists of two parts: the first on water supply broken down according to the origin of the same, mentioning the amounts satisfied by said resources, and the second on the volume of wastewater dumped and its treatment.
For a better comprehension and interpretation of the results presented in this study, the following defines the variables and characteristics collected in the module. An annex includes the questionnaire of water module 2006, where it is possible to view the different items that are mentioned in the text.
3.1 Water supply
Through a public network: this refers to the volume of water that the establishment receives through an urban water supply network. As a general rule, this is purified water for human consumption.
Private collection: this refers to the water collected with the installations and equipment of the establishment itself. Said water may have several origins:
- Surface water: this includes rivers, runoff water and lakes, as well as artificial water channels such as irrigation channels, industrial and navigation channels, drainage systems and artificial reservoirs.
- Groundwater: this is generally extracted through wells or drillings. Water from natural springs is included in groundwater.
7
INE
. Nat
ion
al S
tati
stic
s In
stit
ute

- Sea water: this also includes brackish waters from sea transition. Sea water that is desalinated before use is different from that which is used directly without the need for desalinisation.
- Other types of water resource: they may be rainwater stored directly in rainwater tanks or deposits, as well as water from decantation tanks or still water, water contained in the raw material, water supplied by irrigation communities, etc. As a general rule, these resources are insignificant in comparison with the resources cited in previous sections.
Value of the water collection tax: this refers the amount paid to the Basin Organism (Hydrographic Confederation or Autonomous Community in the case of internal basins for the collection of said water).
Value of the public water supply: this is the amount charged to users for the water service.
3.2 Wastewater
Wastewater is that which is generated as a result of the activity of the industrial establishment. Rainwater or runoff water from installations or buildings should not be considered wastewater. This magnitude is measured in m3 / day.
Volume of treated and untreated water: the filtering and treatment of said water should be carried out in a plant located in the installations of the company or organism itself.
Volume of water dumped: this refers to the wastewater dumped outside of the installations of the company or organism. Its destination may be a public sewerage network (including collectors), the sea, a fluvial channel (rivers, ravines, lakes, etc...), a septic tank or other recipient media (underground storage, still water areas, etc...).
Value of dumping tax: when the wastewater is dumped directly into the sea or a fluvial channel, its dumping may be subject to taxation, according to its volume and pollutant load. Said taxation is expressed in the form of a tax that may be paid to the Basin Organism, or Autonomous Community, in the case of dumping into the sea.
Volume of water re-used, from wastewater generated by the company itself: this refers to the wastewater treated by the establishment itself.
4. Incidences in the information collection
4.1 Total and partial non-response
In general, worth noting is that the difficulties found in the data collection yet to be mentioned for the most significant variables, are mainly related to the absence
8
INE
. Nat
ion
al S
tati
stic
s In
stit
ute

of adequate physical accounting in the industrial establishments, with the resulting impact on errors unrelated to the sampling.
Total non-response is determined by the difference between the theoretical survey sample and the real sample, that is, by the units from which a completed questionnaire is not obtained once the survey fieldwork is finished. The total response rate is expressed as the quotient between the real sample and the theoretical sample. Total non-response may be caused by a multitude of factors that affect the survey framework (units that de-list before the fieldwork begins, mergers, acquisitions, etc.), localisation incidences (not locatable, temporary de-listings, etc.) or different types of refusal to cooperate. These incidences affect both the main sample (WPI) and the water use module.
The partial response rate for a specific variable of the questionnaire can be expressed as the quotient between the number of registers in which said variable takes on an accepted value, and the real sample. Given that, in the blank responses, it is not possible to distinguish between the "does not apply" and "no data recorded" incidences, we cannot speak of "partial response rates" in a strict sense. Therefore, in the tables presented in this study, it has been considered convenient to use the expression, "proportion of partial response", although this seems to be much like the partial response rate.
The breakdown of the mentioned rates in the following tables has been carried out by the number of workers in the establishment ("TAME") and the branch of activity of the same in the real sample, which are the dimensions that define the stratum. Table no. 2: Theoretical and real sample, by TAME
TAME Data
14 15 16 17 18 19, 20 and
21
Total
Theoretical 1,278 1,552 1,044 1,053 1,032 230 6,189
Real 915 1,248 821 881 917 220 5,002
In view of table no. 2, the total response rate for the whole of the industrial sector reached 80.8%.
9
INE
. Nat
ion
al S
tati
stic
s In
stit
ute

Table no. 3: Theoretical and real sample, by subsection
Subsection Data
Theoretical 30 CA
Real 24
Theoretical 194 CB
Real 139
Theoretical 811 DA
Real 686
Theoretical 419 DB
Real 312
Theoretical 159 DC
Real 111
Theoretical 211 DD
Real 168
Theoretical 595 DE
Real 460
Theoretical 19 DF
Real 17
Theoretical 538 DG
Real 471
Theoretical 303 DH
Real 255
Theoretical 506 DI
Real 418
Theoretical 824 DJ
Real 673
Theoretical 395 DK
Real 317
Theoretical 463 DL
Real 355
Theoretical 363 DM
Real 315
Theoretical 324 DN
Real 252
Theoretical 35 EE
Real 29
Theoretical 224 Total C
Real 163
Theoretical 5,930 Total D
Real 4,810
Theoretical 6,189 Total
Real 5,002
The literals of NCAE−93 codes may be viewed in the Annex.
10
INE
. Nat
ion
al S
tati
stic
s In
stit
ute

As may be observed in table no. 3, for the manufacturing industries (Section D), the theoretical sample was 5,930 units, and the real sample was 4,810. Therefore, the total response rate was 81.1%. For the extractive industries (Section C), said rate was 72.8%, and for the production and distribution of electrical energy (Section E), it was 82.9%.
The following tables present the proportions of response in the whole of the real sample for the most significant variables, and in the three strata of establishment size in which the sample has been grouped for purposes of applying the estimators.
In table no. 4.1, we observe that the variable with the highest proportion of response, for both physical and monetary quantities, was that relating to the water supplied by the public supply networks. The reason for this fact is that, as noted previously, these volumes of water are invoiced by entities and companies in charge of said water supply.
Table no. 5 show us that the total response rate was positively correlated to the size (number of workers) of the establishment (76.4%; 81.2%; 90.1%).
If we study the proportions of response by stratum in this table, as can be expected, the ratios relating to the volume of water supplied through a public network did not vary greatly. However, for the variable of water collected by the company itself, we observe that the proportion increased significantly with the size of the establishment (18.4%; 33.7%; 43.3%). A similar phenomenon occurred for the volume of water reused (8.1%; 11.6%; 17.5%) and for the payment of the dumping tax (8.9%; 21.2%; 27.3%). Table no. 4.1: Proportions of partial response (Total industry)
Theoretical sample 6,189
Real sample 5,002 80.80%
Proportions of response
Section 1 Water supply
Volume of water collected by the company 1,463 29.20%
Volume of water supplied through a public network 4,253 85.00%
No volume recorded 141 2.80%
Value of the water collection tax 835 16.70%
Value of the public supply 4,231 84.60%
Section 2 Wastewater treatment
Total volume of wastewater produced 4,855 97.10%
Total volume of water dumped 4,769 95.30%
Volume of water reused 573 11.50%
Value of the sanitation and sewerage quotas 3,608 72.10%
Value of the dumping tax 864 17.30%
11
INE
. Nat
ion
al S
tati
stic
s In
stit
ute

Table no. 4.2: Proportions of partial response (Total manufacturing industries) Theoretical sample 5,930 Real sample 4,810 80.80%
Proportions of response over the real sample
Section 1 Water supply
Volume of water collected by the company 1,347 28.0%
Volume of water supplied through a public network 4,161 86.5%
No volume recorded 128 2.7%
Value of the water collection tax 779 16.2%
Value of the public supply 4,139 86.0%
Section 2 Wastewater treatment
Total volume of wastewater produced 4,680 97.3%
Total volume of water dumped 4,615 95.9%
Volume of water reused 521 10.8%
Value of the sanitation and sewerage quotas 3,556 73.9%
Value of the dumping tax 807 16.8%
Table no. 5: Proportions of response by TAME (Total industry) TAME < 50 workers
Theoretical sample 2830 Real sample 2163 76.4% Proportions of response Section 1 Water supply
Volume of water collected by the company 397 18.4%
Volume of water supplied through a public network 1833 84.7%
No volume recorded 84 3.9%
Value of the water collection tax 227 10.5%
Value of the public supply 1828 84.5%
Section 2 Wastewater treatment
Total volume of wastewater produced 2076 96.0%
Total volume of water dumped 2031 93.9%
Volume of water reused 176 8.1%
Value of the sanitation and sewerage quotas 1601 74.0%
Value of the dumping tax 193 8.9%
12
INE
. Nat
ion
al S
tati
stic
s In
stit
ute

49 < TAME < 200 workers Theoretical sample 2097 % Real sample 1702 81.2% Proportions of response
Section 1 Water supply
Volume of water collected by the company 574 33.7%
Volume of water supplied through a public network 1432 84.1%
No volume recorded 46 2.7%
Value of the water collection tax 336 19.7%
Value of the public supply 1423 83.6%
Section 2 Wastewater treatment
Total volume of wastewater produced 1655 97.2%
Total volume of water dumped 1630 95.8%
Volume of water reused 198 11.6%
Value of the sanitation and sewerage quotas 1202 70.6%
Value of the dumping tax 361 21.2%
TAME > 200 workers
Theoretical sample 1262 %
Real sample 1137 90.1%
Proportions of response
Section 1 Water supply
Volume of water collected by the company 492 43.3%
Volume of water supplied through a public network 988 86.9%
No volume recorded 11 1.0%
Value of the water collection tax 272 23.9%
Value of the public supply 980 86.2%
Section 2 Wastewater treatment
Total volume of wastewater produced 1124 98.9%
Total volume of water dumped 1108 97.4%
Volume of water reused 199 17.5%
Value of the sanitation and sewerage quotas 805 70.8%
Value of the dumping tax 310 27.3%
4.2 Response sampling structure in different variables (manufacturing industries)
The following analysis refers solely to the sector of the manufacturing industries, due to the fact that the coverage and sampling size in these activities allows for carrying out a more detailed study of non-response.
13
INE
. Nat
ion
al S
tati
stic
s In
stit
ute
4.2.1. Water supply
In the case of water supply by urban networks, there is the case in which the informant cannot supply this data because it is a rented premises, and pay the owner these expenses, because said expenses are included in the overall expenses for the rental of a building in an industrial estate, or because they are exempt from payment due to being a new installation or by agreement entered into with the corresponding municipality.
Referring to private water collection, especially of groundwater, many informants do not have meters or measurement instruments to calculate the volume extracted. On the other hand, when a well or drilling is the property of the establishment, no payment at all is made as a collection tax.
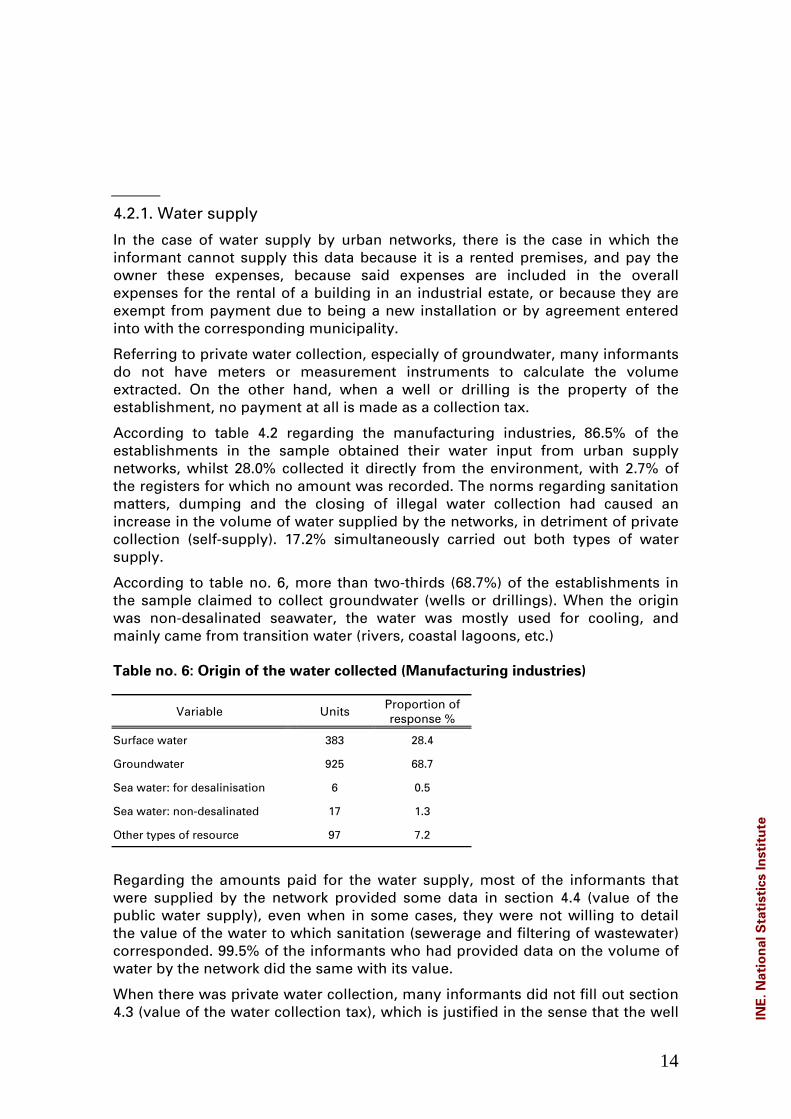
According to table 4.2 regarding the manufacturing industries, 86.5% of the establishments in the sample obtained their water input from urban supply networks, whilst 28.0% collected it directly from the environment, with 2.7% of the registers for which no amount was recorded. The norms regarding sanitation matters, dumping and the closing of illegal water collection had caused an increase in the volume of water supplied by the networks, in detriment of private collection (self-supply). 17.2% simultaneously carried out both types of water supply.
According to table no. 6, more than two-thirds (68.7%) of the establishments in the sample claimed to collect groundwater (wells or drillings). When the origin was non-desalinated seawater, the water was mostly used for cooling, and mainly came from transition water (rivers, coastal lagoons, etc.) Table no. 6: Origin of the water collected (Manufacturing industries)
Variable Units Proportion of response %
Surface water 383 28.4
Groundwater 925 68.7
Sea water: for desalinisation 6 0.5
Sea water: non-desalinated 17 1.3
Other types of resource 97 7.2
Regarding the amounts paid for the water supply, most of the informants that were supplied by the network provided some data in section 4.4 (value of the public water supply), even when in some cases, they were not willing to detail the value of the water to which sanitation (sewerage and filtering of wastewater) corresponded. 99.5% of the informants who had provided data on the volume of water by the network did the same with its value.
When there was private water collection, many informants did not fill out section 4.3 (value of the water collection tax), which is justified in the sense that the well
14
INE
. Nat
ion
al S
tati
stic
s In
stit
ute

is their property, in terms of an exemption of payment for this reason or because there were payment claims in progress, etc. , which requires more detailed research of this type of incidence.
In terms of private water collection, 28.0% who had indicated the volume collected (independently of the origin of the water), only 57.8% indicated a figure in the collection tax. Of the 42.2% without a response in the value of the collection tax, 23.7% corresponded to surface water, 72.5% to groundwater and the rest (3.8%) to other types of resource.
4.2.2 Wastewater dumped and produced
The measurement of the volumes of these water flows causes numerous difficulties for the informant units, given that, as a general rule, there are no meters for measuring this type of water, and therefore the amounts reflected in the questionnaire are approximate estimates. The amounts for the dumping (sewerage or filtering quotas and dumping tax) or payments made to an authorised manager in charge of evacuating the wastewater, have served to improve the estimation of said volumes.
Given that the volume of wastewater is requested in m3/day, for the purpose of obtaining the total volume, making its product with the number of days per year of dumping, the completion of these sections has also had its difficulties.
The two circumstances mentioned above have led to the obligation of carrying out a series of imputations, in order to make the magnitudes of the input of water and of wastewater dumped coherent.
Regarding the destination of the wastewater dumped, worth noting is that many informants indicated item 5.2.4 (to other recipient media), specifying a septic tank, which was supported on marking, in section 6 (type of wastewater treatment) the item related to the septic tank. With the objective of clarifying this problem, in the module for the year 2007 and subsequent modules, it has been considered appropriate to include, specifically, the septic tank as a destination of the wastewater, and not as a type of treatment.
On the other hand, in terms of the volume of water treated, and its characteristics before and after the treatment, a certain confusion has arisen among the informants, perhaps due to the route of questions in the questionnaires not making it clear enough that said variables refer to water filtered / treated by the company itself, and not in wastewater treatment plants (WTP) that collected the wastewater from the sewers. This problem has advised to include, in the module for 2007, a filter question that asks whether the establishment itself treats the wastewater generated in its production process.
These incidences have made it impossible to use the questions regarding the volumes of water treated by the company or establishment itself, and the characteristics of the wastewater before and after the treatment, focusing the study on the volumes of water dumped and on their destination in the environment.
15
INE
. Nat
ion
al S
tati
stic
s In
stit
ute

Table no. 7 presents the response sampling proportions relating to the volumes of water that are produced, treated, untreated and dumped, and that must be interpreted, bearing in mind the aforementioned exceptions.
Table no. 7: Wastewater produced, treated and untreated (Manufacturing
industries)
Variable Units %
Volume of water produced 4,680 97.3
Volume of water treated 1,404 30.0
Volume of water untreated 3,756 28.4
Volume of water dumped 4,615 95.9
For the wastewater produced, the response rate was 97.3%, with the marginal distributions being 19.7% for the units that treated all of the water produced, 70% for those that did not treat the water produced and 10.3% for those that only treated part of it.
In order to calculate the ratios of the physical and economic variables related to wastewater, we used as a base the volumes of wastewater dumped, this variable having been completed by 4,615 informant units (95.9%).
Table no. 8 illustrates the destination of the water dumped. As could be expected, most of the water was dumped into the sewerage network, with direct dumping into the environment (fluvial channel or the sea) being a minority. In the "other means" heading, there were the septic tanks, decantation tanks, tanks, deposits or containers, as well as other means that were re-encoded to other headings. Said re-encoding shall be displayed in the following section. For illustrative purposes, the number of responses to the "septic tank" item in the sixth section of the module (type of treatment) reached 477 registers. Table no. 8: Destination of the wastewater dumped (Manufacturing industries)
Variable Units %
Sewerage system 3,826 82.9
Sea 75 1.6
Fluvial channel 371 8.0
Other means 553 12.0
In terms of the amounts paid by the establishment for the purpose of dumping wastewater, the module collects, in variables 5.10 and 5.11, respectively, the value of the sanitation quotas (fees and quotas for sewerage, wastewater filtering and the sanitation tax), as well as the values of the dumping tax.
It is important to note that, for the informants, it is difficult to differentiate between the different types of value, due both to the variety that exists in the
16
INE
. Nat
ion
al S
tati
stic
s In
stit
ute

format of the water invoices, and to the semantic confusion that arises in this field. Here, they usually confuse the sanitation tax with the dumping tax, which we have tried to correct in the re-encoding, as its imposition is related to the destination of the wastewater (respectively, the sewerage network or a fluvial channel / marine environment).
In turn, a certain number of informant units showed, in the observations section of the questionnaire, that the amounts paid were for the cleaning of septic tanks or for the evacuation, in trucks, of wastewater and sludge on behalf of a waste manager. Conceptually, these payments are of an environmental protection expense nature, but should not be included in the expenses incurred for the filtering or dumping of wastewater.
73.9% of the establishments paid quotas or fees for sanitation and/or sewerage. As regards these quotas, there should be coherence with the environmental destination of the wastewater dumped. In fact, if water is dumped into a public sewerage network, quotas should be paid for sanitation. In the case that the destination of the wastewater is a fluvial channel or the sea, an amount may be paid as a dumping tax.
Following these criteria, 9.1% of the informants that claimed to dump wastewater into the sewerage system, did not claim quotas for this item. 10.3% of those who dumped volumes of wastewater into a fluvial channel or into the sea did not provide data regarding the dumping tax.
4.2.3 Cooling water
Regarding cooling water, this is included in the input of water. The difficulty in delimiting the circuits of this water within the productive process, and the number of times that said water is introduced in the same - since this questionnaire does not consider these matters - made it impossible to use this variable, limiting the study to identifying some sampling values that illustrate the marginal distribution of this variable.
Considering the breakdown by economic activity, worth noting is that divisions 24 (chemistry) and 27 (metallurgy) had, in volume, the highest percentage of cooling water as compared with the total volume of collected water (67.9% and 55.1%, respectively).
Table no. 9: Origin of cooling water (Manufacturing industries)
Variable Units Cooling water %
Surface water 383 128 33.4
Groundwater 925 256 27.7
Sea water for desalinisation 6 2 33.3
Non-desalinated sea water 17 10 58.8
Other types of resource 97 16 16.5
Supply by the network 4,161 543 13.0
17
INE
. Nat
ion
al S
tati
stic
s In
stit
ute

Table no. 10: Cooling water as compared with the volume of water collected
(Manufacturing industries)
Variable Total volume Cooling water
%
Surface water 254,169 48,550 19.1
Groundwater 127,319 15,525 12.2
Sea water for desalinisation 1,549 502 32.4
Non-desalinated sea water 132,406 131,150 99.1
Other types of resource 14,721 1,679 11.4
Supply by the network 154,764 22,201 14.3
4.2.4 Water reused
For the variable "water reused", 521 informants responded, though there has been certain confusion on behalf of the informant in the comprehension of the exact scope of the term "reused". In the module referring to the year 2007, it has been established this is the wastewater produced by the establishment itself during its productive process. 1.2% of the units interviewed reused all of the water that they produced in their productive process. As with the aforementioned for the cooling water, given that the water reused is continuously included in the input of water, there may be a certain lack of definition at the time of limiting its magnitude.
Even when its use is still insignificant in industry, for the year 2007, the section on water supply has included a heading regarding the wastewater regenerated supplied to the industrial establishment by third parties, that is, filtered water from a wastewater treatment plant (WTP).
5. Re-encoding and imputation
5.1 Re-encoding
The re-encoding has been applied to the variables 4.1.5 "other types of water resources" in the case of water collected by the company itself, and 5.2.4 "other recipient media" for the wastewater dumped.
The "other types of resources" heading includes origins of water, such as rain, water condensation contained in the raw material, water in the raw material (tomatoes, clay, etc.). In this case, 54 registers have been re-encoded to heading 4.1.1 (surface water) and 4.1.2 (groundwater).
In the second of the aforementioned cases, 204 registers have been re-encoded. As indicated previously, the heading "to other recipient media" may cite septic
18
INE
. Nat
ion
al S
tati
stic
s In
stit
ute

tanks, cesspools, dirty water tanks, decantation and lagooning tanks, as well as waste managers who are in charge of the evacuation of the wastewater and sludge produced. This re-encoding must be coherent, as indicated previously, with the existence or absence of sanitation quotas and dumping taxes.
5.2 Imputation
The rank controls relating to the water reused implied that the input of water (4.1 + 4.2) had to be in the interval of 0.8 - 1.2 of the water dumped plus the water reused (5.2 + 5.3). This condition was fulfilled by 64.1% of those surveyed, illustrating the great difficulty in establishing the physical balance of said water, which in some cases can be reintegrated in the productive process, and in others, can be used in processes that are auxiliary to the same (cleaning, garden irrigation, etc.).
As mentioned previously, one problem that the informants face is the impossibility of carrying out the breakdown between the value of the public water supply (4.4) and the value of the sanitation quotas (5.10), due to the fact that, in many cases, the premises occupied by the industrial establishment is rented, and the owner invoices an amount for "water".
From the Survey on Water Supply and Treatment, carried out by the INE, we infer that the breakdown between these two concepts was 65% and 35%, percentages that were reproduced almost exactly in the sampling values of the registers from the water module under study. Therefore, these distribution percentages have been applied to the quantities that both concepts encompassed regarding the water supplied by the network. Following this agreement, 110 registers have been imputed.
Another case of imputation arises for the volume of water supplied by the network, but not its value; the volume of water collected, but not the value of the water collection tax. The general rule applied has been to impute the values of the two amounts from the volumes, although in some very limited cases, the imputation has been carried out in the reverse order.
To handle this matter, four unit costs (prices per physical unit) have been selected, two for the water supply and another two for the wastewater dumping.
Unit cost of water from the network: quotient between the value of the supply and the volume of water supplied.
− Unit cost of the water collection tax: quotient between the value of said tax and the volume of water - distinguishing between surface water and groundwater - collected by the company.
− Unit cost of the sanitation quotas: quotient between the value of said quotas and the volume of wastewater dumped.
− Unit cost of the dumping tax: quotient between the value of said quotas and the volume of water dumped.
19
INE
. Nat
ion
al S
tati
stic
s In
stit
ute

By an iterative procedure, the optimum interval is identified for the calculation of the donor value of the imputation.
The following table illustrates the number of imputed registers.
Table no. 11: Number of Registers Imputed (Manufacturing industries)
Unit values Registers
Water from the network 56
Water collection tax (surface water) 55
Water collection tax (groundwater) 132
Water collection tax (both types of water) 14
Sanitation quotas 594
Dumping tax 79
A high number of imputations has been observed in the sanitation (sewerage and filtering) quotas. This is due to the fact that said quotas are established not only depending on the volume of wastewater dumped into the sewerage network, but also on the pollutant load of said water.
6. Estimators
This stage tries to obtain data on a national scope, from the data that the sample provides.
The procedure begins with the calculation of the direct estimator, that is, based on the survey design, this is obtained through:
∑∑∑ ==*
(ˆˆhn
ihih
hh
hwyyY + ); with ∑
≠hk
'k
n
jjk wy
hk
∑ *
*ˆ
h
hh n
Nw = and
k
kk n
Nw ='
Where the first sum covers units i (establishments) of the real sample in stratum h, which has not changed stratum, and the second sum is extended to all
of the units that have changed from stratum k to stratum h.
*hn
hhn
*ˆhN refers to the total estimator of the stratum provided by the design, corrected
from the proportion of units from the theoretical sample of stratum h that change to another stratum, and the temporary inactive units (in), duplicates (d) and direct collection (rd) estimated by the proportion of the theoretical sample in the stratum that each incidence presents. That is,
∑≠
−++
−=hk h
kh
hhh n
nn
rdindNN 1(ˆ * ) (2)
20
INE
. Nat
ion
al S
tati
stic
s In
stit
ute

*hn represents the real sample in stratum h.
These values without (*) refer to the theoretical design factors.
In our case, the strata are defined by the activity variable of the NCEA and TAME (size).
For the purpose of obtaining more precise estimates, a post-stratified ratio estimator was used. This estimator is based on estimation procedures that use auxiliary information not present in the direct estimator, which can produce a great improvement in precision.
For these estimators, we define groupings or sub-domains "A" from the groupings of size strata and from the NCEA. The new stratum size variable is defined, "TAME*".
Table no. 12: Establishment Size
TAME * Employee bracket
1 10-49
2 50-199
3 200 and over
By which, groupings A will be defined by the cross of NCEA and TAME*.
The ratio estimator uses auxiliary variable t, with totals T, which is the number of employees of the establishment known for all the sample units, from the selection framework, grouped for post-stratum A within Domain C:
∑∑∑
∑∑∑ ==
An
iihihA
h
n
iihihA
h
AACC
hAC
hAC
wt
wxXX ˆˆ * ACT
Where the elevation factors obtained previously in the calculation of the direct estimator.
hw
In turn, to obtain the data referring to the whole sector scope, we must consider the establishments with fewer than 10 workers, and the self-employed workers who are not included in the frame of the survey. The external sources used have been the Annual Industrial Companies Survey (INE) and the Spanish National Accounts (INE), respectively.
In the experimental results mentioned here, the estimates obtained through the previously explained procedure have adjusted to the total of the population, complemented by the said external sources, through a ratio of water volume per worker in each variable. On average, the water volume target of adjustment by this procedure has represented approximately 10% of the total.
21
INE
. Nat
ion
al S
tati
stic
s In
stit
ute

7. Manufacturing industries
In general, we must indicate that the data presented herein is of an experimental estimation nature, which provides information on the phenomenon under study and enables making comparisons with other external sources, but that must be used with caution, given the pilot nature of this study. In turn, considering that water use is related to the economic cycle, its price and the local supply of the resource, it is necessary to carry out a temporary study of the same in order to establish certain patterns of development, and in this case, some allocations of demand, and thus a single observation cannot be considered sufficient for its statistical study.
Even when the information of the WPI is requested on a Division level of the CNAE (to two digits), for the purpose of reaching a better quality of the information, the results of the water module have been grouped on a sub-section level of CNAE−93.
7.1. Physical magnitudes
Below, the volumes of water are broken down into water supply (network), wastewater and water reused. Regarding the water supply, the breakdown will be carried out by water from the network, and private water collection, and within the latter, the origin of the water. The wastewater is classified by the place in the environment where the same is dumped.
According to the pilot study on water use in industry, 2006, the water supply to the manufacturing industries reached 1,392.7 HM3, broken down into 432.1 (31%) of the supply from the public supply networks, and 960.6 (69%) from private collection (surface water, groundwater or other types of resources).
Table no. 13: Water supply from the network and from private collection
(thousands of m3). Manufacturing industries
Economic activities
Total Supply from the network
Private collection
DA 337,830 111,395 226,435
DB and DC 52,726 13,866 38,860
DD 5,995 2,033 3,962
DE 168.343 14,094 154,249
DF 55,265 47,285 7,980
DG 420,595 83,319 337,276
DH 64,309 50,353 13,956
DI 64,518 24,408 40,110
DJ 166,622 51,847 114,775
DK 11,832 5,670 6,162
DL 7,256 5,368 1,888
DM 24,934 18,447 6,487
DN 12,488 3,987 8,501
Total 1,392,713 432,072 960,641
22
INE
. Nat
ion
al S
tati
stic
s In
stit
ute

Table no. 14: Water supply from the network and from private collection
(thousands of m3/Percentages). Manufacturing industries.
Economic activities
Total Supply from the network
Private collection
DA 337,830 33.0% 67.0%
DB and DC 52,726 26.3% 73.7%
DD 5,995 33.9% 66.1%
DE 168,343 8.4% 91.6%
DF 55,265 85.6% 14.4%
DG 420,595 19.8% 80.2%
DH 64,309 78.3% 21.7%
DI 64,518 37.8% 62.2%
DJ 166,622 31.1% 68.9%
DK 11,832 47.9% 52.1%
DL 7,256 74.0% 26.0%
DM 24,934 74.0% 26.0%
DN 12,488 31.9% 68.1%
Total 1,392,713 31.0% 69.0%
Table no. 15: Origin of the water collected (thousands of m3). Manufacturing
industries Economic activities
Private collection
Surface water
GroundwaterOther
resources
DA 226,435 78,889 141,898 5,648
DB and DC 38,860 6,385 32,276 199
DD 3,962 670 3,292 0
DE 154,249 119,412 34,819 18
DF 7,980 6,550 329 1,101
DG 337,276 115,124 63,521 158,631
DH 13,956 10,846 3,088 22
DI 40,110 14,321 25,394 395
DJ 114,775 94,265 20,071 439
DK 6,162 1,136 4,978 48
DL 1,888 1,079 766 43
DM 6,487 3,997 613 1,877
DN 8,501 164 8,322 15
Total 960,641 452,838 339,367 168,436
23
INE
. Nat
ion
al S
tati
stic
s In
stit
ute

Table no. 16: Origin of the water collected (thousands of m3/Percentages).
Manufacturing industries Economic activities
Private collection
Surface water
GroundwaterOther
resources
DA 226,435 34.8% 62.7% 2.5%
DB and DC 38,860 16.4% 83.1% 0.5%
DD 3,962 16.9% 83.1% 0.0%
DE 154,249 77.4% 22.6% 0.0%
DF 7,980 82.1% 4.1% 13.8%
DG 337,276 34.1% 18.9% 47.0%
DH 13,956 77.7% 22.1% 0.2%
DI 40,110 35.7% 63.3% 1.0%
DJ 114,775 82.1% 17.5% 0.4%
DK 6,162 18.4% 80.8% 0.8%
DL 1,888 57.1% 40.6% 2.3%
DM 6,487 61.6% 9.5% 28.9%
DN 8,501 1.9% 97.9% 0.2%
Total 960,641 47.1% 35.3% 17.6%
Table no. 17: Wastewater dumped and destination (thousands of m3).
Manufacturing industries Economic activities
Total dumped Sewerage
system River Sea
Other destinations
DA 211,944 140,066 57,420 3,806 10,652
DB and DC 37,950 29,382 4,683 3,183 702
DD 3,833 1,384 982 0 1,467
DE 121,698 24,265 66,537 23,784 7,112
DF 25,482 33 3,462 21,984 3
DG 285,262 58,415 46,250 177,667 2,930
DH 40,683 25,945 14,078 0 660
DI 30,658 18,300 7,158 495 4,705
DJ 114,183 34,806 43,922 34,600 855
DK 8,472 7,112 1,075 0 285
DL 4,637 3,588 924 14 111
DM 16,221 10,225 2,854 2,428 714
DN 7,049 6,753 126 0 170
Total 908,072 360,274 249,471 267,961 30,366
24
INE
. Nat
ion
al S
tati
stic
s In
stit
ute

Table no. 18: Wastewater dumped and destination (thousands of m3 /
Percentages). Manufacturing industries Economic activities
Total dumped
Sewerage system
River Sea Other
destinations
DA 211,944 66.1% 27.1% 1.8% 5.0%
DB and DC 37,950 77.4% 12.3% 8.4% 1.9%
DD 3,833 36.1% 25.6% 0.0% 38.3%
DE 121,698 20.0% 54.7% 19.5% 5.8%
DF 25,482 0.1% 13.6% 86.3% 0.0%
DG 285,262 20.5% 16.2% 62.3% 1.0%
DH 40,683 63.8% 34.6% 0.0% 1.6%
DI 30,658 59.7% 23.3% 1.6% 15.4%
DJ 114,183 30.5% 38.5% 30.3% 0.7%
DK 8,472 83.9% 12.7% 0.0% 3.4%
DL 4,637 77.4% 19.9% 0.3% 2.4%
DM 16,221 63.0% 17.6% 15.0% 4.4%
DN 7,049 95.8% 1.8% 0.0% 2.4%
Total 908,072 39.7% 27.5% 29.5% 3.3%
Table no. 19: Water reused (thousands of m3). Manufacturing industries Economic activities
Water reused
DA 26,138
DB and DC 1,664
DD 334
DE 6,825
DF 11,203
DG 12,981
DH 2,171
DI 8,704
DJ 42,017
DK 231
DL 378
DM 726
DN 111
Total 113,483
Water consumption
Table no. 20 presents the water consumption of the branches of economic activity, that is, the difference between the volume of water used and the volume of water dumped (sewerage system, fluvial channel, sea or other destinations). It should be noted that the phrase "water use" in industry, refers to the volume of water used (that may come from supply networks or from private collection), that is, that has an entry into the industrial establishment to provide for the needs of the productive process, whereas the expression "water consumption" refers to the volume of water that, after being used, does not return to the environment.
25
INE
. Nat
ion
al S
tati
stic
s In
stit
ute

Table no. 20: Water consumption by branch of economic activity. Manufacturing
industries Economic activities
Consumption %
DA 37.3
DB and DC 28.0
DD 36.1
DE 27.7
DF 53.9
DG 32.2
DH 36.7
DI 52.5
DJ 31.5
DK 28.4
DL 36.1
DM 34.9
DN 43.6
Total 34.8
7.2 Monetary magnitudes
As indicated previously, the concept of sanitation includes the quotas and fees of the sewerage system, of the filtering of wastewater and the sanitation tax. The unit cost is the quotient between the amount paid and the volume. In the case of supply, the volume is the water received through the network; for sanitation, the volume of water dumped is considered. Only the registers in which the variables value and volume have a value intervene in the calculation of said values. This unit cost may be assimilated to an average value of the payments for water services (or payments per m3), but in no case is it a price or tariff applicable to said services. Once again, the data presented in this section is of an experimental nature, and must be considered with caution, given the pilot nature of the study.
Table no. 21: Unit costs. Manufacturing industries
Variable Unit cost
Water supplied by the network 0.65 €/m3
Collection of surface water 0.16 €/m3
Collection of groundwater 0.27 €/m3
Sanitation (sewerage and filtering) 0.24 €/m3
Dumping control tax 0.06 €/m3
Sea dumping tax 0.04 €/m3
The unit cost of the water supplied by the supply network reached 0.65 /m3 and that of sanitation (sewerage and filtering) reached 0.24 /m3. These costs refer to the national total, not having carried out a breakdown by branch of economic activity, granted that the unit costs largely depend on the scale of the volumes of water used, on the geographical location of the establishment and on the exemptions that they might be entitled to.
26
INE
. Nat
ion
al S
tati
stic
s In
stit
ute

The total amount paid by the industrial manufacturing establishments by water supply was 282.3 million euros, and that for sanitation (sewerage and filtering) was 85.5 million.
The unit costs have been calculated for the value and volume variables, when both appear with data. The value of the surface water collection tax reached 41.9 million euros, while that corresponding to groundwater reached 38.5 million, and the corresponding unit costs were 0.16 /m3 and 0.27 /m3, respectively.
For the unit cost of the dumping control tax, the denominator applied in the calculation is the volume of wastewater dumped into a fluvial channel. The total value of the dumping control tax reached 13.7 million euros, and its unit cost was 0.06 /m3.
Referring to the sea dumping tax, the unit cost estimated in the pilot study was 0.04 /m3. The total amount collected from this tax was 10.5 million euros, although this figure may include monetary amounts paid as a sanitation tax - and not a dumping tax - on dumping wastewater to collectors that flow directly into the sea.
Regarding the expenses incurred by the economic units when they dump wastewater in places other than the sewerage system, fluvial channel or sea, the amounts paid to waste managers who treat this dumping reached 6.2 million euros. In this case, it is not possible to calculate a unit cost per m3 of the wastewater managed or evacuated, given that in many cases, the same are part of the sludge produced in the productive process.
8. Extractive industries
The extractive industries simultaneously use and generate water, due to the filtrations that are produced as a result of their productive activity. The total volume of water used reached 72.9 Hm3, breaking down this amount into 10.5 for subsection CA (extraction of energy products) and 62.5 Hm3 for subsection CB (extraction of other minerals). Most of the water used comes from private water collection, 93%, while 7% is supplied by the public supply networks.
The volume of sea water (non-desalinated) collected, included in other resources, is significant in branch CB, due to the needs for water for the production of sea salt. Regarding the origin of the water, there is a certain lack of definition in the classification of the water from filtrations, between surface water and groundwater.
The following tables present a breakdown of the data estimated for section C and subsections CA and CB, by type of supply and origin of the water.
27
INE
. Nat
ion
al S
tati
stic
s In
stit
ute

Table no. 22: Total C, Supply and origin of the water (thousands of m3)
Variable Volume %
Total supply 72,998
Supply from the network 5,099 7.0
Private collection 67,899 93.0
Surface water 19,063 28.1
Groundwater 21,019 31.0
Other resources 27,817 41.0
- Subsection CA: Extraction of energy products (thousands of m3)
Variable Volume %
Total supply 10,539 Supply from the network 97 0.9
Private collection 10,441 99.1
Surface water 973 9.3
Groundwater 9,467 90.7
Other resources 1 0.01
- Subsection CB: Extraction of other minerals, except energy products
(thousands of m3)
Variable Volume %
Total supply 62,459 Supply from the network 5,001 8.0
Private collection 57,458 92.0
Surface water 18.09 31.5
Groundwater 11,552 20.1
Other resources 27,816 48.4
9. Energy industries
The production and distribution of electrical energy, gas and water (steam or hot water) sector presents some specific features, given that, while the water use for the production of electrical energy through the eddying of water flows may be considered a use that does not consume water, as the volumes used return completely to the fluvial ecosystem, other uses such as cooling or steam production imply water consumption through the partial evaporation of the flows used.
The information collected for this branch of activity by the water module in WPI 2006 does not currently allow for obtaining indicative results, due to the sample being scarcely representative.
28
INE
. Nat
ion
al S
tati
stic
s In
stit
ute

The different Hydrological Plans that were prepared during the 1990s included the consumption of cooling water of thermal and nuclear power stations with fluvial cooling water, yielding an average total consumption of 6,700 Hm3 / year. The return to the environment may be established at approximately 80% of this amount.
10. Comparison of results with other sources
10.1 Industrial sector water use survey (1999)
As indicated previously, this Survey was carried out by the INE with reference year 1999, submitting a questionnaire to the local units with economic activities comprised in the divisions of sections C and D of NCEA-93. It used the framework of the Industrial Products Survey that the INE conducts for those economic activities classified in division D, and the Central Companies Directory (CCD) for those classified in division C. The results of this survey were published on the INE website.
For the 1999-2006 period, in terms of the manufacturing industries, a global decrease in the input of water was observed, producing a sharp decrease in that from private collection (self-supply) and a appreciable increase in the water supplied by the network. For self-supply, groundwater increased in detriment of surface water.
Regarding the destination of the wastewater, due to the application of the wastewater sanitation and filtering plans in place over the seven years between the two surveys, it was observed that the volume of industrial wastewater dumped into the sewerage network had increased by twenty-three percentage points.
Table no. 23: Water supply ( Hm3 ). Manufacturing industries
Variable Year 1999 Year 2006 Variation
Total 1,714 1,392 -18.8% Water from the network
285 432 51.9%
Private collection 1,430 961 -32.8%
Table no. 24: Origin of the water (private collection). Manufacturing industries
Variable Year 1999 Year 2006
Surface water 69.5% 47.1%
Groundwater 19.1% 35.3%
Other types of resource 11.4% 17.6%
Table no. 25: Destination of the wastewater dumped. Manufacturing industries
Variable Year 1999 Year 2006
Sewerage system 16.0% 38.9%
Other recipient media 84.00% 61.1%
29
INE
. Nat
ion
al S
tati
stic
s In
stit
ute

Regarding the extractive industries (table no. 26), during the 1999-2006 period, a significant decrease was observed in the volume of water from private collection (45%), whose cause may have been due to the decrease in economic activity in subsection CA, with particular incidence in the coal extraction industry.
Table no. 26: Water supply ( Hm3 ). Extractive industries
Variable Year 1999 Year 2006 Variation
Total 125 73 -41.6%
Water from the network 1 5 400.0%
Private collection 124 68 -45.2%
10.2 Survey on Water Supply and Treatment (2006)
This survey requires the breakdown of the water supplied by the network, by type of user (households, municipal consumption and economic sectors). For this last type of user, a breakdown is requested between industry, agriculture, services and tourist and recreational uses. The INE does not publish this breakdown with an official nature, due to its great temporal variability, as it is based on informant estimates. In fact, in many cases, the water tariff applied to households is the same as that applied to industry and services, and the distinction between industry and services is confusing for the informant distribution entity.
However, it may be noted that, for the year 2006, the estimate provided by this survey for the volume of network water used by industry was 486 Hm3, this figure being close to that estimated by the target module of study (437 Hm3).
10.3 Other external sources of an administrative origin
Considering the extractive and manufacturing industries, the White Water Book (2000) estimated the total demand of the industries - not connected to the municipal supply networks - at 1,647 Hm3, while according to Industrial Sector Water Use Survey 1999, the estimate of the volume of water used by these industries was 1,554 Hm3. Thus, there is a significant coincidence between both estimates.
For the module on water use in WPI 2006, the estimate of the water from private collection was 1,085 Hm3 (961 for the manufacturing industries and 124 Hm3 for the extractive industries, not including the energy industries), illustrating the decrease in this type of water origin, subject to greater administrative and sanitation controls.
Worth noting is that the estimate contained in the White Water Book referred to the annual average demands, and was based on the Hydrological Basic Plans that were compiled in the 1990s. As is established in the Water Framework Directive of the European Union and the new hydrological planning norms contained in the Order of the MARM 2856/2008, of 10 September, the preparation of the new Basin plans is in progress, and they should be finalised before 31 December 2009.
30
INE
. Nat
ion
al S
tati
stic
s In
stit
ute

The availability of this information will enable contrasting the quality of the estimates provided by the use of the water module in the WPI in coming years.
11. Conclusions
The use of the module on water use in industry is proving to be of great use for different objectives of the environmental statistics on water, and in particular, to serve as support information for the preparation of the water accounts.
Towards an improvement in the quality of the estimates regarding water use in industry, it is convenient to consider specific studies, by branch of economic activity and characteristics of the industrial processes, for the purpose of establishing some quantitative relationships on water use (proportion between the volumes of water used and the physical quantities of product). To this end, it will be necessary to count on the collaboration of the business organisations involved in the different branches of economic activity and with specialised researchers.
As regards cooling water and water reused from the filtering of wastewater produced by the productive process, it would be necessary to increase the detail of the information to establish all the flows and balances of said water, which would hold in a possible specific survey regarding water use in industry. The use, in coming years, of the module on water use included in the Waste Production in Industry Survey, and the improvements that will be introduced in the survey instruments and procedures, will enable advancing in the quality and coverage of the physical and monetary magnitudes related to water use in industry.
31
INE
. Nat
ion
al S
tati
stic
s In
stit
ute

Annexes
Subsection literal from NCEA-93 Rev.1
Economic activities
Subsection Literal
DA Food, beverage and tobacco industry
DB and DC Textile and clothing industry and Leather and footwear industry
DD Wood and cork industry
DE Paper industry; publishing, graphic arts and reproduction
DF Refinement of petroleum and treatment of nuclear fuels
DG Chemical industry
DH Rubber and plastic material transformation industry
DI Other non-metallic ore product industries
DJ Metallurgy and manufacture of metallic products
DK Construction of machinery and mechanical equipment industry
DL Electrical, electronic and optical material and equipment industry
DM Manufacture of transport material
DN Various manufacturing industries
32
INE
. Nat
ion
al S
tati
stic
s In
stit
ute

Questionnaire from the water use module in Waste Production in Industry
Survey 2006
33
INE
. Nat
ion
al S
tati
stic
s In
stit
ute

34
INE
. Nat
ion
al S
tati
stic
s In
stit
ute