industrial distributor m&a pulse - pmcf · industrial distributor m&a pulse june 2015 ......
TRANSCRIPT

INDUSTRIAL DISTRIBUTOR M&A PULSEJUNE 2015
INSIDE THIS ISSUE
www.pmcf.com
PMCF Insights Page 2
Market Segment Profile — Fastener Distribution Page 3
Trends in Distribution Page 4
Market Commentary & Equity Market Valuations Page 5-7
M&A Activity Update Page 8-9

Diversified Industrials – June 2015
P&M Corporate Finance, LLC
PHIL GILBERTManaging Director 248.223.3326 [email protected]
DIVERSIFIED INDUSTRIALS | PMCF INSIGHTS
JOE WAGNERDirector 312.602.3607 [email protected]
GRAHAM GILBERTAssociate 312.602.3619 [email protected]
MIKE CONGLETONAssociate 248.603.5036 [email protected]
PMCF Diversified Industrials Team
STRONG Q1 M&A ACTIVITY FROM STRATEGIC BUYERSMomentum from the back end of 2014 carried into the new year, resulting in 169 total Q1 deals in the PMCF Industrial Dis-tributor Transaction Database. The uptick in industrial distribution deal volume represents nearly a 5.0 percent increase from the same period last year – one of the strongest years for M&A in recent memory. Total U.S. M&A deal volume during the first quarter of the year was up 11.6 percent compared to Q1 2014. Interestingly, private equity investment in the U.S. market during Q1 decreased meaningfully in terms of deal count and capital invested when compared to Q1 2014, as PE groups completed 30 percent fewer acquisitions than during the same period last year. Though less pronounced, the shift in buyer interest from financials to strategics was also felt in the industrial distribu-tion segment. During Q1 2015, financial buyers accounted for 6.6 percent of total disclosed industrial distribution acquisitions, down 0.9 percent from the same period last year. The trend illustrates an elevated level of interest from strategic buyers in the space, indicating a greater appetite for inorganic growth opportunities in a modest growth macro environment.
Broad economic indicators such as GDP suggest stagnant economic performance through April, registering almost zero growth over the period. However, several sector-specific metrics reveal solid performance within select distribution subsets and should support a strong runway for continued growth in these sectors for the remainder of the year. The Purchasing Managers Index (PMI), for example, averaged 52.4 through May and 54.9 TTM, indicating healthy expansion within the manufacturing sector. Housing data was positive as well, with new housing starts through March up 4.7 percent compared to Q1 2014 and building permits up 6.9 percent. Distributors serving these sectors performed accordingly – the PMCF Building Products Index is up 11.9 percent on the year.
The M&A market still faces numerous economic headwinds going forward. Uncertainty in the oil & gas sector, which dominated headlines to start the year, continues to weigh on the earnings of DXP Enterprises, Rexel SA, and other distributors serving the segment. An increased likelihood of interest rate hikes in late summer / early fall also pose a threat to companies, especially those who have used leverage to finance organic growth in recent years. In spite of these potential headwinds, PMCF maintains confidence in the M&A market in the near term. Strategic and financial buyers alike recognize the benefits of M&A as a tool for end market, product, and geographic diversification, and we expect continued consolidation to take place given the current market fragmentation within distribution.
Strategic Buyer
Financial Buyer
Undisclosed114
134
57
144
125
149
8
0
40
80
120
160
200
Q1 2013Q1 2012 Q1 2014 Q1 2015
60
100
140
180
20
114
12
Industrial Distribution M&A Activity
Sources: Institute for Supply Management and Federal Reserve Bank of St. Louis, Company Reports
Source: Capital IQ, Proprietary Research

www.pmcf.com 3
Industrial Distributor M&A Pulse
Market Segment Profile INDUSTRIAL FASTENER DISTRIBUTIONThe fasteners segment of the global industrial distribution landscape continues to show substantial upside potential in terms of size, scope, and opportunity for consolidation. Demand for fastener products remains high. The Fastener Distributor Index (FDI) – a seasonally adjusted metric used to measure fastener distributor sentiment within North America – finished 2014 at a four month average of 57.9, well above the baseline reading of 50, indicating strong supply and demand side fundamentals throughout the industry. This performance continued into 2015 with distributors across North America re-porting strong revenue growth. The Specialty Tools & Fasteners Distributors Association (STAFDA), which compiles quarterly reports reflecting the financial performance of its members, reported that its member distributors averaged 8.3 percent growth in Q1 2015 YoY. The fasteners segment experienced significant growth in major geographical regions as shown in the graph, including the Pacific, Midwest, Mid-Atlantic and North Central United States. President of the National Fastener Distributor Association Paul Tiffany expressed optimism in select sectors heading into the second half of the year, highlighting a positive outlook for the construction and defense sec-tors, as an example.
Leading fastener distributors such as Bossard, Fastenal, Würth, and Wesco Aircraft spent early 2015 executing growth strategies that will enable them to compete for market share gains in this growing landscape. These dis-tributors, and others, are actively ex-panding their service offerings and geographic reach through both or-ganic and inorganic means. During Q1 2015, Bossard Holding AG an-nounced two acquisitions and closed two others, including Aero-Space Southwest, Inc., an Arizona-based distributor of diversified fastening solutions to a wide array of end markets. This strat-egy continues to drive top line growth for Bossard, whose U.S. sales increased over 22 percent during the quarter as a result of the Aero-Space Southwest acquisition. Fastenal Company, on the other hand, announced new customer wins, increased hiring, and revealed a facility expansion program that it anticipates will support organic growth over the long term. Fastenal is performing well as a result of these initiatives, posting 8.8 percent growth in revenue, 14 percent growth in earnings, and 32.3 percent growth in incremental margin during the first quarter. Both strategies are yielding positive financial outcomes and we expect others in the industry to replicate these successful initiatives.
On the opposite side of the spectrum, financial buyers recognize the aforementioned growth opportunities and are align-ing their portfolios accordingly. In February, American Industrial Partners announced its acquisition of the fasteners seg-ment of Anixter International, Inc. for $380 million. Soon after, Incline Equity acquired AFC Holdings and announced plans to expand the company’s capacity and client base in the near future. Other notable private equity acquisitions during the period include Platinum Equity’s acquisition of PrimeSource Building Products, Inc. and Novaria Group’s acquisition of John Hassall, Inc. Distributors who offer product line diversity and value added services such as consolidated invoicing, engineering services, and integrated supply services, will receive greater interest in the M&A market, especially from finan-cial buyers. PMCF expects interest in the fasteners segment to persist throughout the year as companies look to capitalize on the present growth prospects.
+27.8%Pacific
+11.1%Midwest
+13.4%Mid-Atlantic
+22.9%North Central
+9.4%Northwest
Sources: Company SEC filings, investor conference call transcripts, NFDA, FCH Sourcing Network, and Specialty Tool & Fasteners Distribution Association
Q1 2015 Fastener Distributor YoY Sales
Growth by Region

Diversified Industrials – June 2015
P&M Corporate Finance, LLC
Q1 Trends in Distribution What we’re seeing…
1. Continued regional consolidation within the sector indicates industrial distributors are recognizing the need to reduce response & delivery times. We expect same day delivery to soon become the expectation among downstream customers – the M&A market can benefit from this dynamic.
1
2
3
4
Same day delivery is gaining prevalence within the industry – made evident by Amazon and Ace Hardware’s newly minted distribution models
Constricted economic growth, in part due to harsh winter weath-er, is giving way to elevated consumer sentiment and spend-ing heading into the summer months
Distributors are moving in-ternal IT systems to cloud in-frastructures, allowing for streamlined store and facility expansions
Large distributors continue to show a propensity to expand via small, regionally focused acqui-sitions as opposed to blockbust-er mergers

www.pmcf.com 5
Industrial Distributor M&A Pulse
April 2015: “Focusing [on] our end markets for a moment. Machinery, paper, fabricated metals and food manufacturing all showed positive results year-over-year, while mining and transportation equipment manufacturing remained relatively weak. While we have experienced some near-term challenges at distribution, we believe we are well positioned for a solid 2015… I would highlight that our third quarter in distribution is expected to be our strongest in both a revenue and profit perspective.”
Robert D. Starr, Chief Financial Officer & Senior Vice President, Kaman Corporation
Market Commentary
May 2015: “…we’re encouraged and experienced strong growth in Service Centers in the chemical, upstream production, downstream, food and beverage markets. Additionally, we continue to add diversification to our Service Center end markets through new customers and acquisitions. Subsequent to the quarter end, we completed the acquisition of Tool Supply… This furthers the efforts we have been undertaking over the past years to add businesses that have good end markets outside of oil and gas.”
“I believe that the DXP management team will use this downturn in the oil and gas industry to increase our presence and hit rate to gain profitable market share. I believe that this downturn in oil and gas will be like all the others when demand and supply get out of balance, and it takes about one year to bring the supply and demand back into balance.”
David R. Little, Chairman, Chief Executive Officer, DXP Enterprises, Inc.
April 2015: “Demand for new housing continues to slowly yet consistently improve, and we look to use this momen-tum to grow our revenues and market share while continuing to improve our operating margins. Our recently announced transaction with ProBuild, which we expect to close in the second half of 2015, will be a high priority for us in the coming months, and we look forward to being able to bring the best talent in the industry together as one team. We believe this transaction significantly enhances our opportunity for growth, and we’ve never been more excited about the future prospects for our company.”
Floyd F. Sherman, Chief Executive Officer and Director, Builders FirstSource, Inc.
Sources: Company SEC filings, investor presentations and conference call transcripts
Though earnings season was a mixed bag for distributors, industry executives generally maintain confidence in business prospects throughout the remainder of 2015. While disruptive weather and adversity in the oil & gas sector affected most industry participants, several executives communicated positive developments within select business segments.
Diversified Industrials – June 2015
P&M Corporate Finance, LLC
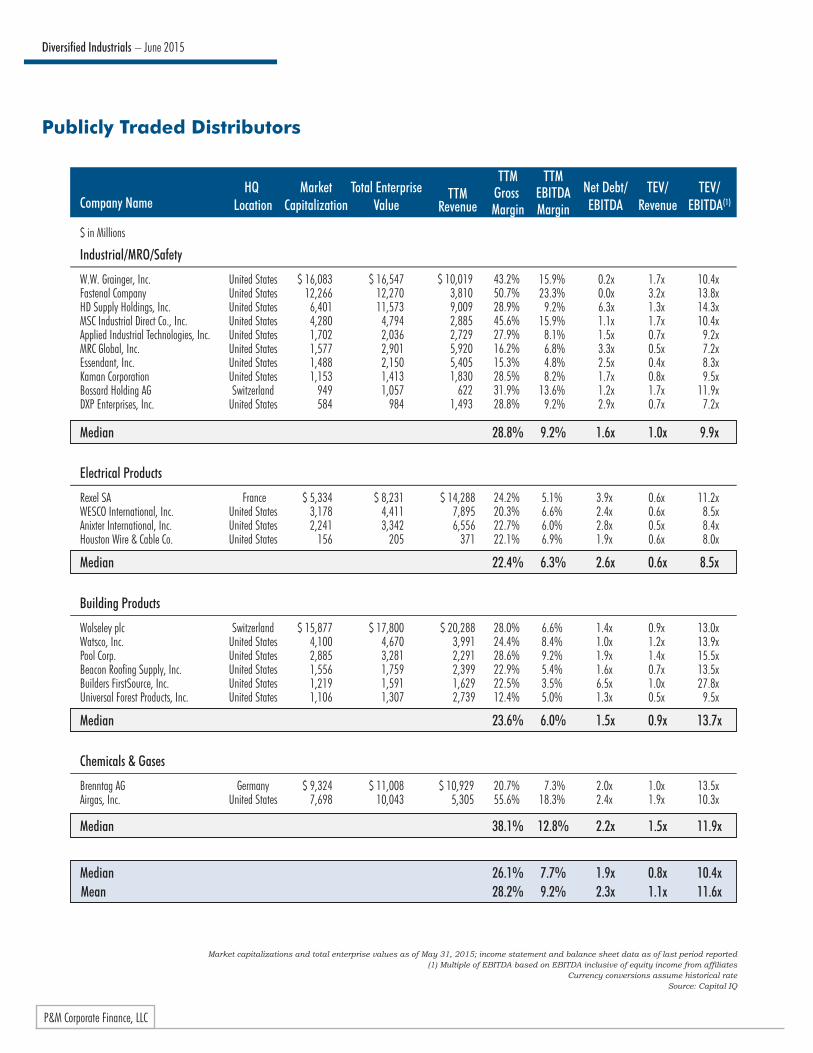
Publicly Traded Distributors
W.W. Grainger, Inc.Fastenal CompanyHD Supply Holdings, Inc.MSC Industrial Direct Co., Inc.Applied Industrial Technologies, Inc.MRC Global, Inc.Essendant, Inc.Kaman CorporationBossard Holding AGDXP Enterprises, Inc.
Company NameMarket
CapitalizationTotal Enterprise
ValueTTM
Revenue
TTMGross Margin
TTMEBITDAMargin
TEV/Revenue
TEV/EBITDA(1)
Net Debt/EBITDA
Industrial/MRO/Safety
Median
$ 16,083 12,266
6,401 4,280 1,702 1,577 1,488 1,153
949 584
$ 16,547 12,270 11,573
4,794 2,036 2,901 2,150 1,413 1,057
984
$ 10,019 3,810 9,009 2,885 2,729 5,920 5,405 1,830
622 1,493
43.2% 50.7% 28.9% 45.6% 27.9% 16.2% 15.3% 28.5% 31.9% 28.8%
28.8%
15.9% 23.3%
9.2% 15.9%
8.1% 6.8% 4.8% 8.2%
13.6% 9.2%
9.2%
0.2x 0.0x 6.3x 1.1x 1.5x 3.3x 2.5x 1.7x 1.2x 2.9x
1.6x
1.7x 3.2x 1.3x 1.7x 0.7x 0.5x 0.4x 0.8x 1.7x 0.7x
1.0x
10.4x 13.8x 14.3x 10.4x
9.2x 7.2x 8.3x 9.5x
11.9x 7.2x
9.9x
Rexel SAWESCO International, Inc.Anixter International, Inc.Houston Wire & Cable Co.
Electrical Products
Median
$ 5,334 3,178 2,241
156
$ 8,231 4,411 3,342
205
$ 14,288 7,895 6,556
371
24.2% 20.3% 22.7% 22.1%
22.4%
5.1% 6.6% 6.0% 6.9%
6.3%
3.9x 2.4x 2.8x 1.9x
2.6x
0.6x 0.6x 0.5x 0.6x
0.6x
11.2x 8.5x 8.4x 8.0x
8.5x
Wolseley plcWatsco, Inc.Pool Corp.Beacon Roofing Supply, Inc.Builders FirstSource, Inc.Universal Forest Products, Inc.
Building Products
Median
$ 15,877 4,100 2,885 1,556 1,219 1,106
$ 17,800 4,670 3,281 1,759 1,591 1,307
$ 20,288 3,991 2,291 2,399 1,629 2,739
28.0% 24.4% 28.6% 22.9% 22.5% 12.4%
23.6%
6.6% 8.4% 9.2% 5.4% 3.5% 5.0%
6.0%
1.4x 1.0x 1.9x 1.6x 6.5x 1.3x
1.5x
0.9x 1.2x 1.4x 0.7x 1.0x 0.5x
0.9x
13.0x 13.9x 15.5x 13.5x 27.8x
9.5x
13.7x
Brenntag AGAirgas, Inc.
Chemicals & Gases
Median
$ 9,324 7,698
$ 11,008 10,043
$ 10,929 5,305
20.7% 55.6%
38.1%
7.3% 18.3%
12.8%
2.0x 2.4x
2.2x
1.0x 1.9x
1.5x
13.5x 10.3x
11.9x
Median 26.1% 7.7% 1.9x 0.8x 10.4xMean 28.2% 9.2% 2.3x 1.1x 11.6x
$ in Millions
HQ Location
United StatesUnited StatesUnited StatesUnited StatesUnited StatesUnited StatesUnited StatesUnited StatesSwitzerland
United States
FranceUnited StatesUnited StatesUnited States
SwitzerlandUnited StatesUnited StatesUnited StatesUnited StatesUnited States
GermanyUnited States
Market capitalizations and total enterprise values as of May 31, 2015; income statement and balance sheet data as of last period reported(1) Multiple of EBITDA based on EBITDA inclusive of equity income from affiliates
Currency conversions assume historical rateSource: Capital IQ

www.pmcf.com 7
Industrial Distributor M&A Pulse
Public Company Equity Performance & Trends
4/301/31 2/28 3/31
Chemicals/Gases - 98.7
S&P 500 Index - 102.4 Industrial/MRO/Safety - 93.8 Electrical Products - 93.0
Building Products - 111.9
80.0
90.0
100.0
110.0
120.0
5/31
Equity Performance• While the broader market showed modest gains through May – rising 2.4 percent from the start of the year – select segments show
strong performance YTD. The PMCF Building Products Index performed particularly well over the first five months, rising 11.9 per-cent on the year as total construction starts showed significant improvement, up 28 percent in Q1 2015 compared to Q1 2014
• The Electrical Products and Industrial/MRO/Safety indices carried losses from 2014 into the first five months of 2015, down 7.0 percent and 6.2 percent YTD, respectively
• Though still positive on the year, markets have been tempered by poor consumer spending during the winter months, uncertainty in interest rate hikes, and a depressed energy sector due to oil prices
Market capitalization indices with mixed currencies are converted into USD using historical spot rates Local currency quotes converted to USD using historical spot ratesSource: Capital IQ, Dodge Data & Analytics
Valuation Trends• Q1 2015 brought a small dip in our Industrial Distribution Index from an EBITDA multiple standpoint, with the mean EV/EBITDA
multiple for the total index shedding 0.1x. However, within the index both the Industrial/MRO/Safety segment and Electrical products segment fell 0.6x while the Building Products segment rose from 13.1x to 14.0x
Revenue Multiple Median Mean
EBITDA Multiple(1) Median Mean
Q1 2013 Q2 2013 Q3 2013 Q4 2013 Q1 2014 Q2 2014 Q3 2014 Q4 2014
0.8x1.2x
11.3x11.5x
0.8x1.1x
10.7x11.6x
0.8x1.2x
11.7x12.0x
0.8x1.2x
11.6x12.2x
0.8x1.2x
11.8x12.0x
0.8x1.2x
11.5x12.2x
0.8x1.1x
10.9x11.1x
0.8x1.1x
11.2x11.4x
Q1 2015
0.8x1.1x
10.6x11.3x
PMCF Industrial Distribution Index Valuation
(1) Multiple of EBITDA based on EBITDA inclusive of equity income from affiliates Quarterly figures based on the last trading day of each quarter shownSource: Capital IQ
Values as of: May 31, 2015
80.0
90.0
100.0
110.0
120.0
12/31 1/31 2/28 3/31 4/30 5/31

Diversified Industrials – June 2015
P&M Corporate Finance, LLC
Industrial Distribution M&A Activity
Select Transactions, as of May 31, 2015
Target Breakdown by Continent — Q1 2015 Buyer Breakdown by Continent — Q1 2015(1)
(1) Excludes 8 unidentifiable buyers Index includes majority acquisitions of Trading Companies and Distributors, as classified by Capital IQ, as well as various transactions reported in industry publications
Index includes deals reported through March 31, 2015Source: Capital IQ, proprietary research
Index includes majority acquisitions of Trading Companies and Distributors, as classified by Capital IQ, as well as various transactions reported in industry publicationsIndex includes deals reported through March 31, 2015
Source: Capital IQ, proprietary research
Sources: Capital IQ, company websites and PMCF industry research
Strategic Buyer Financial Buyer Undisclosed
479
3130
503
4727
506
3736
215
1924
342
3329
0
100
200
300
400
500
600
700
201420102009 2011 2012 2013
617
4734
144 149128
Q1 2015Q1 2014
125
North America49%
ROW5%
Europe36%
Asia10%
North America52%
ROW3%
Europe34%
Asia11%
May-15Apr-15Apr-15Apr-15Apr-15Feb-15
Date Target Buyer Industry SegmentEV/TTMRevenue
EV/TTMEBITDA
Químicas Meroña, S.L.Zep, Inc.ProBuild Holdings, Inc.Marias Technologies SASGPA, Specialty Substrate Solutions Inc.The HC Companies, Inc.
Brenntag AGNew Mountain Capital, LLCBuilders FirstSourceTesmec S.p.A.Fedrigoni S.p.A.Wingate Partners
Chemicals & GasesChemicals & GasesBuilding Products
Industrial/MRO/SafetyPaper/PackagingHome Furnishings
0.8x1.0x1.1x0.5x0.7x0.6x
6.1x14.9x9.6x4.7x6.3xn/a
Implied EV
$ 10700
1,8201450
110
Median 0.8x 6.3xMean 0.8x 8.3x

www.pmcf.com 9
Industrial Distributor M&A Pulse
On April 30, 2015, global electrical equipment distributor Sonepar SA com-pleted its acquisition of the Latin American operations of Rexel SA. The acquisi-tion expands Sonepar’s presence in Central and South America and brings its total global presence to 43 countries. In February of 2015, Rexel announced its plan to discontinue operations in Brazil, Chile, and Peru, which contributed $287 million, or 2% of total 2014 sales. With the sale, Rexel plans to refocus on its more profitable regions, including Europe, North America, and the Asia-Pacific markets. Enterprise value for the transaction totaled $51 million.
New Mountain Capital began 2015 by making a platform acquisition for its new Fund IV. On April 8th, New Mountain Capital acquired Zep, Inc., a dis-tributor of cleaning and maintenance chemicals and related products serving the commercial and industrial markets of North America and Europe. The transaction comes on the heels of New Mountain Capital’s oversubscribed Fund IV, which totals $4.13 billion of equity capital commitments and closed in October of 2014. Zep, Inc. was acquired at an EV/EBITDA multiple of 14.9x.
On March 27, 2015, Platinum Equity Partners announced its acquisition of PrimeSource Building Products, Inc. (“PrimeSource”) from ITOCHU Corpo-ration and ITOCHU International Inc. PrimeSource distributes fasteners and building materials throughout North America and is the largest distributor of screws and nails in the United States with 42 total distribution centers. The ac-quisition adds a blue-chip distributor to Platinum’s already expansive portfolio, which includes 53 current and pending investments.
Ryan Herco Flow Solutions (“RHFS”), a distributor of purity and corrosion re-sistant fluid handling systems, acquired GFI Stainless (“GFI”) on February 2, 2015 for an undisclosed amount. GFI provides complimentary products to RHFS’ current offering, as well as new product lines that will provide current and future customers a more comprehensive source of corrosion resistant fluid handling products. GFI Stainless (doing business as Fluker Enterprises, Inc.) distributes stainless steel and special alloy fluid handling products including pipes, fittings, pumps gaskets, instrumentation, and others.
Key Deal Highlights
Deployment of New Capital
New Mountain Capital & Zep, Inc.
Corporate Carve-Out
Platinum Equity & PrimeSource Building Products, Inc.
Product Line Expansion
Ryan Herco Flow Solutions & GFI Stainless
Geographic Realignment
Sonepar SA & Rexel SA Latin American Operations
Sources: Company Press Releases

Diversified Industrials – June 2015
P&M Corporate Finance, LLC
P&M Corporate Finance (PMCF) is an investment banking firm, focused exclusively on middle market transactions, with professionals in Chicago, Detroit and across the globe through Corporate Finance International associates. Our dedicated Diversified Industrials Group has deep industry knowledge and covers a wide range of industries including aerospace & defense, automotive, energy and industrial distribution. Offering a breadth of advisory services, the Diversified Industrials Group has helped clients worldwide meet their sale, acquisition, financing and strategic growth objectives.
Investment Banking Services:
• Mergers & Acquisitions
• Sales & Divestitures
• Capital Raising
• Strategic Assessments
CHICAGO 225 W. Washington St., Suite 2700
Chicago, IL 60606
312.602.3600
DETROIT Two Towne Square, Suite 425
Southfield, MI 48076
248.223.3300
About PMCF

www.pmcf.com 11
Industrial Distributor M&A Pulse
This market overview is not an offer to sell or a solicitation of an offer to buy any security. It is not intended to be directed to investors as a basis for making an investment decision. This market overview does not rate or recommend securities of individual companies, nor does it contain sufficient information upon which to make an investment decision.
P&M Corporate Finance, LLC will seek to provide investment banking and/or other services to one or more of the companies mentioned in this market overview.
P&M Corporate Finance, LLC, and/or the analysts who prepared this market update, may own securities of one or more of the companies mentioned in this market overview.
The information provided in this market overview was obtained from sources believed to be reliable, but its accuracy cannot be guaranteed. It is not to be construed as legal, accounting, financial, or investment advice. Information, opinions, and estimates reflect P&M Corporate Finance, LLC’s judgment as of the date of publication and are subject to change without notice. P&M Corporate Finance, LLC undertakes no obligation to notify any recipient of this market overview of any such change.
The charts and graphs used in this market overview have been compiled by P&M Corporate Finance, LLC solely for illustrative purposes. All charts are as of the date of issuance of this market overview, unless otherwise noted.
The PMCF Industrial Distribution Index may not be inclusive of all companies in the industrial distribution industry and is not a composite index of the industrial distribution industry sector returns. Index and sector returns are past performance which is not an indicator of future results.
This market overview is not directed to, or intended for distribution to, any person in any jurisdiction where such distribution would be contrary to law or regulation, or which would subject P&M Corporate Finance, LLC to licensing or registration requirements in such jurisdiction.

www.pmcf.com
Suite 425Two Towne SquareSouthfield, MI 48076