indicators of school inputs and outputs in nine similar ... · pdf fileindicators of school...
TRANSCRIPT

!
School Performance in Context:!Indicators of School Inputs and Outputs in Nine Similar Nations!
!!
January 2015!!

!!!!!This report is a joint project of the Horace Mann League and the National Superintendents Roundtable.
The League is an honorary organization devoted to the principles of Horace Mann, the father of the American public school. The Roundtable is a professional learning community of school superintendents from some 30 states.
Questions about this report should be directed to the League or the Roundtable:
Horace Mann League 560 Rainier Lane Port Ludlow, WA 98368 Executive Director: Jack McKay [email protected] !National Superintendents Roundtable 9425 35th Avenue, NE, Suite E Seattle, WA 98115 Executive Director: James Harvey [email protected] !!© 2015, The Horace Mann League and the National Superintendents Roundtable. Figures throughout used by permission of copyright holder James Harvey. !

!!!!!!!
“The question we wish to ask is not ‘Are the children of country X better educated that those
of country Y?’ To us this seemed a false question begging all the important issues we need to
study. Rather we wish . . . to gain as clear a specification as possible of exactly what each
educational system has set itself to achieve.”
International Project on the Evaluation of Educational Achievement
(1960). Bulletin No. 1. Report of the meeting at Hamburg, 17-22, 1960.
Hamburg, Germany: IEA.
! !
!

!

!
Table of Contents ! ! Executive Summary…………………………………………………………………………………….3
Introduction……………………….…………………………………………………………………….7
Economic and Demographic Background of Nine Nations……………………………………9
A Summary Table…………………………………………………………….…………………………13
Dimension I: Economic Equity………………………………………………………………………15
Dimension II: Social Stress……………………………………………………..……………………19
Dimension III: Support for Families……………………………………………………………….23
Dimension IV: Support for Schools……………………….……………………………………….27
Dimension V: Student Outcomes……………………………………………..……………………31
Dimension VI: System Outcomes…………………………………………………………..………35
Conclusions and Implications…………………………………………………….…………………39
Appendix A: Acknowledgments……………………………………………………….……………43
Appendix B: Methods…………………………..…………………………………….………………45
Appendix C: Data Sources……………………….…………………………………….……………47
Endnotes……………………….……………..……………………………………..….………………51
!1

!
!2

!
Executive Summary ! !
This report grew out of several concerns expressed by experienced professional educators regarding large-scale international education assessments (ILSAs). The highly-publicized scores, ratings, and rankings—a frequent product of those assessments—have led to an impression that numbers on a limited set of assessment criteria are really all that counts. What’s needed is full attention to 1
the social, economic, and cultural factors that influence the results these assessments produce.
While results of ILSAs are potentially valuable, they are simply one of many potential indicators. Others should also be considered. Taken together and viewed holistically, a portfolio of indicators can provide a more comprehensive view of the context in which any nation’s public schools operate—and a more accurate guide for action. !The U.S. is the wealthiest of the nations examined in this study, but also exhibits extremely high levels of
social stress and economic inequality.
!Six Major Dimensions
To illustrate this holistic concept, the Horace Mann League and the National Superintendents Roundtable identified 24 indicators divided into six major dimensions. Each has profound implications for not only the well-being of children but also how well they perform in school. All should be considered basic to understanding what stands behind these rankings. The Six Dimensions include: • Economic Equity • Social Stress • Support for Young Families • Support for Schools • Student Outcomes, and
• System Outcomes. In developing these dimensions, the Horace
Mann League and the Roundtable began to think of student and system outcomes as akin to the part of an iceberg that’s visible above the waterline, while the other dimensions represented the bulk of the iceberg concealed deep in the water. The general structure of the study followed the lead of an earlier indicators project on children’s well-being completed by the Innocenti Research Institute for UNICEF.
More Appropriate Comparison Nations Nations vary widely. Some are large and some small.
Some have massive populations. Others are sparsely populated. There are developed and developing nations. Political and economic systems are often highly dissimilar. The ILSA comparisons include democracies, autocracies, dictatorships, and theocracies. With all of these differences and dozens more, simple rankings don’t seem appropriate. Nor are they helpful in improving education for every child in a fast-changing world.
The Horace Mann League and the Roundtable considered it important to draw comparisons among nations that are as similar as possible. This project
!3

focused on the G-7 nations, seven of the largest economies in the world. Due to global interest in the educational performance of their students, Finland and China are added to the analysis. The nations examined are:
• Canada • China • Finland • France • Germany • Italy • Japan • The United Kingdom, and • The United States
Significant Findings Here are some of the major insights about the
United States revealed during this investigation: • No other nation matches the United States in its
combination of size, wealth, and democratic governance. In terms of overall wealth, as measured by GDP and GDP per capita, the U.S. is the wealthiest of the nine nations studied.
• The United States has the most highly educated adult population among these nine nations, as measured by years of schooling completed and the proportion of the population with high school diplomas and bachelor’s degrees.
The U.S. has the most highly educated adult population among these nine nations as measured by years of schooling completed and the proportion of
the population with high school diplomas and bachelor’s degrees.
• The results for the United States with regard to economic inequity, social stress, and support for young families—all correlated with levels of school performance—are disappointing in the extreme.
• With respect to social stress, the indicators suggest the U.S. has the highest rates of deaths from violence and substance abuse, and that American society is 13-16 times more violence-prone than other nations in this study.
• The performance of American elementary school students is in the top third of these nine nations; its performance at middle school level is in the middle third; there are no ILSAs assessing student achievement at the end of secondary school.
With regard to other nations: • China displays the poorest system outcomes and the
greatest economic inequities. • Canada can take great pride in its performance
relative to the other eight nations on school support, student outcomes, and system outcomes.
• France, by contrast, finds itself lagging in all three dimensions.
• Finland demonstrates impressive results in terms of low levels of economic inequity and social stress along with high levels of school support and high student outcomes.
• Italy does well in terms of support for families and social stress, but its standing relative to student and system performance is disappointing.
• Germany finds itself in the middle of these nine nations on most dimensions, but performs very well in terms of economic equity and student outcomes.
• Despite comparatively low levels of school support in Japan, it produces impressive results in terms of low levels of social stress and high student outcomes.
• The United Kingdom displays a pattern similar to the United States with regard to high levels of economic inequity and social stress. Despite that, the U.K.’s record on support for families, support for schools, and system outcomes is impressive.
From this bird’s-eye view, it is apparent that fairly significant differences manifest themselves along these six dimensions, even among nations selected to be reasonably similar.
Recommendations Moving Forward !Educators understand the importance of assessments
and accountability. However, most express concern that any assessment should help them improve education for the students in their classrooms. Simply developing a scoreboard without identifying the societal factors that
!4

influence results does not help the education system become more legitimately accountable to those it serves.
For Educators. Use the findings of this study to help colleagues and communities better understand that summative scores are profoundly affected by formative forces in society. Team up with the leadership in your community to identify your school or district’s formative data so you can then address the needs of the whole child.
For Communities. Broaden your understanding of the need to address economic inequality, social stress, support for young families, support for schools, student outcomes, and system outcomes. Schools can’t do it alone.
For Policymakers. Celebrate the success of schools while helping address some the out-of-school issues that challenge educators, communities, and young people every day. Enact constructive laws and policies that constantly support people on the front lines of our future. Encourage rather than withhold funds for research in the social, behavioral, and economic sciences to advance the well-being of the nation’s people. Treat education as a ticket to an even better future, not as a political football. At the federal level, especially in the U.S., remember that we have a national interest in education, which brings with it a challenge of providing equal opportunity for all.
For International Assessment Organizations. Avoid the temptation to compare cities, provinces, and states with entire nations. Few realize that rankings for one large nation are frequently based on testing of students in one city, specifically leaving out those who have moved there from the countryside. Sponsoring organizations of international assessments, such as the Organization for Economic Cooperation and Development (OECD), home of the PISA test, and the International Association for the Evaluation of Educational Achievement (IEA), home of TIMSS and PIRLS, should release ILSA scores in the context of indicators such as those outlined in this document so as to provide greater depth and insight into what these scores represent. !!
A Final Word Too often, as the president of the Horace Mann League
pointed out recently, policymakers, educators, and the public are inclined to narrow their focus to a few things that are easily tested. They become captives of the 2
results and their goal becomes raising test scores rather than developing fully educated people. To avoid that mentality, the Horace Mann League and the Roundtable want to emphasize the power of a consistent and comprehensive framework that looks at all the measures involved in shaping our future citizens.
Nobody understands the challenges and shortcomings of the nation’s schools better than the
people who have dedicated their lives to them.
In that effort, the United States has its task cut out for it. Our communities and our leaders need help understanding the limitations of our schools and the challenges facing children and families, both in and out of school. We have to close the achievement gaps between and among our students. We have to equalize graduation rates. We need to make sure that young men and young women are progressing equally within our schools. We should work for greater funding equity in the system. We must to do what is necessary to provide a first-rate teacher in every classroom. And we have to draw attention to the social challenges battering our students.
Nobody understands the challenges and shortcomings of American schools better than the people who have dedicated their lives to them. Our work as educators lies in helping students achieve their full potential. Our work as educational leaders lies in making sure that the system of public education in the United States meets its full potential. We understand that learning doesn’t have a finish line . . . that education is always a work in progress.
But the view of the Horace Mann League and the National Superintendents Roundtable is unshakable. We
!5

believe American schools are among this nation’s greatest strengths and most powerful forces for good. Every hour of every day, the work of educators touches the future.
And because it does, this nation can be confident that just as America has always succeeded before, so it will again.
*************** !
!6

!
Introduction !
This report grew out of several concerns expressed by experienced professional educators regarding international large-scale education assessments (ILSAs). For three years, members of the board of the Horace Mann League set out to shine a light on factors that are ignored or taken for granted in ILSAs such as PIRLS (Progress in International Reading Literacy Survey), TIMSS (The International Math and Science Study), and PISA (Program on International Student Assessment). The effort was led by Gary Marx (president of the Horace Mann League), Charles Fowler (incoming president), Jack McKay (executive director) and board member James Harvey, executive director of the National Superintendents Roundtable. The work ultimately formed the foundation of a dissertation by Harvey that was accepted by the faculty of the College of Education, Seattle University, in October 2014.
As the project progressed it became apparent that a more useful assessment of American school performance would compare American education (a) with school systems in other wealthy and democratic nations; and (b) to the extent possible, within the social, economic, and cultural contexts in which school systems function. The G-7 nations, which together account for more than 50% of global wealth, were the most obvious point of comparison. Due to widespread interest in reported achievement in China and Finland, these two nations were added to the analysis.
Still, selecting more appropriate comparison nations does not solve the reductive quality of ILSAs. What other dimensions might we explore to take into account the social and economic context and half-a-century of educational research suggesting that 70% of tested achievement can be accounted for by out-of-school factors? We settled on six broad dimensions and sought 3
data that would inform these issues. The six dimensions are: economic equity, social stress, support for young
families, support for schools, student outcomes, and system outcomes. This document is the first effort to produce a comprehensive, comparative indicator report on K-12 education.
Our work was not designed to suggest that the United States is the most successful or unsuccessful of these nations. It examines the American school system against systems in nations that are as similar as possible to the United States. It explores many of the factors involved in educating today’s young people. Without drawing attention to one indicator at the expense of others, the authors ask readers to consider them all before drawing conclusions about system performance.
In particular, we ask readers to consider school outcomes in the context of the levels of economic inequity, childhood poverty, and violence apparent in many American communities. These indicators suggest a policy response unrelated to schools is absolutely essential in the United States.
!7

!
!8

!
Economic and Demographic Background of Nine Nations !
The United States is a very unusual nation. Large, wealthy, and committed to liberty, there is nothing else quite like it in the world. Even this project’s search for similar nations turned up not a single match across all three descriptors. Some nations are large, but neither democratic nor wealthy (China); some are democratic and wealthy, but not large (Finland); and most of the other nations involved in this analysis fit somewhere in between. The point is that even a conscious effort to locate more appropriate nations with which to compare the United States finds even close matches hard to locate.
Population
It is self evident in the figure on the left that, in this study’s nine-nation world, China is in a league of its own in terms of population size. The visual drives home the numbers. China’s population is more than four times greater than the next largest nation, the United States (1.3 billion versus 316 million). Finland can only be described as quite small in this context, with a population of just over 5 million people. Canada, given its enormous geographic spread is very thinly populated, just 35 million people, while the remaining five nations range from almost 60 million inhabitants in Italy, to more than twice that number in Japan. Another way to gauge just how large China is would be to note that its population is almost twice as large as the populations of the other eight nations combined. In this nine-nation world, China is without a match in terms of population.
It scarcely needs saying, but student enrollment typically tracks population size. China has the largest population. It also had the largest student enrollment in 2010, according to the National Center on Education Statistics (200 million students). Finland has the smallest population and also the smallest student enrollment (about 858 thousand students).
Gross Domestic Product
The picture changes dramatically when the nine
countries are viewed through the prism of national wealth (see figure, following page). Now the United States is the overwhelmingly dominant player. In terms of Gross Domestic Product (GDP), the United States’ $16.8 trillion dollar economy far exceeds the $9.2 trillion produced in China, although the Chinese economy is
!9

growing more rapidly than the economies of the G-7 nations. Japan with an economy of nearly $5 trillion far outpaces Germany and France; the Japanese economy is also nearly twice that of the United Kingdom. Canada ($1.8 trillion) and Finland ($256 billion) have the smallest economies among these nine nations.
One way to understand the economic power of the United States is as follows: Among the seven nations in the G-7 that account for more than half of the globe’s economy, the United States by itself was responsible in 2013 for about 50 percent of the G-7’s economic clout.
GDP Per Capita
If a nation’s wealth were divided equally among its citizens, how much would each person receive? As the figure to the right indicates this is where Finland comes into its own. This small nation punches well above its weight when it comes to GDP per capita. It is comfortably in the top third of these nations by this measure, well ahead of more economically powerful
countries such as Germany, France, the United Kingdom, and Japan.
It is a measure of China’s status as a developing nation that, on a per-capita basis, it generates only about one-tenth of the wealth that the wealthiest Western nations do. Visually, there is not a lot separating most of the G-7 nations (or separating them from Finland). But an economic chasm yawns between the developed world represented here and an emerging nation such as China.
The United States and Canada, at the top of this economic pyramid, are quite close to each other (the United States showing a figure of about $53 thousand per capita, compared to nearly $52 thousand in Canada). Finland comes next (about $47 thousand), followed by Germany, France, and England (all between $39 and $45 thousand). Italy and Japan report in at about $34 and $38 thousand respectively. China reports a small GDP per capita of $6,800.
!In Brief
In brief, China is simultaneously the largest and most impoverished of these nine nations. The United States is the wealthiest. And Finland demonstrates an exemplary
!10

record in terms of maintaining an economy that theoretically would permit it to distribute as much wealth equally among its people as nations ten times as large.
The other self-evident feature of this brief review is that it is impossible to find other nations that are similar to the United States in terms of size and wealth combined with democratic governance.
Even in nations chosen to be similar, as in the G-7 nations, analysts are compelled to compare economic and cultural apples and oranges. The distinctions already noted deserve attention. It would seem that a society such as the United States that sets out to educate 56 million or more students, many of them poor and immigrant, has a more complicated challenge on its hands than a smaller nation such as Finland, intent on educating about 850,000 students, relatively few of them poor or immigrants
China, of course, faces an even more massive challenge educating more than 200 million students. But it has simplified its task considerably by underserving students with disabilities, limiting access to high school, and creating an internal passport system based on parents’ housing registry that eliminates millions of low-income migrant students (all Chinese nationals) from educational services in cities. It also relegates an 4
estimated 60 million children to foster-care arrangements of various kinds with relatives and friends—“left-behind” children who cannot accompany their parents to the urban areas in which economic circumstances have forced parents to seek work. 5
Differences such as these raise troubling questions about the legitimacy of seeking to answer the “false question” identified in the epigraph of this report. The educational issue isn’t whether the children of “country X are better educated than the children of county Y.” The central issue of international assessments should be trying to understand “what each educational system has set itself to achieve.”
An equally troubling issue is revealed in this research: In the following pages the authors lay out a picture of an American educational system working with children and
youth growing up in communities with levels of economic inequity and violence not evident anywhere else in the developed world.
!11

!
!12

!
A Summary Table !
The chart below presents a summary of the findings of this study. The nine nations are listed in alphabetical order. The columns provide an index for the six major dimensions. The numbers represent each nation’s cumulative score on each of four indicators of each dimension. The 24 indicators of interest will be described in the chapters that follow. A blue background indicates a place in the top third of the nine nations; a gray background indicates placement in the middle third; a maroon background indicates ranking in the bottom third. (NOTE: For dimensions III, IV, and V, inadequate data on China precludes developing an index summarizing China’s performance.)
This report provides the first comprehensive, comparative examination of the context in which school systems function. It is grounded in the conviction that student and public school performance must be understood in the context of the economic, social and cultural environments in which school systems function.
Limited to just nine nations, the analysis reported here focuses on six key dimensions of national life: economic inequity, social stress, support for families, support for schools, student outcomes, and system outcomes. Within each of those broad dimensions, the authors have identified four key “indicators” of national performance. Indicators are data that illuminate social and educational issues, but do not diagnose what lies behind them.
The table above summarizes each nation’s relative standing on the six broad dimensions. Subsequent chapters “unpack” these numbers to explain what lies
behind this summary table. Blue is good; gray is medium; maroon shows need for improvement.
Indicators are said to be “normative”—they carry a judgment within them (as do reports of mean achievement test scores). Because they are numbers and because they are normative, they provide a sense when comparing individuals, school districts, communities, or nations that things are “better” or “worse.” Experts on indicators generally agree that an indicator system should avoid two extremes: At one end, an indicator system cannot rely on a single number (such as an achievement test score); at the other, the system should not try to provide readers with hundreds of discrete pieces of information. The principal of “parsimony” is frequently invoked in discussing indicators: providing sufficient information to draw a broad picture without overwhelming the observer with too much data.
!13
!!
Dimension 1 Dimension 2 Dimension 3 Dimension 4 Dimension 5 Dimension 6
NATION
Economic Inequity
Social Stress Support for Families
Support for Schools
Student Outcomes
System Outcomes
Canada 25 15 18 29 29 31
China 8 31 X X X 8
Finland 37 28 32 30 36 29
France 31 24 34 24 17 20
Germany 33 24 27 18 29 29
Italy 24 28 28 27 19 13
Japan 26 39 21 19 34 25
U.K. 21 18 35 34 22 30
U.S.A. 14 11 13 28 25 40
!

In this study, four data sources within each of six dimensions helped define 24 indicators, ranging from childhood poverty rates by nation to the proportion of the world’s high achieving science students in each of these nine nations. The figure below displays the six dimensions and the 24 indicators within them.
Preliminary Observations What jumps out of the Summary Table on page 13 is
the performance of Finland across the board. It is the only one of these nine nations with “blue” results in five dimensions, and it just barely misses a blue categorization in the sixth (system outcomes). That is to say Finland is a nation characterized by high levels of economic equity, support for families, and support for schools, combined with low levels of social stress. Of the nine nations, it also has the most visible and most promising results in terms of student outcomes.
The United States has a more dubious distinction here. It is the only one of the nine nations with a maroon designation in three of the six dimensions. The results for the United States with regard to economic inequity, social stress, and support for young families—all correlated with school performance—leave a great deal to be desired.
China stands our for a different reason. It is the only one of the nine nations in which is it impossible to draw
any conclusions in three of the six dimensions: support for families, support for schools, and student outcomes. In the broadest sense, also, based on the information available, China is the most inequitable of the nine nations, with the poorest system outcomes (really a measure of performance over the long term).
Among other conclusions: • Canada can take great pride in its performance
relative to the other eight nations on school support, student outcomes, and system outcomes.
• France, by contrast, seems to lag on two of these dimensions, student and system outcomes.
• Italy does well in terms of low levels of social stress, but its standing relative to student and system performance is a work in progress.
• Germany seems to be in the middle of these nine nations on several dimensions, but performs very well on indicators of economic equity and student outcomes.
• Despite comparatively low levels of school support in Japan, it produces exemplary results in terms of low levels of social stress (as measured by the indicators reported here) and very high student outcomes.
• The United Kingdom displays a pattern similar to the United States: very high levels of economic inequity and social stress combined with commendable indicators in three areas: support for families, support for schools, and system outcomes.
The nations examined here are, for the most part, democracies. Most are relatively wealthy. Many are located cheek-by-jowl with each other in Europe or North America. But from this bird’s-eye view, it is apparent that fairly significant differences manifest themselves in these nine nations along the six broad dimensions of economic inequity, social stress, support for families, support for schools, student outcomes and system outcomes. !
!14

!
Dimension I: Economic Equity !
The figure below summarizes Dimension I of this analysis, Economic Inequity. Four indicators (below) under equity are discussed in this chapter. Each of the nine nations in the analysis is rank-ordered by performance on each indicator, with the nation receiving the most promising results on this dimension being awarded ten points and the nation with the least promising results, receiving two. Assuming a rank in each of the four indicators, 40 points is the maximum a nation could achieve in this dimension; eight points, the least. The space held by a nation represents how many of the 216 points available in the dimension the nation earned. The larger and bluer the square, the more desirable that nation’s performance is on this dimension, the smaller and redder the square, the less desirable the performance. The number in each square represents the nation’s index score on the dimension.!
Economic Equity The table to the right outlines what went into constructing the economic equity index above. The indicators reflect available data on the nine countries included, as outlined in Appendix B.
!15
COMPONENT INDICATOR
Income Inequality Gini Index of inequality
Children’s Poverty Children in families with less than 50% of median income
Infant Mortality Deaths per 1,000 live births
Intergenerational Mobility Income elasticity - fathers & sons

! !!Excellence, however imperfectly defined and measured
by ILSAs, is one view of a nation’s school system. Equity is another. But a system that produced superior results by tolerating systematic inequities throughout society or by weeding low-income students out of the schools would be neither excellent nor equitable. Dimension I takes up the challenge of equity by looking at indicators of inequity in the larger society, in terms of income inequality, the proportion of children in poverty, rates of infant mortality, and intergenerational mobility.
Main Findings • Finland is an avatar of economic equity.. It
demonstrates what seems to be exemplary performance across the four indicators, followed reasonably closely by Germany and France.
• Japan, Canada, and Italy perform in the middle third of Dimension I, Economic Equity, closely bunched together when the four indicators are combined.
• The United States and China are the most inequitable of the nine nations.
• The indicators suggest the United Kingdom finds itself in the lower third of the rankings, but it is numerically closer to Japan, Canada, and Italy than it is to the United States or China.
Income Inequality The subject of income inequality became a prominent
theme in the United States and Europe as the grip of the Great Recession of 2008 tightened.
An accepted method of measuring inequalities generally is the “Gini Index,” named after the Italian statistician who created the concept. A Gini Index measures statistical dispersion and is frequently employed to examine income inequality. A Gini Index ranges from 00.00 to 100.00. The lower the number, the greater the equality among incomes; the higher the number, the greater the inequality. That is to say, a measure of 00.00 would be a Socialist’s ideal: everyone would enjoy the same income. A measure of 100 would be Gordon
Gecko’s vision brought to life: one person would hold a nation’s entire income.
With regard to income inequality, the Gini Index in Indicator I.1 reveals that in the nine nations of interest here only China appears to have a more unequal distribution of income than the United States.
With a Gini Index of 45.0, income inequality in the United States is extremely high. Japan also has a relatively high income inequality rating, with Canada and most of Europe hovering around 30.0. Finland, with an index of 26.8, displays the lowest level of income inequality in the nine nations, the product, according to Finnish experts, of a 40-year Finnish commitment to equity, both in schools and the larger society. 6
Children in Poverty Measuring poverty across nations is a tricky business.
For comparative purposes, a common measure is important, but many individual nations have their own definitions. The World Bank defines extreme poverty in the developing world in terms of the number and proportion of the population living on $1.25 per day. The United States’ definition is considerably more generous, but not as generous as many Western democracies. American poverty definitions revolve around eligibility for free and reduced meals (in schools) or the Orshansky Index (for the distribution of federal formula funds and eligibility for some benefit programs).
Increasingly, analysts have come to rely on a measure of “relative poverty” that tries to take into account the
!16

degree to which individuals (and children) threaten to fall short of the average standard of living of the society in which they live. It is not entirely satisfactory, but more 7
and more international estimates of children’s poverty rely on estimates of the proportion of children, (aged 0-17 years) in households with an income equivalent to less than 50% of the nation’s median income. Indicator I.2 provides such an estimate.
The figure for China is stunning. It comes not from UNICEF but from a World Bank estimate that 12% of the people in China (children and adults) live on $1.25 a day or less, while 66% live on $5 a day or less.
Looking beyond China, the rate of relative childhood poverty in the United States is nearly five times higher than the rate in Finland, and two to three times higher than the rates in the United Kingdom, France, and Germany. Canada, Japan, and Italy begin to approach the American figure, but by the standards of Western and democratic nations, the level of relative childhood poverty in the United States is very high.
Undoubtedly high levels of poverty are often a reflection of inequity in these societies. The interaction of poverty and inequity represents a potential special challenge in the United States. Recent analyses indicate not only that there no longer exists a “majority” ethnicity in U.S. public schools, but also that about one half (48%) of students enrolled in public schools are now eligible for free- and reduced-price meals. In many states in the
South, 60% or more of students are eligible for such meals.
Infant Mortality Infant mortality before the age of one might seem an
odd measure of inequity, but in fact it is a genuine indicator of access to health care, often a marker of privilege in some societies. UNICEF notes that this is an indicator of society’s overall level of commitment to children and that a nation that manages to reduce infant deaths to below 5 per 1,000 live births is clearly capable of delivering other critical components of child health. 8
Unfortunately, the United States does not meet the standard set by UNICEF (5 deaths per 1,000 births or less). As Indicator I.3 shows, in the nine nations included in this study, only China reports an infant mortality rate higher than that of the United States. The rate in the United States is close to 50% higher than the rates throughout Canada and most of Europe. It is almost three times the rate reported in Japan.
If access to routine preventive health care for children and young families—pre- and neonatal care, well-baby care, screening for adequate nutrition and presence of environmental toxins, annual physical and dental checkups—is related to school performance, schools in the United States have been operating at a comparative disadvantage.
Intergenerational Mobility Finally, as a measure of economic equity and inequity
the question arises about how easy it is to improve one’s economic status across generations. In a society that
!17

displayed a great deal of economic mobility, a child’s economic well-being would bear little or no relationship to the well-being of the child’s parents. At the other end of the spectrum, in class-based societies, a child’s occupation would often be identical to the child’s parent’s.
This is a difficult concept to get one’s arms around. Following families around over generations is hardly practical, but it is possible to get some sense of intergenerational mobility with statistical techniques. Professor Miles Corack (University of Ottawa) recently produced an indicator of intergenerational mobility that depended on calculating the “earnings elasticity” of a son’s income in relation to his father’s. (See note 9
regarding mothers and daughters.)
Broadly, the “earnings elasticity” coefficients reported in Indicator I.4 can be understood as explaining the proportion of the difference between the earnings of a son and the earnings of his father. A coefficient of 1.00 would indicate a frozen economic system in which the relationship of the next generation’s earnings could be fully explained by the earnings of the previous generation. All sons of low-income fathers would themselves become low-income adults. On the other hand a co-efficient of 0.00 would indicate that the earnings of the sons bore no relationship to the earnings of the fathers.
The coefficients between 0.00 and 1.00 account for how closely the son’s earnings are related to the father’s. So, to take the United States (with a coefficient of 0.47), if the
son, as an adult, makes $15,000 less than the father, 47 percent of the differential could be explained by the income of the father.
This measure of intergenerational mobility indicates that young people in France, Japan, Germany, Canada and Finland have greater intergenerational mobility—in a very real sense greater access to this aspect of the American Dream —than do young people in the United States.
Another way of understanding what perfect earnings elasticity would look like would be to imagine that the child of a single parent (male or female) living on food stamps in subsidized housing had precisely the same chance of becoming a high-earning adult as the child of a prominent lawyer or foundation leader raised in privilege within a gated community. Such rags to riches phenomena exist just about everywhere, but it is too often a rarity. !Summary
To summarize: The United States is clearly in a very precarious position on each of the four indicators outlined under Dimension I: income inequality, rates of childhood poverty, infant mortality, and inter-generational mobility. On the other hand, Finland consistently reports encouraging data on all four dimensions, with France and Germany following closely behind on dimensions of economic equity and Japan leading the way in terms of minimizing infant mortality.
!18

!
Dimension II: Social Stress !
The figure below summarizes Dimension II of this analysis, Social Stress. Four indicators (below) are discussed in this chapter. Each of the nine nations in the analysis is rank-ordered by performance on each indicator, with the nation receiving the most promising results on this dimension being awarded ten points and the nation with the least promising results, receiving two. Assuming a rank in each of the four indicators, 40 points is the maximum a nation could achieve in this dimension; eight points, the least. The space held by a nation represents how many of the 216 points available in the dimension the nation earned. The larger and bluer the square, the more desirable that nation’s performance is on this dimension, the smaller and redder the square, the less desirable the performance. The number in each square represents the nation’s index score on the dimension.
!!Social Stress The table to the right outlines the components of the social stress index. The indicators selected reflect available data as outlined in Appendix B.
!19
COMPONENT INDICATOR
Violent Death Violent deaths per 100,000 population
Death from Drugs Drug deaths per 100,000 population
Immigration % of population that is foreign born
Adolescent Births Births to 15-19-year-old women per 1,000

The National Child Traumatic Stress Network reports that acute traumatic events such as shootings or gang-related violence in communities can call forth “overwhelming feelings of terror or hopelessness” in children and youth. Frequently, “Exposure [to such 10
events] overwhelms [children’s] ability to cope with what they have experienced,” leading to withdrawal, depression, anxiety, or difficulty sleeping—and frequently increasing the risk of poor academic performance.
One study examining children in low-income U.S. communities reported that “chronic community violence,” including shootings, beatings, and knife fights, is endemic in many neighborhoods. Children reported 11
“witnessing . . . shootings and beatings as if they were ordinary, everyday events.”
Sustained levels of trauma, including family violence, can lead to “toxic stress” that affects the architecture of the developing brain, according to the National Scientific Council on the Developing Child. Children living in 12
high stress situations, including persistent poverty and threatening neighborhoods run the risk of enduring effects on brain development, according to the council. These risks undermine school readiness and academic achievement, and threaten serious long-term mental health challenges.
Dimension II examines four indicators of social stress: death from violence, death from drugs, immigration, and births to teenage women.
Main Findings • On the combination of the four issues defined here,
Japan is in the most attractive position. • China follows closely behind. • Non-English-speaking European nations (Finland,
Germany, Italy, and France) are grouped quite closely together.
• Results for the United Kingdom and the two North American nations are very disappointing.
• The United States fares very poorly on these measures of community stress and dysfunction, with high rates of death from violence and from drugs, and high rates of immigration and births to adolescent women.
At first blush, the findings on Japan are surprising. Suicide rates in Japan are very high, especially among men. School stress is also thought to be extremely high, particularly around the time of “examination hell,” the national examination periods that govern high school and university entrance. But World Health Organization data for 2005 suggest that suicide rates among teens are higher in Canada, Finland, and the United States than they are in Japan.
Violent Death The American rate of deaths from violence—from
intentional injuries, excluding accidents, suicides, and deaths in war—is, by international standards, extraordinarily high. As Indicator II.1 reveals, the rate in the U.S. is 13 times greater than the rate in Japan—and it is between three and eight times greater than any of the other nations included in this study.
The latest data reported above do not, unfortunately, differ greatly from earlier reports. An analysis of homicide rates in eight nations completed in 2002 by the World Health Organization reported an American rate that was 13 times greater than the average for the other seven nations. The homicide rate among young U.S. men is 13
more alarming. The WHO report included an analysis of homicides of 10-29-year old males prior to 2000. It set the rate for this age-group at close to twice the rate for the entire population—11 deaths per 100,000 males in the age group.
Children living around these events, to repeat, face “overwhelming feelings of terror and helplessness,”
!20

threatening anxiety and depression in these young people and undermining academic performance.
Death from Drugs The figures with regard to drug deaths (Indicator II.2)
find the United Kingdom in the unenviable position of reporting the highest rates. The United States and Canada report rates that are 23 and 39 percent lower, respectively. These are figures, it should be stressed, related to drug overdoses, not to deaths associated with the criminal aspects of the drug trade. While the figures include adults, frequently celebrities from the worlds of entertainment and sports, they inevitably also include young people of school age.
Italy and France report rates of death from drugs at about one-third the rate reported in the United States. Deaths from drugs in China, Japan, and Finland appear to be significantly lower.
!Immigration
The immigration data provided here stands, in some
ways, as a proxy for diversity, albeit an incomplete one.
Immigration enriches our society but adds complexity to educators’ tasks, by enrolling students from different backgrounds, often speaking different languages, at different points in the K-12 education journey. On indicator II.3, it seems that Canada followed by the United States and Germany face the more difficult challenges among these nine nations.
These figures, of course, represent both children and adults, but they offer an indication of the complexity immigration adds to school system functioning. It is not unusual, for example, to hear that in many American communities, 40 or more languages are spoken by students enrolled in the local school district. The school challenge is not limited to the children, but extends to parents as well. The parents’ mastery of the language of the new host nation is often more limited than the child’s. In consequence, many immigrant parents are unable to communicate effectively with the child’s teacher or participate fully in the life of the school.
Canada displays an unusually high proportion of foreign-born residents, fully one in five. The United States, the United Kingdom, and Germany are tightly grouped together, with 12 or 13 percent of the population being foreign born. France and Italy also report almost identical rates of around 9 percent, with Finland reporting the lowest rate among European nations, namely 4.9 percent. The rate for Japan is extremely low, less than 2 percent, while the rate in China is estimated to be close to zero percent.
The inclusion of this indicator is not intended to be xenophobic or a judgment on the economic benefits or costs of immigration. It is an acknowledgment of the obvious: adding significant numbers of children who are foreign born, with limited ability to speak the language of their adopted nation, greatly complicates the lives of educators in Europe and North America. Yet it is hardly a factor at all in the two Asian nations included here.
!21
!
0.0!1.7!
4.9!8.9!9.0!
12.0!13.0!13.0!
20.1!
0.0! 7.0! 14.0! 21.0!China!Japan!
Finland!Italy!
France!U.K.!
Germany!U.S.!
Canada!
Sources:)OECD,)Society)at)a)Glance,)2014;)and)World)Bank,)2014)
Ind.)II.3:)Proportion)of)Population)that)is)
ForeignHBorn,)2011)

Births to Adolescents The number of births to adolescent women in the
United States is extremely high. Indicator II.4 data reflect births to women aged 15-19-years old per 1,000 members of the age group. In Japan, the rate of births to adolescent women would have to increase by a factor of almost eight to approach the rate in the United States. The rate of births to Canadian young women would have to more than double to match the rate of their North American neighbor. The United Kingdom also reports quite high rates, exceeding the rate in Canada by about 50 percent.
These data help to explain why statistically American women in general give birth to their first child much earlier than their peers in the other nations involved in this study. In 2009, according to data reported by OECD, the birth of a first child arrived for American women at a mean age of 25. In the seven other nations for which data are available (China is excluded), the mean age is almost 29. 14
The Centers for Disease Control and Prevention in the United States report that the rate of births to young women aged 15-19 in 2012, fell below 30 live births per 1,000 in the age group, a record low for teenagers. Despite that progress, in an international context the American rate remains remarkably high. It inevitably complicates the school completion prospects of these young women and their partners and frequently requires expensive school interventions to help young mothers finish high school. Meanwhile, childbearing at such a young age promises substantial social and economic costs
for these teenagers and their children, in both the short and the long term.
Summary Once again on the Dimension of Social Stress, the data
reveal that on these four indicators, American teachers, administrators, parents, and students in many communities are faced with complicated challenges in terms of deaths from violence and drugs, homicide rates among young males, complex language needs to accommodate immigrant students, and extremely high rates of teenage pregnancy and childbearing.
Middle-income Americans are accustomed to hearing that three of the greatest stresses in life relate to moving, divorce, or starting a new job. Many people find themselves seeking counseling to handle these stresses or to work through emotional conflicts with a spouse or partner.
Without making light of these stresses, these are hardly unusual challenges in the adult world. Common sense indicates that giving birth to a child, while still a child unprepared for adult responsibilities, is a more stressful event. Nor can any responsible adult in good conscience contemplate a child witnessing a shooting, knifing, or violent beating without reflecting on the trauma the child experiences. Yet such experiences are reported as “ordinary, everyday events” for many American children. These issues call for carefully considered community, state, and even national policy responses that extend far beyond school policy.
!22

!
Dimension III: Support for Families ! The figure below summarizes Dimension III of this analysis, Support for Families. Four indicators (below) are discussed in this chapter. Each of the nine nations in the analysis is rank-ordered by performance on each indicator, with the nation receiving the most promising results on this dimension being awarded ten points and the nation with the least promising results, receiving two. Assuming a rank in each of the four indicators, 40 points is the maximum a nation could achieve in this dimension; eight points, the least. The space held by a nation represents how many of the 216 points available in the dimension the nation earned. The larger and bluer the square, the more desirable that nation’s performance is on this dimension, the smaller and redder the square, the less desirable the performance. The number in each square represents the nation’s index score on the dimension.
Support for Families The table to the right outlines what went into constructing the family support index. The indicators selected reflect available data on the nine countries included, as outlined in Appendix B. !
!23
COMPONENT INDICATOR
Family Benefits Social expenditures as % of GDP
Benefits for Young Families Expenditures on families with 2 children
Access to Preschool 3-6-year 0lds in preschool
Child Neglect Children’s deaths from abuse/neglect

Some years ago the the Annie E. Casey Foundation advanced a “Making Connections” effort built on the concept that children do well when their families do well and families do better in supportive and safe communities. Dimension II examined safe communities. Dimension III examines social support for families, especially families with children.
National accounts of social expenditures include public money spent on pensions, health care, income support, in-kind contributions including food and housing support, and tax credits to encourage certain socially beneficial outcomes (such as the earned income tax credit in the United States). Because of the large size of the age group of older citizens, and the cost of their care, much of this funding goes toward pensions and health care.
This dimension, which might be thought of as the “safety net,” examines support for families with children across the target nations in terms of social expenditures generally, social expenditures on families with children, the availability of preschool programs, and the incidence of child abuse and neglect.
Main Findings The key findings are crystal clear:!
• Most European nations appear to be far more
generous in support of families than Japan, Canada,
and the United States. !
• The United Kingdom is in a very strong position on
support for families, principally due to its
performance in providing access to preschool
programs and to addressing childhood deaths from
abuse and neglect.!
• China, with only limited data available, appears to
provide the least support for families.!
• United States performance on this dimension is the
weakest of the remaining 8 nations (G-7 countries
plus Finland).
Social Benefits As revealed in Indicator III.1, France devotes about one
third of its GDP to public social expenditures. It is 15
followed closely by Finland, Japan, the United Kingdom, Germany and Italy all hover around a figure representing about one-quarter of GDP.
Among developed nations, a surprising range of generosity in financing social benefits exists, from close to one-third of national wealth (France and Finland) devoted to these purposes, to less than one-fifth (the United States and Canada). Only the United States and Canada assign less than 20 percent of GDP to social support, with China assigning just 9 percent, barely more than a quarter of the rate evident in France. The inclusion of privately funded social benefits (e.g., employer-sponsored health care) might change these figures substantially.
Benefits for Young Families It is conceivable that even limited general support for
social welfare might be concentrated on children and families with children. Across the eight nations for which data could be located for this indicator, however, that seems not to be the case.
When expenditures as a proportion of GDP on families with children are examined, they tend to be a small fraction of all expenditures for social support. That is because when analysts subtract public support for pensions, health care, and housing from general support for social welfare, the funds remaining to be allocated to families with children—in the form of cash, in-kind
!24

contributions (e.g., food stamps), tax credits, and support for parental leave and childcare—is relatively small in the great scheme of things.
Indicator III.2 focuses on expenditures on couples with two children. It reveals that France and the United Kingdom provided the most generous benefits to young families, each devoting in excess of 3.5 percent of GDP to expenditures for families with two children. 16
Finland and Germany provide more than 2.7 percent, while Canada, Italy, Japan, and the United States contribute less than 1.5 percent. As in many of these comparisons, the United States’ position leaves a lot to be desired. The U.S. is spending at less than half the rate of much of Europe. This is one of the areas in which data for China are unavailable.
These findings are consistent with earlier reports cited by the National Academy of Sciences suggesting that “public spending by the United States on services for families and young children places the United States last among the 13 peer countries studied. . . . Only Korea ranked lower than the United States on the proportion of its economy devoted to public services for families and young children.” 17
Access to Preschool Federal and state interest in support for preschool
programs has been growing in the United States. As Indicator III.3 reveals, the U.S. and China are not keeping up with the other nations studied here on preschool enrollment for children aged 3-6. Access to high quality preschool programs has been repeatedly demonstrated to be an important precursor to success in school. The
importance of preschool programs for low-income students has been demonstrated repeatedly. For example, three-year-olds from families on public assistance are at a marked verbal disadvantage compared to children from blue-collar families and those from professional families. The working vocabularies of children from 18
professional families are, on average, twice as large as the vocabularies of children from families on public assistance. Reading is certainly fundamental to learning, but language and vocabulary development are even more fundamental.
The famous Perry Preschool study also reveals that high-quality preschool programs contribute benefits well
into adulthood and middle age. Compared to a control group, minority, low-income children who had the benefit of access to a high-quality preschool program were more likely to finish high school, hold a job, and pay taxes, while being less likely to be on public assistance or run into trouble with the juvenile or adult correctional systems. 19
Despite those findings (see Indicator III.3), Japan, the
United States, and China all have fewer than 55 percent of students in the age-group enrolled in preschool. At the other end of the spectrum, 90 percent or more of the age-group is enrolled in preschool in France, Finland, and the United Kingdom. Canada, Italy, and Germany all display eighty percent or more of the age-group enrolled in preschool programs.
Child Neglect Finally, with respect to Dimension III, it is hard to
conceive of greater childhood trauma than that associated
!25

with abuse, violence, and neglect. At their worst, child neglect and abuse lead too frequently to children’s deaths.
Rates of children’s death from abuse, negligence, violence and neglect are published by a number of agencies. All tend to agree that the rates of death from abuse and negligence in the United States far outweigh rates in the comparison nations.
Fortunately, children’s deaths in this manner tend to be rare. To smooth out the spikes from year to year, analysts prefer to report these figures for three-year periods. The most recent three-year period for the United States (see Indicator III.4) demonstrates a childhood death rate of 3.5 per 100,000 children, a rate eight times greater than the average rate for the other seven comparison nations (data for China are not available).
Canada also reports a rate that is twice the rate for most of the other nations. But the most dramatic comparison is between the rates reported for the United Kingdom and the United States. The rate of childhood deaths from abuse and neglect in the United States runs about 14 times greater than the reported rate in the United Kingdom.
Summary In the dimension of support for young families, this
third set of indicators is grim across the board for the United States. The U.S. finds itself lagging in terms of social expenditures as a proportion of Gross Domestic Product, expenditures to support families with children, access to preschool programs for children aged three to six, and an important measure of caregivers’ negligence—children’s deaths from abuse and neglect.
!26

!!
Dimension IV: Support for Schools !
The figure below summarizes Dimension IV of this analysis, Support for Schools. Four indicators (below) are discussed in this chapter. Each of the nine nations in the analysis is rank-ordered by performance on each indicator, with the nation receiving the most promising results on this dimension being awarded ten points and the nation with the least promising results, receiving two. Assuming a rank in each of the four indicators, 40 points is the maximum a nation could achieve in this dimension; eight points, the least. The space held by a nation represents how many of the 216 points available in the dimension the nation earned. The larger and bluer the square, the more desirable that nation’s performance is on this dimension, the smaller and redder the square, the less desirable the performance. The number in each square represents the nation’s index score on the dimension.
Support for Schools !The table to the right outlines how the index above was constructed. The indicators selected reflect available data on the nine countries included, as outlined in Appendix B.
COMPONENT INDICATOR
Expenditures on Schools Annual expenditures per pupil
Expenditure Effort Expenditures as % of GDP
Class Size Average class size — lower secondary
Teacher Workload Annual hours spent teaching
!27

! !Dimension IV, Support for Schools, arrives finally at
what is often the first point of consideration in many assessments of American schools. Indeed, it is sometimes pointed out that Americans spend more on their schools than many nations with better performance on international assessments. A plausible assertion on the surface, it’s not clear that it would stand up under forensic examination.
Dimension IV incorporates four indicators for each nation: expenditures per pupil, expenditure effort, class size, and teacher workload.
Main Findings • The United Kingdom and the United States perform
very well on this dimension, principally due to their strong performance on expenditure effort and expenditures per pupil.
• The U.S. standing on teacher workload is disappointing. • Finland and Japan spend the lowest amounts per-pupil
in this nine-nation world. • Of the four data series, only an estimate of class size is
available for China. • It is not possible to reach an overall conclusion about
China with regard to school support since estimates of expenditure effort, expenditures per pupil, and teacher workload are unavailable.
Support for Schools Indicator IV.1 provides the relevant data on
expenditures per pupil. The data from each nation have been converted into U.S. dollar equivalents on a per-purchasing parity (PPP) basis. Among the eight nations reporting data, the United States is clearly the top performer in expenditures. Americans averaged expenditures of about $11,830 per pupil in 2009, a figure almost 30 percent higher than the $8,310 spent per pupil in Finland, the lowest-spending nation in this group.
With Finland internationally hailed for its superior performance on ILSA’s, this seems to be an example of a nation spending less and getting more in terms of tested student achievement. Indeed, the figure reported for U.S.
expenditures is about 25 percent higher than the average for the other seven reporting nations ($8,848.57).
After the United States, the next four nations (United Kingdom, Canada, Italy, and France) are grouped in a band in which the highest-spending nation, the UK, spends about $1,000 more than the lowest-spending (France). Germany and Japan are also very closely related in terms of expenditures per pupil.
Overall, the United States appears to have a compelling advantage in terms of how much Americans are willing to spend on schools. While that appears to be true at face value, beneath the surface things may not be so simple. A forensic examination of these numbers would be required before it could be ascertained with certainty that apples are being compared with apples. For example, the U.S. figures include expenditures for fringe benefits, including health care insurance and retirement benefits, that are frequently carried in municipal or state budgets outside schools in other nations.
U.S. schools also provide extensive interscholastic athletics programs that are generally provided by non-school community groups across much of Europe. Likewise, American school budgets include virtual door-to-door transportation, free of charge, to just about all students living more than a few blocks from school. Municipalities provide public transportation in many European cities, and it is not clear where these funds are budgeted.
!28

Another issue, with regard to the United States in particular, is funding distribution. Despite genuine progress in recent decades to make expenditures more equal across school districts, the reality is that schools in wealthy communities often spend much more per pupil than those in low-income communities.
With those caveats aside, however, on the surface U.S. schools appear to be in a strong position relative to average expenditures in the context of these comparison nations.
Expenditure Effort In the United States, “effort” analyses typically measure
differences in state or local spending for education relative to fiscal capacity. At the state level, effort is often defined as the ratio of state spending to state per-capita gross domestic product (GDP). The concept readily transfers to comparisons of national expenditures.
On Indicator IV.2, as with expenditure per-pupil estimates, American schools also seem to be in a relatively strong position. Here expenditures are considered as a proportion of Gross Domestic Product. The distinctions among nations with respect to effort are not enormous, as percentages, although the amounts of money involved are substantial. The United Kingdom in 2008 devoted about 4.2 percent of GDP to expenditures on public schools, while the United States and Finland devoted 3.8 20
percent. Only Germany and Japan reported spending less than 3 percent of GDP on public schools in 2008.
As with expenditures per pupil, a forensic analysis of these figures would be required to ensure that the accounts of these various nations were reported in the same manner. Still, on the surface, among the eight reporting nations, the United States appears to be in a leading position with respect to Indicator IV.2.
Class Size The idea that reducing class size should make it easier
for teachers to devote more time to individual students appeals to common sense and logic. But what is the scale of the reduction that would be required to make a difference? From 25 students per class to 20? From 25 to 12? And where should class-size reductions be made? From kindergarten to Grade 3? In middle school? Or high school?
Unfortunately, domestic research on this issue produces conflicting evidence, although reduced class size in early years appears promising. As to international analyses, there are few—and it is even hard to find comparable data on average class size for the nine nations in this study.
From the United States’ point of view, the picture of class size is not as attractive as the snapshot of expenditures. Indicator IV.3 displays the results with figures on average class size in 2011 for the “lower secondary” level, what people in the U.S. would consider to be the junior high or middle school years.
The two Asian nations, China and Japan, report the highest average class size, with class size for China (52.90 per class) almost three times the class size reported for the nation with what appears to be the most attractive class size Canada (18.00).
!29

In this array, the United States comes in at fifth place among the nine nations, with a class-size figure of 23.20. If China is considered to be such an outlier that it should be excluded from the comparison, the U.S. figure is very close to the 23.07 average for the eight remaining nations. If both Asian countries are excluded from the comparison, the average class for middle school teachers in the remaining seven Western nations is 21.69 students. The U.S. figure of 23.20 means that the typical American teacher has 1.5 more students in the average class than middle school teachers in the seven Western nations.
Teacher Workload Teachers in the United States at the elementary, middle,
and senior high levels spend many more hours in front of students in the classroom than do their peers in this study’s nine-nation world. Indicator IV.4 lays out the data for “lower secondary” teachers, but the data for elementary and upper secondary teachers tell an almost identical story.
U.S. lower secondary teachers (those in middle and junior high schools) spent 1,085 hours teaching in 2012, according to the latest data from OECD. Data are not 21
available for China, but on average, teachers in the seven remaining nations spend just 664 hours in front of students. That is to say, U.S. teachers are expected to be in the classroom nearly 40 percent longer than their peers in the other seven nations. Finnish teachers produce remarkable results on ILSAs while spending 45 percent fewer hours in front of students than do U.S. teachers. This is due, in part, according to Finnish educators, because teachers in Finland are provided with time during
the school day to develop lesson plans and work with each other in a cooperative fashion to address individual student needs.
An interesting insight into how adults in different nations view teachers was provided in 2014 by the Varkey GEMS Foundation. Among its findings: In both China 22
and the United States, primary school teachers are more highly regarded than secondary school teachers. School teachers are more likely to be compared to social workers and librarians than to doctors, lawyers, or accountants. And adults in Japan, France, and the United States judge that actual teacher pay is higher than it is—between 6 percent (France) and 55 percent (United States) higher than a “fair rate of pay.”
Summary Of the dimensions considered so far, the four indicators
considered in Dimension IV provide the most encouraging results for the United States. While there may be debates about what is included in expenditure comparisons, Americans seem to be willing to spend more on education than citizens in comparison nations and, as a proportion of GDP, expenditures are in the upper third of the nations examined in this study.
Meanwhile class sizes are not greatly out of line with the major comparison nations. Support for U.S. teachers is a weak spot in this dimension, as measured by data on teacher workload and by assessments of public opinion about teachers. Americans appear to believe that teachers’ salaries are 55 percent higher than they are or than a “fair rate” of compensation would suggest they should be. !
!30

!
Dimension V: Student Outcomes !
The figure below summarizes Dimension V of this analysis, Student Outcomes. Four indicators (below) are discussed in this chapter. Each of the nine nations in the analysis is rank-ordered by performance on each indicator, with the nation receiving the most promising results on this dimension being awarded ten points and the nation with the least promising results, receiving two. Assuming a rank in each of the four indicators, 40 points is the maximum a nation could achieve in this dimension; eight points, the least. The space held by a nation represents how many of the 216 points available in the dimension the nation earned. The larger and bluer the square, the more desirable that nation’s performance is on this dimension, the smaller and redder the square, the less desirable the performance. The number in each square represents the nation’s index score on the dimension.
!!Student Outcomes The table to the right outlines what
went into constructing the student outcomes index above. The indicators selected reflect available data on the nine countries included, as outlined in Appendix B.
!31
COMPONENT INDICATOR
Elementary School Reading PIRLS 4th-grade reading results
Secondary School Reading PISA 15-year-old reading results
School Completion Rates Completion, on time + two years
Achievement Gap PISA 15-year-old reading gap

One of the principal purposes of schools is to impart to students the knowledge and skills they will need to succeed as citizens, parents, employers, employees, and as members of their local communities and of a civil society. One way to assess the success of schools in achieving that purpose is to measure learning outcomes by assessing student achievement. Assessments can provide a valuable way to maintain educational accountability and, properly conducted, provide one indicator of school success.
It is conceivable for assessments to reveal that certain schools in a particular nation (perhaps elementary schools) produce results that are superior to results in the middle and high school years in the same nation. Ideally, ILSAs would take this into account, providing assessment data, by subject, during the elementary, middle, and senior high school years. Even for the nine nations examined here, it is difficult to find evidence of student performance at the end of all three levels of schooling: elementary, middle, and secondary in reading, mathematics, or science: 23
• China as a nation did not participate in PIRLS, PISA, or TIMMS.
• Japan did not participate in the PIRLS 4th-grade reading assessment.
• Canada and France did not participate in TIMSS at either the fourth- or eighth-grade levels.
• Germany participated in PIRLS and TIMSS at the fourth-grade level, but did not participate in TIMSS at the eighth-grade level. Perhaps most surprising of all, summative measures
that might enlighten national policymakers on what secondary school graduates in their respective countries know and are able to do are unavailable. Policymakers cannot compare the end product of elementary and secondary schooling in reading, mathematics, or science. Although TIMSS in 1995 assessed students in 4th-, 8th-, and 12th-grades, it has not fully assessed 12th-graders since. PISA was launched about a decade ago as a set of indicators for 15-year-olds. The justification, according to OECD, was that these students were in their last year of school in most countries. PISA seems now to be widely
interpreted (certainly by policymakers) as a summative measure of student performance on completion of school. That is inaccurate. Almost all students in almost all developed nations continue to go to school for several more years after age 15.
In short, even in the area to which the greatest investments of time, resources, and attention have been devoted, significant gaps in data availability continue to be a challenge. Moreover, policymakers and the public often make summative judgments about the relative success of their elementary and secondary school systems on data that were not designed to support such judgments (namely assessments of 15-year-olds) and cannot possibly support them.
In the absence of such data, this study focused on four key indicators in assessing student learning outcomes across the nine nations in this study: 4th-grade reading levels, reading levels among 15-year-olds, school completion rates by nation, and a measure of the achievement gap in reading.
Main Findings • Japan performs at a top level on indicators of high
school completion, 15-year-old reading, and 4th-grade reading (an imputed score based on the 15-year-old results).
• The United States, as it has for decades, produces commendable results in 4th-grade reading and solid school completion rates, but is less impressive on assessments of 15-year-old reading.
• An achievement gap along socio-economic lines exists in each of the eight nations participating in PISA.
• Finland displays the lowest achievement gap. • China’s only indicator in student outcomes, school
completion rates, places it last among the nine nations.
Elementary School Reading Since IEA and its predecessors first began assessing
student competence in reading in the 1990s, the performance of U.S. fourth-graders has been exemplary. That continues to be the case in the latest administration of the PIRLS reading assessment by IEA in 2011. Among the eight nations for which results are available, as
!32

Indicator V.1 indicates, the United States finds itself reasonably close to the company of Finland and Japan.
These results suggest that American students score, on average, 12 points behind students from Finland, but 36 points ahead of French students (and 13 points ahead of students in Italy and Germany). In examining Indicator V.1, it is important to note that the results for Japan, which did not participate in PIRLS, are imputed, based on the top reading ranking of Japanese students among 15-year-olds on the PISA assessment. It is possible, but highly unlikely, that Japanese students were poor or moderate readers in fourth-grade but then vaulted to the top of the reading charts by age 15. As a nation, China participated in neither the PIRLS or PISA assessments. Although a handful of wealthy, urban, subnational jurisdictions such as Shanghai did report PISA findings, these findings have been shrouded in controversy. 24
Secondary School Reading The positive findings for U.S. students in fourth-grade
reading are not repeated among U.S. 15-year-olds on the PISA reading assessment, as revealed by Indicator V.2. 25
Here we again find Japan and Finland doing extremely well, with the United States and Italy producing less promising results. The Japanese mean results are 14 points higher than the results for Finland and a remarkable 40 points higher than those for the United States (and 48 points higher than the results for Italy).
Results for students in the United Kingdom are virtually indistinguishable from those for the United States, while results for France and Germany are eight to ten points higher that those for the United Kingdom and the United States. Results for Canada are almost identical to those those for Finland.
School Completion Rates Every year, students graduate from American high
schools in the late spring aware of classmates required to complete additional classes to obtain their high school diplomas. By the standards of “on-time” completion, these students would be considered by many to be failures. This is so, even though many of them receive diplomas at the end of the summer and some enroll in two- and four-year colleges in the fall.
A more meaningful completion rate would include graduates who finished school within a reasonable time of their on-time rate. A completion rate calculated on the basis of “on-time plus two years” seems a reasonable proxy. Fortunately OECD collects such data as displayed in Indicator V.3. Here, as elsewhere in Dimension V, Japan is in such solid shape that its on-time graduation rate, which is displayed here, exceeds the “on-time plus two years” benchmark of the other eight nations. Germany and the United States follow Japan in terms of school completion as defined here, with Finland and Canada close behind. France, the United Kingdom, and Italy report almost identical rates around 80 percent.
The Chinese figure may in fact overstate the “completion plus two” rate since this figure, like the Japanese figure, is taken from a different statistical series. OECD reports in a different series on school completion rates at “age specific” years for each nation, with the year defined as the age of students beginning their final year. For example, United States’ students are counted in the
!33

beginning of the year in which they turn 17; English students are counted at the beginning of the year in which they turn 16; French students are counted at the beginning of the years in which they turn 17, 18, or 19; and German students are counted at the beginning of the years in which they turn either 19 or 20. The Chinese rate is calculated on beginning the final year at age 17, but there is good reason to wonder if the reported figure of 73 percent included the entire age group, or simply the 17-year-olds who remain in school at that age. 26
Achievement Gap The final indicator in Dimension V, the Achievement
Gap, while not favorable to the United States, may shed some light on the issue in American schools.
The achievement gap is frequently discussed domestically as though it were something peculiar to the United States. However, this phenomenon exists in each of the eight nations for which data are available. The “achievement gap” is typically reported as a gap that is
easy to discern on mean achievement scores disaggregated by race and ethnicity, gender, special education status, and income or socio-economic status (SES). Indicator V.4 illuminates the achievement gap on eight of the nine nations of interest in this study, with evidence on the gap in mean reading scores between low and high SES students. The gap here is defined as the difference in PISA mean reading results for students in the 5th percentile (very low) on a measure of economic, social and cultural status compared to those in the 95th percentile (very high).
Both France and Japan exhibit a substantially higher achievement gap than the United States (France is 11 points higher; Japan almost 30). Even Finland, which exhibits the most favorable results here, reports a significant gap, although it is some 30 points lower than the gap reported for the United States. The United Kingdom, Italy, and Germany report lower rates than the United States, but all are within just ten points of the U.S. figure.
Summary
Overall, in terms of student learning outcomes, these indicators find the United States in the middle of this group of nine nations. Is that sufficient? Or insufficient? That depends on perceptions, but it is worth noting that this middle position is among nations chosen to be as similar as possible to the United States.
Still the picture is mixed. American fourth-grade reading scores look generally favorable, but the picture at the age of 15 in reading is less attractive, with the United States just marginally below the PISA mean, but some 40 points in arrears of the leader, Japan.
School completion rates for the United States look fairly promising on the benchmark of “on time plus two years.” Meanwhile, the American achievement gap in reading is considerable, but is 11 points more favorable than the gap in Japan and nearly 30 points more positive than the gap in France. !
!34
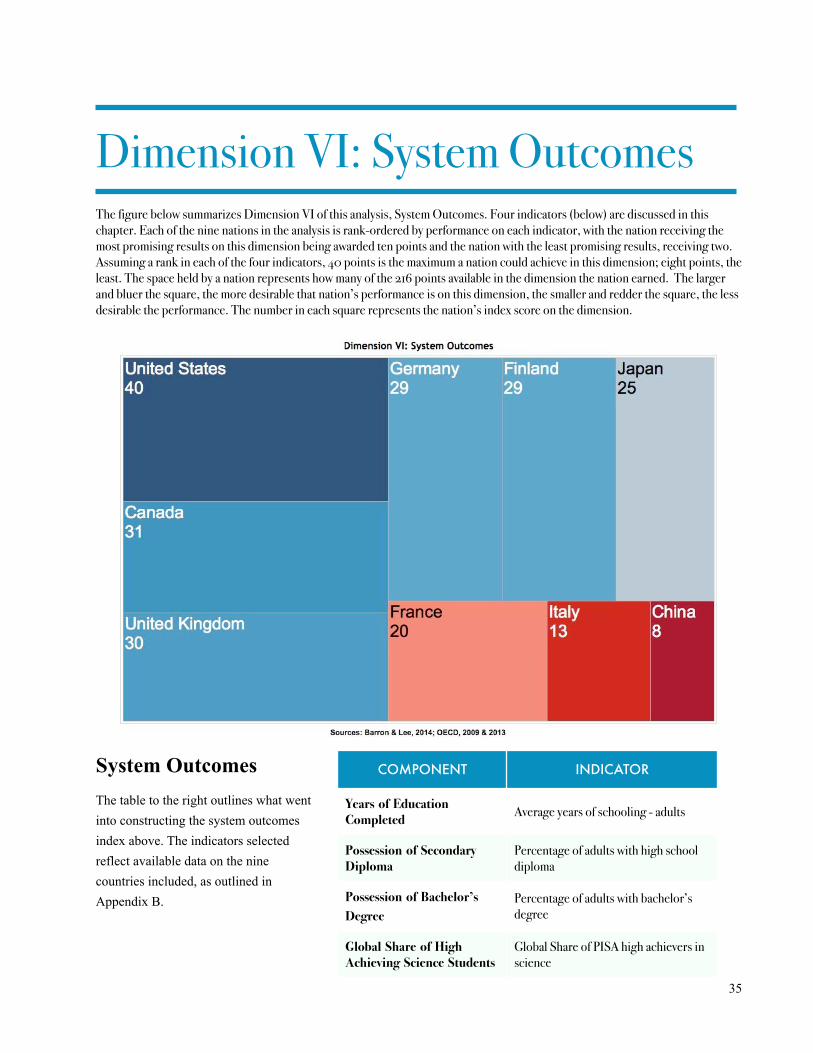
!
Dimension VI: System Outcomes !
The figure below summarizes Dimension VI of this analysis, System Outcomes. Four indicators (below) are discussed in this chapter. Each of the nine nations in the analysis is rank-ordered by performance on each indicator, with the nation receiving the most promising results on this dimension being awarded ten points and the nation with the least promising results, receiving two. Assuming a rank in each of the four indicators, 40 points is the maximum a nation could achieve in this dimension; eight points, the least. The space held by a nation represents how many of the 216 points available in the dimension the nation earned. The larger and bluer the square, the more desirable that nation’s performance is on this dimension, the smaller and redder the square, the less desirable the performance. The number in each square represents the nation’s index score on the dimension.
System Outcomes The table to the right outlines what went into constructing the system outcomes index above. The indicators selected reflect available data on the nine countries included, as outlined in Appendix B. !
!35
COMPONENT INDICATOR
Years of Education Completed Average years of schooling - adults
Possession of Secondary Diploma
Percentage of adults with high school diploma
Possession of Bachelor’s Degree
Percentage of adults with bachelor’s degree
Global Share of High Achieving Science Students
Global Share of PISA high achievers in science

Commentaries on education systems throughout Europe and other Western nations tend to focus very much on system performance today. While that’s appropriate, many of these educational systems have decades, often more than a century, behind them. In the great scheme of things, how well have they performed for their societies over time? Dimension VI, System Outcomes, takes up that question.
It examines four key indicators: years of schooling completed, the proportion of adults with a high school diploma, the proportion of adults with a bachelor’s degree, and each nation’s share of global science talent. Dimension VI really asks how well each of the nine nations’ education systems has performed historically in producing educated citizens and skilled workers.
It is, for example, appropriate for policymakers in Western nations to express concern about the apparent superior success of Chinese schools today (based almost entirely on PISA scores from Shanghai). But the fact is that in comparing the United States and China, one is comparing a system in which the adults in one nation (the United States) average an educational attainment level of more than 13 years of education, while the adults in the other (China) average about seven.
U.S. newspapers have recently focused on reports that college completion rates of Asian nations or nations formerly behind the Iron Curtain now exceed those of the United States. Some caution should be adopted in interpreting and acting on these reports. The definitions employed in collecting and reporting this data are remarkably confusing. The ISCED definitions 27
(International Standard Classification of Education) employed by OECD are opaque and badly written. Even skilled analysts report trouble following distinctions between and among various levels of Tertiary Type A university education, Tertiary Type B vocational education, postsecondary education, and two- three- and four-year college degrees. Many media and newspaper accounts seem to confuse attainment in postsecondary education, which includes certificates, post-high school vocational education, and associate’s and bachelor’s degrees, with attainment of four-year degrees.
Main Findings • On Dimension VI, the United States appears to have the
most highly educated workforce among these nine nations in terms of years of schooling completed, the proportion of adults with a high school diploma and bachelor’s degrees, and the proportion of the world’s high-performing 15-year-old science students.
• By contrast, in the three indicators providing data on China—years of schooling completed, proportion of adults with a high school diploma or a bachelor’s degree—China appears to do least well.
• Canada, the United Kingdom, Germany, and Finland form a closely packed group behind the United States.
• The results for France and particularly Italy are disappointing on the combination of indicators included in Dimension VI.
Years of Education: Adults At the most elementary level, it is appropriate to ask
how many years of schooling has the average adult in each of these nations completed? Various databases indicate the United States leads the way in this category. The latest analysis suggests the typical American over the age of 25 has completed 13.42 years of schooling (Indicator VI.1). Adults in the United Kingdom, Canada, and Germany typically enjoy in excess of 12 years of schooling, with Finland and Japan reporting an average in excess of 11 years. Adults in France, Italy, and China have received the benefit of the fewest years of schooling. Data from China suggest the typical Chinese adult can draw on the benefit of about half the number of years in school provided to the typical American adult.
!36

Since the typical adult American has gone to school longer than typical adults elsewhere in this nine-nation world, one would expect that a higher proportion of adults in the United States also hold high school diplomas and college degrees. That expectation is met.
Secondary Diplomas: Adults The general dynamic documented in Indicator VI.1
carries through in Indicator VI.2 (the proportion of adults with a high school diploma). Here in Indicator VI.2, OECD reports that the United States and Canada have the highest proportion of adults holding a high school diploma (89 percent), with Germany (86 percent) and Finland (84 percent) also reporting high rates.
The OECD data reveal that the proportion of adults aged 25-64 with a high school diploma is between 70 and 77 percent in the United Kingdom, France and Japan. Of advanced economies, Italy has the lowest proportion of adults meeting this standard (56 percent), but even this Italian figure handily outdistances the figure estimated for China (22 percent).
All of these figures work together to confirm the general tendency noted in Indicator VI.1, namely that the United States, Germany, and Canada tend to have the most highly educated adult populations among these nine nations, while China, due to historical circumstances dating back centuries, has the least highly educated in terms both of years of schooling completed and the proportion of adults with a high school diploma.
Bachelor’s Degrees: Adults Without belaboring the point, this pattern is repeated
with respect to adults with a four-year degree (Indicator VI.3). With respect to college degrees, the United States, with 31 percent of its adults holding a bachelor’s degree leads the way, closely followed by the United Kingdom and Canada. China is in an especially disadvantageous position by this measure: just four percent of adults are estimated to hold the equivalent of a bachelor’s degree.
Global Share of High Achieving Science Students
Finally with regard to Dimension VI, several years after OECD’s 2006 analysis of science achievement among 15-year-olds by mean performance, the agency issued a report, Top of the Class, that assessed the share of global talent in science of each nation that participated in PISA. “Global talent” was defined as the share of 28
students, by nation, in each of PISA’s two top categories of science performance. The results were considerably different from the picture presented by mean PISA science scores. 29
In this new analysis, issued in 2009, OECD reported that students from the United States represented 25 percent of all the 15-year-old global talent in science. Japanese students, who handily outpaced the United States in mean PISA science scores, represented just 13 percent of the global talent pool. The United Kingdom and Germany followed with about eight percent. Finnish students, reported to be the highest-scoring Western students on many of these assessments, accounted for just
!37

one percent of the most talented science students in the PISA world. There is no nationwide estimate for China.
OECD has yet to issue a similar analysis around the 2009 or 2012 administrations of PISA. However, analysts associated with Stanford University and the Economic Policy Institute have examined the 2012 administration across all three subject areas. They report markedly 30
similar findings for science and reading, although the results for mathematics are not as encouraging.
The performance on this indicator is clearly related to the size of the United States and its large student population. Nevertheless, this indicator remains a significant piece of information. Policymakers and editors in the United States routinely wring their hands about the threat to national standing and competitiveness that will inevitably follow on the heels of mediocre mean achievement in science. The quest to improve U.S. performance in science is an important and continuing goal of U.S. policy. It would seem, however, that if American elementary and secondary schools are producing 25 percent of the global talent in science, failure to achieve the nation’s ambitions in science and technology might lie outside the elementary and secondary education system.
Summary With respect to Dimension VI, System Outcomes, the
historic performance of American schools in producing adults prepared to take their place in the world is not matched by any of the other eight nations. The United States leads this nine-nation world in years of schooling
completed among adults. It leads in the proportion of adults with a high school diploma. Likewise, it leads in the proportion with a bachelor’s degree. And, when assessments of 15-year-olds in science are examined, it turns out that American 15-year-olds represent fully one quarter of the secondary students making up the global talent pool in science.
That could all change very quickly if educational, community, and political leaders do not effectively address emerging challenges and the realities of the new demographics entering American schools. The nation and its schools needs to work very hard to stay ahead of the curve, especially in the face of fierce and determined economic rivals. We wish to make just a very simple point: In terms of educational levels, the adult population has not placed the United States at risk in any way.
!38
!
1!2!
4!5!
8!8!
13!25!
0! 5! 10! 15! 20! 25!Finland!
Italy!Canada!France!
Germany!United!Kingdom!
Japan!United!States!
Source:(OECD,(Top(of(the(Class,(2009(
Ind.%VI.4:%Share%of%Global%155year5old%Talent%in%Science,%2006%
!
Conclusions and Implications !
In too many cases, reports on international assessments encourage national leaders to consider education to be a “horse race” in which nations compete with each other around educational outcomes, whatever the initial goals and purposes of individual national systems. We believe several conclusions can be drawn from the analyses presented here, along with some significant implications for policymakers and the general public.
Conclusions Based on the indicators included in this study, it seems
clear that the United States has the most highly educated workforce among these nine nations. At the same time, American society reveals the greatest economic inequities among the advanced nations in this analysis, combined with the highest levels of social stress, and the lowest levels of support for young families. Elementary school performance seems to be strong and middle school performance can undoubtedly be improved. No end-of-school data exists from any assessment that permits us to compare U.S. 12th-graders with end-of-school students elsewhere.
Historically, the U.S. system has performed well, as revealed by indicators of the number of years of schooling completed, the proportion of the adult population with high school diplomas and bachelor’s degrees, and the U.S. share of high-performing students in science. Indications that college-degree granting rates are declining relative to other nations among young Americans, are somewhat muddied by the complexity of the terminology used in collecting this data. It is conceivable also that a different standard might be necessary here: the United States remains the land of the second chance. Enrollment of students over the age of 25 in institutions of higher education rose 42 percent between 2000 and 2011, according to the U.S. Department of Education. Educational life in the United
States does not end at the age of 15 or even 25. It is not unusual at commencement ceremonies to find adults aged 30, 40, 50, 60, and even 70 smiling as they pick up their undergraduate, graduate, and professional degrees.
This is not to imply that all is well in American schools or that change is unnecessary in a fast-changing and confusing world. School leaders can certainly improve quality. They should worry about waste and inefficiencies in the system. And we have the enormous challenge of the achievement gap to deal with. But if that challenge is to be fully met, as this analysis suggests, the larger society needs also to put its shoulder to the wheel. Many of the students showing up at our doors are dealing with significant stresses and traumas in their lives. The success of the larger education mission depends on society finding ways to ameliorate the situations in which these young people and their families find themselves. Educators stand ready to help, but they cannot solve these problems or address these challenges alone.
Implications The Horace Mann League and the National
Superintendents Roundtable believe several implications follow from this analysis:
Research. Several issues surfaced during this research that deserve additional research: With which nations is it appropriate to compare the United States? Is it appropriate to compare cities, provinces, or states with entire nations? Can a more comprehensive set of outcome measures be developed to adequately assess system performance at the elementary, middle, and high school levels?
ILSA Administration. This analysis suggests several recommendations for ILSA administrators such as the Organization for Economic Collaboration and Development (OECD) and the International Association for the Evaluation of Educational Achievement (IEA):
!39

Acknowledge that the founders of your discipline rejected horse-race comparisons. Report outcome indicators in context, not as a competition. And convene an international panel of independent experts to promote transparency in the development of ILSA assessments and to examine the science and validity of ILSAs.
Public Policy. The report also supports several recommendations to policymakers in the United States and elsewhere. Minimize alarmist rhetoric around schools. Despite warnings, no country in the West collapsed when the Soviet Union won the initial race into space in 1957. Nor did the rest of the G-7 founder amidst alarms about Japan’s “rising sun” in the 1970s. On the contrary, the Soviet Union disintegrated and Japan entered the economic doldrums for 30 years. Second, we ask American politicians to leave science to the scientists. Withholding funds for research on the social, behavioral, and economic sciences does not advance the well-being of the American people. Third, renew the federal government’s historic interest in school-finance equalization in the United States.
A Final Word In many ways, American policymakers and the
American people need to ask themselves some difficult questions. How do we reconcile being, on average, the wealthiest nation on earth while demonstrating remarkably high levels of infant mortality, children living in poverty, and families living without support amidst great social stress? How do we reconcile being so wealthy while having the lowest-levels of support for the non-educational needs of children and their families? And how can we, as adults who have reaped such enormous benefits from American schools, live with the disappointing results we see from PISA results for today’s students at the age of 15?
The levels of economic inequity, childhood poverty, and violence in American communities outlined in this document will probably shock the American people. These are direct and immediate assaults on the quality of life of children and adults, indeed on life itself. They are not simply potential threats that might undermine the American economy at some point in the future. These
indicators suggest a policy response unrelated to schools is essential. And the Horace Mann League and the National Superintendents Roundtable are confident that well developed responses will have a profound impact on schools and on this nation’s future.
Too often, as the president of the Horace Mann League argued recently, we narrow our focus to a few things that are easily tested. We become captives of the results and our goal becomes raising test scores rather than raising fully educated people. To avoid that mentality, we want to emphasize the power of a consistent and comprehensive framework that looks at all the measures involved in shaping our future citizens and the future of our nation.
In that effort, the United States has its task cut out for it. Our communities and our leaders need help understanding the limitations of our schools and the challenges facing children and families, both in and out of school. We have to close the achievement gaps that are too apparent among our students. We have to improve on-time graduation rates. We need to make sure that young men and young women are progressing equally within our schools. We should work for greater funding equity in the system. We must to do what is necessary to provide a first-rate teacher in every classroom. And we have to draw attention to the social challenges battering our students.
Nobody understands the challenges and shortcomings of American schools better than the people who have dedicated their lives to teaching young people. Our work as educators lies in helping students achieve their full potential. Our work as educational leaders lies in making sure that the system of public education in the United States meets its full potential. We understand that learning doesn’t have a finish line . . . that education is always a work in progress.
But the view of the Horace Mann League and the National Superintendents Roundtable is unshakable. We believe American schools are among this nation’s greatest strengths and most powerful forces for good.
!40

Every hour of every day, the work of educators touches the future.
And because it does, this nation can be confident that just as the United States has always succeeded before, so it will again.
***************
!41

!
!42

!
Appendix A: Acknowledgments !
The Horace Mann League and the National Superintendents Roundtable want to acknowledge the assistance of several people and organizations without whom this work would not have been possible. Our first acknowledgment goes to the Horace Mann League board itself, which conceived of this work several years ago as part of its strategic planning process. We want also to thank board member James Harvey, of the National Superintendents Roundtable, for playing a leadership role in developing this report, with the assistance of board members Gary Marx, Charles Fowler, and Jack McKay (president, president-elect, and executive director, respectively, of the Horace Mann League). At various points in the development of this analysis, three former HML presidents also contributed their thinking to our analysis: Joe Hairston, at the time superintendent of Baltimore County Schools; Steve Rasmussen, at the time superintendent of Issaquah Schools in Washington, and Julie Underwood, dean of the University of Wisconsin School of Education.!
In the course of this investigation, Harvey turned this analysis into a doctoral dissertation at Seattle University. His dissertation committee, made up of John Chattin-McNichols, John G. Gardiner, the late Michael Silver of the Seattle University faculty, and Gary Plano, superintendent in Mercer Island, Washington, provided invaluable guidance on the structure of the investigation. An expert advisory committee made up of Nelda Cambron-McCabe (Professor of Educational Leadership, Miami University, Ohio), Kam Wing Chan (Professor of Geography, University of Washington), Iris Rotberg (Research Professor of Education Policy, George Washington University), and Pasi Sahlberg (author of Finnish Lessons and visiting professor of practice at Harvard University’s Graduate School of Education) provided advice and commentary on the selection of indicators.!
During the development of this analysis, progress reports on the work were made regularly to the Horace Mann League board and the National Superintendents Roundtable, as well as to audiences at annual meetings of ASCD and the American Association of School Administrators. During these presentations, we solicited and received concrete examples of how this research would be useful to educators in their daily lives and suggestions about questions the research raised. These comments and suggestions were unfailingly helpful.!
We want to acknowledge the helpful guidance we received from Richard D. Bagin, Executive Director of the National School Public Relations Association. Richard’s experience provided us with excellent insights into how to reduce the mass of material we had gathered into digestible data that policymakers, the public, and educators could absorb and work with. Richard’s wife Carolyn took this document and turned it into a graphically arresting and highly readable summary for the general public.!
We greatly appreciate all of these contributions. The advice and suggestions we received in the course of this work were invaluable; naturally, any mistakes in this document are our own.!
!
!43

!
!44

!
Appendix B: Methods !
!Methods and Procedures
Step 1. Identify nations of interest. Prior education indicator efforts have considered up to 148 nations. In developing this exploratory study, the Horace Mann League and the Roundtable decided early to focus on G-7 nations for reasons of both parsimony and because they tend to be large, Western democratic nations (Japan is also a member of the G-7). China and Finland were added to the G-7 due to widespread interest in their educational progress.
Step 2. Select appropriate data sources. The authors evaluated nearly 40 potential data bases for consideration. These were reduced to less than 20 reports and data bases based on the following decision rules: The report or data base had to (a) have been issued within the last five years; (b) provide data on at least seven of the nine nations of interest.
Step 3. Identify relevant dimensions. Working with an advisory committee of experts, the authors identified six significant dimensions for further exploration. Step 4. Identify relevant indicators. Guided by the advisory panel, the authors identified, within each dimension, four specific indicators that would serve as “index fingers” — data pointing to issues within schools and society, without necessarily explaining them or identifying potential solutions.
Step 5. Score each country by each indicator. The nation with the most attractive results, by indicator, received 10 points, with one point subtracted sequentially for each of the remaining nation until the nation with the least attractive outcome received just two points.
Step 6. Rank each nation by individual indicator. With scores in hand, rank each nation sequentially. Step 7. Combine the indicators by dimension into a broad index. Indicators by dimension were combined
into the graphic shown in the chapter entitled “A Summary Table.”
!45

!
!46

!
Appendix C: Data Sources !
!Background+Information++(Population):+WorldBank!on!line!(accessed!8.1.2014)!http://data.worldbank.org/indicator/SP.POP.TOTL!!Background+Information++(GDP+Per+Nation)+WorldBank!on!line!(accessed!8.1.2014)!http://data.worldbank.org/indicator/NY.GDP.MKTP.CD!!Background+Information+(GDP+per+capita):+WorldBank!on!line!(accessed!8.1.2014)!http://data.worldbank.org/indicator/NY.GDP.PCAP.CD!!Indicator+I.1+(Income+inequality)+WorldBank!on!line!(accessed!11.3.2014)!http://data.worldbank.org/indicator/SI.POV.GINI!!Indicator+I.2+(%+of+lowBincome+children)!UNICEF Innocenti Research Centre (2012). Measuring Child Poverty: New League Tables of Child Poverty in the World's Rich Countries. Innocenti Report Card 10. UNICEF Innocenti Research Centre, Florence, Italy. (Figure 1b)!Estimate for China drawn from World Bank, which estimates that 11.5% of Chinese population lives on $1.25 or less per day and that 902.5 million people in China (66% of population) lives on $5 or less per day. At: http://tinyurl.com/kbv28dl!Accessed August 2, 2014!!Indicator 1.3 (Infant Mortality) From World Bank on line: (Accessed 11.3.2014) http://data.worldbank.org/indicator/SP.DYN.IMRT.IN+!Indicator I.4 (Intergenerational Mobility) Corak, Miles (2013). Inequality from generation to Generation: The United States in Comparison.” In Robert Rycroft (ed.). The Economics of Inequality, Poverty, and Discrimination in the 21st Century. ABC- CLIO. Available at http://tinyurl.com/cpsa94v !Indicator II.1 (Violent death) Source: "WHO: Mortality and Burden of Disease Estimates for Who Member Countries, 2008" Accessed 8.4.14 at http://tinyurl.com/ll8fnrn !Indicator II.2 (Death from drugs) Source: "WHO: Mortality and Burden of Disease Estimates for Who Member Countries, 2008" Accessed 8.4.14 at http://tinyurl.com/ll8fnrn !Indicator II.3 (Immigration) From OECD (2014) Society at a Glance, Fig. 3.5, p. 91 Data for Fig. 3.5 at: http://dx.doi.org/10.1787/888932966314 !
!47

Indicator II.4 (Adolescent births) From UN Millennium Development Goals IndicatorsAccessed 8.3.2014 at http://tinyurl.com/m5bu2os !Indicator III.1 Social benefits as % of GDP OECD. (2014). Society at a Glance, 2014: OECD Table 5.7. Data accessed 9.30.2014 at http://tinyurl.com/lahmz5t !Indicator III.2 Benefits for Young Families From: OECD, 2011, "Doing Better for Families," Figure 1.11, p. 42, at: http://www.oecd.org/els/soc/47701118.pdf Data for Figure 1.11 at: http://dx.doi.org/10.1787/888932392647 !Indicator III.3 Proportion of 3-6 year olds in preschools The Economist (2012). Starting Well: Benchmarking Early Education Across the World (p. 17). !Indicator III.4 Rates of child abuse and death OECD (2014), OECD Family Database, OECD, Paris (www.oecd.org/social/family/database) Table SF3.4: Family Violence. Accessed 8.4.2014 at http://tinyurl.com/q9fl4vx !Indicator IV.1 EPP, Elementary & Secondary From: United States Department of Education (2014): Digest of Education Statistics. Table 476, p. 692. !Indicator IV.2 EPP as % of GDP From: United States Department of Education (2014): Digest of Education Statistics. Table 477, p. 694. !Indicator IV.3 Average class size, lower secondary OECD (2013), Education at a Glance 2013. D2 Chart D2.2. Accessed 8.6.2014 at: http://dx.doi.org/10.1787/888932851687 Canada from US Department of Education at: http://nces.ed.gov/surveys/talis/talis2013/talis2013results_2.asp !Indicator IV.4 Workload of Teachers Source: OECD (2014). Education at a Glance. (p. 298). !Indicator V.1 4th-Grade reading PIRLS 2011 International Results in Reading (2012). Mullis, I.V.S., Martin, M.O., Foy, P., & Drucker, K.T. (2012). Chestnut Hill, MA: TIMSS & PIRLS International Study Center, Boston College. Table 3, p. 8. !Indicator V.2 15-year-old reading OECD (2013). PISA 2012 Results: What students know and can do: Student performance in mathematics, reading, and science, Vol. 1. Table 1.4.1, p. 177 !Indicator V.3 Secondary school graduation rate OECD (2013). Education at a Glance 2013: OECD Indicators. Table A2.1a, p. 50 and OECD (2012). Education at a Glance 2012: OECD Indicators. Table A2.5, p. 57. !Indicator V.4 Gap in achievement OECD (2010), PISA 2009 Results: Overcoming Social Background, Annex B1, p. 152. !Indicator VI.1 Years of schooling completed Barro & Lee (2014, June). Education Attainment for Population Aged 25 and Over. Accessed 8.8.2014 at http://www.barrolee.com !Indicator VI.2 Adults with high school diploma OECD (2013). Education at a glance: OECD Indicators.Table A1.2a. p. 36. !Indicator VI.3 Adults with bachelor’s degree OECD (2013). Education at a glance 2013: OECD Indicators. Table A1.1a, p. 35 !!
!48

!Indicator VI.4 Global share of high school science talent OECD (2009). Top of the Class: High performers in Science in PISA 2006. Fig. 1.2, p. 21 Downloaded 8.9.14 at http://tinyurl.com/auehto
!49

!
!50

!
End Notes !
!51
See, for example, Iris Rotberg, (2014). “Tenuous Findings, Tenuous Policies.” Teachers College Record, May 19, 2014; 1
and Michael J. Feuer, (2012). No Country Left Behind: Rhetoric and Reality of International Large Scale Assessment. (Annual Angoff Memorial Lecture Series.) Princeton, NJ: ETS.
Gary Marx, “Future Focused Leadership,” School Administrator, November, 2014, pp. 18-222
For example, see: Anthony.S.Bryk and K.L. Hermanson, “Educational Indicator Systems: Observations on their 3
Structure, Interpretation, and Use,” Review of Research in Education, 1993; J.S. Coleman, Equality of Educational Opportunity. Washington: U.S.Department of Health, Education and Welfare, 1966; and Helen Ladd, Education and Poverty: Confronting the Evidence. Durham, NC: Duke University, 2012.
See: Chan, K. W. (2011). “Despite Recent Test Scores, China is Not ‘eating our lunch.’“ Seattle Times, January 2, 2011; 4
Loveless, T. (2013). “PISA’s China Problem,” The Brown Center Chalkboards, The Brooking Institution. October 9, 2013; Loveless, T. (2014). ‘PISA’s China Problem Continues: A Response to Schleicher, Zhang, and Tucker,” The Brown Center Chalkboards, October 9, 2013; Lan, P. C. (2014). “Segmented Incorporation: The Second Generation of Rural Migrants in Shanghai,” China Quarterly, 216 (March), pp. 1-23. and Gerald Kohn and James Harvey, “Acting Decisively; China’s Story,” The School Administrator, September, 2009.
Andrew Browne, “China’s Left-Behind Children Bear Grown-Up Burdens,” Wall Street Journal, January 17, 2014.5
Pasi Sahlberg, “Presentation to visiting delegation of school superintendents from National Superintendents 6
Roundtable,” Helsinki, Finland, June 21, 2012.
Innocenti Research Center, Child Poverty in Perspective: An Overview of Child Well-Being in Rich Countries. 7
Florence, Italy: UNICEF, 2007.
Innocenti Research Center, op. cit.8
Ideally an income elasticity indicator would cover both fathers and mothers and sons and daughters. Unfortunately, the 9
only indicator available relates the son’s income to the father’s, perhaps a reflection of the reality that fewer mothers were working out of the home a generation ago in most countries.
National Child Traumatic Stress Network, “Defining Trauma and Child Traumatic Stress.” Downloaded 9.16.2014 at 10
http://www.nctsnet.org/content/defining-trauma-and-child-traumatic-stress
J.D. Osofsky, “The Impact of Violence on Children.” The Future of Children, (Vol.9:3). 199911
National Scientific Council on the Developing Child. (2012). Establishing a Level Foundation for Life: Mental Health 12
Begins in Early Childhood. (Working Paper 6. Center for the Developing Child.)
World Health Organization. (2002.) World Health Report on Violence and Death. Geneva: WHO, 2002.13
Sources: Eurostat (2012), United States Statistical Division (2010) and national statistical offices. Reported in OECD 14
Family Data Base, 2014 at: http://www.oecd.org/social/soc/oecdfamilydatabase.htm
Social expenditures included here are public support for pensions, health care, and income support for the working-age 15
population. They do not include private expenditures (e.g., employee health-care plans). See OECD: Education at a Glance, p. 116.
Social expenditures on young families includes cash, in-kind benefits such as food stamps, tax benefits for social 16
purposes such as the earned income tax credit, child care support, and parental leave. Support for health care needs and housing support is not included. See: OECD, Doing Better for Families (2011), p. 42.

Woolf, S. H., & Aron, L. (Eds.). (2013). U.S. Health in International Perspective: Shorter Lives, Poorer Health. 17
Washington: National Academy of Sciences.
B. Hart and T.R Risley, Meaningful Differences in the Everyday Experience of Young American Children. Baltimore: 18
Paul H. Brookes Publishing, 1995.
L.J. Schweinhart, J. Montie, Z. Xiang, W.S. Barnett, C.R.Belfield, and M. Nores. Lifetime Effects: The High/Scope 19
Perry Preschool Study through Age 40. Ypsilanti, Michigan: High/Scope Foundation, 2005.
Public schools in the sense of the term used in the United States, not the sense used in the United Kingdom.20
OECD, Education at a Glance, 2014. Chart D4.1, page 474. Data used to create chart downloaded at: http://21
dx.doi.org/10.1787/888933120062
Peter Dolton and Oscar Marcenaro-Gutierrez. Global Teacher Status Index. London Varkey Gems Foundation Study, 22
October 2013.
There are three principle sources of international data on student achievement: The PIRLS reading assessment in 23
fourth grade; TIMSS assessment results in mathematics and science in the equivalent of fourth and eighth grade; and PISA results in reading, mathematics, and science among 15-year-olds (typically in the equivalent of ninth or tenth grade in the United States). The interest in this research was in finding a common area of study that encompassed both primary and secondary education and covered all or most of the nine nations of interest. Reading is the only area of assessment in which results are available for most of the nine nations.
See: Chan, K. W. (2011). “Despite Recent Test Scores, China is Not ‘eating our lunch.’“ Seattle Times, January 2, 24
2011; Loveless, T. (2013). “PISA’s China Problem,” The Brown Center Chalkboards, The Brooking Institution. October 9, 2013; Loveless, T. (2014). ‘PISA’s China Problem Continues: A Response to Schleicher, Zhang, and Tucker,” The Brown Center Chalkboards, October 9, 2013; Lan, P. C. (2014). “Segmented Incorporation: The Second Generation of Rural Migrants in Shanghai,” China Quarterly, 216 (March), pp. 1-23.
PISA assesses 15-year-old students, defined as students who are between the ages of 15 years and 3 months and 16 25
years and 2 months at the beginning of the testing period. But as a 2012 commentary on PISA noted, curriculum and instruction are typically organized by grade level in most nations, not by age. As a result, grades in which students are assessed, within countries and around the world, range from Grade 7 to Grade 12. See: Presentation by Hans Wagemaker, Executive Director, International Association for the Evaluation of Educational Achievement (IEA) at a conference on Validity Issues in International Large-Scale Assessments, March 28-29, 2012. At: http://tinyurl.com/lzk3vbz
Gao, H. (2014). China’s education gap. New York Times. September 4, 2014; and Kohn, G. and Harvey, J. (2009). 26
Acting decisively: China’s story. The School Administrator, 66(3), 47-52; and Lan, P.C. (2014). Segmented incorporation: The second generation of rural migrants in Shanghai. China Quarterly, 216 (March), 1-23.
Clifford Adelman, The Spaces between Numbers: Getting International Data on Higher Education Straight. 27
Washington: Institute for Higher Education Policy, November, 2009; and Clifford Adelman, “Turning around International Comparative Indicators,” New England Journal of Higher Education, July 2010.
Organization for Economic Collaboration and Development, Top of the Class: High Performers in Science in PISA, 28
2006. Paris: OECD, 2009.
OECD administers PISA every three years. It is a two-hour pencil-and-paper test and each administration emphasizes 29
one of three subject areas: reading, mathematics, or science. About 50% of testing time is devoted to the primary subject area, with the remainder divided between the other two subjects. Science was the main subject area in 2006; it will be the main subject area again in 2015.
Martin Carnoy and Richard Rothstein, What Do International Tests Really Show about U.S.Student Performance? 30
Washington: Economic Policy Institute, January 2013.
!52

!

!
Kudos for School Performance in Context� !!“This%report%does%what%has%been%missing%in%interna2onal%assessments%like%PISA%and%
TIMSS%.%.%.%%It%provides%a%broader%context%to%understand%how%educa2on%systems%perform%.%.%.%%
simply%an%eyeAopening%reading%experience!”%
" —"Pasi"Sahlberg,"Harvard"University"
" """""Author"of"Finnish%Lessons%
“This%is%a%significant%piece%of%work.%I%think%it%has%real%poten2al%for%furthering%the%conversa2on%
about%where%we%really%are%in%educa2on%in%the%United%States.”%
" —"Karen"Woodward"
" """""Superintendent,"Lexington"Schools,"South"Carolina" "
“Globaliza2on%means%we%have%to%be%interna2onally%engaged,%economically%and%culturally.%
FutureAfocused%leaders%will%benefit%greatly%from%immersing%themselves%in%the%realis2c%
interna2onal%comparisons%contained%in%this%report.”%%
" —"Joe"A."Hairston"
" """""CoEDirector"AASAEHoward"University"Urban"Superintendents"Academy"
“The%informa2on%in%this%report%is%far%more%informa2ve%than%test%scores%alone.%We%can%learn%
much%from%School"Performance"in"Context%about%meaningful%ways%to%help%all%children%
succeed%in%school.”%
" —"Diane"Ravitch,"New"York"University"
" """""Author,"Reign%of%Error%
“The%most%striking%thing%from%the%data—and%something%that%all%policy%makers%should%be%
concerned%about—is%that%here%we%sit%as%the%wealthiest%na2on%in%the%world%and%we%have%the%
highest%percentage%of%children%in%our%schools%living%in%poverty.”%
" —"Charles"Fowler,"President,"Lead"Schools"
!“A%fascina2ng%report%that%highlights%the%importance%of%context%and%the%.%.%.%oPen%deeply%
misleading%nature%of%test%scores%taken%in%isola2on.%Even%readers%who%think%they%know%about%
context%will%learn%many%new%and%surprising%things.”%
" —"Alison"Wolf,"Sir"Roy"Griffiths"Professor,"King’s"College,"London"
" """""EducaQon"Advisor,"Government"of"Prime"Minister"David"Cameron