indicators and stages of investment in plant and equipment
TRANSCRIPT

This PDF is a selection from an out-of-print volume from the National Bureauof Economic Research
Volume Title: Orders, Production, and Investment: A Cyclical and StructuralAnalysis
Volume Author/Editor: Victor Zarnowitz
Volume Publisher: NBER
Volume ISBN: 0-870-14215-1
Volume URL: http://www.nber.org/books/zarn73-1
Publication Date: 1973
Chapter Title: Indicators and Stages of Investment in Plant and Equipment
Chapter Author: Victor Zarnowitz
Chapter URL: http://www.nber.org/chapters/c3556
Chapter pages in book: (p. 409 - 463)

PART III
THE BEHAVIOR OF INVESTMENTCOMMITMENTS AND EXPENDITURES


9INDICATORS AND STAGES OFINVESTMENT IN PLANT AND
EQUIPMENT
Introduction: Some Important Aspects of theInvestment Process
The process of capital formation in durable producer goods Consistsof two sets of lagged reactions: (1) Investment decisions respond, pre-sumably with varying delays, to changes in a number of determiningfactors. (2) The implementation of these decisions requires time, henceexpenditures lag appropriations, contracts, etc.
The lags in the implementation of investment decisions (2) are in asense more tangible than the lags in the formation of decisions (1), andprobably easier to establish. It is necessary to draw a clear distinctionbetween the two lagged relations, both of which are of major impor-tance in the analysis of the investment process and in theories of busi-ness cycles and the effects of stabilization policies.
Plant and equipment is a generic term denoting a vast variety of capi-tal goods needed to satisfy the demand for capital services. The invest-ment process is set in motion as this demand changes and the need toacquire the capital goods is recognized. The initial stages of technicaland economic planning and cost estimation may be long and important,but they apparently are not directly represented in the data availablefor measuring aspects of the investment process. In time, the decisionto invest becomes firmer, with respect to both the details of the projectand the time it is to be initiated; and funds to finance it are budgeted,appropriated, and contractually committed. These latter stages can be

412 The Behavior of Investment Commitments and Expenditures
measured by the current aggregative series on capital appropriationsand investment orders and contracts.
It is at this point that orders data may find their first application toinvestment analysis. As the orders for equipment and contracts forplant are filled, payments are made on their account. Meanwhile, thecapital goods, which are to be the end product of the process, as faras their sellers are concerned, assume their material form and economicfunction. That is, they are produced, built, shipped, and installed—inshort, acquired in some way to render services to the user.
The demand for capital services is a function of the demand for theoutput which these services help to produce. The demand for outputsof manufacturing industries is measured by manufacturers' orders.This is the second point at which orders data appear as potentially use-ful for investment analysis. The two applications are certainly differentin concept and in their data requirements.
On the Role and Timing of Investment DecisionsThe view that investment expenditures play a central role in busi-
ness cycles is an old one, held by many economists. Its main sourcesare the following notions or observations: (1) that these expendituresare neither constrained nor required by prior receipts, and are notclosely related to the latter; (2) that they fluctuate during business cy-cles with wider relative amplitudes than other major expenditure cat-egories; (3) that they lag, often by long intervals, the decisions to in-vest; and (4) that the investment decisions themselves have a cyclicalpattern and a tendency to lead at peaks and troughs in aggregate eco-nomic activity.
Point (1) has been particularly emphasized in those Keynesian mod-els where investment is treated as an important category of "autono-mous" expenditures that set in motion the multiplier process; but it isalso found, mutatis mutandis, in some older theories in which muchweight is attached to investment. The other points concern empiricalobservations: (2) can be said to have long been well established; (3) isplausible enough and was often assumed, but the relevant measure-ments have until recently been few and quite crude—which is not sur-prising, as it is not easy to measure investment "decisions"; and (4) iseven more difficult to establish for the same reason, and is much morein need of being documented since it is far from obvious.
Indicators and Stages of Investment in Plant and Equipment 413
A cyclical model of the economy can be constructed on the basis of(1), (3), and (4); (2) is neither a necessary nor a sufficient conditionhere. However, positing (1), interpreted to mean that investment is in-dependent of income, cannot be simply taken for granted. It is a hy-pothesis which, far from being established empirically, is widely viewedas dubious and unsatisfactory. The situation for (3) and (4) is very dif-ferent: There is already much evidence to validate and quantify thesestatements, owing largely to recent gains in assembling data that reflectinvestment decisions, such as orders and appropriations.
The existence of (4) is particularly important because it appears tobe a necessary condition for the validity of any hypothesis that ascribesto investment the prime causal role in business cycles. It is difficult tosee how any hypothesis in this class could be successfully defended ifthe decisions to invest and the resulting commitments did not tend tomove ahead of aggregate production and income. Expenditures on plantand equipment actually lag at business cycle turns, which was deemedby some to be the major argument against the investment hypothesisof the cycle. But this is not convincing, since it ignores the possibilitythat investment commitments may lead and have important influencesof their own.
In fact, the early cyclical timing of commitments can be well doc-umented, as will be shown in this chapter. But it must be recognizedthat acceptance of both (3) and (4) is still nor sufficient for a demon-stration that investment is indeed the prime mover in major fluctuationsof the economy. As elsewhere, one must guard here against the posthoc, ergo propter hoc fallacy. Even if the amounts of investment de-cided upon begin to swell and shrink ahead of the troughs and peaksof the economy at large, this does not necessarily mean that these earlychanges in investment commitments are "the cause" and the laterchanges in general business activity "the effect." Investment decisionsare necessarily the antecedent and can be treated as the proximate"cause" of investment spending [as stated in (3)]. There are also fur-ther propagation effects to the extent that increases in this spendingstimulate and decreases discourage other types of expenditure. Butit is conceivable that other factors, more "autonomous" than invest-ment, determine first the investment decisions and then spending.t
'Cf. Milton Friedman and Anna J. Schwartz, and Business Cycles," of Eco-iioinics and Siatisilcs. Supplement, February 1963, p. 48, n. 21.

414 The Behavior of Investment Commitments and Expenditures
Issues Relating to the Cyclical Behavior of InvestmentThe lag of investment expenditures behind investment decisions is
an essential element in several otherwise quite different theories ofbusiness cycles. Consider the hypothesis that downturns of investmentare attributable to the stresses of advanced expansion in aggregate in-come and output. It could be used to explain why investment decisions(or commitments) begin to decline. But investment expenditures canhardly be assumed to decline simultaneously in a degree sufficient tobring about a general business downturn, for this would at once cutoff the rise in income, whereas income must be permitted to rise if thechanges that are unfavorable to investment are to develop. Introduc-tion of an expenditure lag removes this logical difficulty by remindingus that investment undertakings can already be declining while invest-ment expenditures and income are still rising. The undertakings deter-mine future spending on investment, but current income is associatedwith current spending. Thus it can be argued that the lag in the execu-tion of investment projects (contracts or orders) plays a critical rolein explaining business cycle reversals in theories that link investmentdecisions to elements of current and recent incomes and their distri-bution.
An argument along the above lines was made by Milton Friedmanin his interpretation of Wesley Mitchell's view of the investment pro-cess and its role in business cycles.2 To recall its salient points, Mit-chell's analysis (first developed in his 1913 Business Cycles) relatesinvestment decisions to profits expectations and the latter to currentprofits and their distribution. As a business expansion unfolds, aggre-gate income rises and so do both the volume of sales and average profitmargins; hence, total profits must increase. Later in the expansion,however, profit margins begin to decline because of rising cost sched-ules and the tendency for many buying prices to increase faster thanselling prices. When the decline in margins eventually outweighs thecontinuing increase in sales, total profits turn down. These develop-ments influence strongly the timing of decisions to implement invest-ment projects. New investment commitments begin to decline, whichis an early factor of great importance in the process leading to the gen-
2 Milton Friedman, "Wesley C. Mitchell as an Economic Theorist ,"Journal of Political Economy,December 1950; reprinted in Arthur F. Burns, ed., Wesley Clair Mitchell, The Economic Scientist,New York, NBER, 1952; see in particular pp. 263—66.

Indicators and Stages of Investment in Plant and Equipment 415
era! business downturn. Investment expenditures, on the other hand,lag in this process, reflecting the long periods of time that are requiredfor completion of many undertakings to build and equip productiveplant.
An early appearance of the distinction between orders and deliveriesof capital goods marks a business cycle model by Kalecki (1933). Inthis system, deliveries lag behind orders for capital goods by a given"gestation period," 0. Gross saving or "accumulation" equals pro-duction of capital goods, which proceeds at a rate measured by theaverage volume of unfilled investment orders over the interval 0. Netinvestment, or the change in capital stock, equals capital goods de-liveries minus depreciation of capital equipment due to wear and tearand obsolescence. The ratio of new investment orders to capital stockis a function of the rate of profit, and real gross profit itself is relatedto gross accumulation. The model implies that new investment ordersare an increasing function of capital goods production and a decreasingfunction of the existing capital stock. It produces a cyclical movementby letting the capital stock itself fluctuate, that is, capital goods deliv-eries periodically fall short of replacement requirements.3
In models based on the interaction of savings and investment func-tions, fluctuations can come about by assumption either of certain time-
or both. In his 1940 model, NicholasKaldor employs nonlinear functions and deliberately abstracts fromlags.4
The familiar business cycle model of J. R. Hicks (1950) representsa theory which employs both lags and nonlinearities. For investmentin plant and equipment, Hicks suspends the accelerator over a part ofthe cycle (because of surplus capacity), making it operative only in thelater stages of expansion and at the beginning of the contraction. Dis-
3M. Kalecki, "A Macrodynamic Theory of Business Cycles," Econoinetrica, 1935, pp. 327—44(paper presented in 1933). This business cycle model underwent several changes in Kalecki's laterworks, but the feature of the orders-delivery lag for capital goods has been retained throughout thisdevelopment. Given the structural coefficients of these models, the length of that lag determines theduration of the implicit cycles and whether or not they are damped (in the absence of erratic shocks).
4N. Kaldor, "A Model of the Trade Cycle," Economic Journal, March 1940, pp. 78—92. Kaldorregards it as a virtue of his model that it does not depend on particular parameters, lags, or initial"shocks." But a theory of business cycles may also suffer from being overly self-contained (endog-enous) and too dependent on particular nonlinearities. The virtual disregard of lags can hardly bea merit if the theory is to retain contact with fluctuations in the real world, which surely include cer-tain lags as one of their foremost features. And it is not established at all that lags should be impor-tant only "in determining the period of the cycle" and have no part "in explaining its existence"(ibid., p. 92).

416 The Behavior of Investment Commitments and Expenditures
tributed lags are worked into the consumption function and are alsoincluded, somewhat cursorily, in the discussion of induced investment.The main effect of replacing a simple discrete lag by a longer lag, whichspreads the response of investment to changes in output over severalperiods, is to prolong the expansion (for any given combination of val-ues for the coefficients of the consumption and induced investmentfunctions).5
Whether simple or distributed, the lags are assumed to remain un-changed over the cycle, as are the coefficients of the system. Yet inthe case of the fixed investment function, one can expect the lags toincrease late in expansion, when, due to the strain on capacities ofcapital goods producers, more time is likely to be required, on the aver-age, for investment contracts to materialize in deliveries and installa-tions. Such a development would be accompanied in part by price in-creases and in part by unfilled orders accumulations, which may tem-porarily provide some further stimulation of investment demand. Itseems improbable that the latter would then be kept in check by thecurrent and recent increases in output or for that matter that it wouldbear any fixed relation to these increases.
The extension of the lag, however, may tend to prolong the expansion(in analogy to Hicks's comparison of simple and distributed lags). Theresulting increase in the orders backlog may also tend to make thedownturn more gradual and the early stages of contraction lessfor old unfilled contracts can provide a reserve of work to be carriedout long alter new investment has been curtailed.6 Gestation periodsfor various types of investment projects vary widely. Also, the peaksof orders for different categories of capital goods usually fall on datesthat are scattered over a substantial period rather than being heavilyconcentrated at one time. These facts make for a less sharp decline inaggregate investment orders and for a more gradual and lagged decline
5J. R. Hicks, A Contribution to the Theory of the Trade Cycle, Oxford, England, 1950, pp.113—15.
6 On the other hand, depletion of the backlog may worsen the economic situation in the midst ofa downswing. Expenditures on, and presumably also completions of, investment projects tend toreach their peaks when a business decline is already in progress. Burns draws attention to a sug-gestive fact when he notes that "it appears that the crop of newly completed factories reaches itsmaximum when contraction is well under way—or just in time to intensify the competitive strugglethen in progress." Cf. Arthur F. "Economic Research and the Keynesian Thinking of OurTimes," Twenty-Sixth Annual Report of the National Bureau of Economic Research, New York,June 1946; reprinted in Burns, The Frontiers of Economic Knowledge, New York, NBER, 1954;see p. 23.

C,
Indicators and Stages of Investment in Plant and Equipment 417
in investment expenditure than could be hypothesized in disregard ofthem. They create a presumption against the concept of abrupt down-turns in general economic activity being caused by a recurring collapseof confidence in the profitability of investment undertakings and a con-sequent collapse of "aggregate investment" as such.7
It is indeed likely that the demand for new plant and equipment willweaken and eventually fall off when capacity increases begin to over-take output increases, or when most firms come to hold the expecta-tion that this is imminent. But the concepts involved are extremely dif-ficult to handle. Short-term changes in the demand for its productscurrently appear to a firm as erratic in a large degree. It is not easy todistinguish with sufficient confidence a change that is just transitoryfrom one that is more lasting and less risky to use for extrapolation.Measurement of existing capacities is difficult, and estimation of re-quired capacities even more so. The analyst also faces formidable prob-lems of aggregation.
As shown by this brief and selective survey, important issues in busi-ness cycle analysis relate to the internal lag structure and the cyclicaltiming of investment stages. These matters require much further studybefore the lagged relations involved can be adequately specified, es-timated, and tested. This chapter and the next will report merely ona few small steps in this direction.
Investment Plans, Commitments, and Outlays
New Orders for Producer Equipment and ConstructionContracts for Plant
The aggregate of new orders received by durable goods manufac-turers contains not only some that correspond to the "equipment"component of business fixed investment outlays, but also a large va-riety of other kinds. These include orders placed by domestic inter-mediate (nonfinal) users for resale purposes, those placed by foreign-ers, and those placed by the government.8
This idea, found in many recent writings, goes back to Keynes and his, certainly understandable,preoccupation with the rapid business contraction of the early 1930's. Cf. Burns, Frontiers, pp.18—19.
8 All orders for consumer durable goods must, of course, be excluded in deriving the business in-vestment order series. But these would typically be "resale" orders, received from the trade sectors,as consumers do not ordinarily place direct orders with manufacturers.

418 The Behavior of Investment Commitments and Expenditures
The breakdown by major industries used in the published Commercefigures on new orders permits only a very crude approximation to whatis needed here: a series on commitments for the purchase of equipmentby business enterprise. However, much better estimates of new ordersfor industrial and other productive equipment were made available in1961 by the Department of Commerce on the basis of a more detailedclassification of their orders data.9
The series of new orders for machinery and equipment in its presentform includes new orders received by the following thirteen durablegoods industries: steam engines and turbines; internal combustion en-gines; construction, mining, and materials-handling machinery; metal-working machinery; miscellaneous equipment; special industrialmachinery; general industrial machinery; office and store machines;service industry machinery; electrical transmission, distribution equip-ment; electrical industrial apparatus; other electrical machinery; andshipbuilding and railroad equipment. Orders for other industries donot, for the most part, represent business purchases of equipment. Theexclusion of these industries, however, does mean omitting such im-portant items as trucks and commercial aircraft.1° On the other hand,inclusion of all orders received by the machinery and equipment in-dustries results in overstatement, since some of these orders are placedby government and foreign buyers.
The information needed to correct for these elements of under- andoverestimation is essentially lacking because the statistics are reportedby the receiving industry rather than by product and user categories.Also, like the output of multiproduct companies that are included inan industry according to the definition of their main productive activity,orders received by an industry are highly diversified. However, a sig-nificant improvement in the latter respect has probably resulted from
° These estimates were introduced in Victor Zarnowitz, "The Timing of Manufacturers' OrdersDuring Business Cycles," in Geoffrey H. Moore, ed., Business Cycle Indicators, Princeton forNBER, 1961, Vol. 1, pp. 475 if. The data were published in ibid., Vol. II, series 6.1, p. 90. Sinceautumn 1961, the monthly figures have been reported regularly in U.S. Department of Commerce,Business Cycle Developments, as series 24, "Value of manufacturers' new orders, machinery andequipment industries." Since December 1963, this series has been published in revised form toreflect the 1963 revision of the Industry Survey data and to exclude fabricated metal products.
10 Most of the output of the motor vehicle industry consists of consumer durables (civilian pas-senger automobiles). Military purchases are also important here, but even more so in the nonauto-motive transportation equipment industry, particularly aircraft. This explains the decision to omitthese industries from the aggregate of private orders for capital equipment.

Indicators and Stages of Investment in Plant and Equipment 419
the 1963 revision that put the data on a divisional instead of companybasis (see the description of the current Census data at the beginningof Chapter 3, above).
Before 1963, the series of new orders for machinery and equipmentincluded fabricated metal products. The selection of this industry seemsto have been largely an error, since fabricated metals represent mainlymaterials to be further processed rather than capital goods bought byfirst users. However, since we have used the old data in the part of thesubsequent analysis that predated the 1963 changes in the orders se-ries, Chart 9-1 presents these data in two versions: with and withoutnew orders for fabricated metal products (see curves 2 and 3). The twoseries run a closely similar course, although their levels differ sub-stantially, since the fabricated metal orders add up to rather largemonthly amounts.
The "plant" component of business capital formation is not directlyrepresented in the new-order aggregate. The best counterpart to itamong the commitments data is the series of contracts awarded tobuilding contractors for industrial and commercial construction, pluscontracts for privately owned public works and public utilities, as com-piled by the F. W. Dodge Corporation. This series is plotted as curve4 in Chart
The aggregate of current commitments to invest in plant and equip-ment combines series 2 and 4. Since the data on construction contractsas well as those on new orders are in current-dollar values, the seriescan be combined by simple addition. In the resulting totals, the com-ponent categories are weighted by the transaction volumes they rep-resent. The estimated totals of equipment orders and plant contractsare shown as curve 1 in Chart 9-1.
The chart makes it clear that the construction contract values forma highly volatile series with large month-to-month variations, especiallyin the period before 1954. New orders are much less erratic and havea considerably clearer cyclical pattern. It is also evident that the total
"The Dodge data cover private projects of $10,000 minimum valuation (previously, lower val-uations were included). The data available for our purpose cover thirty-seven eastern and southernstates in 1948—56 and forty-eight states since then. They include contracts for commercial buildingssuch as banks, offices, stores, garages, etc., and for manufacturing buildings (e.g., processing, me-chanical). Adjustments for cancellations, additions, and corrections are made when ascertained. Formore detail, see the description and references in Moore, ed., Business Cycle indicators, Vol. II,series 6.0, pp. 12—14.

Cr
420 The Behavior of Investment Commitments and Expenditures
Chart 9-1Manufacturers' New Orders for Machinery and Equipment
and Contracts for Plant Construction, 1949—61Billion dollars8,0
6.0
5.0
4.0
3.0
2.0
1.0
.8
.6
.5
.4
.3
.2
Note: Shaded areas represent business contractions; unshaded artas, expansions.Dots identify peaks and troughs of specific cycles; circles identify minor turns and re-tardations.
Source: U.S. Department of Commerce, Office of Business Economics; F. W. DodgeCorporation.
a This series is the sum of series 2 and 4 in this chart.I) Includes new orders for fabricated metal products.c Includes contracts for privately owned public works and utilities.
investment orders-and-contracts series reflects the behavior of neworders much more than contracts, because orders are a large, and con-tracts a relatively small, component of the total.
In fact, the new-order data overstate investment in equipment andthe contracts data understate investment in plant greatly. For example,the value of new orders received by industries producing machinery

Indicators and Stages of Investment in Plant and Equipment 421
and equipment averaged $52 billion (annual rate) in 1956—5 8 if fabri-cated metal products are included, and $35 billion if they are excluded.In the same period the producer durable equipment component of grossnational product had an average annual value of $27 billion. There isno doubt that the new orders aggregates include products that shouldbe regarded as "materials" rather than "final" capital goods. Elimina-tion of fabricated metals appears to remedy much but not all of thisoverstatement. Material� can of course be counted repeatedly at suc-cessive production stages. The orders figures are gross, while the in-vestment expenditure data on the GNP basis are net, of such duplica-tions. (The latter are presumably "gross" only in the sense of cover-ing outlays for replacements as well as new net additions to the stockof real capital held by business.)
For the construction contracts component of our investment com-mitments series, the annual average value for 1956—58 was somewhatless than $7 billion. The corresponding figure for the value of industrialand commercial construction and other private nonfarm nonresidentialconstruction was somewhat more than $14 billion. In part, this largedifference in levels reflects conceptual divergencies, but it does indicatethe amount of undercoverage of construction projects in the contractsdata.12
An approximate correction for the overstatement of equipment or-ders (EO) and understatement of plant contracts (PC) in the simple ag-gregate of orders and contracts (OC) was made by constructing a re-weighted aggregate, OCr, according to the formula OC'= (1.6/4.9)(EO) + PC. Here new orders for producer equipment (excluding fab-ricated metal products) are given only about one-third of their formerweight relative to plant contracts. This is done because the averageratio for 1957—59 of producer durable equipment to nonresidentialstructures was approximately 1.6, according to the national incomeaccounts of the Department of Commerce, while the correspondingaverage ratio of equipment orders to plant contracts was about 4.9.
In Chart 9-2, the first curve shows OC and the second shows the re-12 Commercial and industrial building contracts accounted for about 78 per cent of the value of
this type of Construction completed in 1956—58; other private nonfarm nonresidential constructioncontracts (of which not all are included in our series) accounted for only 42 per cent of the value put-in-place. The proportion for both categories combined was approximately 59 per cent. (See Moore,ed., Business Cycle Indicajors, Vol. II, p. 14.) Before 1956, the coverage of the Dodge statistics wasconsiderably lower because eleven western states were excluded. It is estimated that constructionin these states amounted to 20 per cent or more of the national total in the period 1926—56.

422 The Behavior of Investment Commitments and Expenditures
Chart 9-2Commitments and Expenditures for Plant and Equipment,
Quarterly, 1953—65
Note: Shaded areas represent business cycle contractions; unshaded areas, expan-sions. Dots identify peaks and troughs of specific cycles; circles, minor turns and re-tardations.
Source: U.S. Department of Commerce; Securities and Exchange Commission; F. W.Dodge Corporation.
weighted series OCr, each in quarterly, seasonally adjusted form, for1953—65. These graphs are based on the most recent Census data onnew orders of the machinery and equipment industries and also thelatest Dodge data on commercial and industrial contracts. The relativemovements of the two series are on the whole quite similar; the effectsof the reweighting are thus fairly small. The short variations in OCTare often a little larger than those in OC (see the curves for 1953 and1962—64), which reflects the relatively large erratic movements in the

Indicators and Stages of Investment in Plant and Equipment 423
PC series, which is given greater weight in ocr than in 0G. The cy-clical turning points in the two series coincide, except for the peaksin 1959—60, where OC seems to have an earlier major turn; but evenhere the difference is marginal.13
Fixed-Investment Orders and ExpendituresThe investment orders-and-contracts series—both the simple (OC)
and the reweighted aggregates—can be used as indicators ofbusiness expenditures on plant and equipment. The investment com-mitments and expenditures data are compared in quarterly form inChart 9-2.
The capital outlay estimates denoted as I (curve 3) are compiled bythe Office of Business Economics, U.S. Department of Commerce(OBE), and the Securities and Exchange Commission (SEC). Theyare derived from reports by corporations registered with the SEC, byunincorporated and incorporated companies reporting to the ORE, andby a group of transportation firms under the jurisdiction of the Inter-state Commerce Commission. The total sample accounts for over 60per cent of aggregate new investment in plant and equipment, but cov-erage varies among the industries.14 These figures, then, reflect theactual quarterly costs that are charged to capital accounts. Ordinarily,depreciation accounts are maintained for such outlays. The data comefrom the reports of those who, having placed the investment ordersand contracts, incur the costs as measured by the expenditure. On theother hand, the value of investment commitments is estimated in largepart from the reports of firms in the machinery and equipment indus-tries, i.e., those who have received the orders.
The OBE-SEC business capital outlays series (I) is not as compre-hensive as the plant-and-equipment component of GNP (/9) (curve 4
in Chart 9-2). The OBE-SEC data exclude, while the GNP data in-clude, investment by professionals, nonprofit institutions, real estatefirms, and insurance companies; expenditures for petroleum and nat-ural gas well drilling; and capital outlays charged to current expense(e.g., hand tools). The average annual value of business expenditures
A double-peak configuration will be noted in each of the two series during this period. In OC,the 1959 peak is a little higher than the 1960 one, while the reverse applies to OC' (see Chart 9.2).
"It is high in railroad transportation, public utilities, and some manufacturing industries, and lowin real estate and parts of the financial sector. See description and references in Moore, ed., BusinessCycle indicators, Vol. II, series 22.0, pp. 54—55.

424 The Behavior of Investment Commitments and Expenditures
on plant and equipment in 1956—58 was $34 billion according to theOBE-SEC estimates, but $41 billion in the GNP accounts.15 Despitethese differences in coverage between I and 1", the relative movementsin the two series resemble each other closely most of the time (the onlysignificant divergence shown on the chart is in the second half of 1954).
The orders-contracts figures are more nearly comparable to I thanto F', and the OBE-SEC data will be used more intensively in the anal-ysis to follow than the GNP data. However, only the latter provide adivision of the expenditures into those for producer durable equipment(PDE) and those for plant or nonresidential structures (Str), whichmakes it possible to set up separate investment realization functionsfor the two types of capital goods. In the OBE-SEC data, outlays onequipment and construction are not available separately.
Chart 9-2 accords with general expectations of what the relationbetween investment commitments and expenditures shouLd be. Thetime-path of outlays on investment goods resembles the course of neworders and contracts for such goods, but the fluctuations in outlayslag behind those in orders and have smaller relative amplitudes. Two-quarter lags of expenditures are observed at the 1-1957 peaks and againat the 1-1958 troughs of commitments (regardless of whether ordersare represented by OC or by OCr and whether expenditures are meas-ured by I or by I"). Three-quarter lags of! are recorded at the 11-1954trough and at the 111-1959 peak of OC.16 However, the upturns of in-vestment orders and expenditures coincide in the second quarter of1961.
Chart 9-3 demonstrates a very similar relationship between the equip-ment components of fixed-investment commitments and outlays. In theperiod from 1-1953 to 11-1954, new orders for machinery and equip-ment (EO) declined strongly, while the PDE expenditures rose a littlein the first two quarters of this interval and decreased gently in thenext three. Then EO turned up sharply between 11-1954 and 1-1955,while PDE barely increased, describing a "flat-bottom" movement that
'5This is approximately the sum of $27 billion of producer durable equipment and $14 billion ofprivate nonresidential nonfarm construction. (Of course, this aggregate, like that for business cap-ital outlays compiled by the OBE-SEC, excludes expenditures by farmers and on all residentialhousing.)
"The 1954 trough in in the second quarter, just like the troughs in OC and but ac-tually I" did not start rising significantly until after 1-1955, i.e., three quarters later (see the text be-low about the underlying behavior of expenditures on producer durable equipment). The use of thelate peak of OCr in 1960 could also lead to a misleading timing comparison (see note 13, above).

Indicators and Stages of Investment in Plant and Equipment 425
Chart 9-3Commitments and Expenditures for Producers' Durable Equipment
and for Structures, Quarterly, 1953—65
Note: Shaded areas represent business cycle contractions; unshaded areas, expan-sions. Dots identify peaks and troughs of specific cycles; circles, minor turns and re-tardations.
Source: U.S. Department of Commerce; F. W. Dodge Corporation.
only in 1955 ended in a decisive upswing. Thus, although the troughsor lowest standings of the two series technically coincide in 11-1954,the actual recovery of PDE lagged behind the upturn in EQ by threequarters. At the peaks of 1956—57 and 1959—60, two lags of PDE rel-ative to EQ of three quarters each are clearly seen on the chart. The1958 troughs are separated by a two-quarter lag. Again, only the II-1961 troughs appear to be really coincident.
Contracts for commercial and industrial plant construction (PC) andoutlays for the nonresidential structures component of fixed invest-
'62 '63 '64

426 The Behavior of Investment Commitments and Expenditures
ment (Str) differ much more. PC shows large erratic variations, butStr follows a generally quite smooth course (Chart 9-3). The erraticappearance of PC is no doubt in considerable measure due to the lim-ited sample coverage of this series, but a marked differentiation of thissort between commitments and realizations would be expected in this.area and is believed to represent a real and basic phenomenon. Struc-tures presumably require substantially longer gestation or "delivery"periods than does equipment; hence there is more room here for sta-bilization of the flow of funds spent relative to the flow of funds com-mitted — which reflects the stabilization of production relative to de-mand.
As a result, the two series for investment in plant show particularlysharp contrasts on several occasions. Thus in 1954 PC first declinedsteeply and then rose substantially, while Str merely flattened off. In1960—61, Str responded similarly, with a prolonged sideward move-ment, to a marked contraction and recovery in PC. In 1963—65, shortup-and-down movements in PC were transformed into a smooth up-ward drift in Sir. Such strong smoothing suppresses turning points,and thus few direct timing, comparisons can be made, but the estimatesleave little doubt about the pronounced tendency of expenditures forplant construction to lag behind contracts. These retardations in Strlag behind the contractions in PC by intervals of one to two quarters.Longer lags—six quarters at the 1956—57 peaks and four quarters atthe 1958—59 troughs in the two series—can also be observed, althoughthere is some uncertainty about these observations because of double-turn configurations in PC.'7
Older data covering the earlier postwar years show the same typeof relationship between new investment orders and contracts and busi-ness expenditures on plant and equipment. Curve 1 from Chart 9-1 isreproduced in quarterly form in Chart 9-4 (the OBE-Dodge series in-cluding fabricated metals orders). With it are shown the OBE-SEC se-ries for fixed-investment outlays of all industries and all manufactur-ing, 1948—61 (curves 3 and 4). Again, it is evident that the cyclicalmovements in outlays follow with substantial lags and smaller relativeamplitudes the corresponding fluctuations in new orders. The one con-
'7Thus, when measured from the secondary peak of PC in 1-1957, the lag of Sir is two quarters,but such a comparison would ignore the fact that PC declined strongly in 1956, while Sir kept in-creasing.

4035
30
25
20
15
1.5
1948 '49 '50 '51 '52 '53 '54 '55 '56 '57 '58 '59 '60 '61
Note: Shaded areas represent business cycle contractions; unshaded areas, expan-sions. Dots identify specific peaks and troughs of specific cycles.
Source: U.S. Department of Commerce, Office of Business Economics; Securitiesand Exchange Commission; F. W. Dodge Corporation; National Industrial ConferenceBoard.
a Net of cancellations. Computed by addition of series for component industries,seasonally adjusted by NBER. The gross appropriations figures, seasonally adjusted byNICB, are shown as points lying above the net appropriations curve. (The encircledpoints represent the specific-cycle turns in the gross appropriations series.)
b The solid curve shows actual expenditures. The points linked with the curve are"first anticipations" of the expenditures converted to the present levels. They areobtained by taking the first anticipated changes (A1 — A2) and adding these changes, ob-serving signs, to the present levels. The links connect actual expenditures of any givenquarter with the anticipated expenditures of the next quarter; the former is the quarterin which the projection was made; the latter is the quarter to which the projected figurerefers. The anticipations data are seasonally adjusted by the source since 1953; forthe earlier years, they were adjusted by means of the average seasonal factors for1953—58.
15
l0987
6
S
Chart 9-4Investment Orders and Contracts, Actual and Anticipated Business
Expenditures on Plant and Equipment, and New CapitalAppropriations and Outlays by Manufacturing
Companies, 1948—61Billion dollars Billion dollars
(I) New investment orders and contracts •-
— 35— (2) New capital appropriations mfg 30- (NICB)° •
• :::::•:•:• •ø —2.5
- T -20o
• V0 * —IS
-1.0
— (3) Business expendttures on plont arid equipment (OBE-SEC1— oil lndustriesb I
(4) Business on plant and equipment (OBE-SEC) —20
• all
- S
:.::.:':.:.:'l -7• -6
— (5) Capital outlays, mfg(N1CB) .
— :::::.:::::.:::.:: Ratioscales :::::::::::::::::::::: • :::::::.:.:.:
_1 I I 1 I I I
3.0
2.5
2.0

428 The Behavior of Investment Copimitments and Expenditures
spicuous difference between these series is that the short but pro-nounced "Korean" cycle in investment orders, with a high peak in thefirst quarter of 1951, is largely smoothed out in the series on expend-itures for plant and equipment (as it is in the corresponding productionand shipments series).
On five occasions, two-quarter lags of business capital outlays arerecorded at cyclical turns of new investment orders in Chart 9-4 (com-pare curves 1 and 3). At the 1954 trough, the lag is four quarters, andat the 1951 peak it is as long as ten quarters. That peak, of course,was associated with the heavy accumulation of unfilled order backlogsduring the first year of the Korean War. The average lag of outlays inthe period since 1949 turns out to be 10.3 months according to thesedata. For the period since 1954, it is 7.2 months, similar to the averagelag of 6 months obtained by using the new data from Chart 9-2.
To conclude, it is reassuring to find that the main results of the anal-ysis in this section show a certain degree of robustness in that they donot depend critically on which of the different sets of data for fixed-in-vestment orders and expenditures are used.
Capital Appropriations, Commitments, and SpendingChart 9-4 includes quarterly series on new capital appropriations
and capital expenditures of several hundred large manufacturing com-panies reporting to the National Industrial Conference Board.'8 An"approved capital appropriation" is an authorization by top manage-ment (typically the board of directors or president) of a future capitalexpenditure. Appropriations cover new plants and buildings, additionsto or improvements of plants and buildings, new machinery, office ma-chines, storage equipment, and motor vehicles for business use. Ex-
'8The number of reporting companies has increased over time. Data for 1953—54 from a 353-company subsample were linked to the 1955—58 data from a 507-company subsample; the latteragain were linked to the 1958—60 data for the currently responding 602-company sample. The se-ries have recently been adjusted for seasonal variation. (The NICB publishes the figures in unad-justed form in the Conference Board Business Record but provides the user with some charts of theadjusted series.) In addition to Statistics of newly approved capital appropriations, cancellations,and expenditures, the NICB compiles data on volume ("backlog") of appropriations outstanding,amounts committed and spent, and the percentage of companies reporting increases in appropria-tions. All these measures are based on a continuing quarterly survey among the nation's largestmanufacturing companies. For a description of statistical procedures, the survey coverage, andlimitations of the data, see Conference Board Business Record, October 1956 and July 1960; andMorris Cohen, "The National Industrial Conference Board Survey of Capital Appropriations," inThe Quality and Economic Significance ofAai'icipations Data, Universities—National Bureau Con-ference 10, Princeton for NBER, 1960.
Indicators and Stages of Investment in Plant and Equipment 429
cluded are funds earmarked for land purchase, maintenance and repair,acquisition of existing companies, used equipment and buildings, andcapital spending outside the United States.
The approval of a capital appropriation confirms or changes the an-nual capital budget of the company. In setting up the budget, the firststage is to complete the process of planning and executing capital out-lays; the second stage is the appropriations procedure in which thebudget is disaggregated and "tested" by individual projects.'9 Thethird stage, logically, would be the commitment of the money, i.e.,placing of the order or contract for equipment or plant. Actual outlaysmay begin as construction work takes place and machinery and equip-ment are produced, shipped, and installed. In the last stage the pay-ment for the capital goods acquired is completed and the expenditureis recorded.
In this sequence, appropriations lead commitments (investment or-ders). In fact, for those companies in the NICB sample which reportcommitments as distinguished from expenditures, commitments of ap-propriated funds do show some lag vis-à-vis the approvals of suchfunds, though the lag appears to be relatively short and irregular.2° Theamplitudes of appropriations exceed those of commitments. These ob-servations, however, are highly tentative as they are based on slenderevidence. Only about 35 per cent of the companies in the NICB sampleare able to report their commitments.2'
New authorizations made during a quarter add to the backlog of ap-propriations outstanding at the beginning of the quarter; commitmentor spending, as well as cancellation, of the appropriations reduce thebacklog. Hence the change in the appropriations backlog during a givenquarter equals the difference between new approvals and the sum ofthe appropriations committed, spent, or cancelled. For the companiesunable to report commitments — the majority of the sample — outstand-ing appropriations are taken to expire only when spent or cancelled.The fact that the appropriation backlog series is largely on an expendedrather than "committed" basis makes it less forward looking than it
Cohen, "Capital Appropriations," p. 300.for 117 durable goods manufacturers, a downturn in appropriations occurred in 1V-1955
and a downturn in commitments in 11-1956; but both series moved briefly down together in 111-1956,whereupon commitments reached a secondary peak in IV.1956 and appropriations in 1-1957. In1958, both appropriations and commitments turned up together in the third quarter. See ConferenceBoard Business Record, July 1960, P. 7.
Cohen, "Capital Appropriations," p. 307.

430 The Behavior of Investment Commitments and Expenditures
would be otherwise. Since the placement of orders precedes spending,uncommitted appropriations backlogs should be an earlier anticipatoryseries than the unexpended backlogs.22
For comparisons with orders and expenditures, appropriations arebest taken net of cancellations. The latter, however, are apparently notlarge enough to create major discrepancies between the time-paths ofgross and net appropriations; the two series tend to move closely to-gether and turn at the same time, as shown in Chart
Relating the Aggregative Data on Investment StagesEven if manufacturers' new capital appropriations (App) should lead
investment orders placed by the same companies, they need not leadour investment orders-contracts series (OC), which has a different andbroader scope. The investment orders are reported by the firms thatreceive them; the appropriations, by those that place the orders. Theformer data relate to orders to be processed by manufacturers and tocontracts for plant construction to be put in place by builders. Theseorders and contracts originate in many sectors of the U.S. economyas well as abroad; but appropriations all originate with large domesticmanufacturing corporations.24
Nevertheless, it would not be implausible if appropriations actuallydid have a definite tendency to lead new orders for capital goods. Itcannot be firmly established that this is actually so, since the timingof these series appears to have been more nearly coincident on a fewoccasions, notably at troughs in 1954, 1958, and 1967; but on the aver-age a short lag of orders is indicated, at least at the peaks. At the height
22 Let B1 be the appropriations backlog at the end of the quarter; A?, gross new appropriations;C1, cancellations; — net new appropriations; 07, capital commitments for those com-panies that report them; E7, capital expenditures for the other companies; E1 = 07 + E7, appro-priations committed or spent. (All these variables, except B, which is a stock, are flows during thequarter.) Then, B1_1 + A7— C1 — 07— E7 = B1 or B1 — B1_1 = M' — E1.
For those companies which report appropriations on a commitment basis, B1 represents capitalappropriations outstanding that have yet to be committed, i.e., the backlog of capital goods ordersyet to be placed. This should be a foreshadowing series for unfilled orders recorded by the receivingcompanies in the capital-goods-producing industries: However, for all those firms that do not reportcommitments, outstanding totals of appropriations represent unexpended, rather than uncommitted,backlogs. Here the orders may have been placed earlier; all that the totals tell us is that a certainsum of money is yet to be spent. It is important to note that this distinction applies to the meaningof the appropriations backlogs, not to the newly approved appropriations which, unless cancelled,do represent investment orders to be placed. See Conference Board Business Record, October 1956,p. 425.
23Cancellations did increase in the vicinity of troughs in appropriations, particularly in 1958 andless so in 1954. Compare gross and net appropriations in Chart 9-4.
24 Recently, the NICB has also begun reporting appropriation figures for electrical and gas utilities.

Indicators and Stages of Investment in Plant and Equipment 431
of the investment boom of the mid-1950's, appropriations did in factlead orders by a long interval (compare curves 1 and 2 in Chart 9-4).For the 1959 peaks, the comparison is somewhat inconclusive, de-pending as it does on which of the orders-contracts series is used (com-pare the OC curves in Charts 9-2 and 9-4), but the best indication isone of roughly coincident timing. However, it is particularly notablehere that OC declined initially very little in 1960, lingering at highlevels well after App dropped off sharply. In l966,App reached a peakin the second quarter, OC in September (or third quarter); and mostrecently App had its highest value in the third quarter of 1969, OC inJanuary 1970.25
Manufacturers' appropriations have considerably larger percentageamplitudes of cyclical movement than the total investment orders (com-pare curves 1 and 2 in Chart 9-4). Similarly, the NICB capital outlaysof manufacturers move in larger cycles, measured in percentages, thando total business expenditures on plant and equipment (cf. curves 3and 5). These results may in part be due to technical reasons such asdifferences in sample size, but they also reflect the fact that investmentby manufacturers is more cyclical than investment by nonmanufactur-ing business—perhaps because of the greater cyclical sensitivity ofmanufacturing output compared with that of other sectors of the econ-omy. Evidence of that behavior is provided by the OBE-SEC serieson plant and equipment expenditures, which show larger relative fluc-tuations for manufacturers alone than for business as a whole (cf.curves 3 and 4). The NICB capital outlays series resembles the OBE-SEC figures for manufacturing rather well, those for all business ap-preciably less (cf. curve 5 with curves 3 and 4).
New capital appropriations very definitely lead plant and equipmentexpenditures, not only as estimated by the NICB for the same sampleof large manufacturers, but also total business and the total manufac-turing outlays on fixed investment as estimated by OBE-SEC (seeChart 9-4). These are all leads of either 2 or 3 quarters, except for afew longer leads (4—7 quarters) that are associated mainly with theIV-1955 peak in appropriations. On the average, expenditures laggedappropriations by 10 to 11 months at the five turning points of tLe
See charts and figures in the latest issue of the Business Conditions Digest (BCD) available atthe time of this writing: the April 1970 issue, pp. 23—24 and 72, series 10 and II. (My charts wereprepared much earlier and have not been updated.)

432 The Behavior of Investment Commitments and Expenditures
1954—60 period. This may be compared with average lags of 6 to 8months obtained by comparing the corresponding turns in expendituresand new investment orders. There is no indication of a systematic dif-ference in timing between the different capital expenditure series com-pared here.
As would be expected, the association between the two NICB se-ries is much closer than that between manufacturers' appropriationsand the comprehensive investment outlays. The latter bear more re-semblance to new investment orders than to the appropriations series,allowing for the lags. This is suggested by graphical comparison (seeChart 9-4) and confirmed by Table 9-i, which shows that business ex-penditures on plant and equipment (I) are more closely correlated withinvestment orders and contracts (OC) than with appropriations (App).The regressions use lags of! of one to three quarters (see lines 1 e andif and 3a—3c in the table). The best result for the orders-contracts se-ries was obtained with a two-quarter lag of!. In this relationship (Table9-1, line if), where the data are expressed in billions of dollars,
i = 11.1 + 1.48 0C1_2 + u1.
About seven-eighths of the variance of the investment expenditures arestatistically explained (f2 = .87 1) and the standard error of estimate(SE) is $1.3 billion. The best result for appropriations (Table 9-1, line3c) was obtained with a three-quarter lag of 1:
= 20.3 + 1.S7App1_3 + Vt.
But here ?2 is smaller (.7 86) and SE is higher ($2.5 billion). Note alsothat the intercept in (3c) is more than 80 per cent larger than the inter-cept in (if).2°
Regressions based on the new data for 1953—65 yield results con-sistent with the above. Close correlations exist between expenditureson plant and equipment and prior values of new investment orders andcontracts, and it matters relatively little whetherOC orOC' and whetherI or are used (the distinctions between these series were discussedearlier; see Chart 9-2 and text). Again, higher correlations are ob-tained with a two-quarter lag of expenditures than with a one-quarter
26 In these equations, gross appropriations seasonally adjusted directly by the NICB were used,rather than the net appropriations series with the NBER adjustment (the latter is plotted as curve2 in Chart 9-4). In later work, however, regressions with the net appropriations series were com-puted, and the results were not improved. In fact, the determination coefficient for the relation be-tween and (net) is (.742)2 = .55 I, i.e., significantly lower than for the corresponding relationwith gross appropriations (3c in Table 9-1).

Indicators and Stages of Investment in Plant and Equipment 433
Table 9-1Simple Correlations of Plant and Equipment Expenditures on Each of
Three Symptomatic Variables, 1949—61 and 1954—61
Lag of I Stand.Relative Errorto md. of Est.
md. Var. Corr. with Plant Var. (qrs.) r ?2 (bill. dol.) Period8and Equip. Expend. (I) (1) (2) (3) (4) (5)
1. NEW INVESTMENT ORDERS AND CONTRACTS (OC)a. 0 .776 .594 3.3 1949—61
b. 1 .870 .752 2.5 1949—61
c. 2 .918 .843 2.1 1949—61d. 3 .910 .824 2.1 1949—61
e. 1 .868 .745 1.8 1954—61
f• 2 .936 .871 1.3 1954—61
g. 3 .924 .849 1.4 1954—61
2. FIRST ANTICIPATIONS OF PLANT
AND EQUIPMENT EXPENDI-TURES(A1) b •979 .957 LI 1949—61
3. NEW CAPITAL APPROPRIATiONS, MANUFACTURING (App)a. 1 .686 .454 2.7 1954—61b. 2 .850 .714 1.9 1954—61
c. 3 .891 .786 2.5 1954—61
4. LAGGED PLANT AND EQUIP-MENT EXPENDITURES 1 .975 .950 1.2 1949—61
Source: Variable 1, Office of Business Economics—Dodge Corporation; variables 2and 4, OBE—Securities and Exchange Commission; variable 3, National IndustrialConference Board.
a Regressions for 1949—61 are based on series of 50—52 quarterly observations; thosefor 1954—61, on 33 quarterly observations.
b Released two and a half to three months before the middle of the quarter to whichthey refer (see text).
or zero lag; the r coefficients between and OCX, OC...1, andrespectively, are .929, .958, and .971. Moreover, when all three OCterms are included simultaneously, proves redundant.
Short-Term Anticipations of Capital Outlays
Their Nature and Predictive ValueThe OBE-SEC quarterly data on capital outlays are accompanied
by data on anticipated capital outlays compiled from reports of the

434 The Behavior of Investment Commitments and Expenditures
same sample of companies. About 4—6 weeks after the beginning ofeach quarter, the firms are asked to provide figures on their plant andequipment expenditures for the quarter just passed and on expectedexpenditures for the current and succeeding quarter. Both the current-quarter and the next-quarter expectations (called "second anticipa-tions," A2 and "first anticipations," A1, respectively) are released in thethird month of the quarter. Thus A1 becomes available less than fourmonths prior to the end of the quarter to which it refers, and nearlysix months ahead of the date of release of the preliminary actual data.The reported A2 figure, which of course utilizes more current informa-tion, has only about half as long a lead over the date of release of thefirst estimate of the actual outlay and a lead of less than one monthrelative to the end of the quarter concerned.
Anticipations do not represent a "stage" of the investment processin the sense in which this term was applied to capital appropriations,contracts and orders, and outlays. They are not a measure of earlyplanning of investment expenditures that is to be followed by the aboveoperational stages. Investment projects typically take much more timeto gestate than the three or (at most) six months that separate the dateswhen anticipations are collected and the end of the period to whichthey refer. These figures, therefore, express not planned but expectedexpenditures. More specifically, they imply forecasts of how the out-lays, which typically will have already been determined by previousappropriations and orders or contracts, would be allocated between thecurrent and next quarters and the further future.
The forecasters are in this case highly qualified, since they representthe companies that incur the outlays. Coming from this source, and ata rather late point in the time scale of the investment process, whenpertinent information should already be ample, the anticipations datapromise to serve as a useful tool for forecasting plant and equipmentoutlays. However, the distribution over time of investment expendi-tures depends in part on the progress of the work underway, and hencemust be related to the developments on the supply as well as on thedemand side, including such factors as changes in prices and availa-bility of capital goods. These considerations suggest that the relationbetween anticipated and actual investment may be subject to influencesof major analytical interest.
A series made up of anticipated expenditures levels alone cannot

Indicators and Stages of Investment in Plant and Equipment 435
be taken to show at what points of time the actual expenditures wereexpected to experience upturns or downturns. Such a series wouldshow changes from a previously anticipated level to the next antici-pated level, whereas, in fact, at any given time the anticipated changeis from the latest available estimate of the actual level to the next an-ticipated level. To take this into account and, at the same time, to avoidthe difficulties due to revisions of the expenditure series, the follow-ing mode of presenting the anticipations was adopted in Chart 9-4: (1)The anticipated change in expenditures between the current quarter(t) and the next quarter (t + 1) is computed as the algebraic difference
= — The base is the second anticipation rather thanthe actual outlay for the period t, because the latter figure is still un-available when the first anticipation for t + 1 is made. (2) The antici-pated change is added to the present version of the actual expendituresseries (Ii) to obtain the levels of first anticipations, adjusted for the ef-fects of the revisions in the basic data: = + (3) Points rep-resenting the levels of are plotted in Chart 9-4 to the common scalewith the actual business outlays on plant and equipment, that is, alongwith the series Ig (curve 3). The points do not form a continuous series,but rather each is linked with the value of I in the preceding quarter.Thus the vertical differences between the points and the curve indicatethe level errors of the adjusted first anticipations, and the differencesbetween the slopes of the links and of the curve indicate the changeerrors (all in relative terms, since the chart uses vertical logarithmicscales).
This presentation puts the anticipations in a better light than wouldothers of a more ex-ante character, for several reasons. First, revisedactual data are used in a way implying elimination of those errors ofmeasurement that are assumed to be corrected by the revisions. Sec-ond, the anticipations figures have been adjusted for seasonal variation.The official adjustment starts in the second half of 1952, but I havecarried it back to the beginning of the anticipations series. Third, theanticipations figures have also been adjusted for the bias of underes-timating, on the average, the changes in actual expenditures. Again,the bias adjustment by the source goes back to 1953 only, but I havecarried it back through the earlier years covered by the data.
The improved processing of the reported figures since August 1952caused a marked reduction in the aggregate anticipation errors. In par-

436 The Behavior of Investment Commitments and Expenditures
ticular, the correction for seasonal variations resulted in a decisive im-provement.27 Even after the adjustments, however, relatively largedispersion and errors are found in the anticipations figures for individ-ual industries. Individual-company deviations from planned investmentare often very substantial, but they tend to cancel out in industry pro-jections; and, similarly, the errors in the latter tend to cancel out in therecord for all industries combined.28
This may seem disappointing. It is easy to think of some factors thatshould enhance the predictive value of short-term investment antici-pations. Certain projects involving outlays on plant and equipment are"autonomous" in the sense of being very little affected by current con-siderations. When such projects reach the point of being included inthe anticipated outlay reports for the next quarter, one would assumethem to be largely independent of such momentary fluctuations as maythen be occurring in sales, profits, interest rates, etc. The influence ofcurrent changes in the business situation would be significant here onlyon those occasions where a current development causes the firm torevise the long-range expectations governing the given investment proj-ect. Another consideration that favors the projectability of investmentby the firm is that capital outlays, unlike sales or profits, are to a largeextent controllable. The rate at which the expenditures are made de-pends substantially on the firm's past planning and decisions. However,these arguments should not be pushed too hard. Plant and equipmentoutlays, viewed over short spans of time, are autonomous and control-lable only in a limited sense and degree.
To the extent that bias is absent or effectively eliminated by dataprocessing, it is certainly reasonable to expect that the larger the sample
Before the correction, the anticipated changes in expenditures (A1) averaged —3.1 per cent andthe actual changes + 1.2 per cent in the period 1953—58, yielding a bias of—4.3 per cent per quarter.After the correction, the mean relative changes were only 0.7 for first anticipations and 0.5 per centfor actual expenditures, which gives a bias of merely 0.2 per cent. As a result of both the regularseasonal adjustment and a separate residual bias correction, the directional errors of the anticipa-tions of change and the dispersion of the anticipated about the actual changes were also drasticallyreduced. See "An Appraisal of OBE-SEC Estimates of Plant and Equipment Expenditures, 1947—1958," Star isticol Evaluation Reports, Report No. 1, Office of Statistical Standards, Bureau of theBudget, October 1959, p. 40. This report was prepared by Raymond Nassimbene and Benjamin T.Teeter.
2H Ibid., Part IV, pp. 46 if. Analyses of individual-company anticipations for selected years aregiven in Irwin Friend and Jean Bronfenbrenner, "Plant and Equipment Programs and Their Realiza-tions," in Short-Term Economic Forecasting, Studies in Income and Wealth, Vol. 17, Princeton forNBER, 1955, pp. 65—68; and also in articles by Murray F. Foss and Vito Natrella,Survey of Cur-rent Business, January and March 1957.

Indicators and Stages of Investment in Plant and Equipment 437
the smaller will be the error of the aggregate. This explains in part thebetter showing of the all-industry anticipations in comparison to theindividual-industry figures. But the collection of companies and invest-ment projects covered by the anticipations aggregates is far from homo-geneous, and offsetting biases among the component groups also con-tribute to the net error-reducing effect of aggregation. While relativelysmall firms tend to underpredict, the larger firms show a slight inclina-tion to overpredict the levels of their actual capital outlays (but thelatter are on the whole significantly better predictors than the former).29
The discrepancies between anticipated and realized capital outlayscan in some periods be related to unexpected changes in prices and theavailability of capital goods. Another factor is the errors in sales an-ticipations. Data on the latter are also collected by the SEC and theCommerce Department. The ex-ante approach of relating the errorsof investment anticipations to the errors of sales expectations met withconsiderable success. When actual sales exceed (fall short of) expec-tations, investment plans generally are revised upward (downward) sothat actual capital expenditures exceed (fall short of) anticipations. Forexample, annual data for all manufacturing show a positive correlationof .88 between the relative sales and investment deviations in 1948—56.This relationship, however, is much closer on the aggregate than on thecompany level.30
Eisner estimated quarterly "realization functions" by regressing thecurrent errors of anticipations expressed as ratios (1 — A1)/A1 on two
2D See Murray F. Foss and Vito Natrella, "Business Anticipations of Capital Expenditures andSales," Survey of Current Business, March 1957, p. 8; Friend and Bronfenbrenner, "Plant andEquipment," pp. 69—70; Robert A. Levine, "Capital Expenditure Forecasts by Individual Firms,"in Quality and Economic Significance of Anticipations Data, pp. 36 1—62; and Murray F. Foss andVito Natrella, "The Structure and Realization of Business Investment Anticipations," ibid., pp.39 1—95.
It may be noted that outlays for major investment projects (large percentage additions to the firm'sfixed assets) tend to be forecast more accurately than those for small projects. The former are oftenslightly overstated, the latter considerably understated. The scale-of-investment factor reinforcesthe size-of-firm factors but each has some independent influence.
See Murray F. Foss and Vito Natrella, "Investment Plans and Realizations," Survey of Cvi rentBusiness, June 1957, pp. 16—17. Compare also Arthur M. Okun, "The Value of Anticipations Datain Forecasting National Product," in Quality and Economic Significance ofAnticipations Data, pp.439—42, and "The Predictive Value of Surveys of Business Intentions," American Eco,winic Re-view. May 1962, p. 222. Interestingly, sales expectations are valuable in explaining investment de-viations even though their record in predicting actual sales is poor. Sales errors are more systematicand investment errors are more volatile and random; so the former cancel out much less in the ag-gregate than the latter. Hence. "sales errors may explain only a trivial portion of the investmenterrors at the microeconomic level and yet explain a substantial fraction of aggregative investmenterrors" (Okun, "Anticipations Data," p. 441).

438 The Behavior of Investment Commitments and Expenditures
terms involving deviations for anticipations of and on lagged rel-ative changes in sales, in profits after taxes, and in unfilled orders formachinery.31 In most cases, the resulting coefficients show the expectedsigns (positive for all the relative change variables), but are generallysmall relative to their standard errors, except for the terms that in-clude the lagged values of the dependent variables. The record is ad-mittedly "sufficiently mixed to call for careful attention to difficultiesunderlying this approach and to possible modifications in its applica-tion." 32
Investment Anticipations, Orders, and ExpendituresAs shown above, new orders and contracts for capital goods lead
expenditures on plant and equipment consistently by substantial in-tervals. Production of equipment or construction of plant comes be-tween ordering or contracting and payments. There may also be ad-ditional delays due to demand pressures and shortages on the supplyside. For first anticipations, no such built-in leading scheme exists,other than that they are reported about one quarter earlier than theactual outlays. Indeed, when plotted in the quarter to which they refer,the anticipations, for optimal timing, should obviously have turningpoints exactly coincident with those for actual expenditures. The pur-pose of this index of investment intentions is not to give an interme-diate-range prediction of turns in expenditures, but to forecast the lev-els of expenditures over a short range.
Chart 9-4 shows that the agreement in sign between the actual in-vestment outlays and the corresponding first anticipations was indeed
"Realization of Investment Anticipations," in J. S. Duesenberry, 0. Fromm, L. R. Klein, andE. Kuh, eds,, Tue Brookings Quarterly Econometric Model of the United States, Chicago-Amster-dam, 1965, pp. 95—128.
32 ibid., p. 128. For a critique and countercritique, see also Zvi Griliches, "The Brookings ModelVolume: A Review Article," Review of Economics and Statistics, May 1968, pp. 217-. 18; and GaryFromrn arid Lawrence R. Klein, "'The Brookings Model Volume: A Review Article:' A Comment,"ibid., pp. 236—37.
It should be noted that Eisner earlier adopted a different, stepwise approach to the same generalproblem, by separately relating (I) the actual investment expenditures and (2) the anticipated in-vestment expenditures to a common group of causal variables (several lagged sales changes, profits,and depreciation), then (3) making the actual values depend on the same variables plus the anticipa-tions. See R. Eisner, "Investment: Fact and Fancy,"American Economic Review, May 1963, pp.237—46. in this and related papers ("A Distributed Lag Function," Econometrica, January 1960,pp. 1—29; "Capital Expenditures, Profits, and the Acceleration Principle," in Models of IncomeDetermination, Studies in Income and Wealth, Vol. 28, Princeton for NBER, 1964, pp. 137—65),Eisner used data from the annual McGraw-Hill surveys of capital expenditures instituted in 1954.

Indicators and Stages of Investment in Plant and Equipment 439
very good (compare the slopes of curve 3 and of the attached projec-tions in each successive quarter). A few directional errors (divergentslopes) did, of course, occur. At the seven major cyclical turns in ex-penditures, two such errors can be spotted. Realized investment reacheda trough in the last quarter of 1949, but the anticipated change fromthat quarter to the next was negative. Again, actual outlays show apeak in 11-1960, but the anticipated change at the mid-year was stillpositive. However, it should be noted that it takes only slight differ-ences in levels to produce such timing discrepancies.
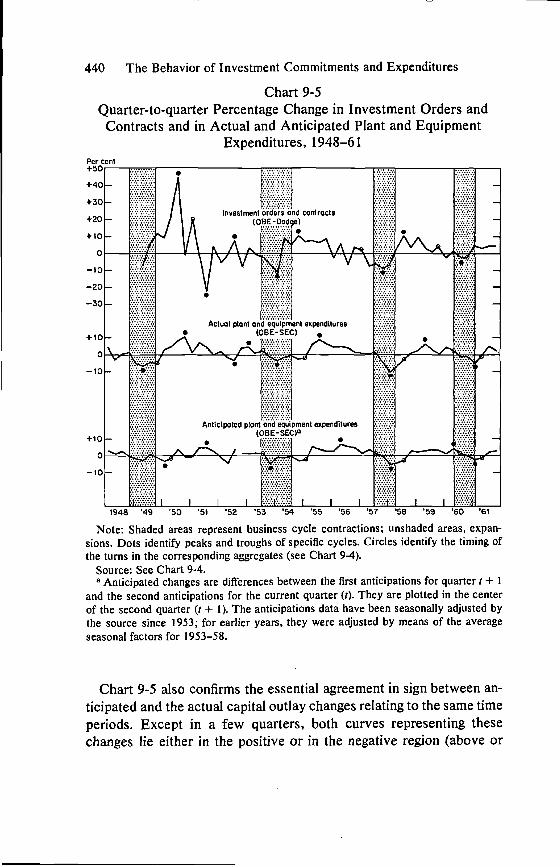
Quarterly percentage changes in first anticipations, computed as— are plotted in Chart 9-5 along with the cor-
responding changes in actual plant and equipment outlays and in newinvestment orders and contracts.33 The use of first differences, whichreduces sharply the influence of common trends, provides a strong testfor the short movements in the series and their possible association.The erratic elements are emphasized but the cyclical ones, if sufficientlyvalid to begin with, will not be suppressed. They are well in evidencein each of the series here considered.
It is evident that the changes in orders-contracts are often consider-ably larger than those in expenditures. They are also more erratic andshow more frequent sign reversals. Due to the adjustments noted be-fore, there is little difference in the average size between the actualand the anticipated expenditure changes (but underestimation is stillmore frequent than overestimation).
Chart 9-5 gives additional evidence of the early timing of the orders-contracts series relative to investment expenditures. The leads relatingto the aggregates themselves are shown here by the sequence of base-line crossings, which mark the transition from positive to negativechanges, or vice versa. The turning points in the plotted quarterly ratesof change (which, of course, correspond to the inflection points in thelevel series) typically follow the same sequence. Either type of meas-urement suggests that on the average expenditures lag behind ordersby some 6 to 7 months.
A similar chart appears in my article in Moore, ed., Business Cycle indicators, Vol. 1, p. 478,but the relative changes in first anticipations shown there for 1953—59 were computed differently.The figures used here are the correct ones in that they allow for the rate of second anticipations andfor all available adjustments of the data.
440 The Behavior of Investment Commitments and Expenditures
Chart 9-5Quarter-to-quarter Percentage Change in Investment Orders and
Contracts and in Actual and Anticipated Plant and EquipmentExpenditures, 1948—61
Per ceni• .:::.:::.:.:.:.:.:.:.: —
+40
+30 :.:::.:.:.
Investment orders and contracts+20 (OBE-Dodge)
Ars ft\t\..Rv —
—10S *
—20•
—30
Actual plant and equipment expenditures• (OBE-SEC) •
Anticipaled plant and equipment expenditures
0(OBE_SEC)a
A
1948 '49 '50 '51 52 '53 '54 '55 '56 '57 '56 '59 '60 '61
Note: Shaded areas represent business cycle contractions; unshaded areas, expan-sions. Dots identify peaks and troughs of specific cycles. Circles identify the timing ofthe turns in the corresponding aggregates (see Chart 9-4).
Source: See Chart 9-4.a Anticipated changes are differences between the first anticipations for quarter t + 1
and the second anticipations for the current quarter (0. They are plotted in the centerof the second quarter (1 + 1). The anticipations data have been seasonally adjusted bythe source since 1953; for earlier years, they were adjusted by means of the averageseasonal factors for 1953—58.
Chart 9-5 also confirms the essential agreement in sign between an-ticipated and the actual capital outlay changes reLating to the same timeperiods. Except in a few quarters, both curves representing thesechanges lie either in the positive or in the negative region (above or

C,
Indicators and Stages of Investment in Plant and Equipment 441
below these base lines, respectively). This can be interpreted as mean-ing that the two variables are basically synchronous.
There is much less agreement in size between the expected and therealized changes. The local maxima and minima of the two curves fallin most instances into different quarters, but without any systematiclags of either variable; consequently, the patterns involved are on thewhole roughly coincident.34
The investment-orders estimates can be constructed with a lag ofI to 2 months. Assume they predicted correctly the turn of investmentexpenditures with a lead of six months, as they did on several recentoccasions. Then their net effective forecasting lead would be about fourto five months to the middle of the quarter in which the turn occurred(defining the net lead as the measured lead minus the publication lag).Now the first anticipations figures are released about two months be-fore the middle of the quarter to which they refer, and their expectedtiming relative to actual expenditures is coincident; thus two monthsis the net effective lead with which they can correctly predict a turnin expenditures. It follows that the lead of orders is two to three monthslonger than the lead of anticipations. This advantage of earlier signalsoffsets, in some degree, the advantage of greater predictive reliabilityheld by the anticipations figures. Investment orders would probablyyield more false leads (signals of turns that do not materialize) thanwould anticipations. As so often happens, the price of earlier forecastsis their larger average error.
A correlation analysis leads to the same general conclusion (seeTable 9-1, line 2). Not surprisingly, first anticipations (A1) are closelycorrelated with the investment expenditures (I) to which they directlyrefer. Over the period 1949—61 (series of 50 quarterly observations),correlating! and A1 results in r2 (.979)2 = .958, with a standard errorof estimate of $1.1 billion. This is significantly better than the highestcorrelation between the OBE-Dodge investment orders and contracts(OC) and 1, which is obtained for OC taken with a lead of two quarters(Table 9-1, line ic): here r2= (.918)2= .843 and SE= $2.1 billion.However, OC taken with a three-quarter lead is still almost as good apredictor of! as is OC taken with a two-quarter lead, judging from the
Although it is difficult to identify the "turning points" in the anticipated changes, a close com-parison of the two curves in Chart 9-5 shows a perceptible similarity between their longer fluctua-tions, which is probably all one could reasonably hope for.

442 The Behavior of Investment Commitments and Expenditures
correlation measures alone (Table 9-1, lines 1 c and 1 d). The net effec-tive lead for this relation between and is 7 to 8 months, whichis more than three times that for the relation between I and A1. Againone finds that for earlier availability of forecast OC is preferable to A1,while for greater reliability of forecast A1 is preferable.35
Distributed Lags of Expenditures
Regressions on Several Lagged Values of CommitmentsReplications of the work done with the older data for 1949—61 were
performed on the currently available quarterly series for 1953—65: thenew Census-Dodge data for fixed-investment orders and contracts andthe OBE-SEC or Commerce (National Income Division) data on ex-penditures for plant and equipment. These calculations confirm thatthe highest correlations between and (or between andare obtained with two-quarter lags of expenditures (i = 2). Three-quarter lags give somewhat lower r's, and one-quarter and four-quarterlags rank third and fourth in this respect. All these correlations arehigh, usually exceeding the correlations obtained with the older datafor 1949—61.
There is an indication that the association between outlays and com-mitments is closer and that it involves shorter lags for producer durableequipment than for the structures component of GNP. In the formercase, correlation between and is maximized when i 1;
in the latter, correlation between and is maximized wheni = 2. However, the second-highest r's are just a little lower; in eachcase, because of high autocorrelations in the time series, the resultsassociated with the different lags fall into relatively narrow ranges.3°
Compare Okun, "Predictive Value of Surveys," pp. 221—24. For 48 quarters from 1949-111to 1961-11, Okun obtained results similar to mine by regressing! on A1. He reports that A1 explainednearly 97 per cent of the variance of predicted quarterly outlays and yielded a standard error of$0.95 billion (at annual rates). He comments on the relation between the ORE-Dodge investmentorders and contracts series (here denoted OC) and the plant and equipment expenditures one (I),lagged by one to three quarters, saying that OC taken alone "does not nearly match the first antici-pations series; taken with anticipations, [it] does not add significantly to the accuracy of the explana-tion" (p. 224). However, Okun does not present his numerical results on this point, does not allowfor the length of the lead involved, and does not mention the trade-off between the gain in timelinessand the loss in accuracy.
36When the lag i is varied from zero to four quarters, the following values of r are obtained: (1)for I, vs. .925 to .970; (2) for vs. .920 to .961; (3) for vs. .886 to .963;and (4) for Str vs. .812 to .844. The correlations with are slightly lower than those withOC, apparently because of the larger weight of structures in the former.
Indicators and Stages of Investment in Plant and Equipment 443
When included along with the values of OC for each of the two pre-ceding quarters, the current value (OCt) has no significant influenceupon also then has a much stronger effect than In-deed, it seems reasonable to assume that some minimum gestation pe-riods prevail so that the shortest-lag terms of OC have no significanteffects of their own, although this assumption could well result in someerror. In other words, the distributed-lag influence on of startsessentially with i = 2 and extends to larger lags (i> 2).38 For the equip-ment component of fixed investment, however, the one-quarter lagterm, will also be included.
In Table 9-2, investment expenditures in the period t are related tocommitments in periods t—j, t—j— 1, and t—j—2, wherej is thelag that maximizes the simple correlation between expenditures andcommitments. The best results for total fixed-investment outlays bybusiness are obtained with lags of two and three quarters, that is, withtwo terms, and The addition of the four-quarter lag termfails to improve the fit in any significant manner. Application of thereweighted orders-contracts series, OCr, yields again very similar,though slightly lower, correlations (see lines 1—3 and 4—6).
When the longer lags in commitments are included in the separateequations for the equipment component, more systematic improve-ments are observed. Here j = 1 and the addition of two- and three-quarter lag terms results in higher k2'S and lower SE's although thegains are small (lines 7—9). Larger relative improvements are achievedin the regressions for the plant component, where j = 2 and the three-as well as four-quarter lag terms are also definitely significant (lines10—12). Again, however, the correlations for plant (structures) are ap-preciably lower than those for equipment (which in turn are slightlylower than those for total fixed investment). The Durbin-Watson sta-tistics are low throughout in Table 9-2, indicating positive autocorre-
Consider the regressions
1t 3.147 — + .9790C1_1 + + = 945(1.155) (.420) (.591) (0.435)
and3.146 + + + Vt; R2 = .946
(1.143) (.410) (0.430)
Regressions based on earlier data for 1949—61 also support this hypothesis. According to Table9-I, and represent the choice of best simple leads relative to Using both terms,
(lt)est = 9.19 + .831 OC..2 + = .859; SE = $1.97 billion.(.224) (.217)

444 The Behavior of Investment Commitments and Expenditures
Table 9-2Regressions of Business Expenditures on Plant, Equipment, and
Total Fixed Investment and Commitments Incurred One to FourQuarters Earlier, 1953—65
Stand-ard
Errorof Es-
Independent Variables and timate Durbin-Depen.Var.a
(1)
Regression Coefficients b ConstantTerm c
(5) (6)
(bill.dol.)(7)
WatsonStatistic
(8)(2) ( 3) (4)
REGRESSIONS FOR EXPENDITURES ON PLANT AND EQUIPMENT
oc1_21. 3.215 3.243 .939 1.695 0.924
(0.120) (1.247)2. 2.010 1.304 2.407 .948 1.557 0.421
(0.406) (0.423) (1.178)3. 2.009 1.179 .138 2.311 .947k' 1.573 0.428
(0.410) (1.576) (.424) (1.225)4. 7.288 2.917 .921 1.925 1.539
(0.311) (1.443)5. It 4.218 3.427 1.521 .946 1.596 0.712
(0.704) (0.731) (1.233)6. 3.926 2.820 .995 1.168 .947 1.583 0.650
(0.733) (0.862) (.762) (1.252)
REGRESSIONS FOR EXPENDITURES ON EQUIPMENT
7. 3.565 —0.244 .926 1.826 0.651(0.147) (1.285)
8. 2.137 1.528 —0.880 .935 1.710 0.412(0.541) (0.560) (1.226)
9. 2.226 0.502 1.017 —1.446 .939 1.661 0.432(0.528) (0.763) (0.531) (1.227)
REGRESSIONS FOR EXPENDITURES ON PLANT
PC1.-3 PC1...4
10. 6.780 5.857 .706 1.621 1.277(0.635) (1.169)
11. 4.348 3.588 3.874 .804 1.324 0.876(0.718) (0.733) (1.037)
12. Sir1 3.334 2.384 2.808 2.938 .857 1.130 0.905(0.659) (0.688) (0.667) (0.913)

Indicators and Stages of Investment in Plant and Equipment 445
Notes to Table 9-2
a As in the text, I denotes business capital outlays (OBE-SEC); PDE, expenditures forproducer durable equipment; Str, expenditures for plant or nonresidential structures.Time subscripts, here as elsewhere, refer to quarters. All the variables are in quarterlytotals at annual rates, in billions of dollars.
b EO denotes new orders for machinery and equipment (Census); PC, contracts for in-dustrial and commercial construction (Dodge); OC, estimated total fixed-investmentcommitments (sum of EQ and PC). In lines 4, 5, and 6, the reweighted orders-contractsseries, ocr is used, with the timing subscripts corresponding to those of OC in lines1, 2, and 3. These variables are expressed in quarterly totals at quarterly rates, in bil-lions of dollars. Standard errors of the regression coefficients are given underneath inparentheses.
Standard errors of the constant terms are given underneath in parentheses.
lation of the residuals, and are not improved by the addition of longerlags (column 9).
Estimates of average lags can be obtained by multiplying the lags iby the corresponding regression coefficient and adding the products.Here, however, each coefficient must first be divided by 4, because theinvestment expenditure data used in the regressions are at annual rates,while the investment commitments data are at quarterly rates. The cal-culations yield average lags of about 2 to 2.5 quarters for the equationsrelating to total fixed investment and to equipment (lines 2, 8, and 9)and of about 5 to 6 quarters for the equations relating to plant (lines11 and 12). In the light of other evidence to be discussed, these are inall likelihood substantial underestimates, and the presumed reason forthis is that the method admits only two or at most three significantterms because of multicollinearity. Each additional term with a positivecoefficient makes for an increase in the estimated average lag.
Chart 9-6 compares the estimates of total business capital outlaysbased on the regression that includes 0C1_2 and (Table 9-2, line2) with actual outlays. The fit is fairly good in that the estimated serieshas no systematic lead or lag relative to the actuals. Significant under-estimation errors, however, can be seen at the 1954—55 trough andagain at the end of the sample period in 1965, while overestimates pre-vail between mid-1959 and mid-1963. At other times, including theturning points of 1957—58, the estimated and observed values show aclose agreement.
The lower part of Chart 9-6 presents a corresponding comparison

446 The Behavior of Investment Commitments and Expenditures
Chart 9-6Regression Estimates for Business Equipment Expenditures and
Total Fixed Investment Outlays, Based on Two LaggedCommitment Terms, Quarterly, 1953—65
dollars
(lt)est = 2.407 + ++ +
on equipment (POEt)
—————ActualEstimated
Expenditures on plant and equipment

Indicators and Stages of Investment in Plant and Equipment 447
for equipment expenditures estimated from lagged orders, and(Table 9-2, line 8). Here again there are no persistent timing
differences between the estimates and the actual values, but there aresubstantial underestimates at the trough of 1954 and in 1964—65 andoverestimates before the peaks of 1957 and 1960.
Variable Lag CoefficientsThe argument developed in Chapter 5 in favor of variable, rather
than fixed, lag coefficients in functions expressing the dependence ofshipments on new orders applies, mutatis mutandis, also to the rela-tions between investment commitments and expenditures. The methodof allowing for the variability of the coefficients by making them dependon the backlog-shipment ratios, U/S, worked rather well in the analysisof the orders-shipments (N-S) relations, where matching data on N,S, and U was available. Its application to the investment functions nowunder study, however, is severely impeded because the data on handat best permit only a crude approximation to the U/S ratios that areneeded. Ratios can be constructed from series for the machinery andequipment industries, but no usable backlog statistics could be foundfor the plant component of business fixed investment. Furthermore, themethod involves only two lagged terms in orders or commitments (say,for the periods t — 2 and t — 3), permitting the relative influence of themore distant term to rise when U/S, as a proxy for capacity utilization,increases. This limitation to shifts between two lag coefficients orweights is probably more detrimental here, where the lags are longerand more complex, than it was in the case of the simpler N-S relations.
Applied to total fixed investment, the variable-lag equation is
it = ajt(OC)i_j + + vt, (1)
where, ai.t + and = 13z — + f31(U/S)1_3_1]. Theform actually used for is
= a + + + /32(OC)(....j_1 + (2)
The estimates for both and turned out to be smaller than theirstandard errors. Better results were obtained in the separate regres-sions for equipment and for plant, which are, respectively:
These formulations are analogous to equations 10—14 in Chapter 5.

448 The Behavior of Investment Commitments and Expenditures
(PDEt)est = 0.883 + —
(1.208) (4.252) (1.075)
+ 3.655(EO)1_2; .937; SE= 1.685; d= .546;(0.140)
and
(Strt)est = 4.061 + 13.49 —
(1.026) (5.753) (1.538)
+ 7.843(PC)1_3; R2 .810; SE = 1.301; d= 1.063.(0.564)
In each case, the estimates of a1 and a2 at the mean values of theU/S ratios come quite close to the values of the corresponding coeffi-cients in the fixed-lag equations, as reported in Table 1-lence,approximately the same average lags are implied by both types of re-gressions, as should be expected. The backlog-shipment ratios for ma-chinery and equipment came close to the high value of 6 early in 1953,but varied between 3 and 5 in the years 1954—66 (see Chart 6-6). Ac-cording to the model, a1 would be going from about 1 toward zero anda2 would be going in exactly the opposite direction, as the U/S ratioin the equation for equipment increased from 3 to 6. Hence the impliedlag for investment in equipment at U/S = 6 would be twice the lag atU/S=3.
Geometric and Second-Order Lag DistributionsThe model examined next is a form of geometric lag distribution
which implicitly includes all lags equal toj and more quarters and ex-cludes the lags shorter than I. For example, using the symbols for totalbusiness investment in plant and equipment, the equation reads
= k + + + Ut, (3)
40These estimates are computed from the formulas = + and — [13o +When each coefficient is divided by 4 (see text above), the results are as follows:
A vg. Variable-Lag Coefficients Fixed-Lag Coefficients
Plant Plantand and
In vestment Equip- Equip- Equip- Equip-Commitments ment ment Plant men: ment PlantFor i—f .506 .567 1.005 .503 .534 1.087Fort—f— 1 .321 .365 0.982 .326 .382 0.897

Indicators and Stages of Investment in Plant and Equipment 449
where U1 is supposed to have the usual assumed properties of the ran-dom disturbance. This form will be recognized as a variant of the fa-miliar Koyck distributed-lag transformation. The results of its appli-cation are presented in Table 9-3, odd lines.
• The regression coefficients of the lagged dependent variable, that is,of or PDE1_1 or Str1_1, are all highly significant (column 4). This,to be sure, could merely reflect the fact that investment expenditures,like most comprehensive economic aggregates, show a substantial de-gree of autocorrelation. But the investment commitments variables —0C1_2, E01_1, and — retain in each case a strong effect uponexpenditures having coefficients that are comfortably large relative totheir standard errors (column 3). The regression constants do not ap-pear to differ significantly from zero, except perhaps in the case ofequipment (column 6). The values of R2 are appreciably higher andthose of SE appreciably lower than the best corresponding figures inTable 9-2 (columns 7 and 8). The improvement here is particularlysubstantial for the estimates of investment in structures. On the otherhand, the Durbin-Watson statistics are still mostly low in these equa-tions, even though they are typically biased upward in such autore-gressive forms (column 9).
The estimates listed on the even lines of Table 9-3 represent second-order lag distributions that use two autoregressive terms. For example,the equation for total business outlays on fixed investment contains11—2 in addition to the factors included in (3), to read:
1= k' + b'11_1 + c'11_2 + u. (4)
The coefficients of 11—2 are negative, and so is the coefficient of thecorresponding term PDE1_2 in the regression for outlays on equipment;but the contribution of S1r1_2 in the equation for expenditures on plantis effectively zero (column 5). Where the second lagged dependent var-iable turns out to be significant, its inclusion results in reductions of thecoefficients of investment commitments and increases of the coefficientsof the first autoregressive term, or PDE1_1 (compare lines 2, 4, and6 with lines 1, 3, and 5, respectively). The values of 2 are increasedbut slightly, while the standard errors of estimate are of course re-duced; the values of d, the Durbin-Watson ratios, are raised consid-erably.
Most of the estimates in Table 9-3 seem quite respectable by con-

450 The Behavior of Investment Commitments and Expenditures
Table 9-3Regressions of Fixed-Investment Expenditures on Commitments,
Based on Alternative Assumptions of Geometric and Second-OrderDistributed Lags, Quarterly, 1953—65
Invest- Regression CoefficientsmentCorn- Lagged Dependent Stand.
Dur-bin-
mit- Invest- Variableb Errorments ment Con- of Est.Van- Commit- For For stant (bill.
Wat-sonSta-
Line able ments a — I — 2 Term R2 dot.) tistic(1) (2) (3) (4) (5) (6) (7) (8) (9)
REGRESSIONS FOR EXPENDITURES ON PLANT AND EQUIPMENT (1k)
I 1.154 0.706 —.772 .977 1.044 0.961(0.247) (0.081) (.895)
2 0C1_2 0.786 1.291 —.518 .312 .983 0.890 1.498(0.228) (0.155) (.122) (.805)
3 0Cj.2 2.075 0.784 —1.219 .973 1.121 1.068(0.576) (0.082) (.946)
4 1.416 1.402 —.581 .179 .982 0.921 1.659(0.493) (0.146) (.123) (.830)
REGRESSIONS FOR EXPENDITURES ON EQUIPMENT (PDE1)
5 0.991 0.775 —1.250 .982 0.891 1.363(0.223) (0.064) (.633)
6 0.870 1.026 —.235 —.818 .983 0.872 1.740(0.229) (0.157) (.134) (.666)
REGRESSIONS FOR EXPENDITURES ON PLANT (Str1)
7 .988 0.942 —.469 .964 0.565 1.698(.387) (0.052) (.535)
8 .990 0.940 .003 —.470 .963 0.572 1.695(.405) (0.182) (.171) (.548)
Note: For identification of symbols, see Table 9-2, notes a and b. Standard errors ofthe regression coefficients and constant terms are shown in parentheses underneath eachstatistic.
8 As identified in column 2.b J, PDE, or SIr, as indicated in the heading, with the subscripts t — 1 or t — 2 as indi-
cated in columns 4 and 5.

Indicators and Stages of Investment in Plant and Equipment 451
ventional statistical standards. The regression coefficients are severaltimes larger than their standard errors and, hence, appear to be highlysignificant. The values of are very high, too. However, a far moredifficult and sensitive test for such equations is provided by the reason-ableness and definiteness of what they imply about the lag structure ofthe investment processes.
It is helpful at this point to consider the long-run equilibrium aspectsof these If the orders-contracts series referred strictly andexclusively to new plant and equipment and were net of cancellationsand duplications, and if expenditures covered exactly the same itemsand no others, then a unit increase in orders, indefinitely maintained,should be associated with a unit increase in expenditures. Briefly, apermanent rise in OC of, say, $1 billion would result in an equal risein I. This is the case of perfect measurement, which of course cannotbe assumed. Actually, the equations for total fixed investment and forequipment in Table 9-3, lines 1—2 and 5—6, imply that a maintainedchange in commitments of one unit does induce a parallel long-runchange in expenditures of approximately one unit. For example, for theregression on line I of the table, the estimated "total response" of Ito a persistent unit rise in OC equals 0.28851(1 — 0.7055) = 0.9695.The corresponding value for the equation on line 2 is 0.1964/(1 —1.2914+ 0.5177)= 0.8680.41 Similarly, estimates of 1.0996 and 1.0414are obtained for the total long-run response of expenditures on PDEin the equations on lines 5 and 6 on Table 9-3, respectively.
The regressions for business investment in plant, however, imply amaintained increase of $4,290 billion in expenditures (Str). This clearlyreflects the large discrepancy in coverage between the series of non-residential building contracts on the one hand and the series of capitaloutlays on structures on the other. The equations for total plant andequipment investment that use the reweighted orders-contracts data,i.e., OC', also yield long-run response estimates that exceed unity. Thefigures obtained here are 2.403 for the geometric and 1.979 for the sec-ond-order lag distribution (Table 9-3, lines 3 and 4). They are at least
41 The figure for line I equals (114)[a/(l — b)], using the symbols from equation (3); the figure forline 2 equals (114)[a'/(l — b' — c')], using the symbols from equation (4). The formulas allow for theuse of data at quarterly and annual rates but are otherwise familiar and equivalent to those used inChapters 5 and 7, above.

452 The Behavior of Investment Commitments and Expenditures
twice as large as they should be because the scaling-down of the equip-ment orders component, designed to bring it into better relation withplant contracts, also reduces the average level of OC' to less than halfthat of OC.
The tabulation below lists the average lags for the investment func-tions identified by their principal variables.42 Except in the case ofstructures, investment expenditures taken with a two-quarter lead havesignificant negative coefficients (Table 9-3, column 5). This implies thatthe average lags calculated from the second-order functions are herepreferable to those calculated from the geometric lag distributions that,tend to be overestimates. The second-order model suggests mean lagsof expenditures of three to four quarters for total fixed investment andequipment. For plant, however, the estimated average lag is as long aseighteen quarters.43
Average Lag in Quarters
Second-Geometric Order
Line No., Model Modelinvestment Function for Table 9-3 (odd lines) (even lines)
Plant and equipment (I, OC) 1, 2 4.4 3.1
Plant and equipment (1, OCT) 3, 4 5.6 3.3
Equipment (PDE, EO) 5, 6 4.4 3.7Plant (Str, PC) 7, 8 18.4 18.4
The patterns of lagged response implied by the second-order equa-tions can be computed by the stepwise method used before (see Table5-6 for description and illustrations). For example, the results for the
42 The averages are computed with the aid of the formulas b/(1 — b) for the geometric and (b' +2c')/(J — — c') for the second-order lag distribution. Since the investment commitments variablesbear the subscript: — 2 for total fixed-investment and plant andt — I for equipment, 2 and I, respec-tively, must be added to the values calculated from the formulas. Compare the discussion of the cor-responding measures in Chapter 5,
It will be noted that the second-order models give a longer average lag for equipment alone thanfor plant and equipment combined. This is certainly unsatisfactory, since the lag for equipmentmust be presumed shorter. It is generally recognized that the lags for structures are much longerthan those for equipment, and our results show this contrast very strongly. But let us recall that thedependent variable in the total fixed-investment regressions is represented by the OBE-SEC busi-ness capital outlays series (1), which is not equal to the sum of the two dependent variables in theseparate regressions for equipment and for plant, where the C NP investment components (PDE andSi,') are used. Hence the reported results are not internally inconsistent.

Indicators and Stages of Investment in Plant and Equipment 453
equipment regression from Table 9-3,line 6, which are tabulated below,suggest that the modal effect of equipment orders (EO) on outlays forproducer durables (PDE) involves a lag of two quarters (the one-quar-ter effect is a little smaller). Nearly 60 per cent of the total long-runreaction would be accomplished within a three-quarter interval, butseven quarters are needed to reach the 90 per cent mark.
CumulativeEffect as
Length of Lag (i) Effect of E01_1 Per Cent of(quarters) on PDE1 Total Effect
1 0.218 20.92 0.223 42.33 0.178 59.44 0.130 71.95 0.092 80.86 0.064 86.97 0.044 91.1
Cumulative, 1—4 0.749Cumulative, 1—7 0.949
Total effect{ (l/4)[a'/(l — b' — c')]} 1.041
The estimates from the second-order equations for total businesscapital outlays and equipment expenditures (Table 9-3, lines 2 and6, respectively) are presented in Chart 9-7 for comparison with theobserved values. The fits are very good indeed and appreciably closerthan those in Chart 9-6. The estimates, however, lag slightly at someturning points and tend to understate somewhat the actual levels on theupgrade and overstate them somewhat on the downgrade. Such resultsare frequently observed for models with lagged dependent variables.
Additional Tests and ModelsTo test for possible misspecification of these models, it is desirable
to include in the regressions additional lagged terms of the independentvariable (compare note 29 and text in Chapter 5, above). This proce-dure also could conceivably result in improved estimates of the timestructure of the investment process. Thus was related stepwise to

454 The Behavior of Investment Corhmitments and Expenditures
Chart 9-7Regression Estimates for Business Equipment Expenditures and
Total Fixed Investment Outlays, Based on Second-OrderDistributed Lags, Quarterly, 1953—65
(tt)est = .312 + + 1.29
(PDEt)est = + + —
on equipment (PDEt)
Billion dollars
—————ActualEst i mated
Expenditures on plant and equipment (Ii)

Indicators and Stages of Investment in Plant and Equipment 455
the terms of and plus and 't2' and similarlyfor the regressions that refer to the equipment and plant componentsof investment separately. In each case, then, three values of the com-mitments variable were included (for the lags j, j + 1, and j + 2), aswell as two lagged values of the dependent variable. Correspondingforms are found in some recent empirical work on distributed-lag in-vestment functions.44 The possibility of comparing these estimates withthe results of those studies was an additional motive for these experi-ments.
The tests refute the (a priori doubtful) hypothesis that capital out-lays are simply a function of a single term in prior investment commit-ments with autocorrelated residuals. The addition of for ex-ample, contributes little if anything to the regression of on and
However, multicollinearity presents a difficult problem for theequations considered here, as it probably does in other applications ofmodels that include several lagged terms in both the independent andthe dependent variables.45 The coefficients of retain values closeto those listed in Table 9-3, but the coefficients of while still neg-ative, tend to be considerably smaller and are not always significantby conventional standards. No gains at all result from adding the ear-lier values of investment commitments to the separate regressions forequipment and for plant; the coefficients of these terms are not sig-nificant.46
In equations (3) and (4) estimated in the preceding section, isused as an explanatory variable and should be independent ofu; but this desideratum may not be satisfied, since the assumed proc-ess makes a weighted average of past disturbances. In one approachfor dealing with this problem, the actual value of the lagged dependentvariable is replaced (as in the section on "Instrumental Variables" in
See Dale W. Jorgenson and James A. Stephenson, "The Time Structure of Investment Behaviorin United States Manufacturing, 1947—1960," Review of Economics and Statistics, February 1967,pp. 16—27.
In some cases, it is difficult to verify this supposition because the necessary information is lack-ing; for example, the Jorgenson-Stephenson article fails to list the standard errors of the regressioncoefficients presented there.
illustrate, the "best" of the equations of this type, that for total fixed investment using thereweighted commitments data, reads
(Ii)est = .192 + 1.295(OCr),_2 + .765(OC'),_3 — + — .5531(2,(.858) (0.510) (.571) (.594) (0.151) (.137)
and yields R2 .982, SE = .916, and d 1.448. The implied average lag is 3.3 quarters, the sameas for the second-order model with one term only (see the tabulation on page 452, above).

456 The Behavior of Investment Commitments and Expenditures
Chapter 5) by an estimated value. In the present case, estimatedfrom past values of OC, as in Table 9-2, could be substituted forAccordingly, the regression
= + + + + (4a)
was computed for total business capital outlays, with j = 2 and2.010(OC)1_2 + as in Table 9-2, line 2. Analogously,estimates from the equations shown on lines 8 and 11 of Table 9-2were used to calculate regressions for and respectively.
The results thus obtained proved disappointing. The estimatedcoefficients of (4a), with their standard errors in brackets, are: a*1.994 (±0.470); b* = 0.522 (±0.306); and =—0.122 (±0.218). Itappears, therefore, that carries the brunt of such explanation asis offered here, since the effect of is relatively weak and that of't-2 insignificant. The fit = .942, SE = 1.6 16) is somewhat worsethan in the regression of on and (see Table 9-2, line2). Apparently, the estimates are not good enough for the roleassigned them in equation (4a), even though they are certainly quiteclosely associated with the lagged values of the actual expendituresthey replace (see Table 9-2, column 7). Corresponding calculationsfor equipment and for plant yield R2 coefficients that are somewhathigher than their counterparts in Table 9-2 but also significantly lowerthan those in Table 9-3. Such estimates of lag structure as can be de-rived from these equations are unsatisfactory.47
Another approach assumes a specific form of serial dependenceamong the disturbances, such as the simplest autoregressive scheme
= + t. Applying this to the residuals u from the regression= a + + + Ut (Table 9-2, line 2), p is estimated
to be .6924. The relation between the transformed variables (compareequation 21 in Chapter 5) is
It — Pit—i = a(1 — p) + —
+ — + (5)
and the least-square estimates for this equation (with standard errors)are: a(1 —p)=—O.597 (±0.738); b= 1.900 (±0.225); and c= 1.816
4TThe coefficients of the lagged values of estimated expenditures are low, and catcutations basedon them result in implausibly short average lags [e.g., little more than three quarters for the equa-tion (4a)].

Indicators and Stages of Investment in Plant and Equipment 457
(±0.223). Considering the usual effects of a transition from levels todifferences, the correlation obtained is quite good = .871). TheDurbin-Watson statistic is 1.394, a sharp increase from the valueobserved for the level regression (d = 0.421 in Table 9-2, line 2). Theequation implies positive coefficients for and 0C1_3, and anaverage lag of about 5.2 quarters.
Chart 9-8 compares the estimates of business fixed-investment ex-penditures based on regression (5) with actual expenditures. The fit isvery close indeed in the period from 1955 through the first half of1958 and in the years 1963—65. The deviations of the estimates fromthe actual values are occasionally larger in the intervening period1958—62, but even here the fit is on the whole good. The timing ofestimated expenditures coincides with that of actual expenditures atmost of the recorded turns: the peaks in 1957 and the troughs in 1958,1961, and 1963. The behavior of in the vicinity of its peak in thesecond quarter of 1960 is not well reproduced in the estimates, whichwere somewhat too low at the time but too high in the preceding andsubsequent intervals, that is, in IV-1959 and IV-1960 and 1-1961.There is also a one-quarter lag of (!)est behind 1 at the minor peak of/ in 1962.
Comparisons with Other EstimatesKareken and Solow estimate by least squares the equation
= —7.330 + .3 + R2 = .9927 (KS)(.040) (.009)
where is the FRB index of production of business equipment (1957= 100) and is the OBE series on new orders for nonelectrical ma-chinery, deflated by the BLS index of wholesale prices for machineryand motive products (1947—49 = 100). Both series are monthly andseasonally adjusted and cover the period from April 1947 to April1960.48
To approximate the period covered by Kareken and Solow, theirresults are compared with a similar distributed-lag regression basedon estimated fixed-investment commitments and outlays of business
4B See John Kareken and Robert M. Solow, "Lags in Fiscal and Monetary Policy," Research StudyOne for ihe Commission on Money and Banking, in Albert Ando et aL, Stabilization Policies,Englewood Cliffs, N.J., 1963, Part 1, pp. 25—30.

458 The Behavior of investment Commitments and Expenditures
Chart 9-8Regression Estimates for Business Total Fixed Investment Outlays,
Based on Transformed Variables, Quarterly, 1954—65
(It)est = .597 + —
+ — +

Indicators and Stages of Investment in Plant and Equipment 459
in 1949—6 1. Here the older data on orders must be used, which aloneare available before 1953 (as in the simple regressions of Table 9-1).My Koyck-type equation is
= 2.452 + ± R2 = .964; SE = 1.03 (Z)(0.828) (.101) (.058)
Using the symbols a for the first and b for the second of the slopecoefficients, let us compute for each of these two regressions:
a(1 — b'1) / a log (1 — q)1—b /l_b1 b orn= iogb
It will be recalled from Chapters 5 and 7 that q is the proportion of the"total effect" [a/(1 — b)] accounted for by an interval of n unit periods.
For five selected proportions, ranging from 30 to 90 per cent of thetotal response of investment expenditures to a unit change in com-mitments, the resulting lag distributions are as follows:
Value of q
n 0.3 0.5 0.7 0.8 0.9
For (KS) 2.6 5.0 8.7 11.6 16.7For (Z) 2.2 4.3 6.0 7.3 9.6
These figures suggest a slower reaction for the Kareken-Solow equa-tion than for my equation involving I and OC. In the first year, nosignificant difference appears: for n = 4, q = .425 in the former caseand q = .455 in the latter (where allowance is made for the initial two-quarter lead of OC relative to 1). But widening discrepancies can beobserved in comparing the times required to absorb more than 50per cent of the total response.
The meaning of such comparisons is, to be sure, rather uncertain,if only because the different explorations use very different data. Thereare, for example, these four sources of discrepancies between my re-suits and those of Kareken-Solow: (1) their use of output rather thanexpenditures; (2) their use of the equipment component only, excludingplant; (3) their use of nonelectrical machinery orders only, rather thana more comprehensive orders aggregate; and (4) their reliance on seriesin "real" terms. General knowledge of the data suggests that (2) and

460 The Behavior of Investment Commitments and Expenditures
(3) are the most important of these sources, while (4) makes probablyless of a difference and (1) perhaps still less. The OC series or ratherits orders component should, despite its weakness, be definitely prefer-able to N. It is a much more comprehensive indicator of investmentorders and therefore more suitable for use in connection with invest-ment realization for equipment, whether the latter are measured byoutput or expenditures.
Kareken and Solow also estimated some distributed-lag relationshipsof a higher order by including additional lagged values of the dependentvariable (B1_2 and in the regressions of on and B,_1. Thisleads from the geometrically declining to unimodal lag distributions.The resulting lag structures are more concentrated; e.g., within thespan of five quarters, one half of the total response is accounted forwhen only one lagged term is used, but with two terins the proportionrises to 56 per cent, and with three terms to 65 per cent. Shifts in thesame direction are implied by my estimates in Table 9-3.
The relation between new capital appropriations and investmentexpenditures has recently been estimated for total manufacturing andseventeen subdivisions by Shirley Almon.49 This study, based on theNICB large-company data for 1953—61, presents a new method ofestimating distributed lags that employs polynomial interpolationsbetween a few points obtained from regressions. Almon selects aneight-quarter lag distribution for "all manufacturing" as yielding thebest fit and the most stable weights. The proportions of appropriationsspent, according to this model, are 15 per cent within the first half year,45 per cent in a year, 77 per cent during the first six quarters, and 92percent by the end of two years. The distribution is roughly symmetric,with the half-way point in spending being reached just after the fourthquarter.
The geometric and second-order models used previously yield, ofcourse, highly skewed lag distributions that tail off slowly in an asymp-totic fashion in the direction of long lags; this is quite unlike Almon'sdiversified but in general much more symmetrical patterns, with finitenumbers of periods (mostly seven to nine quarters) in each distribution.The choice of the model of the lag distribution usually has to be madeon empirical rather than theoretical grounds, and the statistical results
"The Distributed Lag Between Capital Appropriations and Expenditures," Economeirica,January 1965, pp. 178—96.

Indicators and Stages of Investment in Plant and Equipment 461
as well as criteria are far from clear-cut. Hence, in practice, lag struc-tures are commonly estimated by some more or less arbitrary andintuitive procedures, used partly because of computational coriven-ience. Relatively small differences in the calculated regression coeffi-cients can result in large differences between the associated lagpatterns.50 Consequently, it is very difficult to establish such patternswith any substantial precision. The more modest objective of estimat-ing the average and perhaps also the variance of a lag distributionhas a much greater chance of being reasonably well attained. Differentmodels that inevitably yield very divergent lag patterns may well bein essential agreement on the length of the average lag. Thus theaverage lags of three to five quarters reported for the investment func-tions in the two preceding sections are approximately consistent withthe average lag of somewhat more than four quarters that is impliedby the all-manufacturing equation of Almon.5'
Other equations for investment in plant and equipment that wereexamined employ "causal" variables, such as sales, profits, capitalstock, and interest rates, either alone or in combination with "symp-tomatic" variables, such as appropriations, commitments, and antici-pations. The lag patterns suggested by such functions are discussedand compared in the next chapter.
Summary
Series on new investment commitments—capital appropriations,orders, and contracts—reflect the change in the demand for servicesof capital goods that is embodied in the "investment decision." On theother hand, business expenditures on plant and equipment are typicallyconcentrated in later stages of the investment process and also dependon the developments on the supply side—along with production, de-liveries, and installations. A hypothesis that assigns to investment themajor causal role in business cycles does not require that capital out-lays lead aggregate production and income (actually, they tend to lag),but it presumably does require, among other conditions, that invest-ment commitments lead, which they do.
50See Zvi Griliches, "Distributed Lags: A Survey," Econometrica, January 1967, pp. 29—3 1.If the contracting stage is thought of as following upon the appropriations stage, the lags using
appropriations ought to be the longer ones, but the differences on this account may not be large(also, orders may sometimes precede appropriations).

462 The Behavior of Investment Commitments and Expenditures
Estimates of aggregate investment commitments can be obtained byadding the value of new orders received by industries mainly producingmachinery and equipment to the value of new contracts for industrialand commercial construction. The resulting series (OC) has variousshortcomings — most. particularly, its equipment component is too largerelative to its plant component—but this appears to affect chiefly thelevel of, not the relative changes in, these data. The time-path of busi-ness capital expenditures (1) resembles the course of new investmentorders and contracts, but the fluctuations in I lag behind those in OCand have smaller percentage amplitudes. Most of the lags recorded atthe cyclical turning points in these series are two- or three-quarter lags.
New capital appropriations of large manufacturing corporations(App) are roughly coincident with OC. The highest simple correlationswith I are observed when App is taken with a lead of three quartersrelative to I (r = .89) and when OC is taken with a lead of two quarters(r= .94).
The so-called first anticipations of plant and equipment expenditures(A show a higher correlation with actual expenditures (I) than anyother investment indicator. The close association between the twoseries is not surprising, since they have the same source and coverageand, importantly, since A1 predicts I in the next quarter, that is, with avery short lead. Investment products typically take more time to ges-tate; consequently, the quarterly anticipations express not planned butexpected expenditures. In other words, at this late stage, outlays arealready largely known from previous commitments; remaining to be"anticipated" is how they will be allocated between the current andnext quarters and the further future. The commitments series OC andApp, when taken with subscripts (t — 3), have effective forecastingleads relative to that are much longer than the lead of A Theseseries can give early signals of turning points in expenditures, whileanticipations can only give current recognition of these turning points.
The estimates of business capital outlays improve when distributedlags are used. For example, when is regressed on andthe calculated series coincides with the actual one at turning pointsand, on the whole, the observed discrepancies are not large. Autocor-related disturbances present a problem, but this can be handled ratherwell by using modified first differences of the variables. Highercorrelations are obtained with equations that include, in addition to

Indicators and Stages of Investment in Plant and Equipment 463
the selected terms in earlier commitments, the previous values of thedependent variable, i.e., of expenditures. However, although theresidual errors are then on the whole very small, they contain system-atic elements, as manifested in short lags of the estimates at severalturning points.
The distributed-lag regressions suggest that the average lags of Ibehind OC vary between three and five quarters. At least half of theexpenditures are made within one year after commitment; two-thirdsor more, within the first six quarters. There are some indications sup-porting the hypothesis that the lags vary directly with the degree ofcapacity utilization in the capital-goods-producing industries. Thuswhen the coefficients in the equation for expenditures on equipment areassumed to depend on the backlog-shipments ratio for equipmentmanufacturers, rises (falls) in that ratio produce relatively large in-creases (decreases) in the estimated lag of expenditures.