indicators to assess the effectiveness of climate · pdf fileeffectiveness of climate ......
TRANSCRIPT
Indicators to Assess the Effectiveness of Climate Change Projects
Impact-Evaluation GuidelinesTechnical NotesNo. IDB-TN-398April 2012
Nancy McCarthy Paul Winters
Ana Maria Linares Timothy Essam
Office of Strategic Planning and Development Effectiveness, Inter-American Development Bank

This page has been intentionally left blank.
Indicators to Assess the Effectiveness of Climate Change
Projects
Inter-American Development Bank
2012
http://www.iadb.org The Inter-American Development Bank�Technical Notes encompass a wide range of best practices, project evaluations, lessons learned, case studies, methodological notes, and other documents of a technical nature. The information and opinions presented in these publications are entirely those of the author(s), and no endorsement by the Inter-American Development Bank, its Board of Executive Directors, or the countries they represent is expressed or implied. This paper may be freely reproduced.
Nancy McCarthy. President LEAD Analytics, Washington, DC. [email protected]
Indicators to Assess the Effectiveness of Climate Change Projects
Abstract
Nancy McCarthy,1 Paul Winters,2 Ana Maria Linares,3 Timothy Essam4
Determining reasonable indicators for climate change projects is complicated by the long-term horizon of both mitigation and adaptation project impacts as well as the uncertainty associated with climate change impacts. Actions taken now are often designed to have an impact in the uncertain and distant future and may not directly mitigate or adapt to climate change, but be taken as a step to prepare for future actions. Further complicating identification of indicators is the fact that there is a spectrum of projects, from the pure climate change-focused projects to those that provide climate change benefits as one part of an overall development program, and finally to those with only incidental indirect effects. The objective of this document is to discuss SMART (Specific, Measurable, Achievable, Realistic and Timely) indicators that can be used for assessing the impact of climate change projects, including those that seek to adapt to the expected impacts of climate change and those that promote low carbon emissions growth strategies to mitigate greenhouse gases.
JEL Classification: H43, Q54, Q56, Z18
Keywords: climate chance, indicators, development effectiveness, impact
evaluation
1 President LEAD Analytics, Washington, DC. [email protected] 2 Associate Professor. Department of Economics, American University, Washington, DC. [email protected] 3 Sector Lead Specialist. Office of Strategic Planning and Development Effectiveness. Inter-American
Development Bank, Washington, DC. [email protected] 4 PhD Candidate. Agricultural and Resource Economics. University of Maryland, College Park, MD.
1
Table of Contents
1. Introduction 3
2. Challenges in Identifying Climate Change Indicators for the IDB 3
2.2 Development and Additionality 4
2.2 Addressing Climate Change 5
2.3 Identifying Indicators 8
3. Indicators for Examining Projects Related to Adaptation 9
3.1 Stages of Adaptation Projects and Indicators 10
3.2 Developing Adaptation Indicators, Some Examples 14
3.2.1 Outputs and Outcomes from Initial Stages 14
4. Indicators for Examining Projects Related to Mitigation 17
4.1 Stages of Mitigation Projects and Indicators 20
4.2 Developing Mitigation Indicators and Some Examples from Current Projects 22
5. Potential Pitfalls and “Indicators” to Avoid 25
5.1 Specific 25
5.2 Measurable 27
5.4 Achievable 29
5.4 Relevant 29
5.5 Timely 30
6. Conclusions 31
References 32
2
1. Introduction The Inter-American Development Bank’s (IDB) Ninth General Capital Increase sets a target of
25% of total lending to support climate change initiatives, sustainable energy and environmental
sustainability. This is a substantial increase from the 2006-2009 target of 5% of lending to these
areas and is to be achieved by 2015. The new target will lead to increased lending in these areas,
particularly in climate change projects.
In order to ensure that the increase in spending on climate change is effective at bringing
about development, it is necessary to carefully design monitoring and evaluation systems that not
only ascertain the actions taken as part of projects, but also identify the impact of the projects. A
key part of a good monitoring and evaluation system is to have quantifiable indicators that are
SMART (Specific, Measurable, Achievable, Realistic and Timely). The objective of this
document is to discuss indicators that can be used for assessing the impact of climate change
projects, including those that seek to adapt to the expected impacts of climate change and those
that promote low carbon emissions growth strategies to mitigate greenhouse gases.
Determining reasonable indicators for climate change projects is complicated by the
long-term horizon of both mitigation and adaptation projects as well as the uncertainty associated
with climate change impacts. Actions taken now are often designed to have an impact in the
uncertain and distant future. Additionally, current actions may be taken not to directly mitigate or
adapt to climate change, but as a step to prepare for future actions that achieve the ultimate
objectives of mitigation and adaptation; the latter is often the case for climate change policy-
based loans. For this reason, before discussing indicators in detail, Section 2 discusses the
specific challenges of identifying climate change indicators with specific reference to how the
IDB manages projects and the overall climate change strategy. This is followed by a discussion
of indicators that can be used for projects focusing on mitigation in Section 3 and then, in
Section 4, those that can be used for adaptation projects.
2. Challenges in identifying climate change indicators for the IDB
To address the long-term and uncertain nature of climate change impacts, the IDB has developed
a Climate Change Strategy to identify courses of action for assisting borrowing countries in
addressing climate change concerns. While the strategy must maintain a long-term vision of how
to address climate concerns, the nature of development banks is that their loan operations tend to
3
be short-term, about two to six years, and target a wide range of sectors. An initial key challenge
in any attempt to develop indicators is how to determine what intermediate indicators suggest
long-term success in addressing climate change. What is required are metrics that are indicative
of clear progress being made towards long-term mitigation and adaptation objectives. In this
section, we consider these challenges first addressing this issue of what constitutes a climate
change project and then how to address climate change in the long term within the context of
IDB procedures for evaluating loan performance.
2.1 Development and Additionality
Part of the challenge, particularly with respect to adaptation, is that the ability to address climate
change is reflected in a country’s level of development. In general, the more developed a
country, the more resilient it is likely to be to climate change. Providing funds that assist in the
development of a country could potentially be viewed as supporting climate change adaptation.
The link between development and the ability to address climate change creates a risk that
existing development projects will simply be repackaged as climate change projects, resulting in
little new action. While overall development plays an important role in addressing climate
concerns, clearly the point of having a specific strategy is to take additional actions to deal with
climate-related issues. As such, the IDB’s climate change strategy and projects it prioritizes, and
the corresponding indicators of success of those projects, will seek to provide additionality—that
is, will take actions beyond what is already done.
To consider more carefully the issue of additionality, three types of projects that relate to
climate change can be identified. The first type, which might be called direct projects, consists of
those projects specifically addressing climate concerns. These are projects that are designed
explicitly to mitigate greenhouse gas emissions, to adapt to anticipated changes in climate, or to
take the steps necessary to meet those objectives, such as obtaining the necessary information on
climate risks, identifying the most cost-effective means to mitigate greenhouse gases (GHGs), or
setting up the institutional structures and mechanisms that enable government bodies to
effectively address climate change in an integrated and coherent manner. In this case, indicators
should be included that either show direct impact on adaptation or mitigation, or progress
towards reaching those goals.
4
The second type of project includes those that have a broader development agenda, but
have clear mitigation or adaptation components in addition to the broader agenda—additional
projects. For example, as one component of an overall tourism strategy, a tourism project may
create a national park that may have the climate benefit of reducing deforestation. An
agricultural project may promote crop and land management practices that reduce long-term
vulnerability to climate change, but also improve short-term profitability. A reform of the
electricity generation and distribution system may include a combination of actions designed to
improve the efficiency of the system as well as actions that lead to investments that reduce
emissions (relative to what would have been done otherwise). Although not the sole focus of the
project, in these cases there are actions that clearly link to climate change and that provide
additionality. Of course, if a project claims additionality in terms of benefits addressing climate
concerns, the project monitoring and evaluation system should include indicators explicitly
measuring these benefits.
The final type of project comprises those in which benefits for mitigation or adaptation to
climate change are incidental or “serendipitous”. These serendipitous projects include many
general development projects as well as specific ones, particularly in the areas of agriculture,
energy, transport, tourism, etc. While such projects may have incidental climate change benefits,
to the extent that they would have been undertaken without any change whatsoever in design,
evaluation or implementation, they would not provide additionality. In general, if no climate
change-specific outputs or outcomes are identified outside of general development, then clearly
one cannot identify corresponding SMART indicators.
Of course, there will be a spectrum of projects from the pure climate change-focused
projects to those with only incidental indirect effects. If a project claims climate change-related
benefits, those should be measured as one of the indicators identified to determine the project’s
development effectiveness.
2.2 Addressing Climate Change
Beyond identifying climate change outputs and outcomes within the scope of the project, another
challenge to identifying indicators relates to the long-term nature of climate change and thus the
time horizon required for addressing it. Given the relatively short-term horizon of development
projects, it is likely to make sense to view each project as part of the incremental steps a country
makes to address climate change. Each country must determine the set of activities that are
5
necessary to address climate change and order them in a manner that ensures progress is being
made towards the ultimate goals of adapting to changes in climatic conditions and mitigating
GHGs. In order to see how IDB projects might fit into this country-level planning, we consider
the set of activities required for such planning.
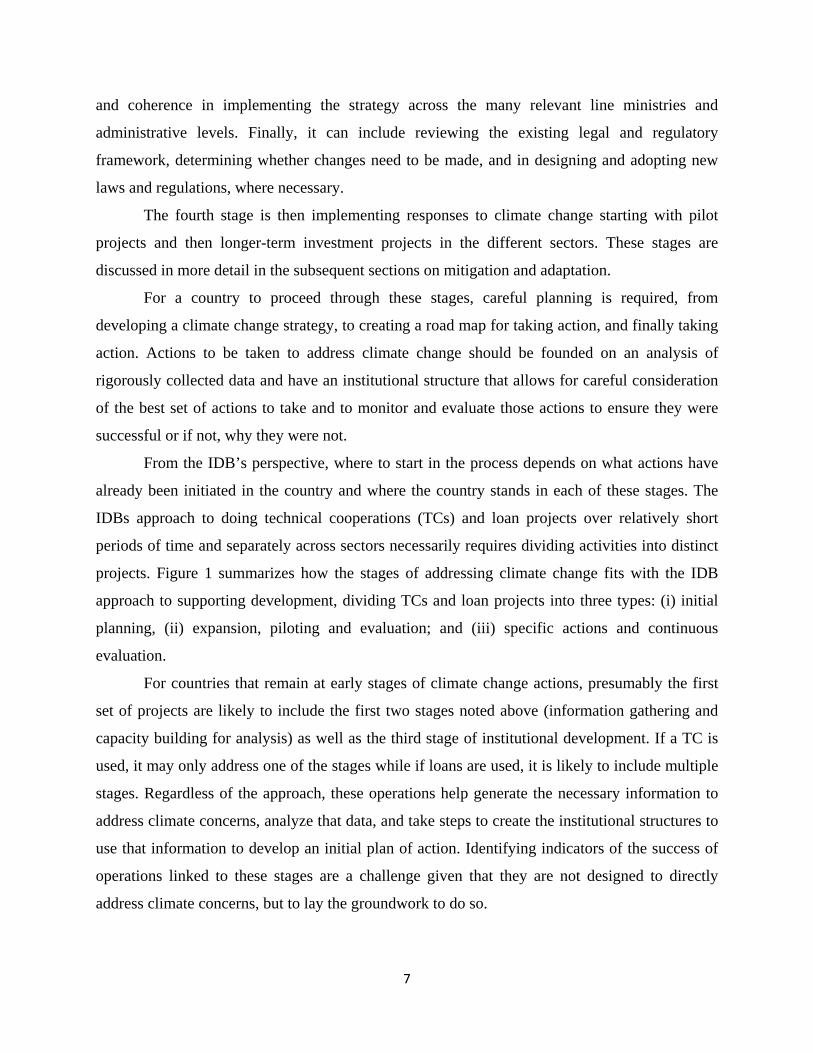
For a country initiating a climate change adaptation and mitigation strategy, four sets of
activities or “stages” that will lead to an increased ability to mitigate GHGs and adapt to climate
change (see Figure 1) are envisioned. The first two stages are closely inter-related; the collection
of information needed to evaluate how different projects and investments will fare in the face of
climate change, and the development of national capacity to analyze that information. To address
climate concerns, information is required on the sources of GHGs and potential impacts of
changing climatic conditions on weather patterns, sea rise, glacial melt, etc. Correspondingly,
information needs to be systematically analyzed to understand what is happening and what
potential responses can be taken. The collection of information and capacity to analyze that
information lays the groundwork for future country-level activities.
Figure 1: Addressing Climate Change
The third stage, which may occur concurrently with the first two, includes a wide range
of activities focusing on building institutional capacity to effectively address climate change.
This can include building technical capacity for using the analyses to prioritize and implement
mitigation and adaption actions at the national, sub-national and local levels. It may also include
designing appropriate institutional structures and coordination mechanisms to ensure consistency
6
and coherence in implementing the strategy across the many relevant line ministries and
administrative levels. Finally, it can include reviewing the existing legal and regulatory
framework, determining whether changes need to be made, and in designing and adopting new
laws and regulations, where necessary.
The fourth stage is then implementing responses to climate change starting with pilot
projects and then longer-term investment projects in the different sectors. These stages are
discussed in more detail in the subsequent sections on mitigation and adaptation.
For a country to proceed through these stages, careful planning is required, from
developing a climate change strategy, to creating a road map for taking action, and finally taking
action. Actions to be taken to address climate change should be founded on an analysis of
rigorously collected data and have an institutional structure that allows for careful consideration
of the best set of actions to take and to monitor and evaluate those actions to ensure they were
successful or if not, why they were not.
From the IDB’s perspective, where to start in the process depends on what actions have
already been initiated in the country and where the country stands in each of these stages. The
IDBs approach to doing technical cooperations (TCs) and loan projects over relatively short
periods of time and separately across sectors necessarily requires dividing activities into distinct
projects. Figure 1 summarizes how the stages of addressing climate change fits with the IDB
approach to supporting development, dividing TCs and loan projects into three types: (i) initial
planning, (ii) expansion, piloting and evaluation; and (iii) specific actions and continuous
evaluation.
For countries that remain at early stages of climate change actions, presumably the first
set of projects are likely to include the first two stages noted above (information gathering and
capacity building for analysis) as well as the third stage of institutional development. If a TC is
used, it may only address one of the stages while if loans are used, it is likely to include multiple
stages. Regardless of the approach, these operations help generate the necessary information to
address climate concerns, analyze that data, and take steps to create the institutional structures to
use that information to develop an initial plan of action. Identifying indicators of the success of
operations linked to these stages are a challenge given that they are not designed to directly
address climate concerns, but to lay the groundwork to do so.
7
The second set of IDB operations are likely to move beyond focusing on preparing to
address climate change to taking initial actions to mitigate GHG emissions and adapt to climate
changes as determined by the strategies and plans determined in the initial projects. As such they
are less likely to be TCs but loan projects. Presumably, these projects would include pilot
projects in both mitigation and adaptation with specific climate change-linked objectives and
indicators that identify whether those objectives are met. Of course, these projects would also
involve continued information gathering and capacity building. Over time, the expectation is that
an increasing emphasis will be placed on obtaining information and developing capacity to
evaluate climate change projects to determine what works and achieves identified objectives and
what does not.
The last set of IDB-supported projects would then involve more large scale projects at the
national, regional and sectoral level. Since these involve broader projects and actions, the
associated indicators would presumably measure the ultimate objectives of a climate change plan
of action; namely, those linked to mitigation and adaptation. In some cases, these indicators may
be measures directly linked to climate change, such as reduced GHG emissions or reduction in
indicators of vulnerability, while in others they would be indirect measures, such as changes in
forest cover that are clearly linked to climate change.
2.3 Identifying Indicators
As noted, some countries are likely to be further along than others. The appropriate set of
indicators for a given project depends on what stage a country is at and the types of TCs and loan
projects being implemented.
Because of these factors, evaluating the success of an individual climate change project is
challenging. As with any development project funded by the IDB, the indicators for an individual
project must be SMART and vertically logical—going from inputs, to outputs, to outcomes and
finally to impacts. For the reasons noted above, understanding the set of indicators included in an
individual project is difficult unless presented in the broader context of the country’s long-term
climate change plan. This is true of pure climate change projects, which should advance the
overall climate agenda, as well as mixed development-climate projects which include a well-
defined climate change sub-component.
In any case, the functional relationship between indicators and both project and ultimate
objectives need to be well articulated. This is important for technical cooperations, and
8
particularly important for policy based loans. Policy based loans have an additional “Policy
Matrix”, which has indicators to measure whether certain policy activities have led to identified
outputs. The trick here is to be very specific about the links between policy outputs and the
outcomes and impacts found in the Results Matrix. The logic of the text should make clear how
policy related activities relate to the outcomes that are specified in the Results Matrix, and the
respective indicators should capture whether the policy-based outputs led to outcomes and long-
term impacts.
In the next section, we discuss indicators for climate change adaptation projects
following the four stages developed above, and end the section with examples of indicators for
outputs and outcomes. In the fourth section, we discuss indicators for mitigation projects. Since
the first three stages related to mitigation are similar to those for adaptation, at the end of
mitigation section, we focus on developing indicators for the final “implementation” stage,
primarily because there are already mitigation projects up and running. In the fifth section, we
discuss “pitfalls” that project developers often run into when constructing indicators, and provide
examples from existing projects and programs to highlight these problems. Concluding
comments are provided in the sixth section.
3. Indicators for Examining Projects Related to Adaptation
Climate change is predicted to alter mean temperatures and precipitation in the longer run, but is
also expected to lead to greater climate variability in the short- to medium-term. There is still a
great deal of uncertainty regarding likely changes in both the mean and the variability of both
temperature and precipitation, though likely scenarios for changes in mean temperature are more
certain, at least at coarse levels (IPCC, 2007; Parry et al., 2007; Rosenzweig & Tubiello, 2006).
Following the IPCC definition, “adaptation to climate change refers to adjustment in natural or
human systems in response to actual or expected climatic stimuli or their effects, which
moderates harm or exploits beneficial opportunities”5. Adaptive capacity, according to the IPCC,
is the “ability of a system to adjust to climate change, including climate variability and extremes,
to moderate potential damages, to take advantage of opportunities, or to cope with the
consequences.” In the shorter term, countries are likely to focus on increasing adaptive capacity
in order to mitigate damages associated with increased variability and extremes.
5 The glossary can be found at: http://www.ipcc.ch/pdf/glossary/tar-ipcc-terms-en.pdf
9
At the same time, many observers have noted that many countries are already vulnerable
to shocks, either to price shocks, non-climate-related disasters (e.g. earthquakes, volcanic
eruptions), and to climate-related disasters. This current vulnerability is often termed an
“adaptation-deficit” (Parry et al., 2007; Burton, 2004). As many observers have noted, reducing
vulnerability and increasing system resilience makes it difficult to separate “development” from
actions taken specifically to address climate change. If we consider the trichotomy of potential
projects developed in section 2 (direct, additional, serendipitous), projects that aim to increase
the ability to address adaptation deficits directly linked to climate-related disasters are likely to
fall within the additional category.
3.1 Stages of Adaptation Projects and Indicators
Considering the stages noted in Table 1, we first jointly consider collection of information (stage
1) and analyses (stage 2). Because of the uncertainty surrounding climate change, initial
adaptation projects will likely be aimed at identifying key sectors and/or geographic regions that
are predicted to suffer most from any change in climate. To do this may mean downscaling
existing global climate models, coupling these with hydrological or other bio-physical process
models, and generating scenarios that also incorporate socio-economic information. This type of
scenario analysis allows policymakers and investors to consider how any one type of project
might fare under the range of likely climate outcomes. This differs from relying on past events
only, in that information on potential future events, which can differ from the past events, is
incorporated to give a richer risk profile of the investment. As an example of a directly climate
change-relevant investment, consider coastal zones with the necessary infrastructure to currently
cope with tidal waters. These zones may still be vulnerable to any changes in water levels and
flows outside of historic experience; a risk analysis would help clarify the reinforcements
necessary to manage climate change-related increases in the risk of flooding and degradation of
the coastal zone. As an example of an additionality project, consider a region heavily dependent
on rainfed agriculture that already suffers from intermittent hurricanes and where new
investment is being considered. Additionality can be captured by scenario analysis that
incorporate best available evidence on likely climate changes. For example, it may be used to
evaluate different irrigation infrastructure specifications in terms of flexibility to respond to a
wider range of climate realizations. Or, it may be used in valuing greater reductions in
production risk from various seeds, given potential climate realizations.
10
The above examples focus on information collection and capacity to analyze data, the
outputs are datasets and capacity to use that data to evaluate different investments and policies.
The outcome is that the knowledge generated based on this information and capacity is used to
guide and prioritize public policy, as well as public and private investments, to increase the
ability of the country, its sub-national governments, its sectors and its people to manage climate
variability and to adapt to longer-term climate change trends (thus, it is an input into stages 3 and
ultimately 4). The broad impact is that national, sub-national, local and household goals for
development are not imperiled by climate change.
The third stage is to build institutional framework, or the “enabling” framework, to
support adaptation and improved adaptive capacity at all relevant levels. This is perhaps one of
the more difficult types of project for which to develop SMART indicators. In this case, then, it
is best to disaggregate the type of institutional capacity that the project focuses on. Such projects
often focus on the legal framework, on institutions to disseminate information and obtain
feedback, on developing institutions that respond to climate change shocks, on promoting
adaptation and flexibility in the longer term, and developing linkages across relevant
stakeholders and scales to enable efficient and equitable responses to climate change. In terms of
the legal framework, examples would include drafting and enforcing regulations related to
building codes updated to reflect potential climate change, alterations in land use and zoning
restrictions, and, in some cases, clarification of the bundle of real property rights. It would also
include ensuring that such sector-specific laws and regulations were harmonized and consistent
across sectors.
The above would be direct climate change projects. Institutional projects might also have
additional climate change sub-components. For instance, a project might focus on restructuring
social safety net programs, with a specific sub-component focusing on responsiveness to
increased frequency of climate shocks (Parry et al., 2009; Heltberg, 2009). Or, a project focusing
on improving the effectiveness of rural extension might include a sub-component that addresses
the capacity of the extension system to develop climate change-relevant materials, and the ability
to disseminate such information.
Finally, adaptation projects often include activities to strengthen institutional capacity to
develop effective linkages and communications pathways across different relevant actors. These
can include linking local, sub-national and national government agencies (vertical), linking
11
across different government agencies at the various levels (horizontal), or linking different types
of actors (civil society organizations, local government and research institutes).
The above examples focus on projects aimed at building institutional frameworks and
mechanisms to address climate change adaptation, and the main output is increased capacity to
implement adaptation and adaptive capacity actions. The outcome is that institutions effectively
implement a climate change strategy that comprehensively addresses climate change adaptation,
that information is broadly shared across relevant stakeholders, that all levels of government
effectively respond to climate-driven shocks, and that linkages developed among different actors
lead to greater adaptive capacity and wider potential to adapt to climate change across sectors
and geographic regions.
The fourth stage focuses on operationalizing actions to support adaptation and improve
adaptive capacity. While developing indicators for such projects are easier than for the
knowledge and institutional capacity building projects mentioned above, they also cover a wide
range of sectors, including agriculture, forestry, coastal zone management, health systems,
buildings, transportation and energy. Second, many of these projects will fall into the second
category of additional projects enumerated above – those with broad development goals but
which also have a specific adaptation component. Clarity in identifying the additionality of
incorporating climate change adaptation component is required in order to develop SMART
indicators. For instance, the design and implementation of a soil and water conservation project
for farmers under existing conditions may well differ from both design and implementation when
considering potential future climate scenarios. Similarly, a public health project addressing
vector borne diseases may include an additional component to include information on potential
changes in the vectors’ geographical distribution. A buildings or transportation project may
include an additional component to evaluate optimal design and materials when incorporating
potential future climate stresses.
In other cases, an adaptation may be realized from an existing project proposal without
any specific adaptation component –the serendipitous projects mentioned above. In other words,
development benefits and adaptation benefits are joint products from the same project.
Depending on the project, it may still be relevant to develop indicators of this additional benefit;
documenting such benefits will help in prioritizing future allocations and in preparing cost-
benefit or cost-effective analyses where these will be undertaken. Many current projects also
12
have activities that (it is hoped) yield multiple benefits, for instance many sustainable land
management techniques are already expected to generate both economic and environmental
benefits. Such techniques may also increase adaptive capacity directly through improved soil
structure and soil moisture management, reducing yield losses in extreme weather event years.
The latter is an example that is a bit “more” than serendipitous, but less than a clear stand-alone
sub-component and highlights that there are really a range of project types. One way to consider
where on the spectrum the adaptation falls is to consider whether there is a direct adaptation
benefit (improved soil stability=improved adaptive capacity), or whether the benefit is very
indirect, e.g. expanded rural labor employment opportunities outside of agriculture (increased
access to more stable and diverse income sources enables households to absorb shocks no matter
what the source –droughts and floods, but also illness, earthquakes, crime).
Another related issue concerns the construction of baseline scenarios. Baselines can be
tricky when the benefits are realized over long time periods. With actions that directly affect
adaptation and that require costly outlays, then the assumption that the project’s outputs would
not be generated in the absence of project is generally justifiable. However, with actions that
have co-benefits, it is more difficult to determine how the future would unfold in the absence of
the adaptation project, since resources may already be dedicated to capture the co-benefits,
making constructing a “business as usual” scenario more difficult. The latter is closely linked
with the concept of additionality in mixed development/adaptation projects.6 Additionally, the
direct benefits are often reduced damages. The baselines and “business as usual” scenarios must
then be able to capture higher damages that would occur in the absence of the project; that is,
negative impacts would be dampened, but often still negative. In certain cases, it may be
relatively easy to measure current and future damages in the absence of a project, e.g. using
current information on mortality or property damage trends.
The number of direct adaptation projects with clear indicators is limited making it
difficult to provide specific examples of actual projects with SMART indicators. Instead, in the
section below, we provide a few examples of output and outcome indicators that are illustrative
of some of the projects we discussed above.
6 With purely serendipitous projects, the baseline and “business as usual” to capture future time periods reflects
changes that would occur with projects whose objectives are to achieve different goals from climate change adaptation (e.g. increase resilience to climate change shocks, improve disaster preparedness, both with respect to current climate conditions).
13
3.2 Developing Adaptation Indicators, Some Examples
The specific indicators to be included in an IDB project depend on whether they are TCs, policy-
based loans or investment loans, and whether they involve individual or multiple stages and
which stages are included. In the following, we present some examples of projects for each of the
four stages, recognizing that many projects will include two or three stages.
3.2.1 Outputs and Outcomes from Initial Stages
1. Project to collect data required to perform vulnerability assessments to droughts and floods.
Outputs: Datasets on current exposure to floods and drought, Downscaled climate predictions
model datasets matched with current exposure datasets, Datasets for baselining socio-
economic scenarios.
Indicators: Number of exposure and socio-economic datasets produced at national and sub-
national levels, Geographic coverage of all datasets (% of all exposed areas), Number of
reports detailing data collection and summarizing information.
Outcome: Datasets used by relevant ministries to generate vulnerability assessments.
Indicators: Number of policy & technical documents based on datasets and modeling
scenarios.
2. Building national, and where relevant, local technical capacity to generate vulnerability
assessments to droughts and floods.
Outputs: Technical staff acquires competence in computer modeling techniques and able to
perform vulnerability analyses (VA).
Indicators: Number of technical staff trained; Average staff performance on end-of-training
comprehension tests; Proportion of national-level ministries using datasets to generate
vulnerability analyses or proportion of “relevant” sectors covered by analyses at national
level (Note: project would need to define “all relevant ministries” or “all relevant sectors” in
order to determine the proportion actually using the datasets); Proportion of regions or
provinces using datasets to generate vulnerability analyses.
Outcome: Policymakers and other key stakeholders are familiarized with VA’s; Results used
to set priority areas for investment across agencies, sectors, and geographic levels.
14
Indicators: Number of policy & technical documents incorporating results from VA’s,
Proportion of government investment/program documents using results from VA’s as a
priority-setting or screening tool.
3. Build institutional framework and mechanisms to support adaptation and adaptive capacity.
a. Legal framework for REDD+ activities (c.f. Greiber, 2009) that provide both mitigation
benefits and increased adaptive capacity.
Output: Laws that clarify the bundle of property rights to forest resources and at forest
margins; laws specifying who has rights to carbon stored in forests and forest margins and
procedures to transfer carbon rights both domestically and internationally; regulations and
guidelines developed on carbon contract terms; dispute resolution mechanisms established;
legal “literacy” programs and dissemination strategies developed and implemented.
Indicators: Number of laws and regulations created or amended to clarify land and carbon
property rights; existence of a dispute resolution mechanism; number of materials
(presentations, briefs, papers) developed for legal literacy programs, number of people
participating in legal literacy programs.
Outcome: Reduced transactions costs for individuals and community groups to access
REDD+ financing, broad-based participation in such projects and increased adaptive capacity
for participants.
Indicators: Number of individuals and community groups participating in REDD+ financed
projects; average number of days and money spent in project preparation; total value of
projects and value per participant; % reduction in production variability from forest-based
activities and/or farm production at the forest margins, for participants versus non-
participants.
b. Information dissemination.
Output: Climate change-related information on increased health and property hazards and
response recommendations communicated; climate change-relevant information included in
rural extension materials.
Indicators: Number of early warning and health hazards dissemination outlets, by type of
outlet (e.g. radio, newspaper, website), geographic coverage, level of disaggregation of
15
system information (e.g. province-specific or district-specific); % languages used in
dissemination materials of total number of languages spoken in country; number of extension
materials containing climate change-relevant materials; % change in government budget
allocations towards climate change information dissemination.
Outcome: People, firms and government staff at all levels are prepared for climate shocks,
and have the resources and capacity to respond to climate shocks, limiting damages to
persons and to personal property.
Indicators: % reduction in property damage; % reduction in income variability; % reduction
in mortality and in disease prevalence for diseases related to weather patterns (e.g. malaria,
dengue).
4. Invest in projects that directly support adaptation and improve adaptive capacity.
a. Public investment in in-situ and ex-situ seed banks.
Outputs: Wide range of seed varieties developed, documented and made available in the
market, as needed.
Indicators: % increase in the number of seed varieties held ex-situ and maintained in-situ;
Documentation of seed varieties and their characteristics; Documentation of procedures and
partnerships created to transfer seeds either directly to farmers or to market traders; %
increase in number of seed varieties available in rural markets.
Outcomes: Farmer’s have access to, and utilize, wide range of seed varieties both to improve
performance in the face of climate shocks in the short-term and to successfully adapt to
climate change in the long term; greater and more stable production leading to greater food
security in rural and urban areas.
Indicators: Number of climate resistant seed varieties available in the market (“market” to be
defined), % increase in use of climate resilient seed varieties; % crop yield improvement in
years of climate extremes; % greater performance in average crop yields; % decrease in
proportion of rural and urban populations malnourished (acknowledging difficulty in
attribution for the latter indicator).
16
b. Project to improve ability of energy facilities to withstand climate shocks.
Outputs: Energy facilities built or retrofitted to withstand greater range of climate shocks.
Indicators: Number of facilities built or retrofitted under project; % of total capacity built or
retrofitted by type of facility and by “threat” level identified in vulnerability analyses.
Outcomes: Energy facilities able to continue operating and providing energy to all customers
to a wider range of climate extremes.
Indicators: % decrease in monetary damages to energy facilities due to climate extremes
(adjusted for degree, or extent, of climate shock); % decrease in customers losing access to
energy due to climate shock-induced power failures.
In all four stages, the long-term overall impacts are to increase resilience to climate
change through adaptation activities and pursue a low carbon-emissions growth strategy
consistent with overall economic development goals. Earlier stages are comprised of activities
that generate intermediate outputs that can be clearly linked to these ultimate impacts through a
“theory of change”. For instance, following the theory of evidence-based policymaking for
improved efficiency and effectiveness, data collection and model-building provide the
intermediate “outcome” that government staff use data and models in policy work, and this
intermediate outcome is used as an input, along with increased technical capacity to generate
knowledge using data and models, in order to generate knowledge necessary to undertake
priority-setting or to design screening mechanisms for resource allocation and public investment
decisions. These outcomes are then inputs into institutional capacity building and reform and into
implementation of concrete investments. And, the outcome of strengthened institutional capacity
building is also an input into the implementation of concrete investments. So, even with projects
that focus on the early stages, outcomes should be indentified within the larger “theory of
change” in which project outcomes will be embedded.
4. Indicators for Examining Projects Related to Mitigation
The Intergovernmental Panel on Climate Change (IPCC) Fourth Assessment Report (AR4)
states, with very high confidence, that the observed changes in global climate are very likely due
to the increase in anthropogenic greenhouse gas (GHG) concentrations. Human activities, such
as the burning of fossil fuels, the conversion of forests into agricultural land, and the
17
intensification of agricultural practices, have substantially increased the level of global GHG
emissions since the Industrial Revolution. In fact, if the world continues on this “business as
usual” path, global emissions are projected to increase by nearly 70% between now and 2050. To
reduce the likelihood of experiencing temperature increases between 2.5-7 degrees C above-
preindustrial levels by the end of the century, the world must act now to reduce greenhouse gas
emissions significantly. This process is concerned with the implementation of policies to reduce
GHG emissions and enhance sinks (IPCC, 2007).
Mitigation interventions can take a number of forms that align with the typology
discussed previously. At one end of the spectrum, pure mitigation projects may curb emissions
by replacing an old, carbon intensive technology with a clean technology or reforesting an area
to sequester carbon if such investments would not have been made otherwise (e.g. the high
carbon-emitting technology would be chosen again for replacement, without incentives to adopt
a low-carbon emitting alternative). The effectiveness of these projects tends to be measured by
the total amount of emissions reductions attributable to the intervention. Falling in the middle of
the spectrum are mitigation interventions that obtain emissions reductions while also delivering
economic development benefits. These are sometimes referred to as “no regrets” projects if the
emission reduction received under the project is a byproduct of initiatives that a country would
have pursued in absence of climate change. Many of the IDB’s energy efficiency or
transportation improvement projects may be considered “no regrets” in the sense that they are
good for development and deliver mitigation benefits; thus, these are either serendipitous or
mixed mitigation/development projects discussed above.
Assessing the effectiveness, in terms of emissions reductions, for these types of
interventions is challenging since it is often difficult to establish a counterfactual emissions
scenario against which post-project emissions levels can be compared. The World Bank also
notes “no regrets in the future” projects, which consist of actions that take into account the
potential regrets stemming from potential future carbon taxes, emissions caps or other related
regulations associated with high-carbon technologies (de la Torre, Fajnzylber, Nash, 2009). By
adopting an “early-mover” strategy, countries may be able to benefit to a larger extent from
international financing mechanisms that help with the transition to low-carbon technologies.
However, because there is much risk associated with these types of financial agreements
countries may be wiser to stick with no-regrets mitigation activities in the short term.
18
Before advancing to a discussion of the stages of mitigation interventions it is helpful to
expound on the prior point regarding international mechanisms designed to reduce global
emissions. The first of these mechanisms to be discussed is the Kyoto Protocol. With the signing
of the agreement in 1997, 37 industrialized (Annex I) countries committed themselves to
reductions in GHG emissions while the remaining signatories (non-Annex I countries), who
ratified the protocol, have hortatory responsibilities. The treaty was unique in that it set binding
targets for reducing GHGs emissions. To help guide industrialized countries with their emissions
reductions commitments, the United Nations Framework Convention on Climate Change
(UNFCCC) provided a set guidelines to be used by Annex I countries to establish national-level
inventories of GHG emissions, which are submitted on annual basis. The development of GHG
inventories is important to mitigation interventions because they allow countries to establish a
reference point against which they can track general trends and start to analyze the temporal and
cross sectional patterns in emissions. At the project level, the concept of a baseline inventory of
emissions is critical to assessing effectiveness in that it provides a reference point from which a
counterfactual scenario can be built and compared with post-project emissions levels to
determine impact.
Under the Kyoto Protocol, other flexible mechanisms were also introduced to help
industrialized countries achieve their emission reduction targets while limiting the effects on
their own economies. These included: i) emissions trading; ii) Clean development Mechanism
(CDM); and, iii) Joint Implementation. Of these mechanisms, the CDM is unique in that it
provides a standardized emissions offset instrument, known as certified emissions reductions
(CERs) to industrialized countries implementing sustainable development projects in non-Annex
I countries. To be eligible for CER credit, applicants must be able to demonstrate additionality,
or the idea that a project reduces emissions more than what would have happened otherwise.
While establishing additionality is most likely beyond the scope of most IDB-financed projects,
the evaluation methodology and indicators developed under the CDM process are promising for
assessing mitigation effectiveness at the project level.
The final climate agreement discussed here, the 2007 Bali Action Plan (BAP), was
primarily responsible for setting a course of action for a binding global climate agreement in
2009 at Copenhagen. Although a global agreement remains elusive, the BAP did introduce key
language concerning mitigation commitments and actions in developing countries, as well as
19
nationally appropriate mitigation actions in developing countries that were measurable,
reportable and verifiable. These terms, often referred to as MRV, are important because a future
climate agreement is likely to require countries to comply with MRV in order to have their
mitigation achievements recognized. The IPCC has devised three “tiers” for the purposes of
monitoring emissions reductions, with higher tiers corresponding to more data intensive
methodologies. Tier 1 requires quantifiable data on activities, and then uses IPCC default values
to determine the emissions reductions from those activities. Tier 2 requires more country-specific
information on emissions from activities, from which country-specific emissions can be
modeled. Tier 3 approaches generally require actual monitoring of emissions reductions. The use
of default values is particularly important to “land use and land use change” (LULUC) projects,
since directly measuring emissions is very costly. As with additionality, establishing MRV
methodologies for most IDB projects will probably not be necessary, but again, this literature is
developing a number of indicators for different types of projects, and thus will provide IDB
project developers with a good starting point.
4.1 Stages of Mitigation Projects and Indicators
With the terminology and some of the international mechanisms introduced, we now move to a
discussion of the stages of projects leading to an increased ability to mitigate as noted in Figure
1. Differing from adaptation, mitigation tends to be much less affected by the uncertainty
associated with future climate outcomes. However, mitigation planning is subject to the
uncertainty caused by the absence of a global agreement on climate change (as well as a current
agreement which is set to expire in 2012). Because developing countries are not committed to
emissions reductions under the Kyoto Protocol they are also not required to submit national
GHG inventories, which means the incentive to develop the institutional capacity for measuring
and reporting emissions may well be sub-optimal.
However, there is still an active voluntary carbon market that appears relatively robust
and also dedicated mitigation funding, e.g. through the Climate Investment Funds, which should
still provide incentives to develop the necessary capacity. The importance of national-level
emissions baselines will be crucial for developing a portfolio of low-carbon projects and
participating in global carbon markets and funds, as well as assessing overall mitigation
effectiveness. Given these points, the likely entry point for early mitigation projects will be the
development of institutional capacity to monitor and track GHG emissions. Once methodologies
20
for inventorying GHG emissions are in place and data has been collected, they can then be
analyzed to determine which sectors or regions are ripe for low-carbon interventions. Once a
country has developed a foundation for tracking emissions and has a thorough understanding of
sectoral emissions, the next phase will likely be to develop a portfolio of priority projects or
programs based on the initial data collection. Ranking projects in terms of cost-effectiveness, and
whether they are no regrets or not, may help countries determine the appropriate phasing of
projects.
The next stage is institutional capacity building. One of the first steps is often the
development of a national mitigation agenda, which may be linked with the UNFCCC process of
“Nationally Appropriate Mitigation Actions” (NAMA) document in order to streamline access to
international mitigation funds. This may further require changes in the legal and regulatory
framework—the enabling environment—for effective participation in global carbon markets and
funds.
Many current climate change project proposals, particularly policy-based loans, would
benefit enormously by disaggregating the type of institutional capacity on which a project
focuses and more clearly articulating what measures will be addressed in order to create an
enabling environment. For example, with respect to projects aimed at addressing the legal
framework, concrete outputs might include regulations related to energy efficiency for buildings
and homes combined with development of an enforcement strategy, drafting efficiency standards
for cars, laws assigning property rights to carbon, and the development of a regulatory securities
framework for engaging in carbon markets. In terms of institutions to disseminate information,
examples would include capacity and resources to develop public awareness campaigns to
increase the use of energy efficient lighting in residential and business spaces; or the promotion
of low-carbon transportation options, such as rapid transit buses or bicycles. Any of these is
better than simply “institutional capacity building for creating an enabling environment”, or
“information on climate change broadly disseminated to all relevant stakeholders”, for instance.
Operationalizing actions to support mitigation is the final stage. Since so many activities
across all sectors generate GHGs, or alternatively, can sequester carbon to reduce emissions, it is
impossible to cover all but a few examples, which we do in detail below. On the other hand, at
least conceptually, the outcome indicator is simple. In nearly all cases, the primary outcome of a
climate change mitigation project is reduced GHGs, and the key indicator is actual reductions in
21
such emissions. However, as we shall see below, actually measuring GHG emissions is often
very costly, and so other methods are used, including sampling, modeling and relying on default
values for emissions reductions developed by the IPCC. In most cases, project developers should
consult the UNFCCC website to obtain information on methodologies currently being used for
different projects under the CDM7.
4.2 Developing Mitigation Indicators and some Examples from Current Projects
In this subsection, we present details from projects currently being funded under the Clean
Development Mechanism of the Kyoto protocol in a number of different sectors. As with
adaptation, determining baselines and counterfactuals (what would happen over time if the
project was not undertaken) is very important. Unlike adaptation projects to date, however, far
more work has been done on developing output and outcome indicators. Because of substantial
work on output and outcome indicators has already been done, in this section we instead focus
here on the identification of baselines and the construction of counterfactuals.
1. Factory Energy Efficiency Improvement in Compressed Air Demand in Mexico.
The program’s objective is the implementation of energy efficiency program to reduce
demand of compressed air in the manufacturing process. The output is energy efficiency
program implementation, the outcome is reduced demand for compressed air and
consequently lower GHG emissions, and the (very broad) impact is reduced the pace of
climate change due to anthropogenic GHG emissions.
Baseline Identification –Continuation of current situation of energy consumption with current
compressed air equipment installed on-site that are in compliance with local regulation.
Baseline Emissions –Based on sum of actual electricity consumption by participating
facilities, and trend increases in consumption. This data is then combined with scientific
formulas and efficiency factors for calculating CO2 emissions.
Project Emissions –Sum of annual electricity consumption by facilities participating in the
energy efficiency program; as above, this information is then combined with scientific
formulas and efficiency factors to arrive at CO2 emissions under the project.
7 http://cdm.unfccc.int/methodologies/index.html
22
2. Gas Fuel Switch Project, Brazil.
Project activities focused on the conversion of 48 different types of equipment. Conversion is
related to adaptation and modifications, allowing the use of natural gas instead of fuel oil,
liquefied petroleum gas, or electricity.
Baseline Identification: CO2 emissions associated with fuel oil and LPG transports by truck
in the baseline were determined based on appropriately selected transport distances and truck
capacities.
Estimates of future fuel consumption are used for the ex-ante determination of expected
project and baseline emissions.
Baseline Emissions: Emissions based on the efficiency of the current fuel oil and LPG boilers
using fuel oil and LPG, respectively (measured ex-ante) combined with estimates of future
fuel consumption.
Project Emissions: These are determined based on the amount of fuel oil and LPG displaced
by natural gas. The amount of this fuel displaced is calculated from the natural gas
consumption (monitored ex-post), the efficiency of natural gas boilers and furnaces
(monitored ex-post). Emissions from five sources listed below were calculated:
• CO2 from combustion of natural gas and fuel oil
• Methane from combustion of natural gas and fuel oil
• Nitrous oxide from combustion of natural gas and fuel oil
• Fugitive CH4 emissions associated with natural gas production and distribution
• CO2 from transportation of fuel oil and LPG
The above information was then combined with measures of changes in natural gas
consumption, obtained through gas company receipts and field instruments.
3. AWMS Methane Recovery Project in Baja California, Mexico.
The purpose of this project is to mitigate and recover animal effluent related GHGs by
replacing open air lagoons with covered lagoon cells, creating ambient temperature anaerobic
digesters. Other expected environmental benefits include improved water quality and reduced
odor.
23
Baseline Identification: – Given the high costs of converting open air lagoons into covered
lagoon cells, and given current and likely future government regulations, project developers
consider that continued use of open air lagoons would persist in the absence of the project.
Baseline Emissions: According to the project document: “The amount of methane that would
be emitted to the atmosphere in the absence of the project activity can be estimated by
referring to Section 4.2.5 of the Revised 1996 IPCC Guidelines for National GHG
Inventories.” In other words, project developers rely on emissions factor equations already
developed under the IPCC, using open anaerobic lagoon plus actual data on composition of
livestock as the baseline.
Project Emissions: Actual Methane (CH4) and CO2 emissions will be continuously monitored
using a bio-gas meter.
4. Reforestation Project in southern Nicaragua.
The project area is 813 ha of former pasture land, with teak and native wood species in
Southern Nicaragua. Reforestation activities will generate sustainable wood supplies,
reduced pressure on natural forests, and also serve as a carbon sink.
Baseline Identification: – Current use as grasslands is considered to also be future land use
for purposes of constructing the baseline.
Baseline Emissions: Given current use as grazing lands, baseline emissions (here, emissions
reductions through increasing carbon stored above and below-ground) would essentially be
zero (no increases in carbon stocks when lands remain as un-reforested grazing lands).
Project Emissions: Project emissions are measured based on random sampling of plots within
the project area, and then applying default allometric equations to estimate increases in above
and below-ground biomass due to reforestation activities.
The stratification strategy is quite sophisticated. In particular, parameters for initial
stratification are tree species (native species and teak) and planting year (2003 to 2006). In
year 4 after plantation the stratification is refined with strata that represent the growth
conditions. These are mapped based on a grid of geo-referenced systematically distributed
circular temporary sample plots of 100 m2 with a distance of 50 m between every plot. In
each plot diameter at breast height (DBH) of every tree is measured. With an allometric
24
formula total volume of the tree is calculated as a function of DBH. The average volume of
each plot is then assigned to a growth class. With the help of a GIS computer program with
interpolation functionality a growth map with homogeneous growth conditions is produced.
Leakage: According to the methodology, three types of leakage need to be assessed if there
are displaced activities due to the project activity:
• Area under cropland displaced
• Number of domesticated grazing animals displaced
• Time-average number of domesticated roaming animals displaced
In this project, the project developers determined that none of these leakages was important,
since landowner participants slaughtered most animals, though some were also sold (so some
leakage in terms of animals displaced.
5. Potential Pitfalls and “Indicators” to Avoid
As discussed in the introduction, developing SMART indicators means developing indicators
that are Specific, Measurable, Achievable, Relevant and Timely. Here, we discuss these concepts
and where potential problems can occur.
5.1 Specific
The major problem here is that project developers often use vague terms without any hint of how
such terms might be operationalized in the specific context, e.g. “widely shared”, “appropriate”,
“relevant”, “are engaged in”, “understand”, etc. Another problem that often arises is that project
managers specify multi-dimensional indices and not indicators, often with no apparent weighting
or aggregation formula to actually construct the index, no units, and very often, using very vague
language to identify what components of the index might actually look like. Two examples
below illustrate this problem:
1. Evidence of coordinated approach between ministries/departments to address cross-
sectoral forest-related policy, planning, or practice issues [Proposed indicator for the
Forest Investment Program of the CIF]
2. Knowledge of hazards, vulnerability, risks and risk reduction actions (including
indigenous knowledge and coping strategies) within the community is sufficient for
25
effective action by community (alone and in collaboration). [Taken from the Benfield
Disaster Risk Resilience Matrix]
In the first example, someone attempting to construct this indicator will have to figure out
what constitutes “evidence”, and will then have to determine how to aggregate “evidence” across
numerous ministries and departments and over three different subject dimensions. What if
“evidence” shows coordination amongst the Ministry of Forestry and the Ministry of the
Environment, but no links with the Ministry of Agriculture, Livestock and Fisheries, and weak
links with the Meteorological Services? What if there is evidence of coordination amongst
agencies for policy but not planning or practice issues? Who decides the “weight” assigned to
each bit of evidence (is all “evidence” equally important, and thus simply tallied up against a
theoretical “maximum” coordination)? What, specifically, constitutes evidence and how is the
evidence itself to be weighted? In short, the “indicator” has many different components which is
a good indication that it is not specific, and has no unit of measurement since the criteria for
constructing the indicator is “evidence” – a vague term in this context.
In the second example, the person constructing the index will have to determine what is
“sufficient knowledge for effective actions”, a very vague expression. And, then the person will
again have to aggregate information on “sufficient knowledge” for each of the subjects (hazards,
vulnerability, risks and risk reduction actions), again by likely applying an implicit weighting
function to these separate pieces of information. Then, the person will need to determine if
knowledge is sufficient to act alone and in collaboration. It is unclear what the proponents of the
indicator mean by “alone and in collaboration”; in collaboration with whom? Does one assess
whether knowledge possessed by the people is sufficient to act alone and then again assess
whether the same knowledge is sufficient to act in collaboration with other family members?
Neighbors? Local government officials? NGO’s?
Before moving on, it is worth noting that indices (or “composite indicators”) can be
helpful in aggregating multiple dimensions of a single output or outcome, but the weighting and
aggregation process must be carefully thought through, and in any case, indicators of each
dimension still require individual measurement and so each must be SMART. For instance, the
IDB’s Indicators for Disaster Risk and Risk Management (Cardona, 2007) carefully develops
and documents the weighting and aggregation process for a number of indices capturing four
aspects of disaster risk and management. For instance, the “Risk Management Index” (RMI) is
26
comprised of four public policy dimensions, each of which has six associated indicators. The
RMI indicators are all expert subjective assessments gathered using “fuzzy” linguistic categories
that are assigned a number ranging from 1-5, and aggregation is performed using a fuzzy
algorithm. On the other hand, the Local Disaster index uses objective measures such as the
number of deaths or persons affected by disaster, and applies a different weighting algorithm.
The point to note is that each of the indicators is available individually and also that there is a
detailed explanation of the methodology used to weight and aggregate information to produce
the indices.
Additionally, the Food and Agriculture Organization has produced a number of GIS-
based indices capturing soil and water degradation and deforestation and degraded forest land;
the most recent version, GLADIS, still being in “beta” form. These indices may be useful in
determining current adaptive capacity and in measuring current pressures on the natural resource
base as reflected in the trend variables8; and certain indices have been proposed as indicators
under the CIF Forest Investment Program Framework. As with the IDB’s indices for disaster,
GLADIS documentation presents a detailed description of the methodology used for developing
the indices, including theoretical motivation for the weighting functions used. To summarize,
project developers should make a clear distinction between single-dimension “indicators” versus
indices that are comprised of multiple indicators. In most cases, the single-dimension indicators
will be preferred, unless the project is following already developed and reviewed methodologies
to construct indices, or will develop such a methodology themselves.
5.2 Measurable
Oftentimes, indicators that are not specific are also not measurable. Additionally, a wide range of
“quality” or subjective opinion indicators suffer from lack of measurability, as do indicators that
are based on feelings. For opinion-based indicators, it is often very difficult to ensure that the
questions to elicit information about the indicator are “anchored”, meaning that all respondents
perceive the question similarly and/or that the “universe” over which they are forming opinions
is the same for all respondents. As an example, a wealthy urban person will anchor questions
regarding quality of education on their own range of knowledge and experience, which will
likely differ from the anchor and the range of experience used to assess quality by a poor rural 8 However, as documented in GLADIS report, these indicators are based on coarse-level data, and are best used in
global comparisons, then regional.
27
person. With respect to feelings, as noted by Liebmann and Pavanello (2007) in a review of the
Benfield UCL Hazard Research Centre indicators for disaster risk, feelings – even specific
feelings – are very difficult to measure, and in any case, often do not necessarily correlate with
behavioral change (which is related to Relevant, as discussed below). This would include
indicators of well-being, of vulnerability, of being empowered. Quality-based indicators, often
prefaced with “degree” or “extent” generally are not measurable, at least not without a well
thought-out strategy for identifying a “baseline” and how change from that baseline can be
quantified to capture “extent” or “degree”. Below, we provide four examples.
1. Women and marginalized groups are empowered to claim their rights to land (Care
Community-Based Adaptation Indicator)
2. Shared vision of a prepared and resilient community (Benfield Disaster Risk Resilience
Matrix)
3. Informed, realistic attitudes toward risk and risk management (Benfield Disaster Risk
Resilience Matrix)
4. People feel justifiably confident about their safety and capacities of self-reliance
(Benfield Disaster Risk Resilience Matrix)
It should be very clear that, with no further attempt to specify baselines or methodologies
to measure the indicators provided above, they are simply not measurable. Even where the
concepts the indicators intend to measure are relatively more specific – e.g. empowered, shared
vision – it is very unclear how one would go about actually measuring such concepts, including
establishing a baseline. Indicators three and four are even worse, as they not only require
measuring “attitudes” and “confidence”, but also whether or not such attitudes are realistic
(according to whom?) or justifiable (again, according to whom?).
For project management purposes, it is likely that making qualitative assessments of the
above indicators can be useful for project planning and fine-tuning during the project life-cycle.
Trying to actually measure such indicators, in conjunction with project beneficiaries, may also
lead to the development of measurable criteria that all stakeholders agree are “indicators” of the
indicators proposed above. However, because they are not measurable at the outset of the
project, they are poor indicators for ensuring evaluability of development effectiveness.
28
5.3 Achievable
Some indicators actually may be specific and measurable, but simply not achievable. For
instance, determining the number of infractions of forest regulations that were subsequently
subject to fine is specific and measurable, but likely only measurable at great cost. Another
example is provided under the CIF; many donors would like to see indicators highly
disaggregated – men, women, boys, girls, marginalized or poor, indigenous, etc., but the sample
size required to generate meaningful information at this level of disaggregation is likely to be
prohibitively expensive for many projects.
5.4 Relevant
The “relevance” criteria is also often inappropriately applied, and perhaps the most difficult to
ensure. To be relevant, indicators need to be shown to actually reflect the output, outcome or
impact that is being addressed. While this may be trivial for many outputs, it becomes much
more complicated as we move up to outcomes and impacts. For instance, “increased yields” has
been proposed as an indicator of reduced pressure on forest resources at forest margins, which is
meant to capture either the outcome of increased adaptive capacity or decreased carbon
emissions through avoided deforestation. However, there is a very large body of research that
shows that increasing yields does not necessarily lead to reduced expansion of arable land and/or
reductions in unsustainable soil and water conservation practices, and in fact, has led to just the
opposite in many cases (c.f. Angelsen & Kaimowitz, 2001; Ewers et al., 2009). A few more
examples are provided below:
1. % of communities/households with clear titles over forest land (Forest Investment
Program proposed indicator)
2. % of households with access to pasture, forests or - other common property resources
(Care Community-Based Adaptation Indicator)
These indicators may or may not be relevant in any given context, and that’s why they
are often poor indicators. As with agricultural intensification, each of these indicators may either
be negatively or positively associated with vulnerability, resilience and adaptive capacity. For
instance, there is a voluminous literature on community-based natural resource management
which shows highly varying results from devolving forest land management to communities.
Unfortunately, this means that whether communities have clear titles has little support in the
29
literature for being a good indicator of resilience and adaptive capacity (c.f. Blaikie, 2006, and
references cited therein). Therefore despite its being specific, measurable and achievable, on its
own it is insufficient As a side note, this indicator only considers “clear title”, which does not
necessarily capture the less formal, but often still secure, tenure rights that can also lead to
sustainable forest management. The second indicator captures access to common property
resources as an indicator of adaptive capacity. This too may also be highly misleading. First,
commons that are overexploited often generate better and more stable returns when privatized,
even if they would increase adaptive capacity and resilience if they were not overexploited
(McCarthy, 2004). On the other hand, if comparison is restricted only to regions with similar
agro-ecological and climate conditions, then access to a wide range of common pool resources
may well increase adaptive capacity and system resilience, particularly in livestock-based
economies (Niamir-Fuller, 1999). Again, the point is that a good deal of context-specific
knowledge is required a priori in order to ensure that the indicator is relevant and actually
captures the hoped-for outcome or impact.
Finally, we note that many quantitative indicators often perform poorly in terms of
relevance, particularly when the outcome is improved quality, e.g. in technical capacity and
service delivery. In these cases, it is best to carefully define the characteristics of improved
quality, and base indicators on these. For instance, improved health service delivery indicators
could be based on time needed to access the service and costs of services, but may also be
augmented by patients’ subjective assessments of quality, using linguistic scores, on additional,
well-defined, characteristics both at the baseline and at the end of the project.
5.5 Timely
Indicators should be “timely” in the sense that information is gathered at points of time that
accurately reflect what the indicator is attempting to reflect. In many mitigation projects,
metering equipment that continuously monitors emissions can accurately capture annual
emissions whereas if emissions were only monitored say, every 6 months, those measures might
instead capture either very high or very low emissions, depending on how cyclical emissions are.
Adaptation and adaptive capacity projects present a more formidable problem, since some of the
most important benefits may not materialize until well after the end of the project. As discussed
above, this means that project developers must define intermediate outcomes that are highly
30
correlated with the realization of longer term benefits, and define SMART indicators for those
intermediate outcomes.
6. Conclusions
The objective of this document has been to lay out some of the most important issues associated
with developing indicators for assessing outputs, outcomes and impacts in climate change
projects. Developing SMART indicators is necessary for all projects, but climate change projects
– both adaptation and mitigation – present certain difficulties not often found in other projects.
The first is that many climate change projects deliver multiple benefits, e.g. a reforestation
program that delivers mitigation, adaptation and development benefits. Project developers need
to keep these benefits separate to the extent possible, both to develop SMART indicators but also
to highlight additionality in the project arising from these multiple benefits. Also, many benefits
may only be realized after the life of the project; this means that projects must have intermediate
indicators that clearly link to expected future benefits in order to facilitate assessment. This
means greater emphasis on the project lifecycle than is often necessary in other projects. Not
discussed above is the possibility that project members may need to reassess and update
indicators as more information becomes available. This type of activity should be built into the
monitoring mechanism of the project.
Especially for adaptation, the longer-term improvements in resilience are likely to be a
function of many different actions being undertaken both in the private and public sectors,
making attribution difficult. Developing good, specific indicators for outputs and outcomes will
make attribution for assessing impacts easier down the road.
A key to developing indicators for specific IDB projects, which includes multiple
components and elements of the different stages noted in Figure 1, is to maintain a long-term
vision of where an individual country wants to go in terms of climate change mitigation and
adaptation and carefully consider how an individual project fits within this longer-term vision.
The expectation is that when the IDB engages a country in promoting a country-specific climate
change strategy and agenda, it will begin by either identifying the countries longer term goals or
assisting the country in developing these goals. Each project will fit into this broader vision and
the indicators used in that project will carefully measure progress towards achieving that vision.
31
References Angelsen A, and D. Kaimowitz. Editors. 2001. Agricultural Technologies and Tropical
Deforestation. New York: CABI Publishing in Association with CIFOR.
Blakie, P. 2006. “Is Small Really Beautiful? Community-based Natural Resource Management
in Malawi and Botswana.” World Development, 34(11): 1942-1957.
Burton, I., 2004, “Climate Change and the Adaptation Deficit.” In: Fenech, A. MacIver, D.,
Auld, H., Bing Rong, R. and Yin, Y. Editors. Climate Change: Building the Adaptive
Capacity. Meteorological Service of Canada, Environment Canada, 25-33.
Cardona, O. D. 2007. “Indicators of Disaster Risk and Risk Management: Summary Report.”
Washington, DC: Inter-American Development Bank.
De la Torre, A., P. Fajnzylber, and J. Nash. 2009. Low Carbon, High Growth: Latin American
Responses to Climate Change – Overview. Washington, DC: World Bank Latin America and
Caribbean Studies.
Ewers, R. M., J. P.W. Scharlemann, A. Balmford, and R. E. Green. 2009. “Do Increases in
Agricultural Yield Spare Land for Nature?” Global Biology. On line: doi: 10.1111/j.1365-
2486.2009.01849.x
Greiber, T. Editor. 2009. Payments for Ecosystem Services. Legal and Institutional Frameworks.
IUCN, Gland, Switzerland.
Heltberg, R., P. B. Siegel, and S. L. Jorgensen. 2009. “Addressing Human Vulnerability to
Climate Change: Toward a “No-Regrets” Approach.” Global Environmental Change, 19: 89-
99.
IPCC (Intergovernmental Panel on Climate Change), 2007. “Summary for Policymakers.” In:
Parry, M. L., Canziani, O. F., Palutikof, J. P., van der Linden, P. J. and Hanson C. E. Editors.
Climate Change 2007: Impacts, Adaptation, and Vulnerability. Contribution of Working
Group II to the Fourth Assessment Report of the Intergovernmental Panel on Climate
Change, Cambridge University Press, Cambridge, 7-22.
Liebmann, M. and S. Pavanello. 2007. “A Critical Review of the Knowledge and Education
Indicators of Community-Level Disaster Risk Management.” Benfield UCL Hazard Research
Centre. Paper available at:
http://www.proventionconsortium.org/themes/default/pdfs/characteristics/LSE_characteristic
s_review.pdf
32
33
McCarthy, N. 2004. With C. Dutilly-Diane, Drabo Boureima, A. Kamara and J.-P. Vanderlinden.
“Managing Resources in Erratic Environments: An Analysis of Pastoral Systems in Ethiopia,
Niger and Burkina Faso.” IFPRI Research Report 135. Washington, DC: International Food
Policy Research Institute.
Niamir-Fuller, M. Editor. 1999. Managing Mobility in African Rangelands: The Legitimization
of Transhumance. London: Intermediate Technology Publications.
Parry, M., Evans, A., Rosegrant, M. & Wheeler, T. 2009. Climate Change and Hunger:
Responding to the Challenge. WFP, IFPRI, New York University Center on International
Cooperation; Grantham Institute at Imperial College London; and Walker Institute at
University of Reading. Available at:
http://www.ifpri.org/sites/default/files/publications/wfp_fightingcchunger.pdf
Parry, M.L., O. F. Canziani, J. P. Palutikof, P. J. van der Linden, C. E. Hanson. Editors. 2007.
Climate Change 2007: Impacts, Adaptation and Vulnerability. Contribution of Working
Group II to the Fourth Assessment Report of the Intergovernmental Panel on Climate
Change. Cambridge, UK: Cambridge University Press, pp. 391-431.
Rosenzweig, C. and F. N. Tubiello. 2006. “Adaptation and Mitigation Strategies in Agriculture:
An Analysis of Potential Synergies.” Mitigation and Adaptation Strategies for Global
Change, 12: 855-873.