indicator 4: family outcomes prepared by ecoectacenter.org/eco/assets/pdfs/osep-published_indicator...
TRANSCRIPT
Part C SPP/APR 2011 Indicator Analyses- (FFY 2009) 35
INDICATOR 4: FAMILY OUTCOMES Prepared by ECO
INTRODUCTION
Indicator 4 of Part C measures the percent of families participating in Part C who report that early intervention services have helped the family:
a) Know their rights;
b) Effectively communicate their children’s needs; and c) Help their children develop and learn.
DATA SOURCES AND MEASUREMENT APPROACHES The data used for this report are based on information reported by 55 states and jurisdictions in their February 2011 APRs for FFY 2009. States and jurisdictions will be called “states” for the remainder of this report. In cases where methods data were not reported this year, existing data from last year’s report were used or the state’s SPP was checked for details on their approach. Although information on survey tools is available for all states, not all states submitted data for all other variables. Analyses where sample sizes differ are noted.
Family Survey Tools
States reported using three main survey approaches to collect data for this indicator. Of the 55 states, 25 used the NCSEAM Family Survey (45%), 24 used the ECO Family Outcomes Survey (44%), and six states (11%) used a state-developed survey. In some cases, a state tailored the NCSEAM or ECO survey by removing questions not required for reporting, adding survey questions specific to their state, and/or making wording and formatting changes. Among those reporting using the ECO tool, three states reported using the revised version of the Family Outcomes Survey (FOS-R).
Family Populations Included in Surveys
Forty-four states (80%) reported using a census approach, and eleven states (20%) reported using a sampling approach when surveying families. Across both census and sampling approaches, the majority of states surveyed families regardless of the length of time their child was in services (n=31, 55%). Twenty-four states surveyed families who had a minimum amount of time in services. Of these, 22 states specified families who had greater than six months of services; one used 9 months or more; and one 12 months or more.
With regard to timing, the majority of states surveyed families at a designated point in time or during a specific time period (n=36, 65%). Another approach was timing the survey administration to child participation in the program (n=17 states). This includes administering the survey at exit or transition, at IFSP meetings, or a combination of

Part C SPP/APR 2011 Indicator Analyses- (FFY 2009) 36
those. Of the remaining two states, one surveyed families in programs according to their monitoring schedule, and one staggered the timing by region/district.
ACTUAL PERFORMANCE FOR FFY 2009
Fifty-five states reported actual target data for FFY 2009. Table 1 presents the percent of families reporting that early intervention helped them know their rights, communicate their children’s needs, and help their children develop and learn.
Table 1
Means and Ranges for Actual Data: FFY 2009 Sub-Indicator 4A: Know their
rights 4B: Communicate children’s needs
4C: Help children develop and learn
Mean 85.5% of families 86.0% of families 90.2% of families Range 48.0% - 100% 53.0% - 99.2% 59.5% - 100%
Actual Performance by Region, State Size, and Percent Served
Figures 1-3 show the average performance among states grouped according to RRC/RPTAC region, number of children served (approximating state size), and percent of the state population served by Part C.
Figure 1 shows some differences when comparing actual results across regions. Region 5 appears somewhat higher across the three sub-indicators, while Regions 1 and 2 show lower means for 4A (parents know their rights) and 4B (parents communicate their child’s needs).
Figure 1

Part C SPP/APR 2011 Indicator Analyses- (FFY 2009) 37
Results appear more consistent when looking at families’ perceptions by the size of the state (Figure 2). For Indicator 4A (early intervention helped the family know their rights), means are somewhat lower for the two categories of larger states: the small and mid- size states range from 86 - 88%, and the means in the larger states are 80 and 84%. A similar pattern is seen for sub-indicators 4B (early intervention helped families communicate their child’s needs) and 4C (early intervention helping their children develop and learn), with somewhat lower means for the groups with the states serving the largest number of children.
Figure 2
More substantial differences are seen when comparing actual results by percent of the population served by Part C (Figure 3). There is variability in the means across the categories, with the middle grouping (states serving 2.3% to <3%) having a much lower mean for all three sub-indicators. The differences do not appear to be related to the survey type used. All percent-served groupings appeared to be balanced with respect to states using the ECO and NCSEAM surveys. While not all groups included states using a state-developed survey, these were also distributed among groups.

Part C SPP/APR 2011 Indicator Analyses- (FFY 2009) 38
Actual Performance by Survey Type
Figure 3
Figure 4 shows FFY 2009 data according to survey type. Overall, states using the ECO and state-developed surveys reported slightly higher scores than for the NCSEAM survey.
Regardless of the tool used, states used a variety of standards to determine whether families had achieved each of the three family outcomes reported in this indicator. Among the 25 states using the NCSEAM survey, 15 states reported using the standard scoring methodology of Rasch analysis to indicate a positive response. Six additional states reported using modified methods of analysis, including ratings based on level of agreement with items or percentage points awarded based on the level of agreement. The remaining four states using the NCSEAM survey did not report their criteria for a positive response.
Of the 24 states using the ECO Family Outcomes Survey for this indicator, 18 states (16 using the original version and two using the revised ECO survey) reported using the scoring standard recommended by ECO. Three states adapted the ECO response scale using criteria of “agree” or higher or a frequency scale, and the remaining three states did not report their scoring criteria.
Among the six states that used a state-developed survey, three used criteria of “agree” or higher, and three used some other cutoff (one used “strongly” or “very strongly”, and the other two had mixed formats among their survey questions.

Part C SPP/APR 2011 Indicator Analyses- (FFY 2009) 39
Figure 4
Figure 5 displays the FFY 2009 data according to the various criteria for positive response used by states. The first category, “Agree or higher” includes states using both the ECO survey and a state-developed survey. Similarly, the “Other” category includes states using other scoring for both the ECO and state-developed surveys. There is substantial variability across these groupings based on the cutoff scores. However, these are likely due to differences in the measurement processes rather than to differential state performance per se.
Figure 5

Part C SPP/APR 2011 Indicator Analyses- (FFY 2009) 40
Response Rates The average of states’ response rates was 36%, based on 49 states (6 states did not report their response rate). Response rates ranged from 5.8% to 100%. There was some variation among response rates based on survey type. Response rates were highest for states using the ECO survey (41%), and comparable for states using the NCSEAM survey (31%), and state-developed surveys (31%). Mean response rates were slightly higher for census (37%) versus sampling (32%) approaches.
Analysis of the method of survey distribution reveals that hand delivering surveys yielded the highest response rate at 46%. States reporting using multiple methods to distribute surveys had an average return rate of 37%, while those reporting using mail distributions averaged a 27% return rate.
Response rates also differed according to the methods used for families to return completed surveys. The four states that collected surveys in person had a mean return rate of 76%. States using a variety of methods (e.g. offering families an option of completing the survey online, mailing it in, or handing it back to a provider) had a mean response rate of 36%. States reporting using a mail-only return method averaged 28% of surveys returned.
Representative Data
A total of 44 states (80%) reported on the criteria they used to determine whether or not their family survey data were representative of the population they serve. Table 2 shows the frequency with which the different criteria were reported by states. This is a duplicative count of categories (e.g. some states used more than one criterion to determine representativeness). Eleven states did not report their criteria.
Table 2
Criteria Used to Evaluate Representativeness Across States (n=55)
Criteria States (n) States (%) Race/ ethnicity 41 75% Geography (district, county, region) 17 31% Gender 14 25% Child’s age (at survey, at referral) 13 24% Disability type/ eligibility category 6 11% Length of time in services 6 11% Income (i.e. receipt of Medicaid) 3 5%
Part C SPP/APR 2011 Indicator Analyses- (FFY 2009) 41
A majority of states (n=41) reported using race/ethnicity categories to evaluate representativeness. Geographic characteristics included region, service district, urban/ rural, county, or program size. States also looked at characteristics of the child such as age of the child (at time of survey, at entry, or referral), gender, disability or eligibility category, and receipt of Medicaid. A few states also assessed representativeness based on the length of time the child had been in services.
In determining whether data were representative, 41 states (75%) reported the source of data used for comparison. The main data sources were Part C population/618 data (25 states, 45%) and program population data (13 states, 24%). Three states used other methods - two used sampling matrices and one a sampling calculator. Fourteen states did not report on their comparison data.
States differed on how they assessed whether their data were representative of the population they serve. The majority of states (n=50, 91%) drew some conclusions about their data, while the remaining five did not. Of the states that did make conclusions, nine reported varied results regarding representativeness, i.e. data were representative on some criteria but not others, or for some subgroups but not others. The remaining 41 states reported that their data were representative of their state. States varied as to whether they reported response rates or percentages of the response pool by subgroup. Twenty-six states provided data on response rates among subgroups, including one state that did not draw a conclusion about representativeness.
PROGRESS AND SLIPPAGE
When comparing actual performance data from FFY 2008 to FFY 2009, the overall trend showed progress for each of the three family outcome measures; the mean percentages for all three sub-indicators increased slightly from last year. Indicator 4A (families know their rights) increased from 84.3% to 85.5%; Indicator 4B (families communicate their children’s needs) increased from 85.2% to 86.0%; and Indicator 4C (families help their child develop and learn) increased from 89.5% to 90.2%.
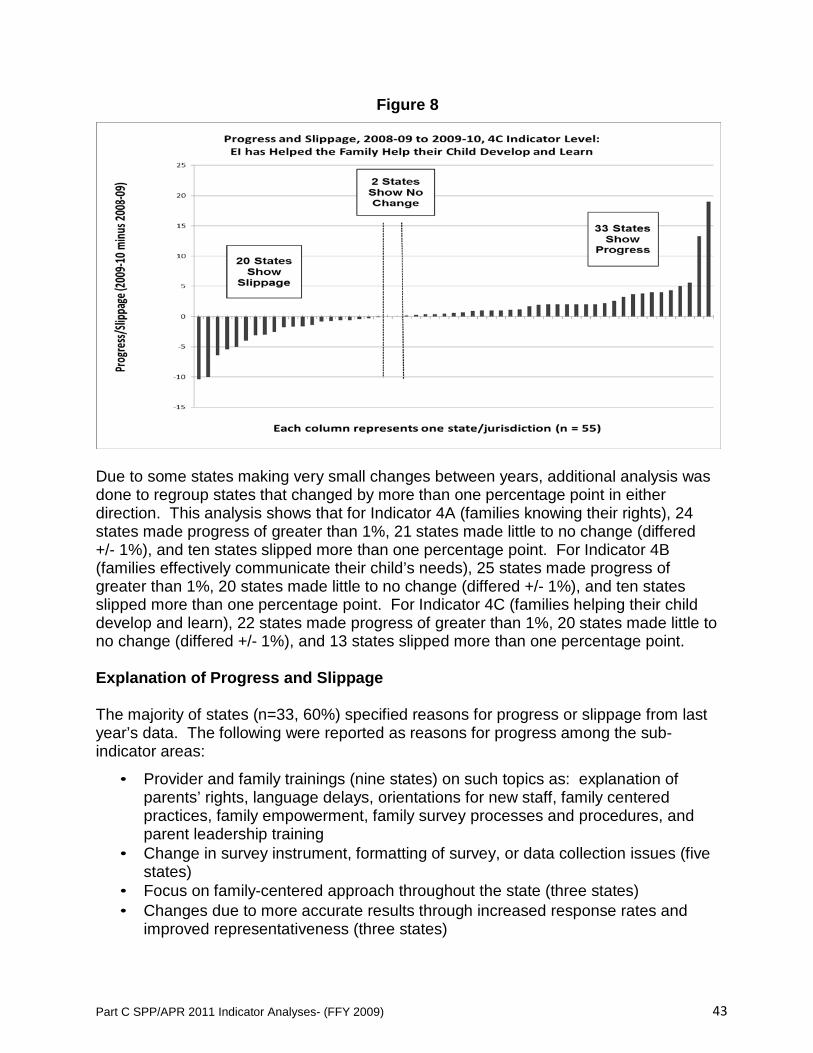
Figures 6, 7, and 8 show the number of states reporting progress or slippage among the three sub-indicators from FFY 2008 to FFY 2009. Each column represents one state. Across all three sub-indicators, the majority of states made progress.

Part C SPP/APR 2011 Indicator Analyses- (FFY 2009) 42
Figure 6
Figure 7
Part C SPP/APR 2011 Indicator Analyses- (FFY 2009) 43
Figure 8
Due to some states making very small changes between years, additional analysis was done to regroup states that changed by more than one percentage point in either direction. This analysis shows that for Indicator 4A (families knowing their rights), 24 states made progress of greater than 1%, 21 states made little to no change (differed +/- 1%), and ten states slipped more than one percentage point. For Indicator 4B (families effectively communicate their child’s needs), 25 states made progress of greater than 1%, 20 states made little to no change (differed +/- 1%), and ten states slipped more than one percentage point. For Indicator 4C (families helping their child develop and learn), 22 states made progress of greater than 1%, 20 states made little to no change (differed +/- 1%), and 13 states slipped more than one percentage point.
Explanation of Progress and Slippage
The majority of states (n=33, 60%) specified reasons for progress or slippage from last year’s data. The following were reported as reasons for progress among the sub- indicator areas:
• Provider and family trainings (nine states) on such topics as: explanation of parents’ rights, language delays, orientations for new staff, family centered practices, family empowerment, family survey processes and procedures, and parent leadership training
• Change in survey instrument, formatting of survey, or data collection issues (five states)
• Focus on family-centered approach throughout the state (three states) • Changes due to more accurate results through increased response rates and
improved representativeness (three states)
Part C SPP/APR 2011 Indicator Analyses- (FFY 2009) 44
• Program practices including monitoring and increasing collaboration with parent organizations and community agencies (three states)
States that reported explanations for slippage attributed it to:
• Delays in services and provider payments • Errors or delays in the data collection process • Increases in family cost of participation leading to decreased services
Comparison of Baseline to Actual Performance
Figures 9, 10, and 11 display changes from baseline to current performance for the three sub-indicators. Each bar represents an individual state’s trajectory from baseline to current. In most cases the baseline data are from FFY 2005, although a few states submitted baseline data or revised baseline data after FFY 2005. For Indicators 4A and 4C, there are 53 states with both baseline and current data; for Indicator 4B, data are based on the 52 states with data for both time points.
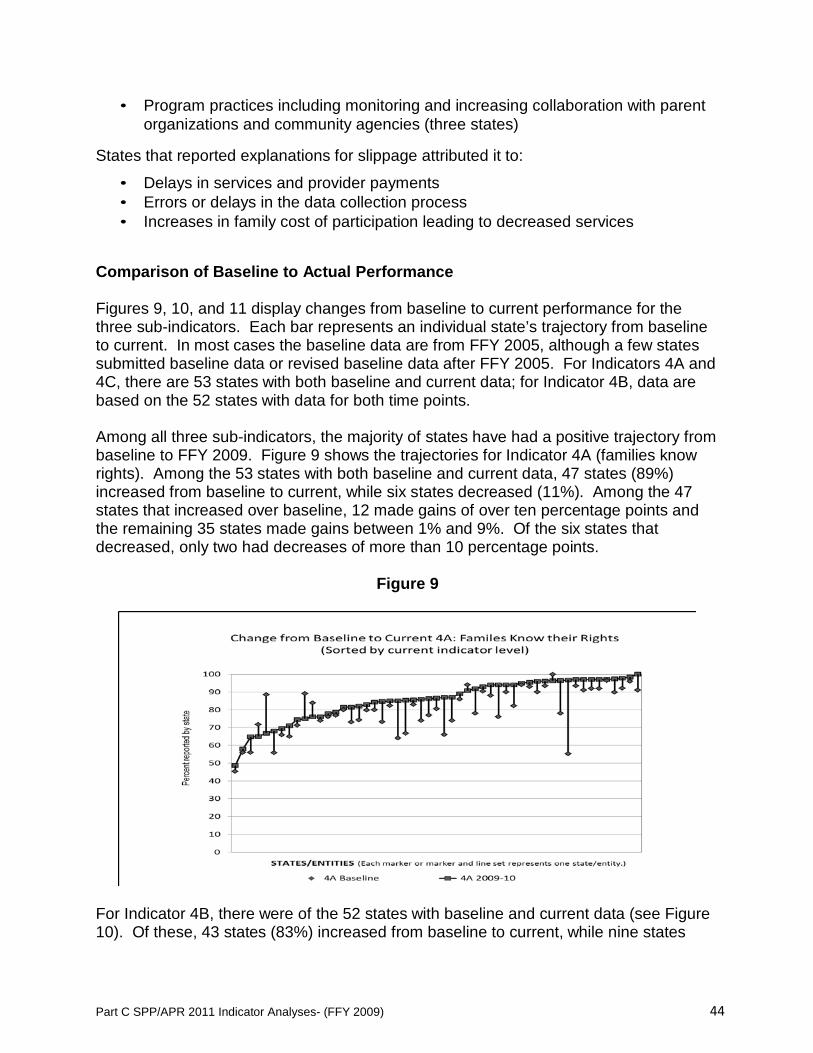
Among all three sub-indicators, the majority of states have had a positive trajectory from baseline to FFY 2009. Figure 9 shows the trajectories for Indicator 4A (families know rights). Among the 53 states with both baseline and current data, 47 states (89%) increased from baseline to current, while six states decreased (11%). Among the 47 states that increased over baseline, 12 made gains of over ten percentage points and the remaining 35 states made gains between 1% and 9%. Of the six states that decreased, only two had decreases of more than 10 percentage points.
Figure 9
For Indicator 4B, there were of the 52 states with baseline and current data (see Figure 10). Of these, 43 states (83%) increased from baseline to current, while nine states

Part C SPP/APR 2011 Indicator Analyses- (FFY 2009) 45
decreased (17%). Among the 43 states that increased over baseline, 14 made gains of over ten percentage points and the remaining 29 states made gains between 1% and 9%. Of the six states that decreased, only two had decreases of more than 10 percentage points.
Figure 10
Figure 11 shows trajectory data for Indicator 4C, helping the child develop and learn. Among the 53 states with both baseline and current data for Indicator 4C, 41 states (77%) increased from baseline to current, 11 states decreased (21%), and one state stayed the same. Among the 41 states that increased over baseline, seven made gains of ten percentage points or more, and the remaining 35 states made less than ten points of progress. Of the 11 states that decreased, none decreased more than 10 percentage points.

Part C SPP/APR 2011 Indicator Analyses- (FFY 2009) 46
Figure 11
Trends over Time
Figures 12, 13, and 14 show trends in Indicator 4 data since baseline. Across all three sub-indicators, there has been an overall upward trend in the means across years, as well as higher proportions of states falling into the 90-100% performance range since baseline.
Figure 12
*Numbers of states reported in trend figures in previous years may vary from this figure due to revised rounding protocols and several instances of corrected historical data.

Part C SPP/APR 2011 Indicator Analyses- (FFY 2009) 47
Figure 13
*Numbers of states reported in trend figures in previous years may vary from this figure due to revised rounding protocols and several instances of corrected historical data.
Figure 14
*Numbers of states reported in trend figures in previous years may vary from this figure due to revised rounding protocols and several instances of corrected historical data.
Part C SPP/APR 2011 Indicator Analyses- (FFY 2009) 48
IMPROVEMENT ACTIVITIES States reported a multitude of activities for improving family outcomes, including revising their policies, procedures, monitoring system, data analysis, improvement planning process, personnel development structure, training activities, program design, family leadership development, and communication with families about family-centered practice and family outcomes. They also reported changes to their survey instrument to make it clearer for families, and changes in the way they distributed the survey to increase return rates and the representativeness of respondents. Improvement activities are reported by level of the system: state level, professional development level, local administrative level, practice level, and family level.
State Level Improvement Activities
Policies and Procedures
Several states made changes in their policies, procedures, or IFSP forms with the intent of improving family outcomes. Of particular note are:
• Adoption of a single Part C Procedures Manual by state lead agency, Service
Coordination Agency, and regional grantees to assure consistency, including definitions, requirements, examples and non-examples, if-then tables, and procedural step tables to clarify procedural expectations
• Revisions to IFSP form with family-friendly language and included family outcomes on new IFSP form as a prompt to service coordinators to discuss outcomes when identifying and prioritizing family needs when developing IFSP goals
• Awarded funding to LEAs to design and implement a Family Involvement Plan with input from families and community partners
State Monitoring
A number of states reported making changes to their state monitoring system to put a greater focus on improving family outcomes. Improvement activities include:
• Monitored IFSP family goals and child records to determine whether families are
involved in eligibility determination, program planning, service delivery, and evaluation of their children
• Reviewed forms and progress notes to ensure that family friendly language is used rather than jargon
• Revised annual comprehensive desk audit to check for documentation that the family survey was provided at annual IFSP meeting
• Used parent forums, family interviews, or anonymous provider surveys to validate data from family surveys

Part C SPP/APR 2011 Indicator Analyses- (FFY 2009) 49
Use of Family Outcome Data States reported using family outcome data in a variety of ways. Examples include:
• Used survey results to design TA to programs to improve family-centered
practice, and to inform parent training topics and parent newsletter topics • Used family outcome data in conjunction with training data to evaluate the
effectiveness of competency based training modules • Linked family outcome results with child outcome results
Collaboration
States mentioned their collaboration with other organizations as an opportunity to promote family supports and outcomes. Most notable are:
• Ongoing contracts with state chapters of the American Academy of Pediatrics
and the Academy of Family Physicians with specific liaisons to the lead agency regarding the family-centered approach of early intervention
• Enhanced collaboration with state family-focus projects, such as PTI, family outcomes committees, and/or network of Family Resource Specialists to maximize their impact on achieving Part C family outcomes
Survey Distribution
States reported improvement activities related to survey promotion, distribution, follow- up, and collection, such as:
• Changed mode of delivery, to include multiple ways for families to respond • Used prompts to increase return rate or representativeness: flyers in both
English and Spanish alerting families that the survey was coming, providing FAQs in English & Spanish about the family outcome survey, sending a second mailing of survey to previously underrepresented population groups, and outreach by parent callers to Spanish-speaking families
• Monitored the number and proportion of surveys completed each month and followed up to increase response rates
• Imposed minimum survey response requirements for programs or districts • Revised, added or deleted survey questions, switched the order of questions, or
changed the survey scale to make the survey easier to understand and/or shorter Professional Development Level Improvement Activities
States reported improvement activities related to professional development that fell into several categories: structure/standards, state/regional face-to-face training, district/ local training activities, individualized professional development opportunities, focused TA, and training materials.

Part C SPP/APR 2011 Indicator Analyses- (FFY 2009) 50
Structure/Policies/Standards
• Contracts with universities at pre-service level to collaborate on statewide planning and implementation of a primary service provider method of service delivery
• Personnel standards for continuing education (EI providers, service coordinators) and core competencies revised to integrate content on family outcomes
State/Regional Face-to-Face Training
• Part C Leadership Academy for local system managers and program directors
included a strong focus on family-centered services and systems • Pre-conference workshops for local EI coordinators focused on family survey
data, family outcomes initiatives, and round table discussions on family outcomes • Training specifically focused on evidence-based practices such as CSEFEL,
CELL, SKI-HI curriculum, Primary Service Provider Model, and Family Service Coordination; or focused on specific disabilities such as autism, infant mental health, hearing/visual impairment, or assistive technology
District/Local Training Activities
• In-depth training to regional teams with a structured follow-up process on
evidence-based practices of teaming, coaching, and natural learning environments
• Monthly meetings or conference calls for service coordinators, providers, and family resource specialists to share local initiatives in support of families and discuss family outcome survey results
Individualized Professional Development Opportunities
• Development of an independent study module on procedural safeguards • Mentoring by programs with good survey results to programs needing
improvement Focused Technical Assistance
• TA support from universities to local EI programs to increase proficiency in
family-centered practices associated with Primary Service Provider teaming method of service delivery
• TA to local sites on methods of facilitating parental involvement through team leader meetings

Part C SPP/APR 2011 Indicator Analyses- (FFY 2009) 51
Training Materials
• Creation of a You Tube video on program features that support improved family outcomes
• Maintenance of an up-to-date resource information database, library database, and a library/resource center by PTI for use by EI/ECSE staff, parents, and others
• Development of training DVDs, adult-learning activities, and training materials for use by trainers at local trainings
• Development of CSPD materials that promote philosophy emphasizing family education and empowerment and evidence-based content
Local Administrative Level Improvement Activities
States also reported on improvement activities implemented by administrators of local programs, for the most part around analyzing and using family outcome data as the basis for creating and implementing improvement plans. Some of the strategies used by local administrators include:
• Reviewed data in small groups with service coordinators to discuss interpretation
and use of data and determine strategies for improvement, in particular effectively explaining family rights
• Worked closely with local ICCs and community stakeholders to develop data- driven improvement activities based on survey results and annual self- assessment on the three family outcome areas
• Created a blog of local EI directors and coordinators to share information and increase communication about family outcomes
Practice Level Improvement Activities
States reported activities at the practice level intended to improve family outcomes. Improvement activities reported by states follow:
• Concerted effort to address parental rights and safeguards using a protocol with
a script and tips for effective communication during a family's introduction to and initial time in the EI program
• Taught families to prepare for meetings and appointments; developed a packet of information for families about community resources; and talked with families about any concerns or needed resources to ensure that families know how to effectively communicate their children’s needs
• EI providers held parent forums which included a slide show of their children and discussion of their children's outcomes and how they relate to family outcomes
Part C SPP/APR 2011 Indicator Analyses- (FFY 2009) 52
Family Level Improvement Activities Family Leadership Development
Several states described activities that were undertaken to ensure that family members know how to be involved in state and local councils and committees and to take on leadership roles in promoting positive family experiences and outcomes. Some specific examples include:
• Families trained to produce multimedia life stories which promote family
leadership and are utilized in staff workshops with the goal of impacting family outcomes
• Parents trained through contracts with PTI to become IFSP Partners to be matched with parents requesting assistance in the IFSP process; to become Collaborative Mediation Partners to be matched with parents who request assistance; and to become a full-time Parent Participation Coordinator
Family Training Opportunities and Activities
States reported numerous training opportunities for families and parent-to-parent networks regarding EI and the role of parents. They include:
• Families new to the Part C system participated in monthly orientation activities
and were invited to join a blog about early intervention • Parent participation in informal play groups held by Family Resource Specialists
was used as opportunities for training in advocacy, procedural safeguards, communication, and development
• Families participated in interactive activities to showcase developmentally appropriate practices, such as Gymboree, Library Story Time, Head Start Fitness Fair, and Power of Play conference
• Families participated in education opportunities including seminar series, statewide training sessions, courses on child development, communication, and other pertinent topics
• A parent training program for children with language delays resulted in higher ratings on the family outcome related to helping your child develop and learn
Information about EI Programs and Family-Centered Services
States reported many ways that they equip families with knowledge about the EI system, service options, who to contact, their rights, opportunities to become involved, and ideas of what parents should know and be able to do to support their child during the various developmental stages. States reported distributing information via a family newsletter, parent website page, FAQs on the Part C program, video on making the most of their experience in EI, guidebook with information about support groups for families of young children with disabilities, and fact sheets in English and Spanish on becoming your child's best advocate.

Part C SPP/APR 2011 Indicator Analyses- (FFY 2009) 53
CONCLUSION The family outcomes data have continued to show improvements at the national level. States are increasingly addressing improving response rates and participation of families representing their states. Many states are still focusing on improving the quality of their data through adaptations to their survey methodologies. However, states are also reporting on how they are using the family data to inform program practices and develop program improvement activities