ff2021 ps eco economics graph & indicator
TRANSCRIPT

As IAS prelims 2021 is knocking at the door, jitters and anxiety is a common emotion that an aspirant feels. But if we analyze the whole journey, these last few days act most crucial in your preparation. This is the time when one should muster all their strength and give the fi nal punch required to clear this exam. But the main task here is to consolidate the various resources that an aspirant is referring to.GS SCORE brings to you, Prelims Sampoorna, a series of all value-added resources in your prelims preparation, which will be your one-stop solution and will help in reducing your anxiety and boost your confi dence. As the name suggests, Prelims Sampoorna is a holistic program, which has 360-degree coverage of high-relevance topics. It is an outcome-driven initiative that not only gives you downloads of all resources which you need to summarize your preparation but also provides you with All India open prelims mock tests series in order to assess your learning. Let us summarize this initiative, which will include:
GS Score UPSC Prelims 2021 Yearly Current Affairs Compilation of All 9 Subjects
Topic-wise Prelims Fact Files (Approx. 40)
Geography Through Maps (6 Themes)
Map Based Questions
ALL India Open Prelims Mock Tests Series including 10 Tests
Compilation of Previous Year Questions with Detailed Explanation We will be uploading all the resources on a regular basis till your prelims exam. To get the maximum benefi t of the initiative keep visiting the website.To receive all updates through notifi cation, subscribe:
PRELIMS SAMPOORNA
https://t.me/iasscore
https://www.youtube.com/c/IASSCOREoffi cial/
https://www.facebook.com/gsscoreoffi cial
https://www.instagram.com/gs.scoreoffi cial/
https://twitter.com/gsscoreoffi cial
https://www.linkedin.com/company/gsscoreoffi cial/

www.iasscore.in ECONOMY | ECONOMIC GRAPHS AND INDICATORS
3
CONTENTSEconomic Graphs ........................................................................ 01-08
Engel Curve ..................................................................................................................................................01
Environmental Kuznet Curve ..................................................................................................................01
Phillips Curve ................................................................................................................................................02
Lorenz Curve .................................................................................................................................................02
Gini Coeffi cient .............................................................................................................................................04
Laffer Curve ...................................................................................................................................................04
K-Shaped Recovery ....................................................................................................................................06
Z-Shaped Recovery ....................................................................................................................................06
V-Shaped Recovery ....................................................................................................................................07
U-Shaped Recovery ....................................................................................................................................07
W-Shaped Recovery ...................................................................................................................................08
Economic Indicators ................................................................... 08-10GDP Growth Rate ........................................................................................................................................08
Per Capita GDP .............................................................................................................................................09
Absolute level of real Gross Value Added (or GVA) .......................................................................09
Infl ation rate ..................................................................................................................................................09
Fiscal Defi cit ...................................................................................................................................................09
Government Debt to GDP ........................................................................................................................09
Cash Reserve Ratio (CRR) .........................................................................................................................10


www.iasscore.in 1ECONOMY | ECONOMIC GRAPHS AND INDICATORS
ECONOMIC GRAPHS
Engel Curve: 1.
It describes how the spending on a certain good varies with household income. The shape of an Engel curve is impacted by demographic variables, such as age, gender, and educational level, as well as other consumer characteristics.
The Engel curve also varies for different types of goods. As income of a household increases its expenditure of food as a percentage declines. However, its expenditure on status goods increases.
Environmental Kuznet Curve2.
The environmental Kuznets curve (EKC) is a hypothesized relationship between various indicators of environmental degradation and per capita income. In the early stages of economic growth, pollution emissions increase and environmental quality declines, but beyond some level of per capita income the trend reverses, so that at high income levels, economic growth leads to environmental improvement.
This implies that environmental impacts or emissions per capita are an inverted U-shaped function of per capita income.
The proponents of the Environmental Kuznets Curve (EKC) hypothesis advocate that growth is actually a cure for environmental problems, rather than being a cause of it.
ECONOMIC GRAPHS
& INDICATORS

www.iasscore.in2 IAS 2021 | PRELIMS SAMPOORNA | FACT FILE |
PHILLIPS CURVE3.
It states that infl ation and unemployment have an inverse relationship. Higher infl ation is associated with lower unemployment and vice versa.
Lorenz Curve4.
It was developed by Max Lorenz in 1906. The Lorenz Curve (the actual distribution of income curve), is a graphical distribution of wealth, shows the proportion of income earned by any given percentage of the population.
The line at the 45º angle shows perfectly equal income distribution, while the other line shows the actual distribution of income. The further away from the diagonal, the more unequal the size of the distribution of income.

www.iasscore.in 3ECONOMY | ECONOMIC GRAPHS AND INDICATORS
www.iasscore.in4 IAS 2021 | PRELIMS SAMPOORNA | FACT FILE |
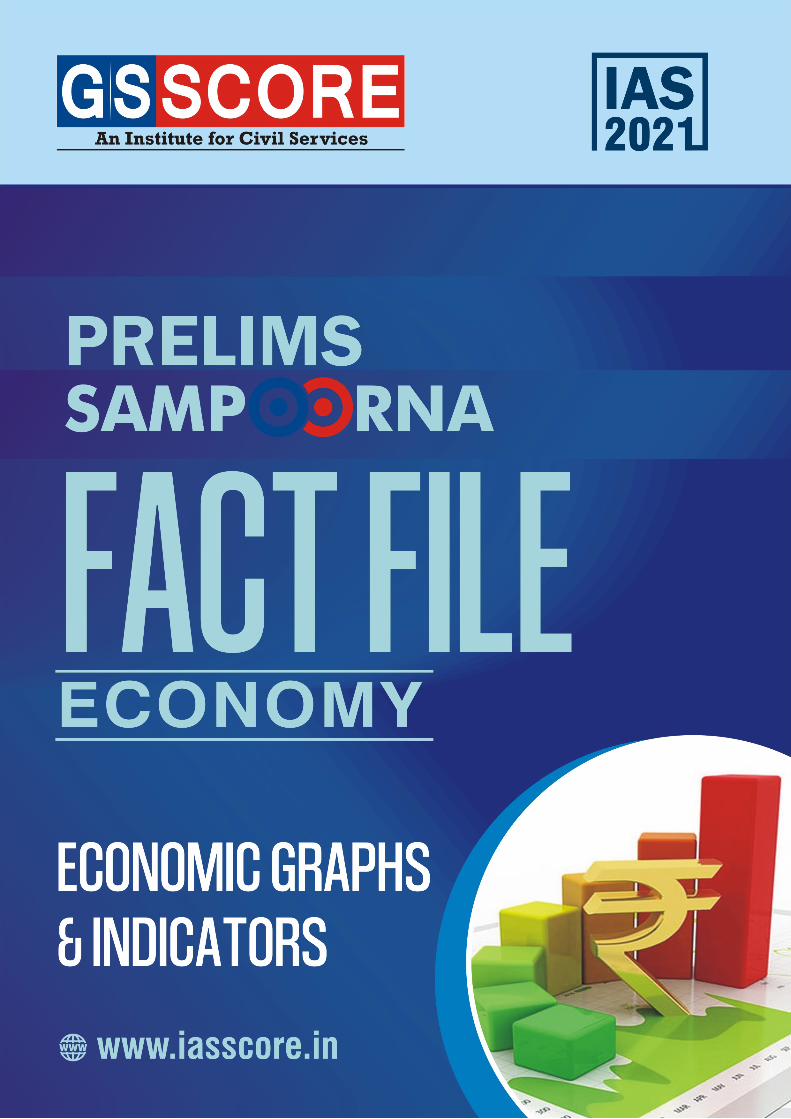
Gini Coeffi cient5.
The Gini Coeffi cient, which is derived from the Lorenz Curve, can be used as an indicator of economic development in a country. It measures the degree of income equality in a population.
It can vary from 0 (perfect equality) to 1 (perfect inequality). A Gini Coeffi cient of zero means that everyone has the same income, while a Coeffi cient of 1 represents a single individual receiving all the income.
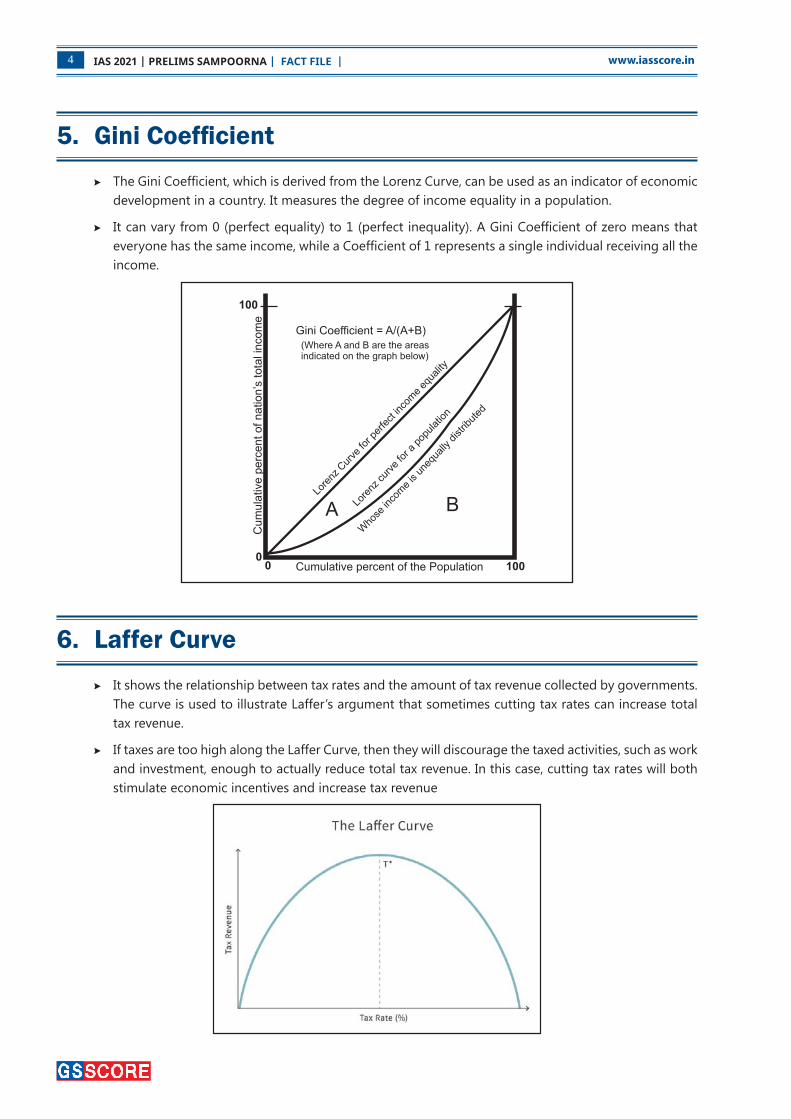
Laffer Curve6.
It shows the relationship between tax rates and the amount of tax revenue collected by governments. The curve is used to illustrate Laffer’s argument that sometimes cutting tax rates can increase total tax revenue.
If taxes are too high along the Laffer Curve, then they will discourage the taxed activities, such as work and investment, enough to actually reduce total tax revenue. In this case, cutting tax rates will both stimulate economic incentives and increase tax revenue


www.iasscore.in6 IAS 2021 | PRELIMS SAMPOORNA | FACT FILE |
K-Shaped Recovery7.
A K-shaped recovery occurs when, following a recession, different parts of the economy recover at different rates, times, or magnitudes. This is in contrast to an even, uniform recovery across sectors, industries, or groups of people.
A K-shaped recovery leads to changes in the structure of the economy or the broader society as economic outcomes and relations are fundamentally changed before and after the recession.
This type of recovery is called K-shaped because the path of different parts of the economy when charted together may diverge, resembling the two arms of the Roman letter “K.
Z-shaped Recovery8.
It represents the most-optimistic scenario in which the economy quickly rises after an economic crash.
It makes up more than for lost ground before settling back to the normal trend-line, thus forming a Z-shaped chart.
In this economic disruption lasts for a small period wherein more than people’s incomes, it is their ability to spend is restricted.

www.iasscore.in 7ECONOMY | ECONOMIC GRAPHS AND INDICATORS
V-shaped recovery: 9.
It is the next-best scenario after Z-shaped recovery in which the economy quickly recoups lost ground
and gets back to the normal growth trend-line.
In this, incomes and jobs are not permanently lost, and the economic growth recovers sharply and
returns to the path it was following before the disruption.
U-Shaped recovery10.
It means that economy after falling, struggles around a low growth rate for some time, before rising
gradually to usual levels.
In this case several jobs are lost and people fall upon their savings.
If this process is more-long drawn than it throws up the “elongated U” shape

www.iasscore.in8 IAS 2021 | PRELIMS SAMPOORNA | FACT FILE |
W-shaped recovery11.
A W-shaped recovery is when an economy passes through a recession into recovery and then immediately turns down into another recession.
W-shaped recessions can be particularly painful because the brief recovery that occurs can trick investors into getting back in too early.
It is estimated that the double-dip depicted by a W-shaped recovery was due to the second wave of the pandemic.
ECONOMIC INDICATORS
GDP Growth Rate1.
Gross Domestic Product measures the aggregate production of fi nal goods and services taking place within the domestic economy during a year.
The Economic Survey 2021 has forecasted that India’s economy contracted 7.7% in 2020-21, before witnessing a sharp recovery of 10-12% in 2021-22. It is expected that the economy grows at its trend growth rate of 6.5% in 2022-23 and 7% in 2023-24 aided by structural reforms.
The government has projected India’s nominal gross domestic product (GDP) growth rate at 14.4 percent for the fi nancial year 2022
Nominal GDP refers to measuring the value of all fi nal goods and services produced within a country for a given period at current market prices. Real GDP takes nominal GDP for a given period and adjusts it for changes in prices.
At Rs 134.4 lakh crore, India’s real GDP — that is, GDP without the infl uence of infl ation — in 2020-21 will be lower than the 2018-19 level

www.iasscore.in 9ECONOMY | ECONOMIC GRAPHS AND INDICATORS
Per Capita GDP2.
While the GDP provides an all-India aggregate, per capita GDP is a better variable if one wants to understand how an average India has been impacted.
While the overall real GDP will fall by 7.7 per cent, per capita real GDP will fall by 8.7 per cent.
Absolute level of real Gross Value Added (or GVA)3.
The Gross Value Added provides a picture of the economy from the supply side. It maps the value- added by different sectors of the economy such as agriculture, industry and services. In other words, GVA provides a proxy for the income earned by people involved in the various sectors
At Rs 123.4 lakh crore, India’s real GVA level, too, will fall below the 2018-19 level.
Infl ation rate4.
Retail infl ation, calculated on the basis of Consumer Price Index (CPI), has been above the RBI’s upper bound infl ation target of 6 per cent for more than 11 months
In the Monetary Policy Committee (MPC) meeting in December 2020, the RBI Governor Shaktikanta Das projected CPI infl ation at 6.8 per cent for December quarter and 5.8 per cent for March quarter of the current fi scal (FY21).
The said infl ation is predicted to hover in the range of 4.6 per cent to 5.2 per cent with risks continuing to be broadly balanced.
Fiscal Defi cit5.
Fiscal defi cit isthe condition when the expenditure of the government exceeds its revenue in a year, is the difference between the two. Fiscal defi cit is calculated both in absolute terms and as a percentage of the country’s gross domestic product (GDP)
The Centre’s fi scal defi cit touched Rs 14.1 trillion in the fi rst 11 months of FY21 — 76 per cent of the 2020-21 revised estimates of Rs 18.5 trillion and 36 per cent higher than last year’s corresponding level of Rs 10.4 trillion.
The government expected to earn revenues of Rs 1.85 trillion in March 2021, 40 per cent lower than what it earned in the year-ago period
The government has set a fi scal defi cit target of Rs 15.1 lakh crore in the current fi scal, which is 6.8% of GDP
Government debt to GDP6.
The debt-to-GDP ratio is the metric comparing a country’s public debt to its gross domestic product (GDP). By comparing what a country owes with what it produces, the debt-to-GDP ratio reliably indicates that particular country’s ability to pay back its debts.

www.iasscore.in10 IAS 2021 | PRELIMS SAMPOORNA | FACT FILE |
Recently IMF’s Fiscal Affairs Department said that In the case of India, the debt ratio at the end of 2019, prior to the pandemic, was 74% of Gross Domestic Product (GDP), and at the end of 2020, it is almost 90% of GDP.
Cash Reserve Ratio (CRR)7.
Percentage of cash required to be kept in reserves, vis-a-vis a bank’s total deposits, is called the Cash Reserve Ratio. The cash reserve is either stored in the bank’s vault or is sent to the RBI.
Banks can’t lend the CRR money to corporates or individual borrowers, banks can’t use that money for investment purposes. And Banks don’t earn any interest on that money.
Recently RBI allowed banks to exclude loans up to Rs 25 lakh given to the micro, small and medium enterprises from its net demand and time liabilities (NDTL) for the purpose of calculating cash reserve ratio (CRR).
**********

