india’s trade in 2020: a mapping of relevant...
TRANSCRIPT

India’s Trade in 2020: A Mapping of Relevant Factors
Nagesh Kumar
A paper prepared for the Committee on Vision 2020 for India,
Planning Commission, Government of India
Revised Version: 22 May 2001
Research and Information System for the Non-aligned and Other Developing Countries, Zone 4B, India Habitat Centre, Lodi Road, New Delhi-110003.
Tel.: 468 2175, Fax: 468 2174; Email: [email protected]
An earlier version of the paper was presented at the Fifth Meeting of the Committee on Vision 2020 for India, Planning Commission, on 8 February 2001. I benefited from discussions with Dr V.R. Panchamukhi, and from comments of Dr S.P. Gupta and other participants at the Meeting The usual disclaimer applies.
2
India’s Trade in 2020: A Mapping of Relevant Factors
Introduction
India's trade has generally grown at a faster rate compared to the growth of GDP over the past
two decades. With the liberalization since 1991 in particular, the importance of international trade
in India’s economy has grown considerably. As a result the ratio of international trade to GDP
has gone up from 14 per cent in 1980 to nearly 20 per cent towards the end of the decade of
1990s. Given the trends of globalization and liberalization, the openness of Indian economy is
expected to grow further in the coming two decades. The more exact magnitude of India's trade
in 2020 and its proportion to India's national income would be determined by a variety of factors.
Many of these factors are in the nature of external shocks and are beyond the control of national
policy making. One illustration is the recent surge in the crude oil prices in the international
market to unprecedented levels that have impacted the country’s imports in a significant manner.
In addition, the implementation of various WTO agreements are likely to affect the India's trade.
India's trade is also likely to be affected by various bilateral/ regional preferential trade
arrangements that have been concluded and those that might take shape in the coming years.
This paper attempts to provide a mapping of different factors that are likely to shape the patterns
and magnitudes of India's imports and exports over the coming two decades. These factors are
classified into three, namely:
1) factors affecting the demand for India's exports of goods and services;
2) factors affecting the supply of India's exports of goods and services; and
3) factors affecting the demand for India's imports.
The supply of imports may be assumed to be elastic and hence is not discussed.
The structure of the paper is as follows. Section 1 maps out various factors affecting demand for
India’s exports, Section 2, factors affecting supply of India’s exports. Section 3 lists the factors
3
that are likely to affect demand for India’s imports. Section 4 briefly summarizes emerging
patterns of India’s comparative advantage in exports of good and services. Section 5 makes some
concluding remarks.
1. Factors Affecting the Demand for Exports
There is a multitude of factors that are likely to affect the demand for India's exports of goods and
services as seen below.
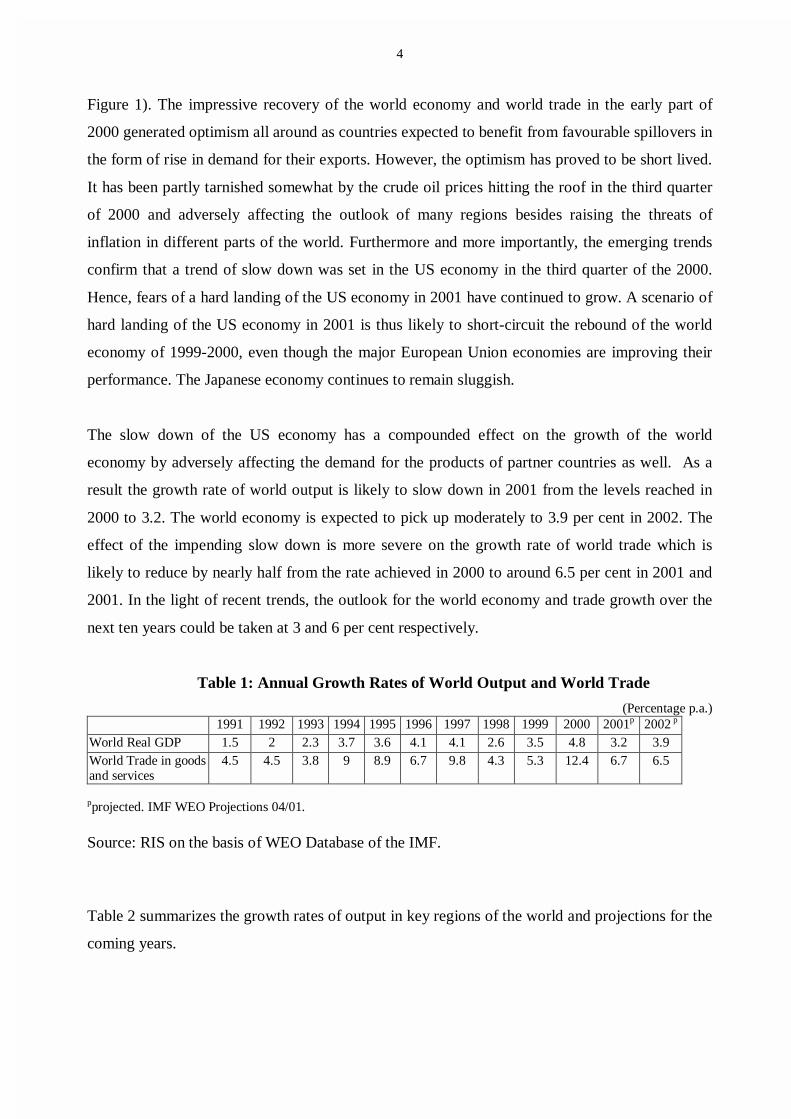
1.1 Growth Performance of World Economy and Key Trading Regions
The growth rates of the world economy and world trade do influence the overall demand for
India's exports. For instance, the rates of stagnation in the growth rate of world trade in the period
since 1996 have affected the growth of India's exports. Some broad correspondence between the
growth rates of world trade and Indian exports is evident from Figure 1. Depending upon the
intensities of India's trade relations the growth prospects in these specific regions may also affect
the demand for India's exports. The regions which may be particularly important for India's
exports include North America, the European Union, Middle East, East and Southeast Asia and
South Asia. Therefore, it will be important to watch the growth outlook and projections for these
regions.
Figure 1: Growth Rates of World Trade and India's Exports Over the 1990s
Source: RIS on the basis of WEO Database of the IMF
1.1.1. World Output and Trade at the Turn of the Century and the Outlook
The world economy in 2000 seems to have fully recovered from the slow down of 1998-1999 on
account of the East Asian crisis. The estimated world output growth of 4.8 percent in 2000 is
highest since 1988 and of world trade at 12.4 percent is highest of the past 25 years (Table 1,
-10-505
10152025
1991 1992 1993 1994 1995 1996 1997 1998 1999
Per
cen
tag
India's exports World Trade
4
Figure 1). The impressive recovery of the world economy and world trade in the early part of
2000 generated optimism all around as countries expected to benefit from favourable spillovers in
the form of rise in demand for their exports. However, the optimism has proved to be short lived.
It has been partly tarnished somewhat by the crude oil prices hitting the roof in the third quarter
of 2000 and adversely affecting the outlook of many regions besides raising the threats of
inflation in different parts of the world. Furthermore and more importantly, the emerging trends
confirm that a trend of slow down was set in the US economy in the third quarter of the 2000.
Hence, fears of a hard landing of the US economy in 2001 have continued to grow. A scenario of
hard landing of the US economy in 2001 is thus likely to short-circuit the rebound of the world
economy of 1999-2000, even though the major European Union economies are improving their
performance. The Japanese economy continues to remain sluggish.
The slow down of the US economy has a compounded effect on the growth of the world
economy by adversely affecting the demand for the products of partner countries as well. As a
result the growth rate of world output is likely to slow down in 2001 from the levels reached in
2000 to 3.2. The world economy is expected to pick up moderately to 3.9 per cent in 2002. The
effect of the impending slow down is more severe on the growth rate of world trade which is
likely to reduce by nearly half from the rate achieved in 2000 to around 6.5 per cent in 2001 and
2001. In the light of recent trends, the outlook for the world economy and trade growth over the
next ten years could be taken at 3 and 6 per cent respectively.
Table 1: Annual Growth Rates of World Output and World Trade
(Percentage p.a.) 1991 1992 1993 1994 1995 1996 1997 1998 1999 2000 2001p 2002 p
World Real GDP 1.5 2 2.3 3.7 3.6 4.1 4.1 2.6 3.5 4.8 3.2 3.9 World Trade in goods and services
4.5 4.5 3.8 9 8.9 6.7 9.8 4.3 5.3 12.4 6.7 6.5
pprojected. IMF WEO Projections 04/01. Source: RIS on the basis of WEO Database of the IMF. Table 2 summarizes the growth rates of output in key regions of the world and projections for the
coming years.
5
Table 2: Growth Outlook in India’s Major Trade Partners
WB/GEP Projections (12/00)
IMF/WEO Projections (05/01)
Region/ country
1998 1999 2000 2001 2002 2001 2002
World 2.6 3.5 4.8 3.4 3.2 3.2 3.9
United States 4.4 4.2 5.0 3.2 2.9 1.5 2.5
European Union 2.7 2.6 3.4 3.2 2.8 2.4 2.8
Japan -2.5 0.8 1.7 2.1 2.2 0.6 1.5
Developing Countries 3.5 3.8 5.8 5.0 4.8 5.0 5.6
Developing Asia 4.1 6.1 6.9 5.9 6.3
East Asia 5* -8.2 6.7 6.9 5.5 5.1 3.4# 4.7#
South Asia 5.6 5.7 6.4 5.5 5.5 5.6 5.9
Middle East 0.8 5.4 2.9 4.6
Latin America and the Caribbean
2.0 0.2 4.1 4.1 4.3 3.7 4.4
Sub-Saharan Africa 2.0 2.3 3.0 3.4 3.7 4.2 4.4
*Indonesia, South Korea, Malaysia, the Philippines, and Thailand. #ASEAN-4.
Source: RIS based on World Bank (2001), IMF (2001).
1.2 WTO Agreements
Since the implementation of the Final Act of the Uruguay Round in 1995, the WTO Agreements
have become important factors in determining the patterns of world trade. Their full impact is not
yet obvious as many provisions of these agreements are yet to be implemented because of the
transition period provided. Most of the remaining provisions of the WTO agreements would be
implemented in the coming five years. Therefore, the patterns of trade in 2020 would have to be
speculated keeping in mind the impact of full implementation of the WTO agreements. Some of
the agreements which are likely to affect India's exports are the following.
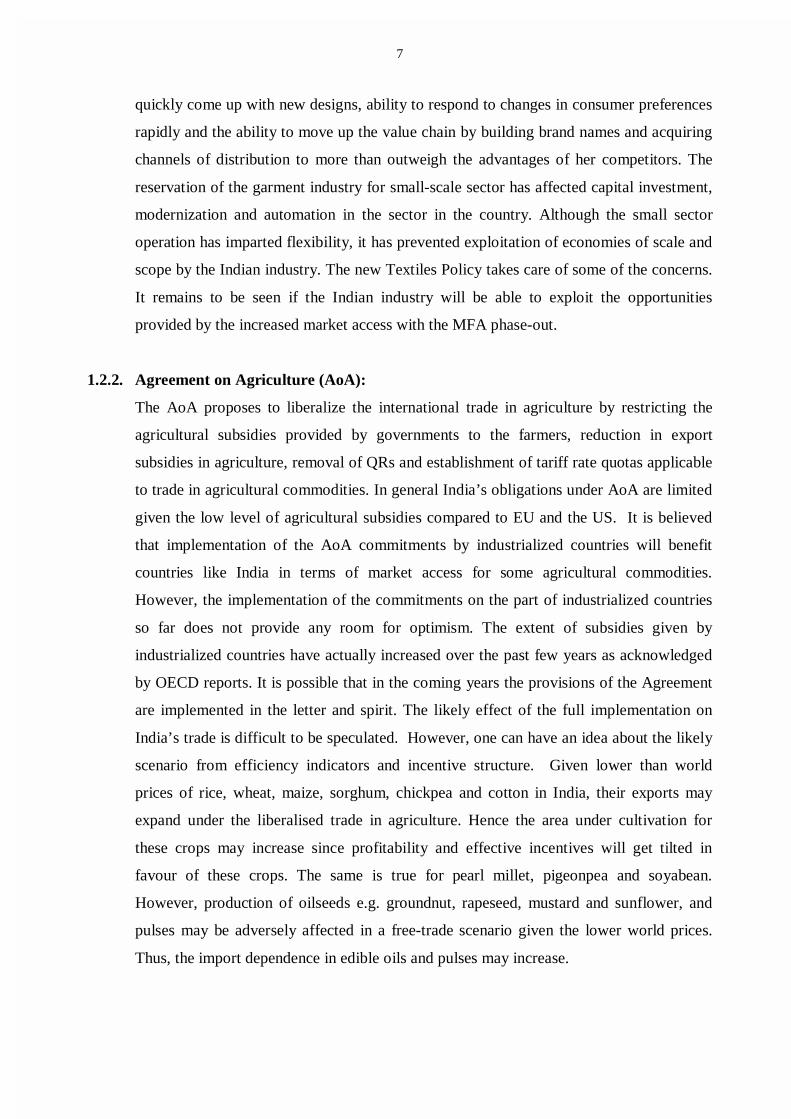
1.2.1 Agreement on Textiles and Clothing
The Agreement on Textiles and Clothing (ATC) proposes to phase out the MFA quotas
imposed by the developed countries on the imports of textiles and clothing from
developing countries over a period of 10 years ending on 31st December 2004. Given the
fact that India has substantially fulfilled her quota for the products coming under MFA, it
may appear that the phasing out of these quotas would help in the expansion of exports.
However, the impact of the phase out is likely to be a mixed bag. This is because with
MFA phase out, Indian exporters would be competing directly with other exporters of
textiles and garments such as China, Korea, Taiwan, Pakistan, Thailand, Turkey, Mexico,

6
Hong Kong, Indonesia, Macau, Philippines, Sri Lanka, Bangladesh, among others.
Therefore, while ATC provides an opportunity to Indian exporters to expand their exports
of textiles and garments by removing the quota restrictions, it also poses a challenge of
increased international competition. Some of them will enjoy preferential access to the
importing countries due to their least developed country (LDC) status such as
Bangladesh.
There are apprehensions on the full benefits of phase out being available to developing
countries. As such the schedule of the phase-out has been back-loaded over a ten-year
long phase-out period. The industrialized countries may use other protectionist measures
such as anti-dumping to prevent market access after the phase-out of quotas. A large
number of textiles and clothing products already face tariffs in the range of 15 to 30 per
cent in the Quad countries (World Bank, 2000). Some attempts of restricting them with
anti-dumping duties have already been made against these exports including those from
India.
Another factor that will affect the competitiveness of Indian exports of textiles and
garments in the post-MFA regime is the availability of trade preferences to emerging
competitors of India. For instance, Mediterranean countries such as Turkey, Cyprus and
Malta and Central and Eastern European countries enjoy free trade agreement with the
European Union ahead of their full membership. The Caribbean countries enjoy a similar
preferential access to the United States market under the Caribbean Basin Initiative (CBI).
Mexico enjoys a privileged access to the North American Market as a member of
NAFTA. These trade preferences have already resulted into diversion of trade in textiles
and clothing to these countries. For instance, Mexican exports of clothing to the United
States have grown at the rate of 27 and 15 percent in 1998 and 1999, respectively with the
growth rate of exports to Canada in these years being 30 percent and 26 percent,
respectively. Similarly, exports of clothing from Bulgaria, Hungary, Poland, Romania,
Turkey to the European Union in 1998 have grown at 26 percent, 14 percent, 11 percent,
23 percent and 11 percent, respectively (WTO, 2000).
The ability of Indian exporters to take advantage of phase out the MFA quotas by 2004
will depend upon a number of factors such as their ability to enhance overall international
competitiveness with productivity and efficiency improvements, quality control, ability to
7
quickly come up with new designs, ability to respond to changes in consumer preferences
rapidly and the ability to move up the value chain by building brand names and acquiring
channels of distribution to more than outweigh the advantages of her competitors. The
reservation of the garment industry for small-scale sector has affected capital investment,
modernization and automation in the sector in the country. Although the small sector
operation has imparted flexibility, it has prevented exploitation of economies of scale and
scope by the Indian industry. The new Textiles Policy takes care of some of the concerns.
It remains to be seen if the Indian industry will be able to exploit the opportunities
provided by the increased market access with the MFA phase-out.
1.2.2. Agreement on Agriculture (AoA):
The AoA proposes to liberalize the international trade in agriculture by restricting the
agricultural subsidies provided by governments to the farmers, reduction in export
subsidies in agriculture, removal of QRs and establishment of tariff rate quotas applicable
to trade in agricultural commodities. In general India’s obligations under AoA are limited
given the low level of agricultural subsidies compared to EU and the US. It is believed
that implementation of the AoA commitments by industrialized countries will benefit
countries like India in terms of market access for some agricultural commodities.
However, the implementation of the commitments on the part of industrialized countries
so far does not provide any room for optimism. The extent of subsidies given by
industrialized countries have actually increased over the past few years as acknowledged
by OECD reports. It is possible that in the coming years the provisions of the Agreement
are implemented in the letter and spirit. The likely effect of the full implementation on
India’s trade is difficult to be speculated. However, one can have an idea about the likely
scenario from efficiency indicators and incentive structure. Given lower than world
prices of rice, wheat, maize, sorghum, chickpea and cotton in India, their exports may
expand under the liberalised trade in agriculture. Hence the area under cultivation for
these crops may increase since profitability and effective incentives will get tilted in
favour of these crops. The same is true for pearl millet, pigeonpea and soyabean.
However, production of oilseeds e.g. groundnut, rapeseed, mustard and sunflower, and
pulses may be adversely affected in a free-trade scenario given the lower world prices.
Thus, the import dependence in edible oils and pulses may increase.
8
1.2.3. Anti-dumping Regulations
The Indian exports of a number of commodities have been subjected to anti-dumping
regulations by some of our important trading partners such as the United States and the
European Union. The onslaught of the anti-dumping measures on Indian exports is likely
to increase in future with the growing competitiveness of Indian products. In order to
minimize their disruptive effect of these regulations on India's exports, the industry and
government will have to strengthen the machinery to counter such actions (Panchamukhi,
2000).
1.2.4. Tariff Negotiations and New Trade Round
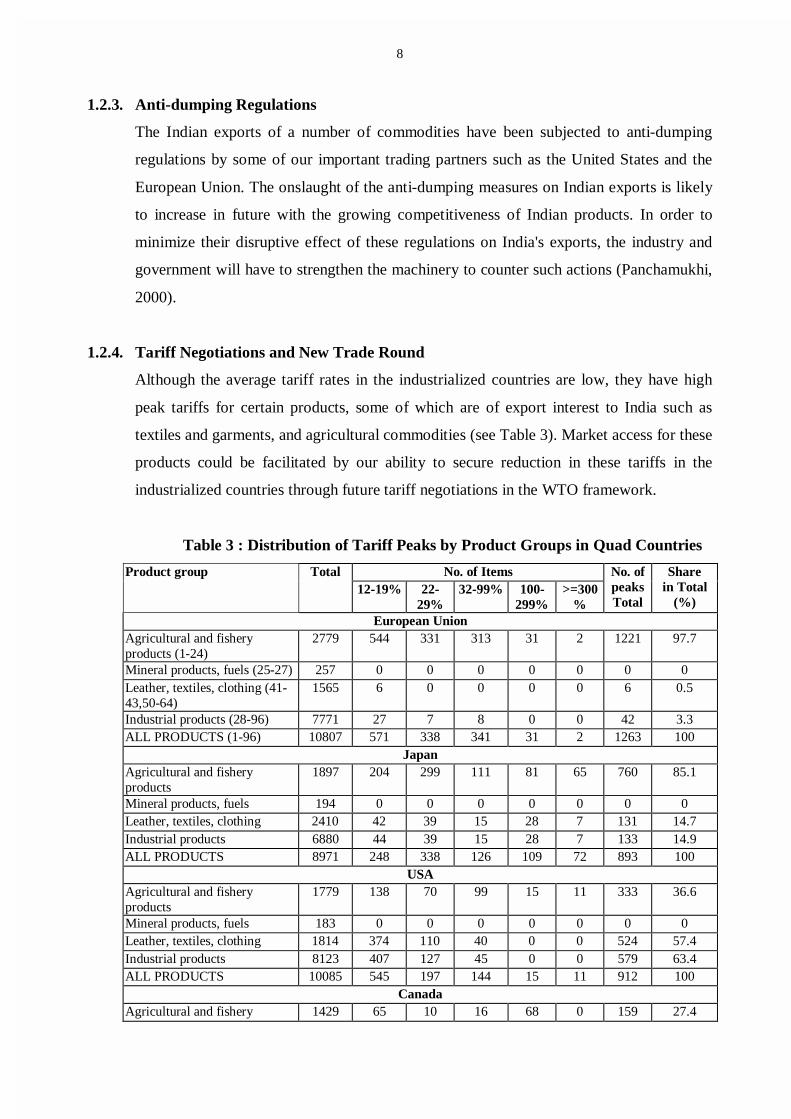
Although the average tariff rates in the industrialized countries are low, they have high
peak tariffs for certain products, some of which are of export interest to India such as
textiles and garments, and agricultural commodities (see Table 3). Market access for these
products could be facilitated by our ability to secure reduction in these tariffs in the
industrialized countries through future tariff negotiations in the WTO framework.
Table 3 : Distribution of Tariff Peaks by Product Groups in Quad Countries
No. of Items Product group Total 12-19% 22-
29% 32-99% 100-
299% >=300
%
No. of peaks Total
Share in Total
(%) European Union
Agricultural and fishery products (1-24)
2779 544 331 313 31 2 1221 97.7
Mineral products, fuels (25-27) 257 0 0 0 0 0 0 0 Leather, textiles, clothing (41-43,50-64)
1565 6 0 0 0 0 6 0.5
Industrial products (28-96) 7771 27 7 8 0 0 42 3.3 ALL PRODUCTS (1-96) 10807 571 338 341 31 2 1263 100
Japan Agricultural and fishery products
1897 204 299 111 81 65 760 85.1
Mineral products, fuels 194 0 0 0 0 0 0 0 Leather, textiles, clothing 2410 42 39 15 28 7 131 14.7 Industrial products 6880 44 39 15 28 7 133 14.9 ALL PRODUCTS 8971 248 338 126 109 72 893 100
USA Agricultural and fishery products
1779 138 70 99 15 11 333 36.6
Mineral products, fuels 183 0 0 0 0 0 0 0 Leather, textiles, clothing 1814 374 110 40 0 0 524 57.4 Industrial products 8123 407 127 45 0 0 579 63.4 ALL PRODUCTS 10085 545 197 144 15 11 912 100
Canada Agricultural and fishery 1429 65 10 16 68 0 159 27.4

9
products Mineral products, fuels 187 5 0 0 0 0 5 0.9 Leather, textiles, clothing 1209 320 27 0 0 0 347 60.1 Industrial products 6791 374 39 0 0 0 413 71.6 ALL PRODUCTS 8407 444 49 16 68 0 577 100
N.B. HS Chapters are given in parentheses.
Source: RIS based on UNCTAD/WTO (2000) The Post-Uruguay Round Tariff Environment For Developing Country Exports: Tariff Peaks and Tariff Escalation, UNCTAD, Geneva (TD/B/COM.1/14/Rev.1; 28 January 2000)
1.2.5. Trade Preferences for the Least Developed Countries
One emerging development in the WTO system has been the tendency to divide the
developing countries with the offer of special trade preferences for the least developed
countries. A sizeable proportion of India's exports still comprise labour and resource
intensive goods that are also exported by some of the least developed countries. If
successful these preferences have the prospects of diverting trade from India to the least
developed countries. The potential of these trade preferences for adversely affecting
India’s exports needs to be kept in mind.
1.3 China's Accession to WTO
One of the important events of the coming years for the world trade may be the entry of China
into the WTO regime. China signed an agreement with the US for its entry into the WTO in
November 1999. It has subsequently been negotiating such agreements with other WTO
members. The accession of China to the WTO and hence the MFN status that it will receive from
other WTO countries may have some implications for the competitiveness of India's exports. This
is because India and China compete in the international market for a number of labour intensive
and matured technology goods such as textiles and garments, leather goods, light engineering
products, chemicals and pharmaceuticals, among others. China has already been giving tough
competition to Indian exports in many commodities and markets. There is a view that the
accession to WTO may further strengthen China’s competitiveness and hence may affect the
Indian exports adversely. There is another view that the accession of China to WTO would force
it to follow WTO norms and procedures, etc. and will bring their trade policy under international
surveillance. State subsidies will be regulated and hence it will make it more difficult for the
Chinese exporters to dump their products in the world market. The exact impact of the accession
of China to the WTO on the India's export prospects will depend upon these counteracting
10
effects. It is important to analyze the effects of Chinese accession to WTO on the competitiveness
of Indian exports.
1.4. Preferential Trade Arrangements/Free Trade Arrangements in Rest of the World
The last decade and a half has seen the proliferation of regional trading arrangements in different
parts of the world. The major trading blocks that have emerged over the years include the
European Union, NAFTA, Mercosur, AFTA, COMESA, among others. Besides, these free trade
and common market agreements, a number of other countries have become integrated with the
trading blocks through a variety of preferential or free trade arrangements. For instance,
European Union has extended free trade agreement treatment to a number of Central Eastern
European Union and Mediterranean countries in anticipation of full membership to these
countries in the EU. These arrangements could also act to divert trade away from India especially
in the labour intensive goods, as indicated earlier in the case of textiles and clothing.
1.5. Regional/Bilateral Free Trade Arrangements
India has taken several steps to liberalize trade with her trading partners in the South Asia region
on regional as well as bilateral basis. These steps include participation to SAARC Preferential
Trading Arrangements (SAPTA) that came into being in December 1995. Under this Agreement,
India has exchanged trade concessions with the SAARC member countries for nearly 3000
commodities in the first three rounds of negotiations. The fourth round of these negotiations is in
the process. It is expected that the process of trade liberalization in the framework of SAARC
will culminate into a South Asia Free Trade Agreement (SAFTA), although, it may take some
time to take shape given the current impasse in the SAARC process. Besides SAPTA, India has
recently signed a bilateral free trade agreement with Sri Lanka. India already has bilateral free
trade agreement with Nepal and Bhutan. A bilateral free trade agreement is being contemplated
with Bangladesh as well. There are other attempts of regional/sub-regional economic integration
which may also come into being in the coming decade, for instance, BIMST-EC (Bangladesh,
India, Myanmar, Sri Lanka and Thailand Economic Cooperation) which has been formed
recently may adopt a preferential trading arrangement between the member countries. Although
India is also a founder member of the Indian Ocean Rim Association for Regional Cooperation
(IOR-ARC), a preferential trading arrangement is not contemplated as the Association has
adopted the concept of open regionalism on the lines of APEC.
11
All these attempts at free trade with the regional partners may open the markets for Indian goods
further in the countries concerned. It is evident that the share of South Asian countries in India's
exports has increased from 2.73 to 4.9 over the period 1990 to 1999. The recent initiatives in
regional/ bilateral trade liberalization may help to divert some trade of the countries concerned
from their other trading partners in favour of India given the supply capabilities.
2. Factors Affecting the Supply of Exports
It is widely believed that the major factors constraining India’s exports lie not in the lack of
demand but more in the supply side constraints. Most of the supply side factors need to be
addressed as a part of the policy towards trade. Some of the factors that constrain the volume and
composition of India's exports are as follows:
2.1 Infrastructural Bottlenecks
It is widely accepted that India's export potential remains considerably unfulfilled because of
infrastructure bottlenecks such as power shortages, port handling facilities, delays in
transportation which in turn are due to poor transport links within the country and poor
communication facilities. The inability of Indian exporters in meeting supply schedules costs
dearly in terms of image of India as a reliable source of supply. Not only that the availability of
the infrastructure services is inadequate but the efficiency and quality of the delivery of what is
available is highly uneven. The ability of the government in removing these constraints in the
coming years will also determine the supply side of Indian exports.
2.2. Growth of Domestic Demand
A rapid growth of domestic demand may also affect India's ability to export at least in certain
products, for instance, in tea where the rapid growth of domestic demand is expected to reduce
the export surplus in the coming years. It may also apply to a number of other agricultural
commodities such as rice, cotton, among others.
2.3 Inflows of Export-oriented Foreign Direct Investment
Multinational enterprises (MNEs) have played an important role in the rapid growth of
manufactured exports from the East and South-East Asian countries. This is because the South
East and East Asian countries were able to attract export platform investments from US and
Japanese MNEs in the 1970s and 1980s. The export platform or export-oriented investment arises
12
in the process of relocation of production by MNEs abroad in order to maintain their international
competitiveness in the face of rising wages and other costs in their home countries. In Malaysia
and Indonesia, for instance, 70 percent of the projects involving FDI have been export-oriented.
In China, the share of foreign owned firms in exports has risen from 5 percent in 1988 to 40
percent by 1997. In contrast, the share of foreign affiliates in India's exports is marginal at 5 to 7
percent (Kumar and Siddharthan, 1997, for a review of evidence from different countries).
Therefore, India has not been able to exploit the potential of MNEs for export-oriented
production. MNEs can play an important role in promotion of India's manufacture exports with
relocation of export platform production in the country with their access to global marketing
networks, best practice technology and organizational know-how. To some extent, therefore,
India's ability to attract export-oriented FDI will determine the magnitude of India's exports in
2020. The studies have shown that export-oriented FDI inflows are of special type and are
determined by different factors than other types of FDI (Kumar, 1994). The studies also find
differences in the nature and determinants of export platform investments that are geared to
MNEs' home markets and those targeting the third countries (Kumar, 1998). India may make an
effort to target the export platform investments of both types by sharpening her bundle of
resource endowments and created assets in the light of determinants identified by these studies.
2.5 Technological Upgrading and Movement along with the Value Chain
The Indian export structure has been highly dominated by simple and un-differentiated products
where the main competitive advantage lies in cheap labour, low levels of skills and simple
technologies compared to that of China and South East Asian countries except for recent growth
of pharmaceuticals and software services (Lall, 1999). Not only these products are slow moving,
the export structure is highly vulnerable to competition. India's competitiveness has also been
adversely affected by the failure to diversify the commodity composition of our exports. In fact
the commodity concentration of India's exports has increased with a 9 percent rise in the share of
top six groups of exports in total and exports between 1987-1988 to 1998-99 (Kumar, 2000a). In
comparison to India, Southeast and East Asian countries have rapidly diversified their export
structure in favour of technologically advanced goods. For instance, share of technologically
advanced goods (differentiated and science based goods) in India’s manufactured exports rose
marginally to about 8 per cent by the mid-1990s over 5.6 per cent in the mid-1970s; in China, this
proportion increased from 8.8 per cent to 23 per cent over the 1987-95 period, and for Malaysia
from 12 per cent to 57 per cent over the 1980 to 1995 (Pigato et al. 1997). The markets for low
13
technology undifferentiated goods are highly price competitive and margins are kept under
pressure by constant competition by entry of new low wage countries.
Paying Attention to R&D Activity
The failure to diversify the export structure in favour of technologically more demanding
products has been due to the relative neglect of R&D activity by the Indian industry, among other
factors. The R&D activity of enterprises helps them in strengthening their international
competitiveness with productivity improvements and product innovations. Not only has the
proportion of national resources devoted to science and technology come down from a peak of
0.98 per cent attained in 1988 to 0.66 per cent by 1997, the R&D intensities in most industries
have also declined in the 1990s (Kumar and Aggarwal, 2000). Studies have shown that export
competitiveness in technology intensive industries can not be secured on the basis of import of
technology alone (Kumar and Siddharthan, 1994). Therefore, technological upgrading of India's
exports will not be possible without a considerable emphasis paid by the corporate sector to in-
house R&D activity aimed at efficiency seeking process innovations and new product
developments. The government needs to review, strengthen and consolidate the incentive
structure for corporate R&D activity in the country. In particular, there is need to examine the
desirability of more direct incentives to R&D activity which have been adopted by the advanced
industrialized countries to further the international competitiveness of national enterprises as a
part of strategic trade policy.
Building Indigenous Brands
Furthermore, the importance of building indigenous brands and their following globally through
advertisement in the global media for international competitiveness can not be over emphasized.
The ability to market a product under own brand name alone allows realization of value addition
more fully. Otherwise, Indian companies will continue to produce and export undifferentiated
simple technology and standardized products that are sold cheap and have low margins. Here
again there is imperative for assisting the industry in building their own indigenous brands. This
could include funding of brand promotion expenses and incentives given to products sold under
indigenous brand names.
Overseas Presence
Establishment of foreign presence in the globalizing world economy and hence the ability to
develop and supervise marketing network and provide after sales services has become an
14
important aspect of overall competitiveness. The Indian enterprises should make aggressive use
of overseas investments and acquisitions (M&As) abroad as a part of their strategy to gain
competitiveness, access to markets, brand names and marketing networks. A few Indian
companies have strengthened their presence in respective overseas markets with acquisitions and
overseas investments successfully. These include Tata Tea that has taken over Tetley in the UK
and with it an instant access to globally recognized brand names, marketing networks and world-
wide presence. By integrating its Indian production activities with Tetley's marketing network,
Tata Tea will be able to realize the value addition in different phases of value chain in the tea
industry more completely. Companies like Ranbaxy in pharmaceuticals and Titan Industries in
brand name sensitive segment of watches have adopted overseas investment route with
significant success. More Indian companies need to follow these channels for strengthening their
presence abroad.
Efficiency Seeking Corporate Restructuring
Finally, an efficiency seeking restructuring and consolidation of Indian industry could also help
them to reap economies of scale, scope and specialization and in the process strengthening their
international competitiveness. The liberalization of the economy has already provoked some
restructuring in the Indian corporate sector focusing on core competencies of the enterprises
through M&As (for instance, Tata Steel selling its cement plants, Raymonds selling its cement
and steel divisions, Birla companies consolidating their cement capacities, etc.). Subject to the
competition policy, this trend is a desirable one and will contribute to the efficiency
improvement.
2.6 WTO Regime
Some of the WTO Agreements also have the provisions that are likely to affect the supply of
India’s exports as discussed below.
2.6.1. TRIPs Agreement
The Agreement on Trade Related Intellectual Property System (TRIPs) attempts to
harmonize the intellectual property protection regime across the world. In particular, India
will have to adopt product patents for chemicals, pharmaceuticals and food processing
industries besides extending the term of the patents to 20 years by 1.1.2005. In the
transition period till 2005, a mail box mechanism has been set-up and the applicants for
product patents are granted exclusive market rights. Very few Indian companies are

15
capable to sustaining product innovations in pharmaceutical industries given huge
research, development and commercialization costs. Therefore, TRIPs Agreement is
likely to lead to an international division of labour in pharmaceutical industries where
countries like India with limited capability of product innovations will specialize in off-
the-patent generic products markets and more advanced countries on innovation based
new drugs. The markets for generics are highly competitive and price elastic. In order to
be able to move up the value chain and upgrade their profile in the international markets,
Indian pharmaceutical companies will need to develop some market niches and build
product innovations capability in those areas. Some leading companies have begun to
conduct R&D activity for product innovations and to develop new drug delivery systems
(NDDS).
2.6.2. Phase out of QRs and Dividend Balancing under TRIMs
A number of companies especially MNE subsidiaries were prompted to export in the
previous trade regime by the need to earn import licenses or by dividend balancing
condition imposed on 22 consumer goods industries. With the removal of QRs and the
dividend balancing requirements to fulfil India’s commitments under WTO Agreements,
those exports will not be necessary any more. Hence, export-orientation of some
companies may come down.
2.6.3. Agreement on Sanitary and Phytosanitary (SPS) Measures
The Agreement on Sanitary and Phytosanitary (SPS) Measures, aims at uniform standards
for the protection of human, animal and plant life or health. The Agreement provides a
transition period to developing countries for complying with the provisions. SPS
measures are likely to affect India’s ability to export high-value food products and
perishables. Thus, there is no alternative but to align standards in accordance with
international norms.
2.7. Supply Constraints on Exports of Knowledge-based Services
India has emerged as a significant supplier of certain knowledge intensive services such as
custom software and other IT enabled services over the past few years. Software exports over the
past five years have grown at a compound annual growth rate of over 50 per cent (Kumar,
2000b). Sustainability of such a rapid growth of these exports is critically dependent upon our
16
ability to increase the supply of engineering manpower (also see Wood and Calandrino, 2000).
The growing scarcity of the engineering talent in the recent years is compounded by growing
brain drain. In response to the growing scarcities of trained manpower for their IT industry, many
countries have relaxed their immigration policies allowing their companies to recruit Indian
engineers. However, currently some of these workers who emigrated are returning back because
of slow down of the US economy. This, however, is a temporary phase.
The rapid rise of software industry has suddenly caused general scarcity of engineers in all
disciplines leading to a sharp rise in their salaries. The engineering industry in the country is
finding it difficult to find an adequate number of engineers for their requirement. The impact of
rising salaries on the competitiveness of the engineering and other industries that compete for the
engineering talent with the software industry is not clear but is likely to be significant.
Side by side the growing scarcity of engineering and IT trained manpower, India's educational
system is churning out masses of conventional science and social science graduates who can not
find adequate job opportunities. There is an immediate need for re-engineering the educational
system geared for the presence times. IT education should integrated in school and college
curricula and traditional disciplines such as fine arts which could feed the growing needs for
Computer Aided Design personnel. Some steps have been taken recently to augment the supply
of engineering manpower as a part of the IT Action Plan which includes expanding the capacity
of IITs and upgradation of REC to the IIT levels. Some new institutes of IT have been set up
besides promotion of private sector training. It remains to be seen how far this expansion can be
achieved without affecting the quality of the education.
2.8. Exchange Rates Alignments
The competitiveness of India’s exports is also likely to be affected by the alignments in the
exchange rates. The future trends in the parities of not only the major currencies such as dollar,
euro and yen but also currencies of India’s major competitors in specific product / market
segments will affect the competitiveness of India’s exports.
3. Factors Affecting the Demand for Imports
The demand for India's imports will be largely determined by the overall growth of the economy,
the changing patterns of growth and the ongoing process of trade liberalization.
17
3.1 India's Growth Performance
The magnitude of imports to a large extent is linked to the size of the economy. The changing
pattern of the economy in favour of tradable goods in future may also affect the overall import
requirements for the country. The import to GDP ratio has increased from an average of 7.7
percent for the 1980s to 10 percent in the 1990s as a result of increasing import dependence of
the Indian economy in the wake of trade liberalization and changing patterns of development. It
is of interest to speculate on the projected growth rate of the economy in the next two decades
and emerging patterns of demand and import intensity of the economy.
3.2.1 Trade Liberalization
As a result of the trade liberalization attempted since July 1991 maximum tariff rates applicable
in India have come down from a peak of 355 percent in 1990-91 to 50.8 percent by the year
1998-99. The average weighted tariff rate has come down from 87 percent to 20 percent from the
same period. The non-tariff measures for most of the commodities have also been phased from 1st
April 2001. The process of trade liberalization is still not completed. It is expected that the tariff
rates will be lowered further in the coming years in the context of regional and bilateral
preferential trade arrangements as well as future WTO negotiations. Given the fact that demand
for many of the items of imports is price elastic, the future tariff reductions may lead to higher
imports. In particular, consumer goods imports may be highly sensitive to liberalization.
3.2 Crude Prices
The year 2000 witnessed extreme volatility in the crude oil prices that hit the roof at $ 35 per
barrel in September 2000 from about $ 12 per barrel a year ago. Although these prices have since
declined to a level of $ 26 per barrel, they have hardly stabilized. OPEC has decided to cut the
oil output by 1.5 million barrels a day in an effort to raise the prices in mid-January 2001. It has
been estimated that $ 1 per barrel variation in the international prices of crude results in $ 500
million change in India's oil import bill on an annualized basis at the current level of imports.
Given the determination of OPEC to keep the prices at high levels by cutting production, the oil
prices may rule around $ 25 per barrel in the coming years, although international organizations
are more optimistic (World Bank 2000; IMF 2000). The volatility of oil prices is a highly
destabilizing factor for the Indian economy.
18
3.4 Industrial Restructuring and Rationalization
The process of liberalization is likely to provoke a trend of efficiency seeking restructuring of
Indian industry where some of the indigenous intermediate inputs may be substituted by imported
materials to enhance the overall efficiency and competitiveness of the manufacturing process.
This rationalization of production may lead to increased demand for imports of a number of
products at the cost of local production.
4. Emerging Patterns of Comparative Advantage in Goods and Services
A look at the export profile of India over the past two decades brings out products where it has
improved its share of the world market and others where it has lost the markets. Table 4
summarizes the patterns emerging from the analysis of changes in India’s share in world markets.
It comes out that other than textiles and garments industry, metals and gems and jewellary,
chemicals and allied sectors are the only groups of manufactures where India has strengthened its
presence in the world market. In almost all engineering and capital goods industries, Indian
presence has either been stagnant or has declined. It would be useful to consolidate India’s
presence in the chemical industry with a coordinated plan to become key players in specific niche
areas and strengthen the competitiveness with further process and product innovations. India also
has a potential to develop into a leading player in the large market of generic pharmaceuticals.
Some Indian companies have positioned themselves as leading and most cost effective producers
of some common generic drugs which are in public domain. As observed earlier, we need to
consolidate our presence in this sector further and also make some headway in highly lucrative
proprietary drugs business that is dominated by MNEs with product innovations.
Poor attention paid to technology development is one of the factors responsible for India’s
declining presence in the engineering industries. In particular, IT hardware is one area where
India should focus because of its long term growth potential. Countries such as Korea, Taiwan,
Singapore, Malaysia, Thailand and China have positioned themselves as significant players in the
IT hardware and peripherals markets. While India has lost its position in IT hardware, it has
emerged as a most important player in the IT software market, as seen below.

19
Table 4: India’s Share in World Exports, 1980-98 (percentage share)
Code Group
Commodity Division/Group 1980 1985 1990 1995 1998
A. COMMODITIES WITH INCREASING SHARES 03 Fish, crustaceans and molluscs and
preparations 2 2.4 1.6 2.1 2.5
042 Rice 3.7 5.6 6.4 18.6 10.4 06 Sugar, sugar preparations and honey 0.3 0 0.1 0.8 0.4 071 Coffee and coffee substitutes 2.1 1.9 1.7 2.8 2.7 08 Feeding stuff for animals 1.6 1.5 2.2 3.4 4.3 22 Oilseeds and oleaginous fruit 0.3 0.3 0.8 1.2 1.6 51 Organic chemicals 0.1 0.1 0.3 0.7 0.9 52 Inorganic chemicals 0.2 0.1 0.2 0.2 0.4 53 Dyeing, tanning and colouring materials 0.8 0.8 1.2 1.1 1.3 54 Medicinal and pharmaceutical products 0.8 0.8 1.2 1 1 57 Explosives and pyrotechnic products 0.1 0.1 0.2 0.3 0.7 58 Artificial resins, plastic materials, cellulose
esters & ethers 0 0 0 0.1 0.1
59 Chemical materials and products n.e.s. 0 0.2 0.2 0.4 0.6 65 Textile yarn, fabrics, made-up articles 2.3 2.1 2.1 2.6 3.3 667 Pearls, precious and semi-precious stones 3.1 9.6 9.8 12 10.7 67 Iron and steel 0.1 0.1 0.3 0.6 0.8 84 Articles of apparel and clothing accessories 1.8 2.3 2.3 2.5 2.3 Other exports 0.2 0.1 0.3 0.3 0.3 Total exports 0.4 0.5 0.5 0.6 0.6
B. COMMODITIES WITH DECLINING OR STATIC SHARES 01 Meat and meat preparations 0.4 0.4 0.2 0.4 0.4 05 Vegetables and fruits 1.1 1.4 0.8 1 1 074 Tea and mate 27.7 26.2 22.1 14.3 16.4 075 Spices 14.5 19.3 7.7 9.5 11.2 12 Tobacco and tobacco manufactures 4.4 1.8 0.8 0.5 1 28 Metalliferous ores and metal scrap 1.5 2.4 2.1 1.5 1.4 55 Essential oils and perfume materials soap,
cleansing etc 1.1 0.7 1.1 0.5 0.4
61 Leather, leather manufactures & dressed fur skins
6.8 8.3 6.3 3.1 2.9
69 Manufactures of metals n.e.s. 0.6 0.4 0.5 0.5 0.6 71 Power-generating machinery and equipment 0.2 0.2 0.2 0.1 0.2 72 Machinery specialized for particular industries 0.1 0.2 0.2 0.1 0.2 73 Metal-working machinery 0.2 0.4 0.2 0.2 0.2 74 General industrial machinery & equipment &
machine parts thereof 0.1 0.1 0.1 0.1 0.1
75 Office machinery and ADP equipment 0 0.1 0.1 0.1 0.1 76 Telecommunication and sound recording and
reproducing apparatus and equipment 0 0 0 0.1 0
77 Electrical machinery, apparatus and appliances 0.2 0.2 0.1 0.1 0.1 78 Road vehicles (including air cushion vehicles) 0.2 0.1 0.1 0.2 0.1 79 Other transport equipment 0.1 0.1 0 0 0
Source: Compiled on the basis of Government of India, Economic Surveys, various years.
20
Software and IT Services1 : A New Field of Comparative Advantage for India
The rise of the IT software and services industry (henceforth software industry) over the 1990s
represents one of the most spectacular achievements for the Indian economy. As shown in Table
5, the Indian software industry has grown at a phenomenal compound annual rate of over 50 per
cent over the 1990s from a total revenue of US $ 175 million in 1989/90 to a $ 8.7 billion
industry by 2000/01. Furthermore, the industry has earned 70 per cent of its revenue (totaling $
6.3 billion) from exports.
Table 5: Indian Software Industry Revenues and Exports
(US $ million) Year Total Domestic Exports 1989/90 197 97 100 1994/95 835 350 485 1995/96 1224 490 734 1996/97 1755 670 1085 1997/98 2700 950 1750 1998/99 3900 1250 2650 1999/2000 5700 1700 4000 2000/1 p 8750 2450 6300 Compound Annual Growth Rate 1994/99 56.3% 46.05% 60.71%
Notes: p projected;
Figure 2: Revenues and Exports of Indian Software Industry
Source: Table 5.
1 This section draws upon Kumar (2000b).
0
1000
2000
3000
40005000
6000
70008000
9000
10000
1994
/5
1995
/6
1996
/7
1997
/8
1998
/9
1999
/200
0
2000
/1p
Years
Rev
enue
s a
nd E
xpor
ts
(US$
mill
ion)
revenues exports
21
Growth Rates and Share in the Global Industry
The growth rates of revenues and of exports in US$ terms are summarized in Table 6 and Fig. 3.
It is clear that except for 1996/7, the annual export growth rate has been higher than 50 per cent.
The growth rate of overall revenue has been lower than that of exports except for 1996/7 on
account of a somewhat slower rate of growth of the domestic software market. However, the
growth rates of overall revenues and of exports have tended to converge over the past couple of
years as a result of the growth rates of the domestic software market also picking up.
Table 6: Growth Rates of Magnitudes of Software Revenue and Exports
1994/5 1995/6 1996/7 1997/8 1998/9 1999/2000 Growth Rate of Revenue in US$
34.61 56.14 53.85 44.44 48.65
Growth Rate of Exports in US$
54.46 51.34 47.82 61.29 51.43 50.94
Source: Based on Table 5. Figure 3: Growth Rates of Software Revenue and Exports
Source: Based on Table 6. To put the above growth performance in an international perspective, the Indian software
industry would account for roughly one to one and a half per cent of the US$ 400 billion global
software industry. However, India’s share in the global market for customized software that is
outsourced across borders is significant at 18.5 per cent in 1999 compared to 11.9 per cent in
1991. The growth rate of the Indian software industry has been substantially higher than the
global software industry. Apparently, India is the only country in the world to register a growth
rate of around 50 per cent in the software industry.
0
2 0
4 0
6 0
8 0
1 99 5 1 99 6 1 99 7 1 99 8 1 99 9 2 00 0
grow
th r
ates
%
G ro w th R ate O f R even u e G ro w th R ate O f E xpo rts
22
Future Outlook
The performance of the Indian software industry over the past few years has generated
tremendous optimism. Nasscom had commissioned McKinsey to provide a vision document for
the year 2008 for the Indian software industry that was released in late 1999. Nasscom-McKinsey
Report presents a bold vision for an industry with US$85 billion revenue by 2008 of which $50
billion would come from exports. The McKinsey Report bases its projections on the basis of a
few assumptions. These include that the global IT-services market will grow from $327 billion in
1997 to $1010 billion by 2008 at a cumulative annual growth rate of 10.8 per cent at which it has
been growing. Secondly, Indian exports account for marginal shares of total spending on IT
services in world’s major markets in 1997 hence the potential for a rise in their share by 2008
given the faster growth rates of the industry in India. Finally, that Indian software industry will be
able to sustain its existing competitive advantages and build further. For instance, leading Indian
companies will develop into multinational companies to anchor Indian capability with worldwide
brand recognition. On the basis of these assumptions, the Nasscom-Mckinsey Report predicts that
it would be possible for Indian software industry to export $50 billion worth of software services
and products as shown in Table 7. This target has also been adopted by the National Taskforce on
IT and Software Development (NTITSD) set up by the Prime Minister in 1998.
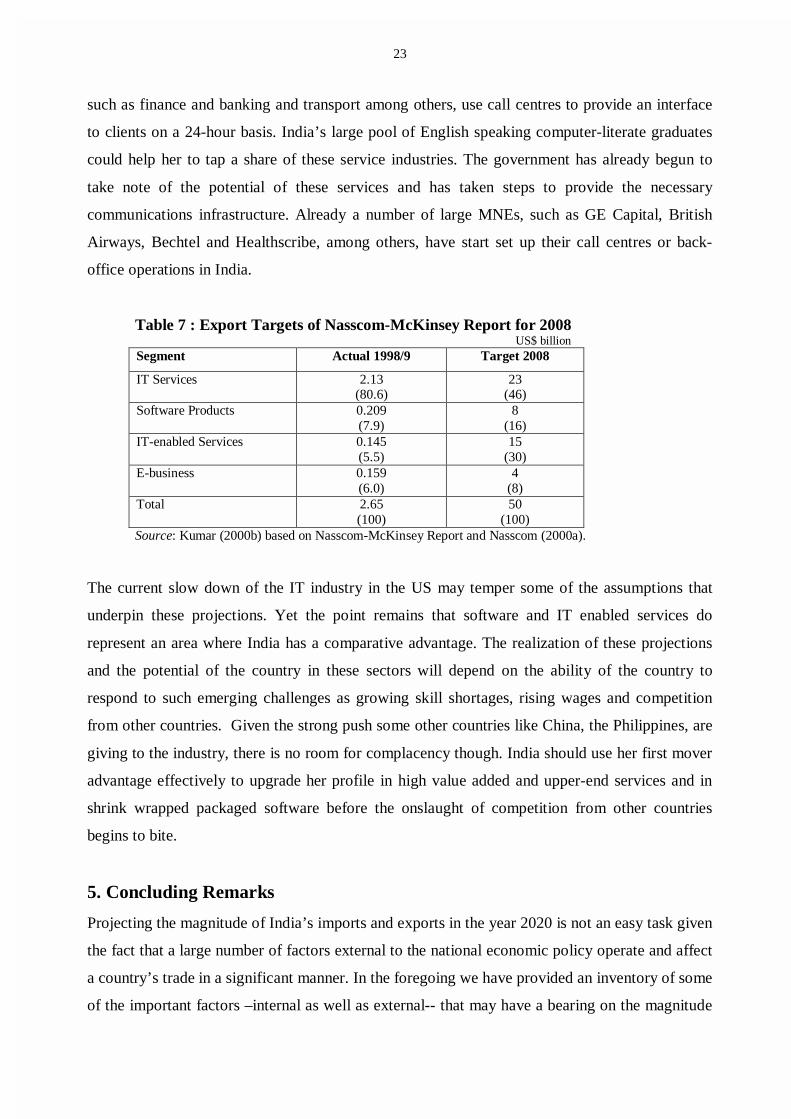
As is clear from the Table 7, the Report’s targets put a big thrust on products and on IT-enabled
services in terms of the composition of Indian exports by 2008 with a proportionate decline in the
share of services in exports. The McKinsey Report’s analysis expects Indian companies to be
able to exploit opportunities in enterprise software (ERP/EAS) and mobile computing and
embedded software given their ability to develop quality software products for the domestic
market. It finds that a big potential exists for India in the large and expanding market of what is
termed as IT-enabled services which could fetch $15 billion in export earnings by 2008 compared
to just $145 million in 1999. These services include several business activities of large
corporations that can be relocated overseas facilitated by the development of satellite
communication links. These cover broadly the back-office operations such as accounting,
insurance claims processing, legal databases, content development/animation, payrolls and
logistics management, call centres, medical transcriptions. The back-office management and
other IT-enabled services generate global revenues of $ 75 billion and are recording a 20 per cent
growth rate per annum. Call centre services is already a large industry with global revenues of $
200 billion and is growing at an annual rate of 23 per cent. Most companies in service industries
23
such as finance and banking and transport among others, use call centres to provide an interface
to clients on a 24-hour basis. India’s large pool of English speaking computer-literate graduates
could help her to tap a share of these service industries. The government has already begun to
take note of the potential of these services and has taken steps to provide the necessary
communications infrastructure. Already a number of large MNEs, such as GE Capital, British
Airways, Bechtel and Healthscribe, among others, have start set up their call centres or back-
office operations in India.
Table 7 : Export Targets of Nasscom-McKinsey Report for 2008 US$ billion
Segment Actual 1998/9 Target 2008
IT Services 2.13 (80.6)
23 (46)
Software Products 0.209 (7.9)
8 (16)
IT-enabled Services 0.145 (5.5)
15 (30)
E-business 0.159 (6.0)
4 (8)
Total 2.65 (100)
50 (100)
Source: Kumar (2000b) based on Nasscom-McKinsey Report and Nasscom (2000a).
The current slow down of the IT industry in the US may temper some of the assumptions that
underpin these projections. Yet the point remains that software and IT enabled services do
represent an area where India has a comparative advantage. The realization of these projections
and the potential of the country in these sectors will depend on the ability of the country to
respond to such emerging challenges as growing skill shortages, rising wages and competition
from other countries. Given the strong push some other countries like China, the Philippines, are
giving to the industry, there is no room for complacency though. India should use her first mover
advantage effectively to upgrade her profile in high value added and upper-end services and in
shrink wrapped packaged software before the onslaught of competition from other countries
begins to bite.
5. Concluding Remarks
Projecting the magnitude of India’s imports and exports in the year 2020 is not an easy task given
the fact that a large number of factors external to the national economic policy operate and affect
a country’s trade in a significant manner. In the foregoing we have provided an inventory of some
of the important factors –internal as well as external-- that may have a bearing on the magnitude
24
and patterns of trade flows in 2020. Given the uncertainties involved in projecting the trade
figures, it may be more appropriate to set targets for specific items of India’s exports by 2020 that
seem feasible and desirable given the local capabilities, resources and competitiveness, likely
world demand scenario, emerging competition, and other relevant factors. Then we may work
backwards to delineate the necessary conditions that will be required to be fulfilled to achieve
those targets. The target setting also has the advantage of giving to the industry a mission to
accomplish in a given time frame. The government may also facilitate the process of achieving
the targets with strategic interventions in the realm of trade, investment and technology policies
(see Kumar 2001). It may also target export-oriented FDI flows from MNEs more effectively and
participate actively in the multilateral trade negotiations to secure Indian interests and make the
playing field less uneven.
25
References IMF (2000) World Economic Outlook: October 2000, Washington, DC: International Monetary Fund. Kumar, Nagesh, (1994a) ‘Determinants of Export-Orientation of Foreign Production by U.S.
Multinationals: An Inter Country Analysis’, Journal of International Business Studies 25(1): 141-56.
Kumar, Nagesh and N.S. Siddharthan, (1994) ‘Technology, Firm Size and Export Behaviour in Developing Countries: the case of Indian Enterprises’, Journal of Development Studies 31(2), 289-309. Kumar, Nagesh and N.S. Siddharthan (1997) Technology, Market Structure and Internationalization: Issues
and Policies for Developing Countries. London and New York: Routledge. Kumar, Nagesh (1998) ‘Multinational Enterprises, Regional Economic Integration, and Export-Platform
Production in the Host Countries: An Empirical Analysis for the US and Japanese Corporations’, Weltwirtschaftliches Archiv, 134(3): 450-483.
Kumar, Nagesh (2000a) Indian Economy Under Reforms: An Assessment of Economic and Social Impact, New Delhi: Bookwell and RIS. Kumar, Nagesh (2000b). ‘Developing Countries in International Division of Labour in Software and Service Industry: Lessons from Indian Experience’, Background Paper for World Employment Report 2001, Geneva: ILO. Kumar, Nagesh (2001) ‘WTO Regime, Host Country Policies and Global Patterns of MNE Activity: Recent Quantitative Studies and India’s Strategic Response’ Economic and Political Weekly, 36(1) 6 January, 39-50. Kumar, Nagesh and Aradhna Agarwal (2000). Liberalization, Outward Orientation and In-house R&D
Activity of Multinational and Local Firms: A Quantitative Exploration for Indian Manufacturing, RIS Discussion Paper # 7, New Delhi.
Lall, Sanjaya (1999) ‘India’s Manufactured Exports: Comparative Structure and Prospects’, World
Development 27(10): 1769-86. Panchamukhi, V.R. (2000) World Trade Organization and India: Challenges and Perspectives, RIS Discussion Paper # 01/2000. Pigato, Miria et al. (1997) South Asia’s Integration into the World Economy, Washington, DC: The World Bank Wood, Adrian and Michele Calandrino (2000) ‘When Other Giant Awakens: Trade and Human Resources in India’, Economic and Political Weekly, 35(52-3), 30 December, 4677-94. World Bank (2000) Global Economic Prospects and the Developing Countries, Washington, DC: The World Bank WTO (2000) International Trade Statistics 2000, Geneva: World Trade Organization.