indian institute of management calcutta - iim cal institute of management calcutta ... the...
TRANSCRIPT

Indian Institute of Management Calcutta
WorkingPaperSeries
WPSNo.764June2015
Offering fourth generation (4G) mobile services in India: a techno-economic assessment from the operators’ perspective
Ashutosh Jha FP student, IIM Calcutta, D. H. Road, Joka P.O., Kolkata 700 104, India
Debashis SahaProfessor,IndianInstituteofManagementCalcutta
D.H.Road,Joka,P.O.Kolkata700104,Indiahttp://facultylive.iimcal.ac.in/workingpapers
Page|1
Offering fourth generation (4G) mobile services in India: a techno-economic assessment from the operators’ perspective
Abstract
This paper aims at determining the techno-commercial feasibility of a 4G (LTE) network deployment in India to provide high-speed broadband access to mobile subscribers. High-speed broadband connectivity is one of the important priorities of the ‘Digital India’ initiative of the Government of India. This assessment is done using Discounted Cash Flow (DCF) approach. We have taken into account, the radio-technical parameters of the LTE network components, the expected subscriber populations forecast using the Bass-Model, and the coverage area matched to the service capacity using a cell dimensioning approach. We have estimated the cost of infrastructure deployment that would meet the demand, likely revenue generated from the users, and break-even period for a given average revenue per user (ARPU). With the help of three different assumed data demand scenarios, the interplay between the forecasted adoption rate and the minimum ARPU required for attaining the break-even is explored. To understand the profitability and the present value of investments for different demand scenarios, a modified internal rate of return (MIRR), and net present value (NPV) analyses are performed.The results of the study indicate that,for a right mix of data-volume offerings in a product package, the annual ARPU can even be both affordable to the rural population, as well as profitable for the operator. With some amount of stimulus and demand inducing initiatives from the government, investments in the rural areas can be an attractive option for 4G operators too. Keywords: 4G, LTE, Digital India, techno-economic analysis, Bass-Model, radio-technical, cell dimensioning, ARPU, NPV, MIRR
Page|2
Table of Contents 1. Introduction........................................................................................................................................3
2. Literature Review.............................................................................................................................4
3. Background........................................................................................................................................5
3.1 Broadband in India..................................................................................................................5
3.2 LTE- Global trends and current Indian scenario..........................................................7
4. Techno-economic model...............................................................................................................7
4.1 Concepts and methodology....................................................................................................7
4.2 LTE Broadband adoption forecasting using the Bass-Model....................................9
4.3 LTE RF Link budgeting model..........................................................................................10
4.4 Radio propagation model for coverage calculation: Okumara-Hata..................10
4.5 Data rate based cell dimensioning...................................................................................11
4.6 Operator’s CAPEX and OPEX calculations................................................................11
4.7 Revenue and Discounted Cash Flow modeling (DCF) for the operators’ costs and revenues...................................................................................................................................12
5. Results...............................................................................................................................................12
5.1 Forecasting of LTE Broadband adoptions using the Bass-Model........................12
5.1.1 Forecasting for a countrywide adoption...............................................................12
5.1.2 Rural and Urban share in the aggregate adoption:..........................................14
5.2 MAPL value calculations using the LTE link budget model...................................15
5.3 Cell radius and coverage calculations using Okumara-Hata model...................16
5.4 Data rate based cell dimensioning, and number of base-station calculations..16
5.5 CAPEX and OPEX calculations for the 20-year period...........................................17
5.6 Discounted Cash-Flow analysis for rural, urban and sub-urban case...............21
5.7 Demand Scenario Analysis.................................................................................................22
6. Conclusion.......................................................................................................................................23
7. References.......................................................................................................................................24
Page|3
1. Introduction Provisioning of Broadband has higher relevance for the developing countries, given its positive impacts on the economic growth [1]. For instance, the contribution of the services and knowledge-based activities to India’s GDP is on a rise1, and provision of Broadband is critical to India becoming a knowledge-based economy [2]. Several countries, such as Brazil, China and India, are formulating nationwide initiatives for implementing Broadband deployment and stimulating the adoption [3]. In India, major policy initiatives like National Optical Fiber Network [4] are underway for enabling Broadband connectivity to over two lakh village-panchayats. Various industry reports have termed Broadband as the lifeline of the recently launched Digital-India initiative [5]. The very first goal of the initiative is to provide the digital infrastructure as a utility to every citizen. This would need nationwide Broadband coverage as its precursor.It is also important to evaluate the currently accepted speed of Broadband (≥ 512Kbps) in India, which is very low when compared to a majority of other countries. This speed is found sufficient only for basic browsing, email and social networking. Higher speeds (≥10Mbps) would be fundamental to enabling services like VoIP, telemedicine, advanced browsing, and video-on-demand. With major advances in mobile Broadband technologies, it has become possible now to deliver Broadband over the wireless networks, with lesser infrastructure costs and increased spectral efficiency and throughput [6]. Long Term Evolution, or, LTE, is one such wireless communication standard for mobile and data terminals, developed by the 3rd Generation Partnership Project (3GPP)2. LTE provides higher data rates (up to 100 Mbps downlink), with increased coverage capabilities, reduced latencies, and scalable bandwidth options. It becomes important, therefore, to assess the economic feasibility of LTE deployment in both the rural and the urban areas. Especially in the rural areas, a seamless deployment with efficient revenue models and high speed connectivity, could help bridge the problem of the rural-urban digital divide to a great extent. Currently, there is a great level of anxiety amongst the operators who have acquired spectrum in the recently concluded spectrum auctions in India3, and are willing to go ahead with the LTE deployments. This is due to a high level of investments needed (both CAPEX and OPEX), longer investment recovery periods, and absence of reliable forecasting mechanisms to assess service adoption and demand pattern. The possibilities of cost savings resulting from using a particular frequency band, or from active/passive sharing of resources, needs to be ascertained and accounted for. This would help potential investors in constructing a stable deployment roadmap, ensuring maximum possible returns, depending on the blocks of spectrum allocated and the targeted scale of service deployment. Both medium and the large-scale operators would help their case, if the estimates related to the service adoption, quality, and data volume demand, could be accurately assessed. Together, these factors, serve as the major motivation behind this work.
1Source:UnionBudget,2015.See:http://indiabudget.nic.in/budget.asp2Source:3GPPLTEspecifications,release83 DoT, Ministry of Communications and IT, GoI, Source: http://www.dot.gov.in/spectrum-management/spectrum-management/auction-spectrum-february-2015

Page|4
This report is structured into 6 sections. Section 2 provides a literary review of some of the associated and relevant work done in the field. Section 3 provides a background of the evolution of wired and wireless services in India, and the general trend of Broadband adoption, along with the current state of things. Section 4 is further divided into 7 sections, and it discusses various theoretical frameworks, and their empirical models. Section 5 is again divided into 7 sections, each with detailed input and output data tables, and illustrated results section, for the respective models that were used. Section 5 also includes short discussions and implications of various results. Section 6 provides final conclusions, along with the recommendations from the author.
2. Literature Review Researchers are evaluating the option of using LTE network as a vehicle for delivering high-speed Broadband access for sometime now. Various comparative studies between LTE and contending technologies like High Speed Packet Access, or HSPA/HSPA+, have proven LTE is to be the global mobile broadband solution of the future [7]. The findings report LTE to be spectrally more efficient for best effort data in the downlink and uplink, and having twice the VoIP capacity as compared to HSPA+. Adoption of LTE, for provisioning of Broadband service, is seeing a rapid growth across continents [8]. The reports indicate 90% coverage of LTE in the developed markets, and 15% in the developing world, as at the end of December 2014. The prediction is that for the next 5 years, global LTE coverage would be driven by deployments across countries in Asia Pacific and Latin America. For the case of India, LTE deployments are on a rise, and GSMA predicts India to be the world’s second largest mobile Broadband market by 2016, with 367 million mobile Broadband connections[9]. The radio propagation characteristics depend on the band of frequency chosen for communication. Various studies have emphasized the suitability of 800 MHz frequency band for LTE ([8], [10]). Especially for rural areas, which are coverage constrained, use of 800 MHz band is recommended for a cost efficient provisioning of mobile Broadband service ([11], [12], and [13]). The 800 MHz frequency band is also, harmonized for the WiMAX and LTE technologies. Telecom Regulatory Authority of India, TRAI, has taken note of the opportunities associated, and has made numerous provisions in its spectrum allocation frameworks for the 800 MHz band[14]. The recommendations include, provisioning of large contiguous blocks (at least 5MHz), and sufficient quantum of spectrum to the operators in order to achieve better efficiencies and throughputs, recovering the spectrum from operators such as BSNL/MTNL, who cannot utilize it optimally, and reconfiguring the allocated frequencies so as to make contiguous allocations[14]. The rural part of the world, across various countries, still does not have sufficient Broadband coverage [15]. Cost of Broadband, low levels of digital literacy, and lack of a computing device are some of the factors found responsible [16]. Studies point out that only 70% household haveBroadband subscriptions, in-spite of the near universal coverage,even in the United States[6]. Feasibility assessments or techno-economic assessments, which essentially mean the investment recoverability at the end of the study period, therefore, are very closely related to the service adoption

Page|5
rate.Similar techno-economic assessments of LTE deployment have been done, for the case of rural areas of Spain [10]. It is found that due to the existence of other Broadband products (3G & 3.5G), very high adoption rates are needed for LTE deployment to be considered as profitable undertaking for an operator. However, for a single network deployment, which encourages service competition, Broadband prices would be as competitive as that of the urban case. This coupled with appropriate policy measures, which stimulate demand, can make LTE Broadband delivery in the rural areas an appealing investment opportunity for the operators[10]. Various techniques are present currently, for making an optimum use of spectrum, and minimize the operator’s cost of investing in the network infrastructure. Resource sharing mechanisms such as, active sharing which allows mutual sharing of the Radio Access Network (RAN) and the spectrum, and passive sharing which allow the operators to mutually share the site related expenditures (site, tower, antenna, power transmission, and personnel cost), exists ([17], [18]). Cognitive Radio technology employs the active sharing concept,to allow the presence of both the primary and secondary operators on the same spectrum band [19]. Supporting studies for business case of mobile operators, to offload the network using Cognitive Femtocells, have been done [20]. The Femtocells were aided by a sensor network, and used frequencies other than that of the mobile network, thereby increasing the outdoor area coverage of the mobile network. This study, however, does not consider such techniques, since the study is of a short-term duration, and assumes a Greenfield deployment scenario, similar to that of the Spanish LTE deployment case [10]. While various works in the literature have done individual assessments related to the feasibility of LTE deployment in specific countries, and have suggested novel ways to address the challenges, very little study has been done for the Indian scenario. Firstly, we found that in the Indian scenario, 800MHz frequency band is not fully explored for leveraging its potential. It has started to garner attention only very recently, and there is a lack of research work done to assess the potential of LTE deployment in India using 800MHz frequency band. This is an important area, which should be explored in greater detail, since, the adoption of 800MHz as the carrier for LTE, is receiving global acknowledgement. Secondly, studies related to determining the feasibility of a countrywide deployment, as well as the individual rural and urban deploymentin India, are unavailable. As explained in [14], there are varying operator viewpoints, without a general consensus, on various aspects of both technical (coverage and capacity) as well as economic feasibilities for LTE deployment, in the 800MHz band. Thirdly, the challenges and possibilities related to a high-speed Broadband access (30Mbps in our case), for ensuring the maximum possible coverage have not been fully explored for the case of India, which we have attempted to do.
3. Background
3.1 Broadband in India Broadband is defined as a high-speed Internet access, which is always on and faster than the traditional dial-up access4. Different countries have different benchmark speed of what is referred to as the Broadband speed in that country. In India, a speed
4Source:FCC.Source:https://www.fcc.gov/
Page|6
higher than 512 Kbps is considered to meet the criteria for Broadband 5 . India currently ranks 122nd in the fixed Broadband category (1.1% penetration against a global average of 9.9%), and 106th in mobile Broadband category (4.9% penetration against a global average of 22.1%)6. There is a target of achieving 175 million Broadband connections by 2017 (NTP 2012), out of which only 61 million have been achieved so far. Top five States (Maharashtra, Tamil Nadu, Delhi, Karnataka and Andhra Pradesh) have a total of 54.4% of overall connections. Metro and category A circles account for 61% of overall connections. Though, the presence of wireless Internet subscribers has increased significantly with almost 233 million subscribers, the adoption is considered relatively weak in a mobile phone dominated country. The Broadband market in Asia Pacific is expected to grow at 12% annually for the next 5 years where as the Indian fixed Broadband market is expected to reach $2.12 billion by 20177. Top 10 service providers have the maximum subscriber base (96%), out of a total of 149 providers. State owned companies viz. BSNL and MTNL together have about 74.9% market share for Wireline Broadband and 30.5% for overall Broadband subscriptions. The complex ecosystem and huge investments required to attain the economies of scale serve as hindrances to a majority of licensed service providers.
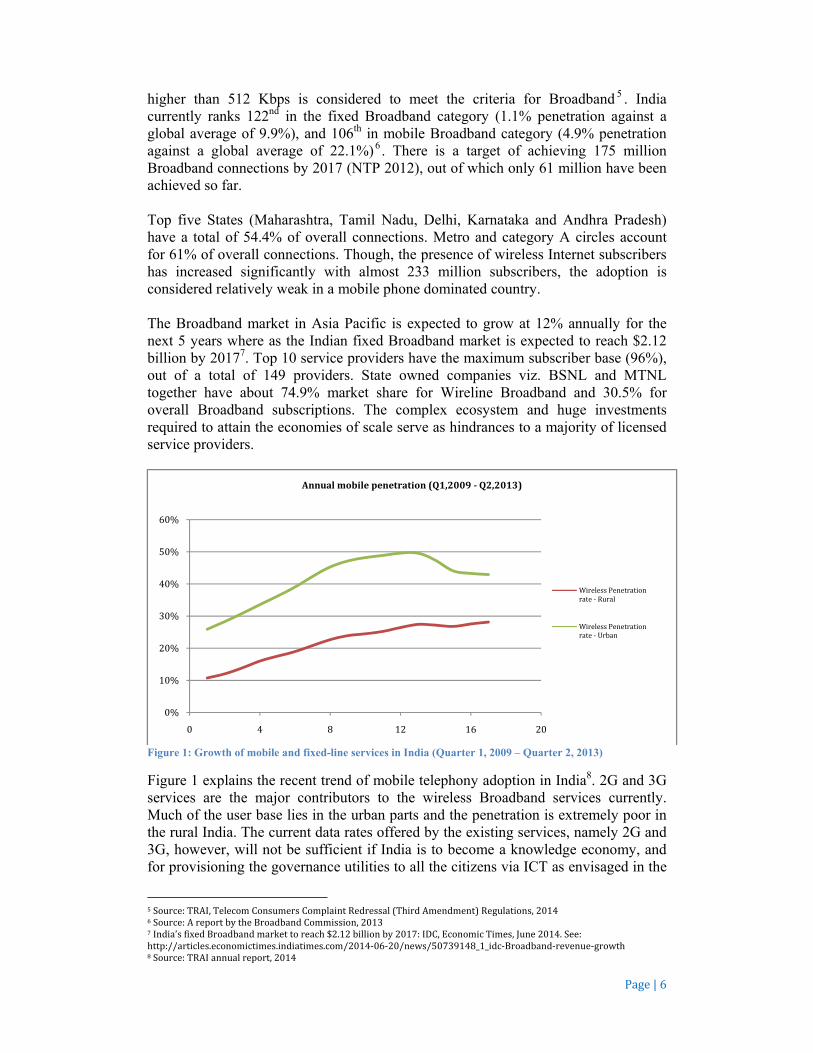
Figure 1: Growth of mobile and fixed-line services in India (Quarter 1, 2009 – Quarter 2, 2013)
Figure 1 explains the recent trend of mobile telephony adoption in India8. 2G and 3G services are the major contributors to the wireless Broadband services currently. Much of the user base lies in the urban parts and the penetration is extremely poor in the rural India. The current data rates offered by the existing services, namely 2G and 3G, however, will not be sufficient if India is to become a knowledge economy, and for provisioning the governance utilities to all the citizens via ICT as envisaged in the
5Source:TRAI,TelecomConsumersComplaintRedressal(ThirdAmendment)Regulations,20146Source:AreportbytheBroadbandCommission,20137India’sfixedBroadbandmarkettoreach$2.12billionby2017:IDC,EconomicTimes,June2014.See:http://articles.economictimes.indiatimes.com/2014‐06‐20/news/50739148_1_idc‐Broadband‐revenue‐growth8Source:TRAIannualreport,2014
0%
10%
20%
30%
40%
50%
60%
0 4 8 12 16 20
Annualmobilepenetration(Q1,2009‐ Q2,2013)
WirelessPenetrationrate‐ Rural
WirelessPenetrationrate‐ Urban

Page|7
Digital India initiative Other than the wireless Broadband, currently DSL (Digital Subscriber Line) is the most preferred technology used by the operators to deliver Broadband services constituting 84.81% of total Broadband subscribers, followed by Ethernet LAN (6.14%) and cable modem (5.26%).
3.2 LTE- Global trends and current Indian scenario The operators worldwide, on both GSM and CDMA technology paths, are deploying long Term Evolution (LTE) networks. Based on the spectrum availability, LTE networks can deliver speeds of up to 100 Mbps (downlink) and 50 Mbps (uplink). The first LTE network was launched in Sweden in December 2009. The global LTE market is moving to a more matured phase of development with around 230 commercial LTE networks in operation now, and over 2.5 billion connections expected by 2020. Four out of five mobile operators, who have acquired new spectrum since 2010, have been allocated airwaves aimed at supporting the launch of LTE networks 9. 700MHz, 800MHz, 1800MHz, 2300MHz and 2600MHz are the frequency bands used for LTE deployment. Currently 19% of the LTE networks are TDD-LTE and remaining 81% are FDD-LTE. This figure will rise to 26% for TDD-LTE and 74% for FDD-LTE. The more advanced version of LTE i.e. LTE-Advanced would be capable of delivering peak data rates of up to 1Gbps. Bharti-Airtel launched the first LTE service in India in April 2012, using TDD-LTE technology. The coverage currently includes Kolkata, Chennai, Pune, Hyderabad, Vishakhapatnam and Chandigarh region10. In the recently concluded Indian spectrum auctions11, Tata-Teleservices, Reliance-Jio-Infocom, and Reliance-Communications have won the licenses in 800 MHz spectrum band, and are planning to provision LTE services in this band. RIL is launching the LTE services through its subsidiary Jio-Infocom, and has plans to cover 700 cities, including 100 high priority markets in 2015. Aircel has also launched LTE services in four circles including Andhra Pradesh, Assam, Bihar and Odisha.
4. Techno-economic model
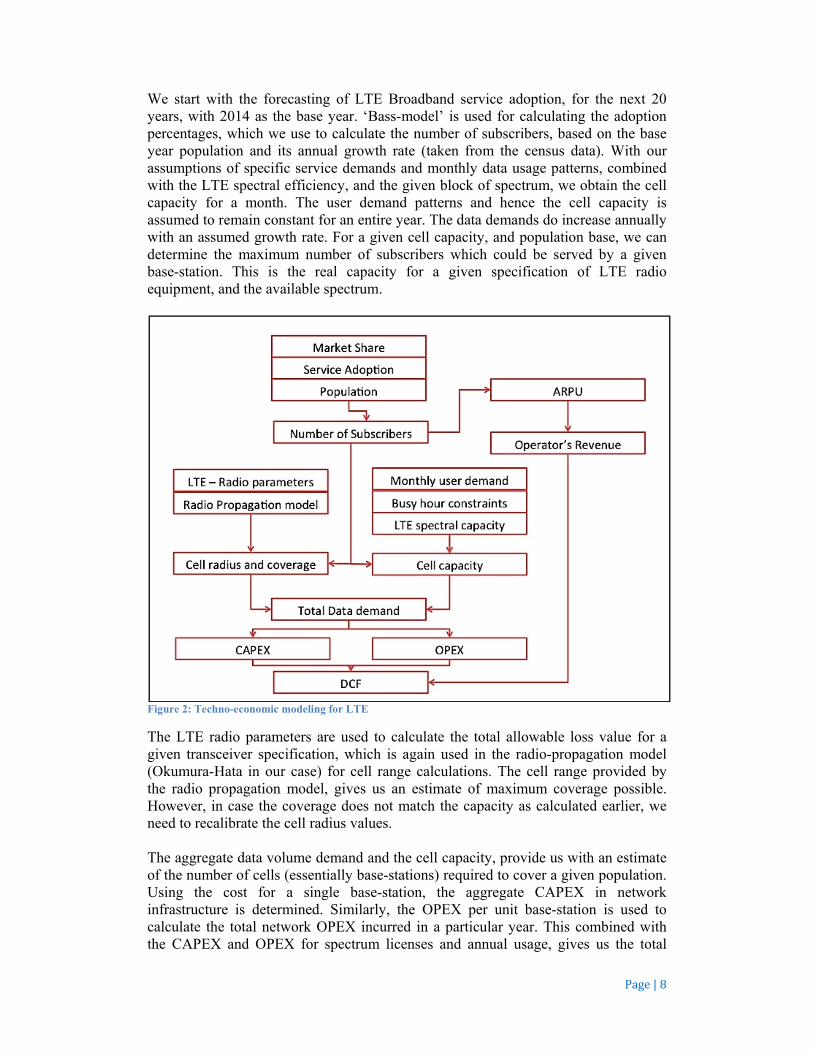
4.1 Concepts and methodology A techno-economic model is used to determine the business feasibility taking into account all the system parameters. The approach of the assessment is simulation based, and it spans from cost modeling to financial results. This method has been used to evaluate the feasibility of LTE deployment in the rural areas of Spain [10], for evaluating the cooperative relaying transmission technique in OFDM cellular networks [21], and for Femtocell deployment in LTE networks [22]. Figure 2 below, explains various components of the techno-economic model as adopted for our case. We discuss the theoretical backgrounds and determination of the key input parameters of the model in further sections.
9Source:GSMApredictiononGlobalLTEtrend,201410Source:TimesofIndiaSee:http://timesofindia.indiatimes.com/business/india‐business/Airtel‐launches‐4G‐in‐Kolkata/articleshow/12617622.cms11Source:TRAI,spectrumauctions2014
Page|8
We start with the forecasting of LTE Broadband service adoption, for the next 20 years, with 2014 as the base year. ‘Bass-model’ is used for calculating the adoption percentages, which we use to calculate the number of subscribers, based on the base year population and its annual growth rate (taken from the census data). With our assumptions of specific service demands and monthly data usage patterns, combined with the LTE spectral efficiency, and the given block of spectrum, we obtain the cell capacity for a month. The user demand patterns and hence the cell capacity is assumed to remain constant for an entire year. The data demands do increase annually with an assumed growth rate. For a given cell capacity, and population base, we can determine the maximum number of subscribers which could be served by a given base-station. This is the real capacity for a given specification of LTE radio equipment, and the available spectrum.
Figure 2: Techno-economic modeling for LTE
The LTE radio parameters are used to calculate the total allowable loss value for a given transceiver specification, which is again used in the radio-propagation model (Okumura-Hata in our case) for cell range calculations. The cell range provided by the radio propagation model, gives us an estimate of maximum coverage possible. However, in case the coverage does not match the capacity as calculated earlier, we need to recalibrate the cell radius values. The aggregate data volume demand and the cell capacity, provide us with an estimate of the number of cells (essentially base-stations) required to cover a given population. Using the cost for a single base-station, the aggregate CAPEX in network infrastructure is determined. Similarly, the OPEX per unit base-station is used to calculate the total network OPEX incurred in a particular year. This combined with the CAPEX and OPEX for spectrum licenses and annual usage, gives us the total
Page|9
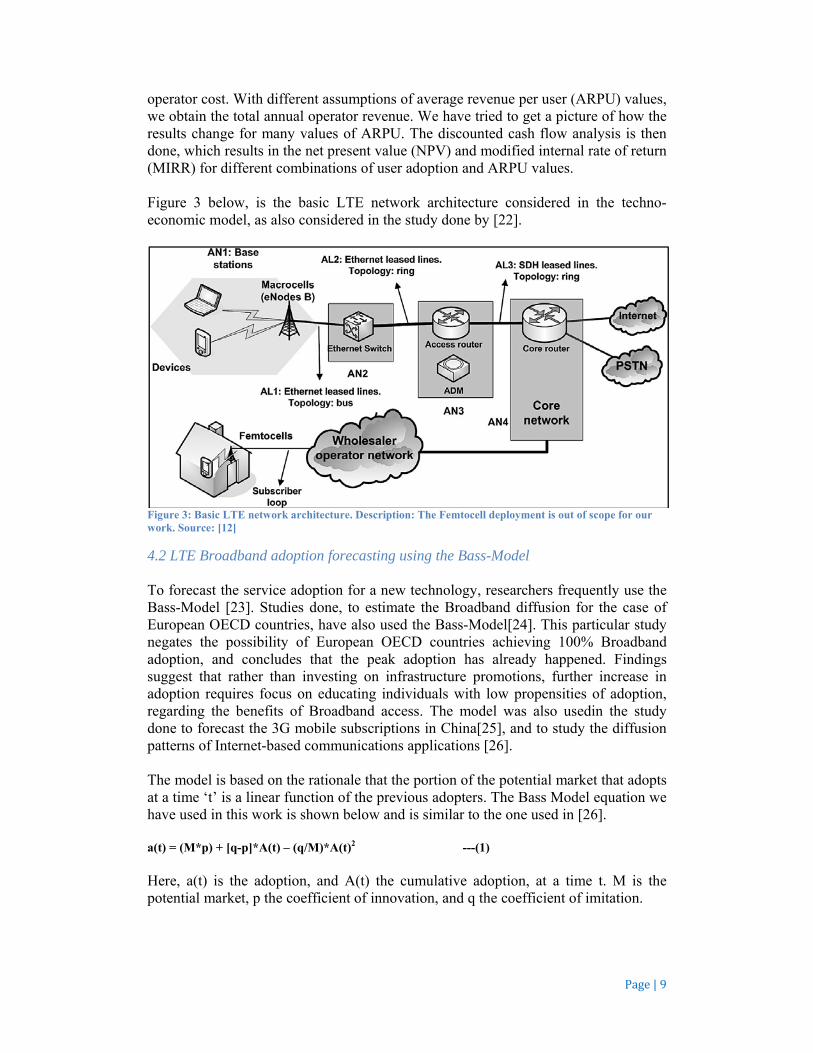
operator cost. With different assumptions of average revenue per user (ARPU) values, we obtain the total annual operator revenue. We have tried to get a picture of how the results change for many values of ARPU. The discounted cash flow analysis is then done, which results in the net present value (NPV) and modified internal rate of return (MIRR) for different combinations of user adoption and ARPU values. Figure 3 below, is the basic LTE network architecture considered in the techno-economic model, as also considered in the study done by [22].
Figure 3: Basic LTE network architecture. Description: The Femtocell deployment is out of scope for our work. Source: [12]
4.2 LTE Broadband adoption forecasting using the Bass-Model To forecast the service adoption for a new technology, researchers frequently use the Bass-Model [23]. Studies done, to estimate the Broadband diffusion for the case of European OECD countries, have also used the Bass-Model[24]. This particular study negates the possibility of European OECD countries achieving 100% Broadband adoption, and concludes that the peak adoption has already happened. Findings suggest that rather than investing on infrastructure promotions, further increase in adoption requires focus on educating individuals with low propensities of adoption, regarding the benefits of Broadband access. The model was also usedin the study done to forecast the 3G mobile subscriptions in China[25], and to study the diffusion patterns of Internet-based communications applications [26]. The model is based on the rationale that the portion of the potential market that adopts at a time ‘t’ is a linear function of the previous adopters. The Bass Model equation we have used in this work is shown below and is similar to the one used in [26]. a(t) = (M*p) + [q-p]*A(t) – (q/M)*A(t)2 ---(1)
Here, a(t) is the adoption, and A(t) the cumulative adoption, at a time t. M is the potential market, p the coefficient of innovation, and q the coefficient of imitation.
Page|10
4.3 LTE RF Link budgeting model All Radio Network Access planning begins with the link budgeting calculations. A link budget accounts for all the losses and gains from a radio transmitter, through the medium (free space, cable, waveguide, fiber etc.), to the receiver, in a telecommunication network. The results of link budget calculations are an estimate of the maximum allowed signal attenuation between a user device and the mobile base station antenna. A suitable radio propagation model then calculates the maximum possible uplink and downlink cell radius, using the results of a link budget. The RF link budget calculations (uplink and downlink) involve the following steps, with the stated formulas [27]. EIRPTx =PTx + GTx - Lb ---(2) RSENS = NBnoise + Thnoise + SINR ---(3) MAPL = EIRPTx + RSENS – IM - Lcable + GRx – M + Gsoft ---(4) Here, EIRPTx is the ‘Equivalent Isotropically Radiated Power’ of the transmitter, PTx is the maximum transmitter power, GTxis the transmitter antenna gain, Lb is the body loss, RSENS is the receiver sensitivity, NBnoise is the noise value for Node-B, Thnoise is the thermal noise, SINR is the signal to interference noise ratio, MAPL is the maximum allowable propagation loss, IM is the interference margin, Lcable is the cable loss, GRx is the receiver antenna gain, M is the fast-fade margin, and Gsoft is the soft handover gain. The typical values for the given parameters have been taken for the case of LTE, as also explained in [27].
4.4 Radio propagation model for coverage calculation: Okumara-Hata The radio propagation models characterize the radio wave propagation as a function of frequency, distance and other antenna parameters. They are given in the form of various empirical mathematical formulations, and are used to determine the coverage area and the propagation loss parameters. We have chosen the ‘Okumara-Hata’ model for our calculations, since it is relevant for the 800MHz frequency band and LTE base station characteristics. As explained in [28], the cellular radius (d) is given by the following equation. d (km) = 10((MAPL – A –B)/C) ---(5) A = 69.55 + 26.16 log10 (fc) – 13.82 log10 (hb) – a (hm) ---(6) B = 44.9 – 6.55 log10 (hb) ---(7) While parameters A and B remain common across all the scenarios, parameter C and the factor a(hm) depend on the environment, and have different values depending on the rural, urban and sub-urban case [28]. Here, fc is the carrier frequency (Mhz), hm is the effective antenna height of the mobile station (m), and hb is the base station antenna height (m). The cell radius (d) is then used to calculate the coverage area using the following formula [10]. Coverage area = 1.9485* (d) 2 ---(8)
Page|11
4.5 Data rate based cell dimensioning A data rate based approach [27] has been used to estimate the monthly data volume capacity for a cell. The monthly data volume capacity per cell, for the given bandwidth and equipment configuration, is then used to estimate the maximum number of subscribers possible. To find the area that can be covered given this cell throughput, we divide the maximum number of subscribers possible by the population density value. If the desired traffic for the given coverage area is greater than the base stations capacity for the area, then we reduce the cell radius. The maximum number of subscribers, Nsub can be calculated as Nsub = (Ccap*LBH)/((Nsector*(Rsub/Ofactor)) ---(9)
Here, Ccap is the cell capacity, LBH is the busy hour average loading, Rsub is the required user data rate, Ofactor is the overbooking factor, ABH_user is the average busy hour data rate per subscriber (same as Rsub/Ofactor), and Nsector is the number of sectors per site. The overbooking factor or the contention ratio indicates the number of users sharing the same data capacity at the same time. The value is usually set to 20. Busy hour is the hour during a 24hr time frame that has the greatest number of calls. We have taken 50% the busy hour value but the operators can change it. Finally, the total number of base stations required to meet the aggregate data demand for the given population is calculated using the individual cell throughput value found above.
4.6 Operator’s CAPEX and OPEX calculations We use the same CAPEX and OPEX cost calculation model as expounded in [10] and [21]. Spectrum costs, physical network infrastructure costs, and Marketing and Advertising costs comprise of operators’ CAPEX and OPEX related expenses. The costs related to physical network infrastructure includes Base Station, User Equipment, Sites, Backhaul, Transport network, and Core network costs, while spectrum costs comprise of the license charges (a portion paid as upfront costs, and the rest as annual installments), and annual usage charges (paid at 6% of the Adjusted Gross Revenue per circle) 12 . We have calculated the license charges from the recently concluded 800 MHz spectrum auction results13. Since, the annual spectrum usage charges are not available, we have kept it to be the same as the annual license charges, based on the observations of previously paid usage charges of the operators, which are close to the license charges14. The annual CAPEX and OPEX values are calculated in the following way. CAPEXi = (BSi* NCi) + SPlicense ---(10) OPEXi= (BSi* SCi) + SUCi ---(11) Here, BSiis the number of base stations in the ith year, NCi is the aggregate network cost per unit base station, SPlicenseis the annual spectrum license installment, SCi is the combined site related expenses and SUCiis the annual spectrum usage charge.
12Source:TRAIconsultationpaper‐March,7&December2,201413Source:TRAIConsultationpaper–ReservePriceforspectrumauctionin800MHzband,‐22ndFebruary,201414Source:TRAIreportbyFinancialandEconomicDivision,forquarterendingDecember2014.

Page|12
4.7 Revenue and Discounted Cash Flow modeling (DCF) for the operators’ costs and revenues Revenue for the operator is calculated based on the following formula. Revenue = Number of subscriber * market share * ARPU ---(12) The revenue and combined CAPEX and OPEX figures are used to calculate the annual cash flows using the discounted cash flow (DCF) analysis. Discounted Cash Flow method is used to evaluate the attractiveness of an investment by taking into account the cash flows (CF) over the investment period and the discount rate (weighted average cost of capital - WACC) prevalent. The method is represented by the following equation. DCF = ∑{CFi/(1+ r)i} - --(13) Here, CFi is the cash flow for the ith(i=0,1,2…) year, and r is the discount rate or WACC (taken to be 15% in this case). The Net Present Value (NPV) and the Modified Rate of Return (MIRR) analysis are then done, for a series of different ARPU values to predict the feasibility of the investments.
5. Results
5.1 Forecasting of LTE Broadband adoptions using the Bass-Model We have used the same parameter values for p (0.005) and q (0.06), as done in the study for forecasting 3G mobile subscription in China [25], since the process of adopting a new product by innovation and imitation is the same. Previous ITU reports [15] suggest a similar diffusion pattern for Broadband services in India and China, which also strengthens this comparison assumption between the two countries. The values predicted are for a 20-year horizon, with 2014 as the base year.
5.1.1 Forecasting for a countrywide adoption The value of ‘M’, or the ultimate adoption value, is taken as 100% of the given population in the base year (2014). However this value can be changed by the operator and used for different scenarios of adoption. The initial base year adoption (36 million), and the cumulative adoption (60 million) are from the TRAI figures on annual Broadband subscription in India. Table 1: Bass Model adoption forecasts for countrywide LTE Broadband scenario
Year Adoption15
Cumulative Adoption16
Population17 (Million) Adoption Percentage
2014 3,62,16,000 6,00,00,000 1,260 4.8% 2015 4,02,83,806 10,02,83,806 1,276 7.9% 2016 6,11,77,252 16,14,61,058 1,293 12.5% 2017 8,99,50,743 25,14,11,801 1,310 19.2%
15CalculatedusingEquation(1)16Cumulativeadoption(t)=adoption(t)+adoption(t‐1)17Source:Forecastedusing2010Indiacensusdata,andannualgrowthratefigures.

Page|13
2018 12,57,82,356 37,71,94,157 1,327 28.4% 2019 16,29,62,683 54,01,56,840 1,345 40.2% 2020 18,87,20,916 72,88,77,756 1,362 53.5% 2021 18,69,38,239 91,58,15,995 1,362 67.2% 2022 15,17,23,932 1,06,75,39,927 1,378 77.5% 2023 9,86,69,088 1,16,62,09,015 1,409 82.8% 2024 5,23,98,881 1,21,86,07,896 1,457 83.7% 2025 2,40,56,455 1,24,26,64,351 1,523 81.6% 2026 1,01,68,338 1,25,28,32,689 1,610 77.8% 2027 41,32,261 1,25,69,64,950 1,721 73.0% 2028 16,51,142 1,25,86,16,092 1,861 67.6% 2029 6,55,205 1,25,92,71,297 2,035 61.9% 2030 2,59,278 1,25,95,30,575 2,249 56.0% 2031 1,02,489 1,25,96,33,063 2,514 50.1% 2032 40,495 1,25,96,73,558 2,842 44.3% 2033 15,997 1,25,96,89,555 3,248 38.8% 2034 6,319 1,25,96,95,874 3,754 33.6%
Figure 4: 2014-2034, countrywide adoption forecast of LTE Broadband using Bass-Model
Figure 5: Annual and cumulative LTE Broadband subscription forecast using Bass-Model
0.0%
10.0%
20.0%
30.0%
40.0%
50.0%
60.0%
70.0%
80.0%
90.0%
2014 2019 2024 2029 2034
AdoptionPercentage
Year
AnnualtrendofcountrywideadoptionforLTEBroadband
‐
200
400
600
800
1,000
1,200
1,400
‐
20
40
60
80
100
120
140
160
180
200
Year 2015 2017 2019 2021 2023 2025 2027 2029 2031 2033
Subscriber Adoption (Milion)
YEAR
CumulativeandAnnualcountrywidesubscriptionofLTEBroadband
SubscriptionCum.Subscription
Page|14
The maximum adoption likely, as predicted by the Bass model, for the assumed parameter values and maximum number of subscriber potential, is 83.7%, occurring in the year 2023. The adoption remains higher than 67% between 2020-28. If the rural to urban migration effects are not considered, the maximum population likely to subscribe to the service is 1260 million.
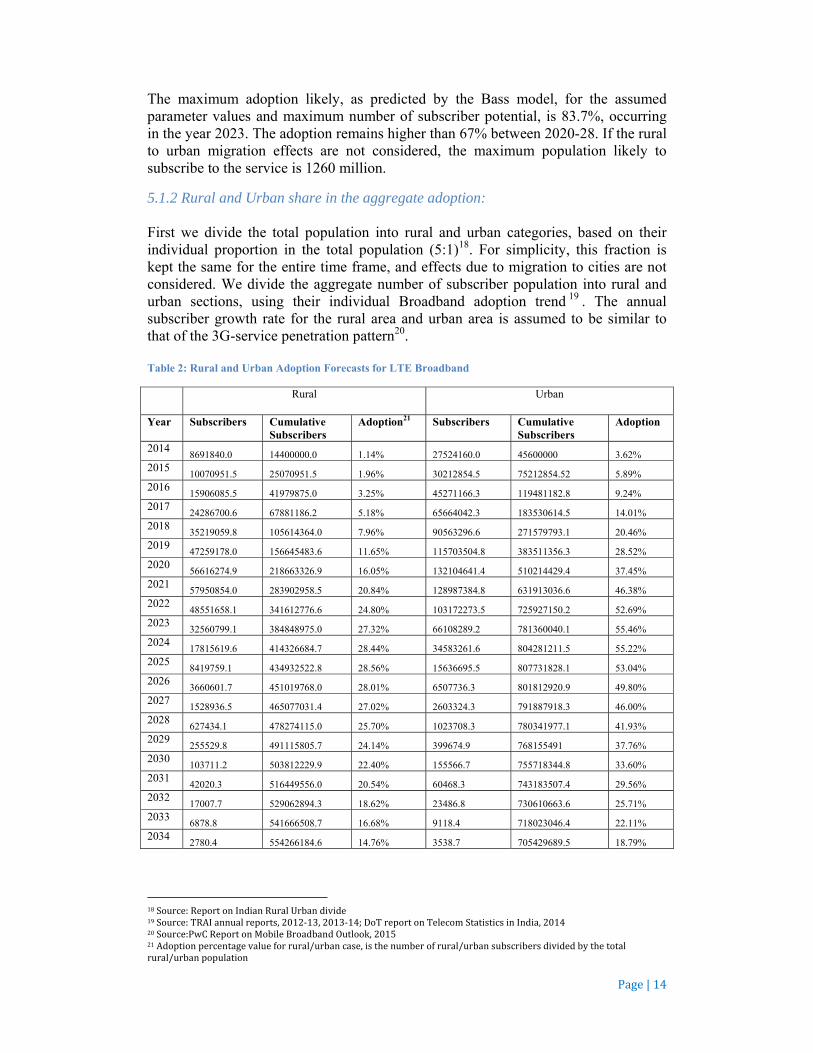
5.1.2 Rural and Urban share in the aggregate adoption: First we divide the total population into rural and urban categories, based on their individual proportion in the total population (5:1)18. For simplicity, this fraction is kept the same for the entire time frame, and effects due to migration to cities are not considered. We divide the aggregate number of subscriber population into rural and urban sections, using their individual Broadband adoption trend 19 . The annual subscriber growth rate for the rural area and urban area is assumed to be similar to that of the 3G-service penetration pattern20. Table 2: Rural and Urban Adoption Forecasts for LTE Broadband
Rural Urban
Year Subscribers Cumulative Subscribers
Adoption21 Subscribers Cumulative Subscribers
Adoption
2014 8691840.0 14400000.0 1.14% 27524160.0 45600000 3.62%
2015 10070951.5 25070951.5 1.96% 30212854.5 75212854.52 5.89%
2016 15906085.5 41979875.0 3.25% 45271166.3 119481182.8 9.24%
2017 24286700.6 67881186.2 5.18% 65664042.3 183530614.5 14.01%
2018 35219059.8 105614364.0 7.96% 90563296.6 271579793.1 20.46%
2019 47259178.0 156645483.6 11.65% 115703504.8 383511356.3 28.52%
2020 56616274.9 218663326.9 16.05% 132104641.4 510214429.4 37.45%
2021 57950854.0 283902958.5 20.84% 128987384.8 631913036.6 46.38%
2022 48551658.1 341612776.6 24.80% 103172273.5 725927150.2 52.69%
2023 32560799.1 384848975.0 27.32% 66108289.2 781360040.1 55.46%
2024 17815619.6 414326684.7 28.44% 34583261.6 804281211.5 55.22%
2025 8419759.1 434932522.8 28.56% 15636695.5 807731828.1 53.04%
2026 3660601.7 451019768.0 28.01% 6507736.3 801812920.9 49.80%
2027 1528936.5 465077031.4 27.02% 2603324.3 791887918.3 46.00%
2028 627434.1 478274115.0 25.70% 1023708.3 780341977.1 41.93%
2029 255529.8 491115805.7 24.14% 399674.9 768155491 37.76%
2030 103711.2 503812229.9 22.40% 155566.7 755718344.8 33.60%
2031 42020.3 516449556.0 20.54% 60468.3 743183507.4 29.56%
2032 17007.7 529062894.3 18.62% 23486.8 730610663.6 25.71%
2033 6878.8 541666508.7 16.68% 9118.4 718023046.4 22.11%
2034 2780.4 554266184.6 14.76% 3538.7 705429689.5 18.79%
18Source:ReportonIndianRuralUrbandivide19Source:TRAIannualreports,2012‐13,2013‐14;DoTreportonTelecomStatisticsinIndia,201420Source:PwCReportonMobileBroadbandOutlook,201521Adoptionpercentagevalueforrural/urbancase,isthenumberofrural/urbansubscribersdividedbythetotalrural/urbanpopulation

Page|15
The peak adoption in the rural case is around 29% while in the urban case it is 55%. Between 2012-29 the adoption is higher than 40%. The adoption in the rural areas are relatively slower as compared to the adoption in the urban areas, indicating a slower rate of growth in the digital-literacy and awareness about the benefits of Broadband adoption.
Figure 6: 2014-2034 rural and urban adoption forecast of LTE Broadband
5.2 MAPL value calculations using the LTE link budget model The input assumptions for the MAPL calculations are for a typical LTE transceiver with specifications to match the desired cell throughput. The MAPL value is obtained for both the uplink and the downlink case using equation (2), (3), and (4). The standard values for LTE link budget input parameters have also been explained in [27]. Table 3: LTE Link budget inputs and outputs
Transmitter - UE Maximum Transmitter Power (dBm) PTx 46 Transmitter Antenna Gain (dBi) GTx 18 Body Loss (dB) Lb 2 EIRP (dBm) EIRPTx 62 Receiver - Node B Node B noise figure (dB) NBnoise 7 Thermal Noise (dB) Thnoise -104.45 SINR (dB) SINR -9 Receiver Sensitivity RSENS -106.45 Interference margin (dB) IM 3 Cable loss (dB) Lcable 20 Receiver antenna gain (dBi) GRx 0 Fast fade margin (dB) M 0 Soft handover gain (dB) Gsoft 0 Maximum Allowable Path Loss (dB) MAPL 145.45(Uplink)
144.45(Downlink)
0.00%
10.00%
20.00%
30.00%
40.00%
50.00%
60.00%
2014 2016 2018 2020 2022 2024 2026 2028 2030 2032 2034
Adoption
Year
RuralandUrbanadoptiontrendforLTEbroadband
Rural
Urban

Page|16
5.3 Cell radius and coverage calculations using Okumara-Hata model The frequency in our case is 800 MHz and the antenna height for the base-station, and the mobile-station is kept at 30 meters and 1.5 meters respectively. Using equations (6) and (7) we derive the values for different common parameters, while the different gain functions and C values, for both the rural and the urban case, results in their respective cell radius’ using equation (5). Equation (8) is used for calculating the coverage area. Table 4: Input parameters for Okumara-Hata model
Carrier frequency, fc 800 MHz
BS antenna height, hb 30 m
MS antenna height, hm 1.5 m
Table 5: Output parameters of the Okumara-Hata model
A22 B23 C Cell radius (km)24 Coverage (sq. km)25
Rural 125.053 35.225 -28.012 20.841 846.36
Sub-Urban 125.053 35.225 -9.639 11.091 239.67
Urban 125.065 35.225 0.000 3.337 21.7
5.4 Data rate based cell dimensioning, and number of base-station calculations We have considered three different product types namely, Gold, Silver and Platinum, with different data volumes. Reasonable assumptions are made for the respective product demands in rural, urban and suburban settings, with a futuristic view. With the help of Table 1 and 2 and applying equation (9), the total data demand for a month is calculated for different percentages of adoption. Dividing the aggregate monthly data demand with the cell capacity gives the total number of base stations required to meet the user data demands. Table 6: Monthly data volume cell capacity calculations and results
Spectrum bandwidth (MHz) 2 x 5 MHz FDD LTE
Average downlink rate 30 Mbps
LTE downlink spectral capacity 5 bps/Hz
Average loading 50%
Busy hour % daily traffic 20%
Total data volume capacity per cell per month 9887.7 GB
Table 7: Input assumptions for user data demand and product types
Product Type Gold Silver Platinum
Data Volume 30 GB 20 GB 10 GB
Rural Demand 30% 10% 60%
Urban + Suburban Demand 60% 30% 10%
22Usingequation(6)23Usingequation(7)24Usingequation(5)25Usingequation(8)
Page|17
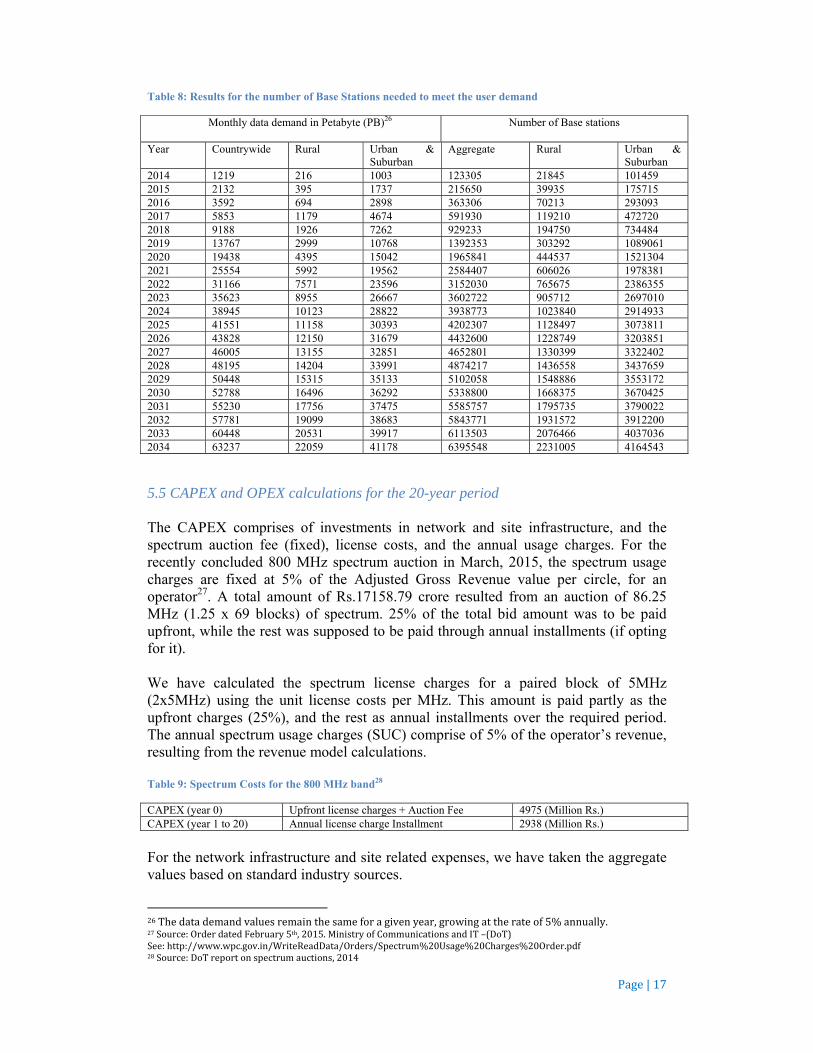
Table 8: Results for the number of Base Stations needed to meet the user demand
Monthly data demand in Petabyte (PB)26 Number of Base stations
Year Countrywide Rural Urban & Suburban
Aggregate Rural Urban & Suburban
2014 1219 216 1003 123305 21845 101459 2015 2132 395 1737 215650 39935 175715 2016 3592 694 2898 363306 70213 293093 2017 5853 1179 4674 591930 119210 472720 2018 9188 1926 7262 929233 194750 734484 2019 13767 2999 10768 1392353 303292 1089061 2020 19438 4395 15042 1965841 444537 1521304 2021 25554 5992 19562 2584407 606026 1978381 2022 31166 7571 23596 3152030 765675 2386355 2023 35623 8955 26667 3602722 905712 2697010 2024 38945 10123 28822 3938773 1023840 2914933 2025 41551 11158 30393 4202307 1128497 3073811 2026 43828 12150 31679 4432600 1228749 3203851 2027 46005 13155 32851 4652801 1330399 33224022028 48195 14204 33991 4874217 1436558 3437659 2029 50448 15315 35133 5102058 1548886 3553172 2030 52788 16496 36292 5338800 1668375 3670425 2031 55230 17756 37475 5585757 1795735 3790022 2032 57781 19099 38683 5843771 1931572 3912200 2033 60448 20531 39917 6113503 2076466 4037036 2034 63237 22059 41178 6395548 2231005 4164543
5.5 CAPEX and OPEX calculations for the 20-year period The CAPEX comprises of investments in network and site infrastructure, and the spectrum auction fee (fixed), license costs, and the annual usage charges. For the recently concluded 800 MHz spectrum auction in March, 2015, the spectrum usage charges are fixed at 5% of the Adjusted Gross Revenue value per circle, for an operator27. A total amount of Rs.17158.79 crore resulted from an auction of 86.25 MHz (1.25 x 69 blocks) of spectrum. 25% of the total bid amount was to be paid upfront, while the rest was supposed to be paid through annual installments (if opting for it). We have calculated the spectrum license charges for a paired block of 5MHz (2x5MHz) using the unit license costs per MHz. This amount is paid partly as the upfront charges (25%), and the rest as annual installments over the required period. The annual spectrum usage charges (SUC) comprise of 5% of the operator’s revenue, resulting from the revenue model calculations. Table 9: Spectrum Costs for the 800 MHz band28
CAPEX (year 0) Upfront license charges + Auction Fee 4975 (Million Rs.) CAPEX (year 1 to 20) Annual license charge Installment 2938 (Million Rs.)
For the network infrastructure and site related expenses, we have taken the aggregate values based on standard industry sources.
26Thedatademandvaluesremainthesameforagivenyear,growingattherateof5%annually.27Source:OrderdatedFebruary5th,2015.MinistryofCommunicationsandIT–(DoT)See:http://www.wpc.gov.in/WriteReadData/Orders/Spectrum%20Usage%20Charges%20Order.pdf28Source:DoTreportonspectrumauctions,2014
Page|18
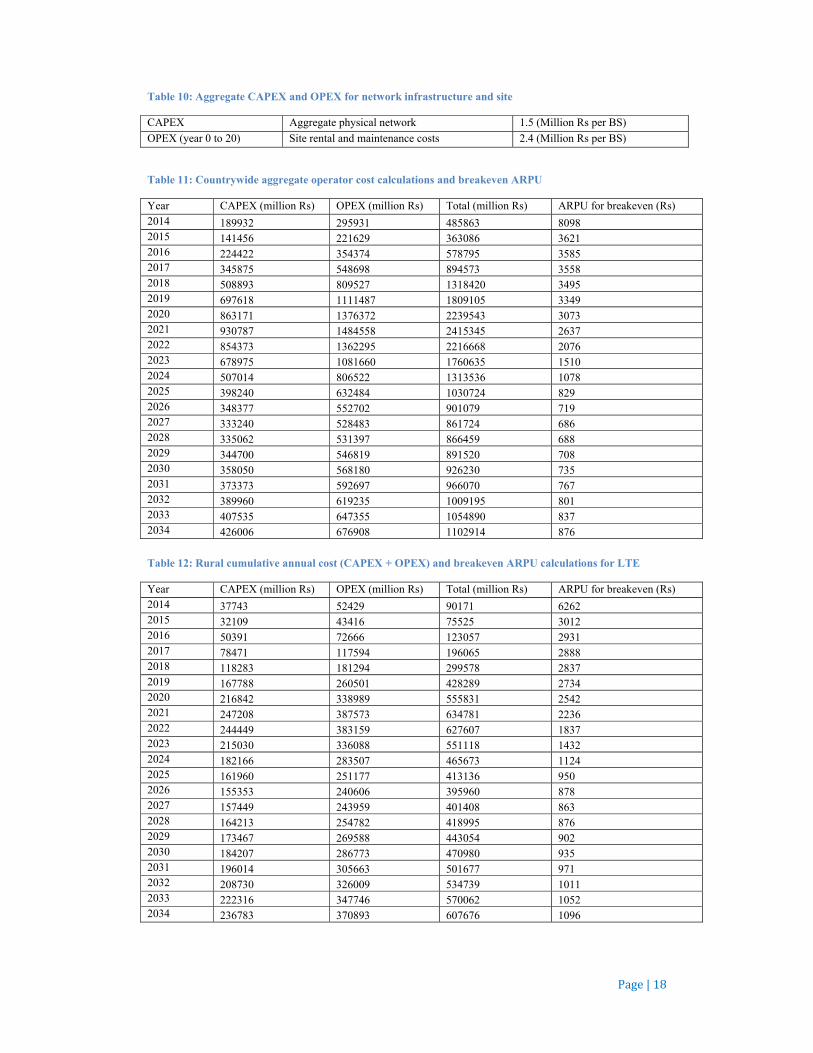
Table 10: Aggregate CAPEX and OPEX for network infrastructure and site
CAPEX Aggregate physical network 1.5 (Million Rs per BS)
OPEX (year 0 to 20) Site rental and maintenance costs 2.4 (Million Rs per BS)
Table 11: Countrywide aggregate operator cost calculations and breakeven ARPU
Year CAPEX (million Rs) OPEX (million Rs) Total (million Rs) ARPU for breakeven (Rs) 2014 189932 295931 485863 8098 2015 141456 221629 363086 3621 2016 224422 354374 578795 3585 2017 345875 548698 894573 3558 2018 508893 809527 1318420 3495 2019 697618 1111487 1809105 3349 2020 863171 1376372 2239543 3073 2021 930787 1484558 2415345 2637 2022 854373 1362295 2216668 2076 2023 678975 1081660 1760635 1510 2024 507014 806522 1313536 1078 2025 398240 632484 1030724 829 2026 348377 552702 901079 719 2027 333240 528483 861724 686 2028 335062 531397 866459 688 2029 344700 546819 891520 708 2030 358050 568180 926230 735 2031 373373 592697 966070 767 2032 389960 619235 1009195 801 2033 407535 647355 1054890 837 2034 426006 676908 1102914 876
Table 12: Rural cumulative annual cost (CAPEX + OPEX) and breakeven ARPU calculations for LTE
Year CAPEX (million Rs) OPEX (million Rs) Total (million Rs) ARPU for breakeven (Rs) 2014 37743 52429 90171 6262 2015 32109 43416 75525 3012 2016 50391 72666 123057 2931 2017 78471 117594 196065 2888 2018 118283 181294 299578 2837 2019 167788 260501 428289 2734 2020 216842 338989 555831 2542 2021 247208 387573 634781 2236 2022 244449 383159 627607 1837 2023 215030 336088 551118 1432 2024 182166 283507 465673 1124 2025 161960 251177 413136 950 2026 155353 240606 395960 878 2027 157449 243959 401408 863 2028 164213 254782 418995 876 2029 173467 269588 443054 902 2030 184207 286773 470980 935 2031 196014 305663 501677 971 2032 208730 326009 534739 1011 2033 222316 347746 570062 1052 2034 236783 370893 607676 1096

Table calcula
Year 2014 2015 2016 2017 2018 2019 2020 2021 2022 2023 2024 2025 2026 2027 2028 2029 2030 2031 2032 2033 2034
As wdepento heARPUcase.
Figure
1
2
3
4
5
6
7
8
9
BreakevenARPU(Rs.)
13: Urban and ations for LTE
CAPEX
157164116358181042274415397620536846533396905906169354709573318592432920003518280217785917824418085418437018824192230196234
we can see fnding on theeavy infrastrU over the t
e 7: Break-even
0
1000
2000
3000
4000
5000
6000
7000
8000
9000
2014
Sub-urban cum
X (million Rs)
4 8 2 5 0 1 9 0 5 7 9 1 5 2 9 4 4 0 1 0 4
from Figuree amount of ructure and total study p
ARPU for rura
2016 2018
Ru
mulative annual
OPEX (milli
243503 178213 281708 431104 628233 850986 1037384 1096985 979137745571 523015 381307 312096 284524 276616277232 281407 287033 293226 299609306015
e 7, the indinvestment,spectrum l
period is bel
al and urban ca
2020 2
ural,UrbanandS
l cost (CAPEX
ion Rs) Tota
40062945462770551025138716901787159612168548624551246734544455446224714481449185022
ividual brea with the higlicense costslow Rs.2000
ases
2022 2024
Year
Sub‐urbanARPU
+ OPEX) and b
al (million Rs)
666 571 749 519 5853 7827 0723 7575 60716528 874 598 131 326 475476 261 404 466 839249
ak-even ARPghest ARPUs. However
0 for both th
2026 20
Uforbreak‐even
A
R
UAA
breakeven ARP
ARPU for b
8787 3917 3873 3844 3777 3619 3314 2829 2199 1557 1063 773 639 590 582 593 612 634 659 685 712
PU for a yeU in the first , the averag
he rural and
028 2030
n
Aggregatebreakev
RuralbreakevenA
UrbanandSuburbARPUAverageAggregat
Page|19
PU
breakeven (Rs)
ear varies year, due
ge annual the urban
2032 203
venARPU
ARPU
banbreakeven
teARPU
4
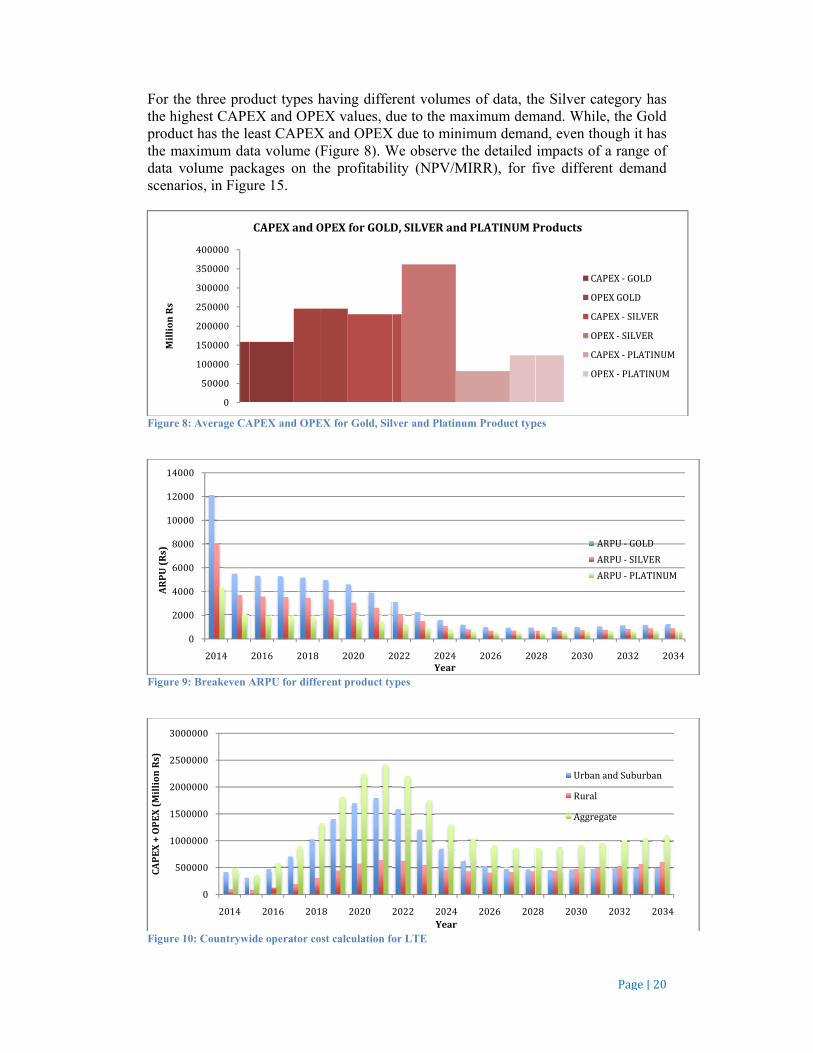
For ththe hiproduthe mdata scena
Figure
Figure
Figure
MillionRs
2
4
6
8
10
12
14
ARPU(Rs)
5
10
15
20
25
30
CAPEX+OPEX(MillionRs)
he three proighest CAPEuct has the le
maximum davolume pac
arios, in Figu
e 8: Average CA
e 9: Breakeven A
e 10: Countrywi
0
50000
100000
150000
200000
250000
300000
350000
400000
0
000
000
000
000
000
000
000
2014
0
500000
000000
500000
000000
500000
000000
2014
oduct types hEX and OPEeast CAPEX
ata volume (Fckages on thure 15.
APEX and OPE
ARPU for diffe
ide operator co
CAPEXandO
2016 2018
2016 201
having differEX values, dX and OPEXFigure 8). Whe profitabil
EX for Gold, Sil
erent product ty
st calculation fo
OPEXforGOLD
2020 2
18 2020 2
rent volumedue to the maX due to miniWe observe tlity (NPV/M
lver and Platinu
ypes
or LTE
D,SILVERand
2022 2024Year
2022 2024Year
es of data, thaximum demimum demanthe detailed
MIRR), for f
um Product typ
dPLATINUMP
2026 20
2026 202
he Silver catmand. Whilend, even thoimpacts of a
five differen
pes
Products
CAP
OPE
CAP
OPE
CAP
OPE
028 2030
AR
AR
AR
28 2030
Urbana
Rural
Aggrega
Page|20
tegory has , the Gold
ough it has a range of
nt demand
PEX‐ GOLD
EXGOLD
PEX‐ SILVER
EX‐ SILVER
PEX‐ PLATINUM
EX‐ PLATINUM
2032 203
RPU‐ GOLD
RPU‐ SILVER
RPU‐ PLATINUM
2032 2034
ndSuburban
ate
4
Page|21
For the break-even ARPU of different product types, Gold category has the lowest break-even ARPU and the Platinum the highest ARPU. The Silver category results in a moderate break-even ARPU in spite of the highest total investment costs.
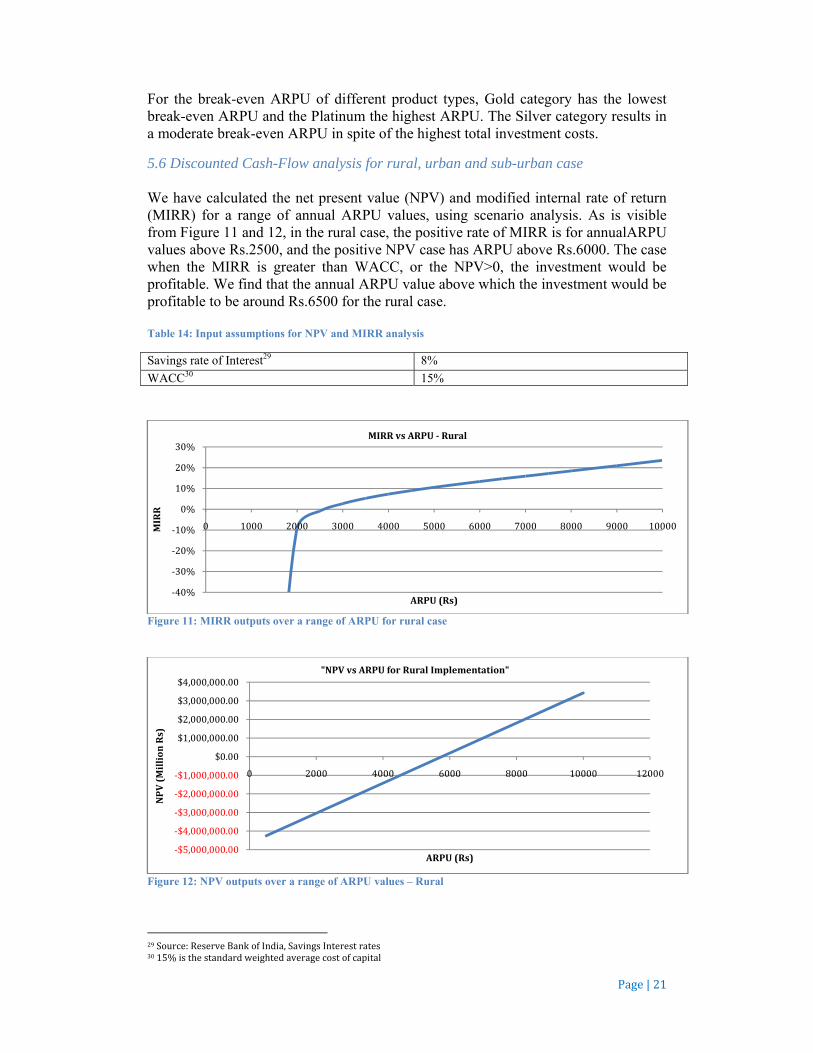
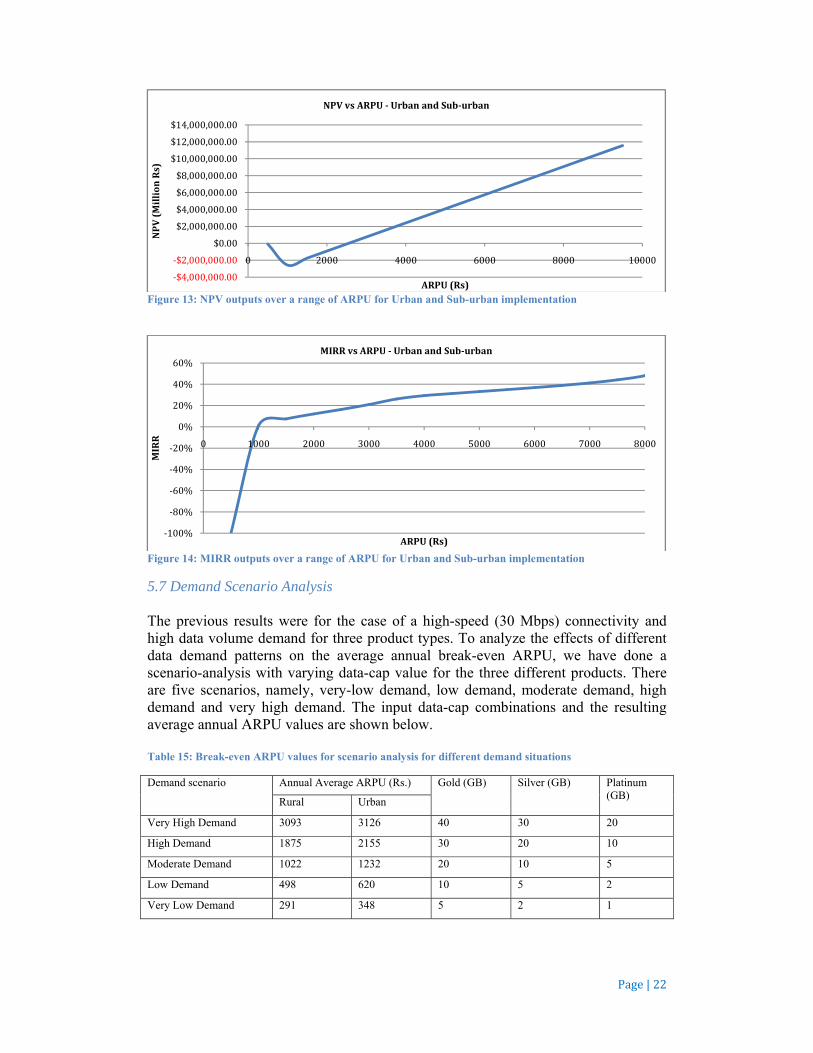
5.6 Discounted Cash-Flow analysis for rural, urban and sub-urban case We have calculated the net present value (NPV) and modified internal rate of return (MIRR) for a range of annual ARPU values, using scenario analysis. As is visible from Figure 11 and 12, in the rural case, the positive rate of MIRR is for annualARPU values above Rs.2500, and the positive NPV case has ARPU above Rs.6000. The case when the MIRR is greater than WACC, or the NPV>0, the investment would be profitable. We find that the annual ARPU value above which the investment would be profitable to be around Rs.6500 for the rural case. Table 14: Input assumptions for NPV and MIRR analysis
Savings rate of Interest29 8%
WACC30 15%
Figure 11: MIRR outputs over a range of ARPU for rural case
Figure 12: NPV outputs over a range of ARPU values – Rural
29Source:ReserveBankofIndia,SavingsInterestrates3015%isthestandardweightedaveragecostofcapital
‐40%
‐30%
‐20%
‐10%
0%
10%
20%
30%
0 1000 2000 3000 4000 5000 6000 7000 8000 9000 10000MIRR
ARPU(Rs)
MIRRvsARPU‐ Rural
‐$5,000,000.00
‐$4,000,000.00
‐$3,000,000.00
‐$2,000,000.00
‐$1,000,000.00
$0.00
$1,000,000.00
$2,000,000.00
$3,000,000.00
$4,000,000.00
0 2000 4000 6000 8000 10000 12000
NPV(MillionRs)
ARPU(Rs)
"NPVvsARPUforRuralImplementation"
Page|22
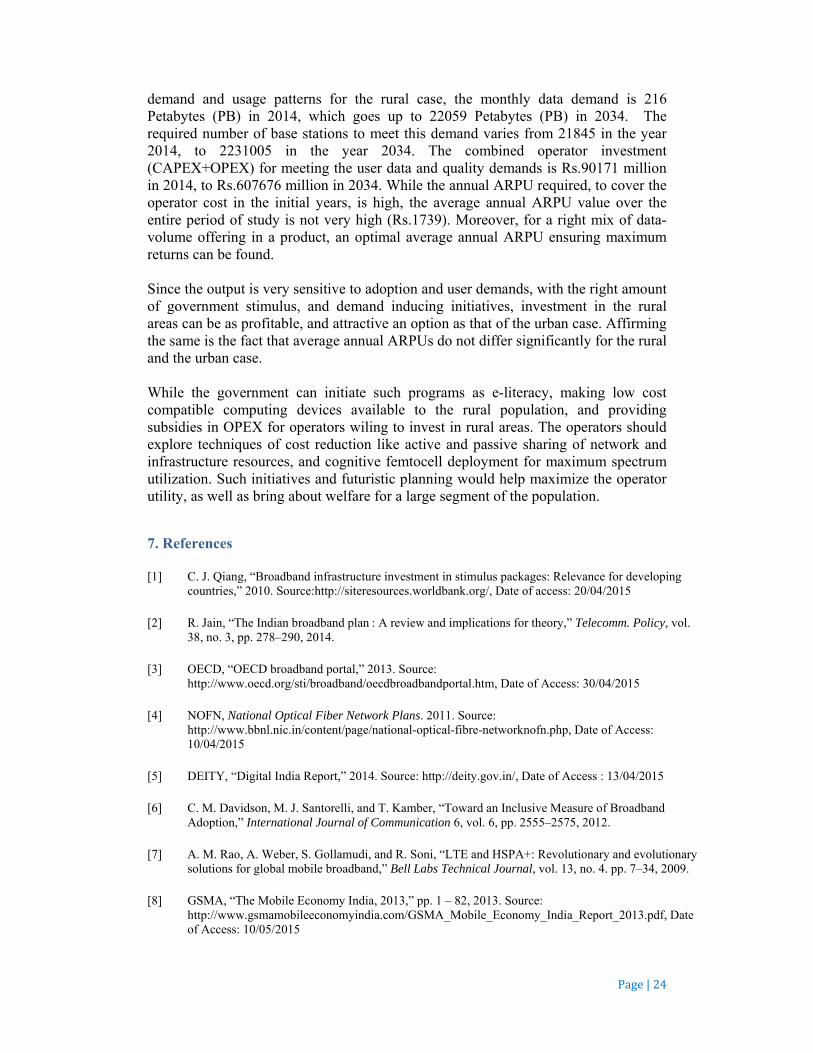
Figure 13: NPV outputs over a range of ARPU for Urban and Sub-urban implementation
Figure 14: MIRR outputs over a range of ARPU for Urban and Sub-urban implementation
5.7 Demand Scenario Analysis The previous results were for the case of a high-speed (30 Mbps) connectivity and high data volume demand for three product types. To analyze the effects of different data demand patterns on the average annual break-even ARPU, we have done a scenario-analysis with varying data-cap value for the three different products. There are five scenarios, namely, very-low demand, low demand, moderate demand, high demand and very high demand. The input data-cap combinations and the resulting average annual ARPU values are shown below. Table 15: Break-even ARPU values for scenario analysis for different demand situations
Demand scenario Annual Average ARPU (Rs.) Gold (GB) Silver (GB) Platinum (GB)
Rural Urban
Very High Demand 3093 3126 40 30 20
High Demand 1875 2155 30 20 10
Moderate Demand 1022 1232 20 10 5
Low Demand 498 620 10 5 2
Very Low Demand 291 348 5 2 1
‐$4,000,000.00
‐$2,000,000.00
$0.00
$2,000,000.00
$4,000,000.00
$6,000,000.00
$8,000,000.00
$10,000,000.00
$12,000,000.00
$14,000,000.00
0 2000 4000 6000 8000 10000
NPV(MillionRs)
ARPU(Rs)
NPVvsARPU‐ UrbanandSub‐urban
‐100%
‐80%
‐60%
‐40%
‐20%
0%
20%
40%
60%
0 1000 2000 3000 4000 5000 6000 7000 8000
MIRR
ARPU(Rs)
MIRRvsARPU‐ UrbanandSub‐urban

Figureurban
As crequiprovirequiThis lower
6. Co The B2014)makeprovithe cpoor ensurof coof reprovi This high-IndiaLTE deploper opis tak The predimaxim
50
100
150
200
250
300
350
e 15: Average Acases respectiv
can be obsered for brisioning in thred to breakindicates th
r recovery p
onclusion
Broadband a). There is a
es the urbaniders. Howeapacity of tBroadband
ring the last mpetition, aecovering oisioning.
work is an e-speed Broada. We have c
suitability, aoyment in thperator by th
ken for evalu
Bass-Modelct, adoptionmum of 28.5
0
00
00
00
00
00
00
00
Annual ARPU fvely, while the Y
erved from Freak-even bhe rural casek-even does hat, for an oeriod and les
adoption in a growing den section anver, limited
the telecom coverage
mile coveraand a lack ofoperator in
evaluation ofdband (30Mbconsidered tand the rece
his band. Conhe authoritieuating the pa
l forecasts fn rate varyin56% (445 m
1
for different deY-axis is the ann
Figure15, asbecomes loe, also in canot vary m
optimum cosser annual A
the urban pemand for hin attractive
spectrum anetwork. Thand adoptioage becomesf digital literanvestment i
f the feasibilbps), to ensuthe 800 MHent interests nsidering thees, a 5 MHz arameters.
for the adopng from 1.4%
million subscr
emand scenarionual average AR
s the data vower and rase of very hmuch betweeombination oARPU requi
part of Indiaigher data vo
investment availability, he case of ron rates. Dus a challengacy lead to ain infrastru
lity of deploure the last mz frequencyshown by vae upper limitpaired spect
ption of Br% (14.4 milribers) in 20
os. Description:RPU required f
volume demreasonable high demanden rural and of product dired.
a is growingolume and do
destinationand dense urural India iue to sparse. Varying uapprehension
ucture deplo
oying LTE nemile coverag band for ouarious operat for the spetrum block (2
roadband sellion subscri025. For the
2
: 1 and 2 are fofor break-even
mands fall, thenough fo
d scenario, tthe urban s
data volume
g very rapidlownlink spe
n for telecomurban plannis opposite,
sely populatuser demandns over the poyment and
etworks for ge for the casur analysis, ators considectrum block2 x 5MHz F
ervices in ruibers) in 20assumed dat
HighD
LowD
Mode
VeryH
VeryL
Page|23
or rural and
he ARPU r service the ARPU situations. e, there is
ly (TRAI, eed, which m service ing, limits with very ted areas, d, absence possibility d service
providing se of rural due to its
ering LTE k allocated FDD LTE)
ural India 14, to the ta volume
Demand
Demand
rateDemand
HighDemand
LowDemand
Page|24
demand and usage patterns for the rural case, the monthly data demand is 216 Petabytes (PB) in 2014, which goes up to 22059 Petabytes (PB) in 2034. The required number of base stations to meet this demand varies from 21845 in the year 2014, to 2231005 in the year 2034. The combined operator investment (CAPEX+OPEX) for meeting the user data and quality demands is Rs.90171 million in 2014, to Rs.607676 million in 2034. While the annual ARPU required, to cover the operator cost in the initial years, is high, the average annual ARPU value over the entire period of study is not very high (Rs.1739). Moreover, for a right mix of data-volume offering in a product, an optimal average annual ARPU ensuring maximum returns can be found. Since the output is very sensitive to adoption and user demands, with the right amount of government stimulus, and demand inducing initiatives, investment in the rural areas can be as profitable, and attractive an option as that of the urban case. Affirming the same is the fact that average annual ARPUs do not differ significantly for the rural and the urban case. While the government can initiate such programs as e-literacy, making low cost compatible computing devices available to the rural population, and providing subsidies in OPEX for operators wiling to invest in rural areas. The operators should explore techniques of cost reduction like active and passive sharing of network and infrastructure resources, and cognitive femtocell deployment for maximum spectrum utilization. Such initiatives and futuristic planning would help maximize the operator utility, as well as bring about welfare for a large segment of the population.
7. References
[1] C. J. Qiang, “Broadband infrastructure investment in stimulus packages: Relevance for developing countries,” 2010. Source:http://siteresources.worldbank.org/, Date of access: 20/04/2015
[2] R. Jain, “The Indian broadband plan : A review and implications for theory,” Telecomm. Policy, vol. 38, no. 3, pp. 278–290, 2014.
[3] OECD, “OECD broadband portal,” 2013. Source: http://www.oecd.org/sti/broadband/oecdbroadbandportal.htm, Date of Access: 30/04/2015
[4] NOFN, National Optical Fiber Network Plans. 2011. Source: http://www.bbnl.nic.in/content/page/national-optical-fibre-networknofn.php, Date of Access: 10/04/2015
[5] DEITY, “Digital India Report,” 2014. Source: http://deity.gov.in/, Date of Access : 13/04/2015
[6] C. M. Davidson, M. J. Santorelli, and T. Kamber, “Toward an Inclusive Measure of Broadband Adoption,” International Journal of Communication 6, vol. 6, pp. 2555–2575, 2012.
[7] A. M. Rao, A. Weber, S. Gollamudi, and R. Soni, “LTE and HSPA+: Revolutionary and evolutionary solutions for global mobile broadband,” Bell Labs Technical Journal, vol. 13, no. 4. pp. 7–34, 2009.
[8] GSMA, “The Mobile Economy India, 2013,” pp. 1 – 82, 2013. Source: http://www.gsmamobileeconomyindia.com/GSMA_Mobile_Economy_India_Report_2013.pdf, Date of Access: 10/05/2015

Page|25
[9] GSMA, “Annual Report,” 2012. Source: http://www.gsma.com/mobilefordevelopment/wp-content/uploads/2012/10/2012_MMU_Annual-Report.pdf, Date of Access: 13/05/2015
[10] C. Ovando, J. Pérez, and A. Moral, “LTE techno-economic assessment: The case of rural areas in Spain,” Telecomm. Policy, vol. 39, no. 3–4, pp. 269–283, 2015.
[11] Radio Spectrum Policy Group, “Opinion on the digital dividend. Information Society and Media Directorate-General.,” 2009. Source: http://rspg-spectrum.eu/wp-content/uploads/2013/05/rspg09_271_draft_position_paper_digitaldividend.pdf, Date of Access: 13/06/2015
[12] European Commission, “Communication from the Commission. European broadband: Investing in digitally driven growth,” 2013. Source: http://europa.eu/legislation_summaries/information_society/strategies/si0017_en.htm, Date of Access: 20/06/2015
[13] Ofcom, “Application of spectrum liberalization and trading to the mobile sector. A further consultation.,” 2011. Source: http://stakeholders.ofcom.org.uk/consultations/spectrumlib/. Date of Access: 20/06/2015
[14] TRAI, “Recommendation on Reserve Price for Auction of Spectrum in the 800 MHz Band,” 2014. http://trai.gov.in/WriteReadData/Recommendation/Documents/Final%20Response%20800%20MHz.pdf, Date of Access: 12/05/2015
[15] ITU, “The World in 2015 -ICT Facts and Figures,” 2015. Source: http://www.itu.int/en/ITU-D/Statistics/Pages/facts/default.aspx, Date of Access: 04/05/2015
[16] FCC, “In the matter of applications of Comcast Corporation, General Electric Company and NBC Universal, INC for consent to assign licenses or transfer control of licensees, memorandum opinion &order,” 2011. Source: https://transition.fcc.gov/FCC-11-4.pdf, Date of Access : 26/04/2015
[17] ITU, “Measuring the Information Society,” 2011. Source: http://www.itu.int/net/pressoffice/backgrounders/general/pdf/5.pdf, Date of Access: 9/05/2015
[18] A. D. Little, “LTE spectrum and network strategies: Strategic options for mobile operators in dynamic 4G mobile markets,” 2010.Source: http://www.adlittle.com/downloads/tx_adlreports/ADL_LTE_Spectrum_Network_Strategies.pdf, Date of Access : 02/05/2015
[19] P. Ballon, W. Lehr, and S. Delaere, “Cognitive radio: Regulation and markets,” Telecomm. Policy, vol. 37, no. 2–3, pp. 83–86, 2013.
[20] P. Grønsund, O. Grøndalen, and M. Lähteenoja, “Business case evaluations for LTE network offloading with cognitive femtocells,” Telecomm. Policy, vol. 37, no. 2–3, pp. 140–153, 2013.
[21] A. Moral, J. Vidal, J. Pérez, A. Agustín, N. Marina, and A. Høst-Madsen, “Technoeconomic evaluation of cooperative relaying transmission techniques in OFDM cellular networks,” EURASIP J. Adv. Signal Process., vol. 2011, 2011.
[22] Z. Frias and J. Pérez, “Techno-economic analysis of femtocell deployment in long-term evolution networks,” EURASIP Journal on Advances in Signal Processing, pp. 1–15, 2012.
[23] F. M. Bass, “A newproduct growth for model consumer durables,” Management Science, vol. 15, no. 5. pp. 215–227, 1969.
[24] T. Turk and P. Trkman, “Bass model estimates for broadband diffusion in European countries,”Technological Forecasting & Social Change, vol. 79, pp. 85–96, 2012.

Page|26
[25] J. Lim, C. Nam, S. Kim, H. Rhee, E. Lee, and H. Lee, “Forecasting 3G mobile subscription in China : A study based on stochastic frontier analysis and a Bass diffusion model,” Telecomm. Policy, vol. 36, no. 10–11, pp. 858–871, 2012.
[26] D. H. Wong, K. B. Yap, and B. Turner, “Predicting the Diffusion Pattern of Internet-Based Communication Applications Using Bass Model Parameter Estimates for Email,” Internet Bus., no. 9, pp. 26–50, 2011.
[27] H. Holma and a Toskala, LTE for UMTS: OFDMA and SC-FDMA based radio access. Wiley Publications, March 2011.
[28] A. R. Mishra, Advanced Cellular Network Planning and Optimisation: 2G/2.5G/3G...Evolution to 4G. Wiley Publications, 2006.
[29] TRAI, “The Indian Telecom Services Performance Indicators,” July - September, 2014. Source: http://www.trai.gov.in/WriteReadData/PIRReport/Documents/Indicator-Reports29012015.pdf, Date of Access: 01/05/2015.
[30] Broadband Commission for Digital Development, 'The State of Broadband 2014: Broadband for All". ITU. Source: www.broadbandcommission.org, Date of Access: 22/04/2015.