indian institute of management calcutta - iim cal · indian institute of management calcutta,...
TRANSCRIPT
Indian Institute of Management Calcutta
Working Paper Series
WPS No. 785
July 2016
Efficiency of Indian ADRs and their underlying stocks:
An Adaptive Market Perspective from Nonlinear Models
Vinodh Madhavan
Assistant Professor
Institute of Management Technology (IMT) Ghaziabad, Raj Nagar, Ghaziabad 201001,
Partha Ray Professor
Indian Institute of Management Calcutta D. H. Road, Joka, P.O. Kolkata 700 104
http://facultylive.iimcal.ac.in/workingpapers
Page | 1
Efficiency of Indian ADRs and their underlying stocks:
An Adaptive Market Perspective from Nonlinear Models
Vinodh Madhavan
Assistant Professor – Finance Area Institute of Management Technology (IMT) Ghaziabad, Raj Nagar, Ghaziabad 201001, U.P., India
Email: [email protected]
Partha Ray1
Professor – Economics Group Indian Institute of Management Calcutta, Diamond Harbour Road, Joka, Kolkata, India
Email: [email protected]
Abstract: This paper is aimed at examining the efficiency of Level II/III Indian ADRs and
their underlying stocks trading in Mumbai from a nonlinear univariate perspective. For this
purpose, we consider the ADRs and the underlying stocks pertaining to Dr. Reddy’s
Laboratories, HDFC Bank, ICICI Bank, Infosys, Wipro, Tata Motors, and Sterlite Industries.
We employ the windowed as well as the rolling hinich bicorrelation test procedures in an
attempt to seek answers to hitherto-unanswered questions pertaining to Indian ADRs.
Findings indicate that the degree of efficiency of all US/Indian scrips considered for this
study is heterogeneous in nature and thereby warrant a ranking approach in each trading
location. At a granular level, in the case of US, Infosys ADR and Sterlite Industries ADR
were found to be more efficient than the overall US stock market (S&P 500). Similarly, in the
case of India, Infosys, Wipro, Tata Motors scrips were found to be more efficient than the
overall Indian stock market (Nifty). Further, the degree of efficiency of dually-listed stocks
such as, and limited to, Dr. Reddy’s Laboratories, HDFC Bank, Wipro, and Tata Motors, was
found to be homogenous across trading locations, while the degree of efficiency of dually-
listed stocks such as, and limited to, ICICI Bank, Infosys and Sterlite Industries, were found
to lack homogeneity across trading locations. The collective take-away from this study is
two-fold in nature. Firstly, the degree of market efficiency witnessed at the level of individual
scrips differs considerably from the degree of efficiency of the broader stock market in which
such scrips trade. Secondly, the degree of efficiency witnessed in certain (not all) dually-
listed scrips considered for this study was found to be homogenous across trading locations.
However, this does not happen to be the case for all other dually-listed scrips considered for
this study.
Key Words: Bicorrelation, ADR, India
JEL Classification Code: C58, G12, G14, G15
1 Corresponding Author
Page | 2
Efficiency of Indian ADRs and their underlying stocks:
An Adaptive Market Perspective from Nonlinear Models
1. Introduction & Literature Review
One of most widely researched area in the field of finance is market efficiency.
Market efficiency can be broadly classified into three categories, namely weak form, semi-
strong form and strong form efficiency. Should the asset prices exhibit weak form efficiency,
then the past history of asset prices is immaterial when it comes to predicting future asset
prices. Put differently, the past history of asset prices is already impounded in the current
asset price, and the consequently, the best predictor of future price happens to be the current
price of the asset. Earlier studies on market efficiency using conventional statistical tests such
as unit root tests, runs test, and autocorrelation test supported the prevalence of weak form
market efficiency. For a review of the early literature in support of market efficiency, refer to
Fama, 1970. In due course of time, studies disputing market efficiency took shape. A major
catalyst behind such studies was the realization that preliminary studies on market efficiency
limited their focus on exploring linear relationships and in the process failed to explore the
possibility of higher order dependence. In addition, the October 1987 crash forced both
academicians and practitioners to revisit the presumption of market efficiency. The seminal
work by Hinich & Paterson (1985), which showed that NYSE stock returns exhibit nonlinear
dependence, was the tipping point that opened the gateway to subsequent scholarly
excursions on market efficiency from nonlinear perspective. Other early studies that
challenged the notion of market efficiency include Poterba & Summers, 1988; Fama &
French, 1988; and Lo & MacKinlay, 1988.
Following Hinich & Patterson’s seminal work, nonlinearity in developed markets was
examined extensively in the literature.2 The broader takeaways from the burgeoning literature
on nonlinearity of asset prices are as follows. Firstly, of all the markets studied so far, US
stock market happens to be the most efficient. Secondly, efficiency per se is no longer viewed
as a static phenomenon. In other words, market efficiency is likely to evolve over time owing
to a variety of factors such as, but not limited to, evolution of market microstructure,
enhancement in investor base, changes in the nature and breadth of investment avenues, and
establishment of regulatory institutions. This is in line with the Adaptive Market Hypothesis
(AMH) put forth by Lo (2005). Grounded in evolutionary biology, AMH offers an
overarching intellectual gateway that helps in reconciling conflicting perspectives held by the
advocates and challengers of EMH. To be specific, markets are characterized by long periods
of efficient behaviour, punctuated by short unexpected bursts of nonlinear dependence. Put
2 See for example, Abhyankar et al., 1995; Hsieh, 1991; Kosefeld and Robe, 2001; Lima, 1998; Lim & Hooy,
2013; Opong et al., 1999; Scheinkman & LeBaron, 1989; Solibakke, 2005; and Willey, 1992. In addition,
empirical examination of nonlinearity in emerging markets paved way for scholarly works such as, but not
limited to, Afonso & Teixeria, 1998; Alagidede, 2011; Ammermann & Patterson, 2003; Cinko, 2002; Dorina &
Simina, 2007; Hassan et al., 2003; Hiremath & Kamaiah, 2010; Lim & Brooks, 2009; Lim et al., (2008a and
2008b); Lim & Hinich, 2005; Mishra et al., 2011; Madhavan, 2014; Panagiotidis, 2005; Poshakwale, 2002;
Romero-Meza et al., 2007; Scheicher, 1999; and Seddighi & Nian, 2004.

Page | 3
simply, long periods of tranquillity coupled with short bursts of turbulence happens to be a
stylized fact that is witnessed in developed and emerging stock markets.
But for the studies by Hinich & Patterson (1985), Poshakwale (2002), Ammerman &
Patterson (2003), and Madhavan (2014) an overwhelming portion of the above cited studies
explore nonlinearity in national stock indices. The central intent behind such explorations is
to garner insights on avenues for portfolio diversification at aggregate level for international
investors. This paper breaks away from this aggregate trend and in the process examines the
nature of nonlinearity in Level II / III American Depositary Receipts issued by Indian
companies, and in the process searches for any discernable difference in the degree of
efficiency exhibited by of Indian ADRs listed in NYSE/NASDAQ, their underlying Indian
stocks listed in Mumbai, the broader US and Indian stock market indices, as indicated by
discernable difference (if any) of the nature of nonlinearity exhibited by each of these time
series.
American Depositary Receipts, which are negotiable instruments issued by non-US
companies in US stock markets, serve as an avenue for international diversification for
American investors. The different types of ADRs available in the market place are Rule
144A, Level I, Level II, and Level III ADRs. Rule 144a ADRs is traded only among qualified
institutional buyers in PORTAL system, while Level I ADRs are traded in OTC market.
Level II and III ADRs are listed in American stock exchanges such as NYSE, NASDAQ, and
AMEX. Firms intent on issuing level II and/or level III ADRs are required to register with
Securities and Exchange Commission (SEC) and meet all reporting requirements. Further
firms that are intent on raising capital from American investors in US stock market would
have to issue level III ADRs, since level II ADRs cannot be used as a conduit to do so.
Prominent strands of literature on ADRs include the following major strands:
a) the reasons behind the issuance of ADRs by foreign entities3;
b) the search for evidence amidst ADRs and their underlying securities that
support law of one price4;
c) the stock price behaviour around the event date listing of ADRs in US
markets5;
d) the performance of ADRs as an investment instrument for portfolio
diversification6;
e) the effect of information content of ADR listing on global stock market
integration or segmentation7; and
f) the adverse nonlinear impact of ADRs on the local index of the market
wherein the originating firms reside.8
3 Errunza & Miller, 2000; Baker et al., 2002; Pagano et al., 2002.
4 Alaganar & Bhar, 2001; Kim et al., 2000; Ji, 2003; Kato et al., 1991; Maldonado & Saunders, 1983; Park &
Tavakkol, 1994; Wahab et al., 1992; Chung et al., 1992; Chen et al., 2008 5 Foerster & Karolyi, 1999, 2000; Jayaraman et al., 1993; Miller, 1999; Sundaram & Logue, 1996
6 Choi & Kim, 2000; Jiang, 1998; Officer and Hoffmeister, 1987; & Wahab and Khandula, 1993
7 Alexander et al., 1988; Domowitz et al., 1998; Webb et al., 1995; Fang & Loo, 2002
8 Chen et al., 2011
Page | 4
A common phenomenon that underlines all of the above cited scholarly excursions is
the employment of multiple time series at a time, such as, but not limited to the ADR, the
underlying stock, the US stock market index, the foreign stock market index, the pertinent
exchange rate, the pertinent industry and world indices at local and global levels so as to
understand the return generating mechanisms of ADRs, the underlying dynamics behind all
such time series considered, and the implications of such findings for portfolio diversification
& market segmentation.
The central intent behind this paper is to step away from this multivariate approach
that is methodologically grounded on law of one price, and in the process test for the nature
of nonlinearity in ADRs and their underlying stocks, and identify discernable differences (if
any) in the degree of efficiency exhibited by the individual ADRs, the underlying stock
trading in Mumbai, the broader US market index and the broader Indian stock index, as
evidenced by differences (if any) on the nature of nonlinearity exhibited by the different
times series considered for this study, using the windowed as well as the rolling procedure of
Hinich portmanteau bicorrelation test.
In light of the prevalence of law of one price amidst ADRs and their underlying
stocks; and the perception of relative inefficiency of emerging markets, the findings of this
paper could shed some light to the following questions:
a) Is there any discernable difference in the degree of efficiency exhibited by the firm-level
ADRs and the broader US market?
b) Is there any discernable difference in the degree of efficiency exhibited by underlying
stocks trading in Mumbai and the broader Indian stock market?
c) Is there any discernable difference in the degree of efficiency exhibited by the different
ADRs considered for this study and their respective underlying stocks trading in Mumbai,
notwithstanding discernable difference in the degree of efficiency exhibited by the
broader US (S&P 500) and Indian (Nifty) stock markets?
The answers to these questions could help our understanding of the econometric
manifestation of market efficiency at the level of individual scrips (ADRs in the case of US,
and underlying stocks in the case of India) as opposed to the broader market index, and in the
process bring to light, discernable differences (if any) when it comes to efficiency and
evolving efficiency of the different time series considered for this study namely, the
individual level II/III ADRs issued by Indian companies; the underlying stocks trading in
Mumbai; and the broader US and Indian stock market indices.
2. Data
Daily closing prices pertaining to level II and level III ADRs issued by Indian
companies, their underlying stocks trading in Mumbai, and the US national stock index (S&P
500) were downloaded from finance.yahoo.com, while daily closing prices pertaining to the
Indian national stock index (Nifty) was downloaded from www.nseindia.com. A snapshot of
the different ADRs considered for this study is made available in table 2.1. Missing values
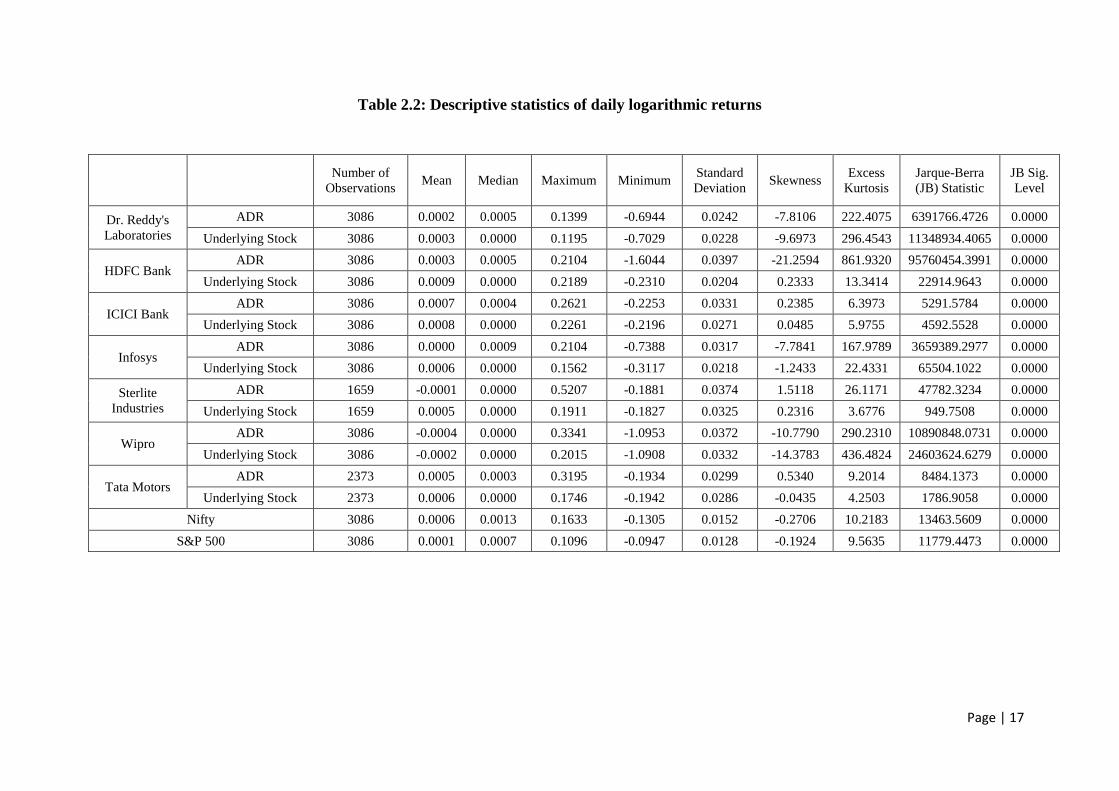
were imputed using linear interpolation. Table 2.2 contains detailed descriptive statistics
Page | 5
pertaining to the different time series considered for this study. Each of the time series
considered for this study was found to be I(1) at levels/logarithmic levels, while logarithmic
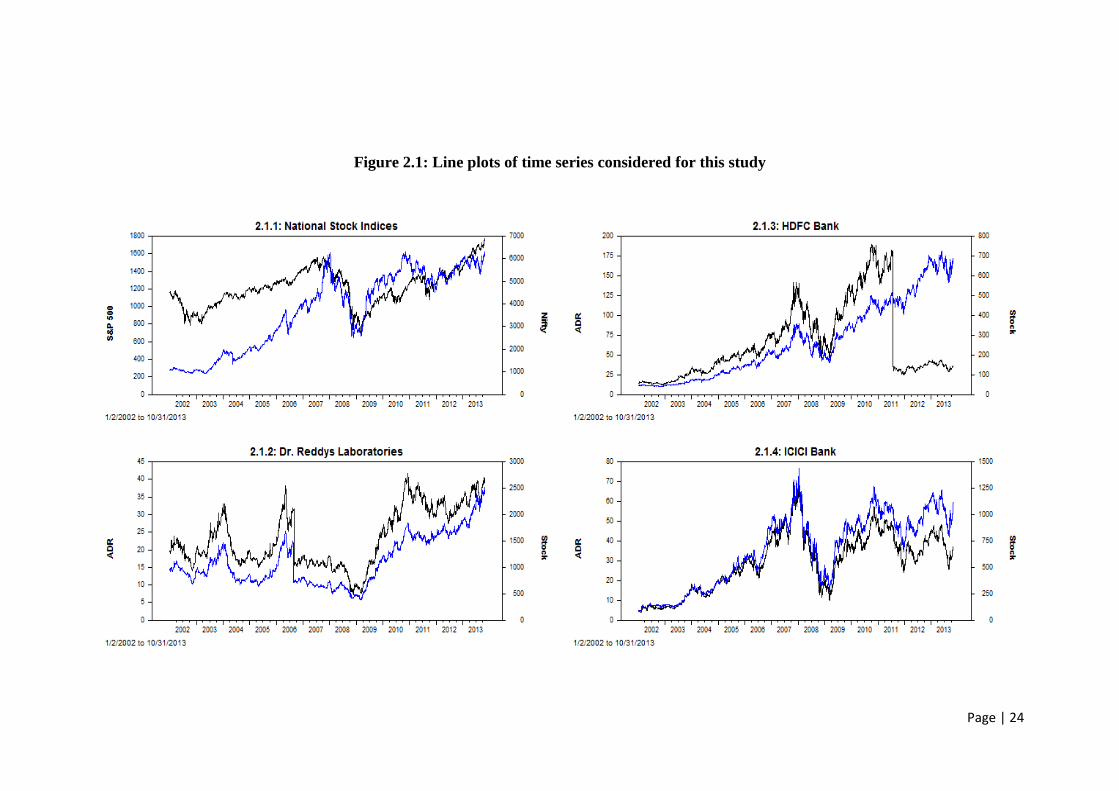
returns of all the time series were found to be I(0). Figures 2.1 and 2.2 constitute the line
plots of the different time series considered for this study.
[Insert Tables 2.1 and 2.2, and Figures 2.1 and 2.2 here]
3. Econometric Methodology
The windowed procedure of Hinich bicorrelation test has been employed by many
researchers, such as, Brooks (1996), Brooks & Hinich (1998), Lim & Hinich (2005), Lim et
al. (2005 & 2008a), and Bonilla et al. (2006 & 2008), so as to examine the nonlinear
behaviour exhibited by a wide variety of assets classes such as ten daily sterling exchange
rates, ten European exchange rates, fourteen Asian stock market indices, seven Latin
American stock indices, and ten Latin American emerging market bonds. Further, the rolling
procedure of hinich bircorrelation test has been applied by Lim (2007) and Lim et al. (2008b)
so as to rank the market efficiency of global stock markets and to investigate the impact of
the 1997 financial crisis on stock market efficiencies of eight Asian stock markets
respectively.
We now describe the windowed procedure of Hinich bicorrelation test, otherwise
called as H test in the literature. Let {x(tk)} denote the sampled data process, wherein time t is
an integer. The test procedure employs non-overlapping time windows. If n is the length of
each window, then kth window would be {x(tk), x(tk+1), x(tk+2), x(tk+3),…., x(tk+n-1)} and
the window after that would be {x(tk+1), x(tk+1+1), x(tk+1+2), x(tk+1+3),…., x(tk+1+n-1)},
where tk+1 = tk+1 + n. Let Z(t) denote the standardized observations obtained as follows
( ) ( )
for each t = 1,2,3,…, n, where mx and sx is sample mean and standard deviation respectively
of each window.
The null hypothesis for each window is that x(t) are realizations of a stationary pure
noise that has zero bicorrelation. Thus, under null hypothesis, the correlations Czz(r) =
E[Z(t)Z(t+r)]=0 for all r ≠ 0 and the bicorrelations Czzz(r,s) = E[Z(t)Z(t+r)Z(t+s)]=0 for all r,s
except for r=s=0. The alternative hypothesis is that the underlying process in the window
possesses nonzero correlations or bicorrelation for 0<r<s<L where L is the number of lags
that define the window. Put differently, should there exist a second-order linear or third-order
nonlinear dependence in the underlying data generating process, then Czz(r) ≠ 0 or Czzz(r,s) ≠
0 for atleast one r or one pair of r and s values respectively. The r sample correlation
coefficient is shown below.
( ) ( ) ∑ ( ) ( )
Page | 6
The C statistic developed to test for existence of non-zero linear dependence within a
window and its corresponding distribution is shown below.
∑ ( )
The sample bicorrelation coefficient is defined as follows
( ) ( ) ∑ ( ) ( ) ( )
The H statistic developed to test for existence of non-zero bicorrelation within each
window and its corresponding distribution is as follows.
∑∑ ( ) ( )
Where G(r,s) = (n-s)1/2
Czzz(r,s).
The number of lags L is specified as L=nb with 0<b<0.5, wherein b is the parameter
under choice by the user. Based on their outcomes pertaining to Monte Carlo simulations,
Hinich & Patterson (2005) recommended the usage of b value of 0.4, as doing so would
maximize the power of test, while ensuring a valid approximation of the asymptotic theory.
Another input that needs to be decided by a researcher while employing the windowed
procedure of hinich bicorrelation test is the length of the window. The larger the length of the
window, the larger would be the number of lags employed, and consequently the greater
would be the power of the test. Having said so, larger window length increases the
uncertainty on the event time when serial dependence occurs. In short, the window length
should be sufficiently long enough to validly apply bicorrelation statistic and yet short
enough for the data generating process to remain roughly constant (Brooks & Hinich, 1998).
Rejection of null hypothesis of pure white noise, when subjecting a time series to
hinich bicorrelation test, could be reflective of linear and/or nonlinear dependence exhibited
by the time series. In order to remove the impact of linear dependence on hinich bicorrelation
test outcomes, the time series is initially subjected to an AR filter. The AR-filtered residuals
obtained from this prewhitening procedure is then subjected to windowed or rolling
procedure of the hinich bicorrelation test. Further, it has to be noted that, unlike other popular
nonlinearity tests such as the BDS test that calls for AR-GARCH filtering of the time series
on hand so as to explore the possibility of non-multiplicative (additive) nonlinearity, the
hinich bicorrelation test possesses proper asymptotic size in the event of the underlying time
series exhibiting GARCH effects. This precludes the need for researchers to employ a
GARCH filter before employing the hinich bicorrelation test.
Unlike the windowed hinich bicorrelation test procedure that calls for division of
underlying time series into non-overlapping moving samples of equal length, the rolling
hinich bicorrelation test procedure warrants fixed-length moving sample that moves one
observation at a time.
Page | 7
4. Findings
4.1 Preliminary prewhitening procedure
To start with, we employ an AR filter so as to remove in any linear dependence in all
the logarithmic returns of all time series considered for this study. The optimum number of
lags for the AR filter were initially arrived at, based on Akaike Information Criterion (AIC).
Subsequently, the C statistic pertaining to each of AR-filtered residuals is determined. Should
any of the AR-filtered residuals exhibit residual linear dependence, as indicated by significant
C statistic, efforts were undertaken by we to employ an higher order AR filter based on Ljung
Box test so as to remove all residual linear dependence in the AR-filtered residuals.
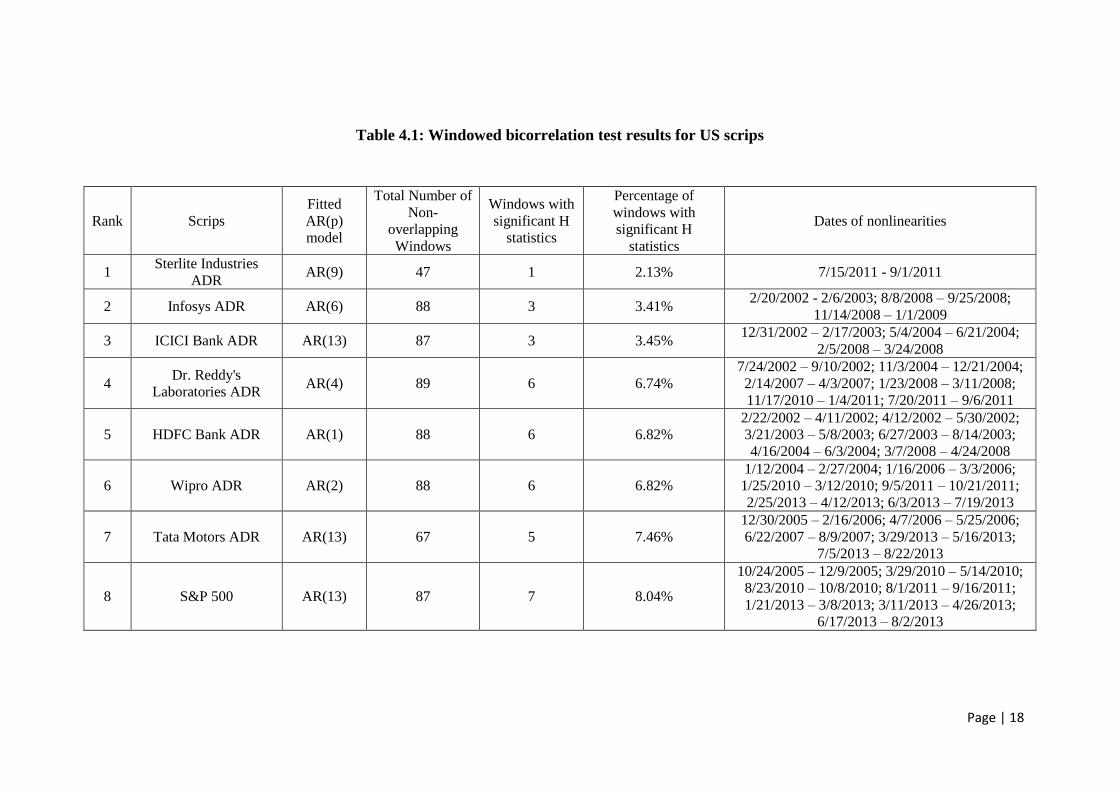
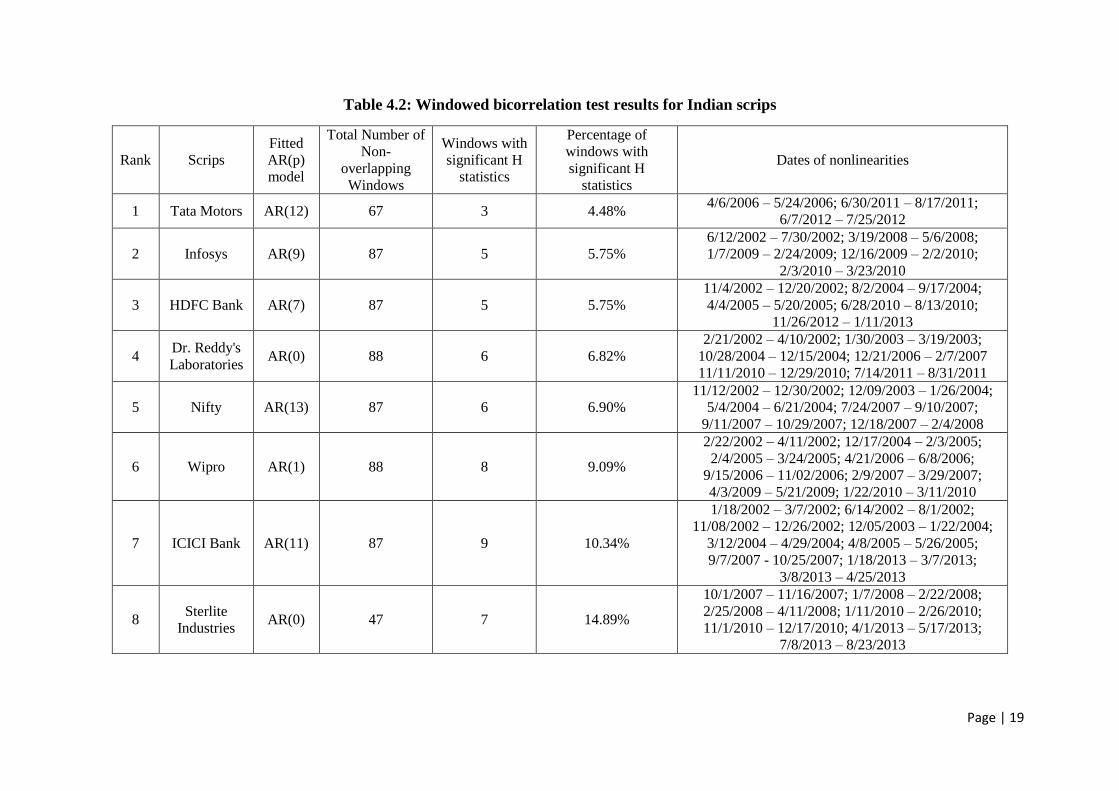
4.2 Windowed hinich bicorrelation test outcomes
AR-filtered residuals obtained from the above prewhitening procedure were then
subjected to windowed hinich bicorrelation test wherein each of the prewhitened time series
were divided into equal but non-overlapping moving time windows of 35 observations each.
Subsequently, the H statistic pertaining to each of the windows pertaining to all prewhitened
time series is determined. Prevalence of a significant H statistic in few of the many non-
overlapping moving windows is reflective of episodic nonlinearity in asset prices. The
windowed bicorrelation test outcomes pertaining to the different US (Indian) scrips
considered for this study is shown in table 4.1 (4.2).
[Insert Tables 4.1 and 4.2 here]
Test outcomes made available in tables 4.1 and 4.2 reveal the heterogeneous nature of
nonlinearity exhibited by the different US and Indian scrips considered for this study. To be
more specific, the degree of nonlinearity, as evidenced in the percentage of non-overlapping
equally-sized windows with significant H statistic, that is exhibited by the individual
US/Indian scrips is not quite the same as the degree of nonlinearity exhibited by the broader
stock market index (S&P 500/Nifty). Further, windowed hinich bicorrelation test outcomes
reveal that certain scrips, such as Sterlite Industries ADR and Infosys ADR in the case of US
and Tata Motors and Infosys stocks in the case of India, are far more efficient than their
respective national stock market index (S&P500 / Nifty).
4.3 Rolling bicorrelation test outcomes
Having examined the heterogeneous nature of nonlinearity exhibited by scrips trading
in US and India, we then employed the rolling bicorrelation test procedure. Unlike the
windowed bicorrelation test procedure, which warrants splitting the prewhitened time series
into equally spaced, non-overlapping moving windows; the rolling hinich bicorrelation test
accommodates for the possibility of evolving efficiency in much shorter horizons. Put
differently, the rolling bicorrelation test procedure calls for a fixed-length moving sample
approach that moves one observation at a time. Subjecting a moving sample to hinich
bicorrelation test, reveals the evolving efficiency of the underlying prewhitened time series as
evidenced by the time-varying trajectory of the H statistic at each point of time.
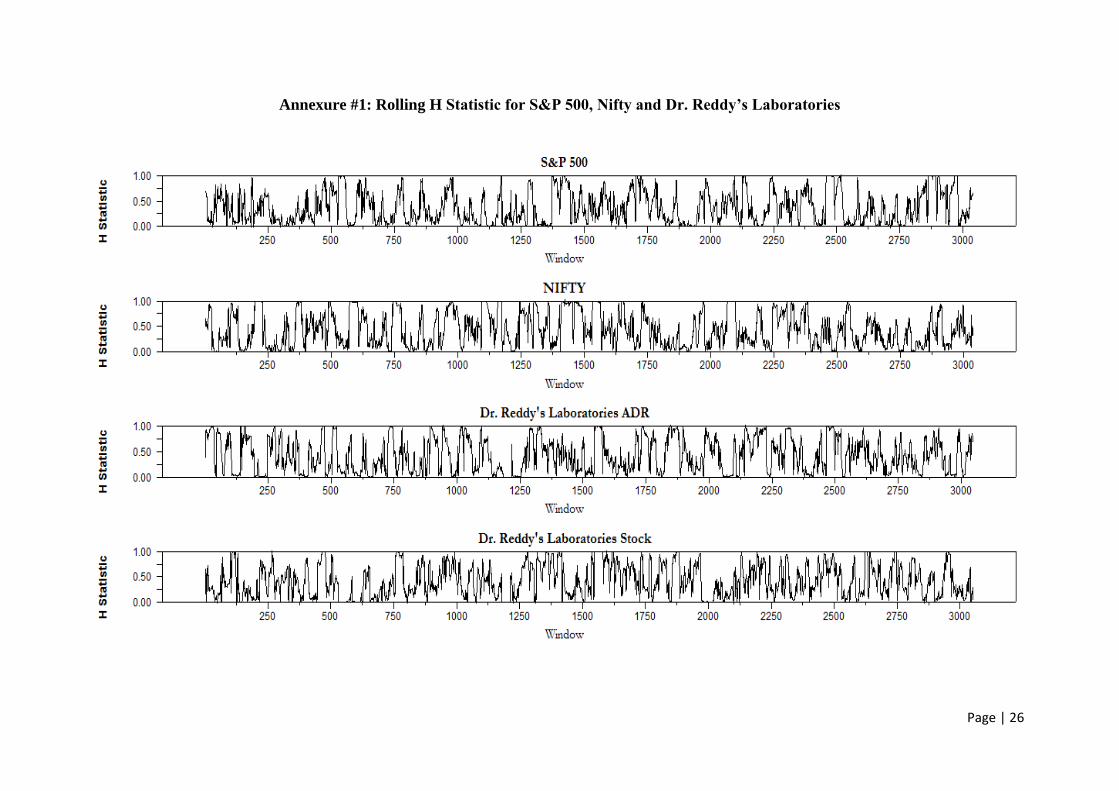
We computed the time-varying H statistic in a rolling window of 35 observations. In
line with precedence in literature (Lim, 2007), the H statistics generated at different points of
Page | 8
time were transformed into a percentile, which is 1 – p value. For instance, should the H
statistic of a window be found to be significant at 5 % level, then the p value is bound to be
lower than 0.05. Consequently the transformed H statistic will be above 0.95. As a result, a
transformed H statistic value that is higher than 0.95 and much closer to one would indicate
acute nonlinear serial dependence of the underlying time series.
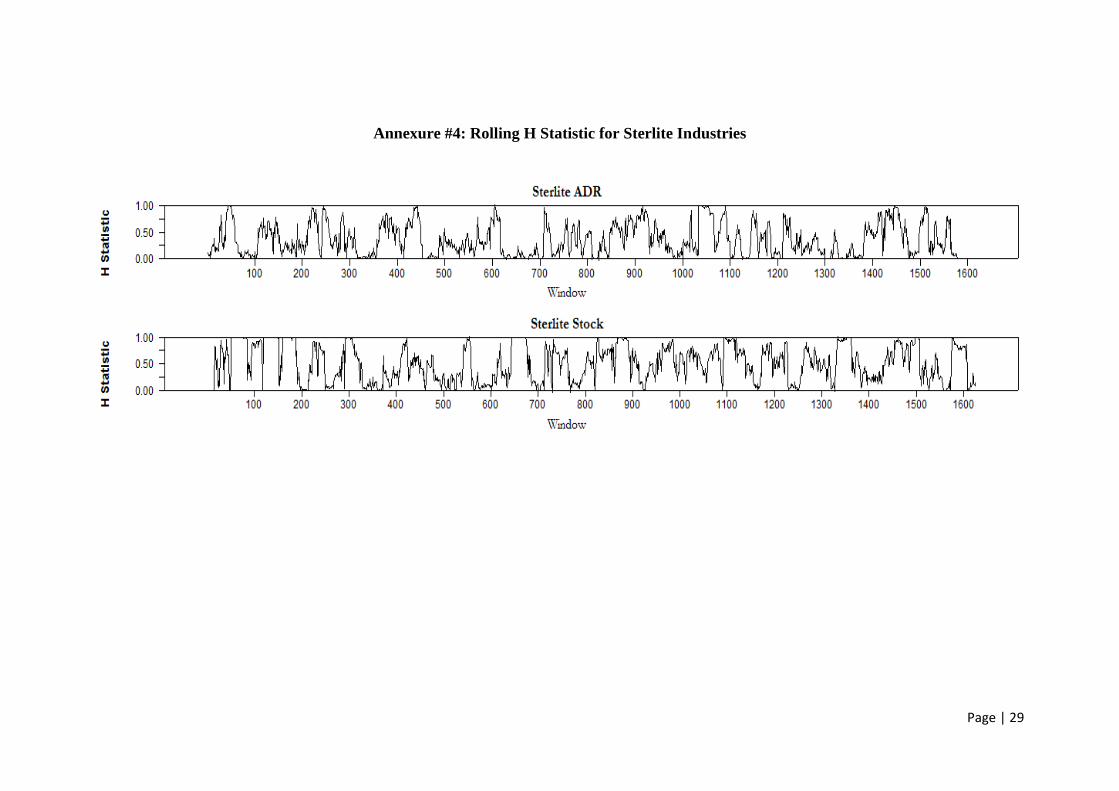
Annexures one to four constitute the line plots of the transformed H statistic obtained
for each of the time series considered in this study. These line plots, which reveal the time-
varying tendency of the H statistic, pinpoint to the inadequacy of studies that characterize
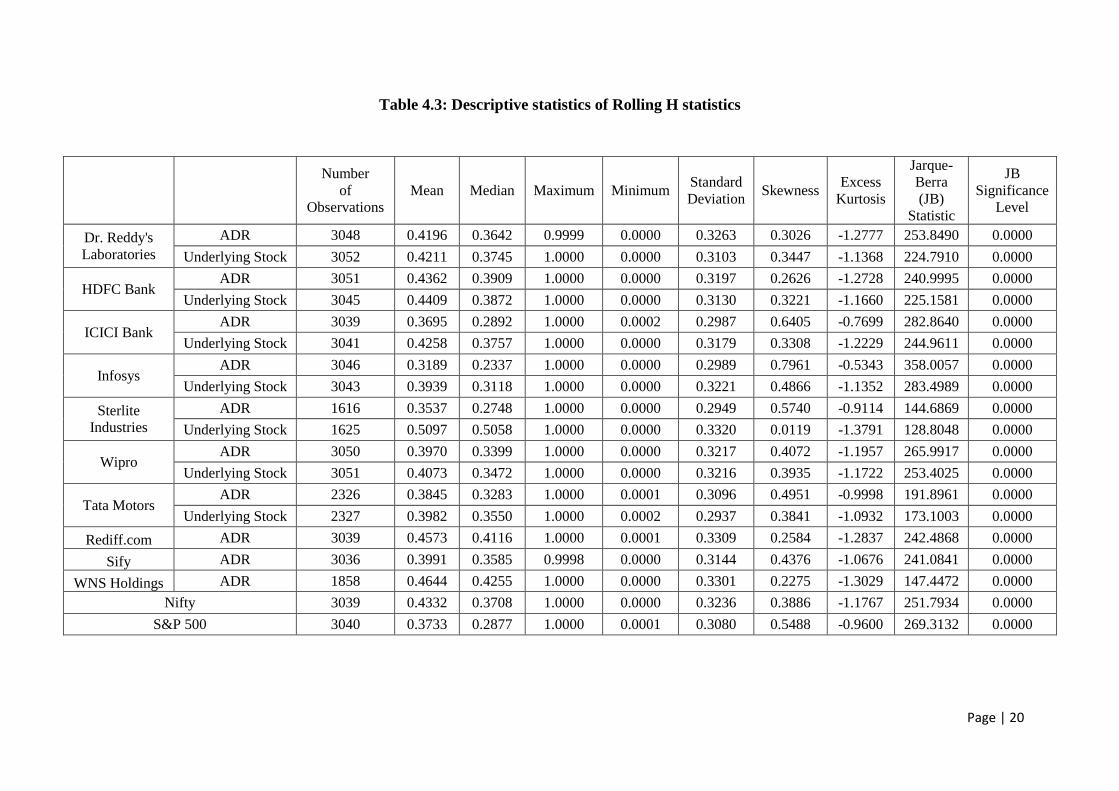
market efficiency as a static phenomenon that remains unchanged over time. In order to
garner a better idea of the distribution of thousands of scrip-wise H statistics generated over
time, detailed scrip-wise descriptive statistics of transformed H statistics is made available in
table 4.3.
[Insert Table 4.3 here; Also View Annexures one to four at this juncture]
4.4 Ranking US and Indian scrips in the order of efficiency
As seen in table 4.3, all scrip-wise H statistics generated over time indicate skewness
towards right, coupled with a kurtosis value that is less than three. In other words, the
distribution of scrip-wise H statistics generated over time, as rightly pointed out by the
Jarque-Berra test outcomes, is non-normal in nature. In light of the non-normal nature of
scrip-wise H statistics generated over time, we follow the approach undertaken by Lim
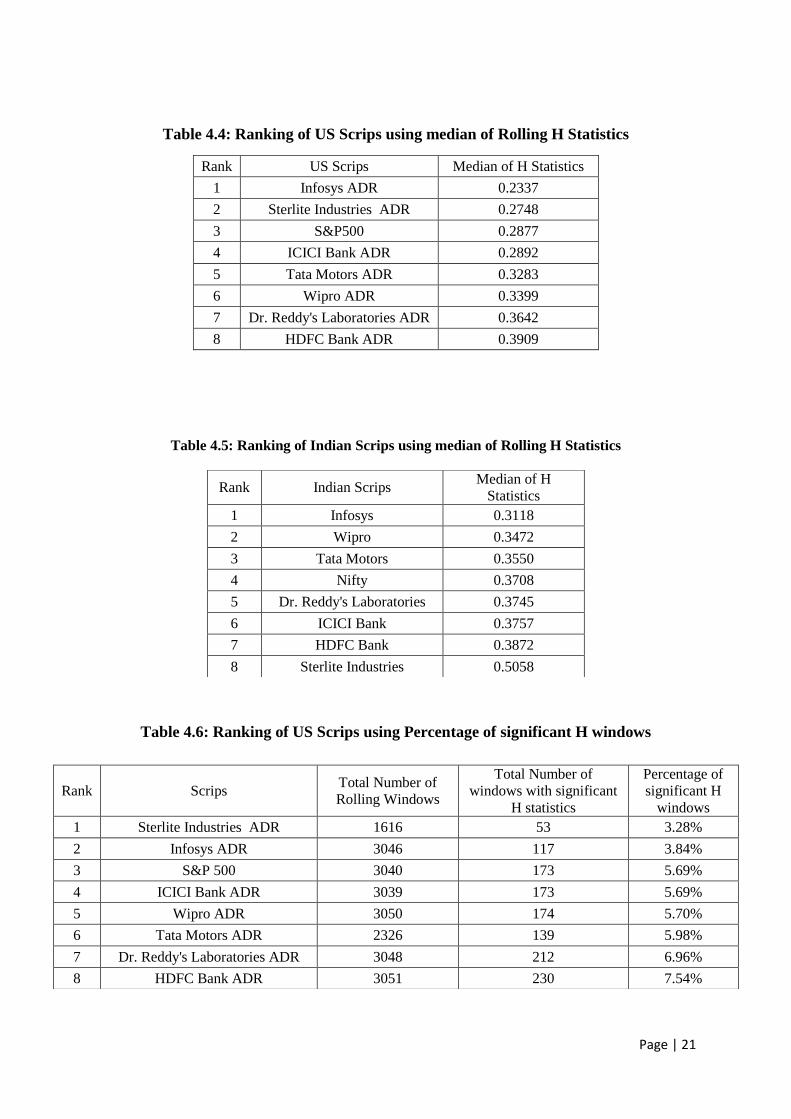
(2007), and consequently rank the different US and Indian scrips considered for this study,
from highly efficient one to the least efficient one, using the median of scrip-wise H statistics
generated. Tables 4.4 and 4.5 show the ranking of the different US and Indian scrips
considered for this study, based on the median of rolling H statistics.
[Insert tables 4.4 and 4.5 here]
In the case of US, Infosys ADR and Sterlite Industries ADR are more efficient than
the overall US stock market (S&P 500). Similarly, in the case of India, Infosys, Wipro, and
Tata Motors scrips are more efficient than the overall Indian stock market (Nifty). Further, of
all the different time series considered for this study, Infosys scrip happens to be the most
efficient both in US and in India. Having said so, this seemingly-universal attribute of Infosys
scrip on the efficiency front is not generalizable. To be specific, while Sterlite Industries
ADR happens to be more efficient than the broader US market (S&P 500), the Sterlite
Industries stock trading in Mumbai is the most inefficient of all scrips considered in this
study. Finally, a broader take-away from tables 4.4 and 4.5, is the higher efficiency of US
stock market as a whole (S&P 500) in comparison to its Indian counterpart (Nifty).
A notable criticism with respect to ranking markets/scrips on the efficiency front
based on median of time-varying H statistics, is that the median per se, is not a true reflection
of the thousands of scrip-wise time-varying H statistics generated as part of the rolling
procedure. Further, ranking different markets/scrips based on such a singular measure would
offer a biased perspective of the relative state of efficiency of different markets, which in
turn, would run counter to the fundamental objective of rolling hinich bicorrelation
Page | 9
procedure. Consequently, Lim (2007) offered a meaningful alternative measure aimed at
ranking the different markets/scrips on the efficiency front, which is the percentage of
significant H windows measure. The proportion of significant H windows for a highly
efficient market would be far less than that of an inefficient market, which is likely to be
punctuated with frequent nonlinear episodes.
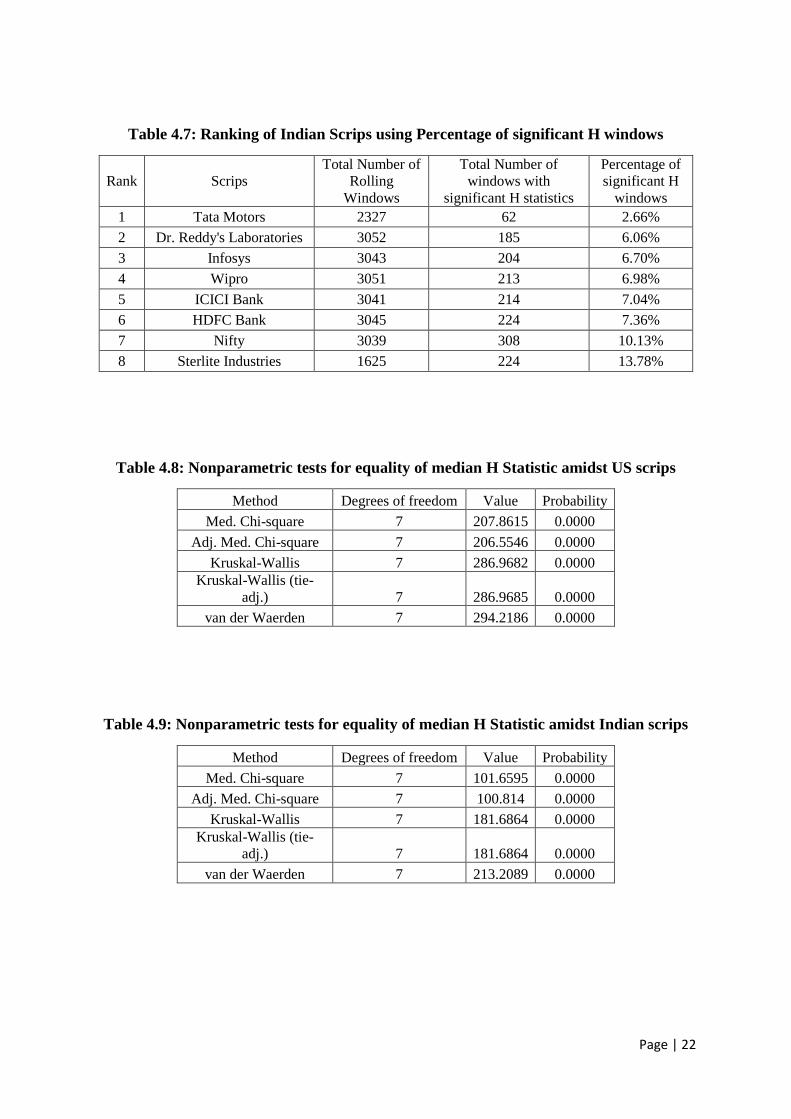
Tables 4.6 and 4.7 show the ranking of the different US and Indian scrips considered
for this study, based on the percentage of significant H windows measure. These findings are
more or less in the same lines as the earlier scrip-wise findings based on median H statistic
measure that were made available in tables 4.4 and 4.5.
[Insert Tables 4.6 and 4.7 here]
4.5 Testing for homogeneity of scrip-wise efficiency within a trading location
In light of the non-normality of scrip-wise H statistics generated over time, non-
parametric tests for equality of median H statistic were employed so as to examine the
homogeneity of the efficiency exhibited by the US and Indian scrips. Test outcomes made
available in table 4.8 rejects the null hypothesis of equality of median H statistics amidst the
different US scrips considered for this study. Similarly, test outcomes made available in table
4.9 rejects the null hypothesis of equality of median H statistic amidst the different Indian
scrips considered for this study. Put differently tables 4.8 and 4.9 show that the scrip-wise
efficiency rankings based on median H statistic is meaningful in nature. Further, the degree of
efficiency of all US/Indian scrips considered for this study is heterogeneous in nature and
thereby warrants a ranking approach in each trading location.
[Insert tables 4.8 and 4.9 here]
4.5 Testing for homogeneity of efficiency of dually-listed stocks
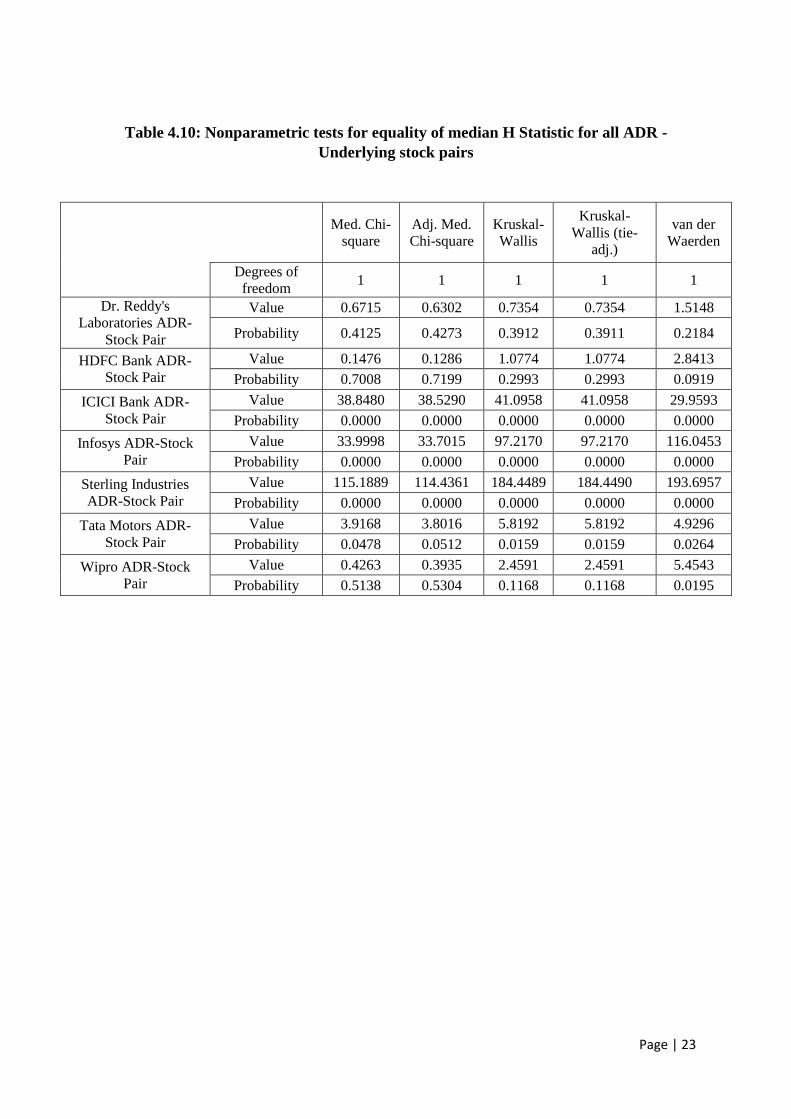
Finally efforts were undertaken by we to test for any discernable difference in the
degree of efficiency exhibited by the different ADRs considered for this study and their
respective underlying stocks trading in Mumbai, notwithstanding discernable difference in
the degree of efficiency exhibited by the broader US (S&P 500) and Indian (Nifty) stock
markets. Findings obtained in this regard are made available in table 4.10.
[Insert table 4.10 here]
It is interesting to note that the nonparametric test outcomes indicate equality of
median H statistic for ADR-Underlying Stock pairs pertaining to (a) Dr. Reddy’s laboratories
and HDFC Bank scrips at 5% significance level and (b) Wipro and Tata Motors scrips at 1%
significance level. In other words, the degree of efficiency of dually-listed stocks such as, and
limited to, Dr. Reddy’s Laboratories, HDFC Bank, Wipro, and Tata Motors, as captured by
the median H statistic, is found to be homogenous across trading locations. However, this
attribute is not generalizable across all the dually-listed scrips considered for this study. To be
specific, test outcomes made available in table 4.10 reveal inequality of median H statistic for
ADR-Underlying Stock pairs pertaining to ICICI Bank, Infosys and Sterlite Industries. In
other words, the degree of efficiency of dually-listed stocks such as, and limited to, ICICI
Page | 10
Bank, Infosys and Sterlite Industries, as captured by the median H statistic, is found to lack
homogeneity.
5. Conclusion
The central intent behind this study was to examine the efficiency of Level II/III
Indian ADRs and their underlying stocks trading in Mumbai from a nonlinear univariate
perspective. Prior research works that employed time-varying non-linear serial dependence
measures were centered on ranking the efficiency of the global stock markets based on degree
of nonlinearity exhibited by the different national stock indices. Outcomes pertaining to such
studies indicate the heightened level of efficiency of US stock market coupled with relative
inefficiency of emerging markets such as India. We of this study break away from this
aggregate trend and examine the evolving efficiency of Indian DRs that are listed in most
efficient trading location, namely the US. In doing so, we seek to answer the following
hitherto-unanswered questions. Firstly, is there any discernable difference in the degree of
efficiency exhibited by the firm-level ADRs and the broader US market? Secondly, is there
any discernable difference in the degree of efficiency exhibited by underlying stocks trading
in Mumbai and the broader Indian stock market? Finally, is there any discernable difference
in the degree of efficiency exhibited by the different ADRs considered for this study and their
respective underlying stocks trading in Mumbai, notwithstanding discernable difference in
the degree of efficiency exhibited by the broader US (S&P 500) and Indian (Nifty) stock
markets?
The study’s findings indicate that the degree of efficiency of all US/Indian scrips
considered for this study is heterogeneous in nature and thereby warrant a ranking approach
in each trading location. At a granular level, in the case of US, Infosys ADR and Sterlite
Industries ADR were found to be more efficient than the overall US stock market (S&P 500).
Similarly, in the case of India, Infosys, Wipro, Tata Motors scrips were found to be more
efficient than the overall Indian stock market (Nifty). Further, of all the different time series
considered for this study, Infosys scrip happens to be the most efficient both in US and in
India. Having said so, this seemingly-universal attribute of Infosys scrip on the efficiency
front is not generalizable across all other scrips. To be specific, while Sterlite Industries ADR
happens to be more efficient than the broader US market (S&P 500), the Sterlite Industries
stock trading in Mumbai is the most inefficient of all scrips considered in this study.
Also, efforts undertaken by us to test for any discernable difference in the degree of
efficiency exhibited by the different ADRs considered for this study and their respective
underlying stocks trading in Mumbai, notwithstanding discernable difference in the degree of
efficiency exhibited by the broader US (S&P 500) and Indian (Nifty) stock markets, yielded
nuanced results. To be specific, the degree of efficiency of dually-listed stocks such as, and
limited to, Dr. Reddy’s Laboratories, HDFC Bank, Wipro, and Tata Motors, was found to be
homogenous across trading locations (US and India), while the degree of efficiency of dually-
listed stocks such as, and limited to, ICICI Bank, Infosys and Sterlite Industries, were found
to lack homogeneity across trading locations.
Page | 11
Apart from addressing certain hitherto-unanswered questions we started with, the
study’s findings also throws light on the long road ahead for researchers, who are intent on
garnering a deeper perspective of market efficiency. This is because; the study’s findings
indicate that the degree of market efficiency witnessed at the level of individual scrips differs
considerably from the degree of efficiency of the broader stock market in which such scrips
trade. Further, degree of efficiency witnessed in certain (not all) dually-listed scrips
considered for this study was found to be homogenous across trading locations. However,
this does not happen to be the case for all dually-listed scrips considered for this study. For
instance, notwithstanding the heightened efficiency of Infosys scrip in comparison to all other
scrips considered for this study in US as well as in Indian market place, the degree of
efficiency exhibited by Infosys ADR and its underlying Indian share trading in Mumbai fail
to exhibit homogeneity. The above-stated findings bring to light the need for granular,
disaggregated, firm-level market efficiency studies aimed at (a) examining firm-level market
efficiency at different trading locations and (b) identifying the antecedents behind
divergences/similarities in firm-level market efficiency across different trading locations.
Page | 12
References
Abhyankar, A., Copeland, L.S., and Wong, W. (1995), “Nonlinear dynamic in real-time
equity market indices: Evidence from the United Kingdom”, The Economic Journal,
Vol. 105 No. 431, pp. 864-880
Afonso, A. and Teixeira, J. (1999), “Nonlinearity of weakly efficient markets: Evidence from
Portugal”, Estudos de Economia, Vol. 9 No. 2, pp. 169-187.
Alaganar, V.T. and Bhar, R. (2001), “Diversification gains from American Depositary
Receipts and foreign equities: evidence from Australian Stocks”, Journal of
International Financial Markets, Institutions and Money, Vol. 11 No. 1, pp. 97-113.
Alagidede, P. (2011), “Return behavior in Africa’s emerging equity markets”, The Quarterly
Review of Economics and Finance, Vol. 51 No. 2, pp. 133-140.
Alexander, G.J., Eun, C., and Janakiramanan, S. (1988), “International listings and stock
returns: some empirical evidence”, Journal of Financial and Quantitative Analysis,
Vol. 23 No. 2, pp. 135-151.
Ammermann, P.A. and Patterson, D.M. (2003), “The cross-sectional and cross-temporal
universality of nonlinear dependence serial dependencies: Evidence from world stock
indices and the Taiwan Stock Exchange”, Pacific-Basin Journal, Vol. 11 No. 2, pp.
175-195.
Baker, H.K., Nofsinger, J.R., and Weaver, J.R. (2002), “International cross-listing and
visibility”, Journal of Financial and Quantitative Analysis, Vol. 37 No. 3, pp. 495-
521.
Bonilla, C.A., Romero-Meza, R., and Hinich, M.J. (2006), “Episodic nonlinearity in Latin
American stock market indices”, Applied Economics Letters, Vol. 13 No. 3, pp. 196-
199.
Bonilla, C.A., Maquieira, C.P., and Romero-Meza, R. (2008), “Nonlinear behaviour of
emerging market bonds spreads: the Latin American case”, Applied Economics, Vol.
40 No. 20, pp. 2697-2702.
Brooks, C. (1996), “Testing for nonlinearity in daily sterling exchange rates”, Applied
Financial Economics, Vol. 6 No. 4, pp. 307-317.
Brooks, C. and Hinich, M. J. (1998), “Episodic nonstationarity in exchange rates”, Applied
Economics Letters, Vol. 5 No. 11, pp. 719-722.
Chen, H., Choi, P.M.S., and Kim, H. (2008), “American depositary receipts: Asia-Pacific
evidence on convergence and dynamics”, Journal of Multinational Financial
Management, Vol. 18 No. 4, pp. 346-368.
Chen, M., Lee, C., and Hsu, Y. (2011), “The impact of American depositary receipts on the
Japanese index: Do industry effect and size effect matter?”, Economic Modelling,
Vol. 28 No. 1-2, pp. 526-539.
Choi, Y.K. and Kim, D. (2000), “Determinants of American Depositary Receipts and their
underlying stock returns: Implications for international diversification”, International
Review of Financial Analysis, Vol. 9 No. 4, pp. 351-368.
Chung, H., Ho, T.W., and Wei, L.J. (2005), “The dynamic relationship between the prices of
ADRs and their underlying stocks: evidence from the threshold vector error
correction model.”, Applied Economics, Vol. 37 No. 20, pp. 2387-2394.

Page | 13
Cinko, M. (2002), “Nonlinearity test for Istanbul Stock Exchange”, available at: http://idari.
cu.edu.tr/sempozyum/bil3.htm (accessed 30 October 2013)
Domowitz, I., Glen, J., and Madhavan, A. (1998), “International cross listing and order flow
migration: evidence from an emerging market”, Journal of Finance, Vol. 53 No. 6,
pp. 2001-2027.
Dorina, L. & Simina, U. (2007), “Testing efficiency of the stock market in emerging
economies”, available at: http://steconomiceuoradea.ro/anale/volume/2007/v2-
statistics-and-economic-informatics/24.pdf (accessed 30 October 2013)
Errunza, V.R. and Miller, D.P. (2000), “Market Segmentation and the cost of capital in
international equity markets”, Journal of Financial and Quantitative Analysis, Vol.
35 No. 4, pp. 577-600.
Fama, E.F. (1970), “Efficient Capital Markets: A review of Theory and Empirical Work”,
Journal of Finance, Vol. 25 No. 2, pp. 383-417.
Fama, E.F. and French, K.R. (1988), “Permanent and Temporary Components of Stock
Prices”, Journal of Political Economy, Vol. 96 No. 2, pp. 246-273.
Fang, H. and Loo, J.C.H. (2002), “Pricing of American Depositary receipts under Market
Segmentation.”, Global Finance Journal, Vol. 13 No. 2, pp. 237-252.
Foerster, S. and Karolyi, G.A. (1999), “The effects of market segmentation and investor
recognition on asset prices: evidence from foreign stocks listing in the United
States”, Journal of Finance, Vol. 54 No. 3, pp. 981-1013.
Foerster, S. and Karolyi, G.A. (2000), “The long run performance of global equity offerings”,
Journal of Financial and Quantitative Analysis, Vol. 35 No. 4, pp. 499-528.
Hassan, K.M., Al-Sultan, W.S., and Al-Saleem, J.A. (2003), “Stock market efficiency in the
Gulf Council Countries (GCC): The case of Kuwait stock exchange”, Scientific
Journal of Administrative Development, Vol. 1 No. 1, pp. 1-21.
Hinich, M. J. and Patterson, D. M. (1985), “Evidence of Nonlinearity in Daily Stock
Returns”, Journal of Business and Economic Statistics, Vol. 3 No. 1, pp. 69-77.
Hinich, M.J. and Patterson, D. (2005), “Detecting Epochs of Transient dependence in White
Noise”, in Belongia, M. & Binner, J. (Eds.), Money Measurement and Computation,
Palgrave Macmillan Houndmills, London.
Hiremath, G.S. and Kamaiah, B. (2010), “Nonlinear Dependence in Stock Returns: Evidence
from India”, Journal of Quantitative Economics, Vol. 8 No. 1, pp. 69-85.
Hsieh, D.A. (1991), “Chaos and Nonlinear Dynamics: Application to Financial Markets”,
Journal of Finance, Vol. 46 No. 5, pp. 1839-1877.
Jayaraman, N., Shastri, K., and Tandon, K. (1993), “The impact of international cross listings
on risk and return: the evidence from American Depositary Receipts”, Journal of
Banking and Finance, Vol. 17 No. 1, pp. 91-103.
Ji, S. (2003), “Does the investor base influence stock co-movement?” working paper, Arizona
State University, AZ.
Jiang, C.X. (1998), “Diversification with American Depositary Receipts: the dynamics and
the pricing factors”, Journal of Business Finance and Accounting, Vol. 25 No. 5-6,
pp. 683-699.
Page | 14
Kato, K., Linn, S., and Schallheim, J. (1991), “Are there arbitrage opportunities in the market
for American Depositary receipts?”, Journal of International Financial Markets
Institutions and Money, Vol. 1 No. 1, pp. 73-89.
Kim, M., Szakmary, A.C., and Mathur, I. (2000), “Price transmission dynamics between
ADRs and their underlying foreign security”, Journal of Banking and Finance, Vol.
24 No. 8, pp. 1359-1382.
Kosfeld, R. and Rober, S. (2001), “Testing for nonlinearities in German bank stock returns”,
Empirical Economics, Vol. 26 No. 3, pp. 581-597.
Lim, K.P. (2007), “Ranking market efficiency for stock markets: A nonlinear perspective”,
Physica A: Statistical Mechanics and its Applications, Vol. 375, pp. 445-454.
Lim, K.P. and Brooks, R. D. (2009), “Are Chinese stock markets efficient? Further evidence
from a battery of nonlinearity tests”, Applied Financial Economics, Vol. 19 No. 2,
pp. 147-155.
Lim, K.P., Brooks, R.D., and Hinich, M.J. (2008a), “Nonlinear serial dependence and the
weak-form efficiency of Asian emerging stock markets”, Journal of International
Financial Markets, Institutions, and Money, Vol. 18 No. 5, pp. 527-544.
Lim, K.P., Brooks, R.D., and Kim, J.H. (2008b), “Financial crisis and stock market
efficiency: Empirical evidence from Asian countries”, International Review of
Financial Analysis, Vol. 17 No. 3, pp. 571-591.
Lim, K.P. and Hooy, C.W. (2013), “Nonlinear Predictability in G7 Stock Index Returns”, The
Manchester School, Vol. 81 No. 4, pp. 620-637.
Lim, K.P. and Hinich, M. J. (2005), “Non-linear Market Behavior: Events Detection in the
Malaysian Stock Market”, Economics Bulletin, Vol. 7 No. 6, pp. 1-5.
Lim, K.P., Hinich, M.J., and Liew, V.K. (2005), “Statistical Inadequacy of GARCH Models
for Asian Stock Markets: Evidence and Implications”, Journal of Emerging Market
Finance, Vol. 4 No. 3, pp. 263-279.
Lima, J. F. (1998), “Nonlinearities and non-stationarities in stock returns”, Journal of
Business and Economic Statistics, Vol. 16 No. 2, pp. 227-236.
Lo, A.W. and MacKinlay, A.C. (1988), “Stock market prices do not follow random walks:
evidence from a simple specification test”, Review of Financial Studies, Vol. 1 No. 1,
pp. 41-66.
Lo, A.W. (2005), “Reconciling Efficient Markets with Behavioural Finance: The Adaptive
Markets Hypothesis”, Journal of Investment Consulting, Vol. 7 No. 2, pp. 21-44.
Madhavan, V. (2014), “Investigating the nature of nonlinearity in Indian Exchange Traded
Funds (ETFs)”, Managerial Finance, Vol. 40 No. 4, 395-415.
Maldonado, R. and Saunders, A. (1983), “Foreign exchange restrictions and the law of one
price”, Financial Management, Vol. 12 No. 1, pp. 19-23.
Miller, D. (1999), “The market reaction to international cross listings: evidence from
depositary receipts”, Journal of Financial Economics, Vol. 51 No. 1, pp. 103-123.
Mishra, R.K., Sehgal, S., and Bhanumurthy, N.R. (2011), “A search for long-range
dependence and chaotic structure in Indian stock market”, Review of Financial
Economics, Vol. 20 No. 2, pp. 96-104.

Page | 15
Officer, D. and Hoffmeister, R. (1987), “ADRs: a substitute for the real thing?”, Journal of
Portfolio Management, Vol. 13 No. 2, pp. 61-65.
Opong, K.K., Mulholland, G., Fox, A. F., and Farahmand, K. (1999), “The behavior of some
UK equity indices: An application of Hurst and BDS tests”, Journal of Empirical
Finance, Vol. 6 No. 3, pp. 267-282.
Pagano, M., Roell, A.A., and Zechner, J. (2002), “The geography of equity listing: why do
companies list abroad?, Journal of Finance, Vol. 57 No. 6, pp. 2651-2694.
Panagiotidis, T. (2005), “Market capitalization and efficiency: does it matter? Evidence from
Athens Stock Exchange”, Applied Financial Economics, Vol. 15 No. 10, pp. 707-
713.
Park, J., and Tavakkol, A. (1994), “Are ADRs a dollar translation of their underlying
securities? The case of Japanese ADRs”, Journal of International Financial Markets,
Institutions, and Money, Vol. 4 No. 1-2, pp. 77-87.
Poshakwale, S. (2002), “The Random Walk Hypothesis in the Emerging Indian Stock
Market”, Journal of Business Finance and Accounting, Vol. 29 No. 9 & 10, pp.
1275-1299.
Poterba, J.M. and Summers, L.H. (1988), “Mean reversion in stock prices: Evidence and
Implications”, Journal of Financial Economics, Vol. 22 No. 1, pp. 27-59.
Romero-Meza, R., Bonilla, C.A., and Hinich, M.J. (2007), “Nonlinear detection in the
Chilean stock market”, Applied Economic Letters, Vol. 14 No. 13, pp. 987-991.
Scheicher, M. (1999), “Nonlinear Dynamics: Evidence for a small stock exchange”,
Empirical Economics, Vol. 24 No. 1, pp. 45-59.
Scheinkman, J.A. and LeBaron, B. (1989), “Nonlinear Dynamics and Stock Returns”,
Journal of Business, Vol. 62 No. 3, pp. 311-337.
Seddighi, H.R. and Nian, W. (2004), “The Chinese stock exchange market: Operations and
efficiency”, Applied Financial Economics, Vol. 14 No. 11, pp. 785-797.
Solibakke, P.B. (2005), “Nonlinearities dependence and conditional heteroscedasticity in
stock returns: Evidence from Norwegian thinly traded equity market”, The European
Journal of Finance, Vol. 11 No. 2, pp. 111-136.
Sundaram, A., and Logue, D. (1996), “Valuation effects of foreign company listing on US
exchanges”, Journal of International Business Studies, Vol. 27 No. 1, pp. 67-88.
Wahab, M., Lashgari, M., and Cohn, R. (1992), “Arbitrage opportunities in the American
Depositary Receipts market revisited”, Journal of International Financial Markets,
Institutions, and Money, Vol. 2 No. 3-4, pp. 97-130.
Wahab, M. and Khanduala, A. (1993), “Why not diversify internationally with ADRs?”,
Journal of Portfolio Management, Vol. 19 No. 2, pp. 75-82.
Webb, S., Officer, D., and Boyd, B. (1995), “An examination of international equity markets
using American Depositary Receipts”, Journal of Business Finance and Accounting,
Vol. 22 No. 3, pp. 415-430.
Willey, T. (1992), “Testing for Nonlinear dependence in daily stock indices”, Journal of
Economics and Business, Vol. 44 No. 1, pp. 63-76.

Page | 16
Table 2.1: A snapshot of the different ADRs considered for this study
S. No. DR Issue Capital Raised DR: Shares
Ratio Industry Effective Date
Time period considered for this
study
1 Dr. Reddy's
Laboratories Yes 1:1
Pharmaceuticals &
Biotechnology Apr 24,2001 1/2/2002 to 10/31/2013
2 HDFC Bank Yes 1:3 Banks Jul 25,2001 1/2/2002 to 10/31/2013
3 ICICI Bank Yes 1:2 Banks Mar 31,2000 1/2/2002 to 10/31/2013
4 Infosys Yes 1:1 Software & Computer
Services Mar 16,1999 1/2/2002 to 10/31/2013
5 Sterlite Industries Yes 1:4 Industrial Metals &
Mining Jun 22,2007 6/22/2007 to 10/31/2013
6 Wipro Yes 1:1 Software & Computer
Services Oct 24,2000 1/2/2002 to 10/31/2013
7 Tata Motors No 1:5 Industrial Engineering Sep 27,2004 9/27/2004 to 10/31/2013
Page | 17
Table 2.2: Descriptive statistics of daily logarithmic returns
Number of
Observations Mean Median Maximum Minimum
Standard
Deviation Skewness
Excess
Kurtosis
Jarque-Berra
(JB) Statistic
JB Sig.
Level
Dr. Reddy's
Laboratories
ADR 3086 0.0002 0.0005 0.1399 -0.6944 0.0242 -7.8106 222.4075 6391766.4726 0.0000
Underlying Stock 3086 0.0003 0.0000 0.1195 -0.7029 0.0228 -9.6973 296.4543 11348934.4065 0.0000
HDFC Bank ADR 3086 0.0003 0.0005 0.2104 -1.6044 0.0397 -21.2594 861.9320 95760454.3991 0.0000
Underlying Stock 3086 0.0009 0.0000 0.2189 -0.2310 0.0204 0.2333 13.3414 22914.9643 0.0000
ICICI Bank ADR 3086 0.0007 0.0004 0.2621 -0.2253 0.0331 0.2385 6.3973 5291.5784 0.0000
Underlying Stock 3086 0.0008 0.0000 0.2261 -0.2196 0.0271 0.0485 5.9755 4592.5528 0.0000
Infosys ADR 3086 0.0000 0.0009 0.2104 -0.7388 0.0317 -7.7841 167.9789 3659389.2977 0.0000
Underlying Stock 3086 0.0006 0.0000 0.1562 -0.3117 0.0218 -1.2433 22.4331 65504.1022 0.0000
Sterlite
Industries
ADR 1659 -0.0001 0.0000 0.5207 -0.1881 0.0374 1.5118 26.1171 47782.3234 0.0000
Underlying Stock 1659 0.0005 0.0000 0.1911 -0.1827 0.0325 0.2316 3.6776 949.7508 0.0000
Wipro ADR 3086 -0.0004 0.0000 0.3341 -1.0953 0.0372 -10.7790 290.2310 10890848.0731 0.0000
Underlying Stock 3086 -0.0002 0.0000 0.2015 -1.0908 0.0332 -14.3783 436.4824 24603624.6279 0.0000
Tata Motors ADR 2373 0.0005 0.0003 0.3195 -0.1934 0.0299 0.5340 9.2014 8484.1373 0.0000
Underlying Stock 2373 0.0006 0.0000 0.1746 -0.1942 0.0286 -0.0435 4.2503 1786.9058 0.0000
Nifty 3086 0.0006 0.0013 0.1633 -0.1305 0.0152 -0.2706 10.2183 13463.5609 0.0000
S&P 500 3086 0.0001 0.0007 0.1096 -0.0947 0.0128 -0.1924 9.5635 11779.4473 0.0000
Page | 18
Table 4.1: Windowed bicorrelation test results for US scrips
Rank Scrips
Fitted
AR(p)
model
Total Number of
Non-
overlapping
Windows
Windows with
significant H
statistics
Percentage of
windows with
significant H
statistics
Dates of nonlinearities
1 Sterlite Industries
ADR AR(9) 47 1 2.13% 7/15/2011 - 9/1/2011
2 Infosys ADR AR(6) 88 3 3.41% 2/20/2002 - 2/6/2003; 8/8/2008 – 9/25/2008;
11/14/2008 – 1/1/2009
3 ICICI Bank ADR AR(13) 87 3 3.45% 12/31/2002 – 2/17/2003; 5/4/2004 – 6/21/2004;
2/5/2008 – 3/24/2008
4 Dr. Reddy's
Laboratories ADR AR(4) 89 6 6.74%
7/24/2002 – 9/10/2002; 11/3/2004 – 12/21/2004;
2/14/2007 – 4/3/2007; 1/23/2008 – 3/11/2008;
11/17/2010 – 1/4/2011; 7/20/2011 – 9/6/2011
5 HDFC Bank ADR AR(1) 88 6 6.82%
2/22/2002 – 4/11/2002; 4/12/2002 – 5/30/2002;
3/21/2003 – 5/8/2003; 6/27/2003 – 8/14/2003;
4/16/2004 – 6/3/2004; 3/7/2008 – 4/24/2008
6 Wipro ADR AR(2) 88 6 6.82%
1/12/2004 – 2/27/2004; 1/16/2006 – 3/3/2006;
1/25/2010 – 3/12/2010; 9/5/2011 – 10/21/2011;
2/25/2013 – 4/12/2013; 6/3/2013 – 7/19/2013
7 Tata Motors ADR AR(13) 67 5 7.46%
12/30/2005 – 2/16/2006; 4/7/2006 – 5/25/2006;
6/22/2007 – 8/9/2007; 3/29/2013 – 5/16/2013;
7/5/2013 – 8/22/2013
8 S&P 500 AR(13) 87 7 8.04%
10/24/2005 – 12/9/2005; 3/29/2010 – 5/14/2010;
8/23/2010 – 10/8/2010; 8/1/2011 – 9/16/2011;
1/21/2013 – 3/8/2013; 3/11/2013 – 4/26/2013;
6/17/2013 – 8/2/2013
Page | 19
Table 4.2: Windowed bicorrelation test results for Indian scrips
Rank Scrips
Fitted
AR(p)
model
Total Number of
Non-
overlapping
Windows
Windows with
significant H
statistics
Percentage of
windows with
significant H
statistics
Dates of nonlinearities
1 Tata Motors AR(12) 67 3 4.48% 4/6/2006 – 5/24/2006; 6/30/2011 – 8/17/2011;
6/7/2012 – 7/25/2012
2 Infosys AR(9) 87 5 5.75%
6/12/2002 – 7/30/2002; 3/19/2008 – 5/6/2008;
1/7/2009 – 2/24/2009; 12/16/2009 – 2/2/2010;
2/3/2010 – 3/23/2010
3 HDFC Bank AR(7) 87 5 5.75%
11/4/2002 – 12/20/2002; 8/2/2004 – 9/17/2004;
4/4/2005 – 5/20/2005; 6/28/2010 – 8/13/2010;
11/26/2012 – 1/11/2013
4 Dr. Reddy's
Laboratories AR(0) 88 6 6.82%
2/21/2002 – 4/10/2002; 1/30/2003 – 3/19/2003;
10/28/2004 – 12/15/2004; 12/21/2006 – 2/7/2007
11/11/2010 – 12/29/2010; 7/14/2011 – 8/31/2011
5 Nifty AR(13) 87 6 6.90%
11/12/2002 – 12/30/2002; 12/09/2003 – 1/26/2004;
5/4/2004 – 6/21/2004; 7/24/2007 – 9/10/2007;
9/11/2007 – 10/29/2007; 12/18/2007 – 2/4/2008
6 Wipro AR(1) 88 8 9.09%
2/22/2002 – 4/11/2002; 12/17/2004 – 2/3/2005;
2/4/2005 – 3/24/2005; 4/21/2006 – 6/8/2006;
9/15/2006 – 11/02/2006; 2/9/2007 – 3/29/2007;
4/3/2009 – 5/21/2009; 1/22/2010 – 3/11/2010
7 ICICI Bank AR(11) 87 9 10.34%
1/18/2002 – 3/7/2002; 6/14/2002 – 8/1/2002;
11/08/2002 – 12/26/2002; 12/05/2003 – 1/22/2004;
3/12/2004 – 4/29/2004; 4/8/2005 – 5/26/2005;
9/7/2007 - 10/25/2007; 1/18/2013 – 3/7/2013;
3/8/2013 – 4/25/2013
8 Sterlite
Industries AR(0) 47 7 14.89%
10/1/2007 – 11/16/2007; 1/7/2008 – 2/22/2008;
2/25/2008 – 4/11/2008; 1/11/2010 – 2/26/2010;
11/1/2010 – 12/17/2010; 4/1/2013 – 5/17/2013;
7/8/2013 – 8/23/2013
Page | 20
Table 4.3: Descriptive statistics of Rolling H statistics
Number
of
Observations
Mean Median Maximum Minimum Standard
Deviation Skewness
Excess
Kurtosis
Jarque-
Berra
(JB)
Statistic
JB
Significance
Level
Dr. Reddy's
Laboratories
ADR 3048 0.4196 0.3642 0.9999 0.0000 0.3263 0.3026 -1.2777 253.8490 0.0000
Underlying Stock 3052 0.4211 0.3745 1.0000 0.0000 0.3103 0.3447 -1.1368 224.7910 0.0000
HDFC Bank ADR 3051 0.4362 0.3909 1.0000 0.0000 0.3197 0.2626 -1.2728 240.9995 0.0000
Underlying Stock 3045 0.4409 0.3872 1.0000 0.0000 0.3130 0.3221 -1.1660 225.1581 0.0000
ICICI Bank ADR 3039 0.3695 0.2892 1.0000 0.0002 0.2987 0.6405 -0.7699 282.8640 0.0000
Underlying Stock 3041 0.4258 0.3757 1.0000 0.0000 0.3179 0.3308 -1.2229 244.9611 0.0000
Infosys ADR 3046 0.3189 0.2337 1.0000 0.0000 0.2989 0.7961 -0.5343 358.0057 0.0000
Underlying Stock 3043 0.3939 0.3118 1.0000 0.0000 0.3221 0.4866 -1.1352 283.4989 0.0000
Sterlite
Industries
ADR 1616 0.3537 0.2748 1.0000 0.0000 0.2949 0.5740 -0.9114 144.6869 0.0000
Underlying Stock 1625 0.5097 0.5058 1.0000 0.0000 0.3320 0.0119 -1.3791 128.8048 0.0000
Wipro ADR 3050 0.3970 0.3399 1.0000 0.0000 0.3217 0.4072 -1.1957 265.9917 0.0000
Underlying Stock 3051 0.4073 0.3472 1.0000 0.0000 0.3216 0.3935 -1.1722 253.4025 0.0000
Tata Motors ADR 2326 0.3845 0.3283 1.0000 0.0001 0.3096 0.4951 -0.9998 191.8961 0.0000
Underlying Stock 2327 0.3982 0.3550 1.0000 0.0002 0.2937 0.3841 -1.0932 173.1003 0.0000
Rediff.com ADR 3039 0.4573 0.4116 1.0000 0.0001 0.3309 0.2584 -1.2837 242.4868 0.0000
Sify ADR 3036 0.3991 0.3585 0.9998 0.0000 0.3144 0.4376 -1.0676 241.0841 0.0000
WNS Holdings ADR 1858 0.4644 0.4255 1.0000 0.0000 0.3301 0.2275 -1.3029 147.4472 0.0000
Nifty 3039 0.4332 0.3708 1.0000 0.0000 0.3236 0.3886 -1.1767 251.7934 0.0000
S&P 500 3040 0.3733 0.2877 1.0000 0.0001 0.3080 0.5488 -0.9600 269.3132 0.0000
Page | 21
Table 4.4: Ranking of US Scrips using median of Rolling H Statistics
Rank US Scrips Median of H Statistics
1 Infosys ADR 0.2337
2 Sterlite Industries ADR 0.2748
3 S&P500 0.2877
4 ICICI Bank ADR 0.2892
5 Tata Motors ADR 0.3283
6 Wipro ADR 0.3399
7 Dr. Reddy's Laboratories ADR 0.3642
8 HDFC Bank ADR 0.3909
Table 4.5: Ranking of Indian Scrips using median of Rolling H Statistics
Table 4.6: Ranking of US Scrips using Percentage of significant H windows
Rank Indian Scrips Median of H
Statistics
1 Infosys 0.3118
2 Wipro 0.3472
3 Tata Motors 0.3550
4 Nifty 0.3708
5 Dr. Reddy's Laboratories 0.3745
6 ICICI Bank 0.3757
7 HDFC Bank 0.3872
8 Sterlite Industries 0.5058
Rank Scrips Total Number of
Rolling Windows
Total Number of
windows with significant
H statistics
Percentage of
significant H
windows
1 Sterlite Industries ADR 1616 53 3.28%
2 Infosys ADR 3046 117 3.84%
3 S&P 500 3040 173 5.69%
4 ICICI Bank ADR 3039 173 5.69%
5 Wipro ADR 3050 174 5.70%
6 Tata Motors ADR 2326 139 5.98%
7 Dr. Reddy's Laboratories ADR 3048 212 6.96%
8 HDFC Bank ADR 3051 230 7.54%
Page | 22
Table 4.7: Ranking of Indian Scrips using Percentage of significant H windows
Rank Scrips
Total Number of
Rolling
Windows
Total Number of
windows with
significant H statistics
Percentage of
significant H
windows
1 Tata Motors 2327 62 2.66%
2 Dr. Reddy's Laboratories 3052 185 6.06%
3 Infosys 3043 204 6.70%
4 Wipro 3051 213 6.98%
5 ICICI Bank 3041 214 7.04%
6 HDFC Bank 3045 224 7.36%
7 Nifty 3039 308 10.13%
8 Sterlite Industries 1625 224 13.78%
Table 4.8: Nonparametric tests for equality of median H Statistic amidst US scrips
Method Degrees of freedom Value Probability
Med. Chi-square 7 207.8615 0.0000
Adj. Med. Chi-square 7 206.5546 0.0000
Kruskal-Wallis 7 286.9682 0.0000
Kruskal-Wallis (tie-
adj.) 7 286.9685 0.0000
van der Waerden 7 294.2186 0.0000
Table 4.9: Nonparametric tests for equality of median H Statistic amidst Indian scrips
Method Degrees of freedom Value Probability
Med. Chi-square 7 101.6595 0.0000
Adj. Med. Chi-square 7 100.814 0.0000
Kruskal-Wallis 7 181.6864 0.0000
Kruskal-Wallis (tie-
adj.) 7 181.6864 0.0000
van der Waerden 7 213.2089 0.0000
Page | 23
Table 4.10: Nonparametric tests for equality of median H Statistic for all ADR -
Underlying stock pairs
Med. Chi-
square
Adj. Med.
Chi-square
Kruskal-
Wallis
Kruskal-
Wallis (tie-
adj.)
van der
Waerden
Degrees of
freedom 1 1 1 1 1
Dr. Reddy's
Laboratories ADR-
Stock Pair
Value 0.6715 0.6302 0.7354 0.7354 1.5148
Probability 0.4125 0.4273 0.3912 0.3911 0.2184
HDFC Bank ADR-
Stock Pair
Value 0.1476 0.1286 1.0774 1.0774 2.8413
Probability 0.7008 0.7199 0.2993 0.2993 0.0919
ICICI Bank ADR-
Stock Pair
Value 38.8480 38.5290 41.0958 41.0958 29.9593
Probability 0.0000 0.0000 0.0000 0.0000 0.0000
Infosys ADR-Stock
Pair
Value 33.9998 33.7015 97.2170 97.2170 116.0453
Probability 0.0000 0.0000 0.0000 0.0000 0.0000
Sterling Industries
ADR-Stock Pair
Value 115.1889 114.4361 184.4489 184.4490 193.6957
Probability 0.0000 0.0000 0.0000 0.0000 0.0000
Tata Motors ADR-
Stock Pair
Value 3.9168 3.8016 5.8192 5.8192 4.9296
Probability 0.0478 0.0512 0.0159 0.0159 0.0264
Wipro ADR-Stock
Pair
Value 0.4263 0.3935 2.4591 2.4591 5.4543
Probability 0.5138 0.5304 0.1168 0.1168 0.0195
Page | 24
Figure 2.1: Line plots of time series considered for this study

Page | 25
Figure 2.2: Line plots of time series considered for this study
Page | 26
Annexure #1: Rolling H Statistic for S&P 500, Nifty and Dr. Reddy’s Laboratories

Page | 27
Annexure #2: Rolling H Statistic for ICICI and Infosys

Page | 28
Annexure #3: Rolling H Statistic for Wipro and Tata Motors
Page | 29
Annexure #4: Rolling H Statistic for Sterlite Industries