indian hotel industry survey 2008-2009 hotel industry – by star ... the presentation and content...
TRANSCRIPT

Indian Hotel Industry Survey 2008-2009
Greening our footprints...

For more information, or additional copies of this document, please contact:
Secretary GeneralFederation of Hotel & Restaurant Association of India (FHRAI)
thB-82, 8 Floor, Himalaya House, 23 Kasturba Gandhi Marg,New Delhi - 110 001India
Tel: +91 (11) 4078 0780Fax: +91 (11) 4078 0777Email: Website:
Price: FHRAI Members: Rs. 400 (per additional copy)FHRAI Non-Members Rs. 600International US$ 50
© Federation of Hotels & Restaurant Association of India, 2009Reproduction of data from within publication is permitted provided that acknowledgementis accredited to the FHRAI and HVS Hospitality Services.
Table of Contents
Foreword from the President, FHRAI..................................................................................................................
HVS Hospitality Services.......................................................................................................................................
® ECOTEL .................................................................................................................................................................
Synopsis & Key Highlights of the Survey...........................................................................................................
Country Trend............................................................................................................................................
In The Focus................................................................................................................................................
City Trends..................................................................................................................................................
Towards Greener Footprints....................................................................................................................
1. Indian Hotel Industry – by Star Category.....................................................................................................
2. Indian Hotel Industry – Inventory and Chain Affiliation.........................................................................
3. Indian Hotel Industry – Seven Major Cities.................................................................................................
4. Indian Hotel Industry – Twelve Other Cities...............................................................................................
Hotel Analysis Worksheet......................................................................................................................................
1
2
4
5
7
8
12
18
22
31
39
50
61
In our efforts to reduce our carbon footprints, HVS has published this year's FHRAI report using ENOVA; a 30% Post Consumer Waste (PCW ) + 70% Programme for the Endorsement of Forest Certification (PEFC) certified recycled coated substrate paper. We shall, in the coming years, substitute this with 100% PCW paper.
Foreword
The Federation of Hotel & Restaurant Associations of India is pleased to present the twelfth annual edition of the Indian Hotel Industry Survey in cooperation with HVS Hospitality Services. This survey, covering the performance of hotels across different cities and different quality standards, provides an in-depth understanding of the Indian hospitality industry; becoming a benchmark reference standard. We would like to thank the participating hotels for all the detailed information they have provided and helped improve the quality of this research.
The Indian Hotel Industry Survey analyses the performance of the Indian hospitality industry across varying parameters such as facilities, manpower, operational performance and marketing trends. The information is based on data received from FHRAI hotel members and the authenticity of this data helps us in providing a clear picture of the operating statistics of India's hospitality sector. Data collated from our member hotels, our extensive historic database and the credibility of our research have helped make this report a preferred tool for hotel professionals, consultants, investors, bankers, researchers, government officials in the tourism department, media persons and all those interested in studying the Indian hotel industry.
The current edition includes an analysis of seven major cities for which we have received detailed information and twelve other cities where information was available with us for some hotels, though not in sufficient numbers for all the star categories. We earnestly request all our members to be more forthcoming with sharing the required information as this helps us all. Therefore, while we have basic data for 1,168 members (a decline from the 1,204 responses received last year), the financial data is not available for all of them.
We have, this year, put special focus on the urgent need to protect and preserve our environment. Being the standard bearers for our industry, it will be our endeavour to lead by example.
We encourage feedback on the presentation and content of this report to enable us to better it each year. We are thankful to HVS Hospitality Services for their continued support for this.
Rajindera Kumar
President, FHRAI
Page 1
About HVS
HVS Hospitality Services, a global hospitality consulting and services organization, is acknowledged as a specialist in its field. Founded in 1980 in the United States, by Steve Rushmore, the company has 30 offices across the globe and more than 18,000 assignments to its credit. HVS New Delhi was established in 1997 and has risen to be the only dedicated hospitality-consulting firm in this region. It currently offers its consulting and valuation services to clients with interests in the South Asian Region covering India, Pakistan, Sri Lanka, Bangladesh and Nepal. The New Delhi office offers the following services.
CONSULTING AND VALUATION
The team comprises of experienced and qualified hotel professionals undertaking feasibility studies, development strategies, valuations, market area analyses, market entry strategies, investment services, operator search and management contract negotiations. Our database of hotel information, combined with broad insight and extensive experience, enables HVS to produce well-documented studies that contain fully supported value conclusions. Each report is customized to meet client requirements based on mutually agreed upon parameters. The HVS approach on hotel and real estate appraisal is widely used by hotel management companies, financial institutions, equity investors and developers of hotels in making investment decisions in the South Asian hospitality industry.
EXECUTIVE SEARCH
Executive Search, another vertical to the base of services offered, entered the Indian market in 2001 and manages diverse portfolios across varied sectors. HVS Executive Search has offices in New Delhi and Mumbai and is among South Asia's first retained Executive Search practices catering to the services sector. While hospitality continues to be an important area of focus, this division has carried out senior level searches in the real estate, financial services, retail and healthcare sectors.
MARKETING AND COMMUNICATIONS
Marketing Communications Services provides a specialized platform for its clients creating executable marketing and communication road maps for improved business performance. Our services include Pre-Opening, Opening and Tactical Marketing Campaign, Conceptualization, Strategic Advertising, Development and Implementation of Brand Architecture and Strategies, Creation and Management of CRM Strategies, F&B Marketing and Corporate Communications.
Page 2

WEB STRATEGIES
HVS Web Strategies provides affordable, accessible, and streamlined Internet and Web services to hotel and resort owners, operators, developers and investors who recognize the key role technology can play in improving their operational and financial performance. It specializes in conceptualizing, developing and deploying the next generation of online/web solutions, such as, Website designing and development, Online Marketing and Branding (including SEO), Graphics and Multimedia services to name a few.
ASSET MANAGEMENT & STRATEGIC ADVISORY SERVICES
The HVS Asset Management & Strategic Advisory Services aims to provide a unique value proposition for its clients through services aimed to assist hotel owners and investors to achieve optimal performance from their hospitality investments. Through expert, independent market assessments and unbiased reviews of various processes affecting the operational efficiency of hotel assets, our analysis and recommendations will be custom-designed to meet the specific needs of each individual client and asset that we manage.
The HVS Asset Management & Strategic Advisory vertical offers services like Strategic Advisory Services and Owner Representation, Pre-Opening Capital Plan and Budgeting, Revenue-Cost Optimization and Profitability Analysis, Sales, Marketing and Revenue Management, Operational Advisory and Audit Services.
OUR CONFERENCES
A confluence of hotel industry stakeholders, visions and ideas, industry news and networking, HICSA has successfully created an interactive platform in the South Asian region. For enquiries regarding the sixth annual c o n f e r e n c e , H I C S A 2 0 1 0 p l e a s e v i s i t
or email to www.hicsaconference.com [email protected]
HICSA 20107 - 8 APRIL 2010, MUMBAI, INDIA
www.hicsaconference.com
6TH HOTEL INVESTMENT CONFERENCE - SOUTH ASIA
The Hotel Operations Summit India would exclusively focus on and be purely dedicated to hotel operations, introducing hospitality leaders and decision makers to the trend setting practices, products and services. For more information please visit or email to [email protected]
The Indian Hotel Industry Survey 2008-2009 brings together the industry's key statistics and serves as an easy reference volume. We are grateful to all those who have contributed towards the same and look forward to increased participation in the years to come.
Page 3
Manav ThadaniManaging Director
Shamsher Singh MannSenior Associate
Panchali Mahendra SinghConsulting & ValuationAssociate
Sally D’SouzaResearch Analyst
Gaurav SharmaAssociate - CreativeDesign
®Ecotel Property Audit
Roadmap forgetting certified
Audit forcertification
Ecotel certification
Environment Commitment
Employee Education
and Community
Involvement
Waste Management
Energy Management
Water Management
Management
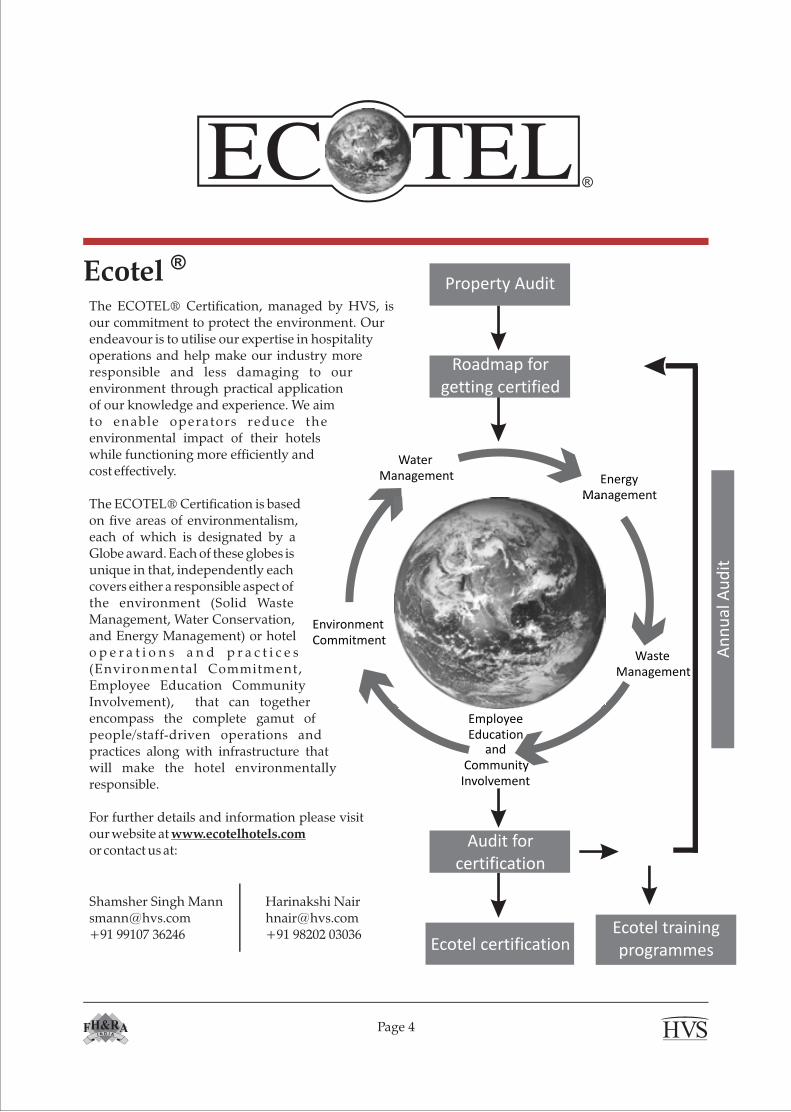
The ECOTEL® Certification, managed by HVS, is our commitment to protect the environment. Our endeavour is to utilise our expertise in hospitality operations and help make our industry more responsible and less damaging to our environment through practical application of our knowledge and experience. We aim to enable operators reduce the environmental impact of their hotels while functioning more efficiently and cost effectively.
The ECOTEL® Certification is based on five areas of environmentalism, each of which is designated by a Globe award. Each of these globes is unique in that, independently each covers either a responsible aspect of the environment (Solid Waste Management, Water Conservation, and Energy Management) or hotel o p e r a t i o n s a n d p r a c t i c e s (Environmental Commitment, Employee Education Community Involvement), that can together encompass the complete gamut of people/staff-driven operations and practices along with infrastructure that will make the hotel environmentally responsible.
For further details and information please visit our website at www.ecotelhotels.com or contact us at:
Shamsher Singh [email protected]+91 99107 36246
Harinakshi [email protected]+91 98202 03036
Page 4
An
nu
al A
ud
it
Ecotel training programmes
Synopsis and Key Highlights of the Survey
Introduction
The Indian hospitality industry has emerged as one of the key industries driving the growth of the services sector and, thereby, the Indian economy. The FHRAI Indian Hotel Survey 2009 Report aims to provide the most comprehensive guide to all India performance trends for this industry. Results of the Survey will empower industry stakeholders such as owners, investors, operators, business analysts and researchers with information on the operational aspects of the industry. It will help operators benchmark their performance and identify investment opportunities.
Data Collection
The data for the FHRAI Indian Hotel Survey 2009 Report has been contributed by the member hotels of FHRAI. The FHRAI sends out a questionnaire to each of its members (currently numbering 2,272 member hotels) which is then analysed and presented in this report. The data presented in the current edition is culled from 1,168 responses.
Methodology
Data from participating hotels is sorted and filtered into a comprehensible structure, from which is extracted the performance of the Indian hospitality sector across crucial parameters. These parameters, like guest segmentation, hotel finances, marketing, seasonality and sources of reservations among others, are then presented under the following categories:
Star: Five-Star Deluxe, Five, Four, Three, Two, One-Star and Heritage hotels alongwith Other hotels, which are not classified under any star ratings.
Inventory: Number of rooms in hotels categorised under - Less than 50 Rooms/ 50-150 Rooms/ More Than 150 Rooms.
Affiliation: Affiliated to chain/ independent
Primary Markets: Seven major citiesBangalore Chennai Goa Kolkata MumbaiNew Delhi – NCR Pune
Secondary Markets: Twelve secondary citiesAhmedabad Chandigarh Coimbatore Hyderabad IndoreJaipur Kochi Ootacamund Shimla ThiruvananthapuramVadodara Visakhapatnam
Page 5

While it is our endeavour to represent all the cities of India, we are limited by the data received from the participating hotels. In order to make the study relevant, we present data for only those categories for which we have a minimum of four participating hotels.
Hotels across different categories showing similar characteristics have been combined under the same category.
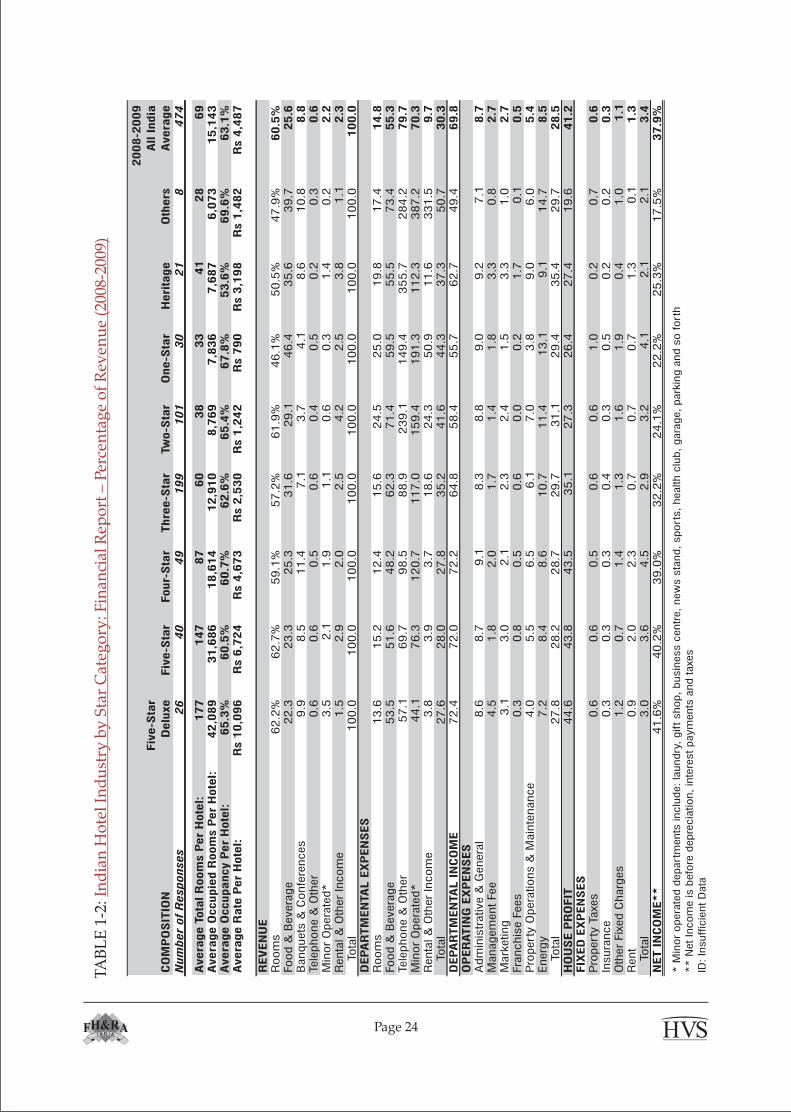
To facilitate better evaluation of data across comparable groups, the financial statements are presented upto Net Income, before any deduction of depreciation and interest, which are hotel/owner specific.
Qualifying Conditions
In some cases, there are large fluctuations in the data and this noise in the data may be attributed to the changing participation in the survey and not an accurate representation of market performance.
Limiting Condition
Percentage of Revenue: is an assessment of costs as a percentage of revenue. Departmental expenses are portions of individual revenue heads while Operating and Fixed Expenses are deducted from Gross Hotel Revenue following the international accounting guidelines.
Amount per Available Room (PAR): is the financial performance of a single room and is based on the total inventory.
Amount per Occupied Room (POR): is the performance of a single occupied room.
All amounts presented in this report have been rounded to the nearest whole number and are in Indian rupees (Rs) for the fiscal year 2008/09 (April-March). In the financial statements, rupee amounts are shown as amounts per available room (PAR) and per occupied room (POR) in order to eliminate differences in the size of hotels surveyed.
Presentation of Financial Data
Page 6
Overall Performance: Reflecting the global trend of an economic slowdown, the Indian hospitality market witnessed a sharp decline in the overall occupancies. This was further affected by the unfortunate terror attacks in Mumbai. Average rates did not follow this trend immediately as they generally lag behind; hence, we observe them to be on par with that of the previous year's except in the case of tourist destinations where a decline in average rates is much more visible. Average occupancy across India fell by approximately 6.3% with some cities witnessing a decline of upto 20%. It is observed that while hotels have been able to reign in the departmental expenses, the overall bottom lines have declined by approximately 21% over last year. This can primarily be attributed to an increase in the PAR expenses of energy and POMEC and the overall reduction in top lines.
Marketing Media: The advent of new marketing media such as viral marketing (advertising through social networks), Consumer General Media (CGM)/ User Generated Content (end consumers rate and give their opinions on the services/products), Pay Per Click and others have changed the way consumers view marketing, forcing advertisers and product/service companies to change their approach towards marketing. We see an increased usage of non-traditional media by the hotel industry with the five-star deluxe, five-star and heritage hotels taking the lead. Travellers are researching the internet and forming their opinions and choices based on the information provided by unaffiliated platforms where their peers comment on the hotels. Blogs, networking sites, travel sites and suchlike are therefore being used by the travellers for making their choices. It is our opinion that such media shall increasingly become the preferred mode of advertising in the coming future and hotels should ensure they are marketed well online.
Bars and License: The lower category (three, two and one-star) hotels have comparatively lesser number of bars operating in their hotels (on an average 0.7 per hotel) as compared to the ones in the higher categories (on an average 1.2 for five-star deluxe, five and four-star hotels). This, however, is not reflective of the demand in the market for bars around the country. Further, we are aware of liquor sales traditionally having much higher margins than food and therefore being a very lucrative business option for hotels. The dearth of bars in the lower category hotels may be attributed to the exorbitant procurement and annual license fee required for operating bars across most states in the country. It would be in the interest of both the hotel owners and state governments to reduce the barriers to entry and see an enhanced revenue growth.
Domestic Traveller: The domestic traveller has long been ignored by hotels in India. Their propensity to spend has generally been much lower than other categories and they tend to bargain heavily in order to maximise their value for money. This said, while the underlying fabric of their requirements remains the same, their perception of value for money is undergoing a tectonic shift. Also undergoing a paradigm change is the demographics of the country with a rise in the educated, middle class with disposable incomes which is in turn driving domestic tourism. Domestic travellers have helped the hospitality industry recover from the downturn in the late 1990s and in the current survey, too, hotels in resort destinations were observed to tide over the turbulent past year by substituting the high paying foreign guests albeit at lower price points.
Key Trends
In the section, 'Country Trends', broad industry characteristics are highlighted first along with historic marketwide trends. 'In the Focus' discusses some key trends and characteristics and this is followed by some emerging trends from hotels across the country presented under 'City Trends', analysing hotels in 19 cities. The City Trends reflect HVS' market perception for each city, as well as our expectations with regard to its performance in the current year (2009/10).
Country Trends
Page 7
Telephone Department: The telephone department has, over the years, become more of a cost centre than a revenue generator. Most hotels tend to provide this facility in order to take room reservations or transfer calls to other departments. While earlier, room guests used to utilise this facility for their personal consumption, the advent and increased usage of mobile telephony has obviated the need for this technology. Newer hotels, especially in the budget and mid market category, are now setting up countrywide call centres that are connected to the individual properties using Voice over Internet Protocol (VoIP). This system requires an initial investment in the setting up of a call centre and annual maintenance charges that are nominal. As the calls between the call centre and the individual properties utilise VoIP, these calls are free, unlike the regular phone charges. Individual/stand alone hotels might find this expense too high but they should consider outsourcing these services to IT companies which can provide this facility at lower costs by aggregating demand across a higher number of hotels.
Employees to Hotel Room Ratio: Indian hotels continue to be inefficient in their manpower utilisation. The All India average of total employee ratio to hotel rooms stands at 1.6, much higher than what is observed in hotels across the globe. In fact not much has changed from our first survey back in 1988-99 when this ratio was 1.4. More interestingly, we see that while this average is 1.7 for hotels in the five-star category, it is 1.9 and 1.6 for those in the four and three-star categories, respectively. This may be directly attributed to the fact that hotel owners in India generally trend to 'overspec' their hotels. A hotel in the mid-market category would be built to much higher standards than that required and this tendency flows through to the manpower requirements as well. In order to compete with the branded international hotels entering all segments of the Indian hospitality sector, it becomes imperative for all hotels to reconsider their staffing levels and become more efficient.
Visa-on-Arrival: The Government of India has decided to offer visa-on-arrival to selected countries including Japan, New Zealand, Luxembourg, Singapore and Finland, which the government was reluctant to offer before due to security reasons. The nationals of the same countries will be allowed to enter India and attain visa-on-arrival. This decision has ostensibly been taken in order to promote Indian tourism and increase the inflow of international tourists, which will directly and positively affect the Indian hospitality industry. However, the importance of the decision apart from promoting tourism was also to improve inter-country relationships on a long-term basis. India, in future, will open its policy only to those countries that are ready to reciprocate. Such a decision, will allow tourists and guests to visit the country in an easier way.
In the Focus
The coming years are expected to see a large quantum of new hotel supply entering the Indian market. A substantial proportion of these hotels are expected to be branded and of international quality in product and service offerings. Indian hotel operators would need to prepare themselves for this coming competition by improving their operational efficiencies and also their products and service offerings. Highlighted below are a few important emerging trends:
Exhibit 1 highlights the sources of revenue for the hotel. Contribution from rooms has gradually risen over the past few years; this year, though, saw a 1% displacement between rooms and F&B as compared to last year. The overall decline in revenues, as highlighted later in Exhibit 2, have been similar in rooms and F&B (14%and 12%respectively) showing the correlation between hotel room occupancies and F&B revenues.
Page 8
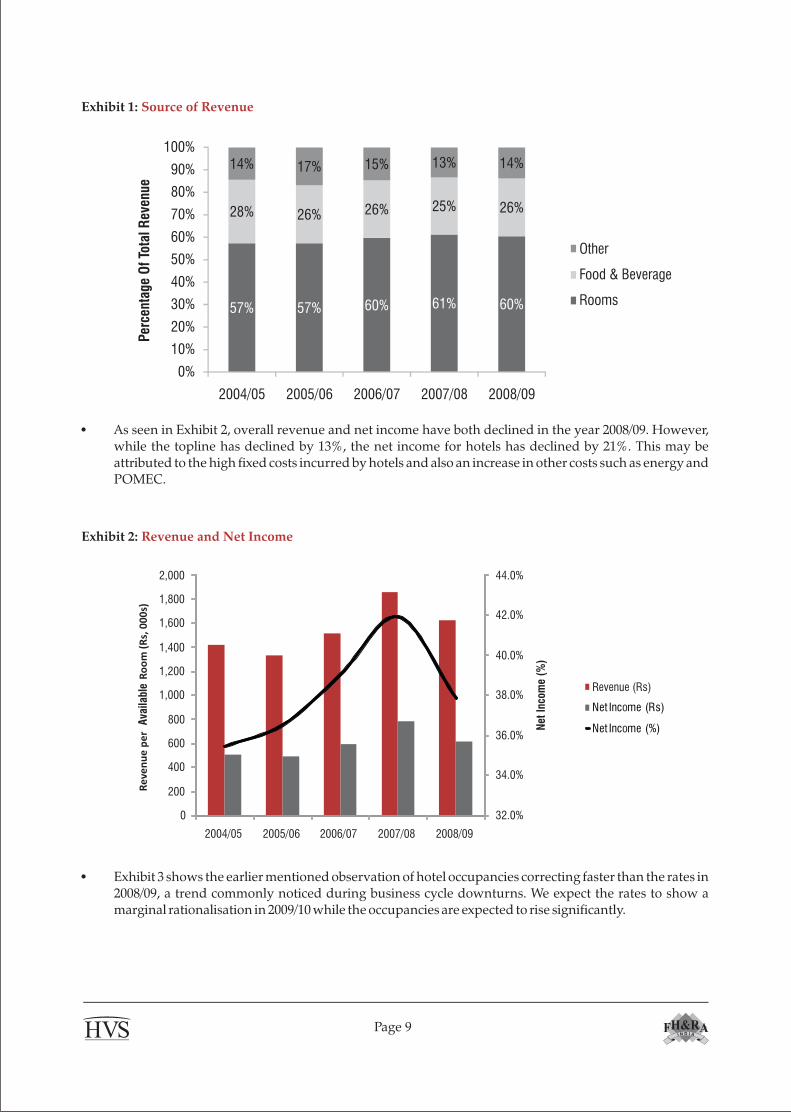
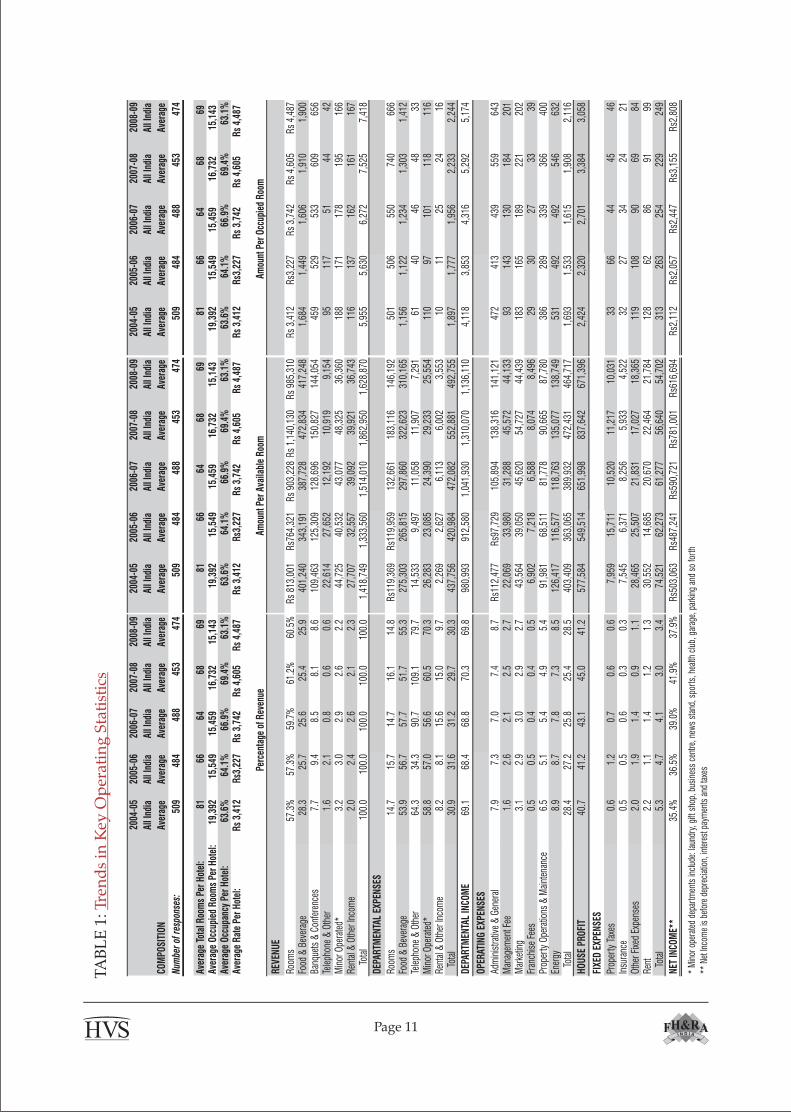
Exhibit 3 shows the earlier mentioned observation of hotel occupancies correcting faster than the rates in 2008/09, a trend commonly noticed during business cycle downturns. We expect the rates to show a marginal rationalisation in 2009/10 while the occupancies are expected to rise significantly.
57% 57% 60% 61% 60%
28% 26% 26% 25% 26%
14% 17% 15% 13% 14%
0%
10%
20%
30%
40%
50%
60%
70%
80%
90%
100%
2004/05 2005/06 2006/07 2007/08 2008/09
Per
cent
age
Of
Tota
l Rev
enue
Other
Food & Beverage
Rooms
Exhibit 1: Source of Revenue
As seen in Exhibit 2, overall revenue and net income have both declined in the year 2008/09. However, while the topline has declined by 13%, the net income for hotels has declined by 21%. This may be attributed to the high fixed costs incurred by hotels and also an increase in other costs such as energy and POMEC.
32.0%
34.0%
36.0%
38.0%
40.0%
42.0%
44.0%
0
200
400
600
800
1,000
1,200
1,400
1,600
1,800
2,000
2004/05 2005/06 2006/07 2007/08 2008/09
Net
Inc
ome
(%)
Re
ven
ue
pe
r A
vaila
ble
Ro
om
(R
s, 0
00
s)
Revenue (Rs)
Exhibit 2: Revenue and Net Income
Page 9
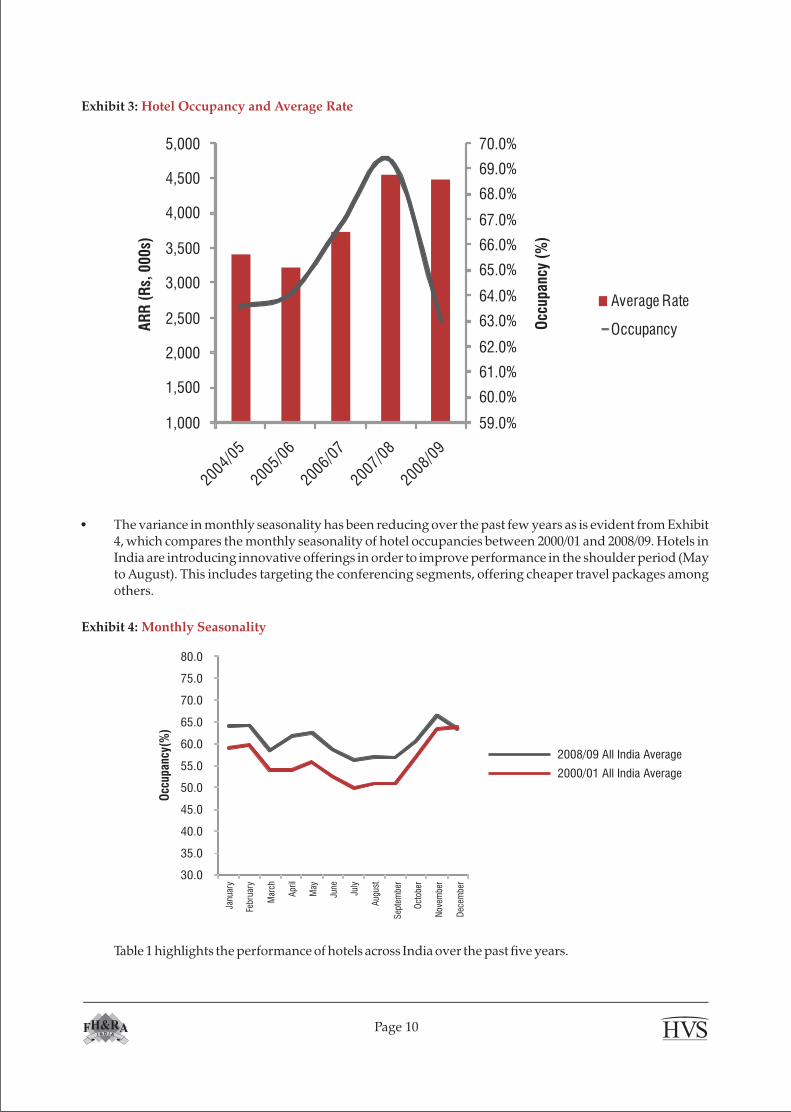
Exhibit 3: Hotel Occupancy and Average Rate
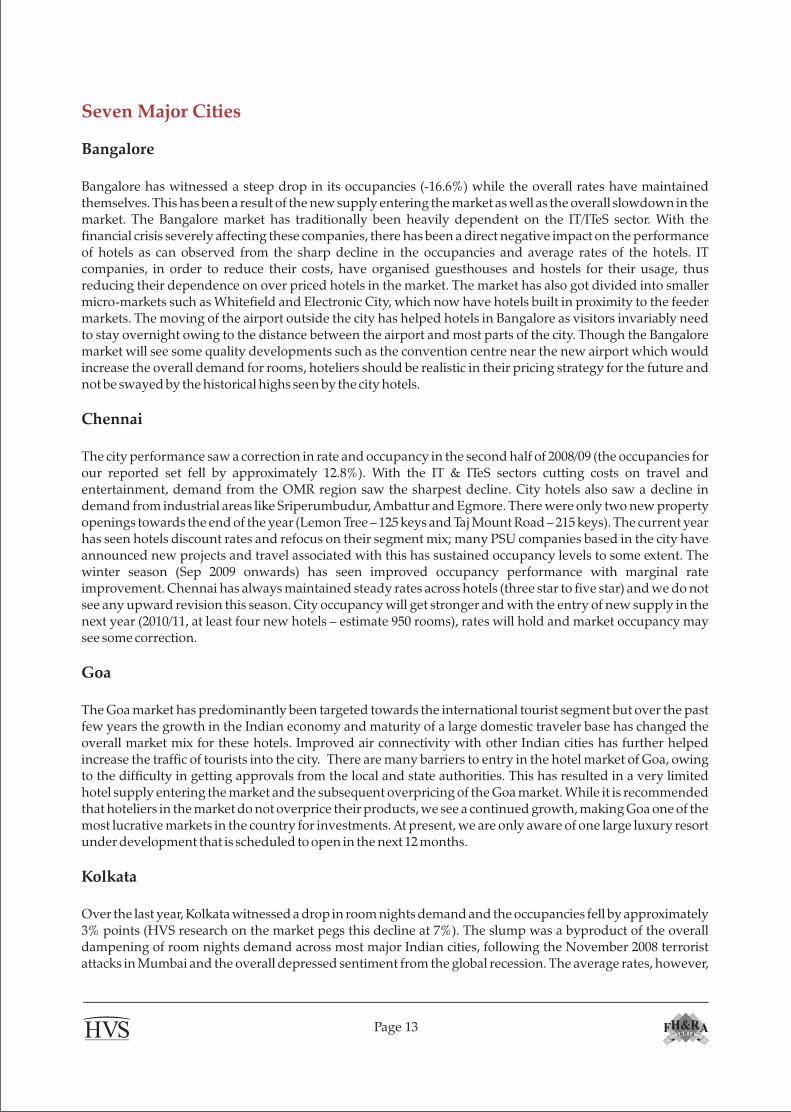
The variance in monthly seasonality has been reducing over the past few years as is evident from Exhibit 4, which compares the monthly seasonality of hotel occupancies between 2000/01 and 2008/09. Hotels in India are introducing innovative offerings in order to improve performance in the shoulder period (May to August). This includes targeting the conferencing segments, offering cheaper travel packages among others.
Exhibit 4: Monthly Seasonality
30.0
35.0
40.0
45.0
50.0
55.0
60.0
65.0
70.0
75.0
80.0
Occ
upan
cy(%
)
Janu
ary
Febr
uary
Mar
ch
Apr
il
May
June
July
Aug
ust
Sep
tem
ber
Oct
ober
Nov
embe
r
Dec
embe
r
2008/09 All India Average
2000/01 All India Average
Table 1 highlights the performance of hotels across India over the past five years.
Page 10
59.0%
60.0%
61.0%
62.0%
63.0%
64.0%
65.0%
66.0%
67.0%
68.0%
69.0%
70.0%
1,000
1,500
2,000
2,500
3,000
3,500
4,000
4,500
5,000
Occ
upan
cy (
%)
AR
R (
Rs,
00
0s)
COM
POSI
TIO
N
2004
-05
All I
ndia
Aver
age
2005
-06
All I
ndia
Aver
age
2006
-07
All I
ndia
Aver
age
2007
-08
All I
ndia
Aver
age
2008
-09
All I
ndia
Aver
age
2004
-05
All I
ndia
Aver
age
2005
-06
All I
ndia
Aver
age
2006
-07
All I
ndia
Aver
age
2007
-08
All I
ndia
Aver
age
2008
-09
All I
ndia
Aver
age
2004
-05
All I
ndia
Aver
age
2005
-06
All I
ndia
Aver
age
2006
-07
All I
ndia
Aver
age
2007
-08
All I
ndia
Aver
age
2008
-09
All I
ndia
Aver
age
Num
ber
of r
espo
nses
:50
948
448
845
347
450
948
448
845
347
450
948
448
845
347
4
Aver
age
Tota
l Roo
ms
Per
Hot
el:
8166
6468
6981
6664
6869
8166
6468
69Av
erag
e O
ccup
ied
Roo
ms
Per
Hot
el:
19,3
9215
,549
15,4
5916
,732
15,1
4319
,392
15,5
4915
,459
16,7
3215
,143
19,3
9215
,549
15,4
5916
,732
15,1
43Av
erag
e O
ccup
ancy
Per
Hot
el:
63.6
%64
.1%
66.9
%69
.4%
63.1
%63
.6%
64.1
%66
.9%
69.4
%63
.1%
63.6
%64
.1%
66.9
%69
.4%
63.1
%Av
erag
e R
ate
Per
Hot
el:
Rs
3,41
2R
s3,2
27R
s 3,
742
Rs
4,60
5R
s 4,
487
Rs
3,41
2R
s3,2
27R
s 3,
742
Rs
4,60
5R
s 4,
487
Rs
3,41
2R
s3,2
27R
s 3,
742
Rs
4,60
5R
s 4,
487
REV
ENU
E
Room
s57
.3%
57.3
%59
.7%
61.2
%60
.5%
Rs
813,
001
Rs7
64,3
21R
s 90
3,22
8R
s 1,
140,
130
Rs
985,
310
Rs
3,41
2R
s3,2
27R
s 3,
742
Rs
4,60
5R
s 4,
487
Food
& B
ever
age
28.3
25.7
25.6
25.4
25.9
401,
240
343,
191
387,
728
472,
834
417,
248
1,68
41,
449
1,60
61,
910
1,90
0Ba
nque
ts &
Con
fere
nces
7.7
9.4
8.5
8.1
8.6
109,
463
125,
309
128,
696
150,
827
144,
054
459
529
533
609
656
Tele
phon
e &
Oth
er1.
62.
10.
80.
60.
622
,614
27,6
5212
,192
10,9
199,
154
9511
751
4442
Min
or O
pera
ted*
3.2
3.0
2.9
2.6
2.2
44,7
2540
,532
43,0
7748
,325
36,3
6018
817
117
819
516
6Re
ntal
& O
ther
Inco
me
2.0
2.4
2.6
2.1
2.3
27,7
0732
,557
39,0
9239
,921
36,7
4311
613
716
216
116
7
Tot
al10
0.0
100.
010
0.0
100.
010
0.0
1,41
8,74
91,
333,
560
1,51
4,01
01,
862,
950
1,62
8,87
05,
955
5,63
06,
272
7,52
57,
418
DEP
ARTM
ENTA
L EX
PEN
SES
Room
s14
.715
.714
.716
.114
.8R
s119
,369
Rs1
19,9
5913
2,66
118
3,11
614
6,19
250
150
655
074
066
6Fo
od &
Bev
erag
e53
.956
.757
.751
.755
.327
5,30
326
5,81
529
7,86
032
2,62
331
0,16
51,
156
1,12
21,
234
1,30
31,
412
Tele
phon
e &
Oth
er64
.334
.390
.710
9.1
79.7
14,5
339,
497
11,0
5811
,907
7,29
161
4046
4833
Min
or O
pera
ted*
58.8
57.0
56.6
60.5
70.3
26,2
8323
,085
24,3
9029
,233
25,5
5411
097
101
118
116
Rent
al &
Oth
er In
com
e8.
28.
115
.615
.09.
72,
269
2,62
76,
113
6,00
23,
553
1011
2524
16
Tota
l30
.931
.631
.229
.730
.343
7,75
642
0,98
447
2,08
255
2,88
149
2,75
51,
897
1,77
71,
956
2,23
32,
244
DEP
ARTM
ENTA
L IN
COM
E69
.168
.468
.870
.369
.898
0,99
391
2,58
01,
041,
930
1,31
0,07
01,
136,
110
4,11
83,
853
4,31
65,
292
5,17
4
OPE
RAT
ING
EXP
ENSE
S
Adm
inis
trativ
e &
Gen
eral
7.9
7.3
7.0
7.4
8.7
Rs1
12,4
77R
s97,
729
105,
894
138,
316
141,
121
472
413
439
559
643
Man
agem
ent F
ee1.
62.
62.
12.
52.
722
,069
33,9
8031
,288
45,5
7244
,133
9314
313
018
420
1M
arke
ting
3.1
2.9
3.0
2.9
2.7
43,5
6439
,050
45,6
2054
,727
44,4
3918
316
518
922
120
2Fr
anch
ise
Fees
0.5
0.5
0.4
0.4
0.5
6,90
27,
218
6,58
88,
074
8,49
629
3027
3339
Prop
erty
Ope
ratio
ns &
Mai
nten
ance
6.5
5.1
5.4
4.9
5.4
91,9
8168
,511
81,7
7890
,665
87,7
8038
628
933
936
640
0En
ergy
8.9
8.7
7.8
7.3
8.5
126,
417
116,
577
118,
763
135,
077
138,
749
531
492
492
546
632
To
tal
28.4
27.2
25.8
25.4
28.5
403,
409
363,
065
389,
932
472,
431
464,
717
1,69
31,
533
1,61
51,
908
2,11
6
HO
USE
PR
OFI
T40
.741
.243
.145
.041
.257
7,58
454
9,51
465
1,99
883
7,64
267
1,39
62,
424
2,32
02,
701
3,38
43,
058
FIXE
D E
XPEN
SES
Prop
erty
Tax
es0.
61.
20.
70.
60.
67,
959
15,7
1110
,520
11,2
1710
,031
3366
4445
46In
sura
nce
0.5
0.5
0.6
0.3
0.3
7,54
56,
371
8,25
65,
933
4,52
232
2734
2421
Oth
er F
ixed
Exp
ense
s2.
01.
91.
40.
91.
128
,465
25,5
0721
,831
17,0
2718
,365
119
108
9069
84Re
nt2.
21.
11.
41.
21.
330
,552
14,6
8520
,670
22,4
6421
,784
128
6286
9199
To
tal
5.3
4.7
4.1
3.0
3.4
74,5
2162
,273
61,2
7756
,640
54,7
0231
326
325
422
924
9
NET
INCO
ME*
*35
.4%
36.5
%39
.0%
41.9
%37
.9%
Rs5
03,0
63R
s487
,241
Rs5
90,7
21R
s781
,001
Rs6
16,6
94R
s2,1
12R
s2,0
57R
s2,4
47R
s3,1
55R
s2,8
08
* M
inor
ope
rate
d de
part
men
ts in
clud
e: la
undr
y, g
ift s
hop,
bus
ines
s ce
ntre
, new
s st
and,
spo
rts,
hea
lth c
lub,
gar
age,
par
king
and
so
fort
h
** N
et In
com
e is
bef
ore
depr
ecia
tion,
inte
rest
pay
men
ts a
nd ta
xesPe
rcen
tage
of R
even
ueAm
ount
Per
Ava
ilabl
e R
oom
Amou
nt P
er O
ccup
ied
Roo
m
TA
BL
E 1
: Tr
end
s in
Key
Op
erat
ing
Sta
tist
ics
Page 11

City Trends
The Indian hospitality industry, over the last three years, has been witnessing a remarkable phase in performance and has continued the same in the former part of the year 2008/09. One of the key reasons for the increase in demand for hotel rooms in the country was the boom in the overall economy and substantial growth in sectors like information technology, telecom, banking and finance, insurance, construction, retail and real estate. However, the global economic downturn and the Mumbai attacks adversely affected the performance of the industry in the latter part of the year. This has been, to a large degree, mitigated by a steep increase in domestic travel and we expect this to be one of the major drivers of growth in the short to medium term. With the economy of the country improving and a simultaneous effort by the government to upgrade and improve the existing road, airport and other infrastructure, we can expect India to recover faster than most countries across the globe. We also expect India to become one of the most favoured investment destinations in the world and all these bode very well for our industry.
It should be noted that the country average is not representative of the trends seen in certain key hotel markets in India as it includes the results of lower star category hotels across several cities, which comparatively, have a more restrained operating environment. Table 2 illustrates average occupancy and rate for 30 cities/regions on an all-India basis over the last five years, which is followed by HVS' viewpoint on the demand-supply scenario and performance of the 19 identified hotel markets based on in-house research.
TABLE 1-1: Indian Hotel Industry by Star Category: Facilities Analysis and Staffing
Page 12
City 2004-2005 2005-2006 2006-2007 2007-2008 2008-2009 2004-2005 2005-2006 2006-2007 2007-2008 2008-2009
All India 63.6% 64.1% 66.8% 69.3% 63.1% Rs3,413 Rs3,227 Rs3,741 Rs4,556 Rs4,487
Agra 62.7% 60.7% 58.9% 62.8% 54.8% 1,895 2,389 2,361 Rs3,307 4,211
Ahmedabad 52.6% 68.9% 69.6% 74.9% 63.7% 1,825 2,572 2,108 4,138 4,039
Aurangabad 61.1% 43.2% 52.9% ID 56.5% 1,784 1,837 2,160 ID 2,289
Bangalore 79.8% 71.7% 67.9% 73.1% 56.5% 6,762 6,534 8,519 9,679 9,757
Bhopal 71.2% 65.8% 74.7% 70.3% 72.2% 1,785 1,604 2,028 2,647 2,639
Chennai 73.3% 78.0% 78.7% 77.4% 64.6% 2,384 3,080 3,340 3,076 4,678
Coimbatore 67.5% 79.7% 72.9% 77.8% 72.1% 1,401 2,311 2,322 2,634 3,255
Darjeeling 66.3% 50.1% 56.3% 57.8% ID 1,570 1,912 2,090 1,719 ID
Goa 60.1% 66.7% 71.3% 70.1% 61.7% 2,704 3,994 4,515 4,368 5,378
Hyderabad 75.2% 80.2% 71.6% 63.7% 56.3% 2,729 4,305 4,660 5,643 4,730
Indore 60.0% 64.9% 69.8% 72.9% 68.7% 661 773 992 1,486 1,933
Jaipur 71.5% 60.2% 69.2% 63.0% 61.4% 1,791 2,220 2,743 5,460 4,472
Jodhpur 56.2% 45.1% 50.7% 53.6% 51.0% 3,346 1,679 4,066 5,468 3,964
Kochi 64.8% 65.9% 75.4% 75.2% 67.4% 1,062 1,247 1,237 1,486 2,062
Kolkata 67.1% 65.0% 75.6% 72.5% 69.6% 2,210 2,668 3,567 5,138 5,342
Kullu-Manali 47.0% 48.0% 46.9% 48.1% 50.9% 2,668 1,585 2,334 1,688 3,716
Lucknow 66.7% 75.0% 70.8% 71.6% 63.0% 1,867 2,060 1,988 2,208 2,491
Mount Abu 47.1% 52.7% 56.6% 57.0% 69.4% 1,255 1,338 1,558 1,825 1,823
Mumbai 74.9% 75.8% 79.2% 80.1% 71.2% 4,307 4,615 4,996 6,665 6,822
Mussoorie 61.0% 55.0% 50.9% ID 48.0% 2,997 656 1,454 ID 4,099
Mysore ID 60.9% 46.4% 66.3% 67.7% ID 1,249 3,300 1,254 2,340
Nagpur 46.1% 71.0% 69.4% ID ID 931 1,307 1,144 ID ID
New Delhi - NCR 76.6% 74.8% 82.2% 78.0% 64.8% 5,498 6,699 7,459 9,728 6,087
Ootacamund 44.4% 50.3% 48.5% 58.3% 58.1% 1,861 1,690 1,527 1,258 1,956
Pune 77.2% 77.3% 80.7% 76.5% 65.5% 1,295 2,621 3,232 4,927 4,951
Shimla 53.8% 45.2% 52.2% 64.6% 52.7% 1,679 813 1,554 1,033 1,766
Thiruvananthapuram 47.5% 57.6% 62.4% 65.1% 57.9% 1,805 1,665 3,959 2,221 1,570
Udaipur 54.5% 55.3% 57.8% 58.2% 51.6% 3,800 3,580 3,700 6,320 7,319
Vadodara 62.6% 70.0% 71.9% ID 77.9% 467 2,085 1,730 ID 2,779
Visakhapatnam 80.6% 77.2% 71.4% 75.9% 69.0% 1,531 1,686 2,495 3,169 3,687
Occupancy Average Room Rate
Seven Major Cities
Bangalore
Bangalore has witnessed a steep drop in its occupancies (-16.6%) while the overall rates have maintained themselves. This has been a result of the new supply entering the market as well as the overall slowdown in the market. The Bangalore market has traditionally been heavily dependent on the IT/ITeS sector. With the financial crisis severely affecting these companies, there has been a direct negative impact on the performance of hotels as can observed from the sharp decline in the occupancies and average rates of the hotels. IT companies, in order to reduce their costs, have organised guesthouses and hostels for their usage, thus reducing their dependence on over priced hotels in the market. The market has also got divided into smaller micro-markets such as Whitefield and Electronic City, which now have hotels built in proximity to the feeder markets. The moving of the airport outside the city has helped hotels in Bangalore as visitors invariably need to stay overnight owing to the distance between the airport and most parts of the city. Though the Bangalore market will see some quality developments such as the convention centre near the new airport which would increase the overall demand for rooms, hoteliers should be realistic in their pricing strategy for the future and not be swayed by the historical highs seen by the city hotels.
Chennai
The city performance saw a correction in rate and occupancy in the second half of 2008/09 (the occupancies for our reported set fell by approximately 12.8%). With the IT & ITeS sectors cutting costs on travel and entertainment, demand from the OMR region saw the sharpest decline. City hotels also saw a decline in demand from industrial areas like Sriperumbudur, Ambattur and Egmore. There were only two new property openings towards the end of the year (Lemon Tree – 125 keys and Taj Mount Road – 215 keys). The current year has seen hotels discount rates and refocus on their segment mix; many PSU companies based in the city have announced new projects and travel associated with this has sustained occupancy levels to some extent. The winter season (Sep 2009 onwards) has seen improved occupancy performance with marginal rate improvement. Chennai has always maintained steady rates across hotels (three star to five star) and we do not see any upward revision this season. City occupancy will get stronger and with the entry of new supply in the next year (2010/11, at least four new hotels – estimate 950 rooms), rates will hold and market occupancy may see some correction.
Goa
The Goa market has predominantly been targeted towards the international tourist segment but over the past few years the growth in the Indian economy and maturity of a large domestic traveler base has changed the overall market mix for these hotels. Improved air connectivity with other Indian cities has further helped increase the traffic of tourists into the city. There are many barriers to entry in the hotel market of Goa, owing to the difficulty in getting approvals from the local and state authorities. This has resulted in a very limited hotel supply entering the market and the subsequent overpricing of the Goa market. While it is recommended that hoteliers in the market do not overprice their products, we see a continued growth, making Goa one of the most lucrative markets in the country for investments. At present, we are only aware of one large luxury resort under development that is scheduled to open in the next 12 months.
Kolkata
Over the last year, Kolkata witnessed a drop in room nights demand and the occupancies fell by approximately 3% points (HVS research on the market pegs this decline at 7%). The slump was a byproduct of the overall dampening of room nights demand across most major Indian cities, following the November 2008 terrorist attacks in Mumbai and the overall depressed sentiment from the global recession. The average rates, however,
Page 13
did not see any movement owing primarily to the lack of new supply entering the market. Additionally, unlike other major cities, Kolkata hotels had not seen an exponential jump in average rates in the past few years and thus the immediate need for rate correction was not warranted. Future supply is expected to be absorbed as room nights demand grows from the central business district as well as the suburban districts of Salt Lake and Rajarhat. A few hotel projects are under construction and the city is expected to have an additional thousand branded rooms across various positionings in the next five years. That being said, while some of these hotel projects are finally seeing active development, there are several announced projects on EM Bypass and in Rajarhat that are suffering delays for a variety of reasons. The overall development of Rajarhat as the new commercial hub of Kolkata has been painstakingly slow and even stagnant in recent months. Overall, Kolkata is not expected to see significant growth in average rates or occupancies in the short to medium term and the existing hotels will probably manage to maintain their current performance over the next nine to twelve months.
Mumbai
The Mumbai market was adversely affected by both the global financial crisis and the terror attacks. Being the financial hub of the country, it saw a sharp decline in demand from its staple feeder markets such as the banking, financial and consulting companies. Hotels were slow to reduce their rates so while the average rates sustained themselves, hotel occupancies witnessed a very sharp correction. The delay in reducing the average rates can also be attributed to the signing of half yearly contracts with companies which could not always be renegotiated in mid-term. The first half of 2009 saw hotels reducing their rates in their endeavour to improve occupancies. This strategy has borne fruit and an improved Indian economy has helped increase both rates and occupancies in the hotels. The coming year will see the opening of many hotel projects such as the Trident at BKC, Westin at Goregaon, Holiday Inn at Saki Naka and Novotel in Juhu. However, the size of the Mumbai market is growing rapidly and we anticipate that Mumbai shall be able to absorb this demand and continue growing. Quality developments across the city such as the Mumbai International Airport's landside development shall further boost demand in the market. Mumbai continues to remain one of India's best performing hotel markets.
New Delhi-National Capital Region (NCR)
The NCR has grown in a very well-rounded manner and almost all parts of the city are seeing rapid growth. So while the Gurgaon market, located in close proximity to the Delhi International Airport, has been very buoyant over the past few years, other areas such as Rohini (in the West), Shahadra (in the Northeast), Noida and Saket (East) have all seen a healthy increase in demand and supply. Unlike many other cities, hotels across Delhi have demand originating from varied sectors including tourism, government, manufacturing and of course services. Therefore, while the NCR saw a decline in occupancies in the last year, it has regained its operating performance this year. The growth of the NCR is also largely attributed to the good governance of the state. Infrastructure projects such as the Metro rail, the road development and upgradation of facilities (owing partly to the upcoming Commonwealth games in 2010) have made the NCR an attractive destination for both investors and residents. However, there is a large quantum of supply expected to enter the NCR market (including the 4045 rooms at the Delhi International Airport Hospitality District) and this might pose a challenge for some of these hotels if not positioned correctly.
Pune
In our previous reports, HVS had predicted the Pune market would decline in both occupancies and average rates; this trend has been very visible in the current year. The city has seen a large influx of new hotels and many more are scheduled to enter the market in the coming future. The lacklustre performance has been further accentuated by these hotels being built outside the city and in close proximity to specific feeder markets which neither generate enough demand for rooms to support these developments nor subsist such a high supply in a relatively short period of time. We expect the performance of this market to remain dampened in the short to medium term.
Page 14
Twelve Major Cities
Ahmedabad
Ahmedabad, being a commercial destination, has seen a decline in average rates and occupancy (11.2 points decline in occupancy) owing to the economic downturn. With sixteen new hotels scheduled to commence operations in the next four to five years, the hotels in the city are expected to witness a price war. Also, some companies such as Torrent Power have developed guest houses and training centers in their facilities. If this trend continues, it could further bring down hotel occupancies. However, in the long term, the investor- friendly approach of the Gujarat government, availability of good infrastructure such as road connectivity to major metros of Delhi and Mumbai as well as interrupted power, and proximity to several ports makes Ahmedabad a favored destination for corporations to set up regional offices or headquarters. Although the development of some big projects in Ahmedabad such as the Gujarat International Finance Tec-City (GIFT) and the Sabarmati Riverfront Development Project has slowed down, we expect Gujarat to be a financial hub for West India and continue to generate demand for hotel rooms. In the long term, Ahmedabad might also get more business from domestic and international airlines as it is developing a separate international terminal. Airlines that choose to park in Ahmedabad stand to benefit from cheaper parking and accommodation facilities.
Chandigarh
The Chandigarh market has attracted a lot of attention over the past few years, owing primarily to the good performance of existing hotels in the market. The city is the combined capital for Haryana and Punjab, and is located at a juncture where it caters to not just these two states but also to Himachal Pradesh. Therefore, the hospitality market in the city saw demand from sectors such as fast moving consumer goods (FMCG), telecommunications, manufacturing, pharmaceuticals and others. Many new projects such as the JW Marriott, Sheraton, The Lalit, Radisson and The Trident have been announced in the city though all of them are much behind completion schedule and in many cases construction has not even begun.
Coimbatore
Coimbatore's diversified economy consisting of a growing auto-ancillary sector, textile manufacturing and services sector (Medical, IT/ITeS) supported with a growing talent pool and significantly lower costs of business operations and living, has helped the city rise to prominence as a business destination in Tamil Nadu. In the medium to long term the proposed development on the commercial, residential and retail front is expected to create significant demand for hotel accommodation and facilities. Also, with the steady growth in the Leisure segment, and proximity of Coimbatore to the Nilgiris (Ooty, Conoor, Kotagiri), we forsee the demand from the Leisure segment to improve in the next few years. However, we anticipate the existing base of approximately 350 hotel rooms to rise to nearly 875 rooms, adding pressure to the performance of hotels in the coming short to medium term.
Hyderabad
Hyderabad, the capital of Andhra Pradesh, is a modern, cosmopolitan city and also the sixth largest in India. Contemporary Hyderabad comprises the tri-cities of old Hyderabad, Cyberabad (Madhapur and Gachibowli) and Secunderabad. Hyderabad was once a city dependent on handicrafts, textiles, and gems and jewellery. However, the city's economy has diversified greatly in the last five to ten years, due to the investor friendly government policies and significant state investment resulting in successful establishment of public-private partnerships. Hyderabad has seen steady growth of information technology (IT), biotechnology, banking, finance and insurance sectors. HITEC, Madhapur, Gachibowli and Nanakramguda in West Hyderabad have seen rapid developments and with a large number of companies, especially those involved in IT and finance in
Page 15
particular having occupied space here. As the International Convention Centre approaches its stabilised year of operations and newer hotels open shortly we can be assured that demand will pick up as larger conferences come to this city.
Indore
Indore is the economic and commercial capital of Madhya Pradesh. Historically, business activity had been limited to textile production and domestic trade. These production houses, factories and mills were concentrated in the heart of the city. The state government is now trying to improve the IT infrastructure in the city and the plan to set up an IT SEZ near the proposed international airport has received approval from the state government. The retail market in the city is on a growth curve. While a majority of the high street retail is concentrated in the CBD, new mall developments are taking place on the outskirts as well. Commercial demand for the city's hotels is primarily dependent upon financial institutions, banks, service providers such as telecommunications companies, and insurance firms. Indore is a key centre for major automobile units like Force Motors and Eicher Motors.
Jaipur
The beginning of the calendar year 2008 did not go well for Jaipur. The communal tension due to the Gujjar agitation and the bomb blasts brought the city to a halt. This impacted the beginning of the fiscal year 2008/09 and resulted in the summer season being a wash out. The Mumbai bombings in November further impacted the leisure demand in the city with huge cancellations and a virtual freeze on the foreign travel to the city. The city, however, still holds a prominent place in the leisure circuit in India. Being the only international airport in the state till some time now, Jaipur acts as the gateway to Rajasthan. As a result, the city witnesses a longer length of stay. The rich heritage of the city with an easy access to Delhi and Mumbai has also benefited the city to develop as a preferred destination for the weddings and meetings segments. The city has also shown tremendous potential for Commercial demand. Jaipur has traditionally been a base for the traders, buyers and sellers from the gems and jewellery business and industrial units on the outskirts of the city. With the economical advantage of lower real estate prices and proximity to the two main markets in India, the city is now attracting other sectors like PSUs, Banking and Insurance, Telecom and IT. to enter the city. The development of the Mahindra World City on the outskirts of Jaipur is also an example of this potential.
Kochi
Kochi has historically been the trade and financial hub for Kerala and has now added tourism to its portfolio becoming the gateway to Kumarakom, Thekkady and other popular tourist spots. This has helped Kochi diversify its target market amongst business travelers, conferences and tourists. The Kochi market is divided into hotels targeting tourists and those targeting the business travelers, based on their location in the city. While we expect the supply in the business hotel category to outstrip demand, tourism oriented resorts are expected to continue performing well.
Ootacamund (Ooty)
Ooty is the primary hill station of South India. Located in the Nilgiris, in proximity to the Nilgiri Biosphere Reserve, it can be accessed by road from both Bangalore and Coimbatore. While Ooty continues to retain its charm as a hill station destination, many new innovative and environment-friendly hotels are being made around the location and in closer proximity to the wildlife destinations. With domestic travel set to grow at a fast pace, we expect these newer hotels to outperform those in Ooty proper as the preferred tourist destination.
Page 16

Shimla
Shimla is the erstwhile summer capital of the British Raaj in India and has long served as the popular hillside getaway for tourists from Delhi, Punjab and Haryana. As the state capital of Himachal Pradesh, it also caters to the demand generated by the government sector. However, the city's performance in attracting the Leisure segment is fast ebbing owing to rampant commercial development and widespread destruction of the flora and fauna.
Thiruvananthapuram
Thiruvananthapuram, the official capital of Kerala, caters primarily to a rate-conscious business travellers segment. While there is a strong demand from the tourism segment, this is primarily for destinations located in close proximity to Thiruvananthapuram such as Kovalam. Two new properties have recently opened in the city but with no substantial future supply, we expect the performance of the city to remain stable.
Vadodara
Vadodara, previously known as Baroda, is located in the state of Gujarat. The city has faced a stable government for 15 years and is one of the developing areas in the field of finance. Some financial institutions like banks and insurance houses form the primary feeder market segment in terms of guests staying in the hotels in Vadodara. The city has a budget to mid market hotel orientation as most of the guests visit the area for commercial purposes.
Visakhapatnam
Vishakhapatnam, the second-largest city in Andhra Pradesh, is primarily an industrial area apart from being a port city. The city has a diversified demand for hotel rooms originating from the ship building, steel, oil and natural gas, and IT&ES sectors. The city has a strong demand from the Extended Stay segment and this has helped increase the overall occupancy in the city; however, there are no branded serviced apartments operational in the city. A Novotel and Double Tree by Hilton are expected to commence operations in this market in the coming year.
Page 17
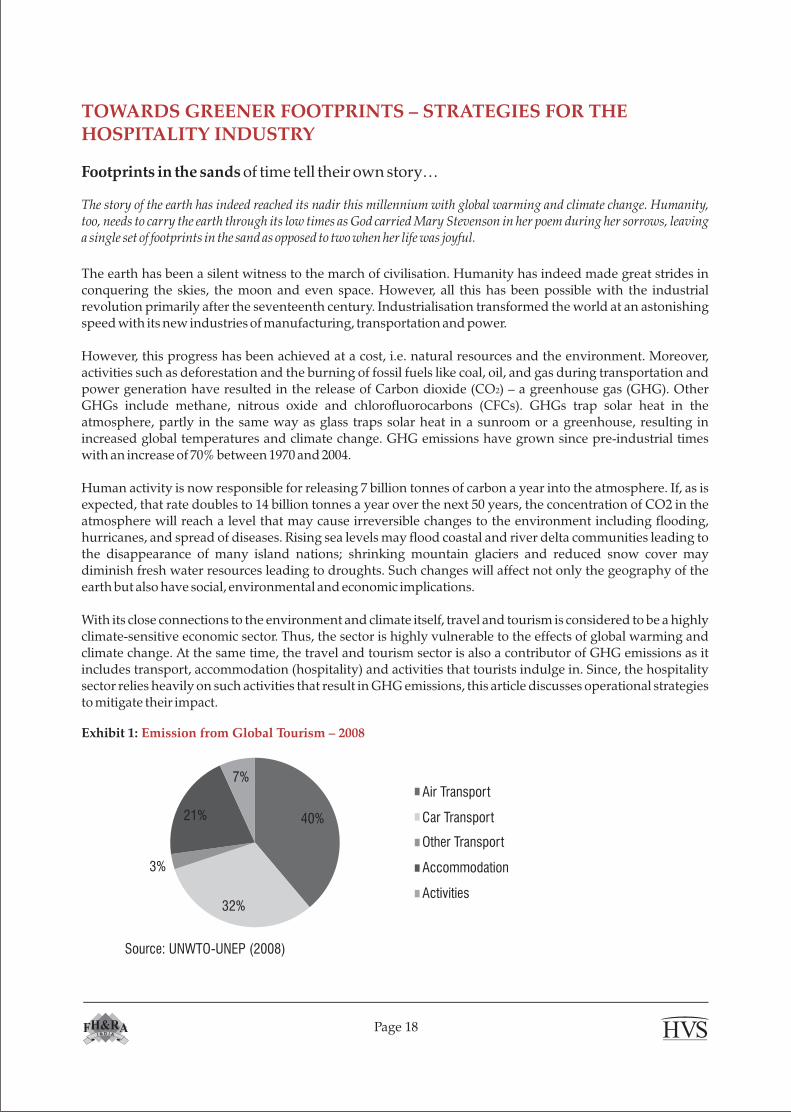
40%
32%
3%
21%
7%Air Transport
Car Transport
Other Transport
Accommodation
Activities
Source: UNWTO-UNEP (2008)
Exhibit 1: Emission from Global Tourism – 2008
TOWARDS GREENER FOOTPRINTS – STRATEGIES FOR THE HOSPITALITY INDUSTRY
Footprints in the sands of time tell their own story…
The story of the earth has indeed reached its nadir this millennium with global warming and climate change. Humanity, too, needs to carry the earth through its low times as God carried Mary Stevenson in her poem during her sorrows, leaving a single set of footprints in the sand as opposed to two when her life was joyful.
The earth has been a silent witness to the march of civilisation. Humanity has indeed made great strides in conquering the skies, the moon and even space. However, all this has been possible with the industrial revolution primarily after the seventeenth century. Industrialisation transformed the world at an astonishing speed with its new industries of manufacturing, transportation and power.
However, this progress has been achieved at a cost, i.e. natural resources and the environment. Moreover, activities such as deforestation and the burning of fossil fuels like coal, oil, and gas during transportation and power generation have resulted in the release of Carbon dioxide (CO2) – a greenhouse gas (GHG). Other GHGs include methane, nitrous oxide and chlorofluorocarbons (CFCs). GHGs trap solar heat in the atmosphere, partly in the same way as glass traps solar heat in a sunroom or a greenhouse, resulting in increased global temperatures and climate change. GHG emissions have grown since pre-industrial times with an increase of 70% between 1970 and 2004.
Human activity is now responsible for releasing 7 billion tonnes of carbon a year into the atmosphere. If, as is expected, that rate doubles to 14 billion tonnes a year over the next 50 years, the concentration of CO2 in the atmosphere will reach a level that may cause irreversible changes to the environment including flooding, hurricanes, and spread of diseases. Rising sea levels may flood coastal and river delta communities leading to the disappearance of many island nations; shrinking mountain glaciers and reduced snow cover may diminish fresh water resources leading to droughts. Such changes will affect not only the geography of the earth but also have social, environmental and economic implications.
With its close connections to the environment and climate itself, travel and tourism is considered to be a highly climate-sensitive economic sector. Thus, the sector is highly vulnerable to the effects of global warming and climate change. At the same time, the travel and tourism sector is also a contributor of GHG emissions as it includes transport, accommodation (hospitality) and activities that tourists indulge in. Since, the hospitality sector relies heavily on such activities that result in GHG emissions, this article discusses operational strategies to mitigate their impact.
Page 18
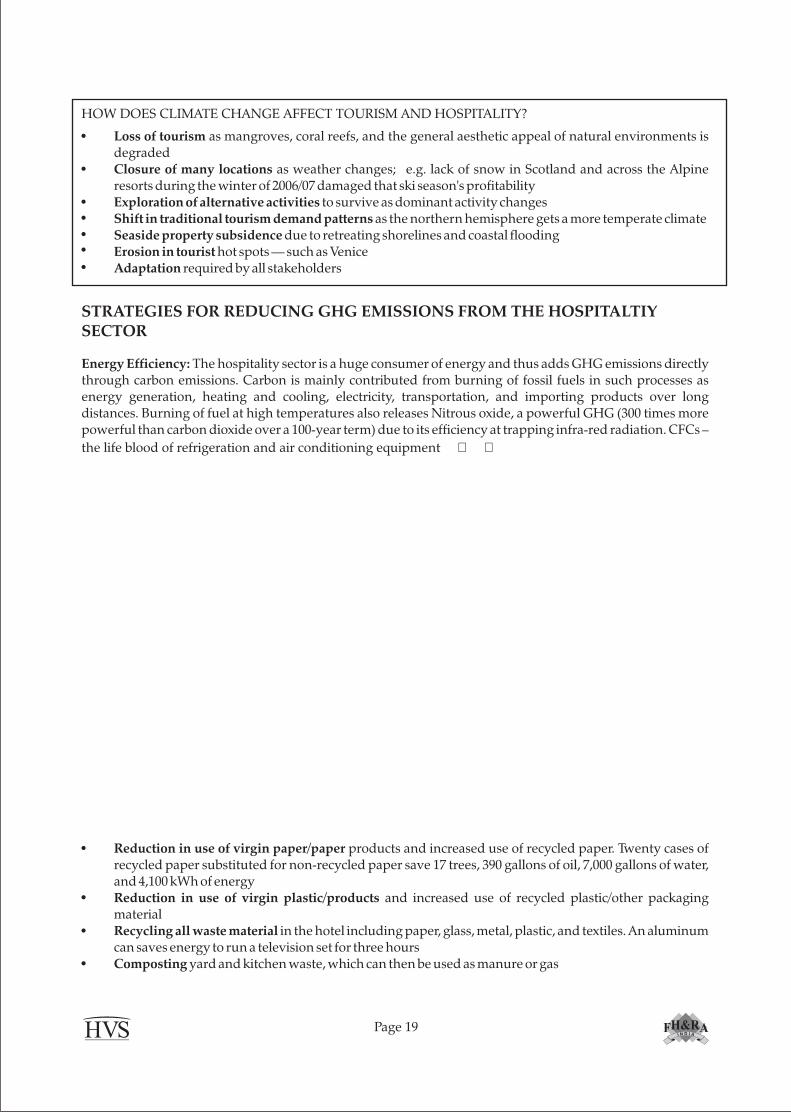
Reduction in use of virgin paper/paper products and increased use of recycled paper. Twenty cases of recycled paper substituted for non-recycled paper save 17 trees, 390 gallons of oil, 7,000 gallons of water, and 4,100 kWh of energyReduction in use of virgin plastic/products and increased use of recycled plastic/other packaging materialRecycling all waste material in the hotel including paper, glass, metal, plastic, and textiles. An aluminum can saves energy to run a television set for three hoursComposting yard and kitchen waste, which can then be used as manure or gas
Page 19
STRATEGIES FOR REDUCING GHG EMISSIONS FROM THE HOSPITALTIY SECTOR
Energy Efficiency: The hospitality sector is a huge consumer of energy and thus adds GHG emissions directly through carbon emissions. Carbon is mainly contributed from burning of fossil fuels in such processes as energy generation, heating and cooling, electricity, transportation, and importing products over long distances. Burning of fuel at high temperatures also releases Nitrous oxide, a powerful GHG (300 times more powerful than carbon dioxide over a 100-year term) due to its efficiency at trapping infra-red radiation. CFCs –
the life blood of refrigeration and air conditioning equipment �{�nalso contribute to the 'greenhouse' effect because they absorb infra-red radiation from the earth's surface. Some methods for attaining energy efficiency in hotels are:
Reduction in energy consumption by exploiting all technical potential for electrical efficiency via technical standards; for example replacement of incandescent bulbs by compact fluorescent lights (CFLs), which use less energy and last eight times longer (8,000h instead of 1,000h)Replacement of old equipment with energy efficient onesReduction in cogeneration of energy that usually goes waste such as in operations of cooling towersReplacement of fossil energy sources with renewable ones available locally such as wind or sunSequestering of Carbon for example through planting of trees, which absorb and store Carbon
Solid Waste Management: The hospitality sector produces large amount of waste. An average restaurant produces 22,727 kg of garbage a year. Every night, the average diner produces about 1 kg of waste, mostly composed of beverage and paper products, accounting for 65% of all hotel waste. About 95% of this can be recycled or composted, but most is simply thrown away. Logging and burning of tropical forests for making paper and clearing land for agriculture creates about 20% of GHG emissions, more than that emitted from the world's transportation. Hotels also use large quantities of plastic in packaging and amenities, which poses a problem in disposal as this takes up landfill space and takes hundreds of years to break down. Since waste has to be paid for twice - once in the form of packaging and again for disposal - it makes good business sense to create as little as possible in the first place. Not treating waste and diverting it to landfills produces methane emissions; methane is 21 times more powerful than CO2 as a GHG. Specific methods for a good waste management plan in hotels include:
Employee Education and Community Development: Since hotels draw on environmental resources and climate change is primarily a result of human activities, it is crucial that people/ staff in hotels understand their role in how resources can be conserved and GHG emissions mitigated. Mitigation is truly possible when employees manning the operations understand the need for change, believe in it, and adapt their practices
Hotels, by their very nature, draw on huge environmental resources and depending on the positioning have high luxury standards. Hotels have to balance out the luxury coefficient of their operations with that of their impact on the environment and adapt accordingly. For example importing expensive items increases the carbon emissions (due to transportation) and costs, while an understanding with the community or a corporate social responsibility (CSR) project may actually lead to procuring the same item at lowered costs to both the hotel and environment as well as development of the local community
Specific employee education and community development methods in hotels include:
Page 20
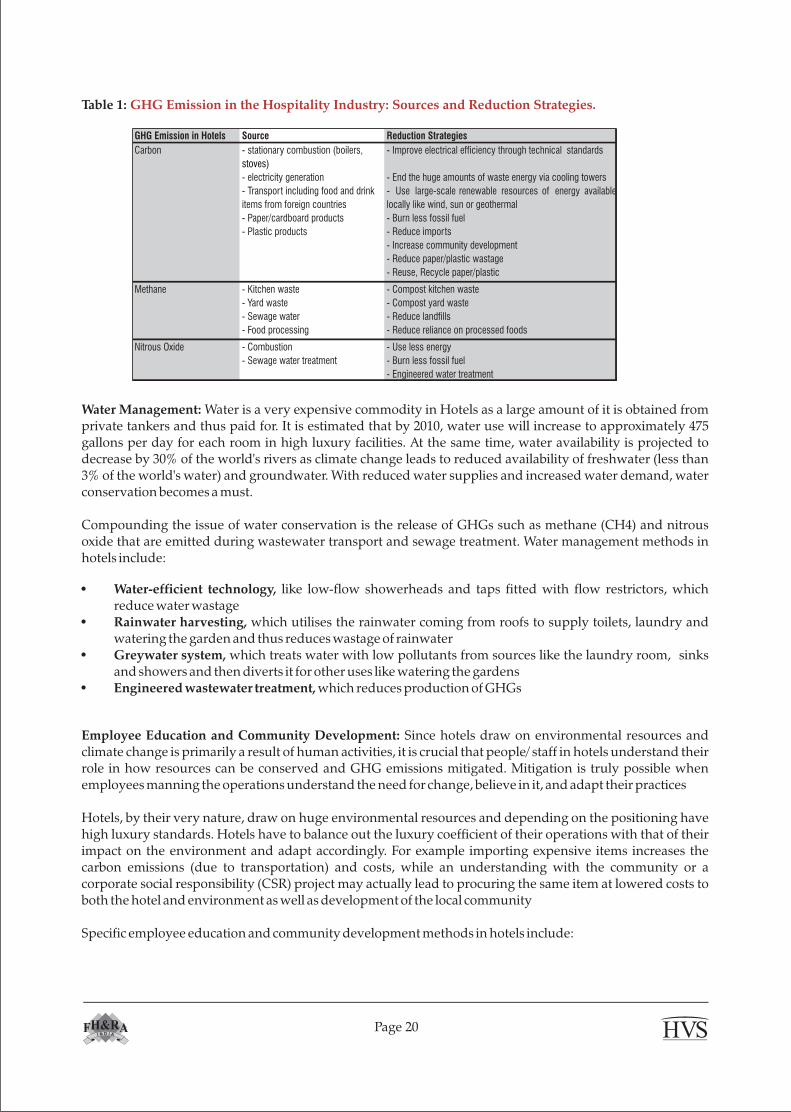
Water-efficient technology, like low-flow showerheads and taps fitted with flow restrictors, which reduce water wastageRainwater harvesting, which utilises the rainwater coming from roofs to supply toilets, laundry and watering the garden and thus reduces wastage of rainwaterGreywater system, which treats water with low pollutants from sources like the laundry room, sinks and showers and then diverts it for other uses like watering the gardensEngineered wastewater treatment, which reduces production of GHGs
Water Management: Water is a very expensive commodity in Hotels as a large amount of it is obtained from private tankers and thus paid for. It is estimated that by 2010, water use will increase to approximately 475 gallons per day for each room in high luxury facilities. At the same time, water availability is projected to decrease by 30% of the world's rivers as climate change leads to reduced availability of freshwater (less than 3% of the world's water) and groundwater. With reduced water supplies and increased water demand, water conservation becomes a must.
Compounding the issue of water conservation is the release of GHGs such as methane (CH4) and nitrous oxide that are emitted during wastewater transport and sewage treatment. Water management methods in hotels include:
Table 1: GHG Emission in the Hospitality Industry: Sources and Reduction Strategies.
GHG Emission in Hotels Source Reduction Strategies
- stationary combustion (boilers,
stoves)
- Improve electrical efficiency through technical standards
- electricity generation - End the huge amounts of waste energy via cooling towers
- Transport including food and drink
items from foreign countries
- Use large-scale renewable resources of energy available
locally like wind, sun or geothermal
- Paper/cardboard products - Burn less fossil fuel
- Plastic products - Reduce imports
- Increase community development
- Reduce paper/plastic wastage
- Reuse, Recycle paper/plastic
- Kitchen waste - Compost kitchen waste
- Yard waste - Compost yard waste
- Sewage water - Reduce landfills
- Food processing - Reduce reliance on processed foods
- Combustion - Use less energy
- Sewage water treatment - Burn less fossil fuel
- Engineered water treatment
Carbon
Methane
Nitrous Oxide

Page 21
Avantika Vijay SinghECOTEL
Commitment to the environment through the complete employee spectrumStandard operating procedures of the hotel to include correct practices regarding different departmentsTarget setting, and involving/ encouraging employees to meet themTraining staff on issues related to the environment such as GHG emissions, water shortage, energy and the initiatives taken by the hotel regarding theseCommunity development with the participation of surrounding communities, suppliers and service providers, promoting the economic, social and cultural growth in the region
In addition to the above practices that focus on the operational aspects of hotels, developers of new hotels can further reduce the environmental effect of their hotels from conception itself – that is, the design stage – to the materials used in construction. Hotels are built to last, literally, a lifetime and hotel owners should ensure their hotels are constructed using environment-friendly products and have a design that minimises the usage of resources.
The world is cohesively moving towards helping green its footprints. The G-8 leaders are meeting in Copenhagen to agree to an acceptable 2 degree centigrade rise in temperature by the end of the century as against a 3 degree one. This involves adopting greener practices that cut down on GHG emissions by all sectors globally. Currently, India ranks fourth among the world's top ten carbon-emitting nations. India's environment policy, under the stewardship of Jairam Ramesh, Indian environment and forests minister, is gearing towards substantial cuts in its Carbon emissions anywhere between 20-25% by 2020.
We believe that this would be possible only by improving the resource consumption efficiency of every stakeholder including the hospitality sector. Owners and management companies of hotels should ensure that their buildings and processes are duly certified and improvements incorporated wherever possible. Not only does bringing about these changes help improve the bottomline, but they also help the topline by attracting an ever-increasing number of environmentally sensitive customers.
The ECOTEL® Certification, managed by HVS, is HVS's commitment to the environment. ECOTEL® enables operators to reduce the environmental impact of their hotels and also to function more efficiently. The certification recognises only those hotels with high operational standards regarding a commitment to the environment through both the infrastructure of the hotel and the knowledge and practices of the people manning the operations. The criteria are updated to keep current with advances in scientific knowledge and technology, and so hotels must reapply every two years.
1. Indian Hotel Industry by Star Category
Introduction
In this section, we have analysed hotel performance by star classification. An overall total of 1,168 hotels participated in our survey for 2008/09. The hotels have been classified into the eight categories applicable in India (see Tables 1-1 to 1-10), and their responses analysed accordingly.
To provide further comparisons, we have included a column for All India Totals across all star categories. Each section includes the total number of respondents for each component of the survey, allowing the reader to judge the validity of the data received.
The layout has been standardised in each section to enable consistency throughout the entire document. All figures pertain to 2008/09 (April-March), and monetary figures are in Indian rupees.
Trends
Rooms Profile: The proportion of suites to that of other room types varies across hotels in different star categories. The difference is stark in the five-star category where suites comprise just 6% of overall inventory as compared to the four star and three star (9% each) ones. This may be considered as an indicator of inefficient space allocation in the lower-category hotels and can have adverse effects on the overall yield management.
Market Segmentation: Domestic business travellers (36.6%) constitute the largest segment in the Indian hotel market. There is a direct correlation between the economic growth of the country and the growth of this segment; a trend expected to grow in the future. A decline in the Tour groups segment (domestic and foreign) is observed with a corresponding increase in the (FIT) Leisure (domestic and foreign) segment as compared to 2000/01. This may be attributed to tourists increasingly preferring to make their own itineraries and exploring destinations on their own rather than through tour operators and packaged tours.
Country of Origin: The overall constitution of the country of origin of guests continues to mirror that of the previous years; the UK and US continue to dominate the overall visitations. Country of origin covers both leisure as well as commercial travellers. This year has seen an increased visitation from 'other countries'.
Page 22
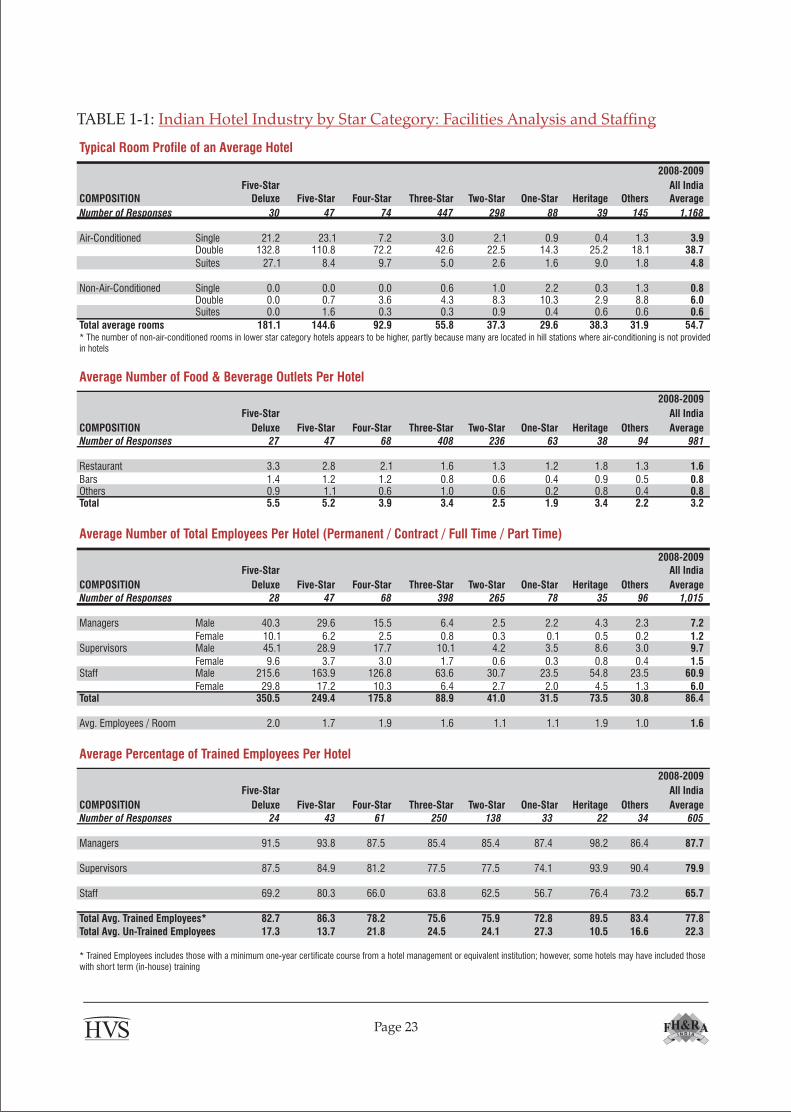
Typical Room Profile of an Average Hotel
COMPOSITION
Five-Star
Deluxe Five-Star Four-Star Three-Star Two-Star One-Star Heritage Others
2008-2009
All India
Average
Number of Responses 30 47 74 447 298 88 39 145 1,168
Air-Conditioned Single 21.2 23.1 7.2 3.0 2.1 0.9 0.4 1.3 3.9Double 132.8 110.8 72.2 42.6 22.5 14.3 25.2 18.1 38.7
Suites 27.1 8.4 9.7 5.0 2.6 1.6 9.0 1.8 4.8
Non-Air-Conditioned Single 0.0 0.0 0.0 0.6 1.0 2.2 0.3 1.3 0.8Double 0.0 0.7 3.6 4.3 8.3 10.3 2.9 8.8 6.0Suites 0.0 1.6 0.3 0.3 0.9 0.4 0.6 0.6 0.6
Total average rooms 181.1 144.6 92.9 55.8 37.3 29.6 38.3 31.9 54.7
Average Number of Food & Beverage Outlets Per Hotel
COMPOSITION
Five-Star
Deluxe Five-Star Four-Star Three-Star Two-Star One-Star Heritage Others
2008-2009
All India
Average
Number of Responses 27 47 68 408 236 63 38 94 981
Restaurant 3.3 2.8 2.1 1.6 1.3 1.2 1.8 1.3 1.6
Bars 1.4 1.2 1.2 0.8 0.6 0.4 0.9 0.5 0.8Others 0.9 1.1 0.6 1.0 0.6 0.2 0.8 0.4 0.8Total 5.5 5.2 3.9 3.4 2.5 1.9 3.4 2.2 3.2
Average Number of Total Employees Per Hotel (Permanent / Contract / Full Time / Part Time)
COMPOSITION
Five-Star
Deluxe Five-Star Four-Star Three-Star Two-Star One-Star Heritage Others
2008-2009
All India
Average
Number of Responses 28 47 68 398 265 78 35 96 1,015
Managers Male 40.3 29.6 15.5 6.4 2.5 2.2 4.3 2.3 7.2
Female 10.1 6.2 2.5 0.8 0.3 0.1 0.5 0.2 1.2Supervisors Male 45.1 28.9 17.7 10.1 4.2 3.5 8.6 3.0 9.7
Female 9.6 3.7 3.0 1.7 0.6 0.3 0.8 0.4 1.5Staff Male 215.6 163.9 126.8 63.6 30.7 23.5 54.8 23.5 60.9
Female 29.8 17.2 10.3 6.4 2.7 2.0 4.5 1.3 6.0Total 350.5 249.4 175.8 88.9 41.0 31.5 73.5 30.8 86.4
Avg. Employees / Room 2.0 1.7 1.9 1.6 1.1 1.1 1.9 1.0 1.6
Average Percentage of Trained Employees Per Hotel
COMPOSITION
Five-Star
Deluxe Five-Star Four-Star Three-Star Two-Star One-Star Heritage Others
2008-2009
All India
Average
Number of Responses 24 43 61 250 138 33 22 34 605
Managers 91.5 93.8 87.5 85.4 85.4 87.4 98.2 86.4 87.7
Supervisors 87.5 84.9 81.2 77.5 77.5 74.1 93.9 90.4 79.9
Staff 69.2 80.3 66.0 63.8 62.5 56.7 76.4 73.2 65.7
Total Avg. Trained Employees* 82.7 86.3 78.2 75.6 75.9 72.8 89.5 83.4 77.8
Total Avg. Un-Trained Employees 17.3 13.7 21.8 24.5 24.1 27.3 10.5 16.6 22.3
* The number of non-air-conditioned rooms in lower star category hotels appears to be higher, partly because many are located in hill stations where air-conditioning is not provided in hotels
* Trained Employees includes those with a minimum one-year certificate course from a hotel management or equivalent institution; however, some hotels may have included those with short term (in-house) training
TABLE 1-1: Indian Hotel Industry by Star Category: Facilities Analysis and Staffing
Page 23
Page 24
CO
MP
OS
ITIO
N
Fiv
e-S
tar
Delu
xe
Fiv
e-S
tar
Four-
Sta
rThre
e-S
tar
Tw
o-S
tar
One-S
tar
Heri
tage
Oth
ers
2008-2
009
All I
ndia
Avera
ge
Num
ber
of
Responses
26
40
49
199
101
30
21
8474
Avera
ge T
ota
l R
oom
s P
er
Hote
l:177
147
87
60
38
33
41
28
69
Avera
ge O
ccupie
d R
oom
s P
er
Hote
l:42,0
89
31,6
86
18,6
14
12,9
10
8,7
69
7,8
36
7,6
87
6,0
73
15,1
43
Avera
ge O
ccupancy P
er
Hote
l:65.3
%60.5
%60.7
%62.6
%65.4
%67.8
%53.6
%69.6
%63.1
%A
vera
ge R
ate
Per
Hote
l:R
s 1
0,0
96
Rs 6
,724
Rs 4
,673
Rs 2
,530
Rs 1
,242
Rs 7
90
Rs 3
,198
Rs 1
,482
Rs 4
,487
REV
EN
UE
Room
s62.2
%62.7
%59.1
%57.2
%61.9
%46.1
%50.5
%47.9
%60.5
%Food &
Bevera
ge
22.3
23.3
25.3
31.6
29.1
46.4
35.6
39.7
25.6
Banquets
& C
onfe
rences
9.9
8.5
11.4
7.1
3.7
4.1
8.6
10.8
8.8
Tele
phone &
Oth
er
0.6
0.6
0.5
0.6
0.4
0.5
0.2
0.3
0.6
Min
or
Opera
ted*
3.5
2.1
1.9
1.1
0.6
0.3
1.4
0.2
2.2
Renta
l &
Oth
er
Incom
e1.5
2.9
2.0
2.5
4.2
2.5
3.8
1.1
2.3
Tota
l100.0
100.0
100.0
100.0
100.0
100.0
100.0
100.0
100.0
DEPA
RTM
EN
TA
L E
XP
EN
SES
Room
s13.6
15.2
12.4
15.6
24.5
25.0
19.8
17.4
14.8
Food &
Bevera
ge
53.5
51.6
48.2
62.3
71.4
59.5
55.5
73.4
55.3
Tele
phone &
Oth
er
57.1
69.7
98.5
88.9
239.1
149.4
355.7
284.2
79.7
Min
or
Opera
ted*
44.1
76.3
120.7
117.0
159.4
191.3
112.3
387.2
70.3
Renta
l &
Oth
er
Incom
e3.8
3.9
3.7
18.6
24.3
50.9
11.6
331.5
9.7
Tota
l27.6
28.0
27.8
35.2
41.6
44.3
37.3
50.7
30.3
DEPA
RTM
EN
TA
L I
NC
OM
E72.4
72.0
72.2
64.8
58.4
55.7
62.7
49.4
69.8
OP
ER
ATIN
G E
XP
EN
SES
Adm
inis
trative &
Genera
l8.6
8.7
9.1
8.3
8.8
9.0
9.2
7.1
8.7
Managem
ent Fee
4.5
1.8
2.0
1.7
1.4
1.8
3.3
0.8
2.7
Mark
eting
3.1
3.0
2.1
2.3
2.4
1.5
3.3
1.0
2.7
Fra
nchis
e F
ees
0.3
0.8
0.5
0.6
0.0
0.2
1.7
0.1
0.5
Pro
pert
y O
pera
tions &
Main
tenance
4.0
5.5
6.5
6.1
7.0
3.8
9.0
6.0
5.4
Energ
y7.2
8.4
8.6
10.7
11.4
13.1
9.1
14.7
8.5
Tota
l27.8
28.2
28.7
29.7
31.1
29.4
35.4
29.7
28.5
HO
US
E P
RO
FIT
44.6
43.8
43.5
35.1
27.3
26.4
27.4
19.6
41.2
FIX
ED
EX
PEN
SES
Pro
pert
y T
axes
0.6
0.6
0.5
0.6
0.6
1.0
0.2
0.7
0.6
Insura
nce
0.3
0.3
0.3
0.4
0.3
0.5
0.2
0.2
0.3
Oth
er
Fix
ed C
harg
es
1.2
0.7
1.4
1.3
1.6
1.9
0.4
1.0
1.1
Rent
0.9
2.0
2.3
0.7
0.7
0.7
1.3
0.1
1.3
Tota
l3.0
3.6
4.5
2.9
3.2
4.1
2.1
2.1
3.4
NET I
NC
OM
E**
41.6
%40.2
%39.0
%32.2
%24.1
%22.2
%25.3
%17.5
%37.9
%
* M
inor
opera
ted d
epart
ments
inclu
de:
laundry
, gift shop,
busin
ess c
entr
e,
new
s s
tand,
sport
s,
health c
lub,
gara
ge,
park
ing a
nd s
o f
ort
h
**
Net In
com
e is b
efo
re d
epre
cia
tion,
inte
rest paym
ents
and taxes
ID:
Insuff
icie
nt D
ata
TA
BL
E 1
-2:
Ind
ian
Ho
tel
Ind
ust
ry b
y S
tar
Cat
ego
ry:
Fin
anci
al R
epo
rt –
Per
cen
tag
e o
f R
even
ue
(200
8-20
09)

CO
MP
OS
ITIO
N
Fiv
e-S
tar
Delu
xe
Fiv
e-S
tar
Four-
Sta
rThre
e-S
tar
Two-S
tar
One-S
tar
Heri
tage
Oth
ers
20
08
-20
09
All I
ndia
Avera
ge
Num
ber
of
Responses
26
40
49
19
91
01
30
21
84
74
Avera
ge T
ota
l R
oom
s P
er
Hote
l:1
77
14
78
76
03
83
34
12
86
9A
vera
ge O
ccupie
d R
oom
s P
er
Hote
l:4
2,0
89
31
,68
61
8,6
14
12
,91
08
,76
97
,83
67
,68
76
,07
31
5,1
43
Avera
ge O
ccupancy P
er
Hote
l:6
5.3
%6
0.5
%6
0.7
%6
2.6
%6
5.4
%6
7.8
%5
3.6
%6
9.6
%6
3.1
%A
vera
ge R
ate
Per
Hote
l:R
s 1
0,0
96
Rs 6
,57
8R
s 4
,67
3R
s 2
,53
0R
s 1
,24
2R
s 7
90
Rs 3
,19
8R
s 1
,48
2R
s 4
,48
7
REV
EN
UE
Room
sR
s 2
,395,0
50
Rs 1
,445,0
80
Rs 9
95,6
86
Rs 5
42,5
57
Rs 2
83,8
79
Rs 1
88,9
92
Rs 5
99,6
99
Rs 3
24,3
39
Rs 9
85
,31
0Fo
od &
Beve
rage
858,1
88
532,2
42
425,7
62
299,5
96
133,5
88
190,2
83
422,5
09
268,5
54
41
7,2
48
Banquets
& C
onfe
rences
379,1
64
194,1
07
191,5
46
67,4
50
17,0
97
16,7
70
102,2
36
72,6
98
14
4,0
54
Tele
phone &
Oth
er
23,5
64
13,4
79
777
5,5
19
1,8
12
2,0
99
2,4
02
2,1
71
9,1
54
Min
or
Opera
ted*
134,3
96
48,7
15
31,3
50
9,9
99
2,8
21
1,3
66
17,0
83
1,2
34
36
,36
0R
enta
l &
Oth
er
Incom
e57,4
39
65,7
87
33,1
41
23,4
38
19,4
11
10,3
93
44,4
89
7,4
90
36
,74
3To
tal
3,8
47,8
00
2,2
99,6
00
1,6
85,2
60
948,5
59
458,6
07
409,9
02
1,1
88,4
10
676,4
85
1,6
28
,87
0D
EP
AR
TM
EN
TA
L E
XP
EN
SES
Room
s326,0
89
220,1
80
123,8
76
84,5
72
69,6
42
47,2
82
118,7
24
56,3
13
14
6,1
92
Food &
Beve
rage
662,1
98
374,6
63
297,2
97
228,6
22
107,5
47
123,2
41
291,0
58
250,5
65
31
0,1
65
Tele
phone &
Oth
er
13,4
52
9,3
97
7,6
64
4,9
07
4,3
32
3,1
34
8,5
42
6,1
70
7,2
91
Min
or
Opera
ted*
59,2
00
37,1
76
37,8
44
11,7
01
4,4
96
2,6
13
19,1
86
4,7
79
25
,55
4R
enta
l &
Oth
er
Incom
e2,1
62
2,5
74
1,2
24
4,3
69
4,7
25
5,2
90
5,1
54
24,8
27
3,5
53
Tota
l1,0
63,1
00
643,9
90
467,9
06
334,1
70
190,7
42
181,5
60
442,6
64
342,6
54
49
2,7
55
DEP
AR
TM
EN
TA
L I
NC
OM
E2,7
84,7
00
1,6
55,6
10
1,2
17,3
60
614,3
89
267,8
65
228,3
41
745,7
43
333,8
31
1,1
36
,11
0O
PER
ATIN
G E
XP
EN
SES
Adm
inis
trative
& G
enera
l332,2
37
200,6
25
152,8
26
79,0
50
40,2
90
36,8
14
108,7
14
47,9
92
14
1,1
21
Managem
ent Fe
e172,7
85
40,3
24
33,2
83
16,5
25
6,5
08
7,4
79
38,9
13
5,4
05
44
,13
3M
ark
eting
118,7
75
69,3
58
35,6
67
21,3
99
11,2
02
5,9
79
38,8
32
6,9
07
44
,43
9Fr
anchis
e F
ees
10,2
51
18,5
42
8,7
73
5,4
34
116
724
19,5
62
901
8,4
96
Pro
pert
y O
pera
tions &
Main
tenance
155,5
09
127,4
94
109,4
40
57,7
02
32,0
52
15,6
61
106,3
80
40,8
22
87
,78
0Energ
y267,7
55
192,8
68
138,5
87
100,7
13
51,2
73
51,8
40
108,1
65
99,0
76
13
8,7
49
Tota
l1,0
57,3
10
649,1
20
478,5
76
280,8
23
141,4
41
118,4
96
420,5
66
201,1
03
46
4,7
17
HO
US
E P
RO
FIT
1,7
27,3
90
1,0
06,4
90
738,8
71
333,5
66
126,4
24
109,8
45
325,1
78
132,7
29
67
1,3
96
FIX
ED
EX
PEN
SES
Pro
pert
y T
axe
s24,7
97
14,3
14
8,9
03
6,0
94
2,7
07
4,1
41
2,4
85
500
10
,03
1In
sura
nce
9,5
74
5,8
92
4,1
36
3,4
01
1,4
77
2,0
37
2,1
64
1,5
39
4,5
22
Oth
er
Fix
ed C
harg
es
46,7
04
16,2
36
24,2
16
12,0
18
7,2
64
7,7
72
4,7
63
7,0
50
18
,36
5R
ent
36,0
01
46,7
94
38,5
24
6,3
49
3,3
12
2,8
74
15,4
10
622
21
,78
4To
tal
117,0
76
83,3
53
75,7
79
27,8
61
14,7
59
16,8
24
24,8
22
14,2
10
54
,70
2N
ET I
NC
OM
E*
*R
s 1
,610,3
10
Rs 9
23,1
33
Rs 6
63,0
02
Rs 3
05,7
05
Rs 1
11,6
65
Rs 9
3,0
21
Rs 3
00,3
55
Rs 1
18,5
19
Rs 6
16
,69
4
* M
inor
opera
ted d
epart
ments
inclu
de:
laundry
, gift shop,
busin
ess c
entr
e,
new
s s
tand,
sport
s,
health c
lub,
gara
ge,
park
ing a
nd s
o f
ort
h
**
Net In
com
e is b
efo
re d
epre
cia
tion,
inte
rest paym
ents
and taxe
s
ID:
Insuff
icie
nt D
ata
TA
BL
E 1
-3:
Ind
ian
Ho
tel
Ind
ust
ry b
y S
tar
Cat
ego
ry:
Fin
anci
al R
epo
rt –
Am
ou
nt
Per
Av
aila
ble
Ro
om
(20
08-2
009)
Page 25
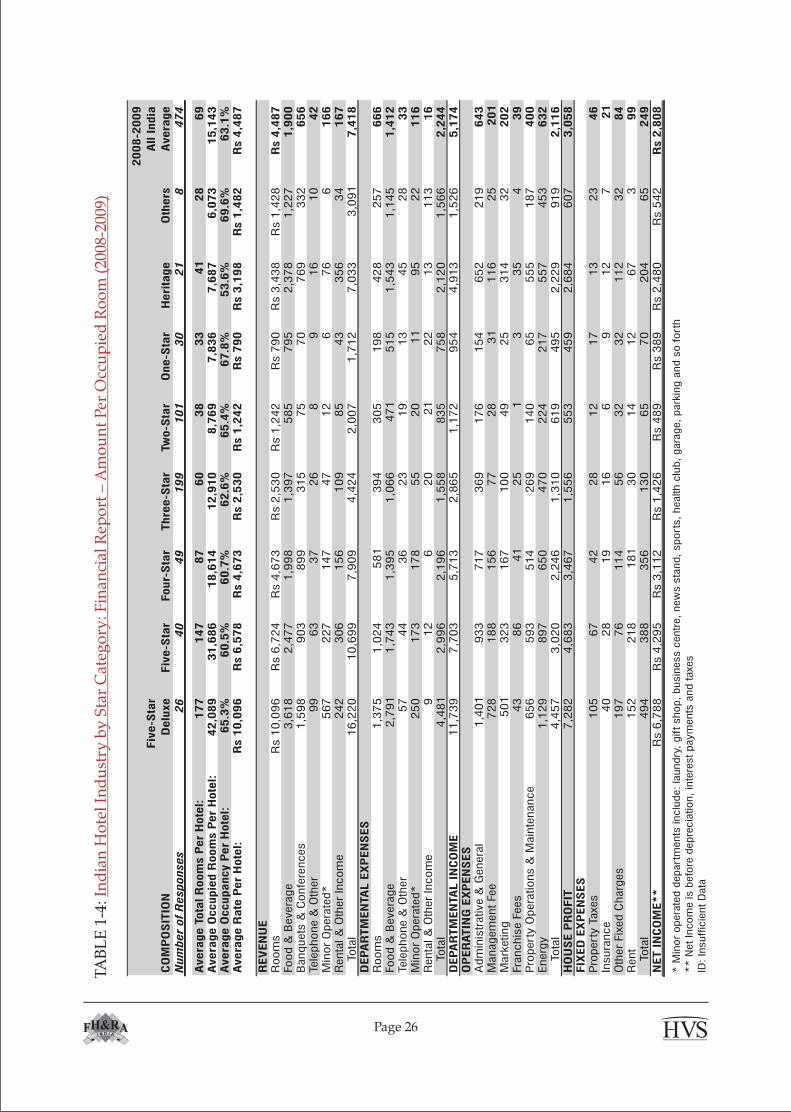
CO
MP
OS
ITIO
N
Fiv
e-S
tar
Delu
xe
Fiv
e-S
tar
Four-
Sta
rThre
e-S
tar
Two-S
tar
One-S
tar
Heri
tage
Oth
ers
20
08
-20
09
All I
ndia
Avera
ge
Num
ber
of
Responses
26
40
49
19
91
01
30
21
84
74
Avera
ge T
ota
l R
oom
s P
er
Hote
l:1
77
14
78
76
03
83
34
12
86
9A
vera
ge O
ccupie
d R
oom
s P
er
Hote
l:4
2,0
89
31
,68
61
8,6
14
12
,91
08
,76
97
,83
67
,68
76
,07
31
5,1
43
Avera
ge O
ccupancy P
er
Hote
l:6
5.3
%6
0.5
%6
0.7
%6
2.6
%6
5.4
%6
7.8
%5
3.6
%6
9.6
%6
3.1
%A
vera
ge R
ate
Per
Hote
l:R
s 1
0,0
96
Rs 6
,57
8R
s 4
,67
3R
s 2
,53
0R
s 1
,24
2R
s 7
90
Rs 3
,19
8R
s 1
,48
2R
s 4
,48
7
REV
EN
UE
Room
sR
s 1
0,0
96
Rs 6
,724
Rs 4
,673
Rs 2
,530
Rs 1
,242
Rs 7
90
Rs 3
,438
Rs 1
,428
Rs 4
,48
7Food &
Bevera
ge
3,6
18
2,4
77
1,9
98
1,3
97
585
795
2,3
78
1,2
27
1,9
00
Banquets
& C
onfe
rences
1,5
98
903
899
315
75
70
769
332
65
6Te
lephone &
Oth
er
99
63
37
26
89
16
10
42
Min
or
Opera
ted*
567
227
147
47
12
676
61
66
Renta
l &
Oth
er
Incom
e242
306
156
109
85
43
356
34
16
7To
tal
16,2
20
10,6
99
7,9
09
4,4
24
2,0
07
1,7
12
7,0
33
3,0
91
7,4
18
DEP
AR
TM
EN
TA
L E
XP
EN
SES
Room
s1,3
75
1,0
24
581
394
305
198
428
257
66
6Food &
Bevera
ge
2,7
91
1,7
43
1,3
95
1,0
66
471
515
1,5
43
1,1
45
1,4
12
Tele
phone &
Oth
er
57
44
36
23
19
13
45
28
33
Min
or
Opera
ted*
250
173
178
55
20
11
95
22
11
6R
enta
l &
Oth
er
Incom
e9
12
620
21
22
13
113
16
Tota
l4,4
81
2,9
96
2,1
96
1,5
58
835
758
2,1
20
1,5
66
2,2
44
DEP
AR
TM
EN
TA
L I
NC
OM
E11,7
39
7,7
03
5,7
13
2,8
65
1,1
72
954
4,9
13
1,5
26
5,1
74
OP
ER
ATIN
G E
XP
EN
SES
Adm
inis
trative &
Genera
l1,4
01
933
717
369
176
154
652
219
64
3M
anagem
ent Fee
728
188
156
77
28
31
116
25
20
1M
ark
eting
501
323
167
100
49
25
314
32
20
2Fra
nchis
e F
ees
43
86
41
25
13
35
43
9P
ropert
y O
pera
tions &
Main
tenance
656
593
514
269
140
65
555
187
40
0Energ
y1,1
29
897
650
470
224
217
557
453
63
2To
tal
4,4
57
3,0
20
2,2
46
1,3
10
619
495
2,2
29
919
2,1
16
HO
US
E P
RO
FIT
7,2
82
4,6
83
3,4
67
1,5
56
553
459
2,6
84
607
3,0
58
FIX
ED
EX
PEN
SES
Pro
pert
y T
axes
105
67
42
28
12
17
13
23
46
Insura
nce
40
28
19
16
69
12
72
1O
ther
Fix
ed C
harg
es
197
76
114
56
32
32
112
32
84
Rent
152
218
181
30
14
12
67
39
9To
tal
494
388
356
130
65
70
204
65
24
9N
ET I
NC
OM
E*
*R
s 6
,788
Rs 4
,295
Rs 3
,112
Rs 1
,426
Rs 4
89
Rs 3
89
Rs 2
,480
Rs 5
42
Rs 2
,80
8
* M
inor
opera
ted d
epart
ments
inclu
de:
laundry
, gift shop,
busin
ess c
entr
e,
new
s s
tand,
sport
s,
health c
lub,
gara
ge,
park
ing a
nd s
o f
ort
h
**
Net In
com
e is b
efo
re d
epre
cia
tion,
inte
rest paym
ents
and taxes
ID:
Insuff
icie
nt D
ata
TA
BL
E 1
-4:
Ind
ian
Ho
tel
Ind
ust
ry b
y S
tar
Cat
ego
ry:
Fin
anci
al R
epo
rt –
Am
ou
nt
Per
Occ
up
ied
Ro
om
(20
08-2
009)
Page 26
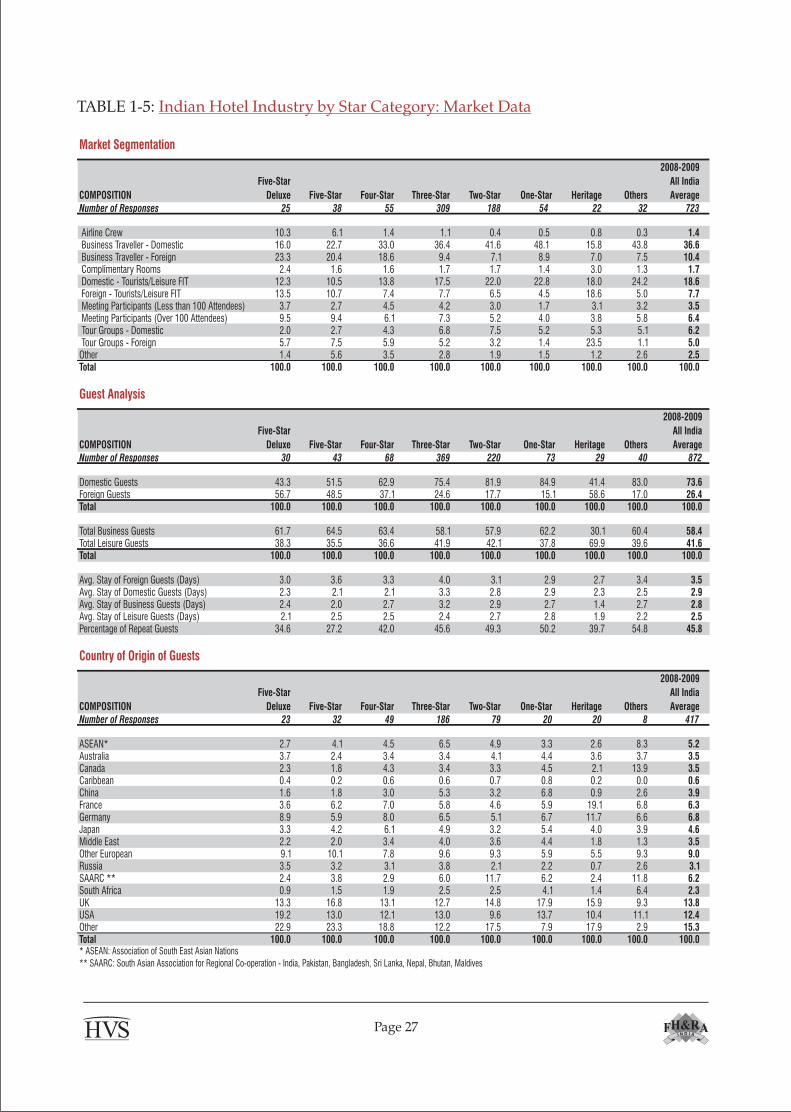
Market Segmentation
COMPOSITION
Five-Star
Deluxe Five-Star Four-Star Three-Star Two-Star One-Star Heritage Others
2008-2009
All India
AverageNumber of Responses 25 38 55 309 188 54 22 32 723
Airline Crew 10.3 6.1 1.4 1.1 0.4 0.5 0.8 0.3 1.4 Business Traveller - Domestic 16.0 22.7 33.0 36.4 41.6 48.1 15.8 43.8 36.6 Business Traveller - Foreign 23.3 20.4 18.6 9.4 7.1 8.9 7.0 7.5 10.4 Complimentary Rooms 2.4 1.6 1.6 1.7 1.7 1.4 3.0 1.3 1.7 Domestic - Tourists/Leisure FIT 12.3 10.5 13.8 17.5 22.0 22.8 18.0 24.2 18.6 Foreign - Tourists/Leisure FIT 13.5 10.7 7.4 7.7 6.5 4.5 18.6 5.0 7.7 Meeting Participants (Less than 100 Attendees) 3.7 2.7 4.5 4.2 3.0 1.7 3.1 3.2 3.5 Meeting Participants (Over 100 Attendees) 9.5 9.4 6.1 7.3 5.2 4.0 3.8 5.8 6.4 Tour Groups - Domestic 2.0 2.7 4.3 6.8 7.5 5.2 5.3 5.1 6.2 Tour Groups - Foreign 5.7 7.5 5.9 5.2 3.2 1.4 23.5 1.1 5.0Other 1.4 5.6 3.5 2.8 1.9 1.5 1.2 2.6 2.5Total 100.0 100.0 100.0 100.0 100.0 100.0 100.0 100.0 100.0
Guest Analysis
COMPOSITION
Five-Star
Deluxe Five-Star Four-Star Three-Star Two-Star One-Star Heritage Others
2008-2009
All India
AverageNumber of Responses 30 43 68 369 220 73 29 40 872
Domestic Guests 43.3 51.5 62.9 75.4 81.9 84.9 41.4 83.0 73.6Foreign Guests 56.7 48.5 37.1 24.6 17.7 15.1 58.6 17.0 26.4Total 100.0 100.0 100.0 100.0 100.0 100.0 100.0 100.0 100.0
Total Business Guests 61.7 64.5 63.4 58.1 57.9 62.2 30.1 60.4 58.4Total Leisure Guests 38.3 35.5 36.6 41.9 42.1 37.8 69.9 39.6 41.6Total 100.0 100.0 100.0 100.0 100.0 100.0 100.0 100.0 100.0
Avg. Stay of Foreign Guests (Days) 3.0 3.6 3.3 4.0 3.1 2.9 2.7 3.4 3.5Avg. Stay of Domestic Guests (Days) 2.3 2.1 2.1 3.3 2.8 2.9 2.3 2.5 2.9Avg. Stay of Business Guests (Days) 2.4 2.0 2.7 3.2 2.9 2.7 1.4 2.7 2.8Avg. Stay of Leisure Guests (Days) 2.1 2.5 2.5 2.4 2.7 2.8 1.9 2.2 2.5Percentage of Repeat Guests 34.6 27.2 42.0 45.6 49.3 50.2 39.7 54.8 45.8
Country of Origin of Guests
COMPOSITION
Five-Star
Deluxe Five-Star Four-Star Three-Star Two-Star One-Star Heritage Others
2008-2009
All India
Average
Number of Responses 23 32 49 186 79 20 20 8 417
ASEAN* 2.7 4.1 4.5 6.5 4.9 3.3 2.6 8.3 5.2Australia 3.7 2.4 3.4 3.4 4.1 4.4 3.6 3.7 3.5Canada 2.3 1.8 4.3 3.4 3.3 4.5 2.1 13.9 3.5Caribbean 0.4 0.2 0.6 0.6 0.7 0.8 0.2 0.0 0.6China 1.6 1.8 3.0 5.3 3.2 6.8 0.9 2.6 3.9France 3.6 6.2 7.0 5.8 4.6 5.9 19.1 6.8 6.3Germany 8.9 5.9 8.0 6.5 5.1 6.7 11.7 6.6 6.8Japan 3.3 4.2 6.1 4.9 3.2 5.4 4.0 3.9 4.6Middle East 2.2 2.0 3.4 4.0 3.6 4.4 1.8 1.3 3.5Other European 9.1 10.1 7.8 9.6 9.3 5.9 5.5 9.3 9.0Russia 3.5 3.2 3.1 3.8 2.1 2.2 0.7 2.6 3.1SAARC ** 2.4 3.8 2.9 6.0 11.7 6.2 2.4 11.8 6.2South Africa 0.9 1.5 1.9 2.5 2.5 4.1 1.4 6.4 2.3UK 13.3 16.8 13.1 12.7 14.8 17.9 15.9 9.3 13.8USA 19.2 13.0 12.1 13.0 9.6 13.7 10.4 11.1 12.4Other 22.9 23.3 18.8 12.2 17.5 7.9 17.9 2.9 15.3Total 100.0 100.0 100.0 100.0 100.0 100.0 100.0 100.0 100.0* ASEAN: Association of South East Asian Nations
** SAARC: South Asian Association for Regional Co-operation - India, Pakistan, Bangladesh, Sri Lanka, Nepal, Bhutan, Maldives
TABLE 1-5: Indian Hotel Industry by Star Category: Market Data
Page 27
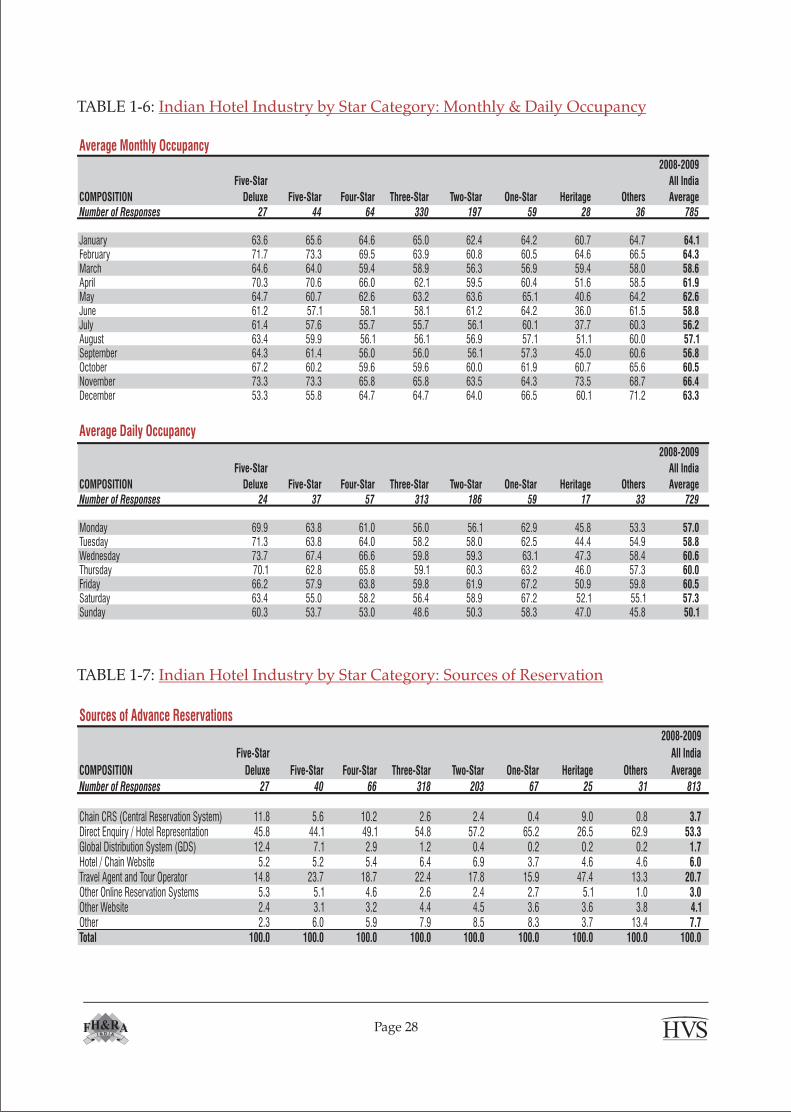
Page 28
TABLE 1-6: Indian Hotel Industry by Star Category: Monthly & Daily Occupancy
Average Monthly Occupancy
COMPOSITION
Five-Star
Deluxe Five-Star Four-Star Three-Star Two-Star One-Star Heritage Others
2008-2009
All India
Average
Number of Responses 27 44 64 330 197 59 28 36 785
January 63.6 65.6 64.6 65.0 62.4 64.2 60.7 64.7 64.1February 71.7 73.3 69.5 63.9 60.8 60.5 64.6 66.5 64.3March 64.6 64.0 59.4 58.9 56.3 56.9 59.4 58.0 58.6April 70.3 70.6 66.0 62.1 59.5 60.4 51.6 58.5 61.9May 64.7 60.7 62.6 63.2 63.6 65.1 40.6 64.2 62.6June 61.2 57.1 58.1 58.1 61.2 64.2 36.0 61.5 58.8July 61.4 57.6 55.7 55.7 56.1 60.1 37.7 60.3 56.2August 63.4 59.9 56.1 56.1 56.9 57.1 51.1 60.0 57.1September 64.3 61.4 56.0 56.0 56.1 57.3 45.0 60.6 56.8October 67.2 60.2 59.6 59.6 60.0 61.9 60.7 65.6 60.5November 73.3 73.3 65.8 65.8 63.5 64.3 73.5 68.7 66.4December 53.3 55.8 64.7 64.7 64.0 66.5 60.1 71.2 63.3
Average Daily Occupancy
COMPOSITION
Five-Star
Deluxe Five-Star Four-Star Three-Star Two-Star One-Star Heritage Others
2008-2009
All India
Average
Number of Responses 24 37 57 313 186 59 17 33 729
Monday 69.9 63.8 61.0 56.0 56.1 62.9 45.8 53.3 57.0Tuesday 71.3 63.8 64.0 58.2 58.0 62.5 44.4 54.9 58.8Wednesday 73.7 67.4 66.6 59.8 59.3 63.1 47.3 58.4 60.6Thursday 70.1 62.8 65.8 59.1 60.3 63.2 46.0 57.3 60.0Friday 66.2 57.9 63.8 59.8 61.9 67.2 50.9 59.8 60.5Saturday 63.4 55.0 58.2 56.4 58.9 67.2 52.1 55.1 57.3Sunday 60.3 53.7 53.0 48.6 50.3 58.3 47.0 45.8 50.1
Sources of Advance Reservations
COMPOSITION
Five-Star
Deluxe Five-Star Four-Star Three-Star Two-Star One-Star Heritage Others
2008-2009
All India
Average
Number of Responses 27 40 66 318 203 67 25 31 813
Chain CRS (Central Reservation System) 11.8 5.6 10.2 2.6 2.4 0.4 9.0 0.8 3.7Direct Enquiry / Hotel Representation 45.8 44.1 49.1 54.8 57.2 65.2 26.5 62.9 53.3Global Distribution System (GDS) 12.4 7.1 2.9 1.2 0.4 0.2 0.2 0.2 1.7Hotel / Chain Website 5.2 5.2 5.4 6.4 6.9 3.7 4.6 4.6 6.0Travel Agent and Tour Operator 14.8 23.7 18.7 22.4 17.8 15.9 47.4 13.3 20.7Other Online Reservation Systems 5.3 5.1 4.6 2.6 2.4 2.7 5.1 1.0 3.0Other Website 2.4 3.1 3.2 4.4 4.5 3.6 3.6 3.8 4.1Other 2.3 6.0 5.9 7.9 8.5 8.3 3.7 13.4 7.7Total 100.0 100.0 100.0 100.0 100.0 100.0 100.0 100.0 100.0
TABLE 1-7: Indian Hotel Industry by Star Category: Sources of Reservation

Payment Methods Used
COMPOSITION
Five-Star
Deluxe Five-Star Four-Star Three-Star Two-Star One-Star Heritage Others
2008-2009
All India
AverageNumber of Responses 17 37 62 316 189 62 28 32 743
Cash Sales 16.2% 18.4% 25.2% 40.4% 53.2% 68.6% 26.6% 64.9% 43.6%Credit Card Sales 45.4 36.8 39.3 33.6 28.4 19.5 24.7 21.5 31.1Credit Sales (other than cards) 33.9 39.1 32.8 21.2 14.6 9.7 45.1 11.6 21.4Electronic Fund Transfer 4.5 5.8 2.7 4.5 3.8 2.2 3.5 2.0 3.9Total 100.0 100.0 100.0 100.0 100.0 100.0 100.0 100.0 100.0
Credit Cards Used
COMPOSITION
Five-Star
Deluxe Five-Star Four-Star Three-Star Two-Star One-Star Heritage Others
2008-2009
All India
AverageNumber of Responses 18 39 57 282 140 39 23 19 617
American Express 36.2% 21.4% 15.5% 8.6% 4.3% 3.3% 10.8% 5.8% 9.5%Diners Club 2.9 2.5 4.0 2.7 1.4 3.6 1.3 0.8 2.5Mastercard / Eurocard 25.6 33.3 35.9 37.7 40.4 40.0 34.7 33.5 37.4Visa 33.7 37.8 42.3 46.5 49.1 51.4 46.3 50.5 46.2Other 1.6 5.0 2.4 4.6 4.8 1.6 6.9 9.4 4.4Total 100.0 100.0 100.0 100.0 100.0 100.0 100.0 100.0 100.0
Average Credit Card Commission
COMPOSITION
Five-Star
Deluxe Five-Star Four-Star Three-Star Two-Star One-Star Heritage Others
2008-2009
All India
Average
Number of Responses 17 34 52 212 101 24 19 9 468
American Express 3.3% 3.4% 3.0% 2.6% 2.0% 1.6% 3.5% 1.6% 2.6%Diners Club 1.9 1.4 1.1 0.7 0.4 0.4 0.2 0.3 0.7Mastercard / Eurocard 1.2 1.3 1.3 1.6 1.8 1.7 1.6 1.9 1.6Visa 1.2 1.3 1.3 1.6 1.8 1.7 1.6 1.9 1.6Other 0.2 0.3 0.1 0.3 0.3 0.0 0.1 0.5 0.3
Marketing Media - Percentage of Hotels Using Each Media
COMPOSITION
Five-Star
Deluxe Five-Star Four-Star Three-Star Two-Star One-Star Heritage Others
2008-2009
All India
AverageNumber of Responses 28 43 68 349 197 65 29 32 811
Consumer Generated Media (CGM) 28.6 16.3 8.8 7.5 5.1 0.0 13.8 6.3 7.8Direct Mail 85.7 79.1 82.4 83.4 72.1 70.8 86.2 71.9 79.0Hotel Website 100.0 97.7 92.7 87.4 73.1 58.5 96.6 59.4 82.2Loyalty Card program 92.9 88.4 51.5 30.1 16.8 9.2 27.6 12.5 31.4Merchandising 46.4 34.9 25.0 21.5 12.2 10.8 24.1 12.5 20.0Other Internet Site 87.6 69.8 66.2 60.2 55.8 47.7 82.8 43.8 59.9Outdoor Advertising 71.4 79.1 57.4 64.5 52.8 56.9 51.7 46.9 60.3Pay Per Click 25.0 11.6 2.9 7.7 3.6 1.5 17.2 6.3 6.9Print Advertising 96.4 95.4 85.3 88.5 85.8 81.5 89.7 56.3 86.4Promotions 96.4 90.7 83.8 67.9 48.7 43.1 82.8 40.6 64.2Radio Advertising 35.7 32.6 29.4 17.2 6.6 6.2 6.9 6.3 15.4Telemarketing 64.3 74.4 60.3 53.9 32.5 35.4 44.8 31.3 48.0TV Advertising 32.1 37.2 26.5 26.9 19.8 13.9 13.8 15.6 23.9Viral Marketing 17.9 9.3 1.5 7.2 2.5 4.6 13.8 12.5 6.3
TABLE 1-8: Indian Hotel Industry by Star Category: Marketing Media
TABLE 1-9: Indian Hotel Industry by Star Category: Payment Methods
Page 29
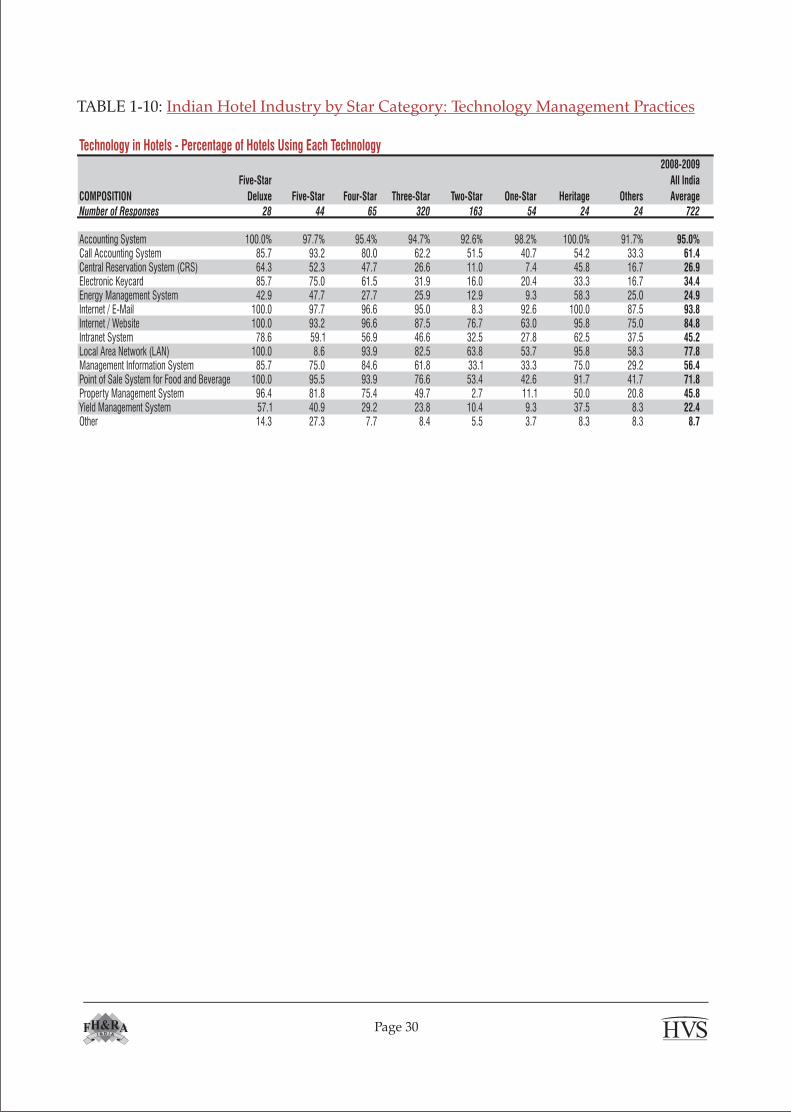
TABLE 1-10: Indian Hotel Industry by Star Category: Technology Management Practices
Technology in Hotels - Percentage of Hotels Using Each Technology
COMPOSITION
Five-Star
Deluxe Five-Star Four-Star Three-Star Two-Star One-Star Heritage Others
2008-2009
All India
AverageNumber of Responses 28 44 65 320 163 54 24 24 722
Accounting System 100.0% 97.7% 95.4% 94.7% 92.6% 98.2% 100.0% 91.7% 95.0%Call Accounting System 85.7 93.2 80.0 62.2 51.5 40.7 54.2 33.3 61.4Central Reservation System (CRS) 64.3 52.3 47.7 26.6 11.0 7.4 45.8 16.7 26.9Electronic Keycard 85.7 75.0 61.5 31.9 16.0 20.4 33.3 16.7 34.4Energy Management System 42.9 47.7 27.7 25.9 12.9 9.3 58.3 25.0 24.9Internet / E-Mail 100.0 97.7 96.6 95.0 8.3 92.6 100.0 87.5 93.8Internet / Website 100.0 93.2 96.6 87.5 76.7 63.0 95.8 75.0 84.8Intranet System 78.6 59.1 56.9 46.6 32.5 27.8 62.5 37.5 45.2Local Area Network (LAN) 100.0 8.6 93.9 82.5 63.8 53.7 95.8 58.3 77.8Management Information System 85.7 75.0 84.6 61.8 33.1 33.3 75.0 29.2 56.4Point of Sale System for Food and Beverage 100.0 95.5 93.9 76.6 53.4 42.6 91.7 41.7 71.8Property Management System 96.4 81.8 75.4 49.7 2.7 11.1 50.0 20.8 45.8Yield Management System 57.1 40.9 29.2 23.8 10.4 9.3 37.5 8.3 22.4Other 14.3 27.3 7.7 8.4 5.5 3.7 8.3 8.3 8.7
Page 30
2. Indian Hotel Industry – Chain Affiliation
Inventory and
Room Profile: Suites comprise a higher percentage of the total room inventory in the less than 50 rooms category (11%) as compared to that in the other categories. The reason for this maybe attributed to heritage properties, with low room inventory and higher number of suites, comprise a large proportion of this category
Facilities: There is a distinct difference in the facilities of hotels belonging to chains when compared to those belonging to independent owners. We observe chain hotels to have a higher room count (105) as compared to Independent (49) ones. Chain affiliated hotels also tend to have a higher count of F&B outlets (4.3) as compared to that of independent (3.0) ones.
Market Segmentation: Hotels under the Independent, less than 50 and 50 to 150 rooms categories show a heavy reliance on the domestic business and leisure traveller while the hotels in the chain and more than 150 rooms category tend to have a more diversified spread of target market. This may be attributed to the latter having access to these segments through better marketing and sales forums.
Performance: While hotels with a larger room inventory (more than 150 rooms) and those with chain affiliation tend to generally outperform the other categories in their occupancies through the year, a reverse trend is observed during the month of December. This may be attributed to the former having a larger reliance on international business, which tends to dip during this month on account of Christmas and New Year.
Marketing mode: There is a direct relationship between size of room inventory and electronic advertising, with the larger hotels relying more on the electronic media for marketing. However, there was not much difference in print advertising among the different categories.
Introduction
In this section, we present key operating and other data for the survey participants according to the number of rooms. The participating hotels have been classified into three categories: 'less than 50 rooms', 'between 50 and 150 rooms', and 'more than 150 rooms'. We have also drawn a comparison between chain affiliated and independent hotels.
Trends
Page 31
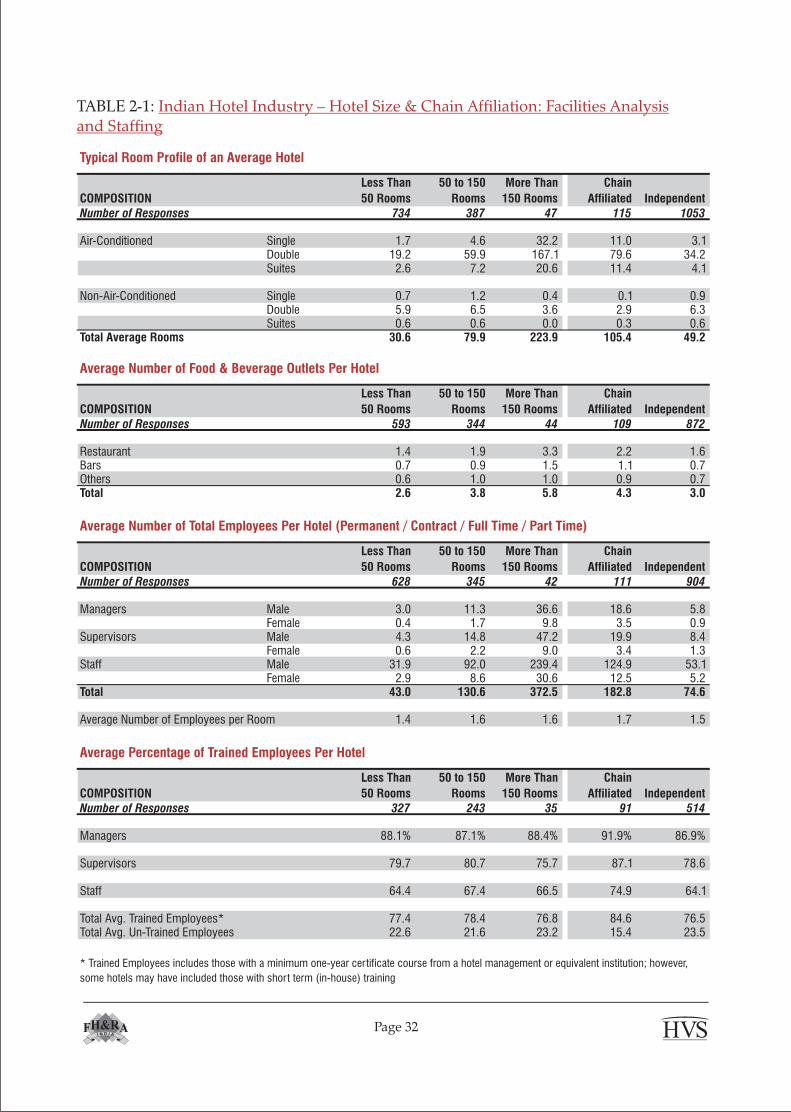
Typical Room Profile of an Average Hotel
COMPOSITION
Less Than
50 Rooms
50 to 150
Rooms
More Than
150 Rooms
Chain
Affiliated IndependentNumber of Responses 734 387 47 115 1053
Air-Conditioned Single 1.7 4.6 32.2 11.0 3.1Double 19.2 59.9 167.1 79.6 34.2Suites 2.6 7.2 20.6 11.4 4.1
Non-Air-Conditioned Single 0.7 1.2 0.4 0.1 0.9Double 5.9 6.5 3.6 2.9 6.3Suites 0.6 0.6 0.0 0.3 0.6
Total Average Rooms 30.6 79.9 223.9 105.4 49.2
Average Number of Food & Beverage Outlets Per Hotel
COMPOSITION
Less Than
50 Rooms
50 to 150
Rooms
More Than
150 Rooms
Chain
Affiliated IndependentNumber of Responses 593 344 44 109 872
Restaurant 1.4 1.9 3.3 2.2 1.6Bars 0.7 0.9 1.5 1.1 0.7Others 0.6 1.0 1.0 0.9 0.7Total 2.6 3.8 5.8 4.3 3.0
Average Number of Total Employees Per Hotel (Permanent / Contract / Full Time / Part Time)
COMPOSITION
Less Than
50 Rooms
50 to 150
Rooms
More Than
150 Rooms
Chain
Affiliated IndependentNumber of Responses 628 345 42 111 904
Managers Male 3.0 11.3 36.6 18.6 5.8Female 0.4 1.7 9.8 3.5 0.9
Supervisors Male 4.3 14.8 47.2 19.9 8.4Female 0.6 2.2 9.0 3.4 1.3
Staff Male 31.9 92.0 239.4 124.9 53.1Female 2.9 8.6 30.6 12.5 5.2
Total 43.0 130.6 372.5 182.8 74.6
Average Number of Employees per Room 1.4 1.6 1.6 1.7 1.5
Average Percentage of Trained Employees Per Hotel
COMPOSITION
Less Than
50 Rooms
50 to 150
Rooms
More Than
150 Rooms
Chain
Affiliated Independent
Number of Responses 327 243 35 91 514
Managers 88.1% 87.1% 88.4% 91.9% 86.9%
Supervisors 79.7 80.7 75.7 87.1 78.6
Staff 64.4 67.4 66.5 74.9 64.1
Total Avg. Trained Employees* 77.4 78.4 76.8 84.6 76.5Total Avg. Un-Trained Employees 22.6 21.6 23.2 15.4 23.5
* Trained Employees includes those with a minimum one-year certificate course from a hotel management or equivalent institution; however,
some hotels may have included those with short term (in-house) training
TABLE 2-1: Indian Hotel Industry – Hotel Size & Chain Affiliation: Facilities Analysis and Staffing
Page 32
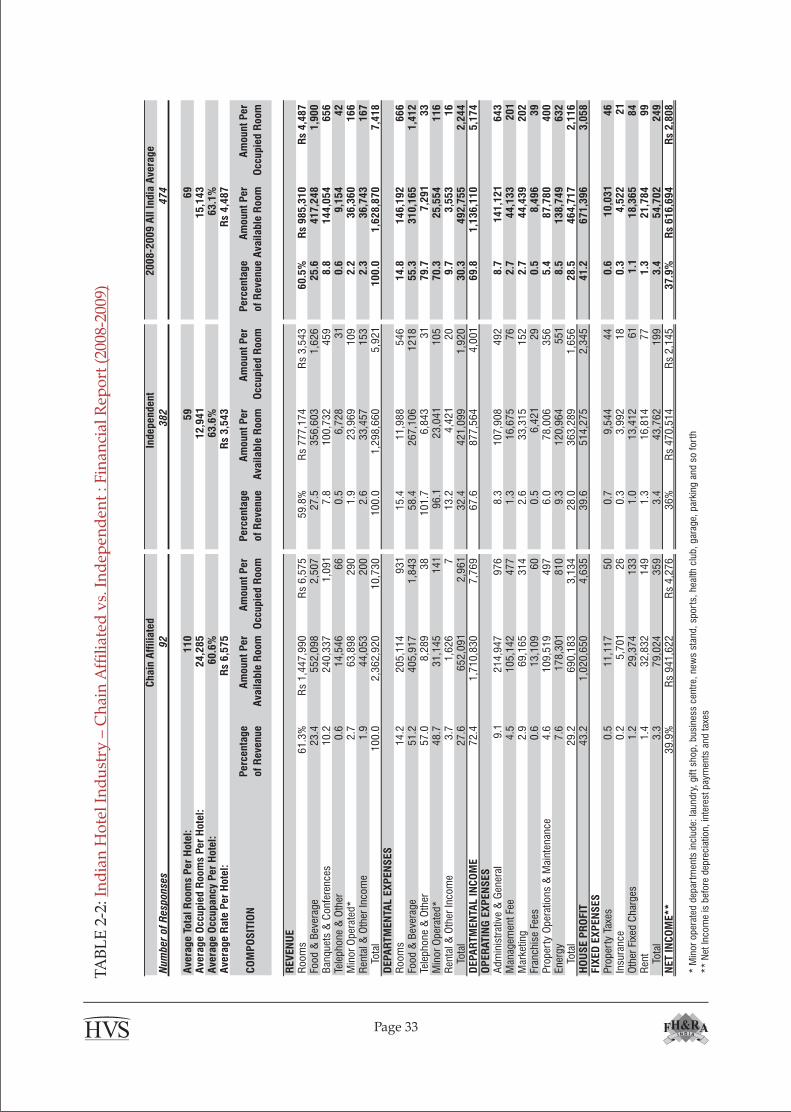
N
um
ber
of
Resp
onse
s92
382
474
Ave
rage T
ota
l R
oom
s P
er
Hote
l:110
59
69
Ave
rage O
ccupie
d R
oom
s P
er
Hote
l:24,2
85
12,9
41
15,1
43
Ave
rage O
ccupancy
Per
Hote
l:60.6
%63.6
%63.1
%A
vera
ge R
ate
Per
Hote
l:R
s 6,5
75
Rs
3,5
43
Rs
4,4
87
CO
MP
OS
ITIO
N P
erc
enta
ge
of
Reve
nue
Am
ount
Per
Ava
ilable
Room
Am
ount
Per
Occ
upie
d R
oom
Perc
enta
ge
of
Reve
nue
Am
ount
Per
Ava
ilable
Room
Am
ount
Per
Occ
upie
d R
oom
Perc
enta
ge
of
Reve
nue
Am
ount
Per
Ava
ilable
Room
Am
ount
Per
Occ
upie
d R
oom
REV
EN
UE
Room
s61.3
%R
s 1,4
47,9
90
Rs
6,5
75
59.8
%R
s 777,1
74
Rs
3,5
43
60.5
%R
s 985,3
10
Rs
4,4
87
Food &
Bev
erag
e23.4
552,0
98
2,5
07
27.5
356,6
03
1,6
26
25.6
417,2
48
1,9
00
Ban
quet
s &
Confe
rences
10.2
240,3
37
1,0
91
7.8
100,7
32
459
8.8
144,0
54
656
Tele
phone
& O
ther
0.6
14,5
46
66
0.5
6,7
28
31
0.6
9,1
54
42
Min
or
Oper
ated
*2.7
63,8
98
290
1.9
23,9
69
109
2.2
36,3
60
166
Ren
tal &
Oth
er Incom
e1.9
44,0
53
200
2.6
33,4
57
153
2.3
36,7
43
167
Tota
l100.0
2,3
62,9
20
10,7
30
100.0
1,2
98,6
60
5,9
21
100.0
1,6
28,8
70
7,4
18
DEPA
RTM
EN
TAL E
XP
EN
SES
Room
s14.2
205,1
14
931
15.4
11,9
88
546
14.8
146,1
92
666
Food &
Bev
erag
e51.2
405,9
17
1,8
43
58.4
267,1
06
1218
55.3
310,1
65
1,4
12
Tele
phone
& O
ther
57.0
8,2
89
38
101.7
6,8
43
31
79.7
7,2
91
33
Min
or
Oper
ated
*48.7
31,1
45
141
96.1
23,0
41
105
70.3
25,5
54
116
Ren
tal &
Oth
er Incom
e3.7
1,6
26
7
13.2
4,4
21
20
9.7
3,5
53
16
Tota
l27.6
652,0
91
2,9
61
32.4
421,0
99
1,9
20
30.3
492,7
55
2,2
44
DEPA
RTM
EN
TAL I
NC
OM
E72.4
1,7
10,8
30
7,7
69
67.6
877,5
64
4,0
01
69.8
1,1
36,1
10
5,1
74
OP
ER
ATIN
G E
XP
EN
SES
Adm
inis
trat
ive
& G
ener
al9.1
214,9
47
976
8.3
107,9
08
492
8.7
141,1
21
643
Man
agem
ent Fe
e4.5
105,1
42
477
1.3
16,6
75
76
2.7
44,1
33
201
Mar
ketin
g2.9
69,1
65
314
2.6
33,3
15
152
2.7
44,4
39
202
Fran
chis
e Fe
es0.6
13,1
09
60
0.5
6,4
21
29
0.5
8,4
96
39
Pro
per
ty O
per
atio
ns
& M
ainte
nan
ce
4.6
109,5
19
497
6.0
78,0
06
356
5.4
87,7
80
400
Ener
gy
7.6
178,3
01
810
9.3
120,9
64
551
8.5
138,7
49
632
Tota
l29.2
690,1
83
3,1
34
28.0
363,2
89
1,6
56
28.5
464,7
17
2,1
16
HO
US
E P
RO
FIT
43.2
1,0
20,6
50
4,6
35
39.6
514,2
75
2,3
45
41.2
671,3
96
3,0
58
FIX
ED
EX
PEN
SES
Pro
per
ty T
axes
0.5
11,1
17
50
0.7
9,5
44
44
0.6
10,0
31
46
Insu
rance
0.2
5,7
01
26
0.3
3,9
92
18
0.3
4,5
22
21
Oth
er F
ixed
Char
ges
1.2
29,3
74
133
1.0
13,4
12
61
1.1
18,3
65
84
Ren
t 1.4
32,8
32
149
1.3
16,8
14
77
1.3
21,7
84
99
Tota
l3.3
79,0
24
359
3.4
43,7
62
199
3.4
54,7
02
249
NET I
NC
OM
E**
39.9
%R
s 941,6
22
Rs
4,2
76
36%
Rs
470,5
14
Rs
2,1
45
37.9
%R
s 616,6
94
Rs
2,8
08
* M
inor
oper
ated
dep
artm
ents
inclu
de:
laundry
, gift sh
op,
busi
nes
s cen
tre,
new
s st
and,
sport
s, h
ealth
clu
b,
gar
age,
par
king a
nd s
o f
ort
h
**
Net
Incom
e is
bef
ore
dep
recia
tion,
inte
rest
pay
men
ts a
nd tax
es
Chain
Aff
ilia
ted
Independent
2008-2
009 A
ll I
ndia
Ave
rage
TA
BL
E 2
-2:
Ind
ian
Ho
tel
Ind
ust
ry –
Ch
ain
Aff
ilia
ted
vs.
In
dep
end
ent
: F
inan
cial
Rep
ort
(20
08-2
009)
Page 33

Le
ss T
han
50 R
oom
s
50
to 1
50
Roo
ms
Mor
e Th
an
150
Roo
ms
2008
-200
9
All
Indi
a
Ave
rage
Less
Tha
n 50
Roo
ms
50
to 1
50
Roo
ms
Mor
e Th
an 1
50
Roo
ms
2008
-200
9 A
ll
Indi
a A
vera
ge
Less
Tha
n
50 R
oom
s
50
to 1
50
Roo
ms
Mor
e Th
an
150
Roo
ms
2008
-200
9
All
Indi
a
Ave
rage
Num
ber
of R
espo
nses
237
203
3447
423
720
334
474
237
203
3447
4
Ave
rage
Tot
al R
oom
s P
er H
otel
:32
8622
569
3286
225
6932
8622
569
Ave
rage
Occ
upie
d R
oom
s P
er H
otel
:6,
965
18,6
8950
,849
15,1
436,
965
18,6
8950
,849
15,1
436,
965
18,6
8950
,849
15,1
43A
vera
ge O
ccup
ancy
Per
Hot
el:
62.7
%63
.1%
64.7
%63
.1%
62.7
%63
.1%
64.7
%63
.1%
62.7
%63
.1%
64.7
%63
.1%
Ave
rage
Rat
e P
er H
otel
:R
s 2,
101
Rs
4,06
9R
s 7,
694
Rs
4,48
7R
s 2,
101
Rs
4,06
9R
s 7,
694
Rs
4,48
7R
s 2,
101
Rs
4,06
9R
s 7,
694
Rs
4,48
7
REV
ENU
ER
oom
s55
.3%
60.6
%61
.9%
60.5
%R
s 45
2,41
0R
s 88
7,89
9R
s 1,
740,
370
Rs
985,
310
Rs
2,10
1R
s 4,
069
Rs
7,69
4R
s 4,
487
Food
& B
ever
age
34.8
26.2
22.2
25.6
284,
732
38
4,67
7
62
3,80
8
41
7,24
81,
322
1,
763
2,
758
1,
900
Ban
quet
s &
Con
fere
nces
5.4
8.4
10.4
8.8
44,1
30
12
3,12
0
29
1,74
8
14
4,05
420
5
56
4
1,
290
65
6Te
leph
one
& O
ther
0.3
0.5
0.7
0.6
2,72
3
7,44
2
19,4
91
9,
154
13
34
86
42
Min
or O
pera
ted*
1.1
1.8
3.0
2.2
9,25
2
26
,722
85,4
35
36
,360
43
12
2
37
8
16
6R
enta
l & O
ther
Inco
me
3.1
2.5
1.8
2.3
25,2
48
36,0
81
49,7
38
36
,743
117
16
5
22
0
16
7To
tal
100.
010
0.0
100.
010
0.0
818,
496
1,
465,
940
2,
810,
590
1,
628,
870
3,80
1
6,
718
12
,425
7,
418
DEP
AR
TMEN
TAL
EXP
ENS
ESR
oom
s21
.015
.312
.714
.895
,127
13
5,54
3
22
1,20
7
14
6,19
244
2
62
1
97
8
66
6Fo
od &
Bev
erag
e65
.557
.648
.455
.321
5,33
1
29
2,22
5
44
3,47
9
31
0,16
51,
000
1,
339
1,
961
1,
412
Tele
phon
e &
Oth
er21
3.4
80.6
59.7
79.7
5,81
3
5,99
9
11,6
38
7,
291
27
27
51
33
Min
or O
pera
ted*
103.
566
.069
.570
.39,
577
17
,638
59,4
05
25
,554
44
81
26
3
11
6R
enta
l & O
ther
Inco
me
28.0
6.8
5.2
9.7
7,05
9
2,44
0
2,56
7
3,
553
33
11
11
16
Tota
l40
.731
.026
.330
.333
2,90
7
45
3,84
4
73
8,29
5
49
2,75
51,
546
2,
080
3,
264
2,
244
DEP
AR
TMEN
TAL
INC
OM
E59
.369
.073
.769
.848
5,58
9
1,
012,
100
2,
072,
300
1,
136,
110
2,25
5
4,
638
9,
161
5,
174
OP
ERAT
ING
EX
PEN
SES
Adm
inis
trat
ive
& G
ener
al7.
910
.56.
78.
765
,006
15
4,22
0
18
7,75
3
14
1,12
130
2
70
7
83
0
64
3M
anag
emen
t Fee
2.4
2.8
3.5
2.7
17,5
18
38
,077
84,5
58
44
,133
81
17
4
37
4
20
1M
arke
ting
2.6
2.3
3.3
2.7
21,5
06
33
,044
93,1
12
44
,439
100
15
1
41
2
20
2Fr
anch
ise
Fees
0.4
0.5
0.6
0.5
3,03
4
6,73
2
17,9
15
8,
496
14
31
79
39
Prop
erty
Ope
ratio
ns &
Mai
nten
ance
6.2
5.7
4.8
5.4
51,0
14
83
,532
13
4,22
6
87
,780
237
38
3
59
3
40
0En
ergy
9.8
9.0
7.5
8.5
80,1
95
13
2,51
0
21
1,98
6
13
8,74
937
2
60
7
93
7
63
2To
tal
29.4
30.8
26.5
28.5
238,
274
44
8,11
5
72
9,54
9
46
4,71
71,
107
2,
054
3,
225
2,
116
HO
US
E P
RO
FIT
30.0
38
.3
47
.2
41.2
247,
314
56
3,98
1
1,
342,
750
67
1,39
61,
149
2,
584
5,
936
3,
058
FIX
ED E
XP
ENS
ESPr
oper
ty T
axes
0.5
0.6
0.6
0.6
4,43
5
9,21
0
17,5
03
10
,031
21
42
77
46
Insu
ranc
e0.
40.
30.
30.
33,
002
4,10
0
7,00
2
4,
522
14
19
31
21
Oth
er F
ixed
Cha
rges
1.4
1.4
0.8
1.1
11,0
81
19
,763
22,4
72
18
,365
51
91
99
84
Ren
t 0.
91.
11.
81.
37,
287
15
,744
50,0
42
21
,784
34
72
22
1
99
Tota
l3.
23.
33.
53.
425
,804
48
,816
97,0
19
54
,702
120
22
4
42
9
24
9N
ET IN
CO
ME*
*26
.8%
35.0
%43
.8%
37.9
%R
s 22
1,51
0R
s 51
5,16
5R
s 1,
245,
730
Rs
616,
694
Rs
1,02
9R
s 2,
361
Rs
5,50
7R
s 2,
808
* M
inor
ope
rate
d de
part
men
ts in
clud
e: la
undr
y, g
ift s
hop,
bus
ines
s ce
ntre
, new
s st
and,
spo
rts,
hea
lth c
lub,
gar
age,
par
king
and
so
fort
h
** N
et In
com
e is
bef
ore
depr
ecia
tion,
inte
rest
pay
men
ts a
nd ta
xesP
erce
ntag
e of
Rev
enue
Am
ount
Per
Ava
ilabl
e R
oom
Am
ount
Per
Occ
upie
d R
oom
TA
BL
E 2
-3:
Ind
ian
Ho
tel
Ind
ust
ry –
Ho
tel
Siz
e :
Fin
anci
al R
epo
rt (
2008
-200
9)
Page 34
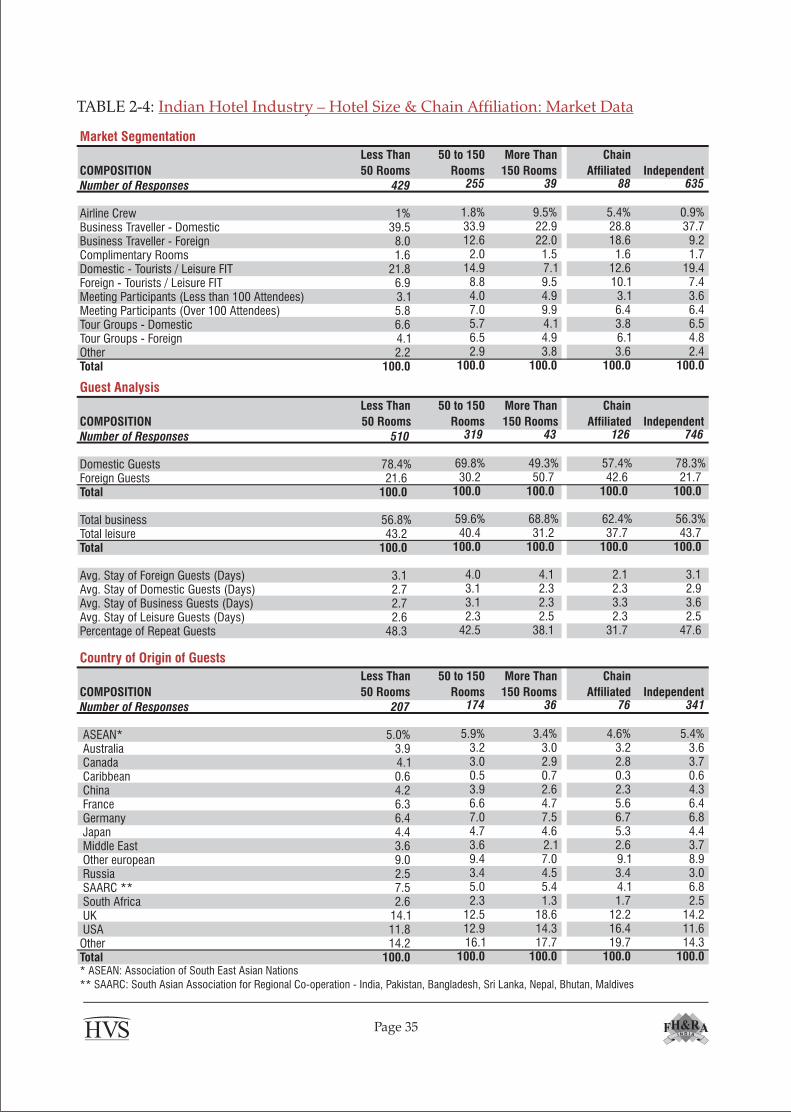
Page 35
TABLE 2-4: Indian Hotel Industry – Hotel Size & Chain Affiliation: Market Data
Market Segmentation
COMPOSITION
Less Than
50 Rooms
50 to 150
Rooms
More Than
150 Rooms
Chain
Affiliated Independent
Number of Responses 429 255 39 88 635
Airline Crew 1% 1.8% 9.5% 5.4% 0.9%
Business Traveller - Domestic 39.5 33.9 22.9 28.8 37.7
Business Traveller - Foreign 8.0 12.6 22.0 18.6 9.2
Complimentary Rooms 1.6 2.0 1.5 1.6 1.7
Domestic - Tourists / Leisure FIT 21.8 14.9 7.1 12.6 19.4
Foreign - Tourists / Leisure FIT 6.9 8.8 9.5 10.1 7.4
Meeting Participants (Less than 100 Attendees) 3.1 4.0 4.9 3.1 3.6
Meeting Participants (Over 100 Attendees) 5.8 7.0 9.9 6.4 6.4
Tour Groups - Domestic 6.6 5.7 4.1 3.8 6.5
Tour Groups - Foreign 4.1 6.5 4.9 6.1 4.8
Other 2.2 2.9 3.8 3.6 2.4
Total 100.0 100.0 100.0 100.0 100.0
Guest Analysis
COMPOSITION
Less Than
50 Rooms
50 to 150
Rooms
More Than
150 Rooms
Chain
Affiliated IndependentNumber of Responses 510 319 43 126 746
Domestic Guests 78.4% 69.8% 49.3% 57.4% 78.3%Foreign Guests 21.6 30.2 50.7 42.6 21.7Total 100.0 100.0 100.0 100.0 100.0
Total business 56.8% 59.6% 68.8% 62.4% 56.3%Total leisure 43.2 40.4 31.2 37.7 43.7Total 100.0 100.0 100.0 100.0 100.0
Avg. Stay of Foreign Guests (Days) 3.1 4.0 4.1 2.1 3.1Avg. Stay of Domestic Guests (Days) 2.7 3.1 2.3 2.3 2.9Avg. Stay of Business Guests (Days) 2.7 3.1 2.3 3.3 3.6Avg. Stay of Leisure Guests (Days) 2.6 2.3 2.5 2.3 2.5Percentage of Repeat Guests 48.3 42.5 38.1 31.7 47.6
Country of Origin of Guests
COMPOSITION
Less Than
50 Rooms
50 to 150
Rooms
More Than
150 Rooms
Chain
Affiliated Independent
Number of Responses 207 174 36 76 341
ASEAN* 5.0% 5.9% 3.4% 4.6% 5.4%
Australia 3.9 3.2 3.0 3.2 3.6 Canada 4.1 3.0 2.9 2.8 3.7 Caribbean 0.6 0.5 0.7 0.3 0.6 China 4.2 3.9 2.6 2.3 4.3 France 6.3 6.6 4.7 5.6 6.4 Germany 6.4 7.0 7.5 6.7 6.8 Japan 4.4 4.7 4.6 5.3 4.4 Middle East 3.6 3.6 2.1 2.6 3.7 Other european 9.0 9.4 7.0 9.1 8.9 Russia 2.5 3.4 4.5 3.4 3.0 SAARC ** 7.5 5.0 5.4 4.1 6.8 South Africa 2.6 2.3 1.3 1.7 2.5 UK 14.1 12.5 18.6 12.2 14.2
USA 11.8 12.9 14.3 16.4 11.6
Other 14.2 16.1 17.7 19.7 14.3
Total 100.0 100.0 100.0 100.0 100.0* ASEAN: Association of South East Asian Nations
** SAARC: South Asian Association for Regional Co-operation - India, Pakistan, Bangladesh, Sri Lanka, Nepal, Bhutan, Maldives
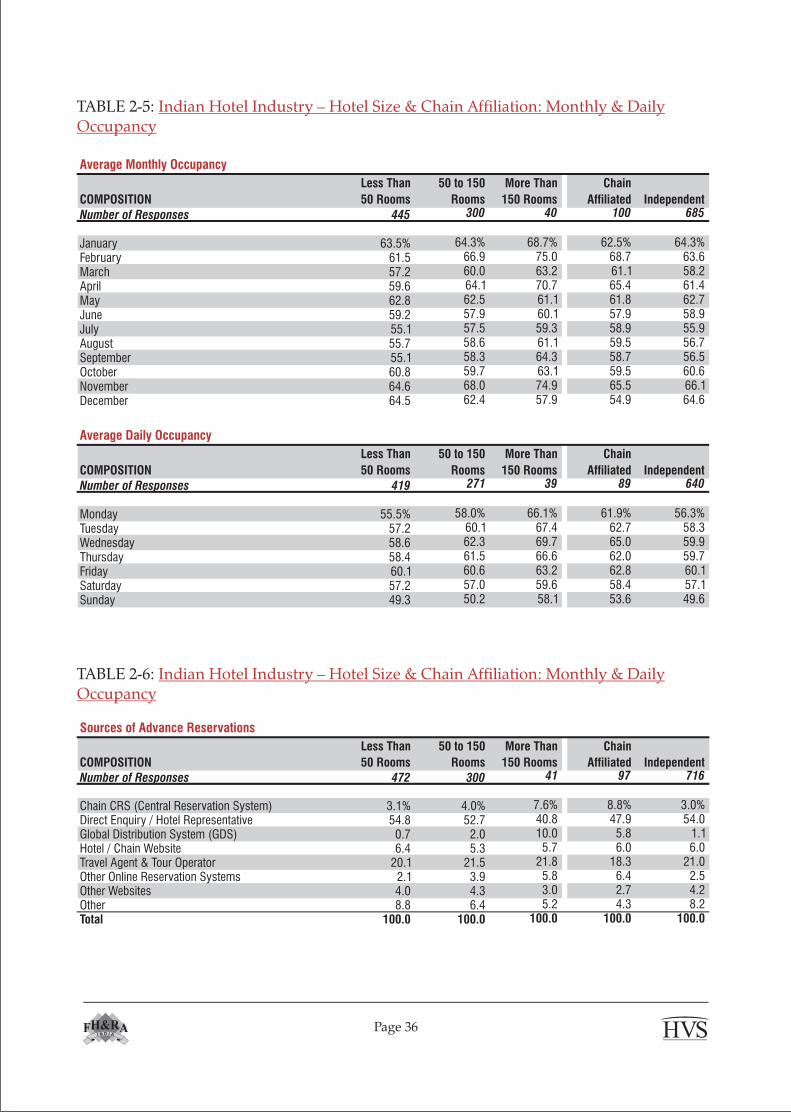
TABLE 2-5: Indian Hotel Industry – Hotel Size & Chain Affiliation: Monthly & Daily Occupancy
Average Monthly Occupancy
COMPOSITION
Less Than
50 Rooms
50 to 150
Rooms
More Than
150 Rooms
Chain
Affiliated Independent
Number of Responses 445 300 40 100 685
January 63.5% 64.3% 68.7% 62.5% 64.3%
February 61.5 66.9 75.0 68.7 63.6
March 57.2 60.0 63.2 61.1 58.2
April 59.6 64.1 70.7 65.4 61.4
May 62.8 62.5 61.1 61.8 62.7
June 59.2 57.9 60.1 57.9 58.9
July 55.1 57.5 59.3 58.9 55.9
August 55.7 58.6 61.1 59.5 56.7
September 55.1 58.3 64.3 58.7 56.5
October 60.8 59.7 63.1 59.5 60.6
November 64.6 68.0 74.9 65.5 66.1
December 64.5 62.4 57.9 54.9 64.6
Average Daily Occupancy
COMPOSITION
Less Than
50 Rooms
50 to 150
Rooms
More Than
150 Rooms
Chain
Affiliated Independent
Number of Responses 419 271 39 89 640
Monday 55.5% 58.0% 66.1% 61.9% 56.3%
Tuesday 57.2 60.1 67.4 62.7 58.3
Wednesday 58.6 62.3 69.7 65.0 59.9
Thursday 58.4 61.5 66.6 62.0 59.7
Friday 60.1 60.6 63.2 62.8 60.1
Saturday 57.2 57.0 59.6 58.4 57.1
Sunday 49.3 50.2 58.1 53.6 49.6
TABLE 2-6: Indian Hotel Industry – Hotel Size & Chain Affiliation: Monthly & Daily Occupancy
Sources of Advance Reservations
COMPOSITION
Less Than
50 Rooms
50 to 150
Rooms
More Than
150 Rooms
Chain
Affiliated IndependentNumber of Responses 472 300 41 97 716
Chain CRS (Central Reservation System) 3.1% 4.0% 7.6% 8.8% 3.0%
Direct Enquiry / Hotel Representative 54.8 52.7 40.8 47.9 54.0Global Distribution System (GDS) 0.7 2.0 10.0 5.8 1.1
Hotel / Chain Website 6.4 5.3 5.7 6.0 6.0Travel Agent & Tour Operator 20.1 21.5 21.8 18.3 21.0
Other Online Reservation Systems 2.1 3.9 5.8 6.4 2.5Other Websites 4.0 4.3 3.0 2.7 4.2
Other 8.8 6.4 5.2 4.3 8.2Total 100.0 100.0 100.0 100.0 100.0
Page 36

Payment Methods Used
COMPOSITION
Less Than
50 Rooms
50 to 150
Rooms
More Than
150 Rooms
Chain
Affiliated Independent
Number of Responses 434 275 34 84 659
Cash Sales 51.1% 34.6% 20.3% 21.7% 46.4%
Credit Card Sales 27.8 35.0 42.4 39.3 30.1 Credit Sales (Other Than Cards) 17.2 26.6 32.5 35.6 19.6 Electronic Fund Transfer 3.8 3.9 4.7 3.3 4.0 Total 100.0 100.0 100.0 100.0 100.0
Credit Cards Used
COMPOSITION
Less Than
50 Rooms
50 to 150
Rooms
More Than
150 Rooms
Chain
Affiliated Independent
Number of Responses 336 248 33 86 531
American Express 5.5% 13.0% 25.0% 20.9% 7.7%Diners club 2.1 2.9 3.3 2.8 2.4Mastercard/Eurocard 38.9 36.5 29.3 31.1 38.4Visa 49.0 43.5 38.3 40.3 47.1
Other 4.6 4.2 4.1 4.9 4.4Total 100.0 100.0 100.0 100.0 100.0
Average Credit Card Commission
COMPOSITION
Less Than
50 Rooms
50 to 150
Rooms
More Than
150 Rooms
Chain
Affiliated Independent
Number of Responses 241 200 27 75 393
American Express 2.2 2.9 3.0 3.3 2.4
Diners club 0.5 0.9 1.5 1.2 0.6Mastercard/Eurocard 1.7 1.5 1.2 1.3 1.6
Visa 1.7 1.5 1.3 1.3 1.6
Other 0.2 0.3 0.2 0.3 0.3
Marketing Media - Percentage of Hotels Using Each Media
COMPOSITION
Less Than
50 Rooms
50 to 150
Rooms
More Than
150 Rooms
Chain
Affiliated Independent
Number of Responses 464 303 44 90 524
Consumer Generated Media (CGM) 6.7% 9.2% 9.1% 15.4% 6.7%Direct Mail 76.3 82.5 84.1 81.7 78.6Hotel Web site 75.4 90.4 97.7 84.2 80.5
Loyalty Card Program 20.9 40.6 79.6 71.2 25.6
Merchandising 14.7 25.1 40.9 32.7 18.1
Other Internet Site 55.6 64.7 72.7 70.2 58.4
Outdoor Advertising 58.0 63.4 63.6 69.2 59.0
Pay Per Click 5.6 7.9 13.6 10.6 6.4
Print Advertising 84.7 88.8 88.6 92.3 85.6
Promotions 55.8 73.3 90.9 93.3 60.0
Radio Advertising 9.5 21.1 38.6 24.0 14.1
Telemarketing 37.9 60.7 65.9 61.5 46.0
TV Advertising 20.0 28.1 36.4 30.8 22.9
Viral Marketing 5.8 6.6 9.1 9.6 5.8
TABLE 2-7: Indian Hotel Industry – Hotel Size & Chain Affiliation: Marketing Media
TABLE 2-8: Indian Hotel Industry – Hotel Size & Chain Affiliation: Payment Methods
Page 37

TABLE 2-9: Indian Hotel Industry – Hotel Size & Chain Affiliation: Technology Management Practices
Technology in Hotels - Percentage of Hotels Using Each Technology
COMPOSITION
Less Than
50 Rooms
50 to 150
Rooms
More Than
150 Rooms
Chain
Affiliated Independent
Number of Responses 392 286 44 100 622
Accounting System 92.6% 97.9% 97.7% 90.0% 95.0%
Call Accounting System 51.5 71.7 81.8 80.0 58.4
Central Reservation System (CRS) 16.8 36.7 52.3 66.0 20.6
Electronic Keycard 21.9 44.1 81.8 67.0 29.1
Energy Management System 19.4 30.4 38.6 45.0 21.7
Internet / E-Mail 91.3 96.5 97.7 96.0 93.4
Internet / Website 79.9 89.9 95.5 93.0 83.4
Intranet System 37.5 52.1 68.2 70.0 41.2
Local Area Network (LAN) 70.4 85.3 95.5 92.0 75.6
Management Information System 43.1 71.3 77.3 79.0 52.7
Point of Sale System for Food and Beverage 60.5 83.9 93.2 94.0 68.2
Property Management System 29.1 62.9 84.1 82.0 40.0
Yield Management System 16.1 27.6 45.5 40.0 19.6
Other 5.1 12.2 18.2 9.0 8.7
Page 38
Revenue Per Available Room (Rev PAR): While Bangalore leads all cities in overall revPAR followed closely by Mumbai and Delhi, we observe that it's room costs (PAR) are amongst the highest in the country and this may lead to a sharp erosion of profitability in times of lower average room rates, as are expected in the coming years.
F&B Outlets: Goan hotels continue having the highest proportion of bars per hotel in the country. This may be attributed to Goa being the primary holiday/party destination in India.
Foreign Guests: Kolkata has the lowest percentage of foreign guests visiting the city as compared to other major cities in the country. Considering that the city is steeped in history, has a rich culture and is also the gateway city to eastern India, this low visitation seems to be an anomaly. This may be attributed to the lack of an effective campaign and support from the state tourism department. Political instability, red tapism, and security concerns in the region further aggravate the situation.
Marketing Media: Despite the widespread success of IT&ES companies in India, we notice a slow rate of adoption of media such as CGM, Pay Per Click and Viral Marketing in the larger cities. While the countrywide adoption of these media is slowly increasing, hotels in primary cities should be more aggressive in adopting these media in order to reach out to their target client base and also expand their existing base.
Country of Origin: The country of origin of travellers indicates the primary feeder market for cities such as Goa have a predominance of travellers from UK while Bangalore has visitors from the US. Similarly Pune has a predominance of Other European and Germans, which is in line with the type of manufacturing taking place in Pune.
Introduction
In this section, we present the operating profiles and financial data for different categories of hotels in seven major cities: Bangalore, Chennai, Goa, Kolkata, Mumbai, New Delhi-NCR and Pune. This section will give the reader an understanding of hotel performance in these cities.
Key Trends
The key trends noted in the 2008/09 survey across the seven major participating cities are presented below.
3. Indian Hotel Industry – Seven Major Cities
Page 39
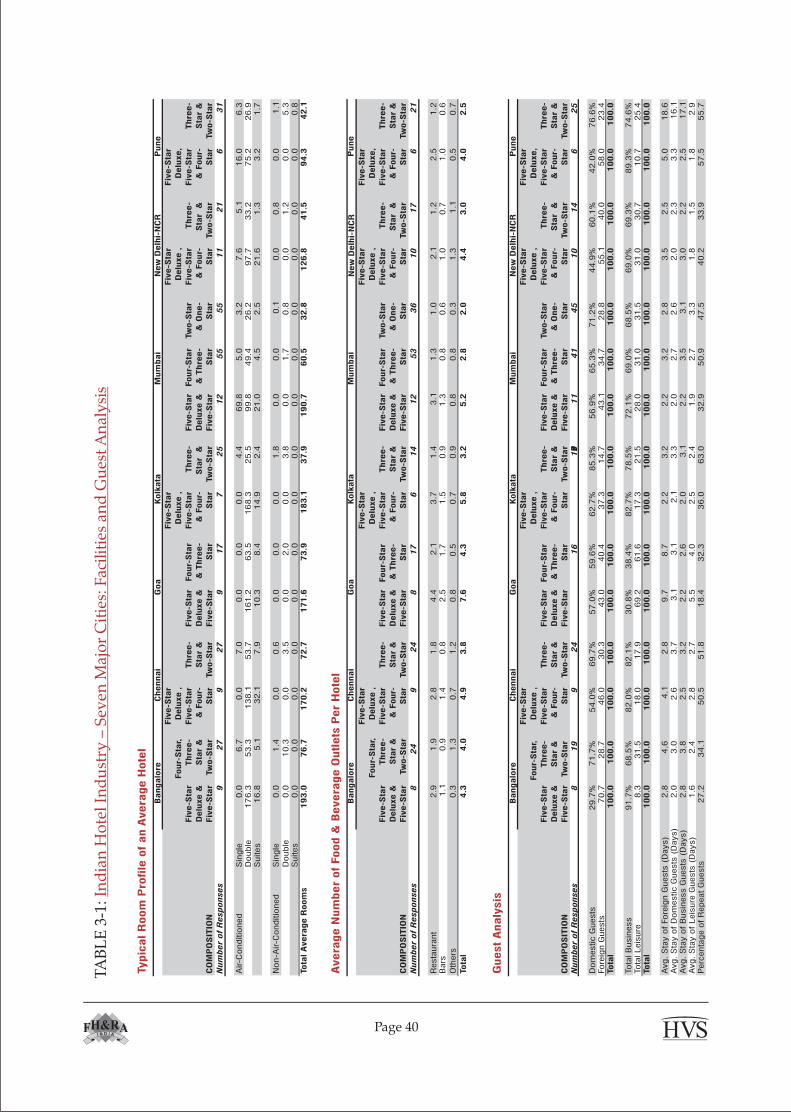
TA
BL
E 3
-1:
Ind
ian
Ho
tel
Ind
ust
ry –
Sev
en M
ajo
r C
itie
s: F
acil
itie
s an
d G
ues
t A
nal
ysi
s
Typic
al R
oom
Pro
file
of
an A
vera
ge H
ote
l
CO
MP
OS
ITIO
N
Fiv
e-S
tar
Delu
xe &
Fiv
e-S
tar
Four-
Sta
r,
Thre
e-
Sta
r &
Tw
o-S
tar
Fiv
e-S
tar
Delu
xe ,
Fiv
e-S
tar
& F
our-
Sta
r
Thre
e-
Sta
r &
Tw
o-S
tar
Fiv
e-S
tar
Delu
xe &
Fiv
e-S
tar
Four-
Sta
r
& T
hre
e-
Sta
r
Fiv
e-S
tar
Delu
xe ,
Fiv
e-S
tar
& F
our-
Sta
r
Thre
e-
Sta
r &
Tw
o-S
tar
Fiv
e-S
tar
Delu
xe &
Fiv
e-S
tar
Four-
Sta
r
& T
hre
e-
Sta
r
Tw
o-S
tar
& O
ne-
Sta
r
Fiv
e-S
tar
Delu
xe ,
Fiv
e-S
tar
& F
our-
Sta
r
Thre
e-
Sta
r &
Tw
o-S
tar
Fiv
e-S
tar
Delu
xe,
Fiv
e-S
tar
& F
our-
Sta
r
Thre
e-
Sta
r &
Tw
o-S
tar
Num
ber
of
Responses
92
79
27
91
77
25
12
55
55
11
21
63
1
Air-C
onditio
ned
Sin
gle
0.0
6.7
0.0
7.0
0.0
0.0
0.0
4.4
69.8
5.0
3.2
7.6
5.1
16.0
6.3
Double
176.3
53.3
138.1
53.7
161.2
63.5
168.3
25.5
99.8
49.4
26.2
97.7
33.2
75.2
26.9
Suites
16.8
5.1
32.1
7.9
10.3
8.4
14.9
2.4
21.0
4.5
2.5
21.6
1.3
3.2
1.7
Non-A
ir-C
onditio
ned
Sin
gle
0.0
1.4
0.0
0.6
0.0
0.0
0.0
1.8
0.0
0.0
0.1
0.0
0.8
0.0
1.1
Double
0.0
10.3
0.0
3.5
0.0
2.0
0.0
3.8
0.0
1.7
0.8
0.0
1.2
0.0
5.3
Suites
0.0
0.0
0.0
0.0
0.0
0.0
0.0
0.0
0.0
0.0
0.0
0.0
0.0
0.0
0.8
Tota
l A
vera
ge R
oom
s1
93
.07
6.7
17
0.2
72
.71
71
.67
3.9
18
3.1
37
.91
90
.76
0.5
32
.81
26
.84
1.5
94
.34
2.1
Avera
ge N
um
ber
of
Food &
Bevera
ge O
utl
ets
Per
Hote
l
CO
MP
OS
ITIO
N
Fiv
e-S
tar
Delu
xe &
Fiv
e-S
tar
Four-
Sta
r,
Thre
e-
Sta
r &
Tw
o-S
tar
Fiv
e-S
tar
Delu
xe ,
Fiv
e-S
tar
& F
our-
Sta
r
Thre
e-
Sta
r &
Tw
o-S
tar
Fiv
e-S
tar
Delu
xe &
Fiv
e-S
tar
Four-
Sta
r
& T
hre
e-
Sta
r
Fiv
e-S
tar
Delu
xe ,
Fiv
e-S
tar
& F
our-
Sta
r
Thre
e-
Sta
r &
Tw
o-S
tar
Fiv
e-S
tar
Delu
xe &
Fiv
e-S
tar
Four-
Sta
r
& T
hre
e-
Sta
r
Tw
o-S
tar
& O
ne-
Sta
r
Fiv
e-S
tar
Delu
xe ,
Fiv
e-S
tar
& F
our-
Sta
r
Thre
e-
Sta
r &
Tw
o-S
tar
Fiv
e-S
tar
Delu
xe,
Fiv
e-S
tar
& F
our-
Sta
r
Thre
e-
Sta
r &
Tw
o-S
tar
Num
ber
of
Responses
82
49
24
81
76
14
12
53
36
10
17
62
1
Resta
ura
nt
2.9
1.9
2.8
1.8
4.4
2.1
3.7
1.4
3.1
1.3
1.0
2.1
1.2
2.5
1.2
Bars
1.1
0.9
1.4
0.8
2.5
1.7
1.5
0.9
1.3
0.8
0.6
1.0
0.7
1.0
0.6
Oth
ers
0.3
1.3
0.7
1.2
0.8
0.5
0.7
0.9
0.8
0.8
0.3
1.3
1.1
0.5
0.7
Tota
l4
.34
.04
.93
.87
.64
.35
.83
.25
.22
.82
.04
.43
.04
.02
.5
Guest
Analy
sis
CO
MP
OS
ITIO
N
Fiv
e-S
tar
Delu
xe &
Fiv
e-S
tar
Four-
Sta
r,
Thre
e-
Sta
r &
Tw
o-S
tar
Fiv
e-S
tar
Delu
xe ,
Fiv
e-S
tar
& F
our-
Sta
r
Thre
e-
Sta
r &
Tw
o-S
tar
Fiv
e-S
tar
Delu
xe &
Fiv
e-S
tar
Four-
Sta
r
& T
hre
e-
Sta
r
Fiv
e-S
tar
Delu
xe ,
Fiv
e-S
tar
& F
our-
Sta
r
Thre
e-
Sta
r &
Tw
o-S
tar
Fiv
e-S
tar
Delu
xe &
Fiv
e-S
tar
Four-
Sta
r
& T
hre
e-
Sta
r
Tw
o-S
tar
& O
ne-
Sta
r
Fiv
e-S
tar
Delu
xe ,
Fiv
e-S
tar
& F
our-
Sta
r
Thre
e-
Sta
r &
Tw
o-S
tar
Fiv
e-S
tar
Delu
xe,
Fiv
e-S
tar
& F
our-
Sta
r
Thre
e-
Sta
r &
Tw
o-S
tar
Num
ber
of
Responses
81
99
24
91
67
19
11
41
45
10
14
62
5
Dom
estic G
uests
29.7
%71.7
%54.0
%69.7
%57.0
%59.6
%62.7
%85.3
%56.9
%65.3
%71.2
%44.9
%60.1
%42.0
%76.6
%Fore
ign G
uests
70.7
28.7
46.0
30.3
43.0
40.4
37.3
14.7
43.1
34.7
28.8
55.1
40.0
58.0
23.4
Tota
l1
00
.01
00
.01
00
.01
00
.01
00
.01
00
.01
00
.01
00
.01
00
.01
00
.01
00
.01
00
.01
00
.01
00
.01
00
.0
Tota
l B
usin
ess
91.7
%68.5
%82.0
%82.1
%30.8
%38.4
%82.7
%78.5
%72.1
%69.0
%68.5
%69.0
%69.3
%89.3
%74.6
%Tota
l Leis
ure
8.3
31.5
18.0
17.9
69.2
61.6
17.3
21.5
28.0
31.0
31.5
31.0
30.7
10.7
25.4
Tota
l1
00
.01
00
.01
00
.01
00
.01
00
.01
00
.01
00
.01
00
.01
00
.01
00
.01
00
.01
00
.01
00
.01
00
.01
00
.0
Avg.
Sta
y o
f Fore
ign G
uests
(D
ays)
2.8
4.6
4.1
2.8
9.7
8.7
2.2
3.2
2.2
3.2
2.8
3.5
2.5
5.0
18.6
Avg.
Sta
y o
f D
om
estic G
uests
(D
ays)
2.0
3.0
2.6
3.7
3.1
3.1
2.1
3.3
2.0
2.7
2.6
2.0
2.3
3.3
16.1
Avg.
Sta
y o
f B
usin
ess G
uests
(D
ays)
2.8
3.8
2.5
3.2
2.2
2.6
2.0
3.1
2.2
3.5
3.1
3.0
2.2
2.5
17.1
Avg.
Sta
y o
f Leis
ure
Guests
(D
ays)
1.6
2.4
2.8
2.7
5.5
4.0
2.5
2.4
1.9
2.7
3.3
1.8
1.5
1.8
2.9
Perc
enta
ge o
f R
epeat G
uests
27.2
34.1
50.5
51.8
18.4
32.3
36.0
63.0
32.9
50.9
47.5
40.2
33.9
57.5
55.7
New
Delh
i-N
CR
New
Delh
i-N
CR
Mum
bai
Goa
Goa
Goa
Mum
bai
Kolk
ata
Mum
bai
Pune
Pune
Pune
Kolk
ata
Kolk
ata
New
Delh
i-N
CR
Bangalo
re
Bangalo
re
Bangalo
re
Chennai
Chennai
Chennai
Page 40
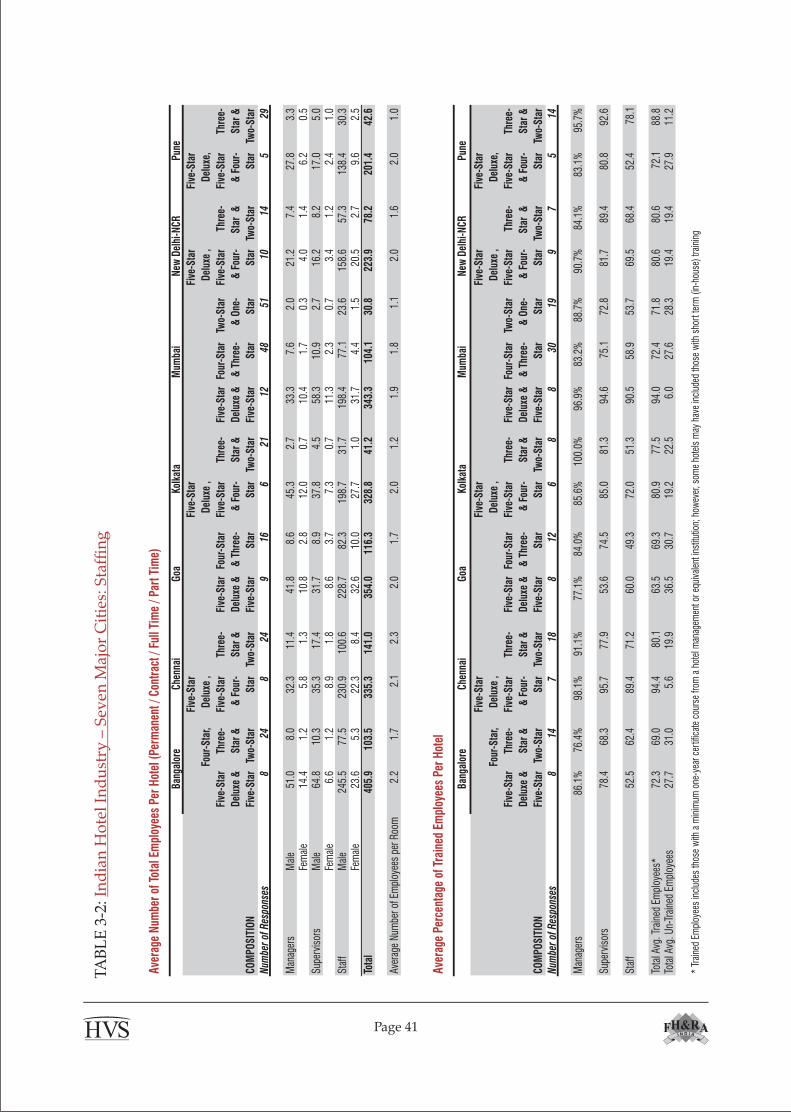
Av
erag
e N
umbe
r of
Tot
al E
mpl
oyee
s Pe
r H
otel
(Pe
rman
ent /
Con
trac
t / F
ull T
ime
/ Par
t Tim
e)
COM
POSI
TIO
N
Five
-Sta
r
Del
uxe
&
Five
-Sta
r
Four
-Sta
r,
Thre
e-
Star
&
Two-
Star
Five
-Sta
r
Del
uxe
,
Five
-Sta
r
& F
our-
Star
Thre
e-
Star
&
Two-
Star
Five
-Sta
r
Del
uxe
&
Five
-Sta
r
Four
-Sta
r
& T
hree
-
Star
Five
-Sta
r
Del
uxe
,
Five
-Sta
r
& F
our-
Star
Thre
e-
Star
&
Two-
Star
Five
-Sta
r
Del
uxe
&
Five
-Sta
r
Four
-Sta
r
& T
hree
-
Star
Two-
Star
& O
ne-
Star
Five
-Sta
r
Del
uxe
,
Five
-Sta
r
& F
our-
Star
Thr
ee-
Star
&
Two-
Star
Five
-Sta
r
Del
uxe,
Five
-Sta
r
& F
our-
Star
Thre
e-
Star
&
Two-
Star
Num
ber
of R
espo
nses
824
824
916
621
1248
5110
145
29
Man
ager
sM
ale
51.0
8.0
32.3
11.4
41.8
8.6
45.3
2.7
33.3
7.6
2.0
21.2
7.4
27.8
3.3
Fem
ale
14.4
1.2
5.8
1.3
10.8
2.8
12.0
0.7
10.4
1.7
0.3
4.0
1.4
6.2
0.5
Supe
rvis
ors
Mal
e64
.810
.335
.317
.431
.78.
937
.84.
558
.310
.92.
716
.28.
217
.05.
0Fe
mal
e6.
61.
28.
91.
88.
63.
77.
30.
711
.32.
30.
73.
41.
22.
41.
0St
aff
Mal
e24
5.5
77.5
230.
910
0.6
228.
782
.319
8.7
31.7
198.
477
.123
.615
8.6
57.3
138.
430
.3Fe
mal
e23
.65.
322
.38.
432
.610
.027
.71.
031
.74.
41.
520
.52.
79.
62.
5To
tal
405.
910
3.5
335.
314
1.0
354.
011
6.3
328.
841
.234
3.3
104.
130
.822
3.9
78.2
201.
442
.6
Aver
age
Num
ber o
f Em
ploy
ees
per R
oom
2.2
1.7
2.1
2.3
2.0
1.7
2.0
1.2
1.9
1.8
1.1
2.0
1.6
2.0
1.0
Aver
age
Perc
enta
ge o
f Tra
ined
Em
ploy
ees
Per
Hot
el
COM
POSI
TIO
N
Five
-Sta
r
Del
uxe
&
Five
-Sta
r
Four
-Sta
r,
Thre
e-
Star
&
Two-
Star
Five
-Sta
r
Del
uxe
,
Five
-Sta
r
& F
our-
Star
Thre
e-
Star
&
Two-
Star
Five
-Sta
r
Del
uxe
&
Five
-Sta
r
Four
-Sta
r
& T
hree
-
Star
Five
-Sta
r
Del
uxe
,
Five
-Sta
r
& F
our-
Star
Thre
e-
Star
&
Two-
Star
Five
-Sta
r
Del
uxe
&
Five
-Sta
r
Four
-Sta
r
& T
hree
-
Star
Two-
Star
& O
ne-
Star
Five
-Sta
r
Del
uxe
,
Five
-Sta
r
& F
our-
Star
Thr
ee-
Star
&
Two-
Star
Five
-Sta
r
Del
uxe,
Five
-Sta
r
& F
our-
Star
Thre
e-
Star
&
Two-
Star
Num
ber
of R
espo
nses
814
718
812
68
830
199
75
14
Man
ager
s86
.1%
76.4
%98
.1%
91.1
%77
.1%
84.0
%85
.6%
100.
0%96
.9%
83.2
%88
.7%
90.7
%84
.1%
83.1
%95
.7%
Supe
rvis
ors
78.4
68.3
95.7
77.9
53.6
74.5
85.0
81.3
94.6
75.1
72.8
81.7
89.4
80.8
92.6
Staf
f52
.562
.489
.471
.260
.049
.372
.051
.390
.558
.953
.769
.568
.452
.478
.1
Tota
l Avg
. Tra
ined
Em
ploy
ees*
72.3
69.0
94.4
80.1
63.5
69.3
80.9
77.5
94.0
72.4
71.8
80.6
80.6
72.1
88.8
Tota
l Avg
. Un-
Trai
ned
Empl
oyee
s27
.731
.05.
619
.936
.530
.719
.222
.56.
027
.628
.319
.419
.427
.911
.2
* Tr
aine
d Em
ploy
ees
incl
udes
thos
e w
ith a
min
imum
one
-yea
r cer
tific
ate
cour
se fr
om a
hot
el m
anag
emen
t or e
quiv
alen
t ins
titut
ion;
how
ever
, som
e ho
tels
may
hav
e in
clud
ed th
ose
with
sho
rt te
rm (
in-h
ouse
) tra
inin
g
Kolk
ata
Kolk
ata
Bang
alor
e
Bang
alor
eCh
enna
i
Chen
nai
Goa
Goa
Mum
bai
Mum
bai
Pune
Pune
New
Del
hi-N
CR
New
Del
hi-N
CR
TA
BL
E 3
-2:
Ind
ian
Ho
tel
Ind
ust
ry –
Sev
en M
ajo
r C
itie
s: S
taff
ing
Page 41
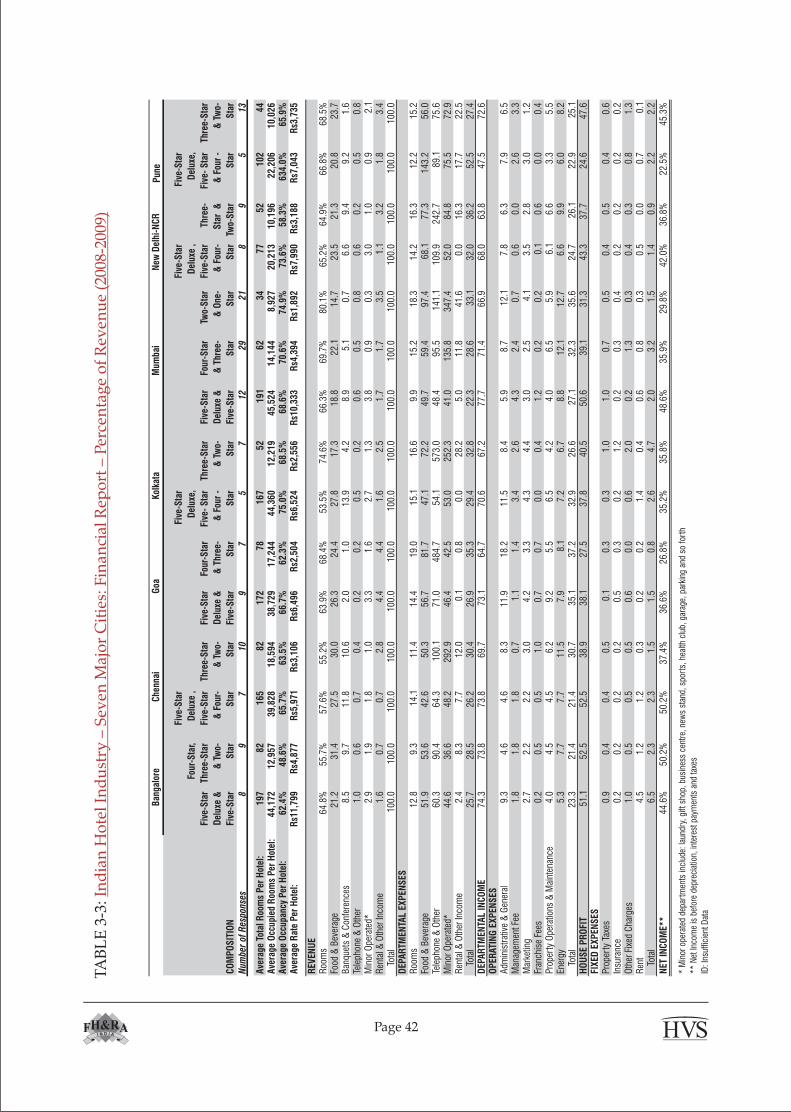
CO
MP
OS
ITIO
N
Five
-Sta
r
Del
uxe
&
Five
-Sta
r
Four
-Sta
r,
Thre
e-S
tar
& T
wo-
Sta
r
Five
-Sta
r
Del
uxe
,
Five
-Sta
r
& F
our-
Sta
r
Thre
e-S
tar
& T
wo-
Sta
r
Five
-Sta
r
Del
uxe
&
Five
-Sta
r
Four
-Sta
r
& T
hree
-
Sta
r
Five
-Sta
r
Del
uxe,
Five
- S
tar
& F
our
-
Sta
r
Thre
e-S
tar
& T
wo-
Sta
r
Five
-Sta
r
Del
uxe
&
Five
-Sta
r
Four
-Sta
r
& T
hree
-
Sta
r
Two-
Sta
r
& O
ne-
Sta
r
Five
-Sta
r
Del
uxe
,
Five
-Sta
r
& F
our-
Sta
r
Thr
ee-
Sta
r &
Two-
Sta
r
Five
-Sta
r
Del
uxe,
Five
- S
tar
& F
our
-
Sta
r
Thre
e-S
tar
& T
wo-
Sta
r
Num
ber
of R
espo
nses
89
710
97
57
1229
218
95
13
Ave
rage
Tot
al R
oom
s P
er H
otel
:19
782
165
8217
278
167
5219
162
3477
5210
244
Ave
rage
Occ
upie
d R
oom
s P
er H
otel
:44
,172
12,9
5739
,828
18,5
9438
,729
17,2
4444
,360
12,2
1945
,524
14,1
448,
927
20,2
1310
,196
22,2
0610
,026
Ave
rage
Occ
upan
cy P
er H
otel
:62
.4%
48.6
%65
.7%
63.5
%66
.7%
62.3
%75
.0%
68.5
%68
.6%
70.6
%74
.9%
73.6
%58
.3%
634.
0%65
.9%
Ave
rage
Rat
e P
er H
otel
:R
s11,
799
Rs4
,877
Rs5
,971
Rs3
,106
Rs6
,496
Rs2
,504
Rs6
,524
Rs2
,556
Rs1
0,33
3R
s4,3
94R
s1,8
92R
s7,9
90R
s3,1
88R
s7,0
43R
s3,7
35
REV
ENU
ER
oom
s64
.8%
55.7
%57
.6%
55.2
%63
.9%
68.4
%53
.5%
74.6
%66
.3%
69.7
%80
.1%
65.2
%64
.9%
66.8
%68
.5%
Food
& B
ever
age
21.2
31.4
27.5
30.0
26.3
24.4
27.8
17.3
18.8
22.1
14.7
23.5
21.3
20.8
23.7
Ban
quet
s &
Con
fere
nces
8.5
9.7
11.8
10.6
2.0
1.0
13.9
4.2
8.9
5.1
0.7
6.6
9.4
9.2
1.6
Tele
phon
e &
Oth
er1.
00.
60.
70.
40.
20.
20.
50.
20.
60.
50.
80.
60.
20.
50.
8M
inor
Ope
rate
d*2.
91.
91.
81.
03.
31.
62.
71.
33.
80.
90.
33.
01.
00.
92.
1R
enta
l & O
ther
Inco
me
1.6
0.7
0.7
2.8
4.4
4.4
1.6
2.5
1.7
1.7
3.5
1.1
3.2
1.8
3.4
Tota
l10
0.0
100.
010
0.0
100.
010
0.0
100.
010
0.0
100.
010
0.0
100.
010
0.0
100.
010
0.0
100.
010
0.0
DEP
AR
TMEN
TAL
EXP
ENS
ESR
oom
s12
.89.
314
.111
.414
.419
.015
.116
.69.
915
.218
.314
.216
.312
.215
.2Fo
od &
Bev
erag
e51
.953
.642
.650
.356
.781
.747
.172
.249
.759
.497
.468
.177
.314
3.2
56.0
Tele
phon
e &
Oth
er60
.390
.464
.310
0.1
71.0
484.
754
.157
3.0
48.4
95.5
141.
110
9.9
242.
789
.175
.6M
inor
Ope
rate
d*44
.636
.648
.229
2.9
46.4
42.5
53.0
252.
341
.013
5.8
347.
452
.084
.875
.572
.9R
enta
l & O
ther
Inco
me
2.4
8.3
7.7
12.0
0.1
0.8
0.0
28.2
5.0
11.8
41.6
0.0
16.3
17.7
22.5
Tota
l25
.728
.526
.230
.426
.935
.329
.432
.822
.328
.633
.132
.036
.252
.527
.4D
EPA
RTM
ENTA
L IN
CO
ME
74.3
73.8
73.8
69.7
73.1
64.7
70.6
67.2
77.7
71.4
66.9
68.0
63.8
47.5
72.6
OP
ERAT
ING
EX
PEN
SES
Adm
inis
trat
ive
& G
ener
al9.
34.
64.
68.
311
.918
.211
.58.
45.
98.
712
.17.
86.
37.
96.
5M
anag
emen
t Fee
1.8
1.8
1.8
0.7
1.1
1.4
3.4
2.6
4.3
2.4
0.7
0.6
0.0
2.6
3.3
Mar
ketin
g2.
72.
22.
23.
04.
23.
34.
34.
43.
02.
54.
13.
52.
83.
01.
2Fr
anch
ise
Fees
0.2
0.5
0.5
1.0
0.7
0.7
0.0
0.4
1.2
0.2
0.2
0.1
0.6
0.0
0.4
Prop
erty
Ope
ratio
ns &
Mai
nten
ance
4.0
4.5
4.5
6.2
9.2
5.5
6.5
4.2
4.0
6.5
5.9
6.1
6.6
3.3
5.5
Ener
gy5.
37.
77.
711
.57.
98.
17.
26.
78.
812
.112
.76.
69.
96.
08.
2To
tal
23.3
21.4
21.4
30.7
35.1
37.2
32.9
26.6
27.1
32.3
35.6
24.7
26.1
22.9
25.1
HO
US
E P
RO
FIT
51.1
52.5
52.5
38.9
38.1
27.5
37.8
40.5
50.6
39.1
31.3
43.3
37.7
24.6
47.6
FIX
ED E
XP
ENS
ESPr
oper
ty T
axes
0.9
0.4
0.4
0.5
0.1
0.3
0.3
1.0
1.0
0.7
0.5
0.4
0.5
0.4
0.6
Insu
ranc
e0.
20.
20.
20.
20.
50.
30.
21.
20.
20.
30.
40.
20.
20.
20.
2O
ther
Fix
ed C
harg
es1.
00.
50.
50.
50.
60.
00.
62.
00.
21.
30.
30.
40.
30.
81.
3R
ent
4.5
1.2
1.2
0.3
0.2
0.2
1.4
0.4
0.6
0.8
0.3
0.5
0.0
0.7
0.1
Tota
l6.
52.
32.
31.
51.
50.
82.
64.
72.
03.
21.
51.
40.
92.
22.
2
NET
IN
CO
ME*
*44
.6%
50.2
%50
.2%
37.4
%36
.6%
26.8
%35
.2%
35.8
%48
.6%
35.9
%29
.8%
42.0
%36
.8%
22.5
%45
.3%
* M
inor
ope
rate
d de
part
men
ts in
clud
e: la
undr
y, g
ift s
hop,
bus
ines
s ce
ntre
, new
s st
and,
spo
rts,
hea
lth c
lub,
gar
age,
par
king
and
so
fort
h
** N
et In
com
e is
bef
ore
depr
ecia
tion,
inte
rest
pay
men
ts a
nd ta
xes
ID: I
nsuf
ficie
nt D
ata
Pun
eN
ew D
elhi
-NC
RK
olka
taM
umba
iB
anga
lore
Che
nnai
Goa
TA
BL
E 3
-3:
Ind
ian
Ho
tel
Ind
ust
ry –
Sev
en M
ajo
r C
itie
s: F
inan
cial
Rep
ort
– P
erce
nta
ge
of
Rev
enu
e (2
008-
2009
)
Page 42
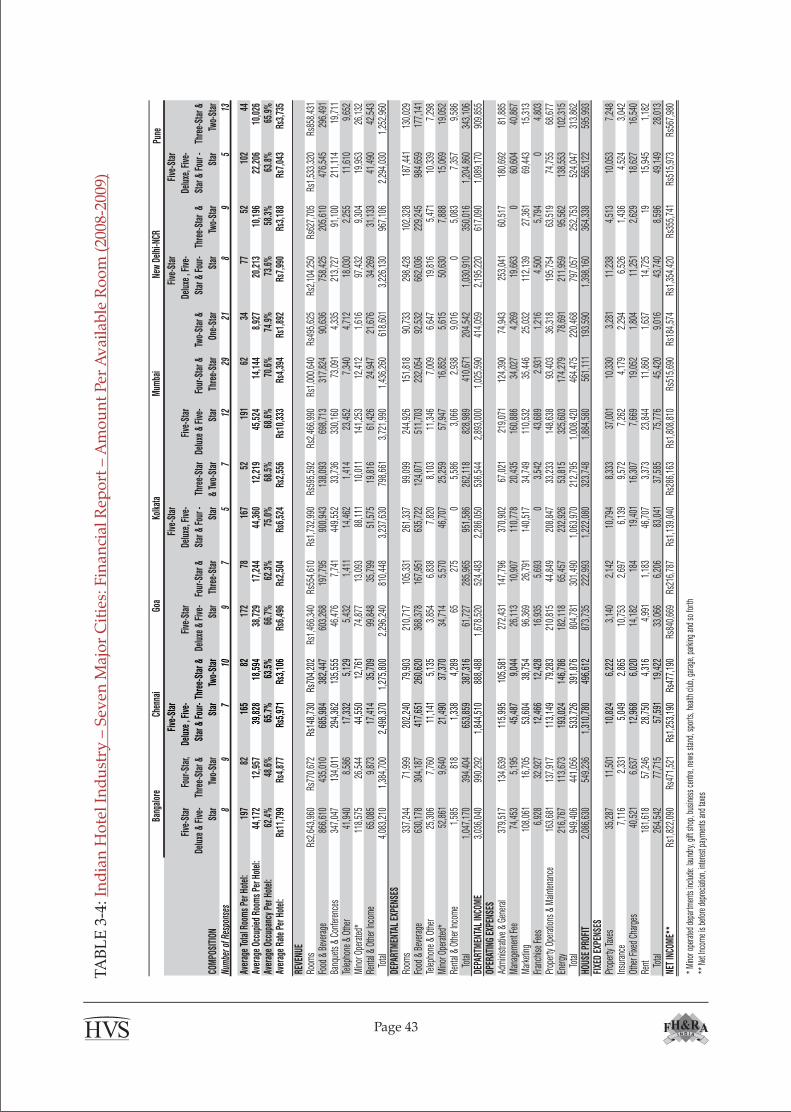
Pu
ne
COM
POSI
TION
Five
-Sta
r
Delu
xe &
Fiv
e-
Star
Four
-Sta
r,
Thre
e-St
ar &
Two-
Star
Five
-Sta
r
Delu
xe ,
Five
-
Star
& F
our-
Star
Thre
e-St
ar &
Two-
Star
Five
-Sta
r
Delu
xe &
Fiv
e-
Star
Four
-Sta
r &
Thre
e-St
ar
Five
-Sta
r
Delu
xe, F
ive-
Star
& F
our -
Star
Thr
ee-S
tar
& Tw
o-St
ar
Five
-Sta
r
Delu
xe &
Fiv
e-
Star
Four
-Sta
r &
Thre
e-St
ar
Two-
Star
&
One-
Star
Five
-Sta
r
Delu
xe ,
Five
-
Star
& F
our-
Star
Thr
ee-S
tar
&
Two-
Star
Five
-Sta
r
Delu
xe, F
ive-
Star
& F
our -
Star
Thre
e-St
ar &
Two-
Star
Num
ber o
f Res
pons
es8
97
109
75
712
2921
89
513
Aver
age
Tota
l Roo
ms
Per H
otel
:19
782
165
8217
278
167
5219
162
3477
5210
244
Aver
age
Occu
pied
Roo
ms
Per H
otel
:44
,172
12,9
5739
,828
18,5
9438
,729
17,2
4444
,360
12,2
1945
,524
14,1
448,
927
20,2
1310
,196
22,2
0610
,026
Aver
age
Occu
panc
y Pe
r Hot
el:
62.4
%48
.6%
65.7
%63
.5%
66.7
%62
.3%
75.0
%68
.5%
68.6
%70
.6%
74.9
%73
.6%
58.3
%63
.8%
65.9
%Av
erag
e Ra
te P
er H
otel
:Rs
11,7
99Rs
4,87
7Rs
5,97
1Rs
3,10
6Rs
6,49
6Rs
2,50
4Rs
6,52
4Rs
2,55
6Rs
10,3
33Rs
4,39
4Rs
1,89
2Rs
7,99
0Rs
3,18
8Rs
7,04
3Rs
3,73
5
REVE
NUE
Room
sRs
2,64
3,96
0Rs
770,
672
Rs14
8,73
0Rs
704,
202
Rs1,
466,
340
Rs55
4,61
0Rs
1,73
2,99
0Rs
595,
592
Rs2,
466,
990
Rs1,
000,
640
Rs49
5,62
5Rs
2,10
4,25
0Rs
627,
705
Rs1,
533,
320
Rs85
8,43
1Fo
od &
Bev
erag
e86
6,61
043
5,01
068
5,98
438
2,44
760
3,26
819
7,79
590
0,94
313
8,09
369
8,71
331
7,82
490
,636
758,
425
205,
610
476,
545
296,
491
Banq
uets
& C
onfe
renc
es34
7,04
713
4,01
129
4,36
213
5,55
546
,476
7,74
144
9,55
233
,736
330,
160
73,0
914,
335
213,
727
91,1
0021
1,11
419
,711
Telep
hone
& O
ther
41,9
408,
586
17,3
325,
129
5,43
21,
411
14,4
621,
414
23,4
527,
340
4,71
218
,030
2,25
511
,610
9,65
2M
inor
Ope
rate
d*11
8,57
526
,544
44,5
5012
,761
74,8
7713
,093
88,1
1110
,011
141,
253
12,4
121,
616
97,4
329,
304
19,9
5326
,132
Rent
al &
Othe
r Inc
ome
65,0
859,
873
17,4
1435
,709
99,8
4835
,799
51,5
7519
,816
61,4
2624
,947
21,6
7634
,269
31,1
3341
,490
42,5
43To
tal
4,08
3,21
01,
384,
700
2,49
8,37
01,
275,
800
2,29
6,24
081
0,44
83,
237,
630
798,
661
3,72
1,99
01,
436,
260
618,
601
3,22
6,13
096
7,10
62,
294,
030
1,25
2,96
0DE
PART
MEN
TAL
EXPE
NSES
Room
s33
7,24
471
,999
202,
240
79,9
0321
0,71
710
5,33
126
1,33
799
,099
244,
926
151,
818
90,7
3329
8,42
810
2,32
818
7,44
113
0,02
9Fo
od &
Bev
erag
e63
0,17
830
4,18
741
7,65
126
0,62
036
8,37
816
7,95
163
5,72
212
4,07
151
1,70
323
2,05
492
,532
662,
036
229,
245
984,
659
177,
141
Telep
hone
& O
ther
25,3
067,
760
11,1
415,
135
3,85
46,
838
7,82
08,
103
11,3
467,
009
6,64
719
,816
5,47
110
,339
7,29
8M
inor
Ope
rate
d*52
,861
9,64
021
,490
37,3
7034
,714
5,57
046
,707
25,2
5957
,947
16,8
525,
615
50,6
307,
888
15,0
6919
,052
Rent
al &
Othe
r Inc
ome
1,58
581
81,
338
4,28
965
275
05,
586
3,06
62,
938
9,01
60
5,08
37,
357
9,58
6To
tal
1,04
7,17
039
4,40
465
3,85
938
7,31
661
,727
285,
965
951,
586
262,
118
828,
989
410,
671
204,
542
1,03
0,91
035
0,01
61,
204,
860
343,
106
DEPA
RTM
ENTA
L IN
COM
E3,
036,
040
990,
292
1,84
4,51
088
8,48
81,
678,
520
524,
483
2,28
6,05
053
6,54
42,
893,
000
1,02
5,59
041
4,05
92,
195,
220
617,
090
1,08
9,17
090
9,85
5OP
ERAT
ING
EXPE
NSES
Adm
inist
rativ
e &
Gene
ral
379,
517
134,
639
115,
995
105,
581
272,
431
147,
796
370,
902
67,0
2121
9,07
112
4,39
074
,943
253,
041
60,5
1718
0,69
281
,885
Man
agem
ent F
ee74
,453
5,19
545
,487
9,04
426
,113
10,9
0711
0,77
820
,435
160,
886
34,0
274,
269
19,6
630
60,6
0440
,867
Mar
ketin
g10
8,06
116
,705
53,6
0438
,754
96,3
6926
,791
140,
517
34,7
4911
0,53
235
,446
25,0
3211
2,13
927
,361
69,4
4315
,313
Fran
chise
Fee
s6,
928
32,9
2712
,466
12,4
2816
,935
5,69
30
3,54
243
,689
2,93
11,
216
4,50
05,
794
04,
803
Prop
erty
Ope
ratio
ns &
Main
tena
nce
163,
681
137,
917
113,
149
79,2
8321
0,81
544
,849
208,
847
33,2
3314
8,63
893
,403
36,3
1819
5,75
463
,519
74,7
5568
,677
Ener
gy21
6,76
711
3,67
319
3,02
414
6,78
618
2,11
865
,457
232,
926
53,8
1532
5,60
317
4,27
978
,691
211,
959
95,5
6213
8,55
310
2,31
5To
tal
949,
406
441,
056
533,
726
391,
876
804,
781
301,
490
1,06
3,97
021
2,79
51,
008,
420
464,
475
220,
468
797,
057
252,
753
524,
047
313,
862
HOUS
E PR
OFIT
2,08
6,63
054
9,23
61,
310,
780
496,
612
873,
735
222,
993
1,22
2,08
032
3,74
81,
884,
580
561,
111
193,
590
1,39
8,16
036
4,33
856
5,12
259
5,99
3FI
XED
EXPE
NSES
Prop
erty
Taxe
s35
,287
11,5
0110
,824
6,22
23,
140
2,14
210
,794
8,33
337
,001
10,3
303,
281
11,2
384,
513
10,0
537,
248
Insu
ranc
e7,
116
2,33
15,
049
2,86
510
,753
2,69
76,
139
9,57
27,
262
4,17
92,
294
6,52
61,
436
4,52
43,
042
Othe
r Fixe
d Ch
arge
s40
,521
6,63
712
,968
6,02
014
,182
184
19,4
0116
,307
7,66
919
,052
1,80
411
,251
2,62
918
,627
16,5
40Re
nt
181,
618
57,2
4628
,750
4,31
64,
991
1,18
346
,707
3,37
323
,844
11,8
601,
637
14,7
2519
15,9
451,
182
Tota
l26
4,54
277
,715
57,5
9119
,422
33,0
666,
206
83,0
4137
,585
75,7
7645
,420
9,01
643
,740
8,59
649
,149
28,0
13
NET
INCO
ME*
*Rs
1,82
2,09
0Rs
471,
521
Rs1,
253,
190
Rs47
7,19
0Rs
840,
669
Rs21
6,78
7Rs
1,13
9,04
0Rs
286,
163
Rs1,
808,
810
Rs51
5,69
0Rs
184,
574
Rs1,
354,
420
Rs35
5,74
1Rs
515,
973
Rs56
7,98
0
* M
inor
ope
rate
d de
partm
ents
incl
ude:
laun
dry,
gift
shop
, bus
ines
s ce
ntre
, new
s st
and,
spo
rts, h
ealth
clu
b, g
arag
e, p
arkin
g an
d so
forth
** N
et In
com
e is
befo
re d
epre
ciat
ion,
inte
rest
pay
men
ts a
nd ta
xes
New
Del
hi-N
CRKo
lkat
aM
umba
iBa
ngal
ore
Chen
nai
Goa
TA
BL
E 3
-4:
Ind
ian
Ho
tel
Ind
ust
ry –
Sev
en M
ajo
r C
itie
s: F
inan
cial
Rep
ort
– A
mo
un
t P
er A
vai
lab
le R
oo
m (
2008
-200
9)
Page 43
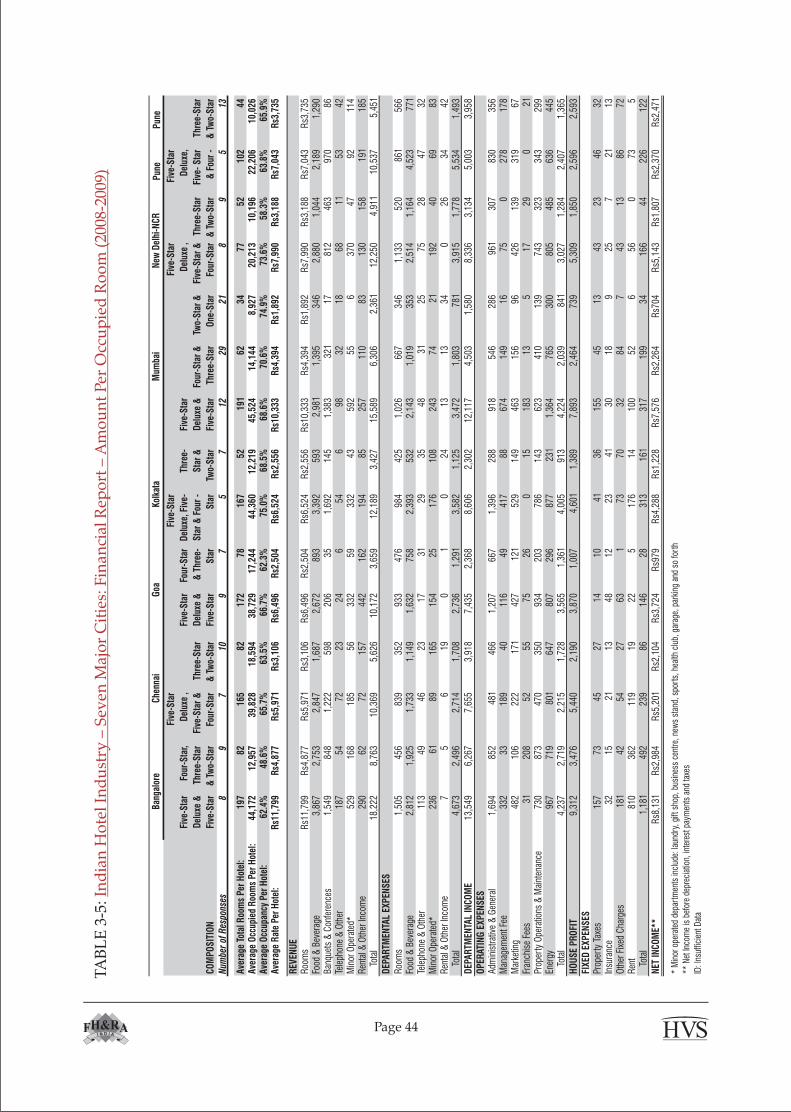
P
une
Pun
e
CO
MP
OS
ITIO
N
Five
-Sta
r
Del
uxe
&
Five
-Sta
r
Four
-Sta
r,
Thre
e-S
tar
& T
wo-
Sta
r
Five
-Sta
r
Del
uxe
,
Five
-Sta
r &
Four
-Sta
r
Thre
e-S
tar
& T
wo-
Sta
r
Five
-Sta
r
Del
uxe
&
Five
-Sta
r
Four
-Sta
r
& T
hree
-
Sta
r
Five
-Sta
r
Del
uxe,
Fiv
e-
Sta
r &
Fou
r -
Sta
r
Thre
e-
Sta
r &
Two-
Sta
r
Five
-Sta
r
Del
uxe
&
Five
-Sta
r
Four
-Sta
r &
Thre
e-S
tar
Two-
Sta
r &
One
-Sta
r
Five
-Sta
r
Del
uxe
,
Five
-Sta
r &
Four
-Sta
r
Thr
ee-S
tar
& T
wo-
Sta
r
Five
-Sta
r
Del
uxe,
Five
- S
tar
& F
our
-
Thre
e-S
tar
& T
wo-
Sta
r
Num
ber
of R
espo
nses
89
710
97
57
1229
218
95
13
Ave
rage
Tot
al R
oom
s Pe
r H
otel
:19
782
165
8217
278
167
5219
162
3477
5210
244
Ave
rage
Occ
upie
d R
oom
s Pe
r H
otel
:44
,172
12,9
5739
,828
18,5
9438
,729
17,2
4444
,360
12,2
1945
,524
14,1
448,
927
20,2
1310
,196
22,2
0610
,026
Ave
rage
Occ
upan
cy P
er H
otel
:62
.4%
48.6
%65
.7%
63.5
%66
.7%
62.3
%75
.0%
68.5
%68
.6%
70.6
%74
.9%
73.6
%58
.3%
63.8
%65
.9%
Ave
rage
Rat
e Pe
r H
otel
:R
s11,
799
Rs4
,877
Rs5
,971
Rs3
,106
Rs6
,496
Rs2
,504
Rs6
,524
Rs2
,556
Rs1
0,33
3R
s4,3
94R
s1,8
92R
s7,9
90R
s3,1
88R
s7,0
43R
s3,7
35
REV
ENU
ER
oom
sR
s11,
799
Rs4
,877
Rs5
,971
Rs3
,106
Rs6
,496
Rs2
,504
Rs6
,524
Rs2
,556
Rs1
0,33
3R
s4,3
94R
s1,8
92R
s7,9
90R
s3,1
88R
s7,0
43R
s3,7
35Fo
od &
Bev
erag
e3,
867
2,75
32,
847
1,68
72,
672
893
3,39
259
32,
981
1,39
534
62,
880
1,04
42,
189
1,29
0Ba
nque
ts &
Con
fere
nces
1,54
984
81,
222
598
206
351,
692
145
1,38
332
117
812
463
970
86Te
leph
one
& O
ther
187
5472
2324
654
698
3218
6811
5342
Min
or O
pera
ted*
529
168
185
5633
259
332
4359
255
637
047
9211
4R
enta
l & O
ther
Inco
me
290
6272
157
442
162
194
8525
711
083
130
158
191
185
Tota
l18
,222
8,76
310
,369
5,62
610
,172
3,65
912
,189
3,42
715
,589
6,30
62,
361
12,2
504,
911
10,5
375,
451
DEP
AR
TMEN
TAL
EXP
ENS
ES
Roo
ms
1,50
545
683
935
293
347
698
442
51,
026
667
346
1,13
352
086
156
6Fo
od &
Bev
erag
e2,
812
1,92
51,
733
1,14
91,
632
758
2,39
353
22,
143
1,01
935
32,
514
1,16
44,
523
771
Tele
phon
e &
Oth
er11
349
4623
1731
2935
4831
2575
2847
32M
inor
Ope
rate
d*23
661
8916
515
425
176
108
243
7421
192
4069
83R
enta
l & O
ther
Inco
me
75
619
01
024
1313
340
2634
42To
tal
4,67
32,
496
2,71
41,
708
2,73
61,
291
3,58
21,
125
3,47
21,
803
781
3,91
51,
778
5,53
41,
493
DEP
AR
TMEN
TAL
INC
OM
E13
,549
6,26
77,
655
3,91
87,
435
2,36
88,
606
2,30
212
,117
4,50
31,
580
8,33
63,
134
5,00
33,
958
OP
ERAT
ING
EX
PEN
SES
Adm
inis
trativ
e &
Gen
eral
1,69
485
248
146
61,
207
667
1,39
628
891
854
628
696
130
783
035
6M
anag
emen
t Fee
332
3318
940
116
4941
788
674
149
1675
027
817
8M
arke
ting
482
106
222
171
427
121
529
149
463
156
9642
613
931
967
Fran
chis
e Fe
es31
208
5255
7526
015
183
135
1729
021
Prop
erty
Ope
ratio
ns &
Mai
nten
ance
730
873
470
350
934
203
786
143
623
410
139
743
323
343
299
Ener
gy96
771
980
164
780
729
687
723
11,
364
765
300
805
485
636
445
Tota
l4,
237
2,71
92,
215
1,72
83,
565
1,36
14,
005
913
4,22
42,
039
841
3,02
71,
284
2,40
71,
365
HO
US
E P
RO
FIT
9,31
23,
476
5,44
02,
190
3,87
01,
007
4,60
11,
389
7,89
32,
464
739
5,30
91,
850
2,59
62,
593
FIX
ED E
XP
ENS
ESPr
oper
ty T
axes
157
7345
2714
1041
3615
545
1343
2346
32In
sura
nce
3215
2113
4812
2341
3018
925
721
13O
ther
Fix
ed C
harg
es18
142
5427
631
7370
3284
743
1386
72R
ent
810
362
119
1922
517
614
100
526
560
735
Tota
l1,
181
492
239
8614
628
313
161
317
199
3416
644
226
122
NET
INC
OM
E**
Rs8
,131
Rs2
,984
Rs5
,201
Rs2
,104
Rs3
,724
Rs9
79R
s4,2
88R
s1,2
28R
s7,5
76R
s2,2
64R
s704
Rs5
,143
Rs1
,807
Rs2
,370
Rs2
,471
* M
inor
ope
rate
d de
part
men
ts in
clud
e: la
undr
y, g
ift s
hop,
bus
ines
s ce
ntre
, new
s st
and,
spo
rts,
hea
lth c
lub,
gar
age,
par
king
and
so
fort
h
** N
et In
com
e is
bef
ore
depr
ecia
tion,
inte
rest
pay
men
ts a
nd ta
xes
ID: I
nsuf
ficie
nt D
ata
New
Del
hi-N
CR
Kolk
ata
Mum
bai
Ban
galo
reC
henn
aiG
oa
TA
BL
E 3
-5:
Ind
ian
Ho
tel
Ind
ust
ry –
Sev
en M
ajo
r C
itie
s: F
inan
cial
Rep
ort
– A
mo
un
t P
er O
ccu
pie
d R
oo
m (
2008
-200
9)
Page 44
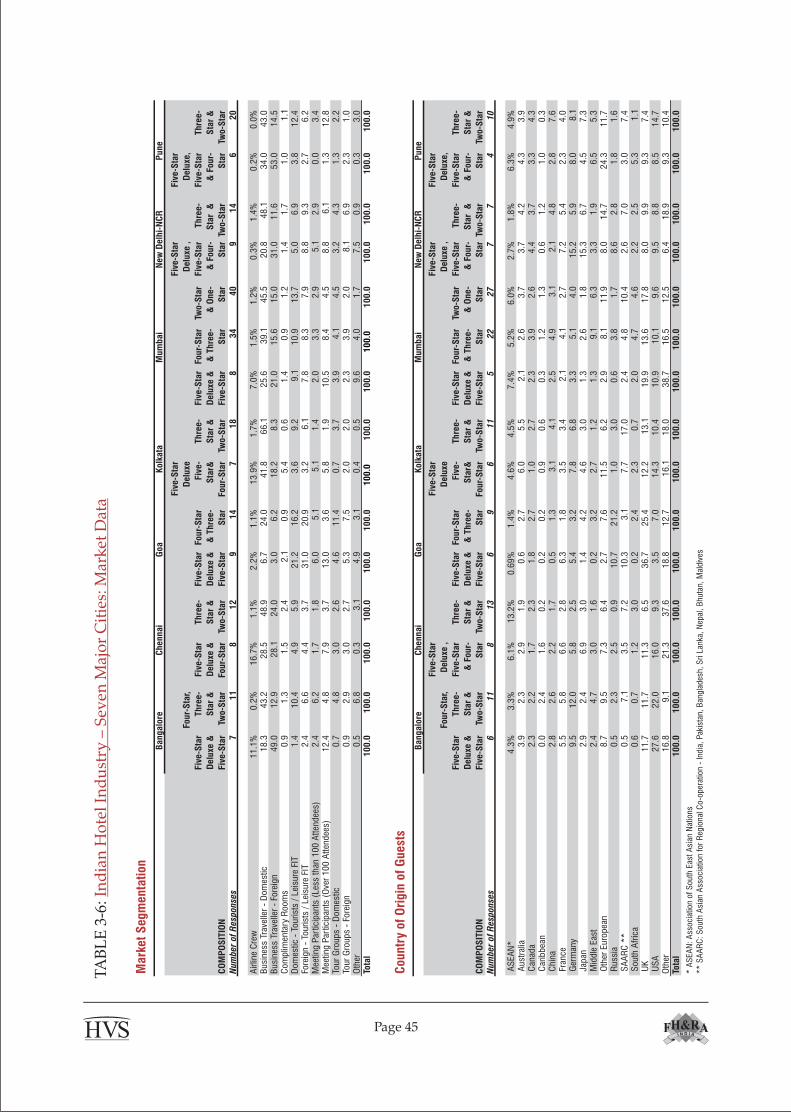
TA
BL
E 3
-6:
Ind
ian
Ho
tel
Ind
ust
ry –
Sev
en M
ajo
r C
itie
s: M
ark
et D
ata
Page 45
M
ark
et
Segm
enta
tion
CO
MP
OS
ITIO
N
Fiv
e-S
tar
Delu
xe &
Fiv
e-S
tar
Four-
Sta
r,
Thre
e-
Sta
r &
Two-S
tar
Fiv
e-S
tar
Delu
xe &
Four-
Sta
r
Thre
e-
Sta
r &
Two-S
tar
Fiv
e-S
tar
Delu
xe &
Fiv
e-S
tar
Four-
Sta
r
& T
hre
e-
Sta
r
Fiv
e-S
tar
Delu
xe
Fiv
e-
Sta
r&
Four-
Sta
r
Thre
e-
Sta
r &
Two-S
tar
Fiv
e-S
tar
Delu
xe &
Fiv
e-S
tar
Four-
Sta
r
& T
hre
e-
Sta
r
Two-S
tar
& O
ne-
Sta
r
Fiv
e-S
tar
Delu
xe ,
Fiv
e-S
tar
& F
our-
Sta
r
Thre
e-
Sta
r &
Two-S
tar
Fiv
e-S
tar
Delu
xe,
Fiv
e-S
tar
& F
our-
Sta
r
Thre
e-
Sta
r &
Two-S
tar
Num
ber
of
Resp
onse
s7
11
81
29
14
71
88
34
40
91
46
20
Airlin
e C
rew
11.1
%0.2
%16.7
%1.1
%2.2
%1.1
%13.9
%1.7
%7.0
%1.5
%1.2
%0.3
%1.4
%0.2
%0.0
%B
usi
nes
s Tr
avel
ler
- D
om
estic
18.3
43.2
28.5
48.9
6.7
24.0
41.8
66.1
25.6
39.1
45.5
20.8
48.1
34.0
43.0
Busi
nes
s Tr
avel
ler
- Fo
reig
n49.0
12.9
28.1
24.0
3.0
6.2
18.2
8.3
21.0
15.6
15.0
31.0
11.6
53.0
14.5
Com
plim
enta
ry R
oom
s0.9
1.3
1.5
2.4
2.1
0.9
5.4
0.6
1.4
0.9
1.2
1.4
1.7
1.0
1.1
Dom
estic
- T
ourist
s /
Lei
sure
FIT
1.4
10.4
4.9
5.9
21.2
16.2
3.6
9.2
9.1
10.9
13.7
5.0
6.9
3.8
12.4
Fore
ign -
Tourist
s /
Lei
sure
FIT
2.4
6.6
4.4
3.7
31.0
20.9
3.2
6.1
7.8
8.3
7.9
8.8
9.3
2.7
6.2
Mee
ting P
artic
ipan
ts (
Les
s th
an 1
00 A
tten
dee
s)2.4
6.2
1.7
1.8
6.0
5.1
5.1
1.4
2.0
3.3
2.9
5.1
2.9
0.0
3.4
Mee
ting P
artic
ipan
ts (
Ove
r 100 A
tten
dee
s)12.4
4.8
7.9
3.7
13.0
3.6
5.8
1.9
10.5
8.4
4.5
8.8
6.1
1.3
12.8
Tour
Gro
ups
- D
om
estic
0.7
4.8
3.0
2.6
4.6
11.4
0.7
3.7
3.9
4.1
4.5
3.2
4.3
1.3
2.2
Tour
Gro
ups
- Fo
reig
n0.9
2.9
3.0
2.7
5.3
7.5
2.0
2.0
2.3
3.9
2.0
8.1
6.9
2.3
1.0
Oth
er0.5
6.8
0.3
3.1
4.9
3.1
0.4
0.5
9.6
4.0
1.7
7.5
0.9
0.3
3.0
Tota
l1
00
.01
00
.01
00
.01
00
.01
00
.01
00
.01
00
.01
00
.01
00
.01
00
.01
00
.01
00
.01
00
.01
00
.01
00
.0
Countr
y of
Ori
gin
of
Guest
s
CO
MP
OS
ITIO
N
Fiv
e-S
tar
Delu
xe &
Fiv
e-S
tar
Four-
Sta
r,
Thre
e-
Sta
r &
Two-S
tar
Fiv
e-S
tar
Delu
xe ,
Fiv
e-S
tar
& F
our-
Sta
r
Thre
e-
Sta
r &
Two-S
tar
Fiv
e-S
tar
Delu
xe &
Fiv
e-S
tar
Four-
Sta
r
& T
hre
e-
Sta
r
Fiv
e-S
tar
Delu
xe
Fiv
e-
Sta
r&
Four-
Sta
r
Thre
e-
Sta
r &
Two-S
tar
Fiv
e-S
tar
Delu
xe &
Fiv
e-S
tar
Four-
Sta
r
& T
hre
e-
Sta
r
Two-S
tar
& O
ne-
Sta
r
Fiv
e-S
tar
Delu
xe ,
Fiv
e-S
tar
& F
our-
Sta
r
Thre
e-
Sta
r &
Two-S
tar
Fiv
e-S
tar
Delu
xe,
Fiv
e-S
tar
& F
our-
Sta
r
Thre
e-
Sta
r &
Two-S
tar
Num
ber
of
Resp
onse
s6
11
81
36
96
11
52
22
77
74
10
AS
EA
N*
4.3
%3.3
%6.1
%13.2
%0.6
9%
1.4
%4.6
%4.5
%7.4
%5.2
%6.0
%2.7
%1.8
%6.3
%4.9
% A
ust
ralia
3.9
2.3
2.9
1.9
0.6
2.7
6.0
5.5
2.1
2.6
3.7
3.7
4.2
4.3
3.9
Can
ada
2.3
2.2
1.7
2.3
1.8
2.7
1.0
2.7
2.3
3.9
2.6
4.4
3.7
3.3
4.3
Car
ibbea
n0.0
2.4
1.6
0.2
0.2
0.2
0.9
0.6
0.3
1.2
1.3
0.6
1.2
1.0
0.3
Chin
a2.8
2.6
2.2
1.7
0.5
1.3
3.1
4.1
2.5
4.9
3.1
2.1
4.8
2.8
7.6
Fra
nce
5.5
5.8
6.6
2.8
6.3
1.8
3.5
3.4
2.1
4.1
2.7
7.2
5.4
2.3
4.0
Ger
man
y9.5
12.0
5.8
2.5
5.4
3.2
7.8
6.8
3.3
5.1
4.0
15.2
5.9
8.0
8.1
Jap
an2.9
2.4
6.9
3.0
1.4
4.2
4.6
3.0
1.3
2.6
1.8
15.3
6.7
4.5
7.3
Mid
dle
Eas
t2.4
4.7
3.0
1.6
0.2
3.2
2.7
1.2
1.3
9.1
6.3
3.3
1.9
6.5
5.3
Oth
er E
uro
pea
n8.7
9.5
7.3
6.4
2.7
7.6
11.5
6.2
2.9
8.1
11.9
8.0
14.7
24.3
11.7
Russ
ia0.5
2.3
2.5
0.9
10.7
21.2
1.0
3.0
0.6
3.8
1.7
8.6
2.8
1.8
1.6
SA
AR
C *
*0.5
7.1
3.5
7.2
10.3
3.1
7.7
17.0
2.4
4.8
10.4
2.6
7.0
3.0
7.4
South
Afr
ica
0.6
0.7
1.2
3.0
0.2
2.4
2.3
0.7
2.0
4.7
4.6
2.2
2.5
5.3
1.1
UK
11.7
11.7
11.3
6.5
36.7
25.4
12.2
13.1
19.9
13.6
17.8
8.0
9.9
9.3
7.4
US
A27.6
22.0
16.0
9.3
3.5
7.0
14.3
10.4
10.9
10.1
9.6
9.5
8.8
8.5
14.7
Oth
er16.8
9.1
21.3
37.6
18.8
12.7
16.1
18.0
38.7
16.5
12.5
6.4
18.9
9.3
10.4
Tota
l1
00
.01
00
.01
00
.01
00
.01
00
.01
00
.01
00
.01
00
.01
00
.01
00
.01
00
.01
00
.01
00
.01
00
.01
00
.0
* A
SEA
N:
Ass
oci
atio
n o
f S
outh
Eas
t A
sian
Nat
ions
**
SA
AR
C:
South
Asi
an A
ssoci
atio
n f
or
Reg
ional
Co-o
per
atio
n -
India
, Pak
ista
n,
Ban
gla
des
h,
Sri L
anka
, N
epal
, B
huta
n,
Mal
div
es
Kolk
ata
Kolk
ata
Bangalo
re
Bangalo
re
Chennai
Chennai
Goa
Goa
Mum
bai
Mum
bai
Pune
Pune
New
Delh
i-N
CR
New
Delh
i-N
CR
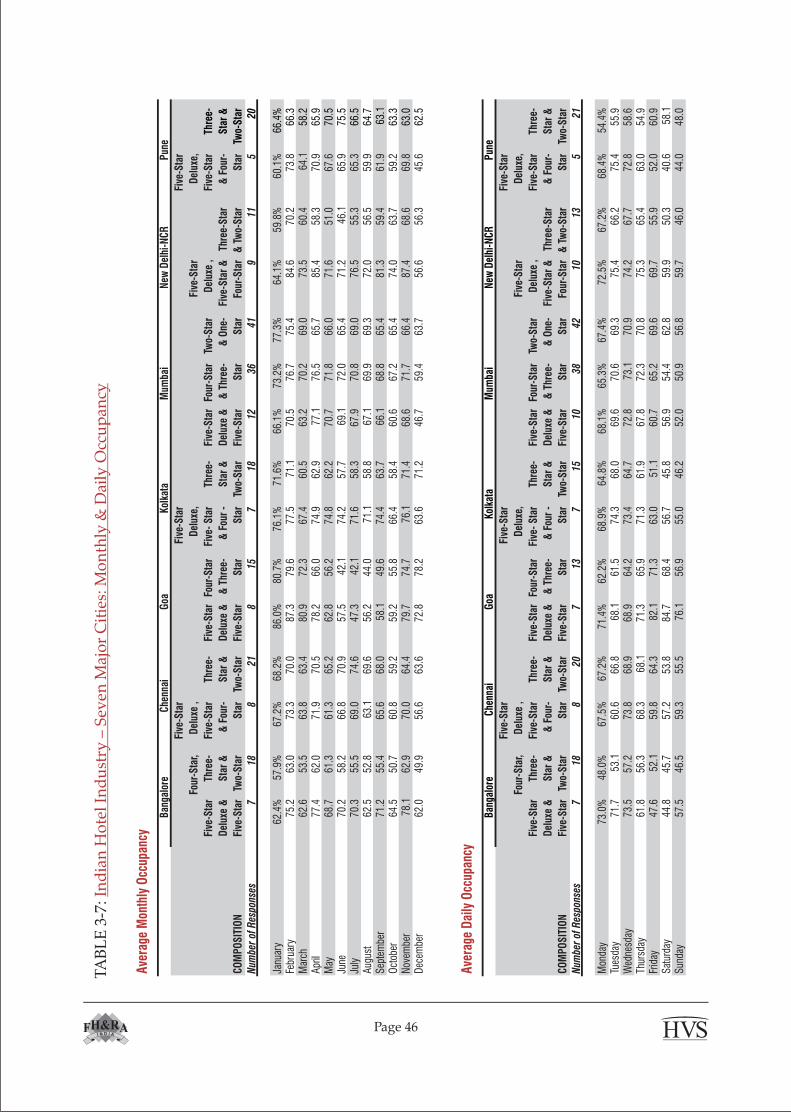
Page 46
A
vera
ge M
onth
ly O
ccup
ancy
CO
MP
OS
ITIO
N
Five
-Sta
r
Del
uxe
&
Five
-Sta
r
Four
-Sta
r,
Thre
e-
Sta
r &
Two-
Sta
r
Five
-Sta
r
Del
uxe
,
Five
-Sta
r
& F
our-
Sta
r
Thre
e-
Sta
r &
Two-
Sta
r
Five
-Sta
r
Del
uxe
&
Five
-Sta
r
Four
-Sta
r
& T
hree
-
Sta
r
Five
-Sta
r
Del
uxe,
Five
- S
tar
& F
our
-
Sta
r
Thre
e-
Sta
r &
Two-
Sta
r
Five
-Sta
r
Del
uxe
&
Five
-Sta
r
Four
-Sta
r
& T
hree
-
Sta
r
Two-
Sta
r
& O
ne-
Sta
r
Five
-Sta
r
Del
uxe
,
Five
-Sta
r &
Four
-Sta
r
Thr
ee-S
tar
& T
wo-
Sta
r
Five
-Sta
r
Del
uxe,
Five
-Sta
r
& F
our-
Sta
r
Thre
e-
Sta
r &
Two-
Sta
r
Num
ber
of R
espo
nses
718
821
815
718
1236
419
115
20
Janu
ary
62.4
%57
.9%
67.2
%68
.2%
86.0
%80
.7%
76.1
%71
.6%
66.1
%73
.2%
77.3
%64
.1%
59.8
%60
.1%
66.4
%Fe
brua
ry75
.263
.073
.370
.087
.379
.677
.571
.170
.576
.775
.484
.670
.273
.866
.3M
arch
62.6
53.5
63.8
63.4
80.9
72.3
67.4
60.5
63.2
70.2
69.0
73.5
60.4
64.1
58.2
Apr
il77
.462
.071
.970
.578
.266
.074
.962
.977
.176
.565
.785
.458
.370
.965
.9M
ay68
.761
.361
.365
.262
.856
.274
.862
.270
.771
.866
.071
.651
.067
.670
.5Ju
ne70
.258
.266
.870
.957
.542
.174
.257
.769
.172
.065
.471
.246
.165
.975
.5Ju
ly70
.355
.569
.074
.647
.342
.171
.658
.367
.970
.869
.076
.555
.365
.366
.5A
ugus
t62
.552
.863
.169
.656
.244
.071
.158
.867
.169
.969
.372
.056
.559
.964
.7Se
ptem
ber
71.2
55.4
65.6
68.0
58.1
49.6
74.4
63.7
66.1
68.8
65.4
81.3
59.4
61.9
63.1
Oct
ober
64.5
50.7
60.8
59.2
59.2
55.8
66.4
58.4
60.6
67.2
65.4
74.0
63.7
59.2
63.3
Nov
embe
r78
.162
.970
.064
.479
.774
.776
.171
.468
.671
.766
.487
.468
.669
.863
.0D
ecem
ber
62.0
49.9
56.6
63.6
72.8
78.2
63.6
71.2
46.7
59.4
63.7
56.6
56.3
45.6
62.5
Ave
rage
Dai
ly O
ccup
ancy
CO
MP
OS
ITIO
N
Five
-Sta
r
Del
uxe
&
Five
-Sta
r
Four
-Sta
r,
Thre
e-
Sta
r &
Two-
Sta
r
Five
-Sta
r
Del
uxe
,
Five
-Sta
r
& F
our-
Sta
r
Thre
e-
Sta
r &
Two-
Sta
r
Five
-Sta
r
Del
uxe
&
Five
-Sta
r
Four
-Sta
r
& T
hree
-
Sta
r
Five
-Sta
r
Del
uxe,
Five
- S
tar
& F
our
-
Sta
r
Thre
e-
Sta
r &
Two-
Sta
r
Five
-Sta
r
Del
uxe
&
Five
-Sta
r
Four
-Sta
r
& T
hree
-
Sta
r
Two-
Sta
r
& O
ne-
Sta
r
Five
-Sta
r
Del
uxe
,
Five
-Sta
r &
Four
-Sta
r
Thr
ee-S
tar
& T
wo-
Sta
r
Five
-Sta
r
Del
uxe,
Five
-Sta
r
& F
our-
Sta
r
Thre
e-
Sta
r &
Two-
Sta
r
Num
ber
of R
espo
nses
718
820
713
715
1038
4210
135
21
Mon
day
73.0
%48
.0%
67.5
%67
.2%
71.4
%62
.2%
68.9
%64
.8%
68.1
%65
.3%
67.4
%72
.5%
67.2
%68
.4%
54.4
%Tu
esda
y71
.753
.160
.666
.868
.161
.574
.368
.069
.670
.669
.375
.466
.275
.455
.9W
edne
sday
73.5
57.2
73.8
68.9
68.9
64.2
73.4
64.7
72.8
73.1
70.9
74.2
67.7
72.8
58.6
Thur
sday
61.8
56.3
68.3
68.1
71.3
65.9
71.3
61.9
67.8
72.3
70.8
75.3
65.4
63.0
54.9
Frid
ay47
.652
.159
.864
.382
.171
.363
.051
.160
.765
.269
.669
.755
.952
.060
.9Sa
turd
ay44
.845
.757
.253
.884
.768
.456
.745
.856
.954
.462
.859
.950
.340
.658
.1Su
nday
57.5
46.5
59.3
55.5
76.1
56.9
55.0
46.2
52.0
50.9
56.8
59.7
46.0
44.0
48.0
Pun
e
Ban
galo
reC
henn
aiG
oaKo
lkat
aM
umba
iN
ew D
elhi
-NC
RP
une
Ban
galo
reC
henn
aiG
oaKo
lkat
aM
umba
iN
ew D
elhi
-NC
R
TA
BL
E 3
-7:
Ind
ian
Ho
tel
Ind
ust
ry –
Sev
en M
ajo
r C
itie
s: M
on
thly
& D
aily
Occ
up
ancy
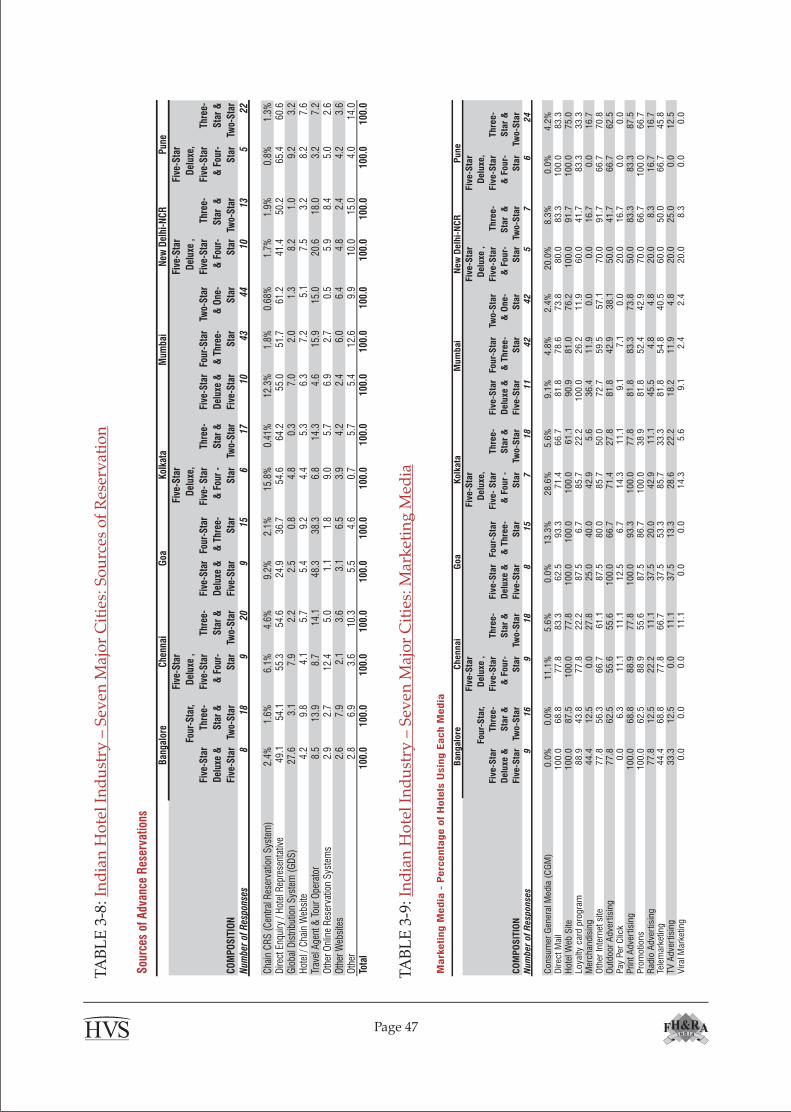
TA
BL
E 3
-8:
Ind
ian
Ho
tel
Ind
ust
ry –
Sev
en M
ajo
r C
itie
s: S
ou
rces
of
Res
erv
atio
n
M
ark
eti
ng M
edia
- P
erc
enta
ge o
f H
ote
ls U
sin
g E
ach M
edia
CO
MP
OS
ITIO
N
Fiv
e-S
tar
Delu
xe &
Fiv
e-S
tar
Four-
Sta
r,
Thre
e-
Sta
r &
Two-S
tar
Fiv
e-S
tar
Delu
xe ,
Fiv
e-S
tar
& F
our-
Sta
r
Thre
e-
Sta
r &
Two-S
tar
Fiv
e-S
tar
Delu
xe &
Fiv
e-S
tar
Four-
Sta
r
& T
hre
e-
Sta
r
Fiv
e-S
tar
Delu
xe,
Fiv
e-
Sta
r
& F
our
-
Sta
r
Thre
e-
Sta
r &
Two-S
tar
Fiv
e-S
tar
Delu
xe &
Fiv
e-S
tar
Four-
Sta
r
& T
hre
e-
Sta
r
Two-S
tar
& O
ne-
Sta
r
Fiv
e-S
tar
Delu
xe ,
Fiv
e-S
tar
& F
our-
Sta
r
Thre
e-
Sta
r &
Two-S
tar
Fiv
e-S
tar
Delu
xe,
Fiv
e-S
tar
& F
our-
Sta
r
Thre
e-
Sta
r &
Two-S
tar
Num
ber
of
Resp
onse
s9
16
918
815
718
11
42
42
57
624
Consu
mer
Gen
eral
Med
ia (
CG
M)
0.0
%0
.0%
11
.1%
5.6
%0
.0%
13
.3%
28
.6%
5.6
%9
.1%
4.8
%2
.4%
20
.0%
8.3
%0
.0%
4.2
%D
irec
t M
ail
10
0.0
68
.87
7.8
83
.36
2.5
93
.37
1.4
66
.78
1.8
78
.67
3.8
80
.08
3.3
10
0.0
83
.3H
ote
l Web
Site
10
0.0
87
.51
00
.07
7.8
10
0.0
10
0.0
10
0.0
61
.19
0.9
81
.07
6.2
10
0.0
91
.71
00
.07
5.0
Loya
lty c
ard p
rogra
m8
8.9
43
.87
7.8
22
.28
7.5
6.7
85
.72
2.2
10
0.0
26
.21
1.9
60
.04
1.7
83
.33
3.3
Mer
chan
dis
ing
44
.41
2.5
0.0
27
.82
5.0
40
.04
2.9
5.6
36
.41
1.9
0.0
0.0
16
.70
.01
6.7
Oth
er Inte
rnet
site
77
.85
6.3
66
.76
1.1
87
.58
0.0
85
.75
0.0
72
.75
9.5
57
.17
0.0
91
.76
6.7
70
.8O
utd
oor
Adve
rtis
ing
77
.86
2.5
55
.65
5.6
10
0.0
66
.77
1.4
27
.88
1.8
42
.93
8.1
50
.04
1.7
66
.76
2.5
Pay
Per
Clic
k0
.06
.31
1.1
11
.11
2.5
6.7
14
.31
1.1
9.1
7.1
0.0
20
.01
6.7
0.0
0.0
Print A
dve
rtis
ing
10
0.0
68
.88
8.9
77
.81
00
.09
3.3
10
0.0
77
.88
1.8
83
.37
3.8
50
.08
3.3
83
.38
7.5
Pro
motio
ns
10
0.0
62
.58
8.9
55
.68
7.5
86
.71
00
.03
8.9
81
.85
2.4
42
.97
0.0
66
.71
00
.06
6.7
Rad
io A
dve
rtis
ing
77
.81
2.5
22
.21
1.1
37
.52
0.0
42
.91
1.1
45
.54
.84
.82
0.0
8.3
16
.71
6.7
Tele
mar
ketin
g4
4.4
68
.87
7.8
66
.73
7.5
53
.38
5.7
33
.38
1.8
54
.84
0.5
60
.05
0.0
66
.74
5.8
TV
Adve
rtis
ing
33
.31
2.5
0.0
11
.13
7.5
13
.32
8.6
22
.21
8.2
11
.94
.82
0.0
25
.00
.01
2.5
Viral
Mar
ketin
g0
.00
.00
.01
1.1
0.0
0.0
14
.35
.69
.12
.42
.42
0.0
8.3
0.0
0.0
Bangalo
reC
hennai
Goa
Kolk
ata
Mum
bai
New
Delh
i-N
CR
Pune
TA
BL
E 3
-9:
Ind
ian
Ho
tel
Ind
ust
ry –
Sev
en M
ajo
r C
itie
s: M
ark
etin
g M
edia
Page 47
S
ourc
es o
f A
dvan
ce R
eser
vatio
ns
CO
MP
OS
ITIO
N
Five
-Sta
r
Del
uxe
&
Five
-Sta
r
Four
-Sta
r,
Thre
e-
Sta
r &
Two-
Sta
r
Five
-Sta
r
Del
uxe
,
Five
-Sta
r
& F
our-
Sta
r
Thre
e-
Sta
r &
Two-
Sta
r
Five
-Sta
r
Del
uxe
&
Five
-Sta
r
Four
-Sta
r
& T
hree
-
Sta
r
Five
-Sta
r
Del
uxe,
Five
- S
tar
& F
our
-
Sta
r
Thre
e-
Sta
r &
Two-
Sta
r
Five
-Sta
r
Del
uxe
&
Five
-Sta
r
Four
-Sta
r
& T
hree
-
Sta
r
Two-
Sta
r
& O
ne-
Sta
r
Five
-Sta
r
Del
uxe
,
Five
-Sta
r
& F
our-
Sta
r
Thr
ee-
Sta
r &
Two-
Sta
r
Five
-Sta
r
Del
uxe,
Five
-Sta
r
& F
our-
Sta
r
Thre
e-
Sta
r &
Two-
Sta
r
Num
ber
of R
espo
nses
818
920
915
617
1043
4410
135
22
Cha
in C
RS
(C
entr
al R
eser
vatio
n S
yste
m)
2.4%
1.6%
6.1%
4.6%
9.2%
2.1%
15.8
%0.
41%
12.3
%1.
8%0.
68%
1.7%
1.9%
0.8%
1.3%
Dire
ct E
nqui
ry /
Hot
el R
epre
sent
ativ
e49
.154
.155
.354
.624
.936
.754
.664
.255
.051
.761
.241
.450
.265
.460
.6G
loba
l Dis
trib
utio
n S
yste
m (
GD
S)
27.6
3.1
7.9
2.2
2.5
0.8
4.8
0.3
7.0
2.0
1.3
8.2
1.0
9.2
3.2
Hot
el /
Cha
in W
ebsi
te4.
29.
84.
15.
75.
49.
24.
45.
36.
37.
25.
17.
53.
28.
27.
6Tr
avel
Age
nt &
Tou
r O
pera
tor
8.5
13.9
8.7
14.1
48.3
38.3
6.8
14.3
4.6
15.9
15.0
20.6
18.0
3.2
7.2
Oth
er O
nlin
e R
eser
vatio
n S
yste
ms
2.9
2.7
12.4
5.0
1.1
1.8
9.0
5.7
6.9
2.7
0.5
5.9
8.4
5.0
2.6
Oth
er W
ebsi
tes
2.6
7.9
2.1
3.6
3.1
6.5
3.9
4.2
2.4
6.0
6.4
4.8
2.4
4.2
3.6
Oth
er2.
86.
93.
610
.35.
54.
60.
75.
75.
412
.69.
910
.015
.04.
014
.0To
tal
100.
010
0.0
100.
010
0.0
100.
010
0.0
100.
010
0.0
100.
010
0.0
100.
010
0.0
100.
010
0.0
100.
0
Pun
eB
anga
lore
Che
nnai
Goa
Kol
kata
Mum
bai
New
Del
hi-N
CR
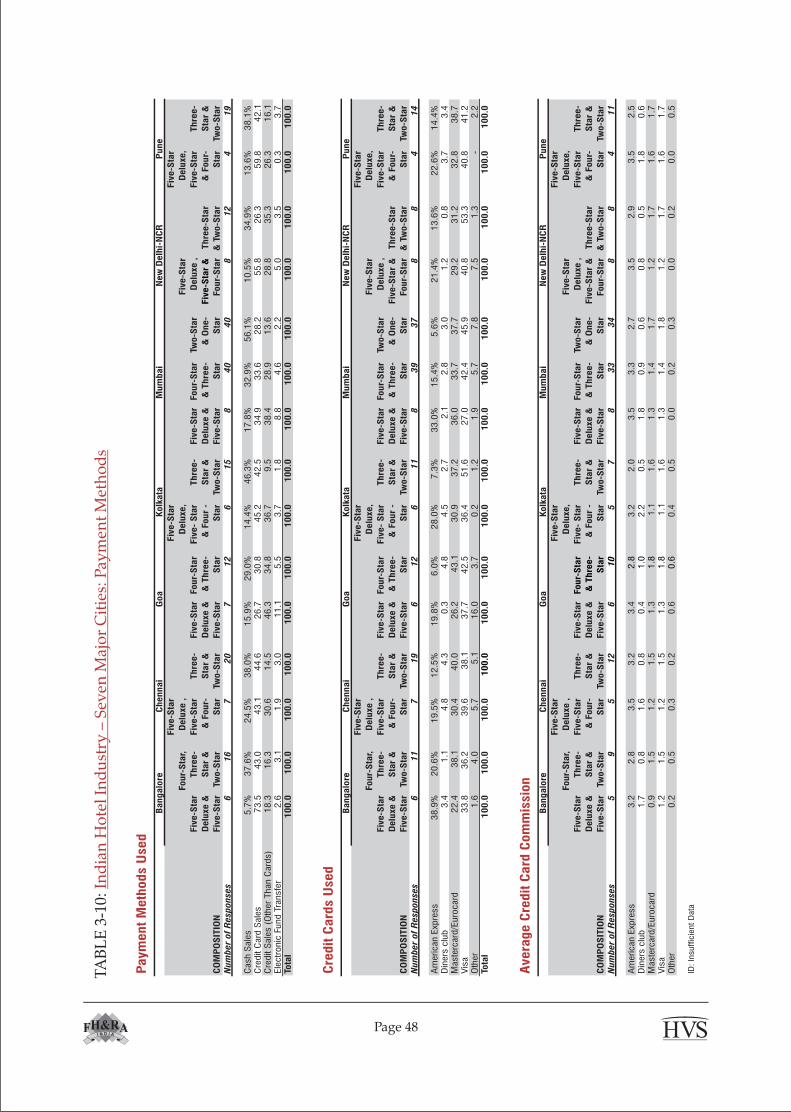
TA
BL
E 3
-10:
In
dia
n H
ote
l In
du
stry
– S
even
Maj
or
Cit
ies:
Pay
men
t M
eth
od
s
Page 48
P
aym
ent
Meth
ods U
sed
CO
MP
OS
ITIO
N
Fiv
e-S
tar
Delu
xe &
Fiv
e-S
tar
Four-
Sta
r,
Thre
e-
Sta
r &
Two-S
tar
Fiv
e-S
tar
Delu
xe ,
Fiv
e-S
tar
& F
our-
Sta
r
Thre
e-
Sta
r &
Two-S
tar
Fiv
e-S
tar
Delu
xe &
Fiv
e-S
tar
Four-
Sta
r
& T
hre
e-
Sta
r
Fiv
e-S
tar
Delu
xe,
Fiv
e-
Sta
r
& F
our
-
Sta
r
Thre
e-
Sta
r &
Two-S
tar
Fiv
e-S
tar
Delu
xe &
Fiv
e-S
tar
Four-
Sta
r
& T
hre
e-
Sta
r
Two-S
tar
& O
ne-
Sta
r
Fiv
e-S
tar
Delu
xe ,
Fiv
e-S
tar
&
Four-
Sta
r
Thre
e-S
tar
& T
wo-S
tar
Fiv
e-S
tar
Delu
xe,
Fiv
e-S
tar
& F
our-
Sta
r
Thre
e-
Sta
r &
Two-S
tar
Num
ber
of
Responses
616
720
712
615
840
40
812
419
Cash S
ale
s5
.7%
37
.6%
24
.5%
38
.0%
15
.9%
29
.0%
14
.4%
46
.3%
17
.8%
32
.9%
56
.1%
10
.5%
34
.9%
13
.6%
38
.1%
Cre
dit C
ard
Sale
s7
3.5
43
.0
4
3.1
44
.6
2
6.7
30
.8
45
.2
4
2.5
34
.9
3
3.6
28
.2
5
5.8
26
.3
5
9.8
42
.1C
redit S
ale
s (
Oth
er
Than C
ard
s)
18
.3
1
6.3
30
.6
14
.5
4
6.3
34
.8
36
.7
9
.5
38
.4
2
8.9
13
.6
2
8.8
35
.3
2
6.3
16
.1Ele
ctr
onic
Fund T
ransfe
r2
.6
3.1
1
.9
3.0
1
1.1
5
.5
3
.7
1.8
8
.8
4.6
2
.2
5.0
3
.5
0.3
3
.7To
tal
100.0
100.0
100.0
100.0
100.0
100.0
100.0
100.0
100.0
100.0
100.0
100.0
100.0
100.0
100.0
Cre
dit
Card
s U
sed
CO
MP
OS
ITIO
N
Fiv
e-S
tar
Delu
xe &
Fiv
e-S
tar
Four-
Sta
r,
Thre
e-
Sta
r &
Two-S
tar
Fiv
e-S
tar
Delu
xe ,
Fiv
e-S
tar
& F
our-
Sta
r
Thre
e-
Sta
r &
Two-S
tar
Fiv
e-S
tar
Delu
xe &
Fiv
e-S
tar
Four-
Sta
r
& T
hre
e-
Sta
r
Fiv
e-S
tar
Delu
xe,
Fiv
e-
Sta
r
& F
our
-
Sta
r
Thre
e-
Sta
r &
Two-S
tar
Fiv
e-S
tar
Delu
xe &
Fiv
e-S
tar
Four-
Sta
r
& T
hre
e-
Sta
r
Two-S
tar
& O
ne-
Sta
r
Fiv
e-S
tar
Delu
xe ,
Fiv
e-S
tar
&
Four-
Sta
r
Thre
e-S
tar
& T
wo-S
tar
Fiv
e-S
tar
Delu
xe,
Fiv
e-S
tar
& F
our-
Sta
r
Thre
e-
Sta
r &
Two-S
tar
Num
ber
of
Responses
611
719
612
611
839
37
88
414
Am
erican E
xpre
ss
38
.9%
20
.6%
19
.5%
12
.5%
19
.8%
6.0
%2
8.0
%7
.3%
33
.0%
15
.4%
5.6
%2
1.4
%1
3.6
%2
2.6
%1
4.4
%D
iners
clu
b3
.4
1.1
4.8
4.3
0.3
4.8
4.5
2.7
2.1
2.8
3.0
1.2
0.8
3.7
3.4
Maste
rcard
/Euro
card
22
.4
38
.1
30
.4
4
0.0
26
.2
43
.1
30
.9
37
.2
36
.0
33
.7
37
.7
29
.2
31
.2
32
.8
38
.7V
isa
33
.8
36
.2
39
.6
38
.1
37
.7
42
.5
36
.4
51
.6
27
.0
42
.4
45
.9
40
.8
53
.3
40
.8
41
.2O
ther
1.6
4.0
5.7
5.1
16
.0
3
.7
0.2
1.2
1.9
5.7
7.8
7.5
1.3
-
2.2
Tota
l100.0
100.0
100.0
100.0
100.0
100.0
100.0
100.0
100.0
100.0
100.0
100.0
100.0
100.0
100.0
Avera
ge C
redit
Card
Com
mis
sio
n
CO
MP
OS
ITIO
N
Fiv
e-S
tar
Delu
xe &
Fiv
e-S
tar
Four-
Sta
r,
Thre
e-
Sta
r &
Two-S
tar
Fiv
e-S
tar
Delu
xe ,
Fiv
e-S
tar
& F
our-
Sta
r
Thre
e-
Sta
r &
Two-S
tar
Fiv
e-S
tar
Delu
xe &
Fiv
e-S
tar
Four-
Sta
r
& T
hre
e-
Sta
r
Fiv
e-S
tar
Delu
xe,
Fiv
e-
Sta
r
& F
our
-
Sta
r
Thre
e-
Sta
r &
Two-S
tar
Fiv
e-S
tar
Delu
xe &
Fiv
e-S
tar
Four-
Sta
r
& T
hre
e-
Sta
r
Two-S
tar
& O
ne-
Sta
r
Fiv
e-S
tar
Delu
xe ,
Fiv
e-S
tar
&
Four-
Sta
r
Thre
e-S
tar
& T
wo-S
tar
Fiv
e-S
tar
Delu
xe,
Fiv
e-S
tar
& F
our-
Sta
r
Thre
e-
Sta
r &
Two-S
tar
Num
ber
of
Responses
59
512
610
57
833
34
88
411
Am
erican E
xpre
ss
3.2
2.8
3.5
3.2
3.4
2.8
3.2
2.0
3.5
3.3
2.7
3.5
2.9
3.5
2.5
Din
ers
clu
b1
.70
.81
.60
.80
.41
.02
.20
.51
.80
.90
.60
.80
.51
.80
.6M
aste
rcard
/Euro
card
0.9
1.5
1.2
1.5
1.3
1.8
1.1
1.6
1.3
1.4
1.7
1.2
1.7
1.6
1.7
Vis
a1
.21
.51
.21
.51
.31
.81
.11
.61
.31
.41
.81
.21
.71
.61
.7O
ther
0.2
0.5
0.3
0.2
0.6
0.6
0.4
0.5
0.0
0.2
0.3
0.0
0.2
0.0
0.5
ID:
Insuff
icie
nt D
ata
Pune
Bangalo
reC
hennai
Goa
Kolk
ata
Mum
bai
New
Delh
i-N
CR
Pune
Bangalo
reC
hennai
Goa
Kolk
ata
Mum
bai
New
Delh
i-N
CR
Pune
Bangalo
reC
hennai
Goa
Kolk
ata
Mum
bai
New
Delh
i-N
CR
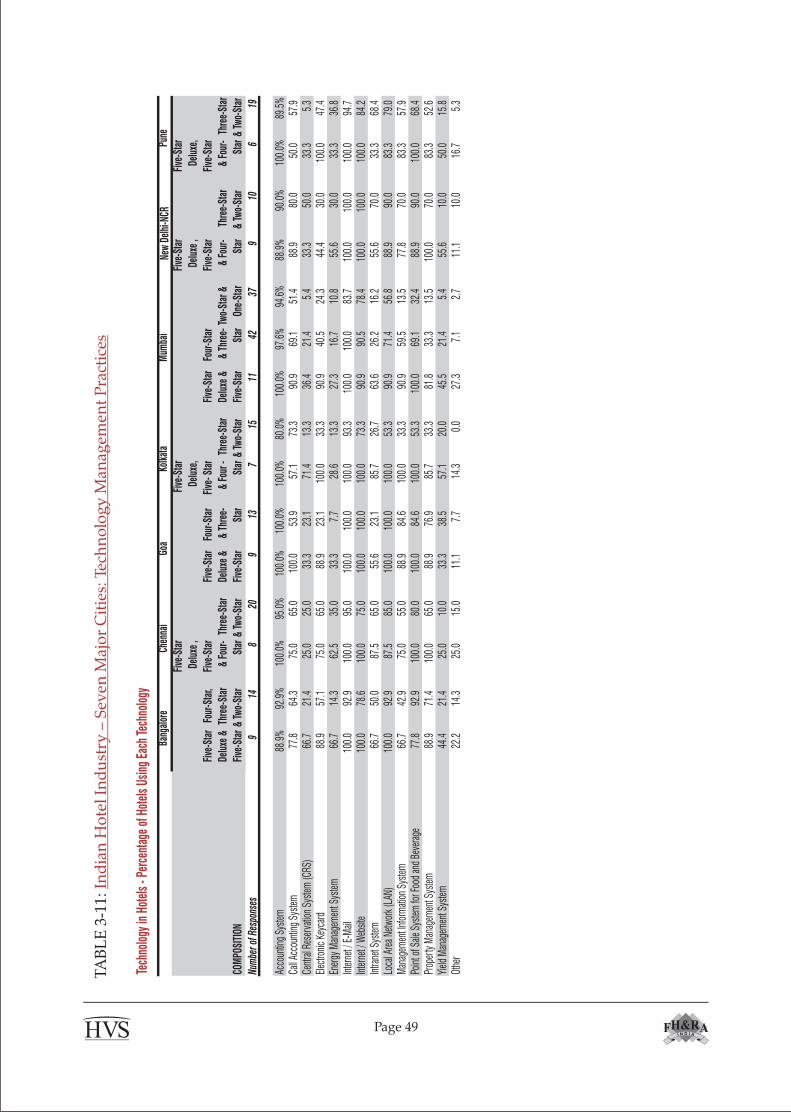
TA
BL
E 3
-11:
In
dia
n H
ote
l In
du
stry
– S
even
Maj
or
Cit
ies:
Tec
hn
olo
gy
Man
agem
ent
Pra
ctic
es
Page 49
Tech
nolo
gy in
Hot
els
- Per
cent
age
of H
otel
s Us
ing
Each
Tech
nolo
gy
COM
POSI
TION
Five
-Sta
r
Delu
xe &
Five
-Sta
r
Four
-Sta
r,
Thre
e-St
ar
& Tw
o-St
ar
Five
-Sta
r
Delu
xe ,
Five
-Sta
r
& F
our-
Star
Thr
ee-S
tar
& Tw
o-St
ar
Five
-Sta
r
Delu
xe &
Five
-Sta
r
Four
-Sta
r
& T
hree
-
Star
Five
-Sta
r
Delu
xe,
Five
- Sta
r
& F
our -
Star
Thre
e-St
ar
& Tw
o-St
ar
Five
-Sta
r
Delu
xe &
Five
-Sta
r
Four
-Sta
r
& T
hree
-
Star
Two-
Star
&
One-
Star
Five
-Sta
r
Delu
xe ,
Five
-Sta
r
& F
our-
Star
Thr
ee-S
tar
& Tw
o-St
ar
Five
-Sta
r
Delu
xe,
Five
-Sta
r
& F
our-
Star
Thre
e-St
ar
& Tw
o-St
ar
Num
ber o
f Res
pons
es9
148
209
137
1511
4237
910
619
Acco
untin
g Sy
stem
88.9
%92
.9%
100.
0%95
.0%
100.
0%10
0.0%
100.
0%80
.0%
100.
0%97
.6%
94.6
%88
.9%
90.0
%10
0.0%
89.5
%Ca
ll Acc
ount
ing
Syst
em77
.864
.375
.065
.010
0.0
53.9
57.1
73.3
90.9
69.1
51.4
88.9
80.0
50.0
57.9
Cent
ral R
eser
vatio
n Sy
stem
(CRS
)66
.721
.425
.025
.033
.323
.171
.413
.336
.421
.45.
433
.350
.033
.35.
3El
ectro
nic
Keyc
ard
88.9
57.1
75.0
65.0
88.9
23.1
100.
033
.390
.940
.524
.344
.430
.010
0.0
47.4
Ener
gy M
anag
emen
t Sys
tem
66.7
14.3
62.5
35.0
33.3
7.7
28.6
13.3
27.3
16.7
10.8
55.6
30.0
33.3
36.8
Inte
rnet
/ E-
100.
092
.910
0.0
95.0
100.
010
0.0
100.
093
.310
0.0
100.
083
.710
0.0
100.
010
0.0
94.7
Inte
rnet
/ W
ebsit
e10
0.0
78.6
100.
075
.010
0.0
100.
010
0.0
73.3
90.9
90.5
78.4
100.
010
0.0
100.
084
.2In
trane
t Sys
tem
66.7
50.0
87.5
65.0
55.6
23.1
85.7
26.7
63.6
26.2
16.2
55.6
70.0
33.3
68.4
Loca
l Are
a Ne
twor
k (L
AN)
100.
092
.987
.585
.010
0.0
100.
010
0.0
53.3
90.9
71.4
56.8
88.9
90.0
83.3
79.0
Man
agem
ent I
nfor
mat
ion
Syst
em66
.742
.975
.055
.088
.984
.610
0.0
33.3
90.9
59.5
13.5
77.8
70.0
83.3
57.9
Poin
t of S
ale S
yste
m fo
r Foo
d an
d Be
vera
ge77
.892
.910
0.0
80.0
100.
084
.610
0.0
53.3
100.
069
.132
.488
.990
.010
0.0
68.4
Prop
erty
Man
agem
ent S
yste
m88
.971
.410
0.0
65.0
88.9
76.9
85.7
33.3
81.8
33.3
13.5
100.
070
.083
.352
.6Yi
eld M
anag
emen
t Sys
tem
44.4
21.4
25.0
10.0
33.3
38.5
57.1
20.0
45.5
21.4
5.4
55.6
10.0
50.0
15.8
Othe
r22
.214
.325
.015
.011
.17.
714
.30.
027
.37.
12.
711
.110
.016
.75.
3
Pune
Bang
alor
eCh
enna
iGo
aKo
lkat
aM
umba
iNe
w D
elhi
-NCR
Extended Stay Segment: Visakhapatnam has a large proportion of long stay guests in the foreign and business guests segments. This can be attributed to the nature of the industry developing in and around the city; these are primarily steel, ship building, oil and natural gas exploration. These factors highlight potential for the extended stay segment and thus, the demand for serviced apartments in the city.
Hill Station Destinations: Shimla and Ootacamund, though similar in their being hill resort destinations in close proximity to major cities, differ in their ratio of domestic to foreign guests. With a high dependence on domestic guests, Shimla is very price sensitive inhibiting the development of higher category hotels in it. Destruction of natural beauty and overpopulation of Shimla are some of the factors that are affecting the destination's performance.
Banquets & Conferences: Cities such as Ahmedabad, Chandigarh, Indore and Jaipur, which have a substantial portion of revenue from Banquets & Conferences have proportionally lower F&B costs than other cities. Considering the ample demand for quality banqueting venues in the country, newer hotels should look at capitalising on this opportunity.
Introduction
This section presents the operating profiles and financial data for different categories of hotels in 12 other cities. These cities are Ahmedabad, Chandigarh, Coimbatore, Kochi, Hyderabad, Jaipur, Indore, Ootacamund, Shimla, Thiruvananthapuram, Vadodara and Visakhapatnam. This section will give the reader an understanding of the markets in these cities.
Qualifying Condition
In certain cities and for certain star categories, we were unable to fulfil the minimum data requirement of a minimum of four hotels in each representation and have reflected this as 'ID' (insufficient data).
Key Trends
Highlighted below are some trends noted in the 2008/09 survey across these 12 participating cities.
4. Indian Hotel Industry – Twelve Other Cities
Page 50
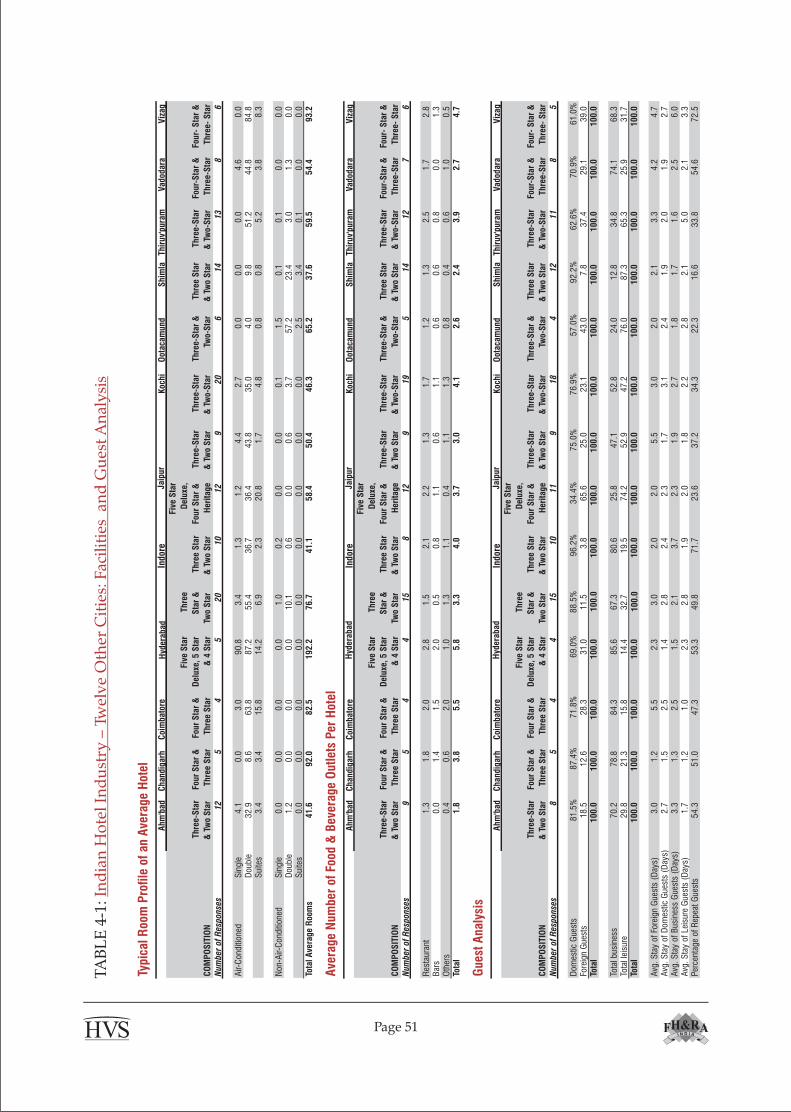
TA
BL
E 4
-1:
Ind
ian
Ho
tel
Ind
ust
ry –
Tw
elv
e O
ther
Cit
ies:
Fac
ilit
ies
an
d G
ues
t A
nal
ysi
s
Page 51
Ty
pic
al R
oom
Pro
file
of
an A
vera
ge
Hot
el
Ahm
'bad
Chandig
arh
Coi
mbato
reIn
dor
eK
ochi
Oot
aca
mund
Shim
laTh
iruv'
pura
mV
adod
ara
Viz
ag
CO
MP
OS
ITIO
N
Thre
e-S
tar
& T
wo
Sta
r
Four
Sta
r &
Thre
e S
tar
Four
Sta
r &
Thre
e S
tar
Fiv
e S
tar
Del
uxe
, 5 S
tar
& 4
Sta
r
Thre
e
Sta
r &
Two
Sta
r
Thre
e S
tar
& T
wo
Sta
r
Fiv
e S
tar
Del
uxe
,
Four
Sta
r &
Her
itage
Thre
e-S
tar
& T
wo
Sta
r
Thre
e-S
tar
& T
wo-
Sta
r
Thre
e-S
tar
&
Two-
Sta
r
Thre
e S
tar
& T
wo
Sta
r
Thre
e-S
tar
& T
wo-
Sta
r
Four-
Sta
r &
Thre
e-S
tar
Four-
Sta
r &
Thre
e- S
tar
Num
ber
of
Resp
onse
s12
54
520
10
12
920
614
13
86
Air-
Con
ditio
ned
Sin
gle
4.1
0.0
3.0
90
.83
.41
.31
.24
.42
.70
.00
.00
.04
.60
.0D
oubl
e3
2.9
8.6
63
.88
7.2
55
.43
6.7
36
.44
3.8
35
.04
.09
.85
1.2
44
.88
4.8
Sui
tes
3.4
3.4
15
.81
4.2
6.9
2.3
20
.81
.74
.80
.80
.85
.23
.88
.3
Non
-Air-
Con
ditio
ned
Sin
gle
0.0
0.0
0.0
0.0
1.0
0.2
0.0
0.0
0.1
1.5
0.1
0.1
0.0
0.0
Dou
ble
1.2
0.0
0.0
0.0
10
.10
.60
.00
.63
.75
7.2
23
.43
.01
.30
.0S
uite
s0
.00
.00
.00
.00
.00
.00
.00
.00
.02
.53
.40
.10
.00
.0To
tal A
vera
ge
Roo
ms
41.6
92.0
82.5
192.2
76.7
41.1
58.4
50.4
46.3
65.2
37.6
59.5
54.4
93.2
Ave
rage
Num
ber
of
Food
& B
ever
age
Outl
ets
Per
Hot
el
Ahm
'bad
Chandig
arh
Coi
mbato
reIn
dor
eK
ochi
Oot
aca
mund
Shim
laTh
iruv'
pura
mV
adod
ara
Viz
ag
CO
MP
OS
ITIO
N
Thre
e-S
tar
& T
wo
Sta
r
Four
Sta
r &
Thre
e S
tar
Four
Sta
r &
Thre
e S
tar
Fiv
e S
tar
Del
uxe
, 5 S
tar
& 4
Sta
r
Thre
e
Sta
r &
Two
Sta
r
Thre
e S
tar
& T
wo
Sta
r
Fiv
e S
tar
Del
uxe
,
Four
Sta
r &
Her
itage
Thre
e-S
tar
& T
wo
Sta
r
Thre
e-S
tar
& T
wo-
Sta
r
Thre
e-S
tar
&
Two-
Sta
r
Thre
e S
tar
& T
wo
Sta
r
Thre
e-S
tar
& T
wo-
Sta
r
Four-
Sta
r &
Thre
e-S
tar
Four-
Sta
r &
Thre
e- S
tar
Num
ber
of
Resp
onse
s9
54
415
812
919
514
12
76
Res
taur
ant
1.3
1.8
2.0
2.8
1.5
2.1
2.2
1.3
1.7
1.2
1.3
2.5
1.7
2.8
Bar
s0
.01
.41
.52
.00
.50
.81
.10
.61
.10
.60
.60
.80
.01
.3O
ther
s0
.40
.62
.01
.01
.31
.10
.41
.11
.30
.80
.40
.61
.00
.5To
tal
1.8
3.8
5.5
5.8
3.3
4.0
3.7
3.0
4.1
2.6
2.4
3.9
2.7
4.7
Gues
t A
naly
sis
Ahm
'bad
Chandig
arh
Coi
mbato
reIn
dor
eK
ochi
Oot
aca
mund
Shim
laTh
iruv'
pura
mV
adod
ara
Viz
ag
CO
MP
OS
ITIO
N
Thre
e-S
tar
& T
wo
Sta
r
Four
Sta
r &
Thre
e S
tar
Four
Sta
r &
Thre
e S
tar
Fiv
e S
tar
Del
uxe
, 5 S
tar
& 4
Sta
r
Thre
e
Sta
r &
Two
Sta
r
Thre
e S
tar
& T
wo
Sta
r
Fiv
e S
tar
Del
uxe
,
Four
Sta
r &
Her
itage
Thre
e-S
tar
& T
wo
Sta
r
Thre
e-S
tar
& T
wo-
Sta
r
Thre
e-S
tar
&
Two-
Sta
r
Thre
e S
tar
& T
wo
Sta
r
Thre
e-S
tar
& T
wo-
Sta
r
Four-
Sta
r &
Thre
e-S
tar
Four-
Sta
r &
Thre
e- S
tar
Num
ber
of
Resp
onse
s8
54
415
10
11
918
412
11
85
Dom
estic
Gue
sts
81
.5%
87
.4%
71
.8%
69
.0%
88
.5%
96
.2%
34
.4%
75
.0%
76
.9%
57
.0%
92
.2%
62
.6%
70
.9%
61
.0%
Fore
ign
Gue
sts
18
.51
2.6
28
.33
1.0
11
.53
.86
5.6
25
.02
3.1
43
.07
.83
7.4
29
.13
9.0
Tota
l100.0
100.0
100.0
100.0
100.0
100.0
100.0
100.0
100.0
100.0
100.0
100.0
100.0
Tota
l bus
ines
s7
0.2
78
.88
4.3
85
.66
7.3
80
.62
5.8
47
.15
2.8
24
.01
2.8
34
.87
4.1
68
.3To
tal l
eisu
re2
9.8
21
.31
5.8
14
.43
2.7
19
.57
4.2
52
.94
7.2
76
.08
7.3
65
.32
5.9
31
.7To
tal
100.0
100.0
100.0
100.0
100.0
100.0
100.0
100.0
100.0
100.0
100.0
100.0
100.0
Avg
. S
tay
of F
orei
gn G
uest
s (D
ays)
3.0
1.2
5.5
2.3
3.0
2.0
2.0
5.5
3.0
2.0
2.1
3.3
4.2
4.7
Avg
. S
tay
of D
omes
tic G
uest
s (D
ays)
2.7
1.5
2.5
1.4
2.8
2.4
2.3
1.7
3.1
2.4
1.9
2.0
1.9
2.7
Avg
. S
tay
of B
usin
ess
Gue
sts
(Day
s)3
.31
.32
.51
.52
.13
.72
.31
.92
.71
.81
.71
.62
.56
.0A
vg.
Sta
y of
Lei
sure
Gue
sts
(Day
s)1
.71
.21
.02
.32
.81
.92
.01
.82
.22
.82
.15
.02
.13
.3P
erce
ntag
e of
Rep
eat G
uest
s5
4.3
51
.04
7.3
53
.34
9.8
71
.72
3.6
37
.23
4.3
22
.31
6.6
33
.85
4.6
72
.5
Hyd
erabad
Jaip
ur
Hyd
erabad
Jaip
ur
Hyd
erabad
Jaip
ur
100.0
100.0

Av
erag
e Nu
mbe
r of T
otal
Em
ploy
ees
Per H
otel
(Per
man
ent /
Con
tract
/ Fu
ll Ti
me
/ Par
t Tim
e)
Ahm
'bad
Chan
diga
rhCo
imba
tore
Indo
reKo
chi
Oota
cam
und
Shim
laTh
iruv'p
uram
Vado
dara
Viza
g
COM
POSI
TION
Thre
e St
ar
& T
wo
Star
Four
Sta
r &
Thre
e St
ar
Four
Sta
r &
Thre
e St
ar
Five
Sta
r
Delu
xe, 5
Star
& 4
Star
Thre
e
Star
&
Two
Star
Thre
e St
ar
& T
wo
Star
Five
Sta
r
Delu
xe,
Four
Sta
r
& H
erita
ge
Thr
ee-S
tar
& T
wo-
Sta
r
Thre
e-St
ar
& T
wo-
Star
Thre
e-St
ar
& T
wo-
Star
Thre
e-St
ar
& T
wo-
Star
Thr
ee-S
tar
& T
wo-
Star
Four
-Sta
r &
Thre
e-St
ar
Four
- Sta
r &
Thre
e- S
tar
Num
ber o
f Res
pons
es11
44
515
1012
916
614
128
6
Man
ager
sM
ale
5.2
6.0
13.5
43.2
7.5
10.1
11.3
6.2
7.6
4.5
2.1
8.5
6.6
14.8
Fem
ale
0.9
1.3
1.8
10.2
0.8
1.5
0.8
0.2
1.2
0.7
0.4
1.0
0.5
0.7
Supe
rvis
ors
Mal
e5.
911
.026
.330
.022
.512
.417
.56.
99.
16.
52.
29.
711
.115
.8Fe
mal
e1.
13.
01.
02.
44.
21.
81.
70.
71.
81.
30.
22.
81.
94.
0St
aff
Mal
e71
.415
5.3
134.
016
6.0
71.5
85.1
64.5
46.4
53.1
45.3
25.2
62.6
74.5
172.
3Fe
mal
e3.
713
.520
.817
.08.
91.
33.
11.
610
.410
.70.
715
.72.
121
.5To
tal
88.2
190.
019
7.3
268.
811
5.3
112.
298
.862
.083
.169
.030
.910
0.3
96.8
229.
2
Aver
age
Num
ber o
f Em
ploy
ees
per R
oom
2.2
2.3
2.3
1.5
1.5
2.8
1.6
1.3
2.0
1.3
0.9
2.0
1.7
2.8
Aver
age
Perc
enta
ge o
f Tra
ined
Em
ploy
ees
Per H
otel
Ahm
'bad
Chan
diga
rhCo
imba
tore
Indo
reKo
chi
Oota
cam
und
Shim
laTh
iruv'p
uram
Vado
dara
Viza
g
COM
POSI
TION
Thre
e St
ar
& T
wo
Star
Four
Sta
r &
Thre
e St
ar
Four
Sta
r &
Thre
e St
ar
Five
Sta
r
Delu
xe, 5
Star
& 4
Star
Thre
e
Star
&
Two
Star
Thre
e St
ar
& T
wo
Star
Five
Sta
r
Delu
xe,
Four
Sta
r
& H
erita
ge
Thr
ee-S
tar
& T
wo-
Sta
r
Thre
e-St
ar
& T
wo-
Star
Thre
e-St
ar
& T
wo-
Star
Thre
e-St
ar
& T
wo-
Star
Thr
ee-S
tar
& T
wo-
Star
Four
-Sta
r &
Thre
e-St
ar
Four
- Sta
r &
Thre
e- S
tar
Num
ber o
f Res
pons
es5
44
510
710
716
36
115
5
Man
ager
s90
.5%
100.
0%87
.5%
100.
0%89
.6%
67.9
%97
.3%
100.
0%82
.5%
66.7
%91
.1%
74.1
%82
.9%
77.9
%
Supe
rvis
ors
72.0
80.8
72.6
94.4
68.3
53.1
100.
091
.488
.069
.491
.765
.879
.178
.5
Staf
f50
.249
.569
.779
.166
.235
.286
.177
.273
.673
.274
.662
.971
.553
.5
Tota
l Avg
. Tra
ined
Em
ploy
ees*
71.0
76.8
76.6
91.1
74.7
52.1
94.5
89.5
81.4
69.8
85.8
67.6
77.8
70.0
Tota
l Avg
. Un-
Trai
ned
Empl
oyee
s29
.023
.223
.48.
925
.348
.05.
510
.518
.630
.214
.232
.422
.230
.0
* Tr
aine
d Em
ploy
ees
incl
udes
thos
e w
ith a
min
imum
one
yea
r cer
tific
ate
cour
se in
an
educ
atio
nal i
nstit
ute,
how
ever
som
e ho
tels
may
hav
e in
clud
ed th
ose
with
sho
rt te
rm (i
n-ho
use)
trai
ning
Hyde
raba
dJa
ipur
Hyde
raba
dJa
ipur
TA
BL
E 4
-2:
Ind
ian
Ho
tel
Ind
ust
ry –
Tw
elv
e O
ther
Cit
ies:
Sta
ffin
g
Page 52
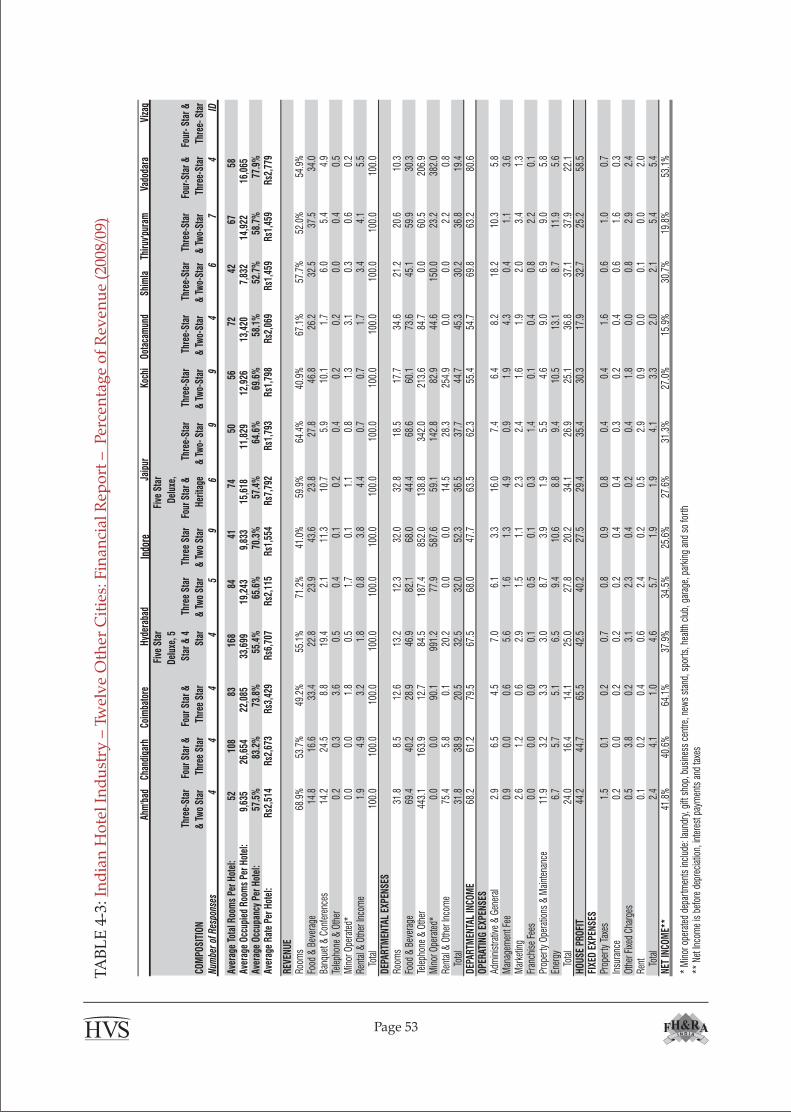
Ah
m'b
adCh
andi
garh
Coim
bato
reIn
dore
Koch
iO
otac
amun
dSh
imla
Thir
uv'p
uram
Vado
dara
Viza
g
COM
POSI
TIO
N
Thr
ee-S
tar
& T
wo
Star
Four
Sta
r &
Thre
e St
ar
Four
Sta
r &
Thre
e St
ar
Five
Sta
r
Del
uxe,
5
Star
& 4
Star
Thre
e St
ar
& T
wo
Star
Thre
e St
ar
& T
wo
Star
Five
Sta
r
Del
uxe,
Four
Sta
r &
Her
itage
Thr
ee-S
tar
& T
wo-
Sta
r
Thre
e-St
ar
& T
wo-
Star
Thre
e-St
ar
& T
wo-
Star
Thre
e-St
ar
& T
wo-
Star
Thre
e-St
ar
& T
wo-
Star
Four
-Sta
r &
Thre
e-St
ar
Four
- St
ar &
Thre
e- S
tar
Num
ber
of R
espo
nses
44
44
59
69
94
67
4ID
Aver
age
Tota
l Roo
ms
Per
Hot
el:
5210
883
168
8441
7450
5672
4267
58Av
erag
e O
ccup
ied
Roo
ms
Per
Hot
el:
9,63
526
,654
22,0
8533
,699
19,2
439,
833
15,6
1811
,829
12,9
2613
,420
7,83
214
,922
16,0
65Av
erag
e O
ccup
ancy
Per
Hot
el:
57.5
%83
.2%
73.8
%55
.4%
65.6
%70
.3%
57.4
%64
.6%
69.6
%58
.1%
52.7
%58
.7%
77.9
%Av
erag
e R
ate
Per
Hot
el:
Rs2,
514
Rs2,
673
Rs3,
429
Rs6,
707
Rs2,
115
Rs1,
554
Rs7,
792
Rs1,
793
Rs1,
798
Rs2,
069
Rs1,
459
Rs1,
459
Rs2,
779
REVE
NU
ERo
oms
68.9
%53
.7%
49.2
%55
.1%
71.2
%41
.0%
59.9
%64
.4%
40.9
%67
.1%
57.7
%52
.0%
54.9
%Fo
od &
Bev
erag
e14
.816
.633
.422
.823
.943
.623
.827
.846
.826
.232
.537
.534
.0Ba
nque
t & C
onfe
renc
es14
.224
.58.
819
.42.
111
.310
.75.
910
.11.
76.
05.
44.
9Te
leph
one
& O
ther
0.2
0.3
3.6
0.5
0.4
0.1
0.2
0.4
0.2
0.2
0.0
0.4
0.5
Min
or O
pera
ted*
0.0
0.0
1.8
0.5
1.7
0.1
1.1
0.8
1.3
3.1
0.3
0.6
0.2
Rent
al &
Oth
er In
com
e1.
94.
93.
21.
80.
83.
84.
40.
70.
71.
73.
44.
15.
5To
tal
100.
010
0.0
100.
010
0.0
100.
010
0.0
100.
010
0.0
100.
010
0.0
100.
010
0.0
100.
0D
EPAR
TMEN
TAL
EXPE
NSE
SRo
oms
31.8
8.5
12.6
13.2
12.3
32.0
32.8
18.5
17.7
34.6
21.2
20.6
10.3
Food
& B
ever
age
69.4
40.2
28.9
46.9
82.1
68.0
44.4
68.6
60.1
73.6
45.1
59.9
30.3
Tele
phon
e &
Oth
er44
3.1
163.
912
.784
.518
7.4
852.
013
8.8
342.
021
3.6
84.7
0.0
60.5
206.
9M
inor
Ope
rate
d*0.
00.
090
.199
1.2
77.9
587.
659
.114
2.8
82.9
44.6
150.
023
.238
2.0
Rent
al &
Oth
er In
com
e75
.45.
80.
120
.20.
00.
014
.528
.325
4.9
0.0
0.0
2.2
0.8
Tota
l31
.838
.920
.532
.532
.052
.336
.537
.744
.745
.330
.236
.819
.4D
EPAR
TMEN
TAL
INCO
ME
68.2
61.2
79.5
67.5
68.0
47.7
63.5
62.3
55.4
54.7
69.8
63.2
80.6
OPE
RATI
NG
EXP
ENSE
SAd
min
istra
tive
& G
ener
al2.
96.
54.
57.
06.
13.
316
.07.
46.
48.
218
.210
.35.
8M
anag
emen
t Fee
0.9
0.0
0.6
5.6
1.6
1.3
4.9
0.9
1.9
4.3
0.4
1.1
3.6
Mar
ketin
g2.
61.
20.
62.
91.
51.
12.
32.
41.
61.
92.
03.
41.
3Fr
anch
ise
Fees
0.0
0.0
0.0
0.1
0.5
0.1
0.3
1.4
0.1
0.4
0.8
2.2
0.1
Prop
erty
Ope
ratio
ns &
Mai
nten
ance
11.9
3.2
3.3
3.0
8.7
3.9
1.9
5.5
4.6
9.0
6.9
9.0
5.8
Ener
gy6.
75.
75.
16.
59.
410
.68.
89.
410
.513
.18.
711
.95.
6To
tal
24.0
16.4
14.1
25.0
27.8
20.2
34.1
26.9
25.1
36.8
37.1
37.9
22.1
HO
USE
PRO
FIT
44.2
44.7
65.5
42.5
40.2
27.5
29.4
35.4
30.3
17.9
32.7
25.2
58.5
FIXE
D E
XPEN
SES
Prop
erty
Tax
es1.
50.
10.
20.
70.
80.
90.
80.
40.
41.
60.
61.
00.
7In
sura
nce
0.2
0.0
0.2
0.2
0.2
0.4
0.4
0.3
0.2
0.4
0.6
1.6
0.3
Oth
er F
ixed
Cha
rges
0.5
3.8
0.2
3.1
2.3
0.4
0.2
0.4
1.8
0.0
0.8
2.9
2.4
Rent
0.
10.
20.
40.
62.
40.
20.
52.
90.
90.
00.
10.
02.
0To
tal
2.4
4.1
1.0
4.6
5.7
1.9
1.9
4.1
3.3
2.0
2.1
5.4
5.4
NET
INCO
ME*
*41
.8%
40.6
%64
.1%
37.9
%34
.5%
25.6
%27
.6%
31.3
%27
.0%
15.9
%30
.7%
19.8
%53
.1%
* M
inor
ope
rate
d de
part
men
ts in
clud
e: la
undr
y, g
ift s
hop,
bus
ines
s ce
ntre
, new
s st
and,
spo
rts,
hea
lth c
lub,
gar
age,
par
king
and
so
fort
h**
Net
Inco
me
is b
efor
e de
prec
iatio
n, in
tere
st p
aym
ents
and
taxe
s
Hyd
erab
adJa
ipur
TA
BL
E 4
-3:
Ind
ian
Ho
tel
Ind
ust
ry –
Tw
elv
e O
ther
Cit
ies:
Fin
anci
al R
epo
rt –
Per
cen
tag
e o
f R
even
ue
(200
8/09
)
Page 53
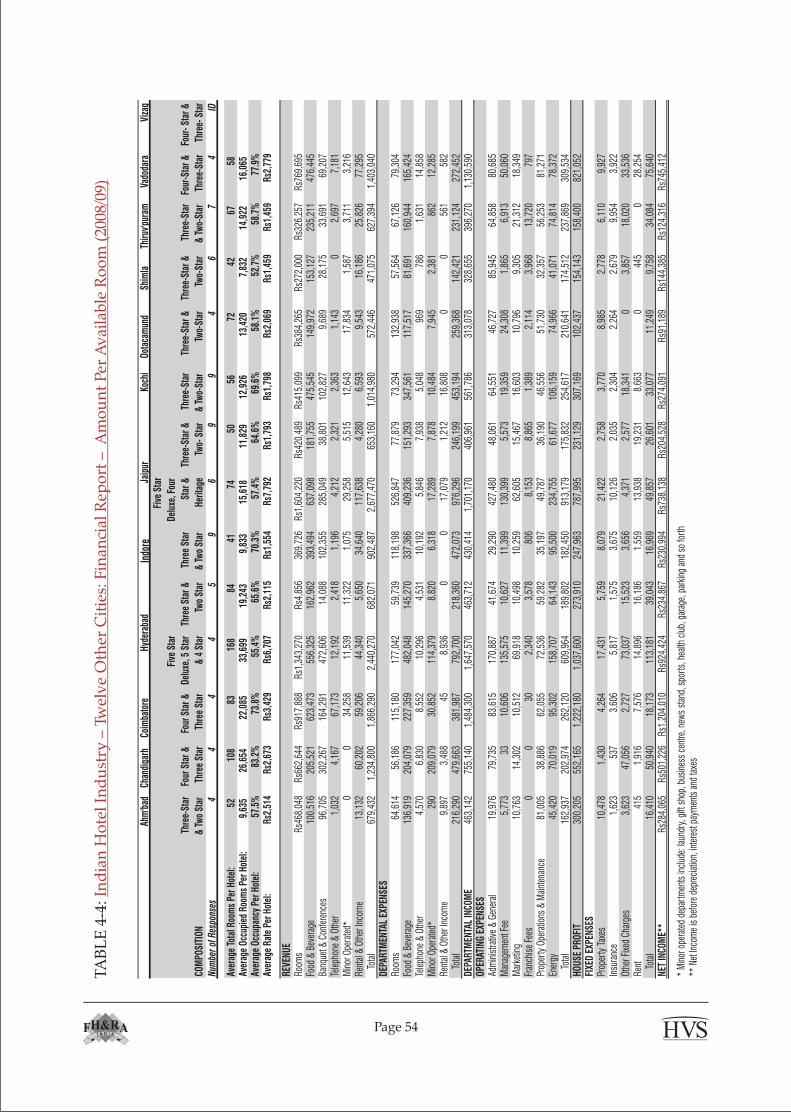
Ah
m'b
adCh
andi
garh
Coim
bato
reIn
dore
Koch
iOo
taca
mun
dSh
imla
Thiru
v'pu
ram
Vado
dara
Viza
g
COM
POSI
TION
Thr
ee-S
tar
& T
wo
Star
Four
Sta
r &
Thre
e St
ar
Four
Sta
r &
Thre
e St
ar
Five
Sta
r
Delu
xe, 5
Sta
r
& 4
Sta
r
Thre
e St
ar &
Two
Star
Thre
e St
ar
& T
wo
Star
Five
Sta
r
Delu
xe, F
our
Star
&
Her
itage
Thr
ee-S
tar &
Two-
Sta
r
Thre
e-St
ar
& T
wo-
Star
Thre
e-St
ar &
Two-
Star
Thre
e-St
ar &
Two-
Star
Thre
e-St
ar
& T
wo-
Star
Four
-Sta
r &
Thre
e-St
ar
Four
- Sta
r &
Thre
e- S
tar
Num
ber
of R
espo
nses
44
44
59
69
94
67
4ID
Aver
age
Tota
l Roo
ms
Per H
otel
:52
108
8316
884
4174
5056
7242
6758
Aver
age
Occu
pied
Roo
ms
Per H
otel
:9,
635
26,6
5422
,085
33,6
9919
,243
9,83
315
,618
11,8
2912
,926
13,4
207,
832
14,9
2216
,065
Aver
age
Occu
panc
y Pe
r Hot
el:
57.5
%83
.2%
73.8
%55
.4%
65.6
%70
.3%
57.4
%64
.6%
69.6
%58
.1%
52.7
%58
.7%
77.9
%Av
erag
e Ra
te P
er H
otel
:Rs
2,51
4Rs
2,67
3Rs
3,42
9Rs
6,70
7Rs
2,11
5Rs
1,55
4Rs
7,79
2Rs
1,79
3Rs
1,79
8Rs
2,06
9Rs
1,45
9Rs
1,45
9Rs
2,77
9
REVE
NUE
Room
sRs
468,
048
Rs66
2,64
4Rs
917,
888
Rs1,
343,
270
Rs4,
856
369,
726
Rs1,
604,
220
Rs42
0,48
9Rs
415,
099
Rs38
4,26
5Rs
272,
000
Rs32
6,25
7Rs
769,
695
Food
& B
ever
age
100,
516
205,
521
623,
473
556,
325
162,
962
393,
494
637,
098
181,
755
475,
545
149,
972
153,
127
235,
211
476,
445
Banq
uet &
Con
fere
nces
96,7
0530
2,26
716
4,29
147
2,60
614
,088
102,
355
285,
049
38,8
0110
2,82
79,
689
28,1
7533
,691
69,2
07Te
leph
one
& O
ther
1,03
24,
167
67,1
7312
,192
2,41
81,
196
4,21
22,
321
2,36
31,
143
02,
697
7,18
1M
inor
Ope
rate
d*0
034
,258
11,5
3911
,322
1,07
529
,258
5,51
512
,643
17,8
341,
587
3,71
13,
216
Rent
al &
Oth
er In
com
e13
,132
60,2
0259
,206
44,3
405,
650
34,6
4011
7,63
84,
280
6,59
39,
543
16,1
8625
,826
77,2
95To
tal
679,
432
1,23
4,80
01,
866,
290
2,44
0,27
068
2,07
190
2,48
72,
677,
470
653,
160
1,01
4,98
057
2,44
647
1,07
562
7,39
41,
403,
040
DEPA
RTM
ENTA
L EX
PENS
ESRo
oms
64,6
1456
,186
115,
180
177,
042
59,7
3911
8,19
852
6,84
777
,879
73,2
9413
2,93
857
,564
67,1
2679
,304
Food
& B
ever
age
136,
919
204,
079
227,
359
482,
048
145,
270
337,
366
409,
236
151,
293
347,
561
117,
517
81,6
9116
0,94
416
5,42
4Te
leph
one
& O
ther
4,57
06,
830
8,55
210
,296
4,53
110
,192
5,84
67,
938
5,04
896
978
61,
631
14,8
58M
inor
Ope
rate
d*29
020
9,07
930
,852
114,
379
8,82
06,
318
17,2
897,
878
10,4
847,
945
2,38
186
212
,285
Rent
al &
Oth
er In
com
e9,
897
3,48
845
8,93
60
017
,079
1,21
216
,808
00
561
582
Tota
l21
6,29
047
9,66
338
1,98
779
2,70
021
8,36
047
2,07
397
6,29
624
6,19
945
3,19
425
9,36
814
2,42
123
1,12
427
2,45
2DE
PART
MEN
TAL
INCO
ME
463,
142
755,
140
1,48
4,30
01,
647,
570
463,
712
430,
414
1,70
1,17
040
6,96
156
1,78
631
3,07
832
8,65
539
6,27
01,
130,
590
OPER
ATIN
G EX
PENS
ESAd
min
istra
tive
& G
ener
al19
,976
79,7
3583
,615
170,
887
41,6
7429
,290
427,
480
48,0
6164
,551
46,7
2785
,945
64,8
5880
,685
Man
agem
ent F
ee5,
773
3310
,606
135,
575
10,6
2711
,399
130,
399
5,57
319
,359
24,3
081,
865
6,91
350
,060
Mar
ketin
g10
,763
14,3
0210
,512
69,9
1810
,498
10,2
5962
,605
15,4
6716
,603
10,7
969,
305
21,3
1218
,349
Fran
chis
e Fe
es0
030
2,34
03,
578
806
8,15
38,
865
1,38
92,
114
3,96
813
,720
797
Prop
erty
Ope
ratio
ns &
Mai
nten
ance
81,0
0538
,886
62,0
5572
,536
59,2
8235
,197
49,7
8736
,190
46,5
5651
,730
32,3
5756
,253
81,2
71En
ergy
45,4
2070
,019
95,3
0215
8,70
764
,143
95,5
0023
4,75
561
,677
106,
159
74,9
6641
,071
74,8
1478
,372
Tota
l16
2,93
720
2,97
426
2,12
060
9,96
418
9,80
218
2,45
091
3,17
917
5,83
225
4,61
721
0,64
117
4,51
223
7,86
930
9,53
4H
OUSE
PRO
FIT
300,
205
552,
165
1,22
2,18
01,
037,
600
273,
910
247,
963
787,
995
231,
129
307,
169
102,
437
154,
143
158,
400
821,
052
FIXE
D EX
PENS
ESPr
oper
ty T
axes
10,4
781,
430
4,26
417
,431
5,75
98,
079
21,4
222,
758
3,77
08,
985
2,77
86,
110
9,92
7In
sura
nce
1,62
353
73,
606
5,81
71,
575
3,67
510
,126
2,03
52,
304
2,26
42,
679
9,95
43,
922
Othe
r Fix
ed C
harg
es3,
623
47,0
562,
727
73,0
3715
,523
3,65
64,
371
2,57
718
,341
03,
857
18,0
2033
,536
Rent
41
51,
916
7,57
614
,896
16,1
861,
559
13,9
3819
,231
8,66
30
445
028
,254
Tota
l16
,410
50,9
4018
,173
113,
181
39,0
4316
,969
49,8
5726
,601
33,0
7711
,249
9,75
834
,084
75,6
40NE
T IN
COM
E**
Rs28
4,06
5Rs
501,
226
Rs1,
204,
010
Rs92
4,42
4Rs
234,
867
Rs23
0,99
4Rs
738,
138
Rs20
4,52
8Rs
274,
091
Rs91
,189
Rs14
4,38
5Rs
124,
316
Rs74
5,41
2
* M
inor
ope
rate
d de
part
men
ts in
clud
e: la
undr
y, g
ift s
hop,
bus
ines
s ce
ntre
, new
s st
and,
spo
rts,
hea
lth c
lub,
gar
age,
par
king
and
so
fort
h**
Net
Inco
me
is b
efor
e de
prec
iatio
n, in
tere
st p
aym
ents
and
taxe
s
Hyd
erab
adJa
ipur
TA
BL
E 4
-4:
Ind
ian
Ho
tel
Ind
ust
ry –
Tw
elv
e O
ther
Cit
ies:
Fin
anci
al R
epo
rt –
Am
ou
nt
Per
Av
aila
ble
Ro
om
(20
08/0
9)
Page 54
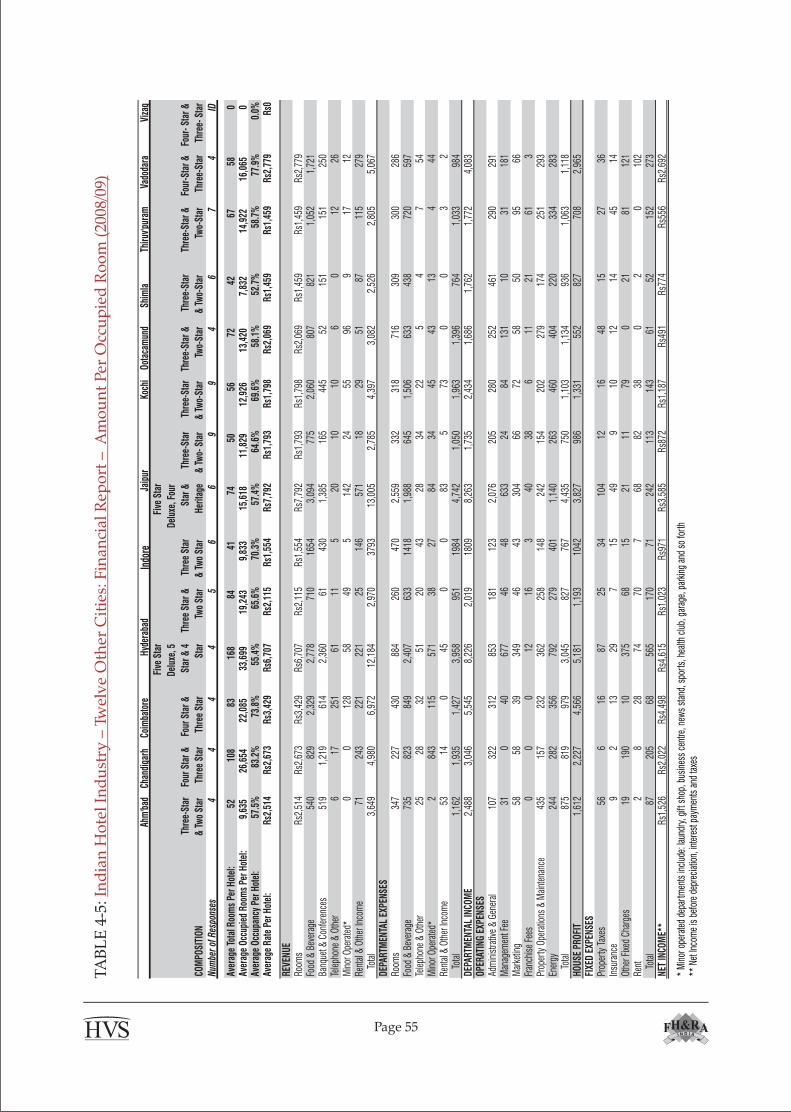
Ah
m'b
adCh
andi
garh
Coim
bato
reIn
dore
Koch
iOo
taca
mun
dSh
imla
Thiru
v'pu
ram
Vado
dara
Viza
g
COM
POSI
TION
Thr
ee-S
tar
& T
wo
Star
Four
Sta
r &
Thre
e St
ar
Four
Sta
r &
Thre
e St
ar
Five
Sta
r
Delu
xe, 5
Star
& 4
Star
Thre
e St
ar &
Two
Star
Thre
e St
ar
& T
wo
Star
Five
Sta
r
Delu
xe, F
our
Star
&
Her
itage
Thr
ee-S
tar
& T
wo-
Sta
r
Thre
e-St
ar
& T
wo-
Star
Thre
e-St
ar &
Two-
Star
Thre
e-St
ar
& T
wo-
Star
Thre
e-St
ar &
Two-
Star
Four
-Sta
r &
Thre
e-St
ar
Four
- Sta
r &
Thre
e- S
tar
Num
ber
of R
espo
nses
44
44
56
69
94
67
4ID
Aver
age
Tota
l Roo
ms
Per H
otel
:52
108
8316
884
4174
5056
7242
6758
0Av
erag
e Oc
cupi
ed R
oom
s Pe
r Hot
el:
9,63
526
,654
22,0
8533
,699
19,2
439,
833
15,6
1811
,829
12,9
2613
,420
7,83
214
,922
16,0
650
Aver
age
Occu
panc
y Pe
r Hot
el:
57.5
%83
.2%
73.8
%55
.4%
65.6
%70
.3%
57.4
%64
.6%
69.6
%58
.1%
52.7
%58
.7%
77.9
%0.
0%Av
erag
e R
ate
Per H
otel
:Rs
2,51
4Rs
2,67
3Rs
3,42
9Rs
6,70
7Rs
2,11
5Rs
1,55
4Rs
7,79
2Rs
1,79
3Rs
1,79
8Rs
2,06
9Rs
1,45
9Rs
1,45
9Rs
2,77
9Rs
0
REVE
NU
ERo
oms
Rs2,
514
Rs2,
673
Rs3,
429
Rs6,
707
Rs2,
115
Rs1,
554
Rs7,
792
Rs1,
793
Rs1,
798
Rs2,
069
Rs1,
459
Rs1,
459
Rs2,
779
Food
& B
ever
age
540
829
2,32
92,
778
710
1654
3,09
477
52,
060
807
821
1,05
21,
721
Banq
uet &
Con
fere
nces
519
1,21
961
42,
360
6143
01,
385
165
445
5215
115
125
0Te
leph
one
& O
ther
617
251
6111
520
1010
60
1226
Min
or O
pera
ted*
00
128
5849
514
224
5596
917
12Re
ntal
& O
ther
Inco
me
7124
322
122
125
146
571
1829
5187
115
279
Tota
l3,
649
4,98
06,
972
12,1
842,
970
3793
13,0
052,
785
4,39
73,
082
2,52
62,
805
5,06
7DE
PART
MEN
TAL
EXPE
NSE
SRo
oms
347
227
430
884
260
470
2,55
933
231
871
630
930
028
6Fo
od &
Bev
erag
e73
582
384
92,
407
633
1418
1,98
864
51,
506
633
438
720
597
Tele
phon
e &
Oth
er25
2832
5120
4328
3422
54
754
Min
or O
pera
ted*
284
311
557
138
2784
3445
4313
444
Rent
al &
Oth
er In
com
e53
140
450
083
573
00
32
Tota
l1,
162
1,93
51,
427
3,95
895
119
844,
742
1,05
01,
963
1,39
676
41,
033
984
DEPA
RTM
ENTA
L IN
COM
E2,
488
3,04
65,
545
8,22
62,
019
1809
8,26
31,
735
2,43
41,
686
1,76
21,
772
4,08
3OP
ERAT
ING
EXPE
NSE
SAd
min
istra
tive
& G
ener
al10
732
231
285
318
112
32,
076
205
280
252
461
290
291
Man
agem
ent F
ee31
040
677
4648
633
2484
131
1031
181
Mar
ketin
g58
5839
349
4643
304
6672
5850
9566
Fran
chis
e Fe
es0
00
1216
340
386
1121
613
Prop
erty
Ope
ratio
ns &
Mai
nten
ance
435
157
232
362
258
148
242
154
202
279
174
251
293
Ener
gy24
428
235
679
227
940
11,
140
263
460
404
220
334
283
Tota
l87
581
997
93,
045
827
767
4,43
575
01,
103
1,13
493
61,
063
1,11
8H
OUSE
PRO
FIT
1,61
22,
227
4,56
65,
181
1,19
310
423,
827
986
1,33
155
282
770
82,
965
FIXE
D EX
PEN
SES
Prop
erty
Tax
es56
616
8725
3410
412
1648
1527
36In
sura
nce
92
1329
715
499
1012
1445
14Ot
her F
ixed
Cha
rges
1919
010
375
6815
2111
790
2181
121
Rent
2
828
7470
768
8238
02
010
2To
tal
8720
568
565
170
7124
211
314
361
5215
227
3N
ET IN
COM
E**
Rs1,
526
Rs2,
022
Rs4,
498
Rs4,
615
Rs1,
023
Rs97
1Rs
3,58
5Rs
872
Rs1,
187
Rs49
1Rs
774
Rs55
6Rs
2,69
2
* M
inor
ope
rate
d de
part
men
ts in
clud
e: la
undr
y, g
ift s
hop,
bus
ines
s ce
ntre
, new
s st
and,
spo
rts,
hea
lth c
lub,
gar
age,
par
king
and
so
fort
h**
Net
Inco
me
is b
efor
e de
prec
iatio
n, in
tere
st p
aym
ents
and
taxe
s
Hyd
erab
adJa
ipur
TA
BL
E 4
-5:
Ind
ian
Ho
tel
Ind
ust
ry –
Tw
elv
e O
ther
Cit
ies:
Fin
anci
al R
epo
rt –
Am
ou
nt
Per
Occ
up
ied
Ro
om
(20
08/0
9)
Page 55
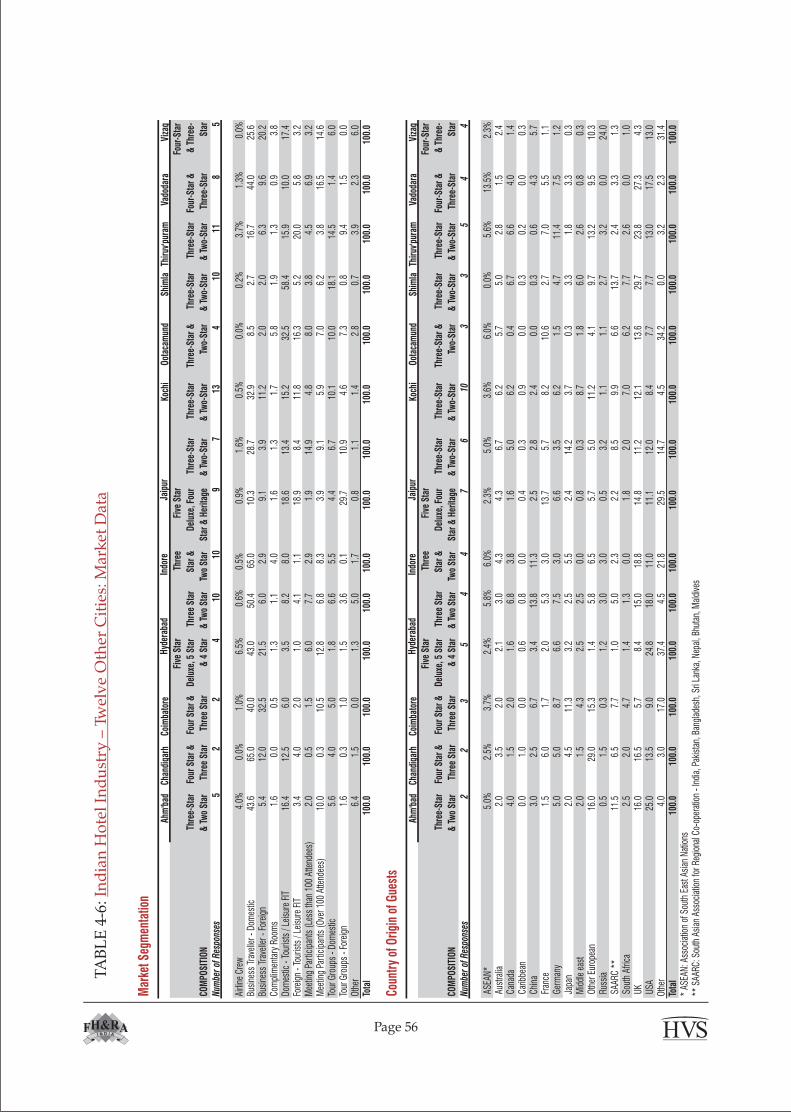
TA
BL
E 4
-6:
Ind
ian
Ho
tel
Ind
ust
ry –
Tw
elv
e O
ther
Cit
ies:
Mar
ket
Dat
a
Page 56
M
arke
t Seg
men
tatio
n
Ahm
'bad
Chan
diga
rhCo
imba
tore
Koch
iO
otac
amun
dSh
imla
Thir
uv'p
uram
Vado
dara
Viza
g
COM
POSI
TIO
N
Thr
ee-S
tar
& T
wo
Star
Four
Sta
r &
Thre
e St
ar
Four
Sta
r &
Thre
e St
ar
Five
Sta
r
Del
uxe,
5 S
tar
& 4
Sta
r
Thre
e St
ar
& T
wo
Star
Thre
e
Star
&
Two
Star
Five
Sta
r
Del
uxe,
Fou
r
Star
& H
erita
ge
Thre
e-St
ar
& T
wo-
Star
Thre
e-St
ar
& T
wo-
Star
Thre
e-St
ar &
Two-
Star
Thre
e-St
ar
& T
wo-
Star
Thre
e-St
ar
& T
wo-
Star
Four
-Sta
r &
Thre
e-St
ar
Fou
r-St
ar
& T
hree
-
Star
Num
ber
of R
espo
nses
52
24
1010
97
134
1011
85
Airli
ne C
rew
4.0%
0.0%
1.0%
6.5%
0.6%
0.5%
0.9%
1.6%
0.5%
0.0%
0.2%
3.7%
1.3%
0.0%
Busi
ness
Tra
velle
r - D
omes
tic43
.665
.040
.043
.050
.465
.010
.328
.732
.98.
52.
716
.744
.025
.6Bu
sine
ss T
rave
ller -
For
eign
5.4
12.0
32.5
21.5
6.0
2.9
9.1
3.9
11.2
2.0
2.0
6.3
9.6
20.2
Com
plim
enta
ry R
oom
s1.
60.
00.
51.
31.
14.
01.
61.
31.
75.
81.
91.
30.
93.
8D
omes
tic -
Tour
ists
/ Le
isur
e FI
T16
.412
.56.
03.
58.
28.
018
.613
.415
.232
.558
.415
.910
.017
.4Fo
reig
n - T
ouris
ts /
Leis
ure
FIT
3.4
4.0
2.0
1.0
4.1
1.1
18.9
8.4
11.8
16.3
5.2
20.0
5.8
3.2
Mee
ting
Part
icip
ants
(Les
s th
an 1
00 A
ttend
ees)
2.0
0.5
1.5
6.0
7.7
2.9
1.9
14.9
4.8
8.0
3.8
4.5
6.9
3.2
Mee
ting
Part
icip
ants
(Ove
r 100
Atte
ndee
s)10
.00.
310
.512
.86.
88.
33.
99.
15.
97.
06.
23.
816
.514
.6To
ur G
roup
s - D
omes
tic5.
64.
05.
01.
86.
65.
54.
46.
710
.110
.018
.114
.51.
46.
0To
ur G
roup
s - F
orei
gn1.
60.
31.
01.
53.
60.
129
.710
.94.
67.
30.
89.
41.
50.
0O
ther
6.4
1.5
0.0
1.3
5.0
1.7
0.8
1.1
1.4
2.8
0.7
3.9
2.3
6.0
Tota
l10
0.0
100.
010
0.0
100.
010
0.0
100.
010
0.0
100.
010
0.0
100.
010
0.0
100.
010
0.0
100.
0
Coun
try
of O
rigi
n of
Gue
sts
Ahm
'bad
Chan
diga
rhCo
imba
tore
Koch
iO
otac
amun
dSh
imla
Thir
uv'p
uram
Vado
dara
Viza
g
COM
POSI
TIO
N
Thr
ee-S
tar
& T
wo
Star
Four
Sta
r &
Thre
e St
ar
Four
Sta
r &
Thre
e St
ar
Five
Sta
r
Del
uxe,
5 S
tar
& 4
Sta
r
Thre
e St
ar
& T
wo
Star
Thre
e
Star
&
Two
Star
Five
Sta
r
Del
uxe,
Fou
r
Star
& H
erita
ge
Thre
e-St
ar
& T
wo-
Star
Thre
e-St
ar
& T
wo-
Star
Thre
e-St
ar &
Two-
Star
Thre
e-St
ar
& T
wo-
Star
Thre
e-St
ar
& T
wo-
Star
Four
-Sta
r &
Thre
e-St
ar
Fou
r-St
ar
& T
hree
-
Star
Num
ber
of R
espo
nses
22
35
44
76
103
35
44
ASE
AN*
5.0%
2.5%
3.7%
2.4%
5.8%
6.0%
2.3%
5.0%
3.6%
6.0%
0.0%
5.6%
13.5
%2.
3% A
ustra
lia2.
03.
52.
02.
13.
04.
34.
36.
76.
25.
75.
02.
81.
52.
4 C
anad
a4.
01.
52.
01.
66.
83.
81.
65.
06.
20.
46.
76.
64.
01.
4 C
arib
bean
0.0
1.0
0.0
0.6
0.8
0.0
0.4
0.3
0.9
0.0
0.3
0.2
0.0
0.3
Chi
na3.
02.
56.
73.
413
.811
.32.
52.
82.
40.
00.
30.
64.
35.
7 F
ranc
e1.
56.
01.
72.
05.
33.
013
.75.
78.
210
.62.
77.
05.
51.
1 G
erm
any
5.0
5.0
8.7
6.6
7.5
3.0
6.6
3.5
6.2
1.5
4.7
11.4
7.5
1.2
Jap
an2.
04.
511
.33.
22.
55.
52.
414
.23.
70.
33.
31.
83.
30.
3 M
iddl
e ea
st2.
01.
54.
32.
52.
50.
00.
80.
38.
71.
86.
02.
60.
80.
3 O
ther
Eur
opea
n16
.029
.015
.31.
45.
86.
55.
75.
011
.24.
19.
713
.29.
510
.3 R
ussi
a0.
51.
50.
31.
23.
03.
00.
53.
21.
11.
12.
73.
20.
024
.0 S
AARC
**
11.5
6.5
7.7
1.0
5.0
2.3
2.2
8.5
9.9
6.6
13.7
2.4
3.3
1.3
Sou
th A
frica
2.5
2.0
4.7
1.4
1.3
0.0
1.8
2.0
7.0
6.2
7.7
2.6
0.0
1.0
UK
16.0
16.5
5.7
8.4
15.0
18.8
14.8
11.2
12.1
13.6
29.7
23.8
27.3
4.3
USA
25.0
13.5
9.0
24.8
18.0
11.0
11.1
12.0
8.4
7.7
7.7
13.0
17.5
13.0
Oth
er4.
03.
017
.037
.44.
521
.829
.514
.74.
534
.20.
03.
22.
331
.4To
tal
100.
010
0.0
100.
010
0.0
100.
010
0.0
100.
010
0.0
100.
010
0.0
100.
010
0.0
100.
010
0.0
* AS
EAN
: Ass
ocia
tion
of S
outh
Eas
t Asi
an N
atio
ns**
SAA
RC: S
outh
Asi
an A
ssoc
iatio
n fo
r Reg
iona
l Co-
oper
atio
n - I
ndia
, Pak
ista
n, B
angl
ades
h, S
ri La
nka,
Nep
al, B
huta
n, M
aldi
ves
Hyd
erab
adIn
dore
Jaip
ur
Hyd
erab
adIn
dore
Jaip
ur
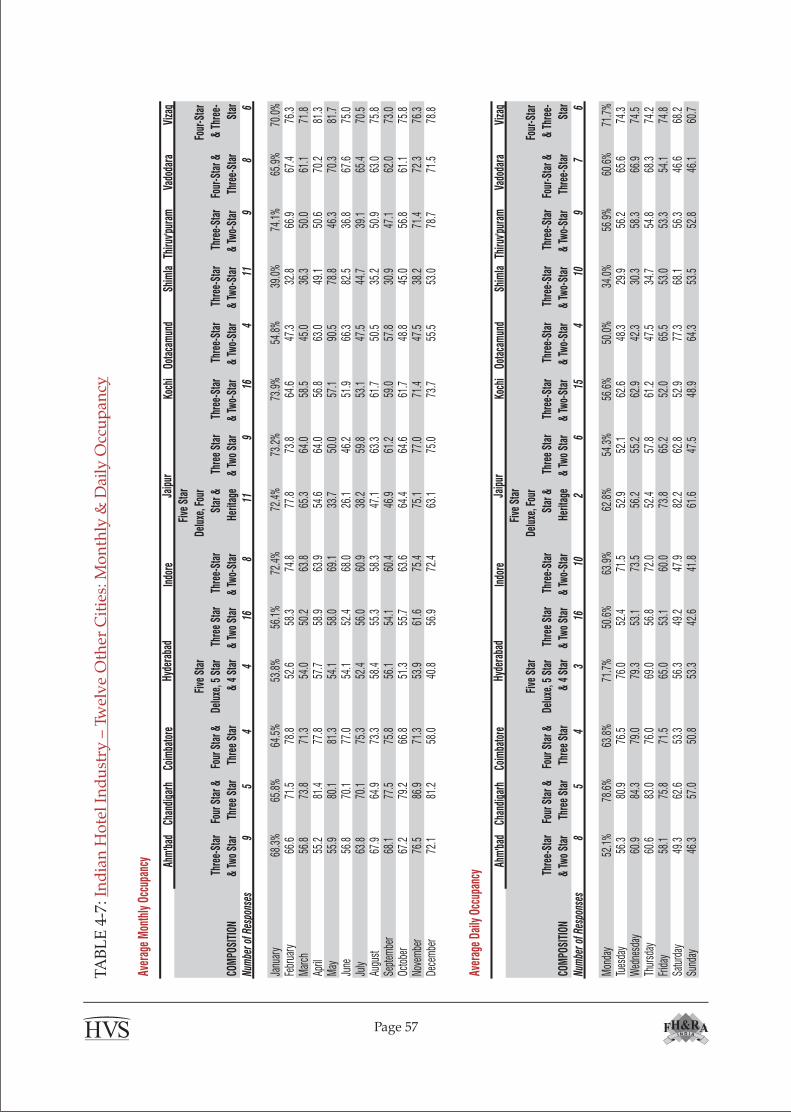
Av
erag
e M
onth
ly O
ccup
ancy Ah
m'b
adCh
andi
garh
Coim
bato
reIn
dore
Koch
iOo
taca
mun
dSh
imla
Thiru
v'pur
amVa
doda
raVi
zag
COM
POSI
TION
Thr
ee-S
tar
& T
wo
Star
Four
Sta
r &
Thre
e St
ar
Four
Sta
r &
Thre
e St
ar
Five
Sta
r
Delu
xe, 5
Sta
r
& 4
Sta
r
Thre
e St
ar
& T
wo
Star
Thre
e-St
ar
& T
wo-
Star
Five
Sta
r
Delu
xe, F
our
Star
&
Herit
age
Thr
ee S
tar
& T
wo
Star
Thre
e-St
ar
& T
wo-
Star
Thre
e-St
ar
& T
wo-
Star
Thre
e-St
ar
& T
wo-
Star
Thre
e-St
ar
& T
wo-
Star
Four
-Sta
r &
Thre
e-St
ar
Fou
r-St
ar
& T
hree
-
Star
Num
ber o
f Res
pons
es9
54
416
811
916
411
98
6
Janu
ary
68.3
%65
.8%
64.5
%53
.8%
56.1
%72
.4%
72.4
%73
.2%
73.9
%54
.8%
39.0
%74
.1%
65.9
%70
.0%
Febr
uary
66.6
71.5
78.8
52.6
58.3
74.8
77.8
73.8
64.6
47.3
32.8
66.9
67.4
76.3
Mar
ch56
.873
.871
.354
.050
.263
.865
.364
.058
.545
.036
.350
.061
.171
.8Ap
ril55
.281
.477
.857
.758
.963
.954
.664
.056
.863
.049
.150
.670
.281
.3M
ay55
.980
.181
.354
.158
.069
.133
.750
.057
.190
.578
.846
.370
.381
.7Ju
ne56
.870
.177
.054
.152
.468
.026
.146
.251
.966
.382
.536
.867
.675
.0Ju
ly63
.870
.175
.352
.456
.060
.938
.259
.853
.147
.544
.739
.165
.470
.5Au
gust
67.9
64.9
73.3
58.4
55.3
58.3
47.1
63.3
61.7
50.5
35.2
50.9
63.0
75.8
Sept
embe
r68
.177
.575
.856
.154
.160
.446
.961
.259
.057
.830
.947
.162
.073
.0Oc
tobe
r67
.279
.266
.851
.355
.763
.664
.464
.661
.748
.845
.056
.861
.175
.8No
vem
ber
76.5
86.9
71.3
53.9
61.6
75.4
75.1
77.0
71.4
47.5
38.2
71.4
72.3
76.3
Dece
mbe
r72
.181
.258
.040
.856
.972
.463
.175
.073
.755
.553
.078
.771
.578
.8
Aver
age
Daily
Occ
upan
cy
Ahm
'bad
Chan
diga
rhCo
imba
tore
Indo
reKo
chi
Oota
cam
und
Shim
laTh
iruv'p
uram
Vado
dara
Viza
g
COM
POSI
TION
Thr
ee-S
tar
& T
wo
Star
Four
Sta
r &
Thre
e St
ar
Four
Sta
r &
Thre
e St
ar
Five
Sta
r
Delu
xe, 5
Sta
r
& 4
Sta
r
Thre
e St
ar
& T
wo
Star
Thre
e-St
ar
& T
wo-
Star
Five
Sta
r
Delu
xe, F
our
Star
&
Herit
age
Thr
ee S
tar
& T
wo
Star
Thre
e-St
ar
& T
wo-
Star
Thre
e-St
ar
& T
wo-
Star
Thre
e-St
ar
& T
wo-
Star
Thre
e-St
ar
& T
wo-
Star
Four
-Sta
r &
Thre
e-St
ar
Fou
r-St
ar
& T
hree
-
Star
Num
ber o
f Res
pons
es8
54
316
102
615
410
97
6
Mon
day
52.1
%78
.6%
63.8
%71
.7%
50.6
%63
.9%
62.8
%54
.3%
56.6
%50
.0%
34.0
%56
.9%
60.6
%71
.7%
Tues
day
56.3
80.9
76.5
76.0
52.4
71.5
52.9
52.1
62.6
48.3
29.9
56.2
65.6
74.3
Wed
nesd
ay60
.984
.379
.079
.353
.173
.556
.255
.262
.942
.330
.358
.366
.974
.5Th
ursd
ay60
.683
.076
.069
.056
.872
.052
.457
.861
.247
.534
.754
.868
.374
.2Fr
iday
58.1
75.8
71.5
65.0
53.1
60.0
73.8
65.2
52.0
65.5
53.0
53.3
54.1
74.8
Satu
rday
49.3
62.6
53.3
56.3
49.2
47.9
82.2
62.8
52.9
77.3
68.1
56.3
46.6
68.2
Sund
ay46
.357
.050
.853
.342
.641
.861
.647
.548
.964
.353
.552
.846
.160
.7
Hyde
raba
dJa
ipur
Hyde
raba
dJa
ipur
TA
BL
E 4
-7:
Ind
ian
Ho
tel
Ind
ust
ry –
Tw
elv
e O
ther
Cit
ies:
Mo
nth
ly &
Dai
ly O
ccu
pan
cy
Page 57
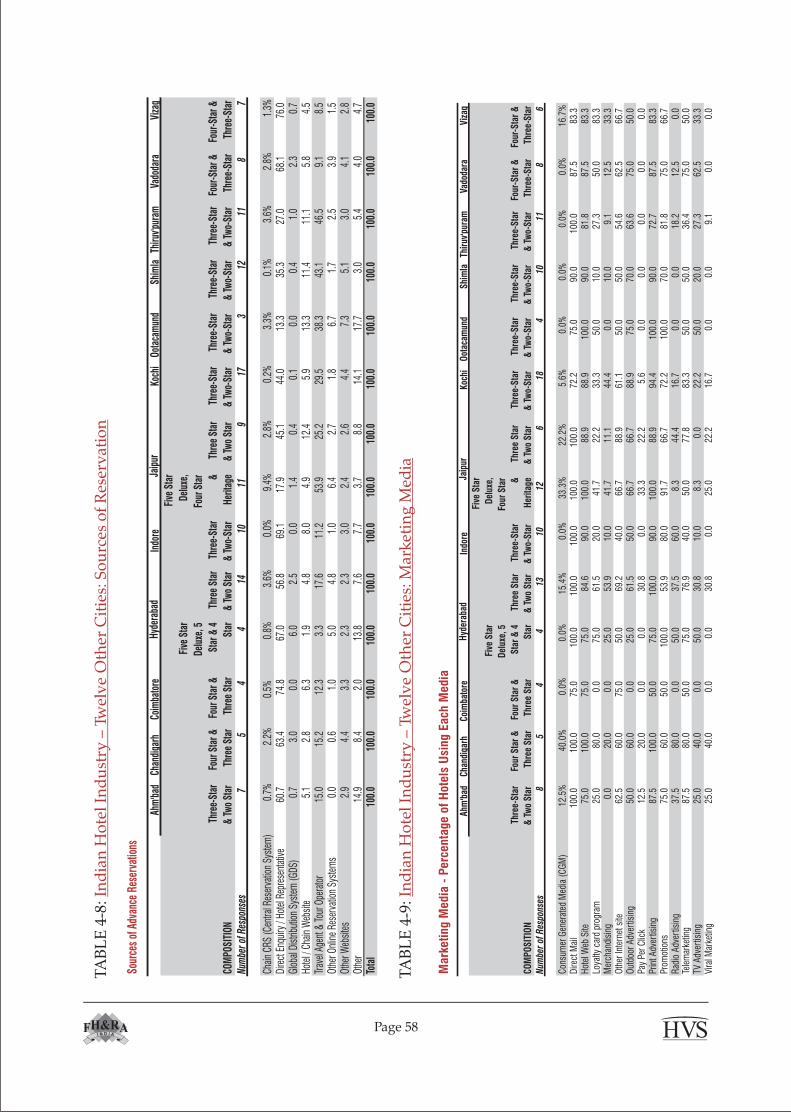
TA
BL
E 4
-8:
Ind
ian
Ho
tel
Ind
ust
ry –
Tw
elv
e O
ther
Cit
ies:
So
urc
es o
f R
eser
vat
ion
TA
BL
E 4
-9:
Ind
ian
Ho
tel
Ind
ust
ry –
Tw
elv
e O
ther
Cit
ies:
Mar
ket
ing
Med
ia
Mark
eti
ng M
edia
- P
erc
enta
ge o
f H
ote
ls U
sing E
ach
Media
Ahm
'bad
Cha
ndig
arh
Coi
mba
tore
Indo
reKo
chi
Oot
acam
und
Shi
mla
Thir
uv'p
uram
Vado
dara
Viz
ag
CO
MP
OS
ITIO
N
Thr
ee-S
tar
& T
wo
Sta
r
Four
Sta
r &
Thre
e S
tar
Four
Sta
r &
Thre
e S
tar
Five
Sta
r
Del
uxe,
5
Sta
r &
4
Sta
r
Thre
e S
tar
& T
wo
Sta
r
Thre
e-S
tar
& T
wo-
Sta
r
Five
Sta
r
Del
uxe,
Four
Sta
r &
Her
itage
Thr
ee S
tar
& T
wo
Sta
r
Thre
e-S
tar
& T
wo-
Sta
r
Thre
e-S
tar
& T
wo-
Sta
r
Thre
e-S
tar
& T
wo-
Sta
r
Thr
ee-S
tar
& T
wo-
Sta
r
Four
-Sta
r &
Thre
e-S
tar
Fou
r-S
tar
&
Thre
e-S
tar
Num
ber
of R
espo
nses
85
44
1310
126
184
1011
86
Con
sum
er G
ener
ated
Med
ia (
CG
M)
12.5
%40
.0%
0.0%
0.0%
15.4
%0.
0%33
.3%
22.2
%5.
6%0.
0%0.
0%0.
0%0.
0%16
.7%
Dire
ct M
ail
100.
010
0.0
75.0
100.
010
0.0
100.
010
0.0
100.
072
.275
.090
.010
0.0
87.5
83.3
Hot
el W
eb S
ite75
.010
0.0
75.0
75.0
84.6
90.0
100.
088
.988
.910
0.0
90.0
81.8
87.5
83.3
Loya
lty c
ard
prog
ram
25.0
80.0
0.0
75.0
61.5
20.0
41.7
22.2
33.3
50.0
10.0
27.3
50.0
83.3
Mer
chan
disi
ng0.
020
.00.
025
.053
.910
.041
.711
.144
.40.
010
.09.
112
.533
.3O
ther
Inte
rnet
site
62.5
60.0
75.0
50.0
69.2
40.0
66.7
88.9
61.1
50.0
50.0
54.6
62.5
66.7
Out
door
Adv
ertis
ing
50.0
60.0
0.0
25.0
61.5
50.0
66.7
66.7
88.9
75.0
70.0
63.6
75.0
50.0
Pay
Per C
lick
12.5
20.0
0.0
0.0
30.8
0.0
33.3
22.2
5.6
0.0
0.0
0.0
0.0
0.0
Prin
t Adv
ertis
ing
87.5
100.
050
.075
.010
0.0
90.0
100.
088
.994
.410
0.0
90.0
72.7
87.5
83.3
Prom
otio
ns75
.060
.050
.010
0.0
53.9
80.0
91.7
66.7
72.2
100.
070
.081
.875
.066
.7R
adio
Adv
ertis
ing
37.5
80.0
0.0
50.0
37.5
60.0
8.3
44.4
16.7
0.0
0.0
18.2
12.5
0.0
Tele
mar
ketin
g87
.580
.050
.075
.076
.940
.050
.077
.883
.350
.050
.036
.475
.050
.0TV
Adv
ertis
ing
25.0
40.0
0.0
50.0
30.8
10.0
8.3
0.0
22.2
50.0
20.0
27.3
62.5
33.3
Vira
l Mar
ketin
g25
.040
.00.
00.
030
.80.
025
.022
.216
.70.
00.
09.
10.
00.
0
Hyd
erab
adJa
ipur
Page 58
So
urce
s of
Adv
ance
Res
erva
tions
Ahm
'bad
Chan
diga
rhCo
imba
tore
Indo
reKo
chi
Oota
cam
und
Shim
laTh
iruv'
pura
mVa
doda
raVi
zag
COM
POSI
TION
Thr
ee-S
tar
& T
wo
Star
Four
Sta
r &
Thre
e St
ar
Four
Sta
r &
Thre
e St
ar
Five
Sta
r
Delu
xe, 5
Star
& 4
Star
Thre
e St
ar
& T
wo
Star
Thre
e-St
ar
& T
wo-
Star
Five
Sta
r
Delu
xe,
Four
Sta
r &
Herit
age
Thr
ee S
tar
& T
wo
Star
Thre
e-St
ar
& T
wo-
Star
Thre
e-St
ar
& T
wo-
Star
Thre
e-St
ar
& T
wo-
Star
Thr
ee-S
tar
& T
wo-
Star
Four
-Sta
r &
Thre
e-St
ar
Fou
r-St
ar &
Thre
e-St
ar
Num
ber o
f Res
pons
es7
54
414
1011
917
312
118
7
Chai
n CR
S (C
entra
l Res
erva
tion
Syst
em)
0.7%
2.2%
0.5%
0.8%
3.6%
0.0%
9.4%
2.8%
0.2%
3.3%
0.1%
3.6%
2.8%
1.3%
Dire
ct E
nqui
ry /
Hote
l Rep
rese
ntat
ive
60.7
63.4
74.8
67.0
56.8
69.1
17.9
45.1
44.0
13.3
35.3
27.0
68.1
76.0
Glob
al D
istri
butio
n Sy
stem
(GDS
)0.
73.
00.
06.
02.
50.
01.
40.
40.
10.
00.
41.
02.
30.
7Ho
tel /
Cha
in W
ebsi
te5.
12.
86.
31.
94.
88.
04.
912
.45.
913
.311
.411
.15.
84.
5Tr
avel
Age
nt &
Tou
r Ope
rato
r15
.015
.212
.33.
317
.611
.253
.925
.229
.538
.343
.146
.59.
18.
5Ot
her O
nlin
e Re
serv
atio
n Sy
stem
s0.
00.
61.
05.
04.
81.
06.
42.
71.
86.
71.
72.
53.
91.
5Ot
her W
ebsi
tes
2.9
4.4
3.3
2.3
2.3
3.0
2.4
2.6
4.4
7.3
5.1
3.0
4.1
2.8
Othe
r14
.98.
42.
013
.87.
67.
73.
78.
814
.117
.73.
05.
44.
04.
7To
tal
100.
010
0.0
100.
010
0.0
100.
010
0.0
100.
010
0.0
100.
010
0.0
100.
010
0.0
100.
010
0.0
Hyde
raba
dJa
ipur
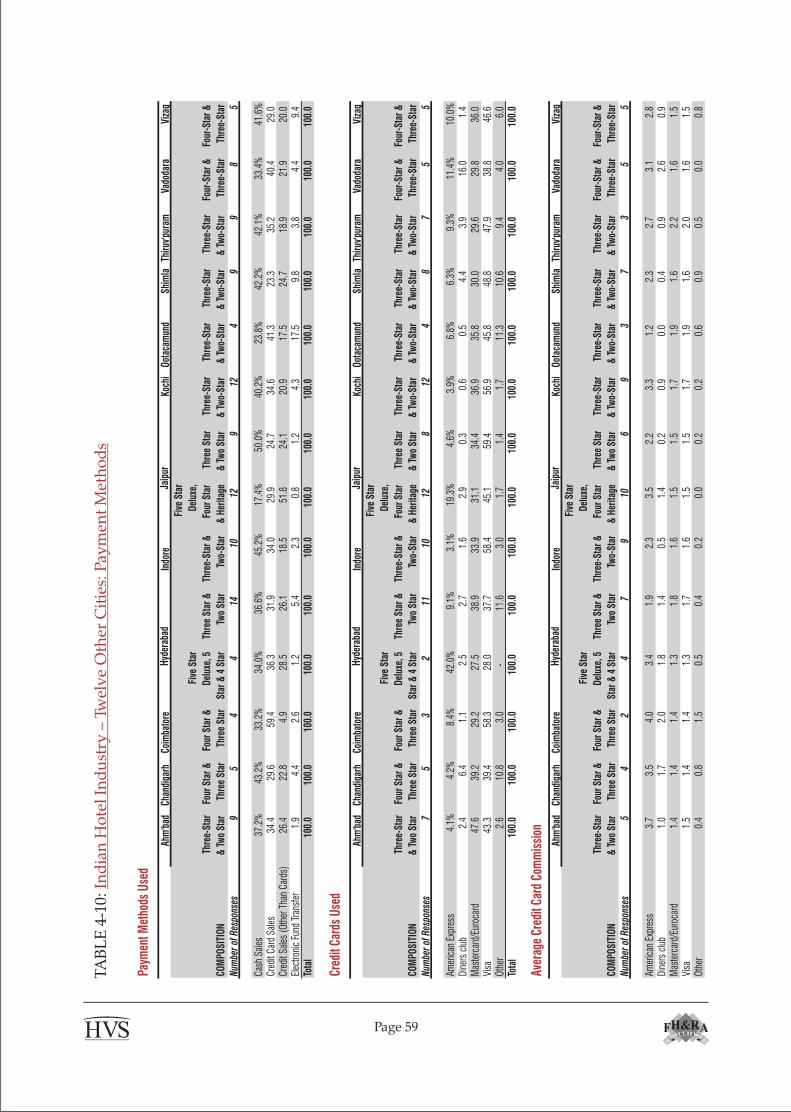
TA
BL
E 4
-10:
In
dia
n H
ote
l In
du
stry
– T
wel
ve
Oth
er C
itie
s: P
aym
ent
Met
ho
ds
Pa
ymen
t Met
hods
Use
d
Ahm
'bad
Chan
diga
rhCo
imba
tore
Indo
reKo
chi
Oot
acam
und
Shim
laTh
iruv
'pur
amVa
doda
raVi
zag
COM
POSI
TIO
N
Thr
ee-S
tar
& T
wo
Star
Four
Sta
r &
Thre
e St
ar
Four
Sta
r &
Thre
e St
ar
Five
Sta
r
Del
uxe,
5
Star
& 4
Sta
r
Thre
e St
ar &
Two
Star
Thre
e-St
ar &
Two-
Star
Five
Sta
r
Del
uxe,
Four
Sta
r
& H
erita
ge
Thr
ee S
tar
& T
wo
Star
Thre
e-St
ar
& T
wo-
Star
Thre
e-St
ar
& T
wo-
Star
Thre
e-St
ar
& T
wo-
Star
Thre
e-St
ar
& T
wo-
Star
Four
-Sta
r &
Thre
e-St
ar
Fou
r-St
ar &
Thre
e-St
ar
Num
ber
of R
espo
nses
95
44
1410
129
124
99
85
Cash
Sal
es37
.2%
43.2
%33
.2%
34.0
%36
.6%
45.2
%17
.4%
50.0
%40
.2%
23.8
%42
.2%
42.1
%33
.4%
41.6
%Cr
edit
Card
Sal
es34
.4
29
.6
59
.4
36
.3
31
.9
34
.0
29
.9
24.7
34.6
4
1.3
23
.3
35
.2
40
.4
29
.0
Cred
it Sa
les
(Oth
er T
han
Card
s)26
.4
22
.8
4.
9
28.5
26.1
18
.5
51
.8
24.1
20.9
1
7.5
24
.7
18
.9
21
.9
20
.0
Elec
troni
c Fu
nd T
rans
fer
1.9
4.
4
2.
6
1.2
5.
4
2.3
0.8
1.2
4.3
17
.5
9.8
3.
8
4.4
9.
4
Tota
l10
0.0
10
0.0
10
0.0
10
0.0
100.
0
10
0.0
10
0.0
10
0.0
10
0.0
100
.0
10
0.0
10
0.0
10
0.0
100.
0
Cred
it Ca
rds
Use
d
Ahm
'bad
Chan
diga
rhCo
imba
tore
Indo
reKo
chi
Oot
acam
und
Shim
laTh
iruv
'pur
amVa
doda
raVi
zag
COM
POSI
TIO
N
Thr
ee-S
tar
& T
wo
Star
Four
Sta
r &
Thre
e St
ar
Four
Sta
r &
Thre
e St
ar
Five
Sta
r
Del
uxe,
5
Star
& 4
Sta
r
Thre
e St
ar &
Two
Star
Thre
e-St
ar &
Two-
Star
Five
Sta
r
Del
uxe,
Four
Sta
r
& H
erita
ge
Thr
ee S
tar
& T
wo
Star
Thre
e-St
ar
& T
wo-
Star
Thre
e-St
ar
& T
wo-
Star
Thre
e-St
ar
& T
wo-
Star
Thre
e-St
ar
& T
wo-
Star
Four
-Sta
r &
Thre
e-St
ar
Fou
r-St
ar &
Thre
e-St
arN
umbe
r of
Res
pons
es7
53
211
1012
812
48
75
5
Amer
ican
Exp
ress
4.1%
4.2%
8.4%
42.0
%9.
1%3.
1%19
.3%
4.6%
3.9%
6.8%
6.3%
9.3%
11.4
%10
.0%
Din
ers
club
2.4
6.
4
1.
1
2.5
2.
7
1.6
2.9
0.3
0.6
0.5
4.
4
3.9
16
.0
1.
4
Mas
terc
ard/
Euro
card
47.6
39.2
29.2
27.5
38.9
33
.9
31
.1
34.4
36.9
3
5.8
30
.0
29
.6
29
.8
36
.0
Visa
43.3
39.4
58.3
28.0
37.7
58
.4
45
.1
59.4
56.9
45
.8
48.8
47.9
38.8
46.6
Oth
er2.
6
10.8
3.0
-
11
.6
3.0
1.7
1.4
1.7
11
.3
10.6
9.4
4.
0
6.0
Tota
l10
0.0
10
0.0
10
0.0
10
0.0
100.
0
10
0.0
10
0.0
10
0.0
10
0.0
100.
0
10
0.0
10
0.0
10
0.0
100.
0
Aver
age
Cred
it Ca
rd C
omm
issi
on
Ahm
'bad
Chan
diga
rhCo
imba
tore
Indo
reKo
chi
Oot
acam
und
Shim
laTh
iruv
'pur
amVa
doda
raVi
zag
COM
POSI
TIO
N
Thr
ee-S
tar
& T
wo
Star
Four
Sta
r &
Thre
e St
ar
Four
Sta
r &
Thre
e St
ar
Five
Sta
r
Del
uxe,
5
Star
& 4
Sta
r
Thre
e St
ar &
Two
Star
Thre
e-St
ar &
Two-
Star
Five
Sta
r
Del
uxe,
Four
Sta
r
& H
erita
ge
Thr
ee S
tar
& T
wo
Star
Thre
e-St
ar
& T
wo-
Star
Thre
e-St
ar
& T
wo-
Star
Thre
e-St
ar
& T
wo-
Star
Thre
e-St
ar
& T
wo-
Star
Four
-Sta
r &
Thre
e-St
ar
Fou
r-St
ar &
Thre
e-St
ar
Num
ber
of R
espo
nses
54
24
79
106
93
73
55
Amer
ican
Exp
ress
3.7
3.5
4.0
3.4
1.9
2.3
3.5
2.2
3.3
1.2
2.3
2.7
3.1
2.8
Din
ers
club
1.0
1.7
2.0
1.8
1.4
0.5
1.4
0.2
0.9
0.0
0.4
0.9
2.6
0.9
Mas
terc
ard/
Euro
card
1.4
1.4
1.4
1.3
1.8
1.6
1.5
1.5
1.7
1.9
1.6
2.2
1.6
1.5
Visa
1.5
1.4
1.4
1.3
1.7
1.6
1.5
1.5
1.7
1.9
1.6
2.0
1.6
1.5
Oth
er0.
40.
81.
50.
50.
40.
20.
00.
20.
20.
60.
90.
50.
00.
8
Hyd
erab
adJa
ipur
Hyd
erab
adJa
ipur
Hyd
erab
adJa
ipur
Page 59
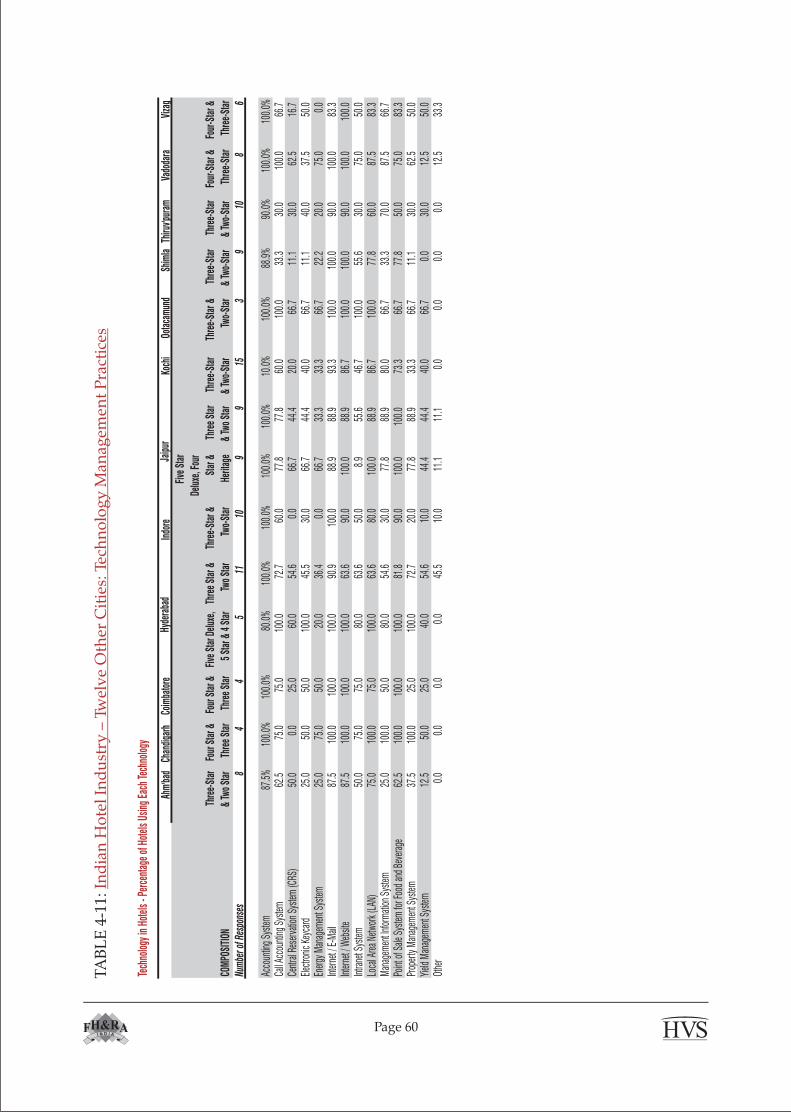
TA
BL
E 4
-11:
In
dia
n H
ote
l In
du
stry
– T
wel
ve
Oth
er C
itie
s: T
ech
no
log
y M
anag
emen
t P
ract
ices
Te
chno
logy
in H
otel
s - P
erce
ntag
e of
Hot
els
Usin
g Ea
ch Te
chno
logy
Ahm
'bad
Chan
diga
rhCo
imba
tore
Indo
reKo
chi
Oota
cam
und
Shim
laTh
iruv'p
uram
Vado
dara
Viza
g
COM
POSI
TION
Thr
ee-S
tar
& Tw
o St
ar
Four
Sta
r &
Thre
e St
ar
Four
Sta
r &
Thre
e St
ar
Five
Sta
r Del
uxe,
5 St
ar &
4 S
tar
Thre
e St
ar &
Two
Star
Thre
e-St
ar &
Two-
Star
Five
Sta
r
Delu
xe, F
our
Star
&
Herit
age
Thr
ee S
tar
& Tw
o St
ar
Thre
e-St
ar
& Tw
o-St
ar
Thre
e-St
ar &
Two-
Star
Thre
e-St
ar
& Tw
o-St
ar
Thre
e-St
ar
& Tw
o-St
ar
Four
-Sta
r &
Thre
e-St
ar
Fou
r-Sta
r &
Thre
e-St
arNu
mbe
r of R
espo
nses
84
45
1110
99
153
910
86
Acco
untin
g Sy
stem
87.5
%10
0.0%
100.
0%80
.0%
100.
0%10
0.0%
100.
0%10
0.0%
10.0
%10
0.0%
88.9
%90
.0%
100.
0%10
0.0%
Call A
ccou
nting
Sys
tem62
.575
.075
.010
0.0
72.7
60.0
77.8
77.8
60.0
100.
033
.330
.010
0.0
66.7
Cent
ral R
eser
vatio
n Sy
stem
(CRS
)50
.00.
025
.060
.054
.60.
066
.744
.420
.066
.711
.130
.062
.516
.7Ele
ctro
nic K
eyca
rd25
.050
.050
.010
0.0
45.5
30.0
66.7
44.4
40.0
66.7
11.1
40.0
37.5
50.0
Ener
gy M
anag
emen
t Sys
tem25
.075
.050
.020
.036
.40.
066
.733
.333
.366
.722
.220
.075
.00.
0In
terne
t / E
87.5
100.
010
0.0
100.
090
.910
0.0
88.9
88.9
93.3
100.
010
0.0
90.0
100.
083
.3In
terne
t / W
ebsit
e87
.510
0.0
100.
010
0.0
63.6
90.0
100.
088
.986
.710
0.0
100.
090
.010
0.0
100.
0In
trane
t Sys
tem50
.075
.075
.080
.063
.650
.08.
955
.646
.710
0.0
55.6
30.0
75.0
50.0
Loca
l Are
a Ne
twor
k (LA
N)75
.010
0.0
75.0
100.
063
.680
.010
0.0
88.9
86.7
100.
077
.860
.087
.583
.3M
anag
emen
t Inf
orm
ation
Sys
tem25
.010
0.0
50.0
80.0
54.6
30.0
77.8
88.9
80.0
66.7
33.3
70.0
87.5
66.7
Point
of S
ale S
ystem
for F
ood
and
Beve
rage
62.5
100.
010
0.0
100.
081
.890
.010
0.0
100.
073
.366
.777
.850
.075
.083
.3Pr
oper
ty M
anag
emen
t Sys
tem37
.510
0.0
25.0
100.
072
.720
.077
.888
.933
.366
.711
.130
.062
.550
.0Yi
eld M
anag
emen
t Sys
tem12
.550
.025
.040
.054
.610
.044
.444
.440
.066
.70.
030
.012
.550
.0Ot
her
0.0
0.0
0.0
0.0
45.5
10.0
11.1
11.1
0.0
0.0
0.0
0.0
12.5
33.3
Hyde
raba
dJa
ipur
Page 60

We, the inheritors of Earth, need to come together and protect it from our own excesses. This report is dedicated to and symbolic of our pledge to give our future generations a happier , healthier planet.