india morning roundup -...
TRANSCRIPT

Institutional EquitiesDa
ily M
ornin
g Upd
ate
India Morning Roundup
Contents Arvind- UNDER REVIEW - 3QFY16 Result Update - Subdued Performance: Following flattish revenue in textile division and 15.3%/11.8% growth in power brands/Brands & Retail or B&R division, respectively, consolidated revenue of Arvind in 3QFY16 grew 4.0% to Rs21,575mn, 9.9%/4.6% below our/Bloomberg consensus estimate, respectively, because of sluggish domestic environment, weak volume in denim which impacted the textile division and a 16% decline in Megamart’s revenue which dragged down the growth of B&R division. Cadila Healthcare- UNDER REVIEW - 3QFY16 Result Update - Stable Performance: Cadila Healthcare’s (CHL) reported 3QFY16 revenue of Rs24.3bn (up 11% YoY but down 1% QoQ) was 3%/1% below our/Bloomberg consensus estimate, respectively, on account of domestic business which declined 3.6% QoQ led by domestic formulations, down 5% QoQ. Export business grew 12%/3.8% YoY/QoQ, respectively, led by US formulations business, up 13.6%/4.6% YoY/QoQ, respectively, on account of growth witnessed in its existing portfolio. Divis Laboratories - UNDER REVIEW - 3QFY16 Result Update - Weak Performance Led By Lower Revenue Growth: Divis Laboratories (DLL) reported a weak set of numbers for 3QFY16, which were below expectations, with reported PAT of Rs2.5bn 10% below our/Bloomberg consensus estimate each, following lower revenue growth, which was 5%/9% below our/Bloomberg consensus estimate, respectively, at Rs8.5bn. Lakshmi Machine Works - BUY - 3QFY16 Result Update - Yet Another Quarter of Positive Surprise; Retain Buy: Lakshmi Machine Works (LMW) posted 3QFY16 performance that was better than our expectations. We are positively surprised by revenue traction in all segments coupled with margin expansion. Strong revenue and margin performance was led by higher exports in 3QFY16. Exports witnessed a YoY growth of 12.4% in 9MFY16 to Rs3.89bn. Lupin- UNDER REVIEW - 3QFY16 Result Update - Performance Beats Expectations Led By Growth In US Market: Lupin reported a better-than-expected performance for 3QFY16, with reported revenue of Rs35.6bn (up 12%/7% YoY/QoQ, respectively) being 8%/6% above our /Bloomberg consensus estimate, respectively, led by the US business which reported revenues of Rs14bn, up 22% QoQ, following improvement in base business portfolio, increased contribution from Suprax and Antara, price hikes and the flu season. P&G Hygiene and Healthcare - BUY - 3QFY16 Result Update - Strong Margins, Remarkable Balance Sheet Improvement: Net sales of P&G Hygiene and Healthcare or P&GHH grew 10.7% YoY to Rs7.1bn in 2QFY16, 2.5% above expectations, led by double-digit growth in feminine hygiene and healthcare segments. Strong gross margin improvement of 250bps YoY (2QFY16 witnessed highest gross margin in 2Q in five years), and decline in A&P spending and other expenses (at least part of the reason is likely to be one-offs, but not disclosed) along with better-than-expected sales led to a 24-quarter high EBITDA margin of 30.3%, resulting in 68.4% YoY growth in EBITDA to Rs2.2bn and PAT growth of 61.8% YoY to Rs1.5bn. Westlife Development - BUY - 3QFY16 Result Update - Good Show Despite Tough Environment; Retain Buy: Westlife Development or WDL’s positive same-store sales growth or SSG of 3.1% in 3QFY16 was above our estimate of a flat number on this front. Revenues were 0.7% above expectations, up 7.8% YoY at Rs2,109mn. Lower-than-expected store addition in 3QFY16 (8 stores versus 13 stores that were expected) meant that sales did not track SSG outperformance.
Corporate/Global/Local News Upcoming Events Valuation Of Companies In Our Coverage Universe Source: Bloomberg, NSE, Nirmal Bang Institutional
Equities Research
Local Indices(Chg %) Close Daily YTDBSE Sensex 24,617 1.1 (5.7) NSE Nifty 7,489 1.1 (5.8) Sectoral Indices(Chg %) Close Daily YTDCNX Mid-Cap 12,383 1.9 (7.6) CNX Bank Nifty Index 15,162 2.0 (10.4) CNX Metal Index 1,643 3.7 (10.1) CNX FMCG Index 19,465 1.0 (3.6) CNX Infrastructure Index 2,409 0.6 (13.0) CNX Auto Index 7,496 1.6 (9.2) CNX IT Index 11,228 0.1 0.1 World IndicesDow Jones 16,205 (1.3) (7.0) S & P 500 1,880 (1.8) (8.0) FTSE 100 5,848 (0.9) (6.3) Nasdaq 4,363 (3.2) (12.9) Hang Seng 19,288 0.5 (12.0) Shanghai Comp 2,763 (0.6) (21.9) Net Investment
8-Feb 1M 3MFIIs (US$mn) (46.5) (86.5) 10.3 MFs (US$mn) (379.4) 8.7 167.2 DII turnover (Rsmn) 476.4 13.2 636.2 Volume
8-Feb US$bn Chg%Cash (NSE + BSE) 1.1 1.1 (8.0) F&O (net) 4.0 0.4 1.7
8-Feb 1 D 1 M 3MRs/US$ 67.7 67.6 66.6 65.7Rs/EUR 75.8 75.6 71.7 71.4Rs/GBP 98.3 98.9 97.8 101.110 yr G-Sec 7.8 7.8 7.7 7.7Call Money 7.6 6.8 7.7 5.8
8-Feb 1 D 1 M 3 MGold (US$/ounce) 1,165 1,173 1,104 1,090 Brent Crude (US$/bbl) 34 34 35 50 Aluminimum (US$/mt) 1,499 1,535 1,463 1,507 Copper (US$/mt) 4,630 4,687 4,645 5,011
Commodities & others
Forex/Money Markets
7,350
7,400
7,450
7,500
7,550
9 AM 10 AM 11 AM 12 PM 1 PM 2 PM 3 PM
8 February 2016
1

Institutional Equities
Morning Note
Corporate News
Toshiba Transmission & Distribution Systems (India) announced completion of a 3bn Yen investment (around US$30mn) at its Hyderabad factory, an expansion which would enable it in meeting the growing domestic and global demand.
Adani Power Ltd to sign a deal to set up a US$2.2bn coal-based power plant in Jharkhand, two people with knowledge of the matter said, as its controlling shareholder aims to nearly double capacity this decade.
Biocon management clarifies that the US government’s decision to not allow overseas pharmaceutical companies to import active pharmaceutical ingredient (API) applies to only one particular anti – retroviral drug and is not a blanket ban.
Software provider Quick Heal Technologies Limited to enter market with initial public offering on Feb 8, IPO consists of a fresh issue of Rs2,500mn by the company and an offer for sale of up to 6.3mn equity-shares by promoters part from investments from Sequoia Capital.
Mudra Bank management said that Bank of Baroda, Bank of India and Punjab National Bank are in discussion for refinance and are seeking capital worth Rs5 –10bn.
Balaji Telefilms on Friday said that it will raise Rs1,500mn through the allotment of equity shares on a preferential basis.
SunEdison has commissioned 146 MW of solar power projects in Tamil Nadu, Andhra Pradesh and Telangana, the energy from the solar power plants would be sold to local distribution channels and private companies.
Global/Local News
The Income-Tax Department has issued detailed guidelines for using electronic communication, or emails, for paperless assessment proceedings, the government has allowed tax payers to reply to notices using their registered email address. Central government to sign MoU with Karnataka for railway JV, railways ministry to come to an agreement with the state government to ensure that a new entity in JV is created.
Foreign Portfolio Investors over Rs25bn in the Indian capital markets in the first week of the month after pulling out hefty funds in the preceding month.
Delhi government said it has made a collection of more than Rs20bn VAT within one month, the Department of Trade and Taxes collected the amount in the month of January.
China’s central bank to fine tune monetary policy and keep the Yuan basically stable while guarding against systemic financial risks. U.S. employment gains estimated to have slowed in January, non-farm payrolls probably increased by 190,000 jobs last month, according to Reuters.
2

Institutional Equities
Morning Note
Event Calendar
8 February 9 February 10 February 11 February GSK Consumer 3QFY16e Revenue: Rs 9.7bn EBITDA: Rs 842mn PAT: Rs 816mn Strides Shasun Ltd 3QFY16e Revenue: Rs 8.4bn EBITDA: Rs 1.5bn PAT: Rs 572mn Atul Auto 3QFY16e Revenue: Rs 1,505mn EBITDA: Rs 224n PAT: Rs 145mn
Britannia 3QFY16e Revenue: Rs 22.4bn EBITDA: Rs 3.1bn PAT: Rs 2.0bn Aurobindo Pharma 3QFY16e Revenue: Rs 36.1bn EBITDA: Rs 8.7bn PAT: Rs 5.6bn Timken India 3QFY16e Revenue: Rs 2.7bn EBITDA: Rs 293mn PAT: Rs 165mn
Bajaj Electricals 3QFY16e Revenue: Rs 11.9bn EBITDA: Rs 569mn PAT: Rs 187mn Bata India 3QFY16e Revenue: Rs 6,221mn EBITDA: Rs 647mn PAT: Rs 351mn
Jubilant FoodWorks 3QFY16eRevenue: Rs 6.6bn EBITDA: Rs 825mn PAT: Rs 313mn Voltas 3QFY16e Revenue: Rs 10.9bn EBITDA: Rs 701mn PAT: Rs 589mn SKF India 4QFY16e Revenue: Rs 6.0bn EBITDA: Rs 539mn PAT: Rs 410mn BHEL 3QFY16e Revenue: Rs 65bn EBITDA: Rs 2.3bn PAT: Rs 1.9bn Natco Ltd 3QFY16e Revenue: Rs 2.6bn EBITDA: Rs 641mn PAT: Rs 339mn Hero MotoCorp 3QFY16e Revenue: Rs 73.8bn EBITDA: Rs 10.7bn PAT: Rs 7.6bn
12 February 13 February 14 February 15 February Nestle India 4QCY15e Revenue: Rs 21.8bn EBITDA: Rs 4.0bn PAT: Rs 2.3bn
16 February 17 February 18 February 19 February
20 February 21 February 22 February 23 February
3

Institutional Equities3Q
FY16
Res
ult U
pdate
Reuters: ARVN.BO; Bloomberg: ARVND IN
Arvind
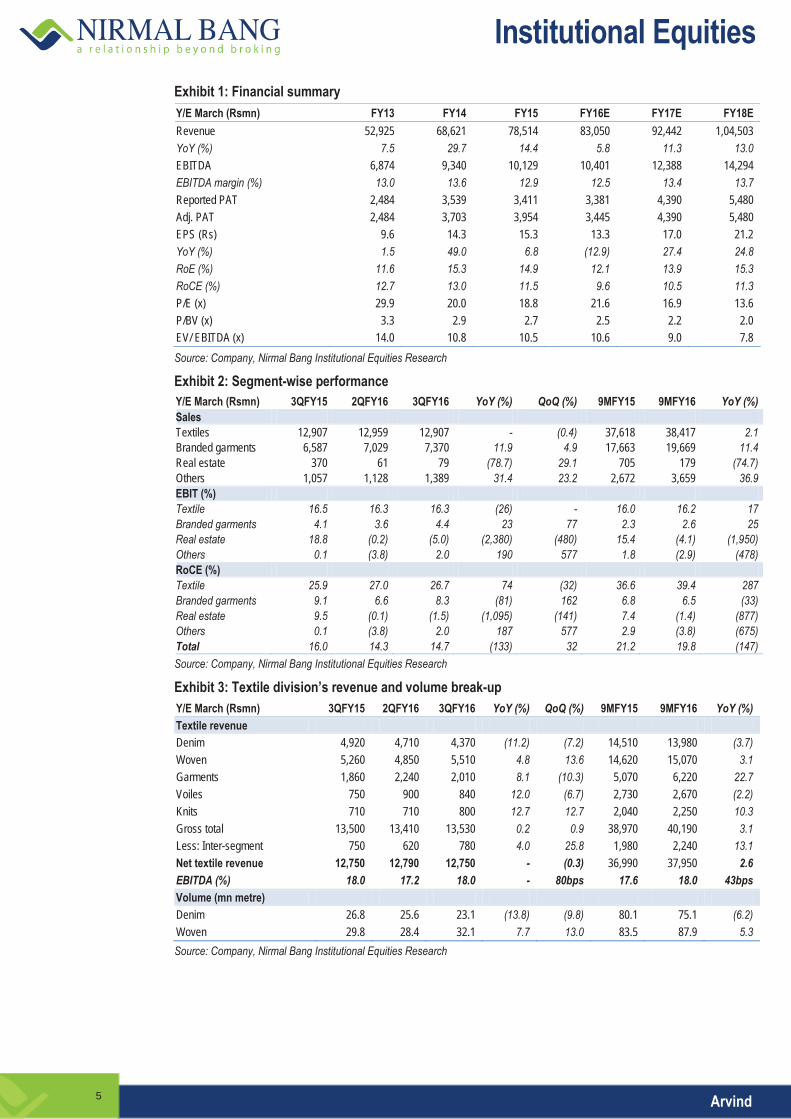
Subdued Performance Following flattish revenue in textile division and 15.3%/11.8% growth in power brands/Brands & Retail or B&R division, respectively, consolidated revenue of Arvind in 3QFY16 grew 4.0% to Rs21,575mn, 9.9%/4.6% below our/Bloomberg consensus estimate, respectively, because of sluggish domestic environment, weak volume in denim which impacted the textile division and a 16% decline in Megamart’s revenue which dragged down the growth of B&R division. In the wake of a challenging environment, brands segment achieved same-store sales growth or SSG of 1.7%. Core operating margin of B&R division improved 60bps, while the margins of power brands and textile division were flattish as a result of which consolidated operating margin declined 90bps to 13%, 100bps/64bps below our/Bloomberg estimate respectively. EBIT margin of textile/branded garment division declined/improved by 26bps/23bps to 16.3%/4.4% respectively. Following weak revenue growth and decline in margins, adjusted net profit fell to Rs1,042mn, 14.7%/11.3% below our/Bloomberg estimate, respectively. Working capital cycle of B&R division reduced from 154 days a year ago to 135 days in 3QFY16. Arvind reduced its inventory days in brands division by 32 days and in Megamart by 27 days. Departmental stores (contributing 30% to Arvind’s sales) operates on Sale or Return model now as a result of which the receivables increased for Arvind. The company is confident of bringing down the receivables level in FY17. The management expects brands division to grow 15%-16% and the company to grow 12%-14% for next five years. The management expects 4QFY16 to be very healthy as several large format stores have been set up during the quarter and expects a 9%-10% growth at company level. We have cut our FY16/FY17/FY18 revenue estimates by 4.1%/7.2%/9.1%, and PAT estimates by 6.6%/10.9%/13.3%, respectively. With a strong portfolio, Arvind has now turned selective in choosing new brands. It plans to partner with only those brands that have potential to deliver Rs5bn revenue, unlike its earlier benchmark of Rs1bn, leading to lower cash burn in future. Currently, the stock trades attractively at 13.6x/7.8x FY18E P/E and EV/EBITDA, respectively. Healthy margins in B&R division: Core operating margin of B&R division rose 60bps to 7.6%. Power brands’ revenue increased 15.3% to Rs4,150mn. Like-to-like growth (LTL) in power brands stood at 6%. Full-price sales in power brands has been very healthy and as a result it reduced the percentage of clothes sold on discount which affected LTL growth, although it has been profitable at EBITDA level. Improvement in working capital cycle in B&R division: Working capital cycle of B&R division reduced from 154 days a year ago to 135 days in 3QFY16. Arvind reduced its inventory days in brands division by 32 days and in Megamart by 27 days. Departmental stores (contributes 30% to Arvind’s sales) operate on Sale or Return model now as a result of which the receivables increased in FY16. The company is confident of bringing down its receivables level in FY17 by taking various initiatives. Denim impacts textile division: Textile division’s revenue was flat at Rs4,370mn. Denim volume declined 13.8% because of: a) Change in product mix, and b) Less off-take by some customers. There is no selling pressure in this division. Woven segment witnessed a rise in capacity to 130mn metres this year. It is growing steadily, although the pace is slower than what the management expected. The management expects ~116mn metres of woven fabric sales in FY16. Total capacity (India and Ethiopia) in shirt division increased from 6mn metres to 12mn metres and both countries are expected to have a significant improvement in shirt business in FY17.
UNDER REVIEW Sector: Retail CMP: Rs288
Chitvan Oza [email protected] +91-22-3926 8175
Key Data Current Shares O/S (mn) 258.2 Mkt Cap (Rsbn/US$bn) 74.3/1.1 52 Wk H / L (Rs) 366/216 Daily Vol. (3M NSE Avg.) 1,822,418 Price Performance (%)
1 M 6 M 1 Yr Arvind (17.2) (9.0) (1.5) Nifty Index (5.0) (13.1) (15.1)
Y/E March (Rsmn) 3QFY15 2QFY16 3QFY16 YoY (%) QoQ (%) 9MFY15 9MFY16 YoY (%) Net sales 20,737 20,964 21,575 4.0 2.9 58,109 61,309 5.5 Net RM costs & purchases of finished goods 9,066 9,080 9,492 4.7 4.5 25,773 26,637 3.4 % of sales 43.7 43.3 44.0 - - 44.4 43.4 - Employee costs 2,081 2,307 2,244 7.8 (2.7) 5,996 6,781 13.1 % of sales 10.0 11.0 10.4 - - 10.3 11.1 - Other expenses 6,708 6,964 7,034 4.9 1.0 18,807 20,206 7.4 % of sales 32.3 33.2 32.6 - - 32.4 33.0 - Operating profit 2,882 2,614 2,805 (2.7) 7.3 7,533 7,684 2.0 OPM (%) 13.9 12.5 13.0 - - 13.0 12.5 - Interest costs 1,018 947 895 (12.1) (5.4) 2,990 2,867 (4.1) Depreciation 558 614 654 17.1 6.5 1,563 1,895 21.2 Other income 150 320 188 25.4 (41.1) 702 756 7.6 Extra-ordinary income (25) (38) (13) (47.8) (66.0) (59) (79) 34.5 PBT 1,432 1,335 1,432 (0.0) 7.2 3,623 3,599 (0.6) Provision for tax 350 406 386 10.3 (4.9) 716 1,059 47.9 Effective tax rate (%) 24.4 30.4 26.9 - - 19.8 29.4 - Adjusted PAT 1,110 937 1,042 (6.1) 11.3 2,975 2,588 (13.0) NPM (%) 5.4 4.5 4.8 - - 5.1 4.2 - EPS (Rs) 4.3 3.6 4.0 (6.1) 11.3 11.5 10.0 (13.0) Source: Company, Nirmal Bang Institutional Equities Research
5 February 2016
4
Institutional Equities
Arvind
Exhibit 1: Financial summary Y/E March (Rsmn) FY13 FY14 FY15 FY16E FY17E FY18E Revenue 52,925 68,621 78,514 83,050 92,442 1,04,503 YoY (%) 7.5 29.7 14.4 5.8 11.3 13.0 EBITDA 6,874 9,340 10,129 10,401 12,388 14,294 EBITDA margin (%) 13.0 13.6 12.9 12.5 13.4 13.7 Reported PAT 2,484 3,539 3,411 3,381 4,390 5,480 Adj. PAT 2,484 3,703 3,954 3,445 4,390 5,480 EPS (Rs) 9.6 14.3 15.3 13.3 17.0 21.2 YoY (%) 1.5 49.0 6.8 (12.9) 27.4 24.8 RoE (%) 11.6 15.3 14.9 12.1 13.9 15.3 RoCE (%) 12.7 13.0 11.5 9.6 10.5 11.3 P/E (x) 29.9 20.0 18.8 21.6 16.9 13.6 P/BV (x) 3.3 2.9 2.7 2.5 2.2 2.0 EV/ EBITDA (x) 14.0 10.8 10.5 10.6 9.0 7.8 Source: Company, Nirmal Bang Institutional Equities Research
Exhibit 2: Segment-wise performance Y/E March (Rsmn) 3QFY15 2QFY16 3QFY16 YoY (%) QoQ (%) 9MFY15 9MFY16 YoY (%) Sales Textiles 12,907 12,959 12,907 - (0.4) 37,618 38,417 2.1 Branded garments 6,587 7,029 7,370 11.9 4.9 17,663 19,669 11.4 Real estate 370 61 79 (78.7) 29.1 705 179 (74.7) Others 1,057 1,128 1,389 31.4 23.2 2,672 3,659 36.9 EBIT (%) Textile 16.5 16.3 16.3 (26) - 16.0 16.2 17 Branded garments 4.1 3.6 4.4 23 77 2.3 2.6 25 Real estate 18.8 (0.2) (5.0) (2,380) (480) 15.4 (4.1) (1,950) Others 0.1 (3.8) 2.0 190 577 1.8 (2.9) (478) RoCE (%) Textile 25.9 27.0 26.7 74 (32) 36.6 39.4 287 Branded garments 9.1 6.6 8.3 (81) 162 6.8 6.5 (33) Real estate 9.5 (0.1) (1.5) (1,095) (141) 7.4 (1.4) (877) Others 0.1 (3.8) 2.0 187 577 2.9 (3.8) (675) Total 16.0 14.3 14.7 (133) 32 21.2 19.8 (147) Source: Company, Nirmal Bang Institutional Equities Research
Exhibit 3: Textile division’s revenue and volume break-up Y/E March (Rsmn) 3QFY15 2QFY16 3QFY16 YoY (%) QoQ (%) 9MFY15 9MFY16 YoY (%) Textile revenue Denim 4,920 4,710 4,370 (11.2) (7.2) 14,510 13,980 (3.7) Woven 5,260 4,850 5,510 4.8 13.6 14,620 15,070 3.1 Garments 1,860 2,240 2,010 8.1 (10.3) 5,070 6,220 22.7 Voiles 750 900 840 12.0 (6.7) 2,730 2,670 (2.2) Knits 710 710 800 12.7 12.7 2,040 2,250 10.3 Gross total 13,500 13,410 13,530 0.2 0.9 38,970 40,190 3.1 Less: Inter-segment 750 620 780 4.0 25.8 1,980 2,240 13.1 Net textile revenue 12,750 12,790 12,750 - (0.3) 36,990 37,950 2.6 EBITDA (%) 18.0 17.2 18.0 - 80bps 17.6 18.0 43bps Volume (mn metre) Denim 26.8 25.6 23.1 (13.8) (9.8) 80.1 75.1 (6.2) Woven 29.8 28.4 32.1 7.7 13.0 83.5 87.9 5.3 Source: Company, Nirmal Bang Institutional Equities Research
5
Institutional Equities
Arvind
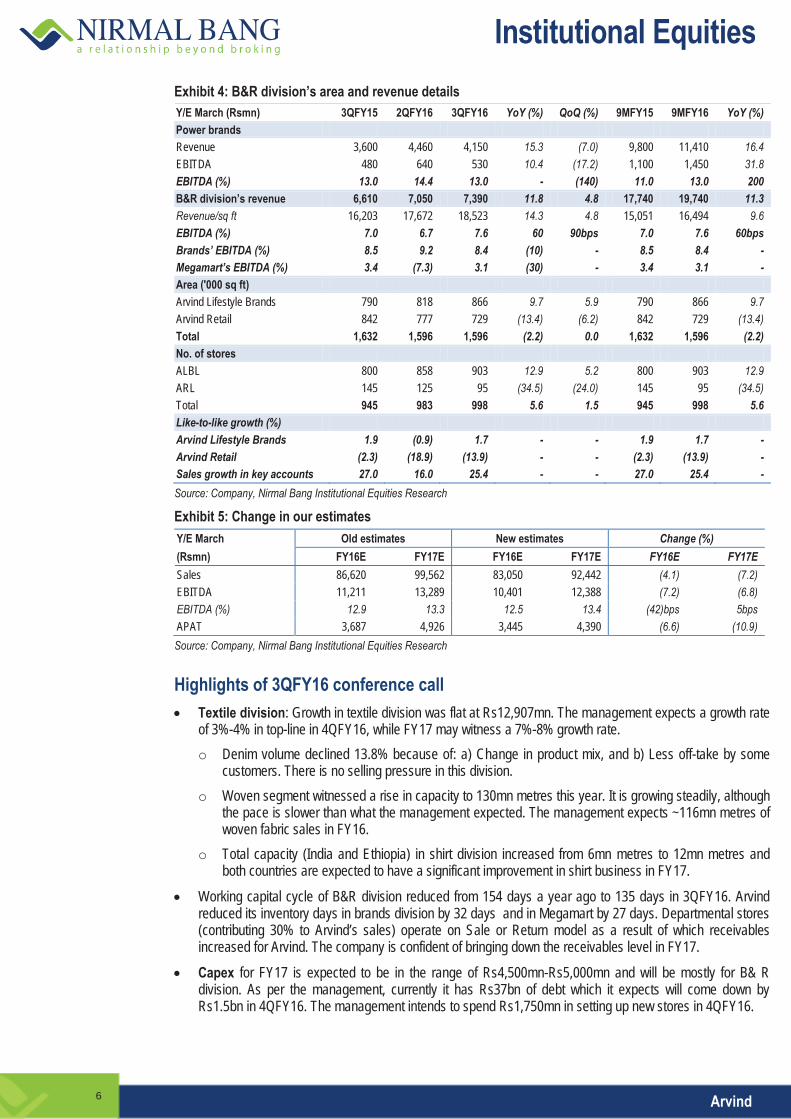
Exhibit 4: B&R division’s area and revenue details Y/E March (Rsmn) 3QFY15 2QFY16 3QFY16 YoY (%) QoQ (%) 9MFY15 9MFY16 YoY (%) Power brands Revenue 3,600 4,460 4,150 15.3 (7.0) 9,800 11,410 16.4 EBITDA 480 640 530 10.4 (17.2) 1,100 1,450 31.8 EBITDA (%) 13.0 14.4 13.0 - (140) 11.0 13.0 200 B&R division’s revenue 6,610 7,050 7,390 11.8 4.8 17,740 19,740 11.3 Revenue/sq ft 16,203 17,672 18,523 14.3 4.8 15,051 16,494 9.6 EBITDA (%) 7.0 6.7 7.6 60 90bps 7.0 7.6 60bps Brands’ EBITDA (%) 8.5 9.2 8.4 (10) - 8.5 8.4 - Megamart’s EBITDA (%) 3.4 (7.3) 3.1 (30) - 3.4 3.1 - Area ('000 sq ft) Arvind Lifestyle Brands 790 818 866 9.7 5.9 790 866 9.7 Arvind Retail 842 777 729 (13.4) (6.2) 842 729 (13.4) Total 1,632 1,596 1,596 (2.2) 0.0 1,632 1,596 (2.2) No. of stores ALBL 800 858 903 12.9 5.2 800 903 12.9 ARL 145 125 95 (34.5) (24.0) 145 95 (34.5) Total 945 983 998 5.6 1.5 945 998 5.6 Like-to-like growth (%) Arvind Lifestyle Brands 1.9 (0.9) 1.7 - - 1.9 1.7 - Arvind Retail (2.3) (18.9) (13.9) - - (2.3) (13.9) - Sales growth in key accounts 27.0 16.0 25.4 - - 27.0 25.4 - Source: Company, Nirmal Bang Institutional Equities Research
Exhibit 5: Change in our estimates Y/E March Old estimates New estimates Change (%) (Rsmn) FY16E FY17E FY16E FY17E FY16E FY17E Sales 86,620 99,562 83,050 92,442 (4.1) (7.2) EBITDA 11,211 13,289 10,401 12,388 (7.2) (6.8) EBITDA (%) 12.9 13.3 12.5 13.4 (42)bps 5bps APAT 3,687 4,926 3,445 4,390 (6.6) (10.9) Source: Company, Nirmal Bang Institutional Equities Research Highlights of 3QFY16 conference call
Textile division: Growth in textile division was flat at Rs12,907mn. The management expects a growth rate of 3%-4% in top-line in 4QFY16, while FY17 may witness a 7%-8% growth rate. o Denim volume declined 13.8% because of: a) Change in product mix, and b) Less off-take by some
customers. There is no selling pressure in this division. o Woven segment witnessed a rise in capacity to 130mn metres this year. It is growing steadily, although
the pace is slower than what the management expected. The management expects ~116mn metres of woven fabric sales in FY16.
o Total capacity (India and Ethiopia) in shirt division increased from 6mn metres to 12mn metres and both countries are expected to have a significant improvement in shirt business in FY17.
Working capital cycle of B&R division reduced from 154 days a year ago to 135 days in 3QFY16. Arvind reduced its inventory days in brands division by 32 days and in Megamart by 27 days. Departmental stores (contributing 30% to Arvind’s sales) operate on Sale or Return model as a result of which receivables increased for Arvind. The company is confident of bringing down the receivables level in FY17.
Capex for FY17 is expected to be in the range of Rs4,500mn-Rs5,000mn and will be mostly for B& R division. As per the management, currently it has Rs37bn of debt which it expects will come down by Rs1.5bn in 4QFY16. The management intends to spend Rs1,750mn in setting up new stores in 4QFY16.
6

Institutional Equities
Arvind
Megamart: Arvind has almost completed its exercise of store closure as in 3QFY16 their number reduced to 95 stores from 145 earlier. It closed 35 stores (mainly small stores) in 3QFY16 as a result of which revenues of Megamart declined 16%. Revenues of Megamart declined from Rs4,620mn in 3QFY15 toRs4,030mn in 3QFY16. The management intends to set up a few large format stores next year. Megmart is expected to achieve a turnover in FY17 similar to FY16.
Online channel contributes to 6% of sales for brands division. The management expects its contribution to increase to 8% in FY17. Margins are better in online channel and the company intends to launch a beta version of its online portal in March 2016.
The management expects 4QFY16 to be very healthy as several large format stores have been set up during the quarter. The company expects a 28%-29% growth in B&R division with Megamart acting as a drag. Overall, company is expecting 9%-10% growth in 4QFY16.
Brands & Retail division: o Power brands’ revenue increased 15.3% to Rs4,150mn. Like-to-like growth (LTL) in power brands
stood at 6%. Full-price sales in power brands division has been very healthy, thereby reducing the percentage of clothes sold on discount which affected LTL growth, although it has been profitable at EBITDA margin level. The growth in power brands declined by 15% from 23%-24% earlier as many of its brands have already matured. The management expects growth in power brands to be 17%-18% for FY16.
o Growth brands (excluding new and power brands) are expected to grow 28% in FY16 and 40%-60% in FY17.
o Speciality Retail: Currently, it has four GAP stores, has inherited four stores of Sephora and set up one store in Mumbai last week, TCY had only one store, but it opened two more stores, Aeropostole has one store. Overall launches have been successful and they were done with minimal investment. From low turnover and marginal loss earlier, it intends to become profitable now. Arvind will get full-year benefits of these stores in FY17, unlike in FY16.
The management expects brands division to grow 15%-16% for the next five years and expects a 10%-12% growth for the next five years in retail segment. Overall, it expects the company to grow 12%-14%.
Exhibit 6: Our estimates versus actual performance (Rsmn) 3QFY15 2QFY16 3QFY16 YoY (%) QoQ (%) 3QFY16E Devi. (%) 3QFY16 BBE Devi.(%) Revenue 20,737 20,964 21,575 4.0 2.9 23,949 (9.9) 22,615 (4.6) EBITDA 2,882 2,614 2,805 (2.7) 7.3 3,353 (16.3) 3,084 (9.0) EBITDA (%) 13.9 12.5 13.0 (90) 53 14.0 (100) 13.6 (64) Adjusted PAT 1,110 937 1,042 (6.1) 11.3 1,222 (14.7) 1,175 (11.3) Source: Company, Nirmal Bang Institutional Equities Research
Exhibit 7: One-year forward P/E Exhibit 8: P/E median band
Source: Nirmal Bang Institutional Equities Research
0
50
100
150
200
250
300
350
400
Aug-
11
Nov-1
1
Feb-
12
May-1
2
Aug-
12
Nov-1
2
Feb-
13
May-1
3
Aug-
13
Nov-1
3
Feb-
14Ma
y-14
Aug-
14
Nov-1
4
Feb-
15
May-1
5
Aug-
15
Nov-1
5
Feb-
16
(Rs)
9x
21x
6x
12x15x18x
0
5
10
15
20
25
30
Aug-
11
Nov-1
1
Feb-
12
May-1
2
Aug-
12
Nov-1
2
Feb-
13
May-1
3
Aug-
13
Nov-1
3
Feb-
14
May-1
4
Aug-
14
Nov-1
4
Feb-
15
May-1
5
Aug-
15
Nov-1
5
Feb-
16
(x)
Median 9.1x
7

Institutional Equities
Arvind
Exhibit 9: One-year forward EV/EBITDA Exhibit 10: EV/EBITDA median band
Source: Nirmal Bang Institutional Equities Research
30 40 50 60 70 80 90
100 110 120 130
Aug-
11
Nov-1
1
Feb-
12Ma
y-12
Aug-
12
Nov-1
2
Feb-
13Ma
y-13
Aug-
13
Nov-1
3
Feb-
14Ma
y-14
Aug-
14
Nov-1
4
Feb-
15Ma
y-15
Aug-
15
Nov-1
5
Feb-
16
(Rsbn)
7x
10x
9x
6x
8x
4
5
6
7
8
9
10
11
Aug-
11
Nov-
11
Feb-
12
May
-12
Aug-
12
Nov-
12
Feb-
13
May
-13
Aug-
13
Nov-
13
Feb-
14
May
-14
Aug-
14
Nov-
14
Feb-
15
(x)
Median 6.7x
8
Institutional Equities
Arvind
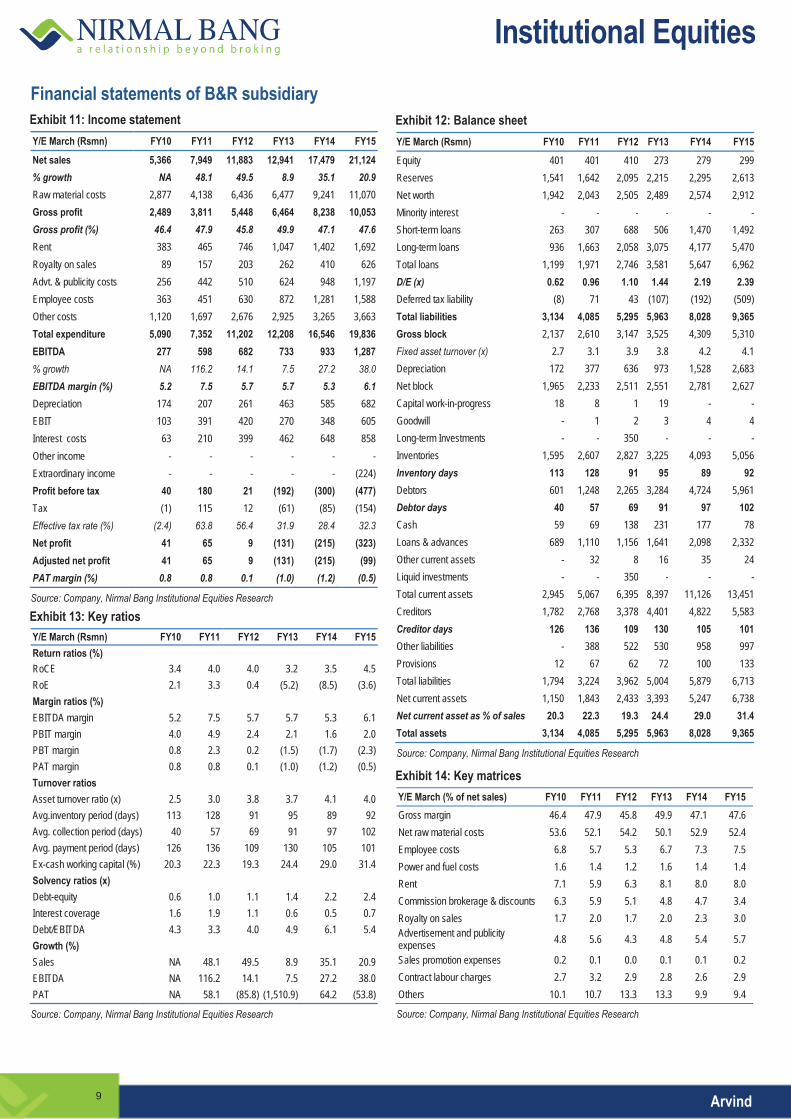
Financial statements of B&R subsidiary Exhibit 11: Income statement Y/E March (Rsmn) FY10 FY11 FY12 FY13 FY14 FY15 Net sales 5,366 7,949 11,883 12,941 17,479 21,124 % growth NA 48.1 49.5 8.9 35.1 20.9 Raw material costs 2,877 4,138 6,436 6,477 9,241 11,070 Gross profit 2,489 3,811 5,448 6,464 8,238 10,053 Gross profit (%) 46.4 47.9 45.8 49.9 47.1 47.6 Rent 383 465 746 1,047 1,402 1,692 Royalty on sales 89 157 203 262 410 626 Advt. & publicity costs 256 442 510 624 948 1,197 Employee costs 363 451 630 872 1,281 1,588 Other costs 1,120 1,697 2,676 2,925 3,265 3,663 Total expenditure 5,090 7,352 11,202 12,208 16,546 19,836 EBITDA 277 598 682 733 933 1,287 % growth NA 116.2 14.1 7.5 27.2 38.0 EBITDA margin (%) 5.2 7.5 5.7 5.7 5.3 6.1 Depreciation 174 207 261 463 585 682 EBIT 103 391 420 270 348 605 Interest costs 63 210 399 462 648 858 Other income - - - - - - Extraordinary income - - - - - (224) Profit before tax 40 180 21 (192) (300) (477) Tax (1) 115 12 (61) (85) (154) Effective tax rate (%) (2.4) 63.8 56.4 31.9 28.4 32.3 Net profit 41 65 9 (131) (215) (323) Adjusted net profit 41 65 9 (131) (215) (99) PAT margin (%) 0.8 0.8 0.1 (1.0) (1.2) (0.5)
Source: Company, Nirmal Bang Institutional Equities Research
Exhibit 13: Key ratiosY/E March (Rsmn) FY10 FY11 FY12 FY13 FY14 FY15 Return ratios (%) RoCE 3.4 4.0 4.0 3.2 3.5 4.5 RoE 2.1 3.3 0.4 (5.2) (8.5) (3.6) Margin ratios (%) EBITDA margin 5.2 7.5 5.7 5.7 5.3 6.1 PBIT margin 4.0 4.9 2.4 2.1 1.6 2.0 PBT margin 0.8 2.3 0.2 (1.5) (1.7) (2.3) PAT margin 0.8 0.8 0.1 (1.0) (1.2) (0.5) Turnover ratios Asset turnover ratio (x) 2.5 3.0 3.8 3.7 4.1 4.0 Avg.inventory period (days) 113 128 91 95 89 92 Avg. collection period (days) 40 57 69 91 97 102 Avg. payment period (days) 126 136 109 130 105 101 Ex-cash working capital (%) 20.3 22.3 19.3 24.4 29.0 31.4 Solvency ratios (x) Debt-equity 0.6 1.0 1.1 1.4 2.2 2.4 Interest coverage 1.6 1.9 1.1 0.6 0.5 0.7 Debt/EBITDA 4.3 3.3 4.0 4.9 6.1 5.4 Growth (%) Sales NA 48.1 49.5 8.9 35.1 20.9 EBITDA NA 116.2 14.1 7.5 27.2 38.0 PAT NA 58.1 (85.8) (1,510.9) 64.2 (53.8)
Source: Company, Nirmal Bang Institutional Equities Research
Exhibit 12: Balance sheet Y/E March (Rsmn) FY10 FY11 FY12 FY13 FY14 FY15 Equity 401 401 410 273 279 299 Reserves 1,541 1,642 2,095 2,215 2,295 2,613 Net worth 1,942 2,043 2,505 2,489 2,574 2,912 Minority interest - - - - - - Short-term loans 263 307 688 506 1,470 1,492 Long-term loans 936 1,663 2,058 3,075 4,177 5,470 Total loans 1,199 1,971 2,746 3,581 5,647 6,962 D/E (x) 0.62 0.96 1.10 1.44 2.19 2.39 Deferred tax liability (8) 71 43 (107) (192) (509) Total liabilities 3,134 4,085 5,295 5,963 8,028 9,365 Gross block 2,137 2,610 3,147 3,525 4,309 5,310 Fixed asset turnover (x) 2.7 3.1 3.9 3.8 4.2 4.1 Depreciation 172 377 636 973 1,528 2,683 Net block 1,965 2,233 2,511 2,551 2,781 2,627 Capital work-in-progress 18 8 1 19 - - Goodwill - 1 2 3 4 4 Long-term Investments - - 350 - - - Inventories 1,595 2,607 2,827 3,225 4,093 5,056 Inventory days 113 128 91 95 89 92 Debtors 601 1,248 2,265 3,284 4,724 5,961 Debtor days 40 57 69 91 97 102 Cash 59 69 138 231 177 78 Loans & advances 689 1,110 1,156 1,641 2,098 2,332 Other current assets - 32 8 16 35 24 Liquid investments - - 350 - - - Total current assets 2,945 5,067 6,395 8,397 11,126 13,451 Creditors 1,782 2,768 3,378 4,401 4,822 5,583 Creditor days 126 136 109 130 105 101 Other liabilities - 388 522 530 958 997 Provisions 12 67 62 72 100 133 Total liabilities 1,794 3,224 3,962 5,004 5,879 6,713 Net current assets 1,150 1,843 2,433 3,393 5,247 6,738 Net current asset as % of sales 20.3 22.3 19.3 24.4 29.0 31.4 Total assets 3,134 4,085 5,295 5,963 8,028 9,365
Source: Company, Nirmal Bang Institutional Equities Research
Exhibit 14: Key matricesY/E March (% of net sales) FY10 FY11 FY12 FY13 FY14 FY15 Gross margin 46.4 47.9 45.8 49.9 47.1 47.6 Net raw material costs 53.6 52.1 54.2 50.1 52.9 52.4 Employee costs 6.8 5.7 5.3 6.7 7.3 7.5 Power and fuel costs 1.6 1.4 1.2 1.6 1.4 1.4 Rent 7.1 5.9 6.3 8.1 8.0 8.0 Commission brokerage & discounts 6.3 5.9 5.1 4.8 4.7 3.4 Royalty on sales 1.7 2.0 1.7 2.0 2.3 3.0 Advertisement and publicity expenses 4.8 5.6 4.3 4.8 5.4 5.7
Sales promotion expenses 0.2 0.1 0.0 0.1 0.1 0.2 Contract labour charges 2.7 3.2 2.9 2.8 2.6 2.9 Others 10.1 10.7 13.3 13.3 9.9 9.4
Source: Company, Nirmal Bang Institutional Equities Research
9

Institutional Equities
Arvind
Financials (consolidated) Exhibit 15: Income statement Y/E March (Rsmn) FY13 FY14 FY15 FY16E FY17E FY18E Net sales 52,925 68,621 78,514 83,050 92,442 1,04,503 % growth 7.5 29.7 14.4 5.8 11.3 13.0 Raw material costs 22,272 31,241 34,939 36,922 40,467 45,561 Power & fuel 4,298 4,343 4,882 5,501 6,123 6,922 Staff costs 5,656 6,793 8,023 8,471 9,429 10,659 Other mfg. 13,825 16,904 20,542 21,755 24,035 27,066 Total expenditure 46,051 59,281 68,386 72,650 80,054 90,209 EBITDA 6,874 9,340 10,129 10,401 12,388 14,294 % growth 14.1 35.9 8.4 2.7 19.1 15.4 EBITDA margin (%) 13.0 13.6 12.9 12.5 13.4 13.7 Depreciation 2,043 2,252 2,124 2,553 2,808 3,040 EBIT 4,831 7,088 8,005 7,848 9,580 11,254 % growth 9.6 46.7 12.9 (2.0) 22.1 17.5 Interest 3,153 3,545 3,946 3,872 4,126 4,247 Other income 806 694 932 998 832 836 Extraordinary items - (164) (543) (79) - - Profit before tax 2,483 4,073 4,448 4,895 6,286 7,843 % growth (49.9) 64.0 9.2 10.1 28.4 24.8 Tax 3 548 1,072 1,488 1,886 2,353 Effective tax rate (%) 0.1 13.4 24.1 30.4 30.0 30.0 Net profit 2,481 3,526 3,376 3,407 4,400 5,490 % growth (43.1) 42.1 (4.2) 0.9 29.1 24.8 Extraordinary items - (164) (543) (64) - - Adjusted PAT 2,484 3,703 3,954 3,445 4,390 5,480 % growth 1.5 49.1 6.8 (12.9)
(12 9)27.4 24.8
Source: Company, Nirmal Bang Institutional Equities Research
Exhibit 17: Balance sheet Y/E March (Rsmn) FY13 FY14 FY15 FY16E FY17E FY18E Equity 2,580 2,582 2,582 2,582 2,582 2,582 Reserves 19,959 23,248 24,656 27,254 30,830 35,467 Net worth 22,540 25,830 27,239 29,836 33,413 38,049 Minority Int 108 242 348 374 384 394 Short-term loans 14,557 16,465 20,020 22,120 22,820 23,520 Long-term loans 10,051 13,455 13,941 14,641 15,441 15,441 Total loans 24,608 29,920 33,961 36,761 38,261 38,961 Deferred tax liability 58 435 471 1,058 1,812 2,754 Liabilities 47,313 56,427 62,018 68,029 73,870 80,157 Gross block 41,591 44,775 49,870 55,870 61,046 66,077 Depreciation 15,988 17,063 19,861 22,414 25,222 28,262 Net block 25,604 27,712 30,009 33,455 35,823 37,815 Capital work-in-progress 2,076 1,347 1,000 1,676 1,831 1,982 Goodwill 1,341 1,215 2,074 2,074 2,074 2,074 Long-term Investments 678 1,293 586 586 586 586 Inventories 14,129 16,281 18,450 18,768 20,681 23,304 Debtors 8,735 10,093 11,658 14,010 15,334 17,041 Cash 1,856 1,663 833 328 572 725 Other current assets 7,915 14,028 15,147 16,029 17,841 20,169 Total current assets 32,635 42,066 46,089 49,134 54,428 61,240 Creditors 10,978 12,495 13,494 14,328 15,788 17,791 Other current liabilities 4,043 4,711 4,245 4,568 5,084 5,748 Total current liabilities 15,021 17,205 17,739 18,896 20,873 23,539 Net current assets 17,614 24,860 28,350 30,238 33,556 37,701 Total assets 47,313 56,427 62,018 68,029 73,870 80,157
Source: Company, Nirmal Bang Institutional Equities Research
Exhibit 16: Cash flow Y/E March (Rsmn) FY13 FY14 FY15 FY16E FY17E FY18E EBIT 4,831 7,088 8,005 7,848 9,580 11,254 (Inc.)/dec. in working capital (2,895) (7,439) (4,320) (2,394) (3,073) (3,992) Cash flow from operations 1,937 (351) 3,685 5,454 6,507 7,262 Other income 806 694 932 998 832 836 Depreciation 2,043 2,252 2,124 2,553 2,808 3,040 Deferred liabilities (131) 377 36 587 754 941 Interest paid (-) (3,153) (3,545) (3,946) (3,872) (4,126) (4,247) Tax paid (-) (3) (548) (1,072) (1,488) (1,886) (2,353) Dividends paid (-) (498) (708) (768) (783) (813) (844) Share in profit/(loss) of
i ( P&L)3 13 35 (26) (10) (10)
Net cash from operations 1,003 (1,814) 1,026 3,424 4,066 4,625 Capital expenditure (-) (3,157) (3,630) (4,074) (6,676) (5,331) (5,182) Net cash after capex (2,154) (5,444) (3,048) (3,252) (1,265) (557) Inc./(dec.) in short-term b i
1,044 1,909 3,554 2,100 700 700 Inc./(dec.) in long-term b i
2,281 3,403 486 700 800 - Inc./(dec.) in borrowings 3,325 5,312 4,041 2,800 1,500 700 (Inc.)/dec. in investments (318) (490) (151) - - - Minority interest 17 134 105 26 10 10 Equity issue/(buyback) - - - - - - Cash from fin.activities 3,023 4,957 3,995 2,826 1,510 710 Others 278 295 (1,233) - - - Opening cash balance 709 1,856 1,663 833 328 572 Closing cash balance 1,856 1,663 833 328 572 725 Change in cash balance 1,147 (193) (830) (506) 245 153
Source: Company, Nirmal Bang Institutional Equities Research
Exhibit 18: Key ratios
Y/E March FY13 FY14 FY15 FY16E FY17E FY18E Per share (Rs) EPS 9.6 14.3 15.3 13.3 17.0 21.2 Book value 87.4 100.1 105.5 115.5 129.4 147.3 Valuation (x) P/E 29.9 20.0 18.8 21.6 16.9 13.6 P/sales 1.4 1.1 0.9 0.9 0.8 0.7 P/BV 3.3 2.9 2.7 2.5 2.2 2.0 EV/EBITDA 14.0 10.8 10.5 10.6 9.0 7.8 Return ratio (%) RoCE (Post tax) 12.7 13.0 11.5 9.6 10.5 11.3 RoCE (Pre tax) 12.7 15.1 15.2 13.8 15.0 16.2 RoE 11.6 15.3 14.9 12.1 13.9 15.3 Margin ratio (%) Gross margin 57.9 54.5 55.5 55.5 56.2 56.4 EBITDA margin 13.0 13.6 12.9 12.5 13.4 13.7 PBIT margin 9.1 10.3 10.2 9.4 10.4 10.8 PBT margin 4.7 5.9 5.7 5.9 6.8 7.5 PAT margin 4.7 5.4 5.0 4.1 4.7 5.2 Turnover ratio Asset turnover ratio (x) 1.1 1.2 1.3 1.2 1.3 1.3 Avg inventory period (days) 110 99 97 93 93 93 Avg collection period (days) 59 53 53 61 60 59 Avg payment period (days) 86 76 71 71 71 71 Ex-cash WC (% of sales) 29.8 33.8 35.0 36.0 35.7 35.4 Solvency ratios (x) Debt-equity 1.1 1.2 1.2 1.2 1.1 1.0 Interest coverage 1.5 2.0 2.0 2.0 2.3 2.6 Debt/EBITDA 3.6 3.2 3.4 3.5 3.1 2.7 Growth(%) Sales 7.5 29.7 14.4 5.8 11.3 13.0 EBITDA 14.1 35.9 8.4 2.7 19.1 15.4 PAT 1.5 49.1 6.8 (12.9) 27.4 24.8 Source: Company, Nirmal Bang Institutional Equities Research
10
Institutional Equities
Arvind
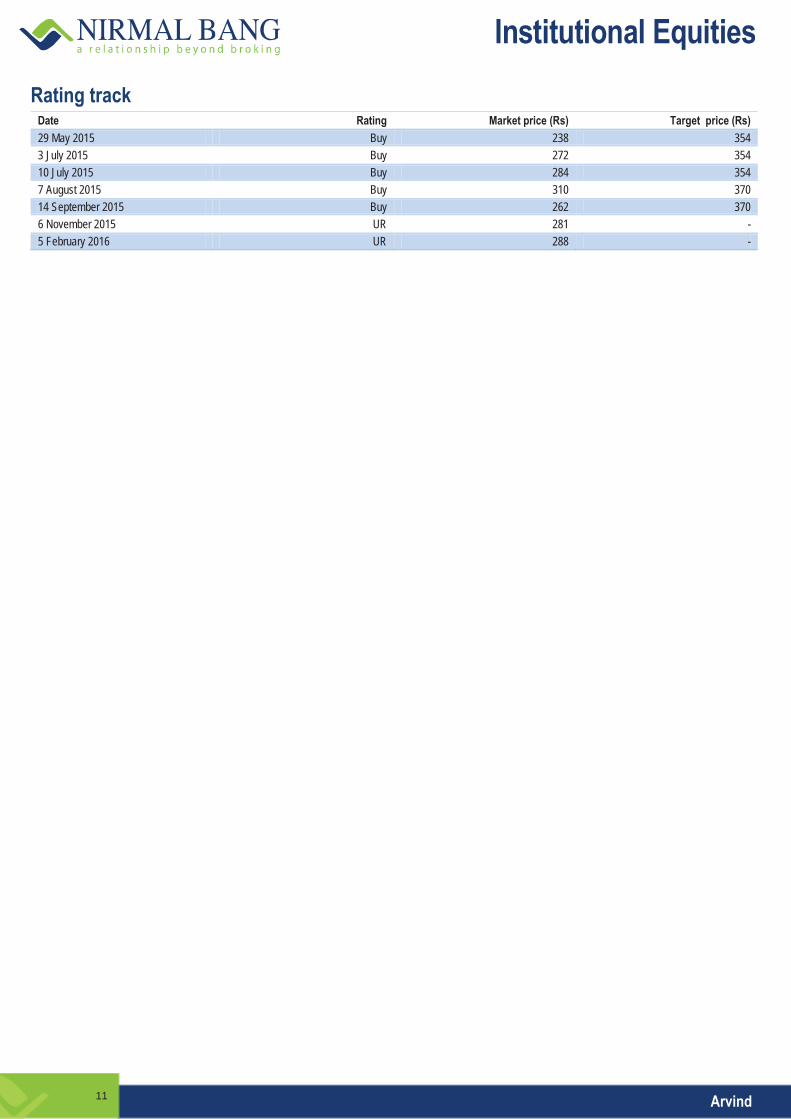
Rating track Date Rating Market price (Rs) Target price (Rs) 29 May 2015 Buy 238 354 3 July 2015 Buy 272 354 10 July 2015 Buy 284 354 7 August 2015 Buy 310 370 14 September 2015 Buy 262 370 6 November 2015 UR 281 - 5 February 2016 UR 288 -
11
Institutional Equities3Q
FY16
Res
ult U
pdate
Reuters: CADI.BO; Bloomberg: CDH IN
Cadila Healthcare 8 February 2016
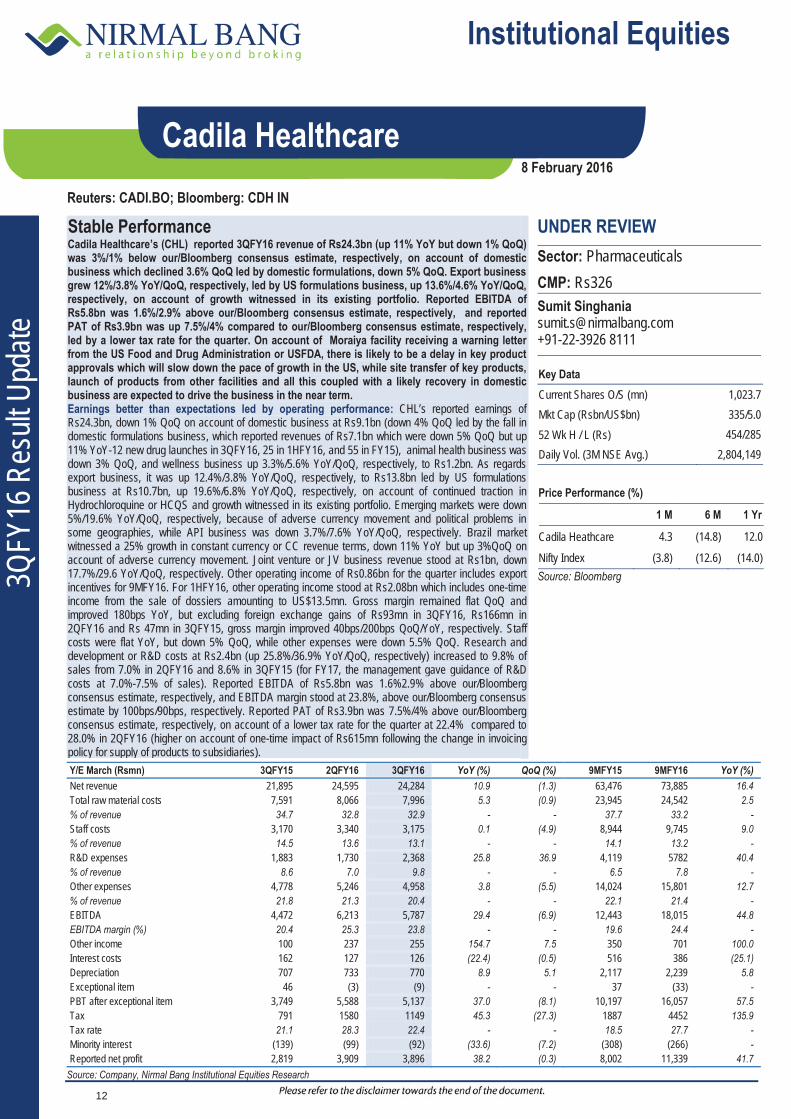
Stable Performance Cadila Healthcare’s (CHL) reported 3QFY16 revenue of Rs24.3bn (up 11% YoY but down 1% QoQ) was 3%/1% below our/Bloomberg consensus estimate, respectively, on account of domestic business which declined 3.6% QoQ led by domestic formulations, down 5% QoQ. Export business grew 12%/3.8% YoY/QoQ, respectively, led by US formulations business, up 13.6%/4.6% YoY/QoQ, respectively, on account of growth witnessed in its existing portfolio. Reported EBITDA of Rs5.8bn was 1.6%/2.9% above our/Bloomberg consensus estimate, respectively, and reported PAT of Rs3.9bn was up 7.5%/4% compared to our/Bloomberg consensus estimate, respectively, led by a lower tax rate for the quarter. On account of Moraiya facility receiving a warning letter from the US Food and Drug Administration or USFDA, there is likely to be a delay in key product approvals which will slow down the pace of growth in the US, while site transfer of key products, launch of products from other facilities and all this coupled with a likely recovery in domestic business are expected to drive the business in the near term. Earnings better than expectations led by operating performance: CHL’s reported earnings of Rs24.3bn, down 1% QoQ on account of domestic business at Rs9.1bn (down 4% QoQ led by the fall in domestic formulations business, which reported revenues of Rs7.1bn which were down 5% QoQ but up 11% YoY-12 new drug launches in 3QFY16, 25 in 1HFY16, and 55 in FY15), animal health business was down 3% QoQ, and wellness business up 3.3%/5.6% YoY/QoQ, respectively, to Rs1.2bn. As regards export business, it was up 12.4%/3.8% YoY/QoQ, respectively, to Rs13.8bn led by US formulations business at Rs10.7bn, up 19.6%/6.8% YoY/QoQ, respectively, on account of continued traction in Hydrochloroquine or HCQS and growth witnessed in its existing portfolio. Emerging markets were down 5%/19.6% YoY/QoQ, respectively, because of adverse currency movement and political problems in some geographies, while API business was down 3.7%/7.6% YoY/QoQ, respectively. Brazil market witnessed a 25% growth in constant currency or CC revenue terms, down 11% YoY but up 3%QoQ on account of adverse currency movement. Joint venture or JV business revenue stood at Rs1bn, down 17.7%/29.6 YoY/QoQ, respectively. Other operating income of Rs0.86bn for the quarter includes export incentives for 9MFY16. For 1HFY16, other operating income stood at Rs2.08bn which includes one-time income from the sale of dossiers amounting to US$13.5mn. Gross margin remained flat QoQ and improved 180bps YoY, but excluding foreign exchange gains of Rs93mn in 3QFY16, Rs166mn in 2QFY16 and Rs 47mn in 3QFY15, gross margin improved 40bps/200bps QoQ/YoY, respectively. Staff costs were flat YoY, but down 5% QoQ, while other expenses were down 5.5% QoQ. Research and development or R&D costs at Rs2.4bn (up 25.8%/36.9% YoY/QoQ, respectively) increased to 9.8% of sales from 7.0% in 2QFY16 and 8.6% in 3QFY15 (for FY17, the management gave guidance of R&D costs at 7.0%-7.5% of sales). Reported EBITDA of Rs5.8bn was 1.6%2.9% above our/Bloomberg consensus estimate, respectively, and EBITDA margin stood at 23.8%, above our/Bloomberg consensus estimate by 100bps/90bps, respectively. Reported PAT of Rs3.9bn was 7.5%/4% above our/Bloomberg consensus estimate, respectively, on account of a lower tax rate for the quarter at 22.4% compared to 28.0% in 2QFY16 (higher on account of one-time impact of Rs615mn following the change in invoicing policy for supply of products to subsidiaries).
UNDER REVIEW Sector: Pharmaceuticals CMP: Rs326 Sumit Singhania [email protected] +91-22-3926 8111
Key Data Current Shares O/S (mn) 1,023.7 Mkt Cap (Rsbn/US$bn) 335/5.0 52 Wk H / L (Rs) 454/285 Daily Vol. (3M NSE Avg.) 2,804,149 Price Performance (%)
1 M 6 M 1 Yr
Cadila Heathcare 4.3 (14.8) 12.0
Nifty Index (3.8) (12.6) (14.0) Source: Bloomberg
Y/E March (Rsmn) 3QFY15 2QFY16 3QFY16 YoY (%) QoQ (%) 9MFY15 9MFY16 YoY (%) Net revenue 21,895 24,595 24,284 10.9 (1.3) 63,476 73,885 16.4 Total raw material costs 7,591 8,066 7,996 5.3 (0.9) 23,945 24,542 2.5 % of revenue 34.7 32.8 32.9 - - 37.7 33.2 - Staff costs 3,170 3,340 3,175 0.1 (4.9) 8,944 9,745 9.0 % of revenue 14.5 13.6 13.1 - - 14.1 13.2 - R&D expenses 1,883 1,730 2,368 25.8 36.9 4,119 5782 40.4 % of revenue 8.6 7.0 9.8 - - 6.5 7.8 - Other expenses 4,778 5,246 4,958 3.8 (5.5) 14,024 15,801 12.7 % of revenue 21.8 21.3 20.4 - - 22.1 21.4 - EBITDA 4,472 6,213 5,787 29.4 (6.9) 12,443 18,015 44.8 EBITDA margin (%) 20.4 25.3 23.8 - - 19.6 24.4 - Other income 100 237 255 154.7 7.5 350 701 100.0 Interest costs 162 127 126 (22.4) (0.5) 516 386 (25.1) Depreciation 707 733 770 8.9 5.1 2,117 2,239 5.8 Exceptional item 46 (3) (9) - - 37 (33) - PBT after exceptional item 3,749 5,588 5,137 37.0 (8.1) 10,197 16,057 57.5 Tax 791 1580 1149 45.3 (27.3) 1887 4452 135.9 Tax rate 21.1 28.3 22.4 - - 18.5 27.7 - Minority interest (139) (99) (92) (33.6) (7.2) (308) (266) - Reported net profit 2,819 3,909 3,896 38.2 (0.3) 8,002 11,339 41.7
Source: Company, Nirmal Bang Institutional Equities Research 12

Institutional Equities
Cadila Healthcare
Other highlights 1) CHL has given tax rate guidance of 24% FY16 and around 20% for FY17. 2) As regards Moraiya unit, which received a warning letter from the US Food and Drug Administration or
USFDA in December 2015, the management highlighted that post implementation of remedial measures there could be a re-inspection by the USFDA to get the site cleared. This unit has around 74 abbreviated new drug applications or ANDAs awaiting approval.
3) CHL has secured approval for transfer of 11 of its existing products from Moraiya plant (received warning letter) to its other plant in Baddi. Of these11, the company has started commercial production in case of 9 products. Approvals for new products involving site transfer from Moraiya plant to other plants are expected to take around three to six months.
4) As far as the site transfers for key products like Asacol HD and Prevacid ODT are concerned, the company has initiated the process of site transfer.
5) The company has the option to launch Asacol HD AG in the market by July 2016. If it chooses to launch this product, then it will not be able to launch generic Asacol under 180-day marketing exclusivity.
6) Apart from Moraiya unit, the company also got a warning letter from the USFDA for its Ahmedabad-based API facility in December 2015.
7) The management expects to get around 15 ANDAs from the USFDA in FY17, primarily for its Baddi and SEZ facilities.
8) The company currently has 60 products in the US market. It has 90 product approvals. 9) In 3QFY16, the company filed for 20 products, in 2QFY16 it filed for 4 products while 6 filings were done in
1QFY16.The company expects to file for around 40 products in FY17. These filings will be for products from Baddi and SEZ facilities.
10) Other than Moraiya unit, the plant at Baddi does not have any sterile and injectable facilities and therefore the company is coming up with a new plant having the said facilities in Baroda. The construction of the new plant is complete and it is expected to go on stream in June/July of 2017. The filings from this plant will commence in FY17.
11) Gross debt stood at Rs24bn, net debt at 13.8bn and cash at Rs10.6bn.
Exhibit 1: Financial summary Y/E March (Rsmn) FY14 FY15 FY16E FY17E FY18E Revenue 72,240 86,513 100,893 113,753 130,397 YoY (%) 13.6 19.8 16.6 12.7 14.6 EBITDA 12,001 17,578 23,925 24,451 28,664 EBITDA (%) 16.6 20.3 23.7 21.5 22.0 Reported PAT 8,036 11,506 15,373 16,280 19,382 Adj. PAT 8,189 11,591 15,373 16,280 19,382 YoY (%) 25.3 41.5 32.6 5.9 19.1 Fully DEPS 8.0 11.3 15.0 15.9 18.9 RoE (%) 25.7 30.1 31.7 26.7 25.9 RoCE (%) 16.0 21.8 27.0 23.4 24.1 P/E (x) 41.6 29.0 21.7 20.5 17.2 EV/EBITDA (x) 29.6 20.1 14.6 14.2 11.9
Source: Company, Nirmal Bang Institutional Equities Research
13
Institutional Equities
Cadila Healthcare
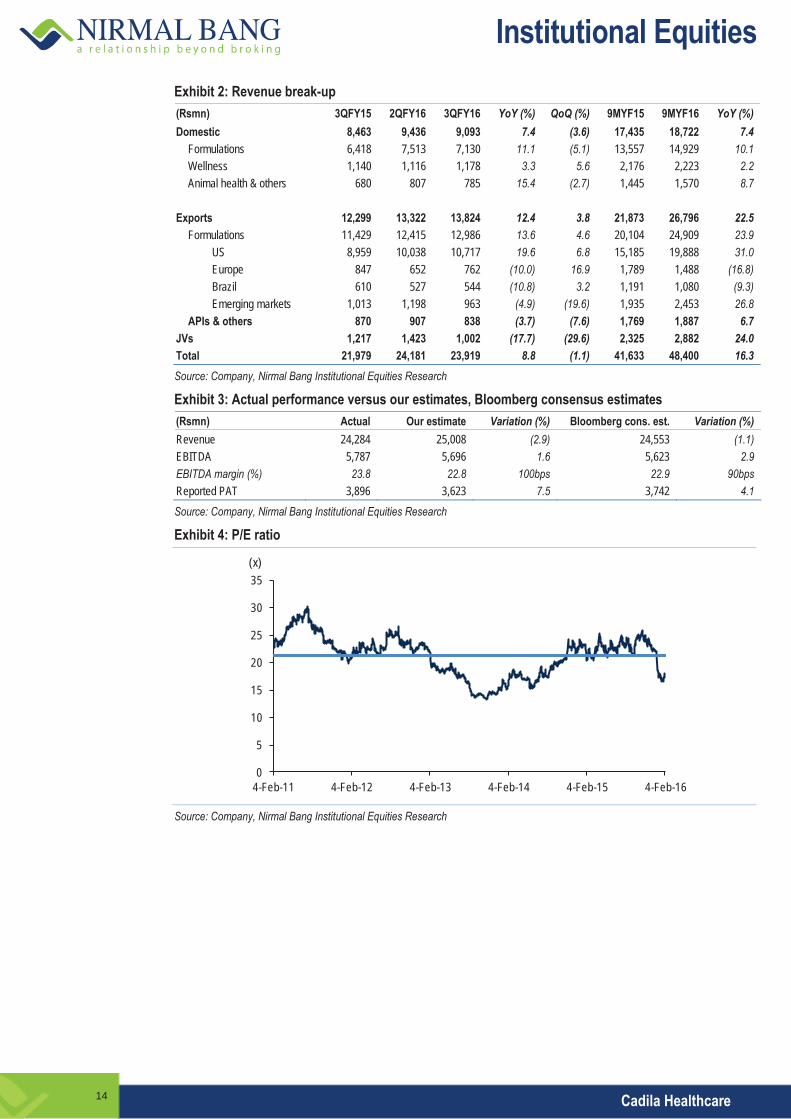
Exhibit 2: Revenue break-up (Rsmn) 3QFY15 2QFY16 3QFY16 YoY (%) QoQ (%) 9MYF15 9MYF16 YoY (%) Domestic 8,463 9,436 9,093 7.4 (3.6) 17,435 18,722 7.4
Formulations 6,418 7,513 7,130 11.1 (5.1) 13,557 14,929 10.1 Wellness 1,140 1,116 1,178 3.3 5.6 2,176 2,223 2.2 Animal health & others 680 807 785 15.4 (2.7) 1,445 1,570 8.7
Exports 12,299 13,322 13,824 12.4 3.8 21,873 26,796 22.5
Formulations 11,429 12,415 12,986 13.6 4.6 20,104 24,909 23.9 US 8,959 10,038 10,717 19.6 6.8 15,185 19,888 31.0 Europe 847 652 762 (10.0) 16.9 1,789 1,488 (16.8) Brazil 610 527 544 (10.8) 3.2 1,191 1,080 (9.3) Emerging markets 1,013 1,198 963 (4.9) (19.6) 1,935 2,453 26.8
APIs & others 870 907 838 (3.7) (7.6) 1,769 1,887 6.7 JVs 1,217 1,423 1,002 (17.7) (29.6) 2,325 2,882 24.0 Total 21,979 24,181 23,919 8.8 (1.1) 41,633 48,400 16.3 Source: Company, Nirmal Bang Institutional Equities Research Exhibit 3: Actual performance versus our estimates, Bloomberg consensus estimates (Rsmn) Actual Our estimate Variation (%) Bloomberg cons. est. Variation (%) Revenue 24,284 25,008 (2.9) 24,553 (1.1) EBITDA 5,787 5,696 1.6 5,623 2.9 EBITDA margin (%) 23.8 22.8 100bps 22.9 90bps Reported PAT 3,896 3,623 7.5 3,742 4.1
Source: Company, Nirmal Bang Institutional Equities Research
Exhibit 4: P/E ratio
Source: Company, Nirmal Bang Institutional Equities Research
0
5
10
15
20
25
30
35
4-Feb-11 4-Feb-12 4-Feb-13 4-Feb-14 4-Feb-15 4-Feb-16
(x)
14

Institutional Equities
Cadila Healthcare
Financials Exhibit 5: Income statement Y/E March (Rsmn) FY14 FY15 FY16E FY17E FY18E Net sales (incl. other oper. income) 72,240 86,513 100,893 113,753 130,397 % growth 13.6 19.8 16.6 12.7 14.6 Raw material costs (27,136) (31,966) (29,715) (35,499) (40,057) Staff costs (10,711) (12,085) (14,127) (16,085) (18,439) Research & development exp. (4,608) (5,607) (7,307) (8,320) (9,537) Other expenses (17,784) (19,277) (25,818) (29,397) (33,699) Total expenditure (60,239) (68,935) (76,967) (89,302) (101,732) EBITDA 12,001 17,578 23,925 24,451 28,664 % growth 6.7 46.5 36.1 2.2 17.2 EBITDA margin (%) 16.6 20.3 23.7 21.5 22.0 Other income 507 554 792 902 1,034 Interest costs (902) (679) (765) (735) (705) Gross profit 11,606 17,453 23,952 24,618 28,993 % growth 16.8 50.4 37.2 2.8 17.8 Depreciation (2,012) (2,873) (3,099) (3,639) (4,017) Profit before tax 9,594 14,580 20,853 20,979 24,976 % growth 18.6 52.0 43.0 0.6 19.1 Tax (1,060) (2,594) (5,005) (4,196) (4,995) Effective tax rate (%) 11.0 17.8 24.0 20.0 20.0 Minority interest (326) (376) (475) (504) (599) Net profit 8,036 11,506 15,373 16,280 19,382 % growth 23.0 43.2 33.6 5.9 19.1 Adj. profit 8,189 11,591 15,373 16,280 19,382 % growth 25.3 41.5 32.6 5.9 19.1
Source: Company, Nirmal Bang Institutional Equities Research
Exhibit 7: Balance sheet Y/E March (Rsmn) FY14 FY15 FY16E FY17E FY18E Equity 1,024 1,024 1,024 1,024 1,024 Reserves 33,366 41,493 53,523 66,263 81,431 Net worth 34,390 42,517 54,547 67,287 82,454 Total loans 27,004 26,513 25,513 24,513 23,513 Deferred tax liability 961 586 586 586 586 Minority interest 1,444 1,690 2,163 2,664 3,260 Total liabilities 63,799 71,305 82,808 95,048 109,811 Gross block 46,640 51,385 57,385 67,385 74,385 Depreciation 15,402 17,863 20,962 24,601 28,617 Net block 31,238 33,522 36,423 42,784 45,768 Capital work-in-progress 8,915 7,979 7,979 7,979 7,979 Long-term Investments 866 1,544 1,544 1,544 1,544 Inventories 13,675 15,357 18,685 21,275 24,736 Debtors 11,337 15,884 18,685 21,275 24,388 Cash 5,488 6,699 9,495 10,994 17,210 Other current assets 8,347 9,487 10,774 12,169 13,846 Total current assets 38,847 47,427 57,638 65,714 80,181 Creditors 9,108 10,909 12,180 14,132 16,099 Other current liabilities 6,959 8,258 8,596 8,841 9,562 Total current liabilities 16,067 19,167 20,776 22,973 25,662 Net current assets 22,780 28,260 36,862 42,741 54,519 Total assets 63,799 71,305 82,808 95,048 109,811
Source: Company, Nirmal Bang Institutional Equities Research
Exhibit 6: Cash flow Y/E March (Rsmn) FY14 FY15 FY16E FY17E FY18E EBIT 9,989 14,705 20,827 20,812 24,648 (Inc.)/dec. in working capital (1,703) (4,900) (6,113) (4,577) (6,237) Cash flow from operations 8,286 9,805 14,713 16,235 18,411 Other income 507 554 792 902 1,034 Depreciation 2,012 2,873 3,099 3,639 4,017 Interest paid (-) (902) (679) (765) (735) (705) Tax paid (-) (1,060) (2,594) (5,005) (4,196) (4,995) Dividends paid (-) (1,875) (2,268) (3,038) (3,345) (3,542) Net cash from operations 6,968 7,691 9,796 12,500 14,219 Capital expenditure (-) (4,437) (3,809) (6,000) (10,000) (7,000) Net cash after capex 2,531 3,882 3,796 2,500 7,219 Inc./(dec.) in long-term borrowing (2,174) (491) (1,000) (1,000) (1,000) Inc./(dec.) in borrowings (2,174) (491) (1,000) (1,000) (1,000) (Inc.)/dec. in investments 279 (678) - - - Cash from financial activities (1,895) (1,169) (1,000) (1,000) (1,000) Others (986) (1,502) - - - Opening cash balance 5,838 5,488 6,699 9,495 10,994 Closing cash balance 5,488 6,699 9,495 10,994 17,210 Change in cash balance (350) 1,211 2,796 1,499 6,216
Source: Company, Nirmal Bang Institutional Equities Research Exhibit 8: Key ratios Y/E March FY14 FY15 FY16E FY17E FY18E Per share (Rs) Reported EPS 7.8 11.2 15.0 15.9 18.9 Adjusted EPS 8.0 11.3 15.0 15.9 18.9 DPS 2.0 2.6 2.7 2.9 3.4 BV/share 33.6 41.5 53.3 65.7 80.5 Dividend payout (%) 30.7 29.6 21.7 21.7 21.7 Performance ratios (%) RoE 25.7 30.1 31.7 26.7 25.9 RoCE 16.0 21.8 27.0 23.4 24.1 Valuation ratios (x) P/E 41.6 29.0 21.7 20.5 17.2 P/BV 9.7 7.9 6.1 5.0 4.1 EV/net sales 4.9 4.1 3.5 3.1 2.6 EV/EBITDA 29.6 20.1 14.6 14.2 11.9 Efficiency ratios Asset turnover (x) 1.1 1.3 1.3 1.2 1.2 Working capital/sales (x) 0.4 0.4 0.4 0.4 0.5 Receivable days 58.6 68.2 70.0 70.0 70.0 Inventory days 70.7 66.0 70.0 70.0 71.0 Payable days 59.8 62.9 63.8 63.7 63.7
Source: Company, Nirmal Bang Institutional Equities Research
15

Institutional Equities3Q
FY16
Res
ult U
pdate
Reuters: DIVI.BO; Bloomberg: DIVI IN
Divis Laboratories 8 February 2016
Weak Performance Led By Lower Revenue Growth Divis Laboratories (DLL) reported a weak set of numbers for 3QFY16, which were below expectations, with reported PAT of Rs2.5bn 10% below our/Bloomberg consensus estimate each, following lower revenue growth, which was 5%/9% below our/Bloomberg consensus estimate, respectively, at Rs8.5bn. Revenue growth was weak because of shipments deferred to the next quarter. EBITDA of Rs3.2bn was 7%/11% below our/Bloomberg consensus estimate, respectively. Reported EBITDA margin of 37.8% was down 40bps/60bps versus our/Bloomberg consensus estimate, respectively. We continue to remain sanguine on DLL led by ramp-up at its DSN unit continuing coupled with future revenue growth set to kick in on account of newly announced capacity addition and expansion, reaffirming our stance that a 20% growth over next few years is likely. Earnings below expectation led by subdued revenue growth: DLL reported earnings of Rs2.5bn, 10% below our/Bloomberg consensus estimate each, led by lower revenue growth which was 5%/9% below our/Bloomberg consensus estimate, respectively, at Rs8.5bn. Revenue growth was weak because of shipments deferred to the next quarter. Generics business revenue of Rs4.1bn was down 14% QoQ, and custom synthesis (CS) business revenue of Rs3.8bn was down 11% QoQ. Revenue from carotenoids segment stood at Rs550mn compared to Rs460mn in 2QFY16 and Rs370mn in 3QFY15, up 49%/20% YoY/QoQ, respectively. The broad-based split between generics and (CS) businesses was 55% and 45%, respectively, in 3QFY16, which was the same for the previous quarter as well, while it was 54% and 46% in 3QFY15, respectively. For 9 months of FY16, the split was 55% and 45%, respectively. Reported EBITDA of Rs3.2bn was 7%/11% below our/Bloomberg consensus estimate, respectively. EBITDA margin for the quarter was 37.8%, 120bps down QoQ and 40bps/60bps down compared to our/Bloomberg consensus estimate, respectively. EBITDA for the quarter was down on account of lower revenue growth during the quarter, higher staff costs (up 22%/6% YoY/QoQ, respectively) and other expenses (up 10%/4% YoY/QoQ, respectively) although gross margin for the quarter improved 310bps/280bps YoY/QoQ, respectively, implying better margins from CS business. Other income was down 24%/49% YoY/QoQ, respectively, on account of lower forex gains amounting to Rs29.4mn compared to a gain of Rs116.6mn in 2QFY16 and Rs110mn in 3QFY15. Tax rate for the quarter was down at 19.8% compared to 21.2% in 2QFY16 and 20.6% in 3QFY15. The management has given guidance that the tax rate for FY16 will be 21%-22% and 22%-23% for FY17. Other highlights: a) For 9MFY16, DLL capitalised fixed assets to the tune of Rs1.8bn. b) For the new plant to be set up at Kakinada, DLL earmarked Rs5bn, but the capex is delayed and will now be incurred equally over the next two years. c) DLL will also expand its Vizag unit for which an additional capex of Rs2.5bn is earmarked to be spent in FY17E. d) DLL has retained its guidance of a 15%-20% revenue growth for FY16.
UNDER REVIEW Sector: Pharmaceuticals CMP: Rs1,110
Sumit Singhania [email protected] +91-22-3926 8111
Key Data Current Shares O/S (mn) 265.5 Mkt Cap (Rsbn/US$bn) 291.1/4.3 52 Wk H / L (Rs) 1,242/786 Daily Vol. (3M NSE Avg.) 304,522
Price Performance (%) 1 M 6 M 1 Yr
Divis Labs (4.4) 9.8 35.2 Nifty Index (3.8) (12.6) (14.0) Source: Bloomberg
Y/E March (Rsmn) 3QFY15 2QFY16 3QFY16 YoY (%) QoQ (%) 9MFY15 9MFY16 YoY (%) Net revenue 7,911 9,643 8,529 7.8 (11.6) 22,669 26,260 15.8 Raw material costs 3,186 3,854 3,175 (0.4) (17.6) 9,182 10,234 11.5 % of net revenue 40.3 40.0 37.2 - - 40.5 39.0 - Staff costs 746 860 912 22.2 6.1 2,043 2,575 26.1 % of net revenue 9.4 8.9 10.7 - - 9.0 9.8 - Other expenses 1,108 1,170 1,219 10.1 4.2 3,155 3,470 10.0 % of net revenue 14.0 12.1 14.3 - - 13.9 13.2 - EBITDA 2,871 3,760 3,223 12.3 (14.3) 8,291 9,981 20.4 EBITDA margin (%) 36.3 39.0 37.8 150bps (120bps) 36.6 38.0 (140bps) Other income 199 296 152 (23.8) (48.7) 482 788 63.6 Interest costs 5 3 2 (52.1) (32.4) 13 8 (37.8) Depreciation 288 301 299 3.8 (0.6) 913 889 (2.7) PBT 2,778 3,752 3,074 10.7 (18.1) 7,847 9,873 25.8 Tax 572 795 608 6.4 (23.5) 1,665 2,018 21.2 Tax rate (%) 20.6 21.2 19.8 - - 21.2 20.4 - Reported PAT 2,206 2,957 2,466 11.8 (16.6) 6,182 7,855 27.1
*Standalone numbers; Source: Company, Nirmal Bang Institutional Equities Research
16

Institutional Equities
Divis Laboratories
Exhibit 1: Financial summary (consolidated) Y/E March (Rsmn) FY14 FY15 FY16E FY17E FY18E Revenue 25,187 30,959 37,832 45,398 54,478 YoY (%) 18.9 22.9 22.2 20.0 20.0 EBITDA 10,391 11,491 14,565 17,251 20,702 EBITDA (%) 41.3 37.1 38.5 38.0 38.0 Reported PAT 7,733 8,515 10,943 12,841 15,615 YoY (%) 28.5 10.1 28.5 17.4 21.6 Fully DEPS 29.1 32.1 41.2 48.4 58.8 RoE (%) 28.3 26.4 28.5 28.0 28.5 RoCE (%) 33.2 30.0 33.4 33.0 33.6 P/E (x) 38.1 34.6 26.9 23.0 18.9 EV/EBITDA (x) 14.2 12.8 10.1 8.5 7.1 Source: Company, Nirmal Bang Institutional Equities Research Exhibit 2: Actual performance versus our estimates, Bloomberg consensus estimates Particulars (Rsmn) Actual Our estimate Variation (%) Bloomberg cons.est. Variation (%) Revenue 8,529 9,018 (5.4) 9,372 (9.0) EBITDA 3,223 3,447 (6.5) 3,603 (10.6) EBITDA margin (%) 37.8 38.2 (40 bps) 38.4 (60 bps) Reported PAT 2,466 2,737 (9.9) 2,737 (9.9)
Source: Bloomberg, Company, Nirmal Bang Institutional Equities Research
Exhibit 3: P/E ratio
Source: Bloomberg, Nirmal Bang Institutional Equities Research
0
5
10
15
20
25
30
4-Feb-11 4-Feb-12 4-Feb-13 4-Feb-14 4-Feb-15 4-Feb-16
(x)
17

Institutional Equities
Divis Laboratories
Financials Exhibit 4: Income statement Y/E March (Rsmn) FY14 FY15 FY16E FY17E FY18E Net sales (incl. other operating income) 25,187 30,959 37,832 45,398 54,478 % growth 18.9 22.9 22.2 20.0 20.0 Raw material costs (9,142) (12,132) (13,809) (16,797) (20,157) Staff costs (2,325) (2,904) (3,405) (4,086) (4,903) R&D expenses (254) (277) (378) (454) (545) Other expenses (3,076) (4,155) (5,675) (6,810) (8,172) Total expenditure (14,796) (19,468) (23,267) (28,147) (33,776) EBITDA 10,391 11,491 14,565 17,251 20,702 % growth 29.7 10.6 26.8 18.4 20.0 EBITDA margin (%) 41.3 37.1 38.5 38.0 38.0 Other income 469 619 709 827 1125 Interest costs (30) (29) (19) (19) (19) Gross profit 10,830 12,081 15,255 18,060 21,808 % growth 26.2 11.5 26.3 18.4 20.8 Depreciation (921) (1,360) (1,227) (1,597) (1,789) Profit before tax 9,909 10,721 14,029 16,463 20,019 % growth 26.8 8.2 30.9 17.4 21.6 Tax (2,176) (2,206) (3,086) (3,622) (4,404) Effective tax rate (%) 22.0 20.6 22.0 22.0 22.0 Net profit 7,733 8,515 10,943 12,841 15,615 % growth 28.5 10.1 28.5 17.4 21.6
Source: Company, Nirmal Bang Institutional Equities Research
Exhibit 6: Balance sheet Y/E March (Rsmn) FY14 FY15 FY16E FY17E FY18E Equity 265 265 265 265 265 Reserves 29,368 34,688 41,569 49,643 59,462 Net worth 29,634 34,954 41,834 49,909 59,728 Short-term loans 163 251 251 251 251 Long-term loans 21 16 16 16 16 Total loans 184 266 266 266 266 Deferred tax liability 1,150 1,262 1,262 1,262 1,262 Liabilities 30,968 36,482 43,363 51,437 61,256 Gross block 17,403 19,530 24,530 29,030 32,530 Depreciation 5,185 6,441 7,668 9,264 11,054 Net block 12,218 13,089 16,862 19,766 21,477 Capital work-in-progress 1,560 2,396 996 996 996 Long-term investments 5,019 7,330 8,830 10,330 14,830 Inventories 9,324 11,626 14,207 17,049 20,459 Debtors 7,237 7,416 9,063 10,875 13,051 Cash 405 652 620 697 175 Other current assets 1,342 1,541 1,863 2,217 2,642 Total current assets 18,308 21,236 25,754 30,838 36,327 Creditors 2,857 2,492 3,046 3,655 4,386 Other current liabilities 3,280 5,077 6,034 6,838 7,987 Total current liabilities 6,137 7,569 9,080 10,493 12,373 Net current assets 12,171 13,667 16,674 20,345 23,954 Total assets 30,968 36,482 43,363 51,437 61,256
Source: Company, Nirmal Bang Institutional Equities Research
Exhibit 5: Cash flow Y/E March (Rsmn) FY14 FY15 FY16E FY17E FY18E EBIT 9,470 10,131 13,339 15,655 18,913 (Inc.)/dec. in working capital (3,220) (1,338) (3,906) (4,300) (5,160) Cash flow from operations 6,249 8,793 9,433 11,355 13,753 Other income 469 619 709 827 1,125 Depreciation 921 1,360 1,227 1,597 1,789 Interest paid (-) (30) (29) (19) (19) (19) Tax paid (-) (2,176) (2,206) (3,086) (3,622) (4,404) Dividend (-) (2,329) (3,106) (3,195) (4,062) (4,767) Net cash from operations 3,105 5,431 5,068 6,076 7,479 Capital expenditure (-) (2,347) (2,963) (3,600) (4,500) (3,500) Net cash after capex 758 2,468 1,468 1,576 3,979 Inc./(dec.) in short-term borrowing (142) 87 - - - Inc./(dec.) in long-term borrowing (5) (5) - - - Inc./(dec.) in borrowings (146) 82 - - - (Inc.)/dec. in investments (941) (2,311) (1,500) (1,500) (4,500) Cash from financial activities (1,087) (2,229) (1,500) (1,500) (4,500) Others 325 8 Opening cash balance 409 405 652 620 697 Closing cash balance 405 652 620 697 175 Change in cash balance (4) 247 (32) 76 (521)
Source: Company, Nirmal Bang Institutional Equities Research
Exhibit 7: Key ratios Y/E March FY14 FY15 FY16E FY17E FY18E Per share (Rs) Reported EPS 29.1 32.1 41.2 48.4 58.8 Adjusted EPS 29.1 32.1 41.2 48.4 58.8 DPS 20.0 20.0 26.4 31.0 37.6 BV/share 111.6 131.7 157.6 188.0 225.0 Dividend payout (%) 40.2 37.5 37.1 37.1 37.1 Performance ratios RoE (%) 28.3 26.4 28.5 28.0 28.5 RoCE (%) 33.2 30.0 33.4 33.0 33.6 Valuation ratios P/E (x) 38.1 34.6 26.9 23.0 18.9 P/BV (x) 5.0 4.2 3.5 3.0 2.5 EV/net sales (x) 5.8 4.7 3.9 3.2 2.7 EV/EBITDA (x) 14.2 12.8 10.1 8.5 7.1 Efficiency ratios Fixed asset turnover (x) 1.3 1.4 1.5 1.5 1.6 Working capital/sales (x) 0.6 0.5 0.5 0.5 0.5 Receivable days 105 87 87 87 87 Inventory days 135 137 137 137 137 Payable days 41 29 29 29 29
Source: Company, Nirmal Bang Institutional Equities Research
18

Institutional Equities3Q
FY16
Res
ult U
pdate
Reuters: LKMC.BO; Bloomberg: LMW IN
Lakshmi Machine Works
Yet Another Quarter of Positive Surprise; Retain Buy Lakshmi Machine Works (LMW) posted 3QFY16 performance that was better than our expectations. We are positively surprised by revenue traction in all segments coupled with margin expansion. Strong revenue and margin performance was led by higher exports in 3QFY16. Exports witnessed a YoY growth of 12.4% in 9MFY16 to Rs3.89bn. However, exports in 1HFY16 were down 19% YoY to Rs1.88bn. 3QFY16 witnessed a bounce-back in exports with a 77% YoY growth to Rs2.01bn (31% of total net revenue) which resulted in YoY export growth turning positive in 9MFY16. Textile machinery division (TMD) registered an export growth of 17% YoY in 9MFY16 at Rs3.65bn and occupied a major share of 94% in total exports. In 3QFY16, total net revenue witnessed an increase of 14.7% YoY to Rs6,516mn, mainly on account of a 12.3% growth in TMD revenue which constituted 88% of revenue at Rs5,787mn. EBITDA registered a 27.8% surge with a 143bps YoY expansion in EBITDA margin to 14.1% (our estimate 12.7%). The YoY expansion in gross margin by 66bps to 40.4% (our estimate 39.4%) coupled with ~70bps YoY fall in other expenses as a percentage of revenue led to EBITDA margin expansion. The YoY decline of 31% in depreciation to Rs176.7mn (our estimate was an amount similar to a year ago – Rs256.1mn), a 427bps reduction in tax rate to 32.9% (our estimate – reduction of 418bps) resulted in a strong YoY growth of 41.8% in PAT to Rs634.9mn (our estimate – Rs445.5mn) along with a 186bps YoY expansion in PAT margin to 9.7% (our estimate- 7.6%). We have increased our revenue and PAT estimates for FY16 by 6% and 15%, respectively, to factor in the latest developments. However, by and large we have retained our FY17 revenue and PAT estimates. Market share, order book, exports and spare part sales: LMW maintained its domestic revenue market share at 60%-61% as of end-December 2015. LMW’s domestic order book (OB) stood at Rs25.8bn with a strong flow of export enquiries worth Rs2.7bn as of end-December2015. Project orders accounted for 65% of domestic order book and slow-moving orders have been reduced to 30% of order book. The company witnessed order inflow of Rs11bn in 9MFY16. Our estimate on order inflow stands revised upwards to Rs14.5bn for FY16. Total exports in 9MFY16 stood at Rs3.89bn against Rs3.46bn in the corresponding period a year ago and the current enquiry pipeline is to the extent of Rs2.67bn. LMW reported spare part sales amounting to Rs2.20bn in 9MFY16, which was in line with our annual estimate of Rs2.85bn. Retain Buy rating on LMW: We are positive on LMW on account of its strong financial health (debt-free status, positive free cash flow and huge cash on its books), strong management pedigree, market leadership status and export focus. LMW will continue to provide a high margin of safety and economic moat to investors. We expect LMW to cumulatively generate net operating cash flow of Rs10bn over FY16E-FY18E. We have rolled forward our valuation to FY18E EPS. We have retained Buy rating on LMW with a target price of Rs4,688, valuing the stock at 19x FY18E EPS of Rs247.
BUY Sector: Capital Goods CMP: Rs3,490 Target Price: Rs4,688 Upside: 34% Sameer Panke [email protected] +91-22-3926 8114
Key Data Current Shares O/S (mn) 11.3Mkt Cap (Rsbn/US$mn) 39.3/581.352 Wk H / L (Rs) 4,199/3,275Daily Vol. (3M NSE Avg.) 4,383 Price Performance (%)
1 M 6 M 1 Yr LMW (3.3) (11.7) (7.0) Nifty Index (3.8) (12.6) (14.0) Source: Bloomberg
Y/E March (Rsmn) 3QFY15 2QFY16 3QFY16 Chg. (YoY)% Chg. QoQ)% 9MFY15 9MFY16 Chg. (YoY)% Net sales 5,680 6,198 6,516 14.7 5.1 17,288 18,356 6.2 Raw materials consumed 3,420 3,890 3,884 13.6 (0.2) 10,574 11,116 5.1 % of sales 60.2 62.8 59.6 - - 61.2 60.6 - Employee costs 533 586 602 12.9 2.7 1,694 1,752 3.5 % of sales 9.4 9.5 9.2 - - 9.8 9.5 - Other expenditure 1,008 1,001 1,113 10.3 11.2 2,869 3,192 11.3 % of sales 17.8 16.1 17.1 - - 16.6 17.4 - EBITDA 719 721 918 27.8 27.3 2,151 2,296 6.7 EBITDA (%) 12.7 11.6 14.1 - - 12.4 12.5 - Other income 255 286 208 (18.2) (27.2) 786 735 (6.6) Exceptional items 2 2 1 (32.6) (26.2) 76 7 (90.9) Interest costs 2 1 2 (3.2) 94.2 6 4 (40.8) Depreciation 257 193 177 (31.1) (8.6) 731 602 (17.7) PBT 713 811 946 32.8 16.6 2,124 2,418 13.9 Total tax 265 247 311 17.5 26.3 722 780 8.0 Effective tax rate (%) 37.2 30.4 32.9 - - 34.0 32.3 - Net profit (+) / loss (-) 448 565 635 41.8 12.4 1,402 1,638 16.9 NPM (%) 7.9 9.1 9.7 - - 8.1 8.9 - Source: Company, Nirmal Bang Institutional Equities Research
8 February 2016
19
Institutional Equities
Lakshmi Machine Works
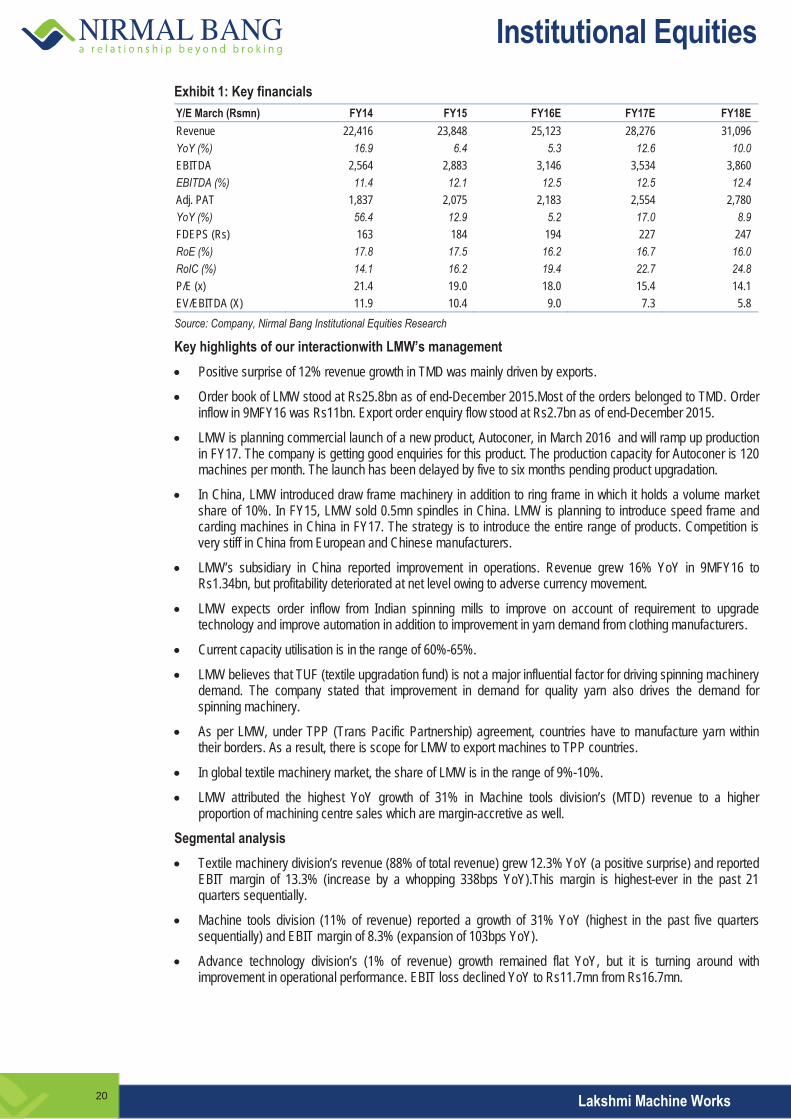
Exhibit 1: Key financials Y/E March (Rsmn) FY14 FY15 FY16E FY17E FY18E Revenue 22,416 23,848 25,123 28,276 31,096 YoY (%) 16.9 6.4 5.3 12.6 10.0 EBITDA 2,564 2,883 3,146 3,534 3,860 EBITDA (%) 11.4 12.1 12.5 12.5 12.4 Adj. PAT 1,837 2,075 2,183 2,554 2,780 YoY (%) 56.4 12.9 5.2 17.0 8.9 FDEPS (Rs) 163 184 194 227 247 RoE (%) 17.8 17.5 16.2 16.7 16.0 RoIC (%) 14.1 16.2 19.4 22.7 24.8 P/E (x) 21.4 19.0 18.0 15.4 14.1 EV/EBITDA (X) 11.9 10.4 9.0 7.3 5.8 Source: Company, Nirmal Bang Institutional Equities Research
Key highlights of our interactionwith LMW’s management Positive surprise of 12% revenue growth in TMD was mainly driven by exports.
Order book of LMW stood at Rs25.8bn as of end-December 2015.Most of the orders belonged to TMD. Order inflow in 9MFY16 was Rs11bn. Export order enquiry flow stood at Rs2.7bn as of end-December 2015.
LMW is planning commercial launch of a new product, Autoconer, in March 2016 and will ramp up production in FY17. The company is getting good enquiries for this product. The production capacity for Autoconer is 120 machines per month. The launch has been delayed by five to six months pending product upgradation.
In China, LMW introduced draw frame machinery in addition to ring frame in which it holds a volume market share of 10%. In FY15, LMW sold 0.5mn spindles in China. LMW is planning to introduce speed frame and carding machines in China in FY17. The strategy is to introduce the entire range of products. Competition is very stiff in China from European and Chinese manufacturers.
LMW’s subsidiary in China reported improvement in operations. Revenue grew 16% YoY in 9MFY16 to Rs1.34bn, but profitability deteriorated at net level owing to adverse currency movement.
LMW expects order inflow from Indian spinning mills to improve on account of requirement to upgrade technology and improve automation in addition to improvement in yarn demand from clothing manufacturers.
Current capacity utilisation is in the range of 60%-65%.
LMW believes that TUF (textile upgradation fund) is not a major influential factor for driving spinning machinery demand. The company stated that improvement in demand for quality yarn also drives the demand for spinning machinery.
As per LMW, under TPP (Trans Pacific Partnership) agreement, countries have to manufacture yarn within their borders. As a result, there is scope for LMW to export machines to TPP countries.
In global textile machinery market, the share of LMW is in the range of 9%-10%.
LMW attributed the highest YoY growth of 31% in Machine tools division’s (MTD) revenue to a higher proportion of machining centre sales which are margin-accretive as well.
Segmental analysis Textile machinery division’s revenue (88% of total revenue) grew 12.3% YoY (a positive surprise) and reported EBIT margin of 13.3% (increase by a whopping 338bps YoY).This margin is highest-ever in the past 21 quarters sequentially.
Machine tools division (11% of revenue) reported a growth of 31% YoY (highest in the past five quarters sequentially) and EBIT margin of 8.3% (expansion of 103bps YoY).
Advance technology division’s (1% of revenue) growth remained flat YoY, but it is turning around with improvement in operational performance. EBIT loss declined YoY to Rs11.7mn from Rs16.7mn.
20

Institutional Equities
Lakshmi Machine Works
Exhibit 2: Segment-wise snapshot Y/E March (Rsmn) 3QFY15 2QFY16 3QFY16 Chg.
(YoY)% Chg.
(QoQ)% 9MFY15 9MFY16 Chg. (YoY)%
Segment Revenue Textile machinery division (TMD) 5,154 5,590 5,787 12.3 3.5 15,603 16,446 5.4 Machine tools and foundry division (MTD) 562 680 739 31.4 8.6 1,837 1,977 7.6 Advance technology division (ATD) 59 47 58 (0.8) 25.0 134 177 31.5 Sub-total 5,775 6,316 6,584 14.0 4.2 17,574 18,600 5.8 Less : Inter-segmental revenue 39 52 46 19.9 (11.6) 103 132 28.7 Net sales/income from operations 5,736 6,264 6,538 14.0 4.4 17,472 18,468 5.7 Segment-wise profit from operations Textile machinery division (TMD) 512 591 770 50.5 30.2 1,532 1,796 17.2 Machine tools and foundry division (MTD) 41 67 61 50.2 (8.7) 154 171 11.4 Advance technology division (ATD) (17) (26) (12) - - (97) (50) - Total segmental profit 536 633 819 53.0 29.5 1,589 1,917 20.6 Add: Other non-allocable income net of non-allocable expenditure 177 179 127 (28.5) (29.1) 534 501 (6.2) Profit before tax 713 811 946 32.8 16.6 2,124 2,418 13.9 Capital employed Textile machinery division (TMD) 8,769 9,977 10,611 21.0 6.4 8,769 10,611 21.0 Machine tools and foundry division (MTD) 2,301 2,215 2,255 (2.0) 1.8 2,301 2,255 (2.0) Advance technology division (ATD) 41 66 73 77.5 10.7 41 73 77.5 Unallocated 1,336 1,350 1,303 (2.4) (3.5) 1,336 1,303 (2.4) Total capital employed 12,446 13,608 14,243 14.4 4.7 12,446 14,243 14.4 Segment-wise revenue share Textile machinery division (TMD) 89.2 88.5 87.9 - - 88.8 88.4 - Machine tools and foundry division (MTD) 9.7 10.8 11.2 - - 10.5 10.6 - Advance technology division (ATD) 1.1 0.7 0.9 - - 0.8 1.0 - Margin (%) EBIT margin - textile machinery division (TMD) 9.9 10.6 13.3 - - 9.8 10.9 - EBIT margin - machine tools and foundry division (MTD) 7.2 9.8 8.3 - - 8.4 8.7 - EBIT margin - advance technology division (ATD) (28.5) (54.9) (20.1) - - (71.9) (28.5) -
Source: Company, Nirmal Bang Institutional Equities Research Exhibit 3: Actual performance versus our estimates Y/E March (Rsmn) 3QFY15 2QFY16 3QFY16 Chg. (YoY)% Chg. QoQ)% 3QFY16E Devi (%) Revenue 5,680 6,198 6,516 14.7 5.1 5,855 11.3 EBITDA 719 721 918 27.8 27.3 744 23.5 EBITDA (%) 12.7 11.6 14.1 143bps 245bps 12.7 139bps Reported PAT 448 565 635 41.8 12.4 446 42.5
Source: Company, Bloomberg, Nirmal Bang Institutional Equities Research
Exhibit 4: Change in our earnings estimates Y/E March Old New Variation (%) (Rsmn) FY16E FY17E FY16E FY17E FY16E FY17E Revenue 23,672 28,245 25,123 28,276 6.1 0.1 EBITDA 2,792 3,539 3,146 3,534 12.7 (0.1) EBITDA (%) 11.8 12.5 12.5 12.5 73bps (3bps) Reported PAT 1,895 2,541 2,183 2,554 15.2 0.5
Source: Company, Bloomberg, Nirmal Bang Institutional Equities Research
21

Institutional Equities
Lakshmi Machine Works
Exhibit 5: P/E trend
Source: NSE, Nirmal Bang Institutional Equities Research
0
5
10
15
20
25
30
35
Feb-
05Au
g-05
Feb-
06Au
g-06
Feb-
07Au
g-07
Feb-
08Au
g-08
Feb-
09Au
g-09
Feb-
10Au
g-10
Feb-
11Au
g-11
Feb-
12Au
g-12
Feb-
13Au
g-13
Feb-
14Au
g-14
Feb-
15Au
g-15
Feb-
16
(x)
0
1,000
2,000
3,000
4,000
5,000
6,000
7,000
Feb-
05Au
g-05
Feb-
06Au
g-06
Feb-
07Au
g-07
Feb-
08Au
g-08
Feb-
09Au
g-09
Feb-
10Au
g-10
Feb-
11Au
g-11
Feb-
12Au
g-12
Feb-
13Au
g-13
Feb-
14Au
g-14
Feb-
15Au
g-15
Feb-
16
Stock price 10x 15x 20x 25x 30x
(Rs)
22

Institutional Equities
Lakshmi Machine Works
Financials Exhibit 6: Income statement Y/E March (Rsmn) FY14 FY15 FY16E FY17E FY18E Net revenue from segments 21,652 23,126 24,580 27,667 30,415 Other operating income 764 722 543 610 681 Revenue from operations 22,416 23,848 25,123 28,276 31,096 Other income 1,155 1,063 929 1,158 1,218 Total revenue 23,571 24,912 26,052 29,435 32,314 Cost of raw material consumed 14,216 14,761 15,365 17,260 19,054 Change in inventories (270) (93) (119) (67) (176) Employee benefits expenses 2,269 2,277 2,441 2,901 3,109 Other expenses 3,637 4,020 4,290 4,649 5,249 Total expenses 19,853 20,965 21,977 24,742 27,236 EBITDA (incl. OI) 3,719 3,946 4,075 4,692 5,078 EBITDA (excl. OI) 2,564 2,883 3,146 3,534 3,860 Depreciation 1,025 965 901 1,006 1,090 EBIT (excl.OI) 1,539 1,918 2,246 2,528 2,770 Financial charges and interest
t6 6 10 13 19
PBT (before exceptional items) 2,688 2,975 3,164 3,673 3,969 Exceptional item - VRS 82 95 10 10 10 PBT 2,606 2,880 3,154 3,663 3,959 Total tax 769 805 971 1,110 1,179 Current tax 879 991 1,049 1,218 1,316 Deferred tax (net) (103) (121) (75) (103) (132) Prior-year tax (8) (65) (3) (6) (5) Profit after tax 1,837 2,075 2,183 2,554 2,780
Source: Company, Nirmal Bang Institutional Equities Research
Exhibit 8: Balance sheet Y/E March (Rsmn) FY14 FY15 FY16E FY17E FY18E Share capital 113 113 113 113 113 Reserves and surplus 10,932 12,492 14,166 16,177 18,414 Networth 11,044 12,605 14,279 16,290 18,527 Non-current liabilities 2,258 1,345 1,201 1,323 1,337 Deferred tax liabilities (net) 26 - - - - Other long-term liabilities 2,232 1,345 1,201 1,323 1,337 Current liabilities 6,924 7,769 6,625 7,379 8,276 Trade payables 2,921 3,092 3,157 3,594 3,967 Other current liabilities 3,539 4,074 2,898 3,179 3,702 Short-term provisions 463 603 570 605 607 Total liabilities 20,226 21,719 22,105 24,992 28,141 Total gross block 16,775 17,486 17,836 18,166 18,496 Accumulated depreciation 12,946 13,745 14,645 15,651 16,741 Net fixed assets 3,829 3,741 3,190 2,514 1,755 Capital work in progress 27 31 15 15 15 Non-current investments 1,288 1,288 1,288 1,288 1,288 Deferred tax assets - 97 97 97 97 Long-term loans and advances 224 236 257 251 194 Current assets 14,857 16,324 17,257 20,826 24,792 Inventories 2,806 2,887 3,008 3,228 3,537 Trade receivables 1,828 2,206 2,271 2,479 2,726 Cash and carry equivalents 8,794 9,416 11,028 13,559 17,001 Short-term loans and advances 928 1,386 588 1,068 1,023 Other current assets 502 430 361 491 504 Total assets 20,226 21,719 22,105 24,992 28,141
Source: Company, Nirmal Bang Institutional Equities Research
Exhibit 7: Cash flow Y/E March (Rsmn) FY14 FY15 FY16E FY17E FY18E EBIT (excl. OI) 1,539 1,917.9 2,246 2,528 2,770 Exceptional item (-) (82) (94.9) (10) (10) (10) (Inc.)/dec. in working capital (464) (284) 374 Cash flow from operations 1,107 1,823.6 1,771 2,234 3,134 Other income 1,155 1,063.3 929 1,158 1,218 Depreciation 1,025 965.0 901 1,006 1,090 Tax paid (-) (769) (805.5) (971) (1,110) (1,179) Inc/(dec.) other long-term liabilities - (886.9) (144) 123 14 Long-term assets (-) - (12.6) (20) 6 57 Net cash from operations 2,517 2,146.9 2,465 3,417 4,333 Capital expenditure (-) (60) (714.3) (334) (330) (330) Net cash after capex 2,457 1,432.6 2,131 3,087 4,003 Interest paid (-) (6) (6.3) (10) (13) (19) Dividends paid (-) (395) (508.5) (509) (543) (543) (Inc.)/dec. in investments (250) 0.0 - - - Cash from financial activities (651) (514.9) (519) (556) (562) Others (509) (295.5) - - - Opening cash balance 7,497 8,793.9 9,416 11,028 13,559 Closing cash balance 8,794 9,416.2 11,028 13,559 17,001 Change in cash balance 1,297 622.3 1,612 2,531 3,442
Source: Company, Nirmal Bang Institutional Equities Research
Exhibit 9: Key ratios Y/E March FY14 FY15 FY16E FY17E FY18E Per share (Rs) EPS 163.0 184.1 193.8 226.7 246.8 CEPS (Rs.) 254.0 269.8 273.7 316.0 343.5 BV 980.3 1118.8 1267.4 1445.9 1644.4 DPS 30.0 37.5 37.5 40.0 40.0 Dividend payout (%) 18.4 20.4 19.4 17.6 16.2 Valuation (x) P/E (x) 21.4 19.0 18.0 15.4 14.1 P/BV (x) 3.6 3.1 2.8 2.4 2.1 EV/EBDITA (x) 11.9 10.4 9.0 7.3 5.8 M.cap/ sales (x) 1.8 1.6 1.6 1.4 1.3 EV/sales (x) 1.4 1.3 1.1 0.9 0.7 Return ratios (%) RoANW 17.8 17.5 16.2 16.7 16.0 RoACE 8.1 9.1 10.3 10.8 10.5 RoAIC 14.1 16.2 19.4 22.7 24.8 Margins (%) EBITDA margin (excl. O.I.) 11.4 12.1 12.5 12.5 12.4 EBITDA margin (incl. O.I.) 16.6 16.5 16.2 16.6 16.3 EBIT margin 6.9 8.0 8.9 8.9 8.9 Tax/PBT 29.5 28.0 30.8 30.3 29.8 Net profit margin 8.2 8.7 8.7 9.0 8.9 Expense ratios (% of revenue) Cost of raw materials consumed 62 62 61 61 61 Employee benefit expenses 10 10 10 10 10 Total expenses 89 88 87 88 88 Turnover and working capital ratios Debtors period (days) 30 34 33 32 32 Inventory period (days) 57 56 56 53 53 Creditor period (days) 75 76 75 76 76 Cash conversion cycle (days) 12 13 14 9 9 Fixed asset turnover (x) 1.3 1.4 1.4 1.6 1.7 Working capital turnover (x) 3.2 2.9 2.6 2.3 2.1 Non-cash working capital (Rsmn) (860.2) (860.8) (396.3) (112.0) (485.8)
Source: Company, Nirmal Bang Institutional Equities Research
23

Institutional Equities
Lakshmi Machine Works
Rating track Date Rating Market price (Rs) Target price (Rs) 6 February 2015 Buy 3,793 4,725 22 May 2015 Buy 3,676 4,725 11 August 2015 Buy 3,657 4,725 6 October 2015 Buy 3,644 4,725 4 November 2015 Buy 3,701 4,725 5 February 2016 Buy 3,490 4,688
24

Institutional Equities3Q
FY16
Res
ult U
pdate
Reuters: LUPN.BO; Bloomberg: LPC IN
Lupin 8 February 2016
Performance Beats Expectations Led By Growth In US Market Lupin reported a better-than-expected performance for 3QFY16, with reported revenue of Rs35.6bn (up 12%/7% YoY/QoQ, respectively) being 8%/6% above our /Bloomberg consensus estimate, respectively, led by the US business which reported revenues of Rs14bn, up 22% QoQ, following improvement in base business portfolio, increased contribution from Suprax and Antara, price hikes and the flu season. Reported EBITDA of Rs8.8bn, up 31% QoQ, was 26%/11% above our/Bloomberg consensus estimate, respectively, and EBITDA margin at 24.7% rebounding from its low of 20.0% reported in 2QFY16, which was the lowest in the past 13 quarters, was up 350bps/110bps compared to our/Bloomberg consensus estimate, respectively. Consequently, reported PAT of Rs5.3bn, (up 30% QoQ), was 23%/5% above our/Bloomberg consensus estimate, respectively. Given the slow pace of product approvals, no material product launches and competition in existing products, the earnings were muted in 1HFY16, but with improvement in base business, likely approval and launches of key products in the near term and with a strong US product pipeline spanning across niche therapies, we believe Lupin is building a strong platform for sustainable growth. Improvement in the US business leads earnings to beat expectations: Lupin’s reported revenues of Rs35.6bn (up 12%/7% YoY/QoQ, respectively) were 8%/6% above our/Bloomberg consensus estimate, respectively, led by the US business which reported revenues of Rs14bn, flat YoY but up 22% QoQ on account of improvement in base business portfolio, increased contribution from Suprax and Antara during the quarter, price hikes and the flu season. In US dollar terms, reported revenue stood at US$208mn, up 19.5% QoQ compared to US$174mn in 2QFY16. Although the US revenues were down US$9mn YoY in absolute terms, in Indian rupee or INR terms they remained flat YoY led by gains from a depreciating INR against the US dollar. Following higher US sales, gross margin improved 60bps/240bps YoY/QoQ, respectively, and partly because of foreign exchange gains. Reported EBITDA of Rs8.8bn, up 31% QoQ, was 26%/11% above our/Bloomberg consensus estimate, respectively, and EBITDA margin of 24.7% - rebounding from its low of 20.0% reported in 2QFY16 - lowest in the past 13 quarters, was 350bps/110bps up compared to our/Bloomberg consensus estimates, respectively. EBITDA improved because of higher US sales despite higher staff costs (up 27%/1% YoY/QoQ, respectively) on account of increased hiring and increments, research and development expenses (up 50% YoY at 11.0% of revenue compared to 11.7% in 2QFY16 and 8.2% in 3QFY15) and higher other expenses (up 7%/5% YoY/QoQ, respectively) including Rs250mn of foreign exchange gains. Domestic business remains muted, Japan grows, while other markets decline: Domestic business revenue stood at Rs8.7bn for the quarter which was muted QoQ (up 17% YoY). Japanese business grew 9%/16% YoY/QoQ, respectively (in constant currency terms, it was up 9%/13% YoY/QoQ, respectively). RoW market was down 15% QoQ, while it was up 11% YoY impacted by adverse currency movement. South Africa market, in constant currency terms, posted a growth of 17%/13% YoY/QoQ. API business remained flat YoY, while it was down 14% QoQ. Reported PAT of Rs5.3bn was 23%/5% above our/Bloomberg consensus estimate, respectively, despite a higher tax rate for the quarter which stood at 35.4% (the management attributed it to unsold inventory pertaining to transfer of products from India to other countries) versus 31% in 2QFY16 and 28% in 3QFY15.
UNDER REVIEW Sector: Pharmaceuticals CMP: Rs1,802 Sumit Singhania [email protected] +91-22-3926 8111
Key Data Current Shares O/S (mn) 450.5 Mkt Cap (Rsbn/US$bn) 817.8/12.1 52 Wk H / L (Rs) 2,129/1,540 Daily Vol. (3M NSE Avg.) 846,655 Price Performance (%)
1 M 6 M 1 Yr Lupin 1.8 8.0 15.0 Nifty Index (3.8) (12.6) (14.0) Source: Bloomberg
Y/E March (Rsmn) 3QFY15 1QFY16 3QFY16 YoY (%) QoQ (%) 9MFY15 9MFY16 YoY (%) Net revenue 31,776 33,213 35,558 11.9 7.1 96,919 1,00,273 3.5 Total raw material costs 10,236 11,294 11,230 9.7 (0.6) 32,007 32,357 1.1 % of net revenue 32.2 34.0 31.6 - - 33.0 32.3 - Staff costs 4,159 5,242 5,284 27.0 0.8 12,652 15,386 21.6 % of net revenue 13.1 15.8 14.9 - - 13.1 15.3 - R&D costs 2,605 3,878 3,916 50.3 1.0 7,892 10,925 38.4 % of net revenue 8.2 11.7 11.0 - - 8.1 10.9 - Other expenses 5,948 6,078 6,357 6.9 4.6 16,067 17,946 11.7 % of net revenue 18.7 18.3 17.9 - - 16.6 17.9 - EBITDA 8,829 6,721 8,772 (0.7) 30.5 28,302 23,659 (16.4) EBITDA margin (%) 27.8 20.2 24.7 (312)bps 443bps 29.2 23.6 560bps Other income 834 415 653 (21.7) 57.4 2,226 1,824 (18.0) Interest costs 27 102 92 246.4 (9.6) 74 217 195.8 Depreciation 1,103 1,068 1,114 1.0 4.3 3,275 3,189 (2.6) PBT 8,534 5,967 8,219 (3.7) 37.8 27,179 22,077 (18.8) Tax 2,387 1,851 2,909 21.9 57.1 8,342 7,404 (11.2) Tax rate (%) 28.0 31.0 35.4 - - 30.7 33.5 - Minority interest 133 27 13 (90.6) (53.2) 275 36 (86.8) Reported PAT 6,015 4,088 5,298 (11.9) 29.6 18,562 14,636 (21.2)
Source: Company, Nirmal Bang Institutional Equities Research
25

Institutional Equities
Lupin
Other conference-call highlights The tax rate for FY16 is seen around 30%-31%.
Lupin filed 5 ANDAs (abbreviated new drug applications) and received approvals for 9 ANDAs during the quarter from the US Food and Drug Administration or USFDA. Cumulative filings stood at 225, with cumulative approvals for 133 ANDAs.
The company launched 4 products in the US during the quarter. It launched 8 products in the US in 1HFY16, taking the total launches to 12 products in 9MFY16.
Other operating income for the quarter was higher at Rs1.98bn as it included export incentive to the tune of Rs1bn and some amount was received in lieu of contracts. Going forward, the management expects this run-rate to continue.
Of the US$208mn of US revenues for the quarter, branded business comprises US$15mn, posting a 56% growth QoQ.
12 USFDA inspections took place in all, of which 9 were successful and in the balance 3 the company received Form 483 observations. Goa plant received 9 observations, Indore plant received 3 observations but successfully cleared these observations, and the Aurangabad plant received 3 observations.
The company got approvals for products from Goa facility after getting Form 483 from the USFDA.
Gavis acquisition is expected to be closed this month and its numbers for only one month may be consolidated in FY16, or else they will be consolidated in FY17.
Exhibit 1: Financial summary Y/E March (Rsmn) FY14 FY15 FY16E FY17E FY18E Net sales 112,866 127,700 142,837 173,377 197,748 YoY (%) 17.1 13.1 11.9 21.4 14.1 EBITDA 30,028 33,100 33,536 44,704 51,418 EBITDA margin (%) 26.6 25.9 23.5 25.8 26.0 Net profit 18,364 20,936 21,142 29,103 33,623 YoY (%) 39.7 14.0 1.0 37.7 15.5 EPS 41.0 46.6 47.0 64.7 74.8 RoE (%) 30.3 26.5 21.7 24.8 23.6 RoCE (%) 38.1 33.1 23.8 25.7 27.7 P/E (x) 44.0 38.7 38.3 27.8 24.1 EV/EBITDA (x) 27.2 24.4 24.2 18.9 16.3
Source: Company, Nirmal Bang Institutional Equities Research Exhibit 2: Revenue break-up (Rsmn) 3QFY15 1QFY16 3QFY16 YoY (%) QoQ (%) 9MFY15 9MFY16 YoY (%) US 14,043 11,550 14,049 - 21.6 42,814 37,505 (12.4) Europe 805 1,158 1,010 25.5 (12.8) 2,371 3,024 27.5 Domestic formulations 7,438 8,738 8,712 17.1 (0.3) 23,043 26,301 14.1 Japan 3,422 3,234 3,739 9.3 15.6 10,296 10,204 (0.9) RoW markets 2,983 3,884 3,307 10.9 (14.9) 8,067 9,833 21.9 API 2,758 3,219 2,760 0.1 (14.3) 8,866 9,236 4.2 Total 31,449 31,783 33,577 6.8 5.6 95,457 96,103 0.7
Source: Company, Nirmal Bang Institutional Equities Research Exhibit 3: Actual performance versus our estimates, Bloomberg estimates (Rsmn) Actual NBIE estimate Variation (%) BBG cons. est. Variation (%) Revenue 35,558 32,798 8.4 33,478 6.2 EBITDA 8,772 6,953 26.2 7,910 10.9 EBITDA margin (%) 24.7 21.2 350bps 23.6 110bps Reported PAT 5,298 4,300 23.2 5,053 4.8
Source: Bloomberg, Nirmal Bang Institutional Equities Research
26
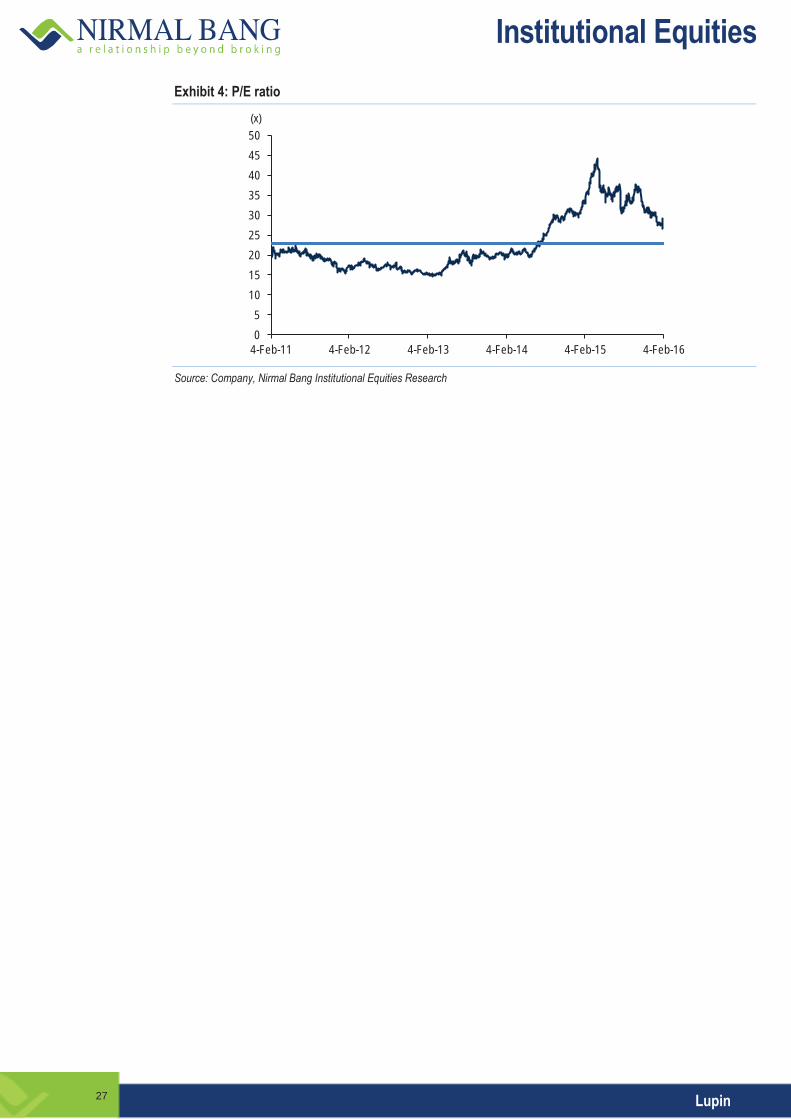
Institutional Equities
Lupin
Exhibit 4: P/E ratio
Source: Company, Nirmal Bang Institutional Equities Research
05
101520253035404550
4-Feb-11 4-Feb-12 4-Feb-13 4-Feb-14 4-Feb-15 4-Feb-16
(x)
27

Institutional Equities
Lupin
Financials
Exhibit 5: Income statement Y/E March (Rsmn) FY14 FY15 FY16E FY17E FY18E Net sales (incl. other oper. income) 112,866 127,700 142,837 173,377 197,748 % growth 17.1 13.1 11.9 21.4 14.1 Raw material costs (38,174) (41,570) (51,063) (58,642) (66,689) Staff costs (14,647) (17,473) (18,907) (23,287) (26,482)
Research & development exp. (9,294) - (10,351) (12,748) (14,498) Other expenses (20,723) (35,556) (28,981) (33,995) (38,660) Total expenditure (82,838) (94,600) (109,302) (128,673) (146,329) EBITDA 30,028 33,100 33,536 44,704 51,418 % growth 32.3 10.2 1.3 33.3 15.0 EBITDA margin (%) 26.6 25.9 23.5 25.8 26.0 Other income 1165 2398 2070 1870 1160 Interest costs (267) (98) (402) (908) (369) Gross profit 30,926 35,399 35,203 45,666 52,209 % growth 37.0 14.5 -0.6 29.7 14.3 Depreciation (2,610) (4,347) (4,695) (5,117) (5,684) Profit before tax 28,317 31,052 30,508 40,548 46,525 % growth 47.1 9.7 -1.8 32.9 14.7 Tax (9,622) (9,704) (9,153) (11,151) (12,562) Effective tax rate (%) 34.0 31.3 30.0 27.5 27.0 Minority interest (331) (412) (214) (294) (340) Net profit 18,364 20,936 21,142 29,103 33,623 % growth 39.7 14.0 1.0 37.7 15.5
Source: Company, Nirmal Bang Institutional Equities Research
Exhibit 7: Balance sheet Y/E March (Rsmn) FY14 FY15 FY16E FY17E FY18EEquity 897 899 899 899 899Reserves 68,419 87,842 104,817 128,183 155,179Net worth 69,316 88,741 105,716 129,082 156,078Total loans 6,461 5,310 40,247 30,271 12,298Deferred tax liability 1,779 1,182 1,182 1,182 1,182Minority interest 670 241 241 241 241Liabilities 78,225 95,474 147,385 160,776 169,800Gross block 46,260 50,530 72,230 81,230 90,230Depreciation 19,283 23,329 28,024 33,141 38,826Net block 33,556 43,682 103,867 107,749 111,065Capital work-in-progress 3,041 5,760 5,760 5,760 5,760Long-term investments 1,785 16,584 - - -Inventories 21,295 25,036 28,358 34,927 39,720Debtors 24,641 26,566 31,004 38,187 43,427Cash 7,975 4,814 4,892 3,040 833
Other current assets 9,060 8,095 11,343 13,971 15,888Total current assets 62,970 64,510 75,597 90,124 99,867Creditors 13,703 16,799 19,465 22,914 26,059Other current liabilities 9,425 18,263 18,373 19,942 20,833Total current liabilities 23,128 35,062 37,838 42,857 46,892Net current assets 39,843 29,448 37,759 47,267 52,975Total assets 78,225 95,474 147,385 160,776 169,800
Source: Company, Nirmal Bang Institutional Equities Research
Exhibit 6: Cash flow Y/E March (Rsmn) FY14 FY15 FY16E FY17E FY18E EBIT 27,418 28,753 28,841 39,587 45,734 (Inc.)/dec. in working capital (3,458) 4,838 (8,343) (12,930) (8,806) Cash flow from operations 23,960 33,591 20,498 26,657 36,928 Other income 1,165 2,398 2,070 1,870 1,160 Depreciation 2,610 4,347 4,695 5,117 5,684 Interest paid (-) (267) (98) (402) (908) (369) Tax paid (-) (9,622) (9,704) (9,153) (11,151) (12,562) Dividends paid (-) (2,182) (1,574) (4,057) (4,167) (5,737) Minority Interest (331) (412) (214) (294) (340) Net cash from operations 15,333 28,548 13,437 17,124 24,766 Capital expenditure (-) (5,931) (16,890) (64,880) (9,000) (9,000) Net cash after capex 9,402 11,658 (51,443) 8,124 15,766 Inc./(dec.) in long-term borrowing (5,109) (1,152) 34,936 (9,976) (17,973) Inc./(dec.) in borrowings (5,109) (1,152) 34,936 (9,976) (17,973) (Inc.)/dec. in investments (1,764) (14,799) 16,584 - - Equity issue/(buyback) 255 413 - - - Cash from financial activities (6,617) (15,538) 51,520 (9,976) (17,973) Others 842 - - - - Opening cash balance 4,349 7,975 4,814 4,892 3,040 Closing cash balance 7,975 4,814 4,892 3,040 833 Change in cash balance 3,626 (3,162) 78 (1,852) (2,207)
Source: Company, Nirmal Bang Institutional Equities Research Exhibit 8: Key ratios Y/E March FY14 FY15 FY16E FY17E FY18E Per share (Rs) Reported EPS 41.0 46.6 47.0 64.7 74.8 Adjusted EPS 41.0 46.6 47.0 64.7 74.8 DPS 5.0 7.9 7.9 10.9 12.6 BV/share 154.6 197.4 235.2 287.2 347.2 Dividend payout (%) 14.2 19.7 19.7 19.7 19.7 Performance ratios (%) RoE 30.3 26.5 21.7 24.8 23.6 RoCE 38.1 33.1 23.8 25.7 27.7 Valuation ratios (x) P/E 44.0 38.7 38.3 27.8 24.1 P/BV 11.7 9.1 7.7 6.3 5.2 EV/net sales 7.1 6.3 5.9 4.8 4.2 EV/EBITDA 27.2 24.4 24.2 18.9 16.3 Efficiency ratios Asset turnover (x) 2.3 2.2 1.7 1.5 1.6 Working capital/sales (x) 0.3 0.2 0.3 0.3 0.3 Receivable days 81 77 82 82 82 Inventory days 70 73 75 75 75 Payable days 60 65 65 65 65
Source: Company, Nirmal Bang Institutional Equities Research
28

Institutional Equities2Q
FY16
Res
ult U
pdate
Reuters: PROC.BO; Bloomberg: PG IN
P&G Hygiene and Healthcare
Strong Margins, Remarkable Balance Sheet Improvement Net sales of P&G Hygiene and Healthcare or P&GHH grew 10.7% YoY to Rs7.1bn in 2QFY16, 2.5% above expectations, led by double-digit growth in feminine hygiene and healthcare segments. Strong gross margin improvement of 250bps YoY (2QFY16 witnessed highest gross margin in 2Q in five years), and decline in A&P spending and other expenses (at least part of the reason is likely to be one-offs, but not disclosed) along with better-than-expected sales led to a 24-quarter high EBITDA margin of 30.3%, resulting in 68.4% YoY growth in EBITDA to Rs2.2bn and PAT growth of 61.8% YoY to Rs1.5bn. Negative net working capital increased 34% YoY and other assets declined 33% YoY mainly led by a steep fall in inter-group lending. Following likely one-offs, which aided margins during the quarter, we have assumed a slight dip in operating margin for the next two years over FY16E level. Changes to our model resulted in a 10.6% increase in FY16 EPS estimate and a 2.3% decline in FY17 EPS estimate. We have rolled forward our valuation to FY18E EPS and valued the stock at 38x (discount to 3-year/5 year average P/E of 45x/40x) to arrive at a target price of Rs6,503 (Rs6,284 earlier), 18% upside, and upgraded our rating on it to Buy from Accumulate earlier. We remain a strong believers in structural revenue growth story of P&GHH led by low market penetration in feminine hygiene segment (accounting for two-thirds of its sales) of around 15% and barriers to entry in the form of rising distribution reach which will benefit both key segments - feminine hygiene and healthcare- phenomenal category development efforts and widest product portfolio compared to peers. Net sales better than expectations: Net sales in 2QFY16 (June year-end) rose 10.7% YoY to Rs7,137mn. Sales were 2.5% above expectations of Rs6,961mn. Feminine hygiene as well as healthcare segment reportedly grew in double-digits. Thus, after a blip in the previous quarter or 1QFY16, when healthcare segment declined, it is now back to double-digit growth level. Strong performance on margin front: Gross margin grew 250bps YoY and 70bps sequentially. While this was below our expectation of a 314bps YoY improvement, 2QFY16 gross margin was the highest reported for a comparable quarter since the price cuts a few years ago. Employee costs grew 25% YoY to Rs284mn (4% of sales for the quarter). This was 11.7% above our estimate. On the other hand, A&P as well as other expenses (including royalty) declined on an absolute basis YoY by 10.7% and 16.7%, respectively, and by 264bps/565bps YoY, respectively, as a percentage of sales. The company has not shared details on one-offs. We believe that at least some component of the absolute decline in both these expenses may be because of one-offs. EBITDA margin grew by over 1,037bps YoY to 30.3%, the highest EBITDA margin reported by the company in 24 quarters. Absolute EBITDA reported a spectacular growth of 68.4% YoY to Rs2,161 mn, 43% above our estimate. PAT also grew sharply by 61.8% YoY to Rs1,467mn, 37.5% above expectations. Balance sheet improves: As a result of a 10% YoY decline in absolute inventory level and a 21% YoY increase in creditors, negative net working capital increased 34% YoY. There was an improvement in negative working capital over June 2015 level as well. Another encouraging aspect about the results was the decline in total other assets by 33% YoY and by 41% over June 2015 levels. The improvement came in from sharp declines, both in long-term and short-term advances, which indicates that inter-group lending declined significantly. Cash balance grew from Rs 4.25bn at the end of December 2014 and Rs6.2bn at the end of June 2015 to Rs10bn at the end of December 2015.
BUY Sector: FMCG CMP: Rs5,500 Target Price: Rs6,503 Upside: 18% Krishnan [email protected] +91-22-3926 8033 Aditya Joshi [email protected] +91-22-3926 8028
Key Data Current Shares O/S (mn) 32.5 Mkt Cap (Rsbn/US$bn) 179.3/2.7 52 Wk H / L (Rs) 7,449/5,171 Daily Vol. (3M NSE Avg.) 13,761 Price Performance (%)
1 M 6 M 1 Yr P&G Hygiene 0.0 (14.4) (11.7) Nifty Index (3.8) (12.6) (14.0) Source: Bloomberg
Y/E June (Rsmn) 2QFY15 1QFY16 2QFY16 Chg (YoY)% Chg. (QoQ)% 1HFY15 1HFY16 Chg. (%) Net sales 6,445 5,986 7,137 10.7 19.2 12,210 13,123 7.5 Net RM costs & purchase of finished goods 2,587 2,291 2,683 3.7 17.1 4,991 4,974 (0.3) % of sales 40.1 38.3 37.6 - - 40.9 37.9 - Advertising & promotion expenses 879 877 784 (10.7) (10.6) 1,927 1,661 (13.8) % of sales 13.6 14.7 11.0 - - 15.8 12.7 - Staff costs 227 336 284 25.1 (15.4) 559 621 11.0 % of sales 3.5 5.6 4.0 - - 4.6 4.7 - Other expenses 1,470 1,514 1,225 (16.7) (19.1) 2,660 2,738 2.9 % of sales 22.8 25.3 17.2 - - 21.8 20.9 - Operating profit 1,283 968 2,161 68.4 123.2 2,073 3,128 50.9 OPM (%) 19.9 16.2 30.3 1,037bps 1,410bps 17.0 23.8 680 bps Interest costs 5 12 23 - - 16 35 113.0 Depreciation 159 127 142 - - 270 269 (0.4) Other income 171 212 206 20.6 (2.9) 381 418 9.7 PBT 1,290 1,041 2,202 70.6 111.4 2,167 3,243 49.6 Provision for tax 384 344 735 91.5 113.8 646 1,078 67.0 Effective tax rate (%) 29.7 33.0 33.4 - - 29.8 33.2 - Reported PAT 907 698 1,467 61.8 110.2 1,522 2,165 42.3 Adjusted PAT 907 698 1,467 61.8 110.2 1,522 2,165 42.3 NPM (%) 14.1 11.7 20.6 - - 12.5 16.5 - EPS (Rs) 27.9 21.5 45.2 - - 46.9 66.7 -
Source: Company, Nirmal Bang Institutional Equities Research
8 February 2016
29
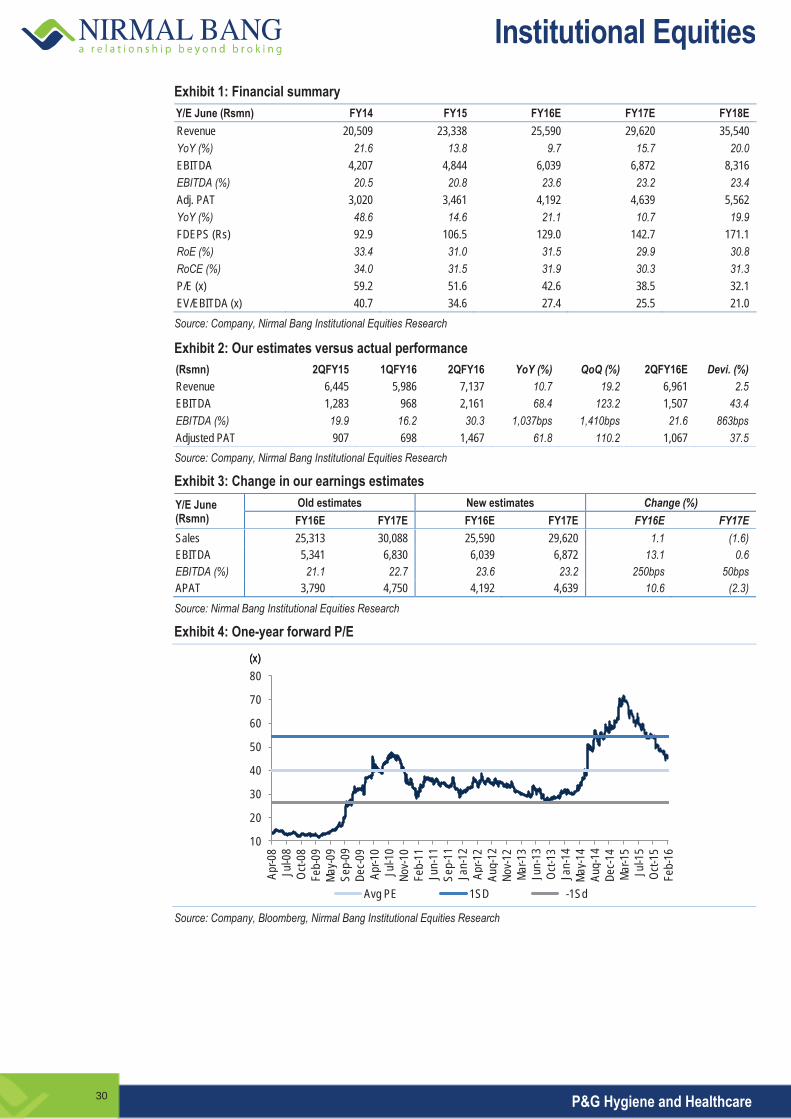
Institutional Equities
P&G Hygiene and Healthcare
Exhibit 1: Financial summary Y/E June (Rsmn) FY14 FY15 FY16E FY17E FY18E Revenue 20,509 23,338 25,590 29,620 35,540 YoY (%) 21.6 13.8 9.7 15.7 20.0 EBITDA 4,207 4,844 6,039 6,872 8,316 EBITDA (%) 20.5 20.8 23.6 23.2 23.4 Adj. PAT 3,020 3,461 4,192 4,639 5,562 YoY (%) 48.6 14.6 21.1 10.7 19.9 FDEPS (Rs) 92.9 106.5 129.0 142.7 171.1 RoE (%) 33.4 31.0 31.5 29.9 30.8 RoCE (%) 34.0 31.5 31.9 30.3 31.3 P/E (x) 59.2 51.6 42.6 38.5 32.1 EV/EBITDA (x) 40.7 34.6 27.4 25.5 21.0 Source: Company, Nirmal Bang Institutional Equities Research
Exhibit 2: Our estimates versus actual performance (Rsmn) 2QFY15 1QFY16 2QFY16 YoY (%) QoQ (%) 2QFY16E Devi. (%) Revenue 6,445 5,986 7,137 10.7 19.2 6,961 2.5 EBITDA 1,283 968 2,161 68.4 123.2 1,507 43.4 EBITDA (%) 19.9 16.2 30.3 1,037bps 1,410bps 21.6 863bps Adjusted PAT 907 698 1,467 61.8 110.2 1,067 37.5 Source: Company, Nirmal Bang Institutional Equities Research
Exhibit 3: Change in our earnings estimates Y/E June (Rsmn)
Old estimates New estimates Change (%) FY16E FY17E FY16E FY17E FY16E FY17E
Sales 25,313 30,088 25,590 29,620 1.1 (1.6) EBITDA 5,341 6,830 6,039 6,872 13.1 0.6 EBITDA (%) 21.1 22.7 23.6 23.2 250bps 50bps APAT 3,790 4,750 4,192 4,639 10.6 (2.3) Source: Nirmal Bang Institutional Equities Research
Exhibit 4: One-year forward P/E
Source: Company, Bloomberg, Nirmal Bang Institutional Equities Research
10
20
30
40
50
60
70
80
Apr-0
8Ju
l-08
Oct-0
8Fe
b-09
May-0
9Se
p-09
Dec-0
9Ap
r-10
Jul-1
0No
v-10
Feb-
11Ju
n-11
Sep-
11Ja
n-12
Apr-1
2Au
g-12
Nov-1
2Ma
r-13
Jun-
13Oc
t-13
Jan-
14Ma
y-14
Aug-
14De
c-14
Mar-1
5Ju
l-15
Oct-1
5Fe
b-16
Avg PE 1SD -1Sd
(x)(x)
30

Institutional Equities
P&G Hygiene and Healthcare
Financials Exhibit 5: Income statement Y/E June (Rsmn) FY14 FY15 FY16E FY17E FY18E Net sales 20,509 23,338 25,590 29,620 35,540 % growth 21.6 13.8 9.7 15.7 20.0 Raw material costs 8,128 9,209 9,571 11,019 13,186 Staff costs 950 1,133 1,305 1,333 1,635 Advt. expenses 3,029 3,327 3,351 4,266 5,148 Royalty 955 1,114 1,222 1,414 1,697 Other expenses 3,241 3,710 4,103 4,716 5,559 Total expenses 16,303 18,494 19,551 22,748 27,224 EBITDA 4,207 4,844 6,039 6,872 8,316 % growth 67.9 15.1 24.7 13.8 21.0 EBITDA margin (%) 20.5 20.8 23.6 23.2 23.4 Other income 802 746 810 822 937 Depreciation 352 525 622 744 866 Profit before tax 4,603 5,008 6,165 6,873 8,301 % growth 60.8 8.8 23.1 11.5 20.8 Tax 1,583 1,547 1,973 2,234 2,739 Effective tax rate (%) 34.4 30.9 32.0 32.5 33.0 Adjusted net profit 3,020 3,461 4,192 4,639 5,562 Reported net profit 3,020 3,461 4,192 4,639 5,562 % growth 48.6 14.6 21.1 10.7 19.9
Source: Company, Nirmal Bang Institutional Equities Research
Exhibit 7: Balance sheet Y/E June (Rsmn) FY14 FY15 FY16E FY17E FY18E Equity 325 325 325 325 325 Reserves 9,704 11,962 14,035 16,329 19,080 Net worth 10,029 12,287 14,360 16,654 19,404 Deferred tax liability (72) (40) (44) (48) (53) Liabilities 9,957 12,247 14,316 16,606 19,352 Gross block 4,281 5,237 6,444 7,592 8,804 Depreciation 1,886 2,149 2,771 3,515 4,382 Net block 2,395 3,088 3,673 4,077 4,423 Capital work-in-progress 982 390 382 434 422 Inventories 1,185 1,191 1,192 1,380 1,655 Debtors 861 1,139 1,192 1,298 1,558 Cash 2,691 6,186 10,137 12,684 15,433 Other current assets 6,894 7,444 5,747 5,751 6,506 Total current assets 11,631 15,960 18,268 21,113 25,152 Creditors 2,934 4,570 4,382 5,016 6,011 Other current liabilities 2,117 2,621 3,625 4,002 4,634 Total current liabilities 5,050 7,190 8,007 9,018 10,645 Net current assets 6,581 8,770 10,261 12,095 14,507 Total assets 9,957 12,247 14,316 16,606 19,352
Source: Company, Nirmal Bang Institutional Equities Research
Exhibit 6:Cash flow Y/E June (Rsmn) FY14 FY15 FY16E FY17E FY18E
EBIT 3,855 4,319 5,417 6,127 7,450
(Inc.)/dec. in working capital (87) 1,306 2,460 712 337
Cash flow from operations 3,768 5,625 7,877 6,840 7,787
Other income 802 746 810 822 937
Depreciation 352 525 622 744 866
Deferred tax asset (42) 32 (4) (4) (5)
Tax paid (-) (1,583) (1,547) (1,973) (2,234) (2,739)
Dividends paid (-) (1,044) (1,182) (2,119) (2,345) (2,812)
Net cash from operations 2,198 4,143 5,152 3,746 3,949
Capital expenditure (-) (1,168) (626) (1,200) (1,200) (1,200)
Net cash after capex 1,030 3,517 3,952 2,546 2,749
Opening cash balance 1,660 2,691 6,186 10,137 12,684
Closing cash balance 2,691 6,186 10,137 12,684 15,433
Change in cash balance 1,031 3,495 3,952 2,546 2,749
Source: Company, Nirmal Bang Institutional Equities Research
Exhibit 8: Key ratios
Y/E June FY14 FY15 FY16E FY17E FY18E Per share (Rs) EPS 92.9 106.5 129.0 142.7 171.1 DPS 27.5 30.2 54.2 60.0 71.9 Book value 309.0 378.5 442.4 513.1 597.8 Valuation (x) P/E 59.2 51.6 42.6 38.5 32.1 P/BV 17.8 14.5 12.4 10.7 9.2 EV/EBITDA 40.7 34.6 27.4 25.5 21.0 EV/sales 8.3 7.2 6.5 5.9 4.9 Return ratios (%) RoIC 135.9 181.5 343.7 514.0 1,164.8 RoCE 34.0 31.5 31.9 30.3 31.3 RoE 33.4 31.0 31.5 29.9 30.8 Dividend yield (%) 0.5 0.5 1.0 1.1 1.3 Margins (%) Gross margin 60.4 60.5 62.6 62.8 62.9 EBITDA margin 20.5 20.8 23.6 23.2 23.4 PBT margin 22.4 21.5 24.1 23.2 23.4 PAT margin 14.7 14.8 16.4 15.7 15.6 Turnover ratios Fixed asset turnover ratio (x) 6.1 6.7 6.3 6.6 7.3 Avg. inventory period (days) 21 19 17 17 17 Avg. collection period (days) 15 16 17 16 16 Avg. payment period (days) 39 47 49 49 50 Growth (%) Sales 21.6 13.8 9.7 15.7 20.0 EBITDA 67.9 15.1 24.7 13.8 21.0 PAT 48.6 14.6 21.1 10.7 19.9
Source: Company, Nirmal Bang Institutional Equities Research
31
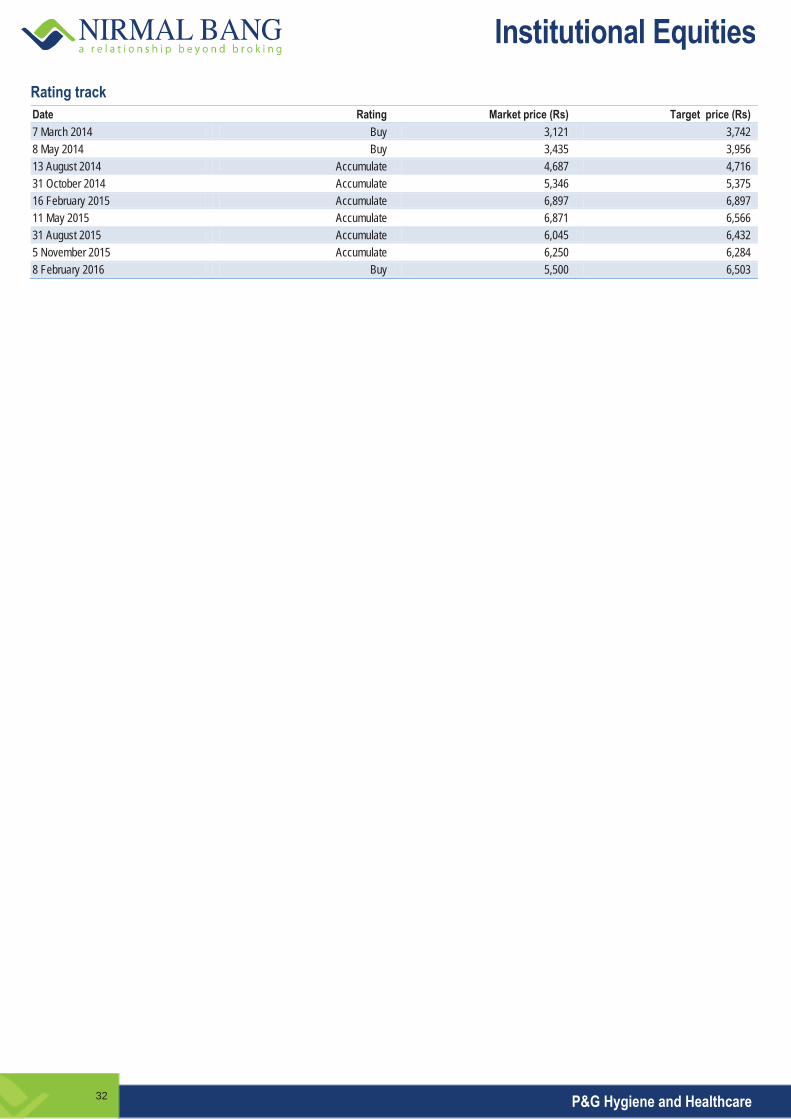
Institutional Equities
P&G Hygiene and Healthcare
Rating track Date Rating Market price (Rs) Target price (Rs) 7 March 2014 Buy 3,121 3,742 8 May 2014 Buy 3,435 3,956 13 August 2014 Accumulate 4,687 4,716 31 October 2014 Accumulate 5,346 5,375 16 February 2015 Accumulate 6,897 6,897 11 May 2015 Accumulate 6,871 6,566 31 August 2015 Accumulate 6,045 6,432 5 November 2015 Accumulate 6,250 6,284 8 February 2016 Buy 5,500 6,503
32
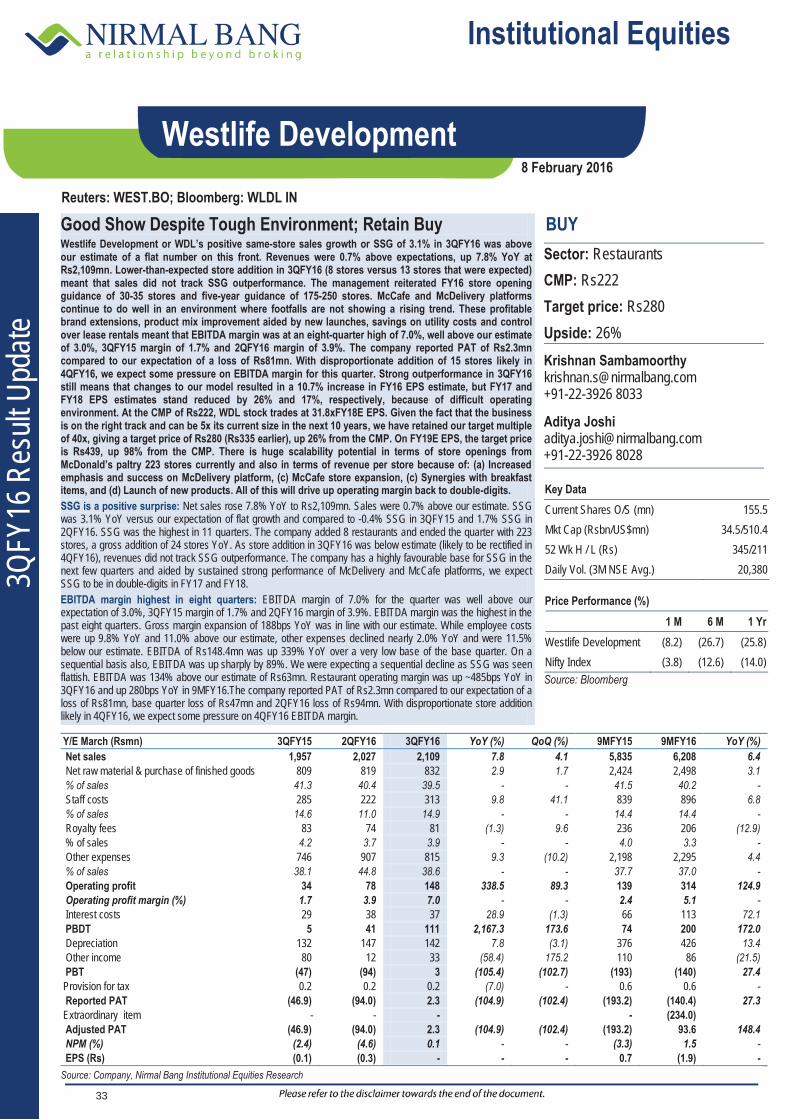
Institutional Equities3Q
FY16
Res
ult U
pdate
Reuters: WEST.BO; Bloomberg: WLDL IN
Westlife Development
Good Show Despite Tough Environment; Retain Buy Westlife Development or WDL’s positive same-store sales growth or SSG of 3.1% in 3QFY16 was above our estimate of a flat number on this front. Revenues were 0.7% above expectations, up 7.8% YoY at Rs2,109mn. Lower-than-expected store addition in 3QFY16 (8 stores versus 13 stores that were expected) meant that sales did not track SSG outperformance. The management reiterated FY16 store opening guidance of 30-35 stores and five-year guidance of 175-250 stores. McCafe and McDelivery platforms continue to do well in an environment where footfalls are not showing a rising trend. These profitable brand extensions, product mix improvement aided by new launches, savings on utility costs and control over lease rentals meant that EBITDA margin was at an eight-quarter high of 7.0%, well above our estimate of 3.0%, 3QFY15 margin of 1.7% and 2QFY16 margin of 3.9%. The company reported PAT of Rs2.3mn compared to our expectation of a loss of Rs81mn. With disproportionate addition of 15 stores likely in 4QFY16, we expect some pressure on EBITDA margin for this quarter. Strong outperformance in 3QFY16 still means that changes to our model resulted in a 10.7% increase in FY16 EPS estimate, but FY17 and FY18 EPS estimates stand reduced by 26% and 17%, respectively, because of difficult operating environment. At the CMP of Rs222, WDL stock trades at 31.8xFY18E EPS. Given the fact that the business is on the right track and can be 5x its current size in the next 10 years, we have retained our target multiple of 40x, giving a target price of Rs280 (Rs335 earlier), up 26% from the CMP. On FY19E EPS, the target price is Rs439, up 98% from the CMP. There is huge scalability potential in terms of store openings from McDonald’s paltry 223 stores currently and also in terms of revenue per store because of: (a) Increased emphasis and success on McDelivery platform, (c) McCafe store expansion, (c) Synergies with breakfast items, and (d) Launch of new products. All of this will drive up operating margin back to double-digits. SSG is a positive surprise: Net sales rose 7.8% YoY to Rs2,109mn. Sales were 0.7% above our estimate. SSG was 3.1% YoY versus our expectation of flat growth and compared to -0.4% SSG in 3QFY15 and 1.7% SSG in 2QFY16. SSG was the highest in 11 quarters. The company added 8 restaurants and ended the quarter with 223 stores, a gross addition of 24 stores YoY. As store addition in 3QFY16 was below estimate (likely to be rectified in 4QFY16), revenues did not track SSG outperformance. The company has a highly favourable base for SSG in the next few quarters and aided by sustained strong performance of McDelivery and McCafe platforms, we expect SSG to be in double-digits in FY17 and FY18. EBITDA margin highest in eight quarters: EBITDA margin of 7.0% for the quarter was well above our expectation of 3.0%, 3QFY15 margin of 1.7% and 2QFY16 margin of 3.9%. EBITDA margin was the highest in the past eight quarters. Gross margin expansion of 188bps YoY was in line with our estimate. While employee costs were up 9.8% YoY and 11.0% above our estimate, other expenses declined nearly 2.0% YoY and were 11.5% below our estimate. EBITDA of Rs148.4mn was up 339% YoY over a very low base of the base quarter. On a sequential basis also, EBITDA was up sharply by 89%. We were expecting a sequential decline as SSG was seen flattish. EBITDA was 134% above our estimate of Rs63mn. Restaurant operating margin was up ~485bps YoY in 3QFY16 and up 280bps YoY in 9MFY16.The company reported PAT of Rs2.3mn compared to our expectation of a loss of Rs81mn, base quarter loss of Rs47mn and 2QFY16 loss of Rs94mn. With disproportionate store addition likely in 4QFY16, we expect some pressure on 4QFY16 EBITDA margin.
BUY Sector: Restaurants CMP: Rs222 Target price: Rs280 Upside: 26% Krishnan Sambamoorthy [email protected] +91-22-3926 8033 Aditya Joshi [email protected] +91-22-3926 8028
Key Data Current Shares O/S (mn) 155.5 Mkt Cap (Rsbn/US$mn) 34.5/510.4 52 Wk H / L (Rs) 345/211 Daily Vol. (3M NSE Avg.) 20,380
Price Performance (%) 1 M 6 M 1 Yr
Westlife Development (8.2) (26.7) (25.8) Nifty Index (3.8) (12.6) (14.0) Source: Bloomberg
Y/E March (Rsmn) 3QFY15 2QFY16 3QFY16 YoY (%) QoQ (%) 9MFY15 9MFY16 YoY (%) Net sales 1,957 2,027 2,109 7.8 4.1 5,835 6,208 6.4 Net raw material & purchase of finished goods 809 819 832 2.9 1.7 2,424 2,498 3.1 % of sales 41.3 40.4 39.5 - - 41.5 40.2 - Staff costs 285 222 313 9.8 41.1 839 896 6.8 % of sales 14.6 11.0 14.9 - - 14.4 14.4 - Royalty fees 83 74 81 (1.3) 9.6 236 206 (12.9) % of sales 4.2 3.7 3.9 - - 4.0 3.3 - Other expenses 746 907 815 9.3 (10.2) 2,198 2,295 4.4 % of sales 38.1 44.8 38.6 - - 37.7 37.0 - Operating profit 34 78 148 338.5 89.3 139 314 124.9 Operating profit margin (%) 1.7 3.9 7.0 - - 2.4 5.1 - Interest costs 29 38 37 28.9 (1.3) 66 113 72.1 PBDT 5 41 111 2,167.3 173.6 74 200 172.0 Depreciation 132 147 142 7.8 (3.1) 376 426 13.4 Other income 80 12 33 (58.4) 175.2 110 86 (21.5) PBT (47) (94) 3 (105.4) (102.7) (193) (140) 27.4 Provision for tax 0.2 0.2 0.2 (7.0) - 0.6 0.6 - Reported PAT (46.9) (94.0) 2.3 (104.9) (102.4) (193.2) (140.4) 27.3 Extraordinary item - - - - (234.0) Adjusted PAT (46.9) (94.0) 2.3 (104.9) (102.4) (193.2) 93.6 148.4 NPM (%) (2.4) (4.6) 0.1 - - (3.3) 1.5 - EPS (Rs) (0.1) (0.3) - - - 0.7 (1.9) - Source: Company, Nirmal Bang Institutional Equities Research
8 February 2016
33

Institutional Equities
Westlife Development
Conference-call highlights The management is energised by the progress on all fronts. Volatility is nevertheless here to stay with periods of good footfalls as well as poor footfalls in a quarter. End-of-season sales, holidays and release of good movies are periods where footfalls rise. However, on overall basis, there was no significant pick-up in footfalls.
With base quarter SSG less challenging in the next two quarters (negative 4.5% and negative 4.9% in 4QFY15 and 1QFY16, respectively) compared to flat growth in 3QFY15, SSG is likely to show an improving trend compared to 3.1% in 3QFY16. 9MFY16 SSG was flat (-0.3%).
Exhibit 1: SSG trend
Source: Company, Nirmal Bang Institutional Equities Research
The management is taking steps towards margin expansion and broadening reach and experience with new stores and constant innovation in respect of products.
New units are being opened with better operating economics, which will also lead to better restaurant operating margins going forward. A few quarters ago, the management went back to the drawing board and looked at each component of operating costs, a process which enabled margin expansion.
Restaurant operating margins were up 485 bps YoY in 3QFY16 and up 280bps YoY in 9MFY16. Exhibit 2: Restaurant operating margin
Source: Company, Nirmal Bang Institutional Equities Research
9.5
3.2
7.2
0.5
(5.5)
(9.8)(10.5)
(9.0) (8.1)
(0.4) (4.8) (4.9)
1.7
3.1
(15)
(10)
(5)
0
5
10
15 2Q
FY13
3QFY
13
4QFY
13
1QFY
14
2QFY
14
3QFY
14
4QFY
14
1QFY
15
2QFY
15
3QFY
15
4QFY
15
1QFY
16
2QFY
16
3QFY
16
(%)
11.8
6.2
8.28.5
10.611.1
13.1
5
6
7
8
9
10
11
12
13
14
1QFY15 2QFY15 3QFY15 4QFY15 1QFY16 2QFY16 3QFY16
(%)
34

Institutional Equities
Westlife Development
The Indi-McSpicy product range launched during the quarter did very well, contributing to better realisation and margins.
The company does not offer discounts on its products, a strategy which is serving it well. Price hike remains at 3%-5% annually and other factors contributing to better SSG and gross margin are mix effect and increase in supply chain efficiencies. There was a small price hike in October 2015.
Exhibit 3: Quarterly gross margin (%) trend
Source: Company, Nirmal Bang Institutional Equities Research
McCafe and McDelivery remain strong growth areas. 50% of all McDelivery orders are online. Many stores which offer delivery facility have strong double-digit sales from McDelivery platform. On food tech aspect of McDelivery, the management stated that quality of food and innovations are now allied with robust technology which is enabling strong share in online order placement. The company has upgraded its delivery app in the past few months. The management compared the online competition with food courts, where competition is stiff but McDonalds still find ways to dominate. Healthy demand in case of McDelivery is good for margins as well. Over 120 out of 223 restaurants at the end of the quarter have McDelivery service. The base McDonald’s store already has most of the costs built in and thus extensions like McDelivery and McCafe are highly profitable.
McCafe is present in 62 stores now (the count was 37 at the end of FY15) out of 223 stores and has been a big contributor to realisation and margin expansion of these stores. As the proportion of stores with McCafe increases, the contribution to overall SSG and margins is likely to be significantly positive. The company intends to double its McCafe base in the next 12-18 months.
The amendment to The Bonus Act has been factored into staff costs during the quarter, both for FY16 and FY15. As the company was already paying performance bonus to most of its employees, the hit on account of the amendment to The Bonus Act was only around 10bps-12bps.
Lease rentals are under check because of long-term contracts of 20-35 years that the company signs which results in escalation of ~3%, much lower than its peers. At the same time, it has also been able to get good deals in the slowdown. With around 3% escalation in a key cost item, the scope to improve profitability is very strong when SSG sustains at over 3%. Utility costs are doing down on per store level because of better efficiency measures. The management maintained near-term store expansion targets of 30-35 stores in FY16 and five-year year target of 175-250 stores. Having opened 15 outlets in 9MFY16, the company is thus likely to open around an equivalent number of stores in 4QFY16. As per the guidance given in the preceding quarter, capex per store declined from Rs25mn-Rs30mn range earlier to Rs23mn-Rs25mn currently.
58.2
58.8
58.0
58.758.3
59.1
59.6
60.5
57
57
58
58
59
59
60
60
61
61
4QFY14 1QFY15 2QFY15 3QFY15 4QFY15 1QFY16 2QFY16 3QFY16
(%)
35
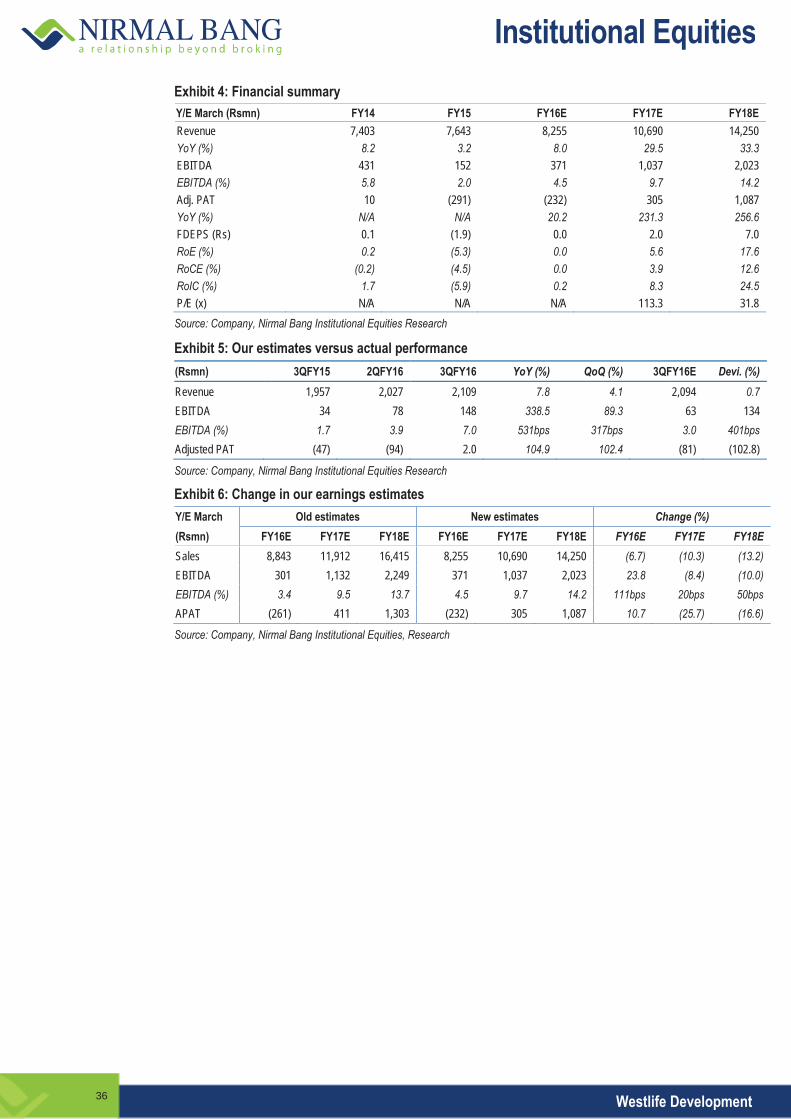
Institutional Equities
Westlife Development
Exhibit 4: Financial summary Y/E March (Rsmn) FY14 FY15 FY16E FY17E FY18E Revenue 7,403 7,643 8,255 10,690 14,250 YoY (%) 8.2 3.2 8.0 29.5 33.3 EBITDA 431 152 371 1,037 2,023 EBITDA (%) 5.8 2.0 4.5 9.7 14.2 Adj. PAT 10 (291) (232) 305 1,087 YoY (%) N/A N/A 20.2 231.3 256.6 FDEPS (Rs) 0.1 (1.9) 0.0 2.0 7.0 RoE (%) 0.2 (5.3) 0.0 5.6 17.6 RoCE (%) (0.2) (4.5) 0.0 3.9 12.6 RoIC (%) 1.7 (5.9) 0.2 8.3 24.5 P/E (x) N/A N/A N/A 113.3 31.8 Source: Company, Nirmal Bang Institutional Equities Research
Exhibit 5: Our estimates versus actual performance (Rsmn) 3QFY15 2QFY16 3QFY16 YoY (%) QoQ (%) 3QFY16E Devi. (%) Revenue 1,957 2,027 2,109 7.8 4.1 2,094 0.7 EBITDA 34 78 148 338.5 89.3 63 134 EBITDA (%) 1.7 3.9 7.0 531bps 317bps 3.0 401bps Adjusted PAT (47) (94) 2.0 104.9 102.4 (81) (102.8)
Source: Company, Nirmal Bang Institutional Equities Research Exhibit 6: Change in our earnings estimates Y/E March Old estimates New estimates Change (%) (Rsmn) FY16E FY17E FY18E FY16E FY17E FY18E FY16E FY17E FY18E Sales 8,843 11,912 16,415 8,255 10,690 14,250 (6.7) (10.3) (13.2) EBITDA 301 1,132 2,249 371 1,037 2,023 23.8 (8.4) (10.0) EBITDA (%) 3.4 9.5 13.7 4.5 9.7 14.2 111bps 20bps 50bps APAT (261) 411 1,303 (232) 305 1,087 10.7 (25.7) (16.6)
Source: Company, Nirmal Bang Institutional Equities, Research
36

Institutional Equities
Westlife Development
Financials Exhibit 7: Income statement Y/E March (Rsmn) FY14 FY15 FY16E FY17E FY18E Net sales 7,403 7,643 8,255 10,690 14,250 % growth 8.2 3.2 8.0 29.5 33.3 Raw material costs 3,138 3,177 3,241 4,083 5,308 Staff costs 962 1,137 1,148 1,389 1,709 Advt. and promotion exp. 406 428 462 568 755 Royalty 232 268 322 508 798 Electricity, gas & other utility costs 814 898 952 1,133 1,371 Conducting charges (lease Rent) 598 680 802 955 1,146 Other expenses 822 904 957 1,017 1,139 Total expenses 6,972 7,492 7,884 9,653 12,226 EBITDA 431 152 371 1,037 2,023 % growth (25.8) (64.8) 144.5 179.7 95.2 EBITDA margin (%) 5.8 2.0 4.5 9.7 14.2 Other income 57 165 3 13 14 Interest costs 46 102 6 39 37 Depreciation 435 504 601 707 833 Profit before tax 7 (290) (232) 305 1,169 % growth (98.0) (4,537.9) 20.0 231.3 283.4 Tax (3.0) 0.9 - - 81.8 Effective tax rate (%) (45.7) (0.3) 0.0 0.0 7.0 Net profit 10 (291) (232) 305 1,087 % growth N/A N/A 20.2 231.3 256.6 Adjusted net profit 10 (291) (232) 305 1,087 Reported net profit 10 (291) 2 305 1,087 % growth N/A N/A 20.2 231.3 256.6
Source: Company, Nirmal Bang Institutional Equities Research
Exhibit 9: Balance sheet Y/E March (Rsmn) FY14 FY15 FY16E FY17E FY18E Equity 311 311 311 311 311 Reserves 5,299 5,025 5,027 5,332 6,419 Net worth 5,610 5,336 5,338 5,643 6,730 Short-term loans - - 700 450 - Long-term loans 637 1,342 1,342 2,042 2,492 Total loans 637 1,342 2,042 2,492 2,492 Deferred tax liability - - - - - Liabilities 6,247 6,678 7,380 8,135 9,222 Gross block 5,942 6,740 7,731 9,196 10,846 Depreciation 1,704 2,098 2,699 3,406 4,238 Net block 4,238 4,642 5,032 5,791 6,608 Capital work-in-progress 177 209 350 385 385 Investments 1,587 1,481 1,481 1,481 1,481 Inventories 199 241 211 374 407 Debtors 63 42 93 82 152 Cash 121 73 312 348 780 Other current assets 986 1,071 1,125 1,181 1,240 Total current assets 2,957 2,908 3,223 3,467 4,059 Creditors 591 594 718 981 1,284 Other current liabilities 533 487 507 527 547 Total current liabilities 1,124 1,080 1,225 1,507 1,830 Net current assets 1,832 1,827 1,998 1,959 2,229 Total assets 6,247 6,678 7,380 8,135 9,222
Source: Company, Nirmal Bang Institutional Equities Research
Exhibit 8: Cash flow Y/E March (Rsmn) FY14 FY15 FY16E FY17E FY18E EBIT (4) (353) (230) 330 1,191 (Inc.)/dec in working capital (89) (8) 49 55 142 Cash flow from operations 380 188 678 1,125 2,118 Depreciation 435 504 601 707 833 Tax paid (-) (12) 1 - - (82) Net cash from operations 380 188 678 1,125 2,118 Capital expenditure (-) (1,021) (1,050) (1,133) (1,500) (1,650) Net cash after capex (641) (862) (455) (375) 468 Inc./(dec.) in short-term borrowing 308 314 900 700 - Inc./(dec.) in long-term borrowing 171 442 - - - (Inc.)/dec. in investments (1,543) 257 - - - Equity issue/(buyback) (40) (9) - - - Cash from financial activities 2,217 606 700 450 - Others 2,849 17 (0) - - Opening cash balance 246 121 73 312 348 Closing cash balance 121 73 312 348 780 Change in cash balance (5) (48) 240 36 432
Source: Company, Nirmal Bang Institutional Equities Research
Exhibit 10: Key ratios Y/E March FY14 FY15 FY16E FY17E FY18E Per share (Rs) EPS 0.1 (1.9) (1.5) 2.0 7.0 DPS - - - - - Book value 36.1 34.3 34.3 36.3 43.3 Valuation (x) P/E N/A N/A N/A 113.3 31.8 P/BV 6.2 6.5 6.5 6.1 5.1 EV/EBITDA 77.6 226.4 93.6 33.9 17.2 EV/sales 4.5 4.5 4.2 3.3 2.4 Return ratios (%) RoCE (0.2) (4.5) - 3.9 12.6 RoE 0.2 (5.3) - 5.6 17.6 Margins (%) Gross margin 57.6 58.4 60.7 61.8 62.8 EBITDA margin 5.8 2.0 4.5 9.7 14.2 PBT margin 0.1 (3.8) (2.8) 2.9 8.2 PAT margin 0.1 (3.8) (2.8) 2.9 7.6 Turnover ratios Fixed asset turnover ratio (x) 1.68 1.58 1.53 1.73 2.04 Avg. inventory period (days) 9 11 10 10 10 Avg. collection period (days) 4 3 3 3 3 Avg. payment period (days) 29 28 29 29 29 Solvency ratios (x) Debt-equity 0.1 0.2 0.3 0.4 0.3 Dividend yield (%) - - - - - Growth (%) Sales 8.2 3.2 8.0 29.5 33.3 EBITDA (25.8) (64.8) 144.5 179.7 95.2 PAT N/A N/A 20.2 231.3 256.6
Source: Company, Nirmal Bang Institutional Equities Research
37

Institutional Equities
Westlife Development
Rating track Date Rating Market price (Rs) Target price (Rs) 6 May 2015 Buy 296 403 11 May 2015 Buy 293 403 5 June 2015 Buy 280 403 10 August 2015 Buy 295 356 9 November 2015 Buy 238 335 8 February 2016 Buy 222 280
38
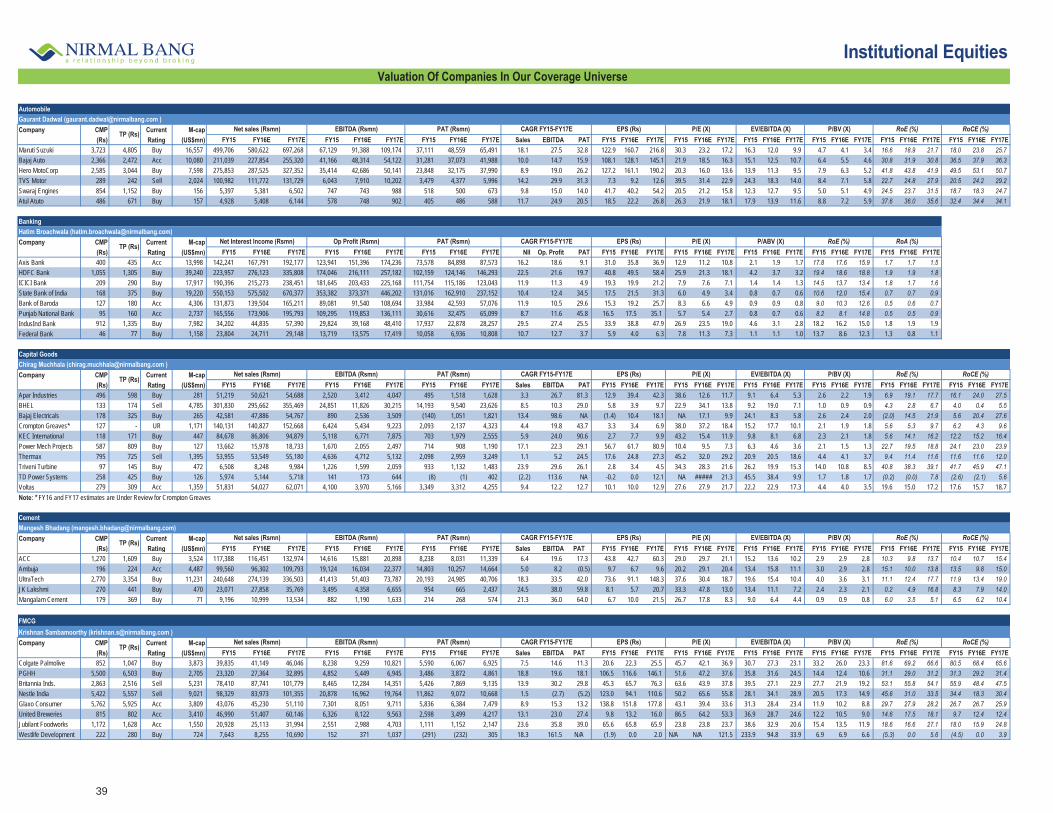
AutomobileGaurant Dadwal ([email protected] )Company CMP Current M-cap
(Rs) Rating (US$mn) FY15 FY16E FY17E FY15 FY16E FY17E FY15 FY16E FY17E Sales EBITDA PAT FY15 FY16E FY17E FY15 FY16E FY17E FY15 FY16E FY17E FY15 FY16E FY17E FY15 FY16E FY17E FY15 FY16E FY17EMaruti Suzuki 3,723 4,805 Buy 16,557 499,706 580,622 697,268 67,129 91,388 109,174 37,111 48,559 65,491 18.1 27.5 32.8 122.9 160.7 216.8 30.3 23.2 17.2 16.3 12.0 9.9 4.7 4.1 3.4 16.6 18.9 21.7 18.0 23.8 25.7 Bajaj Auto 2,366 2,472 Acc 10,080 211,039 227,854 255,320 41,166 48,314 54,122 31,281 37,073 41,988 10.0 14.7 15.9 108.1 128.1 145.1 21.9 18.5 16.3 15.1 12.5 10.7 6.4 5.5 4.6 30.8 31.9 30.8 36.5 37.9 36.3 Hero MotoCorp 2,585 3,044 Buy 7,598 275,853 287,525 327,352 35,414 42,686 50,141 23,848 32,175 37,990 8.9 19.0 26.2 127.2 161.1 190.2 20.3 16.0 13.6 13.9 11.3 9.5 7.9 6.3 5.2 41.8 43.8 41.9 49.5 53.1 50.7 TVS Motor 289 242 Sell 2,024 100,982 111,772 131,729 6,043 7,910 10,202 3,479 4,377 5,996 14.2 29.9 31.3 7.3 9.2 12.6 39.5 31.4 22.9 24.3 18.3 14.0 8.4 7.1 5.8 22.7 24.8 27.9 20.5 24.2 29.2 Swaraj Engines 854 1,152 Buy 156 5,397 5,381 6,502 747 743 988 518 500 673 9.8 15.0 14.0 41.7 40.2 54.2 20.5 21.2 15.8 12.3 12.7 9.5 5.0 5.1 4.9 24.5 23.7 31.5 18.7 18.3 24.7 Atul Atuto 486 671 Buy 157 4,928 5,408 6,144 578 748 902 405 486 588 11.7 24.9 20.5 18.5 22.2 26.8 26.3 21.9 18.1 17.9 13.9 11.6 8.8 7.2 5.9 37.6 36.0 35.6 32.4 34.4 34.1
BankingHatim Broachwala ([email protected])Company CMP Current M-cap
(Rs) Rating (US$mn) FY15 FY16E FY17E FY15 FY16E FY17E FY15 FY16E FY17E NII Op. Profit PAT FY15 FY16E FY17E FY15 FY16E FY17E FY15 FY16E FY17E FY15 FY16E FY17E FY15 FY16E FY17EAxis Bank 400 435 Acc 13,998 142,241 167,791 192,177 123,941 151,396 174,236 73,578 84,898 87,573 16.2 18.6 9.1 31.0 35.8 36.9 12.9 11.2 10.8 2.1 1.9 1.7 17.8 17.6 15.9 1.7 1.7 1.5 HDFC Bank 1,055 1,305 Buy 39,240 223,957 276,123 335,808 174,046 216,111 257,182 102,159 124,146 146,293 22.5 21.6 19.7 40.8 49.5 58.4 25.9 21.3 18.1 4.2 3.7 3.2 19.4 18.6 18.8 1.9 1.9 1.8 ICICI Bank 209 290 Buy 17,917 190,396 215,273 238,451 181,645 203,433 225,168 111,754 115,186 123,043 11.9 11.3 4.9 19.3 19.9 21.2 7.9 7.6 7.1 1.4 1.4 1.3 14.5 13.7 13.4 1.8 1.7 1.6 State Bank of India 168 375 Buy 19,220 550,153 575,502 670,377 353,382 373,371 446,202 131,016 162,910 237,152 10.4 12.4 34.5 17.5 21.5 31.3 6.0 4.9 3.4 0.8 0.7 0.6 10.6 12.0 15.4 0.7 0.7 0.9 Bank of Baroda 127 180 Acc 4,306 131,873 139,504 165,211 89,081 91,540 108,694 33,984 42,593 57,076 11.9 10.5 29.6 15.3 19.2 25.7 8.3 6.6 4.9 0.9 0.9 0.8 9.0 10.3 12.6 0.5 0.6 0.7 Punjab National Bank 95 160 Acc 2,737 165,556 173,906 195,793 109,295 119,853 136,111 30,616 32,475 65,099 8.7 11.6 45.8 16.5 17.5 35.1 5.7 5.4 2.7 0.8 0.7 0.6 8.2 8.1 14.8 0.5 0.5 0.9 IndusInd Bank 912 1,335 Buy 7,982 34,202 44,835 57,390 29,824 39,168 48,410 17,937 22,878 28,257 29.5 27.4 25.5 33.9 38.8 47.9 26.9 23.5 19.0 4.6 3.1 2.8 18.2 16.2 15.0 1.8 1.9 1.9 Federal Bank 46 77 Buy 1,158 23,804 24,711 29,148 13,719 13,575 17,419 10,058 6,936 10,808 10.7 12.7 3.7 5.9 4.0 6.3 7.8 11.3 7.3 1.1 1.1 1.0 13.7 8.6 12.3 1.3 0.8 1.1
Capital GoodsChirag Muchhala ([email protected] )Company CMP Current M-cap
(Rs) Rating (US$mn) FY15 FY16E FY17E FY15 FY16E FY17E FY15 FY16E FY17E Sales EBITDA PAT FY15 FY16E FY17E FY15 FY16E FY17E FY15 FY16E FY17E FY15 FY16E FY17E FY15 FY16E FY17E FY15 FY16E FY17EApar Industries 496 598 Buy 281 51,219 50,621 54,688 2,520 3,412 4,047 495 1,518 1,628 3.3 26.7 81.3 12.9 39.4 42.3 38.6 12.6 11.7 9.1 6.4 5.3 2.6 2.2 1.9 6.9 19.1 17.7 16.1 24.0 27.5 BHEL 133 174 Sell 4,785 301,830 295,662 355,469 24,851 11,826 30,215 14,193 9,540 23,626 8.5 10.3 29.0 5.8 3.9 9.7 22.9 34.1 13.8 9.2 19.0 7.1 1.0 0.9 0.9 4.3 2.8 6.7 4.0 0.4 5.5 Bajaj Electricals 178 325 Buy 265 42,581 47,886 54,767 890 2,536 3,509 (140) 1,051 1,821 13.4 98.6 NA (1.4) 10.4 18.1 NA 17.1 9.9 24.1 8.3 5.8 2.6 2.4 2.0 (2.0) 14.5 21.9 5.6 20.4 27.6 Crompton Greaves* 127 - UR 1,171 140,131 140,827 152,668 6,424 5,434 9,223 2,093 2,137 4,323 4.4 19.8 43.7 3.3 3.4 6.9 38.0 37.2 18.4 15.2 17.7 10.1 2.1 1.9 1.8 5.6 5.3 9.7 6.2 4.3 9.6 KEC International 118 171 Buy 447 84,678 86,806 94,879 5,118 6,771 7,875 703 1,979 2,555 5.9 24.0 90.6 2.7 7.7 9.9 43.2 15.4 11.9 9.8 8.1 6.8 2.3 2.1 1.8 5.6 14.1 16.2 12.2 15.2 16.4 Power Mech Projects 587 809 Buy 127 13,662 15,978 18,733 1,670 2,055 2,497 714 908 1,190 17.1 22.3 29.1 56.7 61.7 80.9 10.4 9.5 7.3 6.3 4.6 3.6 2.1 1.5 1.3 22.7 19.5 18.8 24.1 23.0 23.9 Thermax 795 725 Sell 1,395 53,955 53,549 55,180 4,636 4,712 5,132 2,098 2,959 3,249 1.1 5.2 24.5 17.6 24.8 27.3 45.2 32.0 29.2 20.9 20.5 18.6 4.4 4.1 3.7 9.4 11.4 11.6 11.6 11.6 12.0 Triveni Turbine 97 145 Buy 472 6,508 8,248 9,984 1,226 1,599 2,059 933 1,132 1,483 23.9 29.6 26.1 2.8 3.4 4.5 34.3 28.3 21.6 26.2 19.9 15.3 14.0 10.8 8.5 40.8 38.3 39.1 41.7 45.9 47.1 TD Power Systems 258 425 Buy 126 5,974 5,144 5,718 141 173 644 (8) (1) 402 (2.2) 113.6 NA -0.2 0.0 12.1 NA ##### 21.3 45.5 38.4 9.9 1.7 1.8 1.7 (0.2) (0.0) 7.8 (2.6) (2.1) 5.6 Voltas 279 309 Acc 1,359 51,831 54,027 62,071 4,100 3,970 5,166 3,349 3,312 4,255 9.4 12.2 12.7 10.1 10.0 12.9 27.6 27.9 21.7 22.2 22.9 17.3 4.4 4.0 3.5 19.6 15.0 17.2 17.6 15.7 18.7 Note: * FY16 and FY17 estimates are Under Review for Crompton Greaves
CementMangesh Bhadang ([email protected])Company CMP Current M-cap
(Rs) Rating (US$mn) FY15 FY16E FY17E FY15 FY16E FY17E FY15 FY16E FY17E Sales EBITDA PAT FY15 FY16E FY17E FY15 FY16E FY17E FY15 FY16E FY17E FY15 FY16E FY17E FY15 FY16E FY17E FY15 FY16E FY17EACC 1,270 1,609 Buy 3,524 117,388 116,451 132,974 14,616 15,881 20,898 8,238 8,031 11,339 6.4 19.6 17.3 43.8 42.7 60.3 29.0 29.7 21.1 15.2 13.6 10.2 2.9 2.9 2.8 10.3 9.8 13.7 10.4 10.7 15.4 Ambuja 196 224 Acc 4,487 99,560 96,302 109,793 19,124 16,034 22,377 14,803 10,257 14,664 5.0 8.2 (0.5) 9.7 6.7 9.6 20.2 29.1 20.4 13.4 15.8 11.1 3.0 2.9 2.8 15.1 10.0 13.8 13.5 9.8 15.0 UltraTech 2,770 3,354 Buy 11,231 240,648 274,139 336,503 41,413 51,403 73,787 20,193 24,985 40,706 18.3 33.5 42.0 73.6 91.1 148.3 37.6 30.4 18.7 19.6 15.4 10.4 4.0 3.6 3.1 11.1 12.4 17.7 11.9 13.4 19.0 JK Lakshmi 270 441 Buy 470 23,071 27,858 35,769 3,495 4,358 6,655 954 665 2,437 24.5 38.0 59.8 8.1 5.7 20.7 33.3 47.8 13.0 13.4 11.1 7.2 2.4 2.3 2.1 0.2 4.9 16.8 8.3 7.9 14.0 Mangalam Cement 179 369 Buy 71 9,196 10,999 13,534 882 1,190 1,633 214 268 574 21.3 36.0 64.0 6.7 10.0 21.5 26.7 17.8 8.3 9.0 6.4 4.4 0.9 0.9 0.8 6.0 3.5 5.1 6.5 6.2 10.4
FMCGKrishnan Sambamoorthy ([email protected] )Company CMP Current M-cap
(Rs) Rating (US$mn) FY15 FY16E FY17E FY15 FY16E FY17E FY15 FY16E FY17E Sales EBITDA PAT FY15 FY16E FY17E FY15 FY16E FY17E FY15 FY16E FY17E FY15 FY16E FY17E FY15 FY16E FY17E FY15 FY16E FY17EColgate Palmolive 852 1,047 Buy 3,873 39,835 41,149 46,046 8,238 9,259 10,821 5,590 6,067 6,925 7.5 14.6 11.3 20.6 22.3 25.5 45.7 42.1 36.9 30.7 27.3 23.1 33.2 26.0 23.3 81.6 69.2 66.6 80.5 68.4 65.6 PGHH 5,500 6,503 Buy 2,705 23,320 27,364 32,895 4,852 5,449 6,945 3,486 3,872 4,861 18.8 19.6 18.1 106.5 116.6 146.1 51.6 47.2 37.6 35.8 31.6 24.5 14.4 12.4 10.6 31.1 29.0 31.2 31.3 29.2 31.4 Britannia Inds. 2,863 2,516 Sell 5,231 78,410 87,741 101,779 8,465 12,284 14,351 5,426 7,869 9,135 13.9 30.2 29.8 45.3 65.7 76.3 63.6 43.9 37.8 39.5 27.1 22.9 27.7 21.9 19.2 53.1 55.8 54.1 55.9 48.4 47.5 Nestle India 5,422 5,557 Sell 9,021 98,329 83,973 101,355 20,878 16,962 19,764 11,862 9,072 10,668 1.5 (2.7) (5.2) 123.0 94.1 110.6 50.2 65.6 55.8 28.1 34.1 28.9 20.5 17.3 14.9 45.6 31.0 33.5 34.4 18.3 30.4 Glaxo Consumer 5,762 5,925 Acc 3,809 43,076 45,230 51,110 7,301 8,051 9,711 5,836 6,384 7,479 8.9 15.3 13.2 138.8 151.8 177.8 43.1 39.4 33.6 31.3 28.4 23.4 11.9 10.2 8.8 29.7 27.9 28.2 26.7 26.7 25.9 United Breweries 815 802 Acc 3,410 46,990 51,407 60,146 6,326 8,122 9,563 2,598 3,499 4,217 13.1 23.0 27.4 9.8 13.2 16.0 86.5 64.2 53.3 36.9 28.7 24.6 12.2 10.5 9.0 14.6 17.5 18.1 9.7 12.4 12.4 Jubilant Foodworks 1,172 1,628 Acc 1,550 20,928 25,113 31,994 2,551 2,988 4,703 1,111 1,152 2,147 23.6 35.8 39.0 65.6 65.8 65.9 23.8 23.8 23.7 38.6 32.9 20.6 15.4 13.5 11.9 18.6 16.6 27.1 18.0 15.9 24.8 Westlife Development 222 280 Buy 724 7,643 8,255 10,690 152 371 1,037 (291) (232) 305 18.3 161.5 N/A (1.9) 0.0 2.0 N/A N/A 121.5 233.9 94.8 33.9 6.9 6.9 6.6 (5.3) 0.0 5.6 (4.5) 0.0 3.9
RoE (%) RoCE (%)TP (Rs)
Net sales (Rsmn) EBITDA (Rsmn) PAT (Rsmn) CAGR FY15-FY17E
CAGR FY15-FY17E EPS (Rs) P/E (X) EV/EBITDA (X) P/BV (X) RoE (%) RoCE (%)
TP (Rs)
RoE (%) RoA (%)
TP (Rs)Net sales (Rsmn) EBITDA (Rsmn) PAT (Rsmn)
RoE (%)
PAT (Rsmn) CAGR FY15-FY17E
Net sales (Rsmn) EBITDA (Rsmn) PAT (Rsmn) CAGR FY15-FY17E P/BV (X)P/E (X) EV/EBITDA (X) RoCE (%)EPS (Rs)
EPS (Rs) P/E (X) EV/EBITDA (X) P/BV (X)
RoE (%)
Valuation Of Companies In Our Coverage Universe
P/ABV (X)Op Profit (Rsmn) PAT (Rsmn) CAGR FY15-FY17E P/E (X)
RoCE (%)EPS (Rs) P/E (X)
TP (Rs)Net Interest Income (Rsmn) EPS (Rs)
EV/EBITDA (X) P/BV (X)TP (Rs)
Net sales (Rsmn) EBITDA (Rsmn)
Institutional Equities
39
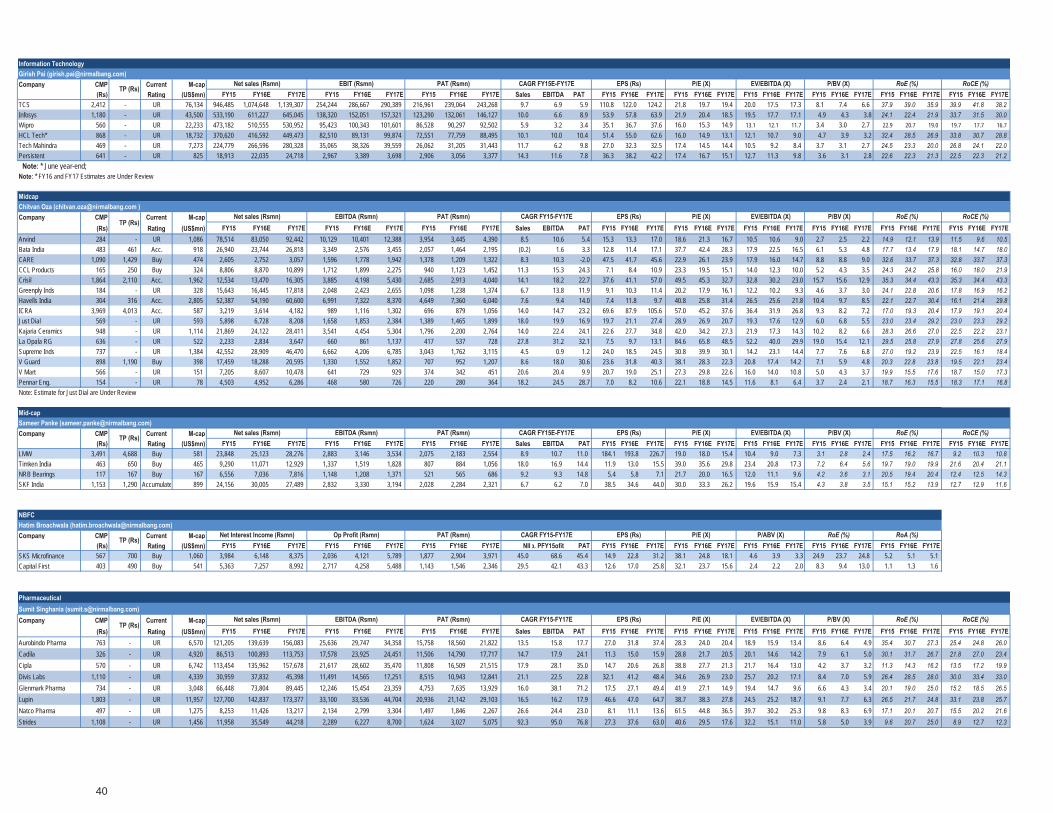
Information Technology Girish Pai ([email protected])Company CMP Current M-cap
(Rs) Rating (US$mn) FY15 FY16E FY17E FY15 FY16E FY17E FY15 FY16E FY17E Sales EBITDA PAT FY15 FY16E FY17E FY15 FY16E FY17E FY15 FY16E FY17E FY15 FY16E FY17E FY15 FY16E FY17E FY15 FY16E FY17ETCS 2,412 - UR 76,134 946,485 1,074,648 1,139,307 254,244 286,667 290,389 216,961 239,064 243,268 9.7 6.9 5.9 110.8 122.0 124.2 21.8 19.7 19.4 20.0 17.5 17.3 8.1 7.4 6.6 37.9 39.0 35.9 39.9 41.8 38.2 Infosys 1,180 - UR 43,500 533,190 611,227 645,045 138,320 152,051 157,321 123,290 132,061 146,127 10.0 6.6 8.9 53.9 57.8 63.9 21.9 20.4 18.5 19.5 17.7 17.1 4.9 4.3 3.8 24.1 22.4 21.9 33.7 31.5 30.0 Wipro 560 - UR 22,233 473,182 510,555 530,952 95,423 100,343 101,601 86,528 90,297 92,502 5.9 3.2 3.4 35.1 36.7 37.6 16.0 15.3 14.9 13.1 12.1 11.7 3.4 3.0 2.7 22.9 20.7 19.0 19.7 17.7 16.7 HCL Tech* 868 - UR 18,732 370,620 416,592 449,473 82,510 89,131 99,874 72,551 77,759 88,495 10.1 10.0 10.4 51.4 55.0 62.6 16.0 14.9 13.1 12.1 10.7 9.0 4.7 3.9 3.2 32.4 28.5 26.9 33.8 30.7 28.8 Tech Mahindra 469 - UR 7,273 224,779 266,596 280,328 35,065 38,326 39,559 26,062 31,205 31,443 11.7 6.2 9.8 27.0 32.3 32.5 17.4 14.5 14.4 10.5 9.2 8.4 3.7 3.1 2.7 24.5 23.3 20.0 26.8 24.1 22.0 Persistent 641 - UR 825 18,913 22,035 24,718 2,967 3,389 3,698 2,906 3,056 3,377 14.3 11.6 7.8 36.3 38.2 42.2 17.4 16.7 15.1 12.7 11.3 9.8 3.6 3.1 2.8 22.6 22.3 21.3 22.5 22.3 21.2 Note: * June year-end; Note: * FY16 and FY17 Estimates are Under Review
MidcapChitvan Oza ([email protected] )Company CMP Current M-cap
(Rs) Rating (US$mn) FY15 FY16E FY17E FY15 FY16E FY17E FY15 FY16E FY17E Sales EBITDA PAT FY15 FY16E FY17E FY15 FY16E FY17E FY15 FY16E FY17E FY15 FY16E FY17E FY15 FY16E FY17E FY15 FY16E FY17EArvind 284 - UR 1,086 78,514 83,050 92,442 10,129 10,401 12,388 3,954 3,445 4,390 8.5 10.6 5.4 15.3 13.3 17.0 18.6 21.3 16.7 10.5 10.6 9.0 2.7 2.5 2.2 14.9 12.1 13.9 11.5 9.6 10.5Bata India 483 461 Acc. 918 26,940 23,744 26,818 3,349 2,576 3,455 2,057 1,464 2,195 (0.2) 1.6 3.3 12.8 11.4 17.1 37.7 42.4 28.3 17.9 22.5 16.5 6.1 5.3 4.8 17.7 13.4 17.9 18.1 14.7 18.0CARE 1,090 1,429 Buy 474 2,605 2,752 3,057 1,596 1,778 1,942 1,378 1,209 1,322 8.3 10.3 -2.0 47.5 41.7 45.6 22.9 26.1 23.9 17.9 16.0 14.7 8.8 8.8 9.0 32.6 33.7 37.3 32.8 33.7 37.3CCL Products 165 250 Buy 324 8,806 8,870 10,899 1,712 1,899 2,275 940 1,123 1,452 11.3 15.3 24.3 7.1 8.4 10.9 23.3 19.5 15.1 14.0 12.3 10.0 5.2 4.3 3.5 24.3 24.2 25.8 16.0 18.0 21.9Crisil 1,864 2,110 Acc. 1,962 12,534 13,470 16,305 3,885 4,198 5,430 2,685 2,913 4,040 14.1 18.2 22.7 37.6 41.1 57.0 49.5 45.3 32.7 32.8 30.2 23.0 15.7 15.6 12.9 35.3 34.4 43.3 35.3 34.4 43.3Greenply Inds 184 - UR 328 15,643 16,445 17,818 2,048 2,423 2,655 1,098 1,238 1,374 6.7 13.8 11.9 9.1 10.3 11.4 20.2 17.9 16.1 12.2 10.2 9.3 4.6 3.7 3.0 24.1 22.8 20.6 17.8 16.9 16.2Havells India 304 316 Acc. 2,805 52,387 54,190 60,600 6,991 7,322 8,370 4,649 7,360 6,040 7.6 9.4 14.0 7.4 11.8 9.7 40.8 25.8 31.4 26.5 25.6 21.8 10.4 9.7 8.5 22.1 22.7 30.4 16.1 21.4 29.8ICRA 3,969 4,013 Acc. 587 3,219 3,614 4,182 989 1,116 1,302 696 879 1,056 14.0 14.7 23.2 69.6 87.9 105.6 57.0 45.2 37.6 36.4 31.9 26.8 9.3 8.2 7.2 17.0 19.3 20.4 17.9 19.1 20.4Just Dial 569 - UR 593 5,898 6,728 8,208 1,658 1,853 2,384 1,389 1,465 1,899 18.0 19.9 16.9 19.7 21.1 27.4 28.9 26.9 20.7 19.3 17.6 12.9 6.0 6.8 5.5 23.0 23.4 29.2 23.0 23.3 29.2Kajaria Ceramics 948 - UR 1,114 21,869 24,122 28,411 3,541 4,454 5,304 1,796 2,200 2,764 14.0 22.4 24.1 22.6 27.7 34.8 42.0 34.2 27.3 21.9 17.3 14.3 10.2 8.2 6.6 28.3 26.6 27.0 22.5 22.2 23.1La Opala RG 636 - UR 522 2,233 2,834 3,647 660 861 1,137 417 537 728 27.8 31.2 32.1 7.5 9.7 13.1 84.6 65.8 48.5 52.2 40.0 29.9 19.0 15.4 12.1 29.5 25.8 27.9 27.8 25.6 27.9Supreme Inds 737 - UR 1,384 42,552 28,909 46,470 6,662 4,206 6,785 3,043 1,762 3,115 4.5 0.9 1.2 24.0 18.5 24.5 30.8 39.9 30.1 14.2 23.1 14.4 7.7 7.6 6.8 27.0 19.2 23.9 22.5 16.1 18.4V Guard 898 1,190 Buy 398 17,459 18,288 20,595 1,330 1,552 1,852 707 952 1,207 8.6 18.0 30.6 23.6 31.8 40.3 38.1 28.3 22.3 20.8 17.4 14.2 7.1 5.9 4.8 20.3 22.8 23.8 19.5 22.1 23.4V Mart 566 - UR 151 7,205 8,607 10,478 641 729 929 374 342 451 20.6 20.4 9.9 20.7 19.0 25.1 27.3 29.8 22.6 16.0 14.0 10.8 5.0 4.3 3.7 19.9 15.5 17.6 18.7 15.0 17.3Pennar Eng. 154 - UR 78 4,503 4,952 6,286 468 580 726 220 280 364 18.2 24.5 28.7 7.0 8.2 10.6 22.1 18.8 14.5 11.6 8.1 6.4 3.7 2.4 2.1 18.7 16.3 15.5 18.3 17.1 16.8Note: Estimate for Just Dial are Under Review
Mid-cap Sameer Panke ([email protected])Company CMP Current M-cap
(Rs) Rating (US$mn) FY15 FY16E FY17E FY15 FY16E FY17E FY15 FY16E FY17E Sales EBITDA PAT FY15 FY16E FY17E FY15 FY16E FY17E FY15 FY16E FY17E FY15 FY16E FY17E FY15 FY16E FY17E FY15 FY16E FY17ELMW 3,491 4,688 Buy 581 23,848 25,123 28,276 2,883 3,146 3,534 2,075 2,183 2,554 8.9 10.7 11.0 184.1 193.8 226.7 19.0 18.0 15.4 10.4 9.0 7.3 3.1 2.8 2.4 17.5 16.2 16.7 9.2 10.3 10.8 Timken India 463 650 Buy 465 9,290 11,071 12,929 1,337 1,519 1,828 807 884 1,056 18.0 16.9 14.4 11.9 13.0 15.5 39.0 35.6 29.8 23.4 20.8 17.3 7.2 6.4 5.6 19.7 19.0 19.9 21.6 20.4 21.1 NRB Bearings 117 167 Buy 167 6,556 7,036 7,816 1,148 1,208 1,371 521 565 686 9.2 9.3 14.8 5.4 5.8 7.1 21.7 20.0 16.5 12.0 11.1 9.6 4.2 3.6 3.1 20.5 19.4 20.4 12.4 12.5 14.3 SKF India 1,153 1,290 Accumulate 899 24,156 30,005 27,489 2,832 3,330 3,194 2,028 2,284 2,321 6.7 6.2 7.0 38.5 34.6 44.0 30.0 33.3 26.2 19.6 15.9 15.4 4.3 3.8 3.5 15.1 15.2 13.9 12.7 12.9 11.6
NBFCHatim Broachwala ([email protected])Company CMP Current M-cap
(Rs) Rating (US$mn) FY15 FY16E FY17E FY15 FY16E FY17E FY15 FY16E FY17E NIIp. PFY15ofit PAT FY15 FY16E FY17E FY15 FY16E FY17E FY15 FY16E FY17E FY15 FY16E FY17E FY15 FY16E FY17ESKS Microfinance 567 700 Buy 1,060 3,984 6,148 8,375 2,036 4,121 5,789 1,877 2,904 3,971 45.0 68.6 45.4 14.9 22.8 31.2 38.1 24.8 18.1 4.6 3.9 3.3 24.9 23.7 24.8 5.2 5.1 5.1 Capital First 403 490 Buy 541 5,363 7,257 8,992 2,717 4,258 5,488 1,143 1,546 2,346 29.5 42.1 43.3 12.6 17.0 25.8 32.1 23.7 15.6 2.4 2.2 2.0 8.3 9.4 13.0 1.1 1.3 1.6
Pharmaceutical Sumit Singhania ([email protected])Company CMP Current M-cap
(Rs) Rating (US$mn) FY15 FY16E FY17E FY15 FY16E FY17E FY15 FY16E FY17E Sales EBITDA PAT FY15 FY16E FY17E FY15 FY16E FY17E FY15 FY16E FY17E FY15 FY16E FY17E FY15 FY16E FY17E FY15 FY16E FY17EAurobindo Pharma 763 - UR 6,570 121,205 139,639 156,083 25,636 29,747 34,358 15,758 18,560 21,822 13.5 15.8 17.7 27.0 31.8 37.4 28.3 24.0 20.4 18.9 15.9 13.4 8.6 6.4 4.9 35.4 30.7 27.3 25.4 24.8 26.0 Cadila 326 - UR 4,920 86,513 100,893 113,753 17,578 23,925 24,451 11,506 14,790 17,717 14.7 17.9 24.1 11.3 15.0 15.9 28.8 21.7 20.5 20.1 14.6 14.2 7.9 6.1 5.0 30.1 31.7 26.7 21.8 27.0 23.4 Cipla 570 - UR 6,742 113,454 135,962 157,678 21,617 28,602 35,470 11,808 16,509 21,515 17.9 28.1 35.0 14.7 20.6 26.8 38.8 27.7 21.3 21.7 16.4 13.0 4.2 3.7 3.2 11.3 14.3 16.2 13.5 17.2 19.9 Divis Labs 1,110 - UR 4,339 30,959 37,832 45,398 11,491 14,565 17,251 8,515 10,943 12,841 21.1 22.5 22.8 32.1 41.2 48.4 34.6 26.9 23.0 25.7 20.2 17.1 8.4 7.0 5.9 26.4 28.5 28.0 30.0 33.4 33.0 Glenmark Pharma 734 - UR 3,048 66,448 73,804 89,445 12,246 15,454 23,359 4,753 7,635 13,929 16.0 38.1 71.2 17.5 27.1 49.4 41.9 27.1 14.9 19.4 14.7 9.6 6.6 4.3 3.4 20.1 19.0 25.0 15.2 18.5 26.5 Lupin 1,803 - UR 11,957 127,700 142,837 173,377 33,100 33,536 44,704 20,936 21,142 29,103 16.5 16.2 17.9 46.6 47.0 64.7 38.7 38.3 27.8 24.5 25.2 18.7 9.1 7.7 6.3 26.5 21.7 24.8 33.1 23.8 25.7 Natco Pharma 497 - UR 1,275 8,253 11,426 13,217 2,134 2,799 3,304 1,497 1,846 2,267 26.6 24.4 23.0 8.1 11.1 13.6 61.5 44.8 36.5 39.7 30.2 25.3 9.8 8.3 6.9 17.1 20.1 20.7 15.5 20.2 21.6 Strides 1,108 - UR 1,456 11,958 35,549 44,218 2,289 6,227 8,700 1,624 3,027 5,075 92.3 95.0 76.8 27.3 37.6 63.0 40.6 29.5 17.6 32.2 15.1 11.0 5.8 5.0 3.9 9.6 20.7 25.0 8.9 12.7 12.3
RoCE (%)
TP (Rs)Net sales (Rsmn) EBITDA (Rsmn) PAT (Rsmn) CAGR FY15E-FY17E RoCE (%)EPS (Rs) P/E (X) EV/EBITDA (X) P/BV (X) RoE (%)
TP (Rs)Net sales (Rsmn)
RoA (%)
EBITDA (Rsmn) RoE (%)PAT (Rsmn)
P/E (X) P/ABV (X) RoE (%)EPS (Rs)
P/E (X) EV/EBITDA (X) P/BV (X) CAGR FY15-FY17E EPS (Rs)
Op Profit (Rsmn) PAT (Rsmn) CAGR FY15-FY17E
RoCE (%)P/BV (X)CAGR FY15-FY17E EPS (Rs) P/E (X) EV/EBITDA (X)
RoE (%) RoCE (%)
TP (Rs)
RoE (%)TP (Rs)
Net sales (Rsmn) EBITDA (Rsmn) PAT (Rsmn)
TP (Rs)Net sales (Rsmn) EBIT (Rsmn) CAGR FY15E-FY17E EPS (Rs) P/E (X) EV/EBITDA (X) P/BV (X) PAT (Rsmn)
Net Interest Income (Rsmn)
40

Institutional Equities
Disclaimer Stock Ratings Absolute Returns
BUY > 15%
ACCUMULATE -5% to15%
SELL < -5%
This report is published by Nirmal Bang’s Institutional Equities Research desk. Nirmal Bang group has other business units with independent research teams separated by Chinese walls, and therefore may, at times, have different or contrary views on stocks and markets. Reports based on technical and derivative analysis may not match with reports based on a company's fundamental analysis. This report is for the personal information of the authorised recipient and is not for public distribution. This should not be reproduced or redistributed to any other person or in any form. This report is for the general information for the clients of Nirmal Bang Equities Pvt. Ltd., a division of Nirmal Bang, and should not be construed as an offer or solicitation of an offer to buy/sell any securities.
We have exercised due diligence in checking the correctness and authenticity of the information contained herein, so far as it relates to current and historical information, but do not guarantee its accuracy or completeness. The opinions expressed are our current opinions as of the date appearing in the material and may be subject to change from time to time without notice.
Nirmal Bang or any persons connected with it do not accept any liability arising from the use of this document or the information contained therein. The recipients of this material should rely on their own judgment and take their own professional advice before acting on this information. Nirmal Bang or any of its connected persons including its directors or subsidiaries or associates or employees or agents shall not be in any way responsible for any loss or damage that may arise to any person/s from any inadvertent error in the information contained, views and opinions expressed in this publication.
Nirmal Bang Equities Private Limited (hereinafter referred to as “NBEPL”) is a registered Member of National Stock Exchange of India Limited, Bombay Stock Exchange Limited. NBEPL has registered with SEBI as a Research Entity in terms of SEBI (Research Analyst) Regulations, 2014. (Registration No: INH000001436 -19.08.2015 to 18.08.2020).
NBEPL or its associates including its relatives/analyst do not hold any financial interest/beneficial ownership of more than 1% in the company covered by Analyst.
NBEPL or its associates/analyst has not received any compensation from the company covered by Analyst during the past twelve months. NBEPL /analyst has not served as an officer, director or employee of company covered by Analyst and has not been engaged in market-making activity of the company covered by Analyst.
The views expressed are based solely on information available publicly and believed to be true. Investors are advised to independently evaluate the market conditions/risks involved before making any investment decision.
Access all our reports on Bloomberg, Thomson Reuters and Factset.
Team Details: Name Email Id Direct Line Rahul Arora CEO [email protected] - Girish Pai Head of Research [email protected] +91 22 3926 8017 / 18
Dealing
Ravi Jagtiani Dealing Desk [email protected] +91 22 3926 8230, +91 22 6636 8833
Pradeep Kasat Dealing Desk [email protected] +91 22 3926 8100/8101, +91 22 6636 8831
Michael Pillai Dealing Desk [email protected] +91 22 3926 8102/8103, +91 22 6636 8830
Umesh Bharadia Dealing Desk [email protected] +91-22-39268226
Nirmal Bang Equities Pvt. Ltd.Correspondence Address
B-2, 301/302, Marathon Innova, Nr. Peninsula Corporate Park,
Lower Parel (W), Mumbai-400013. Board No. : 91 22 3926 8000/1; Fax. : 022 3926 8010
41